Embed Size (px)
Citation preview

Wanganui WWTP –Presentation to Wanganui District Council 28 October 2015By Humphrey ArcherCH2M Beca reference 6518753/NZ1-11543197CONFIDENTIAL AND PRIVILEGED
FINAL

Primary MWH Design Faults In Our Opinion
Incorrect assumptions in the calculation of required aeration energy for aerobic treatment of the design 90 percentile BOD load
Excessive energy input to a Facultative Aerated Lagoon (labelled by MWH as the Optimised Lagoon Process – OLP)
Incorrect assumptions in the calculation of solids mass (sludge) to be stored in the base of the lagoons
Incorrect assumption of an average 12% solids content in the sludge layer (actual measured value was an average of 3.1%)
Optimistic interpretation of the mass loads during the design and construction phases and insufficient ‘safety factor’ used
Secondary design faults are not discussed in this summary

Features of Aerated Lagoons
So that the significance of technical issues can be appreciated, the types of aerated lagoons need to be explained
The normal arrangement comprises a fully-mixed aerated lagoon, followed by one to three partially-mixed facultative aerated lagoons-in-series
Facultative means having ‘two environments’ – an aerobic upper layer and an anaerobic base layer. Another term is a ‘stratified lagoon’

Dual Power Lagoons (Prof Linvil Rich 1980)

Industrial Wastewater Treatment Lagoons (Eckenfelder 1989)

Wanganui Optimised Lagoon Process (from MWH O&M Manual, Fig 1.4)

Aerial view of the Wanganui Wastewater Treatment Facility prior to commissioning the aerators

Incorrect Assumptions in the Calculation of Aeration Energy

Required Aeration Energy – Calculation Comparisons
Line Ref MWH Calculation
CH2M Beca Calculation
(22/9/15)
CH2M Beca Calculation (14/10/15)
A 90%ile BOD load (kg/d) 23,536 23,536(i) 23,536(i)
C BOD5/BODL ratio 0.77 0.65 0.65D Ultimate mass of BOD treated [A / C] (kg/d) 30,550 36,209 36,209G Mass of organisms wasted (kg/d) 13,630 9,600 3,635H Daily aeration requirement for
BOD reduction [D – G] (kgO2/d)(kgO2/h)
16,920705
26,6091,109
32,5741,357
K Actual Oxygen Requirement (AOTR). Could be 0.6? (kgO2/kWh)
0.77 0.77(ii) 0.77(ii)
L Installed power required [H / K] (kW)(with no diurnal peaking factor)
915 1,440 1,763
N Benthic oxygen demand at 80g/m2.d and 20,000m2 (iii)
(kgO2/d)(kgO2/h)
Not calculated 1,60067
1,60067
P Installed aeration power required for benthic load (kW) Not calculated 93 93(iv)
S Overall peak aeration demand (BOD removal and benthic demand) at high BOD loadings (kgO2/d)
(kgO2/h)16,920
70528,2091,175
34,1741,424
T Overall installed aeration power (kW) (required for BOD removal and benthic oxygen demands, with no diurnal peaking factor applied)
915 1,526 1,850
i. From MWH calculations supplied to WDC on 13 December 2007 – MWH.02058.00ii. MWH value assumed. This could be optimistic given that testing did not achieve the target.iii. Rich (1980) assumes the 80 g/m2.d value. 20,000m2 area at top of sludge layer, is estimated from Section 6.2, MWH Report 11iv. If the Eckenfelder method is used, Benthic oxygen demand in summer = 40% of soluble BODL , which would be
9,120 KgO2/d or 380 KgO2/hr. This would require an extra 493 kW aeration power for the benthic demand alone – not included above.
Revised Table B1– Aeration Requirement Comparison (Abbreviation of Table B1 in CH2M Beca Review. Differences or uncertainty in assumed values are in red)

Comments on Aeration Energy Calculations
Aeration calculations were not included in MWH Reports 10 and 11
The 2004 Peer Reviewers requested the aeration calculations, but these were not provided by MWH
Aeration calculations were sent to WDC on 13 December 2007 – about six months after the plant start-up
MWH adopted optimistic values for a number of factors, which resulted in a substantial difference in aeration power required (MWH = 915 kW vs CH2M Beca estimates of 1,526 kW to 1,850 kW)
MWH also did not include the ‘feedback’ oxygen demand from the sludge layer

Excessive Energy Input to a Facultative Aerated Lagoon

Excessive Energy Input to a Facultative Aerated Lagoon The purpose of a facultative aerated lagoon is to have a
quiescent layer at the base, where organic solids can be stabilised by anaerobic digestion (which converts solids to biogas thus reducing the mass solids)
To avoid disturbance of the base layer, energy input at the surface is limited to 2 W/m3, based on the aerobic zone volume (Rich 1983)
For Wanganui, the aerobic volume was approximately 116,000m3, so the installed power should have been a maximum of 232 kW

Excessive Energy Input to a Facultative Aerated Lagoon (cont’d) MWH calculated required power at 915 kW and initial
installed power (Tornados) was 17 x 45 kW = 765 kW (excluding the boost blowers which do not contribute to mixing) – From July 2007 start-up
Increased power with 20 Twisters and 3 Tornado, was 23 x 45 kW = 1035 kW – From July 2009
The CH2M Beca estimate for aeration power is 1,526 kW or 1,850 kW (see revised Table B1 earlier)
This is 6 to 8 times the allowable power to avoid disturbing the base layer
More aerators would have disturbed the base layer

Depth of the Aerated Lagoon
The main aerated lagoon has a normal water depth of 8 m and maximum of 10 m for peak wet weather flow storage
Lower 4 m was designed for sludge storage Upper aerobic zone was 4 m deep Typical facultative aerated lagoons are 4 to 5m total depth Did the extra depth allow the sludge layer to be undisturbed? WDC commissioned a Computational Fluid Dynamics (CFD)
study of the mixing currents in the aerated lagoon

Fig 3-12 Case 1 – 120s pathlines released from 4m depth (17 Tornados)
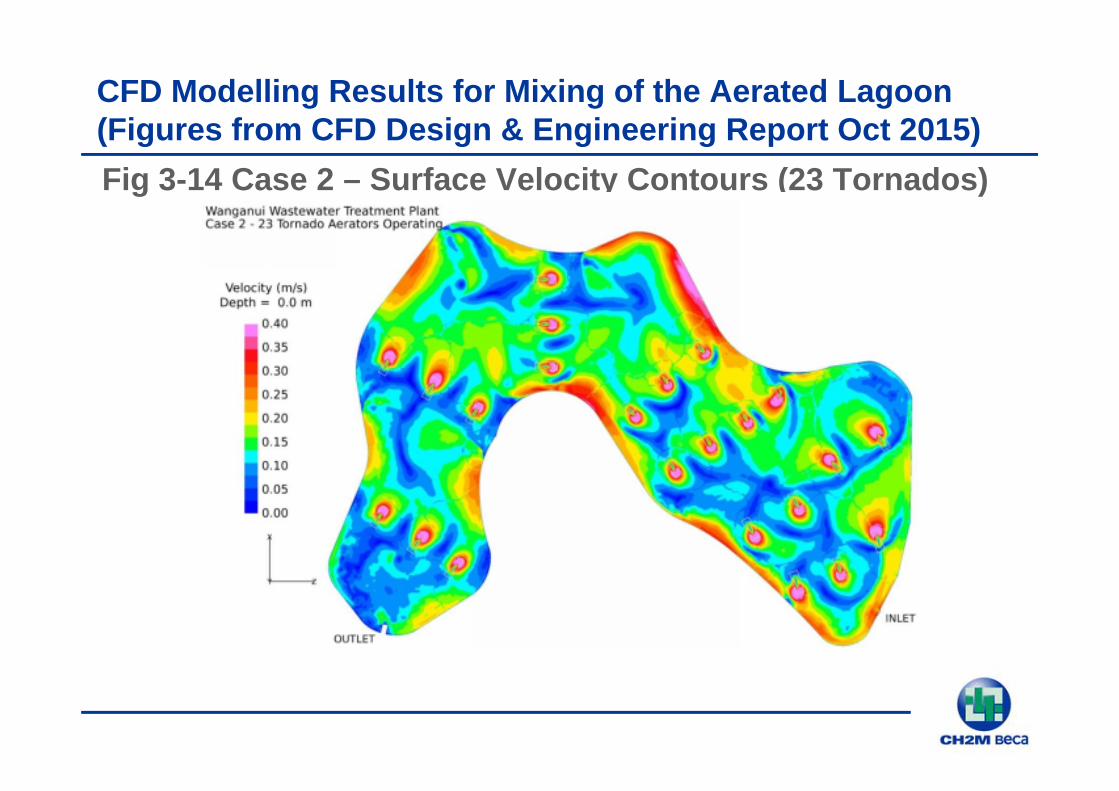
Fig 3-14 Case 2 – Surface Velocity Contours (23 Tornados)
CFD Modelling Results for Mixing of the Aerated Lagoon (Figures from CFD Design & Engineering Report Oct 2015)

Fig 3-20 Case 2 – 120s pathlines released from 4m depth (23 Tornados)

Fig 3-22 Case 3 – Surface Velocity Contours(20 Twisters & 3 Tornados)

Fig 3-28 Case 3 – 120s pathlines released from 4m depth

Fig 3-29 Case 3 – Location of Aerator Rows 2 and 5

Fig 3-30 Case 3 – Streamlines through full 8m depth along Aerator Row 2

Twister Aerator with Sludge Uplift

Twister Aerator with Clean Water

CFD Modelling Conclusions
The mixing currents from the Tornado and Twister aerators extended below the 4 m plane (interface of aerobic and anaerobic zones)
These currents would have entrained gas-buoyed sludge and carried it into the upper aerobic zone causing increased oxygen demand, or carried oxygen into the anaerobic zone causing incomplete anaerobic digestion
Stabilised and well-consolidated sludge may not have been entrained by the deeper currents, but as the sludge surface rose, more sludge would have been disturbed
CFD modelling supports the guideline value for mixing energy input limit of 2 W/m3

Sludge Storage Incorrect Assumptions

Sludge Storage Calculation
The key reason for selecting the ‘Optimised Lagoon Process’, was the expected ‘20 years sludge storage’, first stated in Report 10 (2003)
However, the sludge storage volume of 160,000m3 in Report 10, was reduced to approximately 90,000m3 in Report 11 (2005), and an ‘as-built’ of 78,000m3
The reduction in available sludge storage volume was not highlighted in Report 11 (Nov 2005)
Report 11 in Section 7.4, predicts 13 years sludge storage in the aerated lagoon and 8 years for the settling lagoon
The O&M Manual (2010) and a 2008 Conference paper by MWH, re-stated the predicted 20 years sludge storage

Comparison of Sludge Consolidation Factors (Table 4-1)
Location Sludge Dry Solids ContentMWH Report 10 – assumption for Wanganui 12.0%MWH Report 11, Section 7.4.2 – assumption for Wanganui
12.0%
MWH Report 11, Section 7.5 (Regina, Canada aerated lagoons)
7.5% and 7.14%
MWH Report 11, Section 7.5 (Meze, France anaerobic lagoon)
8.0%
Dual Power Lagoons USA (L. Rich, 2003) Range from 4.8% to 7.4% at base of lagoons after typically 15 years storage
Hawera Anaerobic Lagoon (meat processing wastewaters)
3.4% (weighted average)
Wanganui (measured by Cardno-BTO May 2013)Aerated LagoonSettling Lagoon 3.1% (average)
1.6% (average)Loughran MWH 6 to 8%Hoffmann MWH 3 to 5%
The 2004 Peer Reviewers questioned the Report 10 12% consolidation factor but MWH replied with anaerobic lagoon examples (with no surface aeration)
The Dual Power Lagoon range from 4.8% to 7.4%, would have been more appropriate in our opinion

Summary Comparison of Sludge Volume Estimates (Table 4-2)

Sludge Storage Conclusions
The CH2M Beca estimate is 2 years sludge storage. The difference in estimated storage time is due to the combination of differences in the sludge mass load and the sludge consolidation factor
MWH internal review recommendations were:─ Loughran (MWH) estimated a significantly greater mass of solids –
4,627 Kg/d compared to 2,496 Kg/d in MWH Report 11─ Loughran (MWH) recommended sludge consolidation to 6% or 8%,
compared to 12% in MWH Report 11─ Hoffmann (MWH) recommended sludge consolidation in the range
3% to 5%, compared to 12% in MWH Report 11─ Report 11 does not explain why the Loughran and Hoffman
recommendations were not adopted Also, the 2004 Peer Reviewer’s concerns were not adequately addressed

Load CharacterisationFull load as measured at the Beach Road Pump Station (BRPS) before bypass to Ocean Outfall

Full BOD Daily Load at Beach Rd Pump Station

Full TSS Daily Load at Beach Rd Pump Station

Effects of Bypass to the Ocean Outfall During Operation from 2007

Loading Comparisons (for full year data);Accounting for Bypass to Ocean Outfall
2007 2008 2009
AverageDesign Value
WWTP Inlet
WWTPInlet
WWTP Inlet
Flow 32,000 22,178 15,259 26,881
TSS Load 10,000 12,033 6,742 11,957 BOD Load 11,000 13,092 7,026 10,686
COD Load 20,783 15,823 30,126
BOD % above average design load 19% -36% -3%
TSS % above average design load 20% -33% 20%
The overall average BOD load for 2007 was higher than the design value, but much lower in 2008 and about the same in 2009, and similar for TSS (except 2009 where it’s very high overall).
Note that these are average values. The design 90%ile BOD value was generally not exceeded – see next slide.

Loading Comparison (peak season 90 percentile loads); Accounting for Bypass to Ocean Outfall
2007/2008 2008/2009 2009/2010
Design Loads WWTP Inlet
WWTP Inlet
WWTP Inlet
Average TSS 10,000 11,552 10,678 16,070
90%ile TSS 20,218 22,670 25,392
Max TSS 39,966 36,596 52,721
Average BOD 11,000 12,452 9,168 12,942
90%ile BOD 23,536 23,944 16,573 25,391
Max BOD 34,097 33,358 52,721
Average BOD % above design load 13% -17% 18%
90%ile BOD % above design load 2% -30% 8%
We have assumed the peak season is from November 1 to February 28

Peak Season 2007/08 BOD Loads on WWTP

Peak Season 2008/09 BOD Loads on WWTP

Peak Season 2009/10 BOD Loads on WWTP

Actual Load on WWTP due to Bypassing to Ocean Outfall It is expected that 1 in 10 values would be greater than the
90 percentile design load There are some points above the 90 percentile aeration
design load in 2007/08, but few in the next few seasons. By using the bypass to the ocean outfall, WDC protected the
plant from higher BOD loadings during peak processing seasons.

Overall Conclusions in Our Opinion
The “Optimised Lagoon Process” did not have precedents, and attempted to combine all treatment functions into one lagoon
Significant errors were made in the estimated sludge storage volume which resulted in the storage capacity being exceeded from about 2009/10
Required aeration energy was significantly underestimated and no margins were applied (which is standard practice for aeration demand)
Installed aeration energy disturbed the sludge layer and prevented full anaerobic digestion of the sludge. Further aeration would have caused more disturbance of the sludge layer.
The concerns expressed by the 2004 Peer Reviewers were not appropriately addressed by MWH
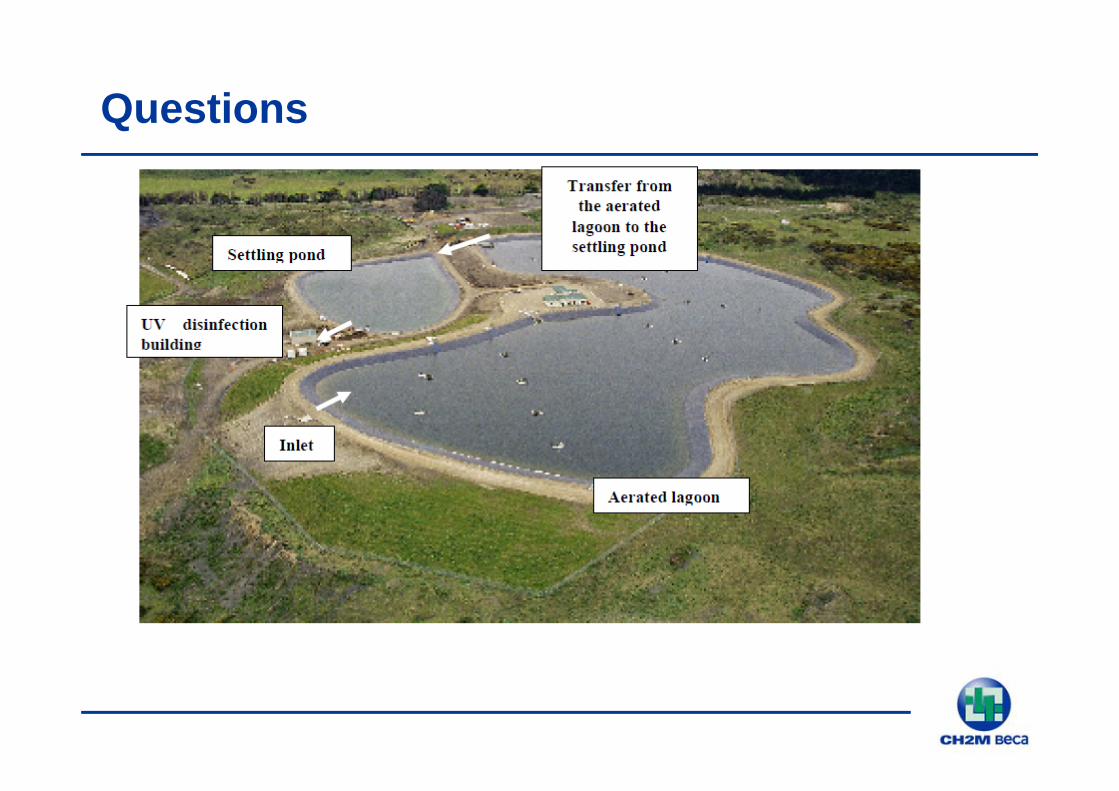
Questions

Additional Slides
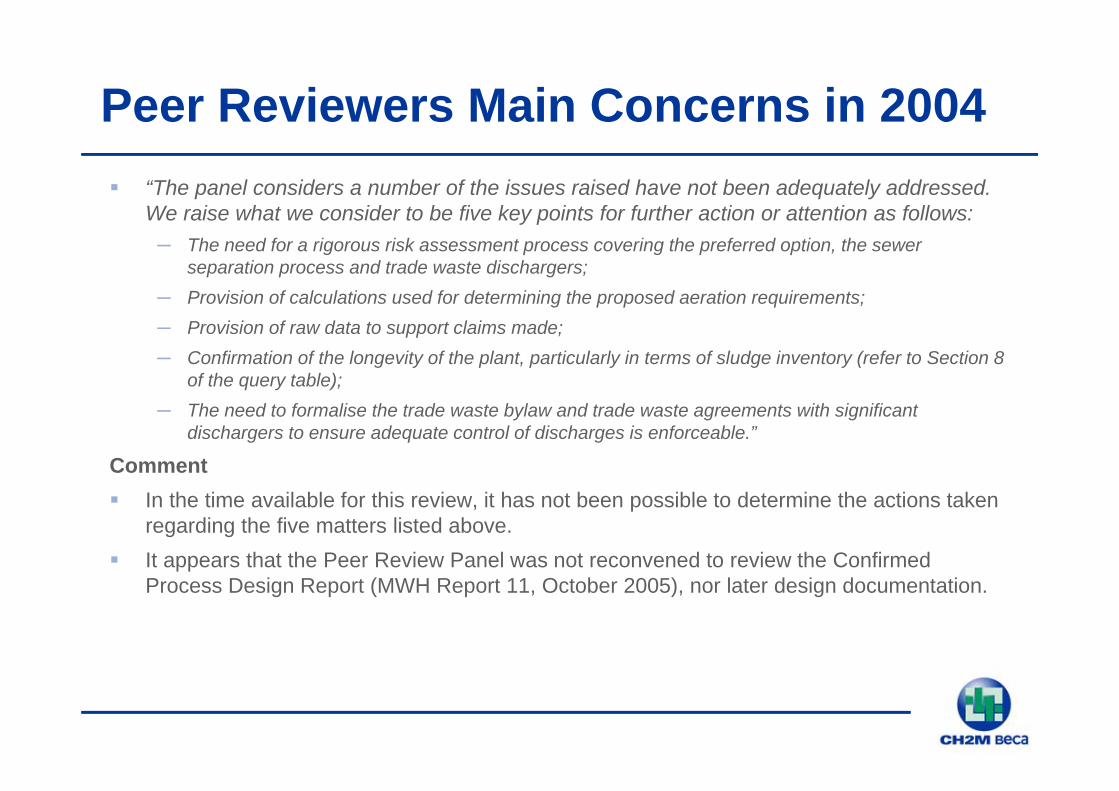
Peer Reviewers Main Concerns in 2004 “The panel considers a number of the issues raised have not been adequately addressed.
We raise what we consider to be five key points for further action or attention as follows:─ The need for a rigorous risk assessment process covering the preferred option, the sewer
separation process and trade waste dischargers;─ Provision of calculations used for determining the proposed aeration requirements;─ Provision of raw data to support claims made;─ Confirmation of the longevity of the plant, particularly in terms of sludge inventory (refer to Section 8
of the query table);─ The need to formalise the trade waste bylaw and trade waste agreements with significant
dischargers to ensure adequate control of discharges is enforceable.”
Comment In the time available for this review, it has not been possible to determine the actions taken
regarding the five matters listed above. It appears that the Peer Review Panel was not reconvened to review the Confirmed
Process Design Report (MWH Report 11, October 2005), nor later design documentation.

Table 5-1 Wanganui WWTP Effluent Monitoring Results Summary (2009 – 2012)
Parameter Units Basis 2009 2010 2011 2012
Resource Consent Standard
BOD g/m3 Median 76 121 84 80 n/aTSS g/m3 Median
95 %ile99
22289
212159 241
184 390
n/a 100
Enterococci cfu/100ml MedianMaximum
3,900 160,000
20,000 2,100,000
24,000 1,600,000
51,000 620,000
4,000 12,000
Faecal Coliforms
cfu/100ml Median 90 %ile
7,50056,600
22,000 91,000
86,000 300,000
260,000 501,000
10,000 25,000

Figure 2-1 The 1992 Wastewater Scheme (from the AEE Summary March 2001)

CH2M Beca Review Report Appendix D Flow Diagrams

Comparisons of Wanganui to Other Aerated Lagoon Treatment Plants Referred to by MWH

Comparisons of Wanganui to Other Aerated Lagoon Treatment Plants Referred to by MWH

Comparisons of Wanganui to Other Aerated Lagoon Treatment Plants Referred to by MWH
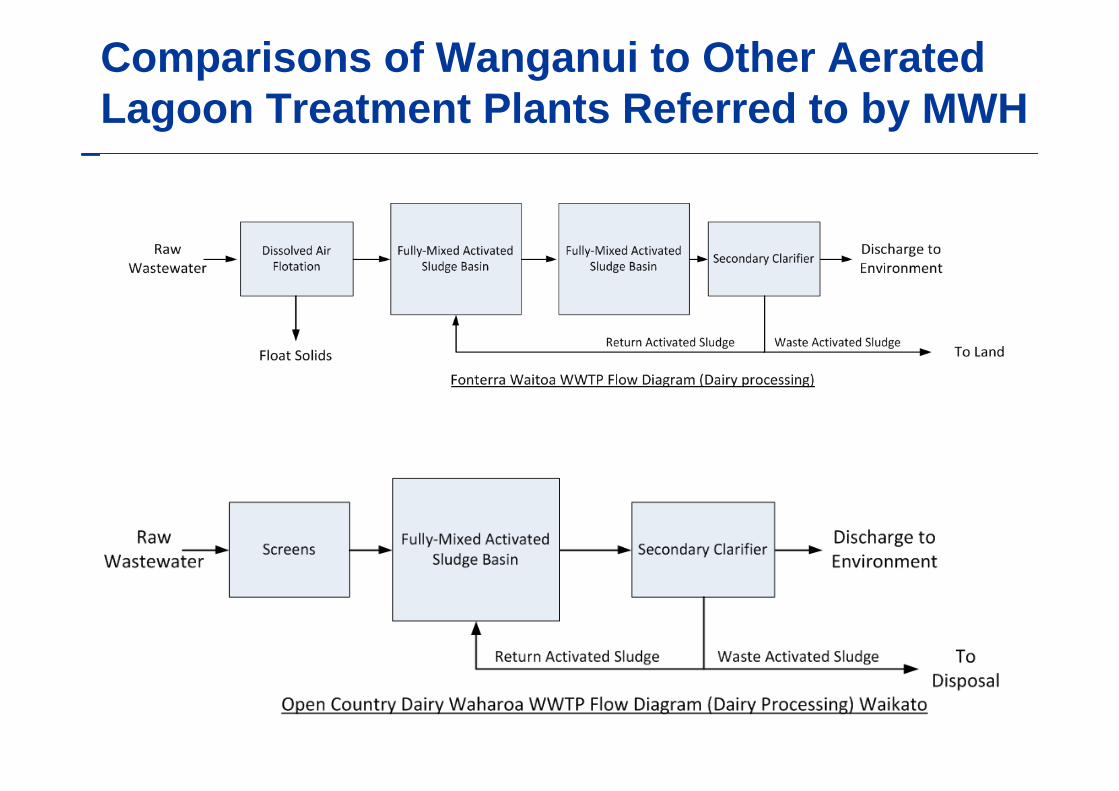
Comparisons of Wanganui to Other Aerated Lagoon Treatment Plants Referred to by MWH

MWH Concept from Report 10 (2003)