Embed Size (px)
Citation preview
NYSERDA New York State Energy Research and Development AuthorityVincent A. Delorio, Esq., Chairman
Toll Free: 1 (866) NYSERDA
www.nyserda.org • info(a!nyserda.org
August 14, 2009
The Honorable Jaclyn A. BrillingSecretaryNew York State Public Service CommissionThree Empire State PlazaAlbany, New York 12223-1350
r->
Q
0
Case 05-M-0090, Order Continuing the System Benefits Charge (SBC) andthe SBC-Funded Public Benefit Programs
Dear Secretary Brilling,
Pursuant to the December 21, 2005 Order approving the continuation of the System BenefitsCharge Program in the above-referenced proceeding, enclosed please find an original and five copiesof the quarterly report for the period ending June 30, 2009, prepared by the New York State EnergyResearch and Development Authority.
Francis J. Murray, Jr.President and CEO
Enclosures
Main Office West Valley Site New York City BuffaloAlbany Management Program 485 Seventh Ave., Suite 1006 Larkin at Exchange Building17 Columbia Circle 10282 Rock Springs Road New York, NY 10018 726 Exchange Street, Suite 821Albany, NY 12203-6399 West Valley, NY 14171-9799 Phone: (212) 971-5342 Buffalo, New York 14210Toll Free: 1 (866) NYSERDA Phone: (716) 942-9960 Fax: (212) 971-5349 Phone: (716) 842-1522Phone: (518) 862-1090 Fax: (716) 942-9961 Fax: (716) 842-0156Fax: (518) 862-1091
NEW YORK's SYSTEM BENEFITS CHARGE
PROGRAMS
EVALUATION AND STATUS REPORT
QUARTERLY REPORT TO PUBLIC SERVICE COMMISSION
QUARTER ENDING JUNE 30, 2009
FINAL REPORT
AUGUST 2009
A cw ^ovk6^tym
PUBLIC Souc
waft0711

Table of- Contents
1 INTRODUCTION .................................................................................................................................1-11.1 Organization of the Report ............................................................................................................1-2
2 PORTFOLIO-LEVEL REPORTING .................................................................................................2-12.1 Budget and Spending Status .........................................................................................................2-1
2.1.1 System Benefits Charge Program Budget Spending Status .............................................2-12.1:2 EEPS Fast Track Program Budget Spending Status ........................................................2-4
2.2 Portfolio Level Findings ...............................................................................................................2-42.2.1 Summary of System Benefits Charge Program Benefits .................................................2-42.2.2 New York Energy $martsM Progress Toward Goals ........................................................2-7
2.3 Largest Energy Savers Impact Evaluation ....................................................................................2-72.3.1 Gross Savings Evaluation Methods .................................................................................2-82.3.2 Net-to-Gross Evaluation Methodology ............................................................................2-92.3.3 Gross Savings Realization Rates: Overall Findings .......................................................2-112.3.4 Participant Free-Ridership and Spillover Findings ........................................................2-112.3.5 Spillover .........................................................................................................................2-132.3.6 Overall Results and Findings .........................................................................................2-142.3.7 Overall Conclusion ........................................................................................................2-16
3 COMMERCIAL/INDUSTRIAL PROGRAMS .................................................................................3-13.1 Commercial/Industrial Evaluation Activities ................................................................................3-1
3.1.1 Completed Evaluation Activities .....................................................................................3-13.1.2 Evaluation Activities in Progress and Planned ................................................................3-1
3.2 Summary of C/I Evaluation Results ..............................................................................................3-13.2.1 Progress Toward Non-Energy Goals ...............................................................................3-13.2.2 Energy, Peak Demand, and Fuel Savings ........................................................................3-1
3.3 Existing Facilities Program (EFP) ................................................................................................3-43.3.1 Progress Toward Goals ....................................................................................................3-53.3.2 Energy, Peak Demand and Fuel Savings .........................................................................3-5
3.4 New York Energy $martsM Business Partners ..............................................................................3-6
3.4.1 Progress Toward Goals ....................................................................................................3-6
3.4.2 Energy, Peak Demand and Fuel Savings .........................................................................3-6
3.5 New York Energy $martsM Loan Fund and Financing Program ...................................................3-83.5.1 Progress Toward Goals ....................................................................................................3-83.5.2 Energy, Peak Demand and Fuel Savings .........................................................................3-8
3.6 Energy Smart Focus Program .......................................................................................................3-93.6.1 Progress Toward Goals ....................................................................................................3-93.6.2 Energy, Peak Demand and Fuel Savings .......................................................................3-103.6.3 Sector Highlights ............................................................................................................3-10
3.7 New Construction Program .........................................................................................................3-133.8 FlexTech Technical Assistance Program ....................................................................................3-14
3.8.1 Energy, Peak Demand and Fuel Savings .......................................................................3-143.9 Industrial and Process Efficiency Program .................................................................................3-15
Table of Contents
4 RESIDENTIAL AND LOW-INCOME PROGRAMS ......................................................................4-14.1 Residential and Low-Income Evaluation Activities ......................................................................4-1
4.1.1 Completed Evaluation Activities .....................................................................................4-14.1.2 Evaluation Activities in Progress and Planned ................................................................4-1
4.2 Summary of Residential and Low-Income Evaluation Results ....................................................4-14.2.1 Progress Toward Non-Energy Goals ...............................................................................4-14.2.2 Energy, Peak Demand, and Fuel Savings ........................................................................4-2
4.3 Single Family Home Performance Program .................................................................................4-54.3.1 Progress Toward Goals ....................................................................................................4-54.3.2 Energy, Peak Demand and Fuel Savings .........................................................................4-54.3.3 Prospective Benefits Analysis for the Home Performance with ENERGY STAR®
Program ............................................................................................................................ 4-64.4. Multifamily Building Programs ..................................................................................................4-19
4.4.1 Progress Toward Goals ..................................................................................................4-194.4.2 Energy, Peak Demand and Fuel Savings .......................................................................4-194.4.3 Other Evaluation Findings .............................................................................................4-21
4.5 Market Support Program .............................................................................................................4-214.5.1 Progress Toward Goals ..................................................................................................4-214.5.2 Energy, Peak Demand and Fuel Savings .......................................................................4-22
4.6 Communities and Education Program ........................................................................................4-234.6.1 Progress Toward Goals ..................................................................................................4-23
4.7 CFL Expansion Program .............................................................................................................4-234.8 EmPower New Yorks"' ...............................................................................................................4-24
4.8.1 Energy, Peak Demand and Fuel Savings .......................................................................4-244.9 Buying Strategies and Energy Awareness Program ....................................................................4-25
4.9.1 Progress Toward Goals ..................................................................................................4-25
5 RESEARCH AND DEVELOPMENT PROGRAMS ........................................................................5-15.1 Research & Development (R&D) Program Evaluation Activities ................................................5-1
5.1.1 Completed Evaluation Activities .....................................................................................5-15.1.2 Evaluation Activities in Progress and Planned ................................................................5-1
5.2 Summary of R&D Evaluation Results ..........................................................................................5-25.2.1 Progress Toward Non-Energy Goals ...............................................................................5-25.2.2 Energy, Peak Demand, Fuel Savings, and Clean Generation ..........................................5-3
5.3 Public Benefit Power Transmission and Distribution Research ...................................................5-45.3.1 Progress Toward Goals ....................................................................................................5-4
5.4 Clean Energy Infrastructure ..........................................................................................................5-55.4.1 Progress Toward Goals ....................................................................................................5-55.4.2 Clean Energy Generation .................................................................................................5-5
5.5 Power Systems Product Development ..........................................................................................5-65.5.1 Progress Toward Goals ....................................................................................................5-6
5.6 DG-CHP Demonstration ...............................................................................................................5-85.6.15.6.2
Progress Toward Goals ....................................................................................................5-8Energy, Peak Demand and Fuel Savings .........................................................................5-8
5.7 Demand Response and Innovative Rate Research ........................................................................5-95.7.1 Progress Toward Goals ....................................................................................................5-95.7.2 Energy, Peak Demand and Fuel Savings .......................................................................5-10
5.8 Electric Transportation ................................................................................................................5-115.8.1 Progress Toward Goals ..................................................................................................5-1 1
5.9 Environmental Monitoring, Evaluation, and Protection (EMEP) ...............................................5-125.9.1 Progress Toward Goals ..................................................................................................5-12
ToC-2
Organization of the Report
5.10 Industrial Process and Product Innovation Program ...................................................................5-145.10.1 Progress Toward Goals ..................................................................................................5-14
5.11 Municipal Water and Wastewater Efficiency .............................................................................5-165.11.1 Recent Program Accomplishments ................................................................................5-165.11.2 Long-Term Program Accomplishments .........................................................................5-185.11.3 Program Impact Evaluation ...........................................................................................5-18
5.12 Next Generation and Emerging Technologies ............................................................................5-185.12.1 Progress Toward Goals .................................................................................................._5-18
APPENDIX A ..........................................................................................................................................A-I
APPENDIX B ..........................................................................................................................................B-I
LIST OF TABLES
Table 2-1. Financial Status of New York's System Benefits Charge Programs through June 30, 2009($ million) ............................................................................................................................2-1
Table 2-2. Financial Status of the New York Energy $martsM Program through June 30, 2009($ million) ............................................................................................................................ 2-2
Table 2-3. Individual Programs - New York Energy $martsM Financial Status through June 30, 2009($ million) ............................................................................................................................2-3
Table 2-4. Financial Status of the EEPS Fast Track Programs through June 30, 2009 ($ million) ....2-4Table 2-5. Cumulative SBC Program Benefits from Installed Measures (Combined Program) ..............2-5Table 2-6. Gross Savings Realization Rates ...........................................................................................2-11Table 2-7. Total Project Free-Ridership Estimates .................................................................................2-12Table 2-8. NYSERDA-induced Participant Spillover ..............................................................................2-14Table 2-9. Total Net Impact Rate, by Program ....................................................................................... 2-15Table 3-1. C/I Program Cumulative Annual Electricity Savings through June 30, 2009 and Progress
toward SBC Goals (Combined Programs) ..........................................................................3-2Table 3-2. C/I Program Cumulative Peak Demand Savings through June 30, 2009 and Progress toward
Five-Year SBC Goals (Combined Programs) .....................................................................3-3Table 3-3. C/I Program Cumulative Annual Fuel Savings through June 30, 2009 (Combined
Programs) ............................................................................................................................3-4Table 3-4. Existing Facilities Program - Program Outputs ......................................................................3-5Table 3-5. EFP Cumulative Annual Energy and Peak Demand Savings (through June 30, 2009)...........3-6Table 3-6. New York Energy $martsM Business Partners Program - Goal and Achievement .................3-6Table 3-7. New York Energy $martsM Business Partners Cumulative Annual Energy and Peak Demand
Savings (through June 2009) ...............................................................................................3-7Table 3-8. New York Energy $martsM Loan Fund and Financing Program - Goals and Achievements for
Commercial/Industrial Projects ........................................................................................... 3-8Table 3-9. Loan Fund Cumulative Annual Energy and Peak Demand Savings (through June 2009)' .....3-9Table 3-10. Energy Smart Focus Program - Goal and Achievement .......................................................3-9Table 3-11. New Construction Program -Key Activities .......................................................................3-13Table 3-12. New Construction Program Cumulative Annual Energy and Peak Demand Savings (through
June 30, 2009) (Combined Program) ................................................................................3-14Table 3-13. FlexTech Technical Assistance Program - Goal and Achievement ....................................3-14Table 3-14. FlexTech Technical Assistance Program Cumulative Annual Energy and Peak Demand
Savings (through June 2009) (Combined Program) ..........................................................3-15Table 4-1. Residential and Low-Income Program Cumulative Annual Electricity Savings through June
30, 2009 and Progress toward Goals (Combined Program) ................................................4-2
ToC-3
Table of Contents
Table 4-2. Residential and Low-Income Program Cumulative Peak Demand Savings through June 30,2009 .....................................................................................................................................4-3
Table 4-3. Residential and Low-Income Program Cumulative Annual Fuel Savings through June 30,2009 and Progress toward Goals .........................................................................................4-4
Table 4-4. Single Family Home Performance Program - Goals and Achievements ................................4-5Table 4-5. Single Family Home Performance Program Cumulative Annual Energy and Peak Demand
Savings (through June 2009) ...............................................................................................4-6Table 4-6: Overview of Prospective Benefit Factors ...............................................................................4-10Table 4-7. Overview of NFR Weights .....................................................................................................4-1 1Table 4-8. Estimates of 2008 Non-Participant Spillover Savings (kWh) ...............................................4-12Table 4-9. 2008 Mid-Estimate Non-Participant Spillover Savings by Fuel Type ..................................4-13Table 4-10. Summary of Prospective Benefits Results (Electricity, weighted) .......................................4-15Table 4-11. Summary of Prospective Benefits Results (Fossil Fuels) .....................................................4-18Table 4-12. Multifamily Performance Program - Goals and Achievements ..........................................4-19Table 4-13. Multifamily Building Programs Cumulative Annual Energy and Peak Demand Savings
(through June 2009) ..........................................................................................................4-20Table 4-14. Number of Units Participating in MPP According to Status ...............................................4-21Table 4-15. Market Support Program - Goals and Achievements ..........................................................4-21Table 4-16. Market Support Program Cumulative Annual Energy and Peak Demand Savings
(through June 2009) ..........................................................................................................4-22Table 4-17. Communities and Education Program - Goals and Achievements .....................................4-23Table 4-18. EmPower New YorksM Program - Key Activities .............................................................4-24Table 4-19. EmPower New YorksM Program Cumulative Annual Energy and Peak Demand Savings
(through June 2009) (Combined Program) .......................................................................4-24Table 4-20. Buying Strategies and Energy Awareness Program - Goals and Achievements ................4-25Table 5-1. R&D Program Electricity Savings and Clean Generation through June 30, 2009 ..................5-3Table 5-2. R&D Program Cumulative Peak Demand Savings through June 30, 2009 .............................5-3Table 5-3. R&D Program Cumulative Annual Fuel Savings through June 30, 2009 ...............................5-4Table 5-4. Public Benefit Power Transmission and Distribution Research Program - Goals and
Achievements ......................................................................................................................5-4Table 5-5. Clean Energy Infrastructure Program - Goals and Achievements ..........................................5-5Table 5-6. Clean Energy Infrastructure Program Cumulative Annual Clean Generation (through
transition of Program to RPS in 2008) ................................................................................5-6Table 5-7. Power Systems Product Development Program - Goals and Achievements ..........................5-6Table 5-8. DG-CHP Demonstration Program - Goals and Achievements ...............................................5-8Table 5-9. DG-CHP Program Cumulative Annual Energy and Peak Demand Savings (through June
2009) ...................................................................................................................................5-9Table 5-10. Demand Response and Innovative Rate Research Program - Goals and Achievements ......5-9Table 5-11. Demand Response and Innovative Rate Research Program Cumulative Annual Energy and
Peak Demand Savings (through June 30, 2009) ................................................................5-11Table 5-12. Electric Transportation Program - Achievements ............................................................... 5-1 1Table 5-13. Environmental Monitoring, Evaluation, and Protection Program - Goals and
Achievements ....................................................................................................................5-12Table 5-14. Industrial Process and Product Innovation Program - Goals and Achievements ................5-14Table 5-15. Status of IPPI Projects by Solicitation .................................................................................5-15Table 5-16. IPPI Contracts by Project Type ...........................................................................................5-15Table 5-17. Municipal Water and Wastewater Efficiency Program Goals achieved from July 1, 2006
through June 30, 2009 .......................................................................................................5-16
Table 5-18. Project and Funding Status through June 30, 2009 . ...........................................................5-18Table 5-19. Next Generation and Emerging Technologies Program - Goals and Achievements ..........5-19
ToC-4
Organization of the Report
LIST OF FIGURES
Figure 2-1. Electricity Savings by Utility through June 30, 2009 (Combined Program) ..........................2-6Figure 2-2. Demand Savings by Utility (includes callable MW) through June 30, 2009 (Combined
Program) .............................................................................................................................. 2-6Figure 2-3. The In-Depth Largest Savers Impact Evaluation Salad Bar Approach to NTG ...................2-10Figure 4-1. 2009 HPwES MWh Prospective Benefits Compared to HPwES 2008 Incremental
Savings ..............................................................................................................................4-16Figure 4-2. 2009 HPwES MW Prospective Benefits Compared to HPwES 2008 Incremental
Savings ..............................................................................................................................4-17
1Introduction
This report provides an update on the progress of New York's System Benefits Charge (SBC) programstoward meeting their stated goals. It contains evaluation results on activities through the quarter endingJune 30, 2009. The last full annual report on progress (through December 31, 2008) was issued in March2009.'
The 13-year New York Energy $martsM Program, administered by the New York State Energy Researchand Development Authority (NYSERDA), was initiated in 1998 by order of the New York State PublicService Commission2 (Commission) and embodies three funding cycles.3 The Program portfolio consistsof numerous initiatives promoting energy efficiency and demand management, facilitating renewableenergy development, providing energy services to low-income New Yorkers, and conducting research anddevelopment. The activities pursued by the Program include disseminating information to increaseconsumer energy awareness, marketing, providing financial incentives, developing and testing newproducts, commercializing new technologies, and gathering data and information.
In its June 23, 2008 Order4, the Commission established the State's Energy Efficiency Portfolio Standard(EEPS) and approved a subset of "Fast Track" programs to commence immediately. The Order alsodirected NYSERDA to submit a supplemental revision to its SBC Operating Plan incorporating the FastTrack programs, including enhancements to the SBC Fast Track programs. The supplemental revision,approved by DPS on March 12, 2009, served as the vehicle to incorporate the Fast Track programs intoNYSERDA's existing New York Energy $marts"t program portfolio.5
1 New York State Energy Research and Development Authority, New York Energy $tnarts'' Program Evaluation and StatusReport, Final Report, March 2009.2 Case 94-E-1052, et al., In the Matter of Competitive Opportunities Regarding Electric Service, Opinion 98-3, issuedJanuary 30, 1998.3 The most recent cycle was initiated with the New York State Public Service Commission order in Case 05-M-0900, In theMatter of the System Benefits Charge 111, Order Continuing the System Benefits Charge (SBC) and the SBCfiinded PublicBenefit programs, issued and effective December 21, 2005.4 Case 07-M-0548, Proceeding on Motion of the Commission Regarding an Energy Efficiency Portfolio Standard, OrderEstablishing Energy Efficiency Portfolio Standard and Approving programs, (issued and effective June 23, 2008).5
New York State Energy Research and Development Authority, System Benefits Charge Supplemental Revision for New YorkEnergy $marts"'Programs (2008-2011) As Amended August 22, 2008 and revised March 12, 2009.
1-1
Introduction
As NYSERDA's first quarterly report since the Fast Track programs commenced, this documentcombines reporting requirements of the original New York Energy $marts' programs with theadditional reporting requirements for the new Fast Track programs. This evaluation report provides anupdate for the New York Energy $martsm Program as well as the Fast Track EEPS Programs.6
1.1 Organization of the Report
This report was prepared by NYSERDA staff with contributions from a team of independent third-partyevaluation contractors. The evaluation contractors work closely with NYSERDA's programimplementation staff and contractors, customers, and market and trade allies to develop an understandingof the Program offerings and to conduct independent assessments of the Program's impacts and progresstoward the established public policy goals. The evaluation functions covered by the specialty contractorteams are: impact evaluation; market characterization and assessment; and process assessment andevaluation management. This report is divided into the following sections:
Section 1 Introduction
• Section 2 Portfolio-Level Reporting
• Section 3 Commercial/Industrial Programs
• Section 4 Residential and Low-Income Programs
• Section 5 Research and Development Programs
• Appendix A'
• Appendix B8
6 For purposes of this report, the New York Energy $marts" Program refers to the original 13-year program and the EEPSProgram refers to the EEPS Fast Track Programs. The SBC Program refers to the portfolio of programs and includes both NewYork Energy $martsM and EEPS funding sources.
' This appendix provides a compilation of quarterly narrative and numeric progress updates required by the Department of Public
Service in their June 29, 2009 Energy Efficiency Program Information Reporting Manual. The appendix focuses onNYSERDA's five EEPS Fast Track EEPS programs.8 This appendix provides the complete numeric progress updates, in total and by program, required by the Department of PublicService in their June 29, 2009 Energy Efficiency Program Information Reporting Manual. The appendix focuses onNYSERDA's five EEPS Fast Track EEPS programs.
1-2
2Portfolio-Level Reporting
2.1 Budget and Spending Status
This section presents financial data for the System Benefits Charge (SBC)-funded Program. Table 2-1provides summary level budget and spending data for both the New York Energy $martsM and EEPSFast Track Programs. Sections 2. 1.1 and 2.1.2 provide further breakout of budget and spending for eachindividual New York Energy $martsM and EEPS Fast Track-funded program, respectively.
Table 2-1. Financial Status of New York's System Benefits Charge Programs throughJune 30, 2009 ($ million)
Total BudgetTotal Funds
Spent% of Budget
Spent
New York Energy $martsM Program (Original 13-Year Budget) $1,894.2 $1,186.8 62.7%
EEPS Fast Track Programs $259.5 $1.3 0.5%
Total SBC Program $2,153.7 $1,188.1 55.2%
Totals may not sum exactly due to rounding. Source: NYSERDA
2.1.1 System Benefits Charge Program Budget Spending Status
This section presents financial data for the New York Energy $martSM Program from 1998 through June30, 2009. Of the $1.87 billion, 13-year budget, $1.68 billion is allocated to four major program areas;Commercial/Industrial, Residential, Low-Income, and Research and Development (R&D), and a generalawareness campaign. The percentage of each program area budget spent to date is: 59.9% for
Commercial/Industrial, 81.7% for Residential, 63.4% for Low-Income, and 46.3% for R&D. Budgets
and spending are presented in Table 2-2 along with costs for program administration, evaluation,
Environmental Disclosure', and the New York State Cost Recovery Fee'.
1 This program provides electricity commodity suppliers with data for informing customers about the fuel mix and associatedenvironmental impacts of their electricity sources.
2-1
k
Portfolio-Level Reporting
Table 2-3 shows the budget and spending for individual New York Energy $martsm programs.
Table 2-2. Financial Status of the New York Energy $mart'm Program through June 30,2009 ($ million)
Total 13-Funds Spent
YearBudget 1
SBC I &
SBC II2SBC III' Total Spent
% of BudgetSpent
Commercial/Industrial 634.0 247.1 132.6 379.8 59.9%
Residential 312.8 165.4 89.9 255.4 81.717c
Low-Income 318.6 86.6 115.3 201.9 63.4%
Research and Development 388.3 105.9 74.1 179.9 46.3%
General Awareness) (Marketing) 31.0 15.9 6.4 22.3 71.9%
Program Areas Total $1,684.6 $620.9 $418.3 $1,039.2 61.7%
Program Administration 128.4 59.8 45.7 105.5 82.2%
Metrics and Evaluation 5 51.8 14.5 8.7 23.2 44.8%
Statewide Evaluation ProtocolDevelopment
2.1 0.0 0.0 0.0 0.0%
Environmental Disclosure 1.9 0.8 -0.8 <0.1 2.5%
NYS Cost Recovery Fee 25.4 9.2 9.6 18.8 73.8%
Other Costs Total $209.6 $84.3 $63.3 $147.6 70.7%
Total New York Energy $martsMProgram
$1,894.2 $705.2 $481.6 $1,186.8 62.7%
1 Reflects reallocation of funding among programs as approved by the Public Service Commission.2 SBC 1: July 1, 1998 through June 30, 2001; SBC II: July 1, 2001 through June 30, 2006.i SBC III: July 1, 2006 through June 30, 2011.4 General Awareness previously included in Residential Program Areas PSC Case 07-M-0548 Order Establishing the Energy Efficiency Portfolio Standard and Approving Programs, effective June
23, 2008 increased the SBC evaluation budget from 2% to 5% of program funding, thus adding $17.1 million. Budget also
reflects $250,000 for Department of Public Service Evaluation Consultant - amount approved to be paid from SBC interesting
earnings.
Totals may not sum exactly due to rounding. Source: NYSERDA
2 The New York State Cost Recovery Fee is assessed for services to public authorities. The fee is determined by the New YorkState Division of Budget and imposed and collected by the Department of Taxation and Finance.
2-2
Budget and Spending Status
Table 2-3. Individual Programs - New York Energy $mart' Financial Status throughJune 30, 2009 ($ million)
Budget Funds Spent
Program TotalBudget
SBC I &SBC II 2
3SBC IIITotalFundsSpent
% of BudgetSpen
Commercial/Industrial
Existing Facilities4, 5 308.0 135.4 49.4 184.8 60.0%
New York Energy $martsM Business Partners 43.9 21.1 7.7 28.8 65.6%
Loan Fund and Financing 5 43.7 12.3 21.3 33.6 77.0%
Energy Smart Focus 18.9 4.8 6.7 11.6 61.4%
New Construction Program 164.4 53.1 39.4 92.4 56.2%
FlexTech Technical Assistance 55.2 20.4 8.1 28.5 51.6%
Total Commercial & Industrial $634.0 $247.1 $132.6 $379.8 59.9%
Residential & Low-income
Single Family Home Performance 107.5 47.4 38.5 85.8 79.9%
Multifamily Building Performance 44.5 18.3 18.7 37.0 83.3%
Market Support Residential 148.9 96.5 27.8 124.3 83.5%
Communities and Education 11.9 3.2 5.0 8.2 68.7%
Subtotal Residential $312.8 $165.4 $90.0 $255.4 81.7%
Single Family Home Performance 78.3 22.3 21.7 44.0 56.1 %
Multifamily Building Performance 160.0 45.4 49.9 95.3 59.6%
EmPower New York 63.7 14.3 38.9 53.1 83.4%
Buying Strategies & Energy Awareness 16.6 4.7 4.8 9.5 57.4%
Subtotal Low-Income $318.6 $86.6 $115.3 $201.9 63.4%
Total Residential and Low-Income $631.3 $252.0 $205.3 $457.3 72.4%
Research and Development
Public Benefit Power Transmission and Distribution 10.0 0.0 0.7 0.7 7.4%
Clean Energy Infrastructure (includes closed program: EndUse Renewables)
91.1 19.0 27.9 46.9 51.5%
Distributed Energy Resources: Power Systems ProductDevelopment & DG-CHP Demonstrations
149.2 34.0 21.8 55.8 37.4%
Demand Response and Innovative Research 10.0 0.0 <0.1 <0. I 0.1%
Electric Transportation 5.0 0.0 0.7 0.7 14.3%
Environmental, Monitoring, Evaluation & Protection 39.1 17.7 7.3 25.0 64.0
Industrial and Municipal Process Efficiency 15.0 0.0 3.0 3.0 19.9
Next Generation and Emerging Technologies 42.7 18.3 8.4 26.7 62.5%
Wholesale Renewable Energy Market 22.7 16.5 2.7 19.1 84.1%
Other 0.4 0.4 <0.1 0.4 100%
Regional Greenhouse Gas Initiative 3.0 0.0 1.5 1.5 49.8%
Total Research and Development $388.3 $105.9 $74.1 $179.9 46.3%
General Awareness (Marketing) 31.0 15.9 6.4 22.3 71.9%
Total New York Energy $martsM Program $1,684.6 $620.9 $418.3 $1,039.2 61.7%
Reflects reallocation of funding among programs as approved by the Public Service Commission.
2 SBC 1: July I, 1998 through June 30, 2001; SBC II: July 1, 2001 through June 30, 2006.
' SBC III: July I, 2006 through June 30, 2011.4 The Peak Load Management and Enhanced Commercial / Industrial Performance programs have been combined into the Existing Facilities Program
`Transfer of $18.3 million from Existing Facilities to Loan Fund and Financing per approval by the Public Service Commission as of January 27, 2009
Totals may not sum exactly due to rounding. Source: NYSERDA
2-3
Portfolio-Level Reporting
2.1.2 EEPS Fast Track Program Budget Spending Status
This section presents financial data for the EEPS Fast Track Programs from their initiation in March 2009through June 30, 2009. Of the $259.5 million Fast Track budget, $229.3 million (88%) is allocated to sixprograms: CFL Expansion, EmPower, Commercial New Construction, Flex Tech Expansion, Industryand Process Efficiency, and General Awareness. Budgets and spending for each EEPS Fast Trackprogram are presented in Table 2-4.
Table 2-4. Financial Status of the EEPS Fast Track Programs through June 30, 2009($ million)
Total BudgetTotal Funds
Spent% of Budget
Spent
CFL Expansion 17.2 0.0 0.0%
EmPower 23.6 0.6 2.5%
Commercial New Construction Program 62.7 0.0 0.0%
Flex Tech Expansion 14.9 0.0 0.0%
Industry and Process Efficiency 92.8 0.2 0.2%
General Awareness 18.1 0.0 0.0%
Program Total $229.3 $0.8 0.3%
Program Administration 18.1 0.3 1.6%
Metrics and Evaluation 12.0 0.2 1.7%
Other Costs Total $30.1 $0.5 1.7%
Total EEPS Fast Track Program $259.5 $1.3 0.5%
Totals may not sum exactly due to rounding. Source: NYSERDA
2.2 Portfolio Level Findings
This section presents portfolio-level findings for the SBC Program.
2.2.1 Summary of System Benefits Charge Program Benefits
Summary of SBC Program Benefits (Combined Program)
Table 2-5 shows the cumulative New York Energy $martsM Program benefits through June 30, 2009,and through the last four calendar years. Cumulative annual electric savings have reached nearly 3,365GWh. Peak demand reduction efforts have led to a total reduction of 1,315 MW that consists ofpermanent and curtailable demand reductions. Renewable energy generation now amounts to 106 GWh.
Portfolio Level Findings
Table 2-5. Cumulative SBC Program Benefits from Installed Measures (CombinedProgram)
ThroughThrough Through Through Through
BenefitsYear-End
Year-End Year-End Year End June 30,2006 2007 2008 2009
2005
Electricity Savings from Energy Efficiency and1,950 2,350 3,060 3,225 3,365
On-Site Generation (Annual GWh)
Renewable Energy Generation (Annual GWh) 103 105 106 106 106
Peak Demand Reduction' (MW)........ ....... ...... ... ........ .........
1,040..................................................
1,113.......... .._... ..._......
1,200...... .. .........
1,275 1.315
Permanent Measures (MW)........ ....... .... ........ ........ ..........
445........ _ _.............
495..................... ........
650......... ............... ..........
700..............
725
Curtailable2 595 618 550 575 590
Net Fuel Savings (Annual MMBtu) 4,000,000 4,049,000 4,660.000 5,400,000 5,200,000
Annual Energy Bill Savings to Participating$275 $330 $570 $620 $610
Customers ($ Million)
Jobs Created and Retained per Year3 3,100 3,700 4,700 4,700 4,700
NO, Emissions Reductions (Annual Tons)........ ......... ... .......... ............... ............... .......... .
1,750.........-
2,060.............. . ..............................
2,570......... .
2,690 2,780
SO2Emissions Reductions (Annual Tons)........ . ......... ......... ................................................. .............
3,170 3,800....... ...
4,720..... ...
4,930 5,070.........
4CO, Emissions Reductions (Annual Tons) 1,400,000 1,600,000 2,000,000 2,100,000 2,200,000
Equivalent number of cars removed from NY275,000 320,000 400,000 420,000 440,000
roadways.......... .......... .......... ............. ... .... ._._._ ... .... ..._...... .... . ....... ... ........ . ...... ........ ...... ..... ............
'Does not include 9.8 MW of renewable energy generation capacity.
2 Curtailable MW has decreased due to a reassessment of the impact of the Enabling Technologies Program. MW enabledunder the SBC2 program Enabling Technologies for Price Responsive Load was not required to persist beyond the period ofthe contract. As such, the MWs available have steadily declined since the program's close.
i Figures in this row represent the net additional jobs created through year-end. Results from 2004 through 2007 have beenrestated based on new analysis conducted in 2009.
4These emission reductions are associated with both electric and fossil fuel saving measures. Under a cap-and-trade system, thetotal number of emission allowances is determined by regulation. Regulated entities can purchase allowances and collectivelyemit up to the cap that is currently in place. Therefore, in the near term, electric efficiency projects may not decrease theoverall amount of emissions going into the atmosphere. However, electric efficiency projects will reduce end-users'responsibility or footprint associated with emissions from electricity production.
Electric and Peak Demand Savings by Utility Service Area
Figure 2-1 and Figure 2-2, respectively, show electricity and demand savings by utility service area forthe combined EEPS and New York Energy $marts"-funded programs. The National Grid (37%) andCon Edison (33%) service areas show the highest percentages of electricity savings. The same serviceareas, Con Edison (39%) and National Grid (32%), are also seeing the highest percentages of the overalldemand reductions. Both of these figures are based on the cumulative annual savings achieved throughJune 30, 2009. For certain market transformation and informational programs representing 18% of theportfolio electricity savings and 17% of the demand reductions, savings were apportioned to utility areasbased on incentive dollars. In future quarterly reports, as EEPS-funded savings grow, two sets of piecharts will be presented displaying New York Energy $martsst and EEPS savings by utility separately.
2-5
Portfolio-Level Reporting
Figure 2-1. Electricity Savings by Utility through June 30, 2009 (Combined Program)
RG&E6% -Central Hudson
4%NYSEG
17% Con Edison33%
Figure 2-2. Demand Savings by Utility (includes callable MW) through June 30, 2009(Combined Program)
NYSEG19%
Con Edison39%
National Grid32%
Largest Energy Savers Impact Evaluation
2.2,2 New York Energy $martw Progress Toward Goals
Overall, the New York Energy $martsM programs are performing well toward their five-year goals3 inthe areas of energy savings, demand reduction, and other key metrics. This section discusses generalprogress toward these goals. Sections 3, 4, and 5 contain more detailed information. In summary:
The C/I programs are showing good progress toward their individual electricity and demandsavings goals. Progress on the majority of programs has met or exceeded expected levels at thispoint in the five-year measurement period.
Within the C/I program area, five different five-year goals have been set for metrics other thanenergy and peak demand savings. These metrics capture progress in key areas such as the numberof customers served, allies participating, and dollars leveraged. The programs are making goodprogress toward these non-energy goals.
The Residential and Low-Income programs are making good progress toward their individualelectricity and fuel savings goals. The Multifamily Building Performance Program has beensignificantly revised, and is therefore experiencing a lag in achievements, but most of the otherprograms are performing at expected levels.
Twenty-five long-term goals have been set for important non-energy metrics in the Residential andLow-Income areas, including the number of customers participating, outreach efforts and peopleaffected, and dollars leveraged. Overall, the programs are making progress toward these goals.
Almost 40 long-term non-energy goals have been set for the R&D portfolio. These goals addressmetrics such as solicitations released, projects funded, information dissemination, co-funding, andtechnology transfer. In general, the programs are tracking well toward these long-term non-energygoals.
2.3 Largest Energy Savers Impact Evaluation
The Megdal & Associates Impact Evaluation contractor team evaluated the energy savings for a group oflarge projects that completed participation in NYSERDA's programs between 2005 and 2007. The studytargeted 25 participants, each exceeding 1.5 GWh, from the following programs:
• C1PP (Commercial/Industrial Performance Program);
• DG-CHP (Distributed Generation - Combined Heat and Power);
• NCP (New Construction Program);
3 Five-year goals were specified in the System Benefits Charge Proposed Plan for New York Energy $marts' Programs (2006-2011), March 2, 2006. These goals were set at the program level, and included energy savings, demand reductions and otherimportant metrics. The five-year goals cover the time period from July 1, 2006 through June 30, 2011.
4 For the purposes of this study, Large Savers are considered to be organizations that participated in a NYSERDA programresulting in estimated savings of 1.5 GWh/yr or greater.
2-7
Portfolio-Level Reporting
PLMP (Peak Load Management Program); and
• TA (Technical Assistance).
The Large Savers study was designed to evaluate a census of the largest expected savers. Together, the25 projects represent 108 GWh/yr in savings, or 15% of the 2007 incremental savings reported for theSBC portfolio.
This report presents the results for the impact evaluation that was completed for 24 of the selectedprojects.5 The Large Savers included a wide range of businesses and institutions, includingcommunications, utilities, manufacturing, higher education, recreation, healthcare, local government, andretail. The project results presented here represent 103 GWh/yr or 14% of the 2007 incremental savingsreported for the SBC portfolio.
It must be emphasized that these results are only applicable to the specific projects studied. As this is acensus of the largest expected savers, results cannot be applied to any other groups of participants in anyof these programs or to provide any general conclusions about the programs overall without specificevaluation. The Large Savers study serves to inform the programs and increase the reliability ofNYSERDA's overall program and portfolio savings estimates due to the increased reliability in theestimates for these specific large projects.
2.3.1 Gross Savings Evaluation Methods
The Megdal Team's lead impact evaluation engineers prepared measurement and verification (M&V)plans for each individual site. They first reviewed the project files in detail; verified qualification forinclusion in the Large Savers study, determined what measures would be examined for each specificfacility using Pareto analysis, and outlined the evaluation procedure. In forming the plan, the evaluationengineers had the option of proposing simulation of building systems and equipment operations, analysisof utility bills, or direct measurement of equipment performance through metering or monitoring withappropriate instrumentation. Participant or contractor data were also used where deemed reliable.
The M&V plan for each site was based on an eight-page template specifying measure(s), approach, rigor,accuracy, data requirements, analysis, and budget for the evaluation. The engineering director for theevaluation team and NYSERDA's impact evaluation manager reviewed the M&V plans. Refinementswere made as necessary.
The lead evaluators worked with NYSERDA program staff to gain access to decision-makers in the
participant organizations to arrange for site visits, obtain vendor and site-collected data, and to scheduleinterviews to gather/obtain data for the net-to-gross analysis. In addition to performing measurementsand other data acquisition for the energy-saving evaluation, the lead site evaluation engineer conducted
in-depth interviews with decision-makers at the participant organization.
s The 25`h targeted site was a participant for which implementation and program M&V was in process during the evaluationperiod and thus was not evaluated for ex post impact. Of the 24 participants evaluated for ex post gross savings, there were 21that completed interviews and evaluations for free-ridership and participant spillover.
2-8
Largest Energy Savers Impact Evaluation
After data collection, the lead evaluator analyzed the data and reported it in a standardized format. Theengineering director reviewed all site-specific analysis and reports and performed the summary realizationrate analysis.
2.3.2 Net-to-Gross Evaluation Methodology
One purpose of an energy saving program is to induce changes that would not otherwise occur. Programevaluation includes an assessment of which energy saving initiatives were taken as a result of theprogram, and how much would have been done in the absence of the program. The latter, free-ridership(FR), essentially dilutes the efficacy of the program and is expressed as a percentage of the total savingsunder the program. Since many large saving projects have access to sophisticated engineering, cost-management resources, and internal financing, a large proportion of them could be expected to undertakeenergy-saving projects even in the absence of any incentives, in comparison to the generalcommercial/industrial sector.
A contrary effect, spillover (SO), includes those energy saving actions an organization takes as a result ofthe program, but for which it does ,not receive any program incentives. Spillover increases the cost-effectiveness of the program, and is also expressed as a percentage of the total savings under the program.External, or non-participant, spillover often occurs outside the participating organization, as well, but thisis not included in the current study which focuses only on the specific participants themselves. However,the general non-participant SO results derived from a separate NYSERDA evaluation have been appliedto the projects analyzed.
To determine the net effect of the program, free-ridership and spillover need to be determined and takeninto account. Then the net-to-gross ratio (NTGR) is calculated as follows:
NTGR = I - FRrate + SOtate
Thus, in addition to the engineering evaluation of the physical changes made by the participatingorganization and the resulting energy savings, knowing the free-ridership and spillover is critical tounderstanding the effectiveness of the program.
Historically, free-ridership and spillover effects have been assessed through telephone surveys of
personnel at participating companies. The Large Savers study sought to investigate free-ridership and
participant spillover in more depth than previous evaluations by mirroring the approach used in the
verification of gross savings for large-scale projects. The creation of site-specific measurement andverification plans for the highest savings projects is a common expectation for high quality gross savings
evaluations. NYSERDA's approach for its Largest Savers evaluation created a systematic approach to do
likewise for free-ridership and participant spillover estimation.
In order to understand the decision-making process in each participating organization, the assessmentteam sought to identify and conduct in-person interviews, where possible, with all the participants' staffwho have influence in making decisions relating to energy equipment or energy usage relatedproducts/operations. Referred to as the "salad bar approach", all respondents received a core set ofquestionnaires ("the lettuce"), and then select instruments were applied to each project ("the toppings").
This initial step involves learning how decision-making occurs for each particular firm and project. Theinformation is then used to combine components based upon the type of decision-maker (facilitymanagers, financial personnel, operations personnel) and the type of application (renewables, newconstruction, DG standard technology and DG emerging technology).
Portfolio-Level Reporting
The survey instruments include the same set of questions used in the previous NYSERDA NTGevaluations plus other inquiries to assess construct validity. This strategy allows the Impact EvaluationTeam to compare the results using alternative approaches. All interviewees received a common set ofinquiries so responses could be compared across decision-makers and that firm's decision-makingprocess. Open-ended questions invited decision-makers to comment at length.
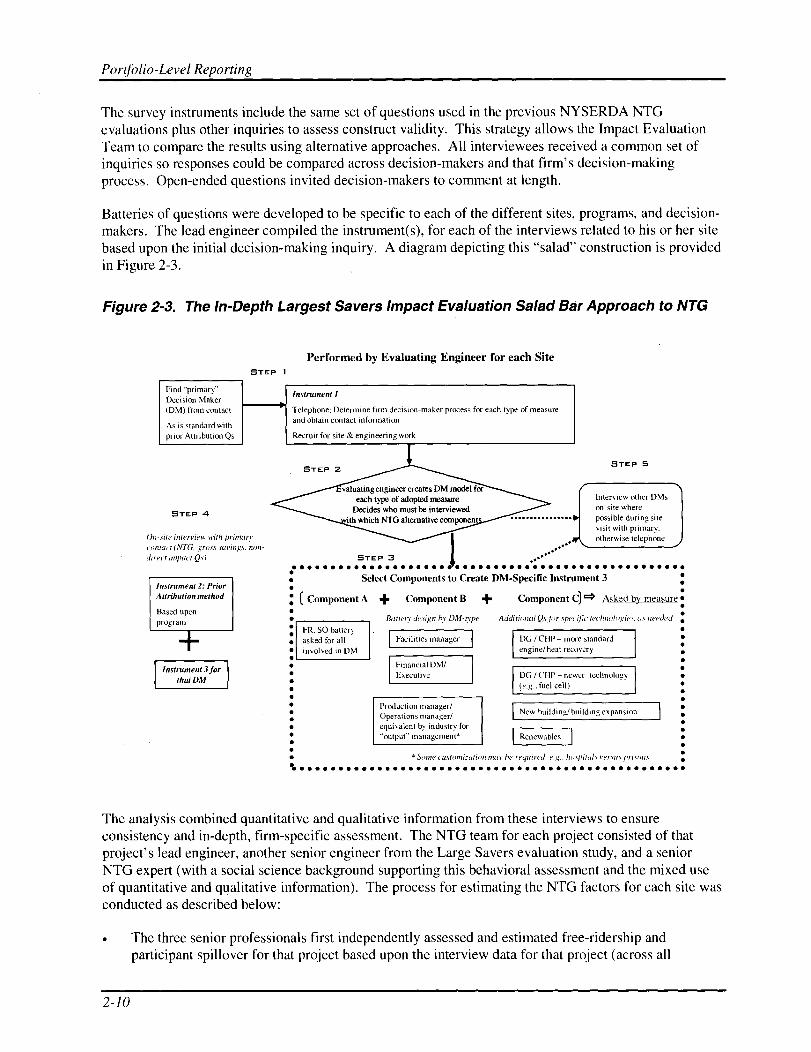
Batteries of questions were developed to be specific to each of the different sites, programs, and decision-makers. The lead engineer compiled the instrument(s), for each of the interviews related to his or her sitebased upon the initial decision-making inquiry. A diagram depicting this "salad" construction is providedin Figure 2-3.
Figure 2-3. The In-Depth Largest Savers Impact Evaluation Salad Bar Approach to NTG
Find "primary"Decision Maker(DM) from contact
STEP 1
Performed by Evaluating Engineer for each Site
As is standard withprior Attribution Qs
STEP 4
On-site interview with primate
contact (NTG, gross sol ing.5, nan-
direct impact Qs)
Instrument 2: PriorAttribution method
Based uponprogram
Instrument 3 forthat DM
Instrument I
Telephone: Determine firm decision-maker process for each type of measureand obtain contact information
Recruit for site & engineering work
STEP 2
valuating engineer creates DM model foieach type of adopted measure
Decides who must be interviewedgnth which NTG alternative compote :............... N
STEP 3 l
STEP 5
Interview other DMson-site wherepossible during sitevisit with primary.otherwise telephone
• • • • • • • • • • • • • • • • • • • • S. • • • • • • • • • • • • • • • • • • • • • • • • • • • • •
Select Components to Create DM-Specific Instrument 3 ••
(Component A + Component B + Component C) I* Asked by measure ••
•
FR. SO batteryasked for allinvolved in DM
•
•11•
•
Batters de.ssx nn by DM-n'e Additional Qrfor.,Itecif'tc technolnxies. as needed ••
Facilities manager
Financial DM/Executive
Production manager/
Operations manager/
equivalent by industry for
"output' management*
DG / CHP - more standardengine/heat recovery
DG / CHP - newer technology(e.g.. fuel cell)
New building/ building expansion
Renewables
•
••••
• * Some cue7omi;lainn may he required. e. g., ha.epitaLs versus prixuns •
••••••••••••••••••••••••••••••••••••••••••••••••••••
The analysis combined quantitative and qualitative information from these interviews to ensureconsistency and in-depth, firm-specific assessment. The NTG team for each project consisted of thatproject's lead engineer, another senior engineer from the Large Savers evaluation study, and a seniorNTG expert (with a social science background supporting this behavioral assessment and the mixed useof quantitative and qualitative information). The process for estimating the NTG factors for each site wasconducted as described below:
The three senior professionals first independently assessed and estimated free-ridership andparticipant spillover for that project based upon the interview data for that project (across all
2-10
Largest Energy Savers Impact Evaluation
interviewees). These independent assessments allowed the process to test and enhance inter-raterreliability.
Once the independent assessments were made, a teleconference was scheduled. Each member of the
project-specific NTG team presented his or her initial estimates (prior to any other questions or
discussion). The lead engineer answered questions from the other two reviewers, described
perceptions, intonations, and other context. This was followed by an open discussion covering
various issues arising from the interviews and the challenges in interpreting the responses across the
various interviewees.
The discussions varied considerably depending upon the responses received, the decision-making process,the type of project, the type of customer, whether the organization is a non-profit, a government entity andtheir funding circumstances. This process produced a consensus estimate of free-ridership and participantspillover, and estimated upper and lower bounds for these values.
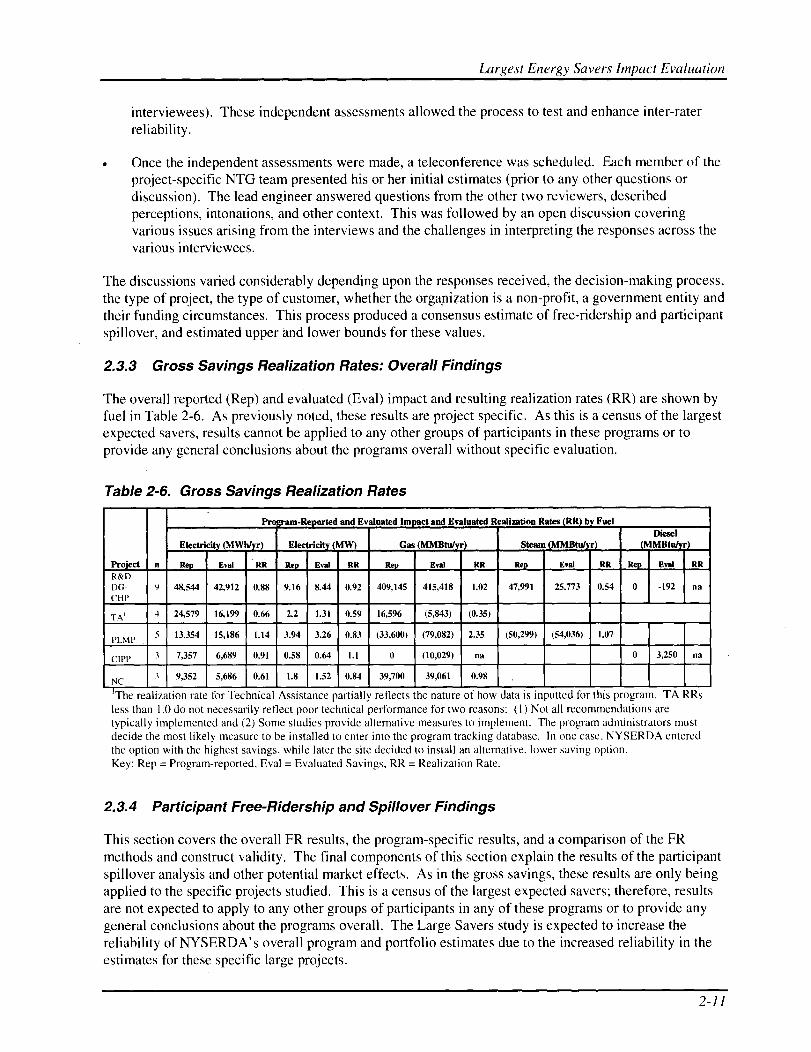
2.3.3 Gross Savings Realization Rates: Overall Findings
The overall reported (Rep) and evaluated (Eval) impact and resulting realization rates (RR) are shown byfuel in Table 2-6. As previously noted, these results are project specific. As this is a census of the largestexpected savers, results cannot be applied to any other groups of participants in these programs or toprovide any general conclusions about the programs overall without specific evaluation.
Table 2-6. Gross Savings Realization Rates
m-R rted and Evaluated Impact and Evaluated Realization Rates (111 1) FuelDiesel
Electricity (MW" r Electricity (MW) Gas MMBtu! r Steam MBtuI r) (MMBtuty r
Project n Rep I Eva[ RR Rep Eval RR Rep Eval RR Rep Eval RR Rep Eval RR
R&DDG- 9 48,544 42,912 0.88 9.16 8.44 0.92 409,145 415,418 1.02 47,991 25,773 0.54 0 192 na
CHP
TA' I4 24,579 16,199 0.66 2.2 1.31 0.59 16,596 (5,843) (0.35)
PLMP 5 13,354 15,186 1.14 3.94 3.26 0.83 (33,600) (79,082) 2.35 (50,299) (54,036) 1.07
CIPP 3 7,357 6,689 0.91 0.58 0.64 1.1 0 (10,029) na 0 3,250 na
NC3 9,352 5,686 0.61 1.8 1.52 0.84 39,700 39,061 0.98
'The realization rate for Technical Assistance partially reflects the nature of how data is inputted for this program. TA RRsless than 1.0 do not necessarily reflect poor technical performance for two reasons: (l) Not all recommendations aretypically implemented and (2) Some studies provide alternative measures to implement. The program administrators mustdecide the most likely measure to be installed to enter into the program tracking database. In one case, NYSERDA enteredthe option with the highest savings, while later the site decided to install an alternative, lower saving option.Key: Rep = Program-reported, Eva] = Evaluated Savings, RR = Realization Rate.
2.3.4 Participant Free-Ridership and Spillover Findings
This section covers the overall FR results, the program-specific results, and a comparison of the FRmethods and construct validity. The final components of this section explain the results of the participantspillover analysis and other potential market effects. As in the gross savings, these results are only beingapplied to the specific projects studied. This is a census of the largest expected savers; therefore, resultsare not expected to apply to any other groups of participants in any of these programs or to provide anygeneral conclusions about the programs overall. The Large Savers study is expected to increase thereliability of NYSERDA's overall program and portfolio estimates due to the increased reliability in theestimates for these specific large projects.
2-11

Portfolio-Level Reporting
Free-Ridership Results
The free-ridership level seen in this study is fairly high. Results are outlined in Table 2-7. These resultsare not completely unexpected., since a higher proportion of the largest customers can be expected to havewell trained engineering staff and internal resources to search, consider, and finance efficiencyimprovements.
Free-ridership is based upon customer knowledge of the equipment and building options, the vendor'sdepth of experience and knowledge of efficient equipment, the customer's decision-making process andfinancial situation, and the circumstances surrounding the equipment purchase or building construction.There can be significant variation across customers and projects.
Table 2-7. Total Project Free-Ridership Estimates
Project' n Free-Ridership E.stimate2
PLMP 5 50%
CI PP 3 10%
NCP 3 89%
DG-CHP 7 28%
TA 3 44%
These results are for the projects studied only and will not be applied to the entire program.
2All estimates are weighted by the ex ante savings estimates.
The construction of the in-depth method used in this Largest Savers study deliberately included exactreplication of the prior NYSERDA method within its inquiries and calculations to allow comparison ofthe results for each project between the intense depth method and NYSERDA's current standard self-reported free-ridership method used for all its program evaluations. The results for the largest saverssupport NYSERDA's prior method, where the prior method replication produced a weighted average FRacross the projects (with both measurements) of 40% compared to a depth method estimate of 42% forthese projects .6 There is more variation between NYSERDA's prior method and the depth method on aprogram level, but the census population sizes by program are small (3-7). At a program level thecomparable estimates have 2 programs with the Depth Method estimate lower than the prior method and 3where it is higher.
Construct Validity
There are two important questions in the field of self-reported free-ridership estimation: (1) how difficultit is to measure the underlying construct, and (2) what is needed to provide reliable self-reportmeasurements of free-ridership. This study's comparison of NYSERDA's prior method and the currentmethod strongly supports the construct validity of NYSERDA's standard self-report survey method. Thecurrent method also allows for direct comparison of responses among a range of the parties instrumental
6 The overall weighted average for the Depth Method is 40% for free-ridership. One customer had a Depth Method estimate butwas missing data to derive a prior method estimate.
2-12
Largest Energy Savers Impact Evaluation
in the installation of the efficiency measures, and thus allows for the potential to mitigate self-reportingbias from a particular decision-maker by combining the self-reports from the various perspectives.Through the current process, it was also possible to weigh the NTG impacts based on the relativeinfluence of the decision-maker at each site.' The consensus process also included explicit discussionsconcerning potential biases, direction and evidence for any biases within a set of interviews. In addition,the evaluators generally agreed that the interviewees provided candid responses to the surveys developedfor the Large Savers study, although these responses could still be colored by the difficulty in assessinghow one might have acted under a different set of conditions, such as the absence of senior staff members.
The current method included a substantially larger variety of self-report FR questions than is typicallyemployed. This approach allows for a more detailed comparison of the range of possible questions andthe consistency of the responses, which is useful for more fully understanding the consequences ofrestricting the number of FR questions. This result suggests that self-reported FR inquiries should includea battery of questions best suited to measure the underlying construct. It also highlights the need forexperienced evaluators who understand both the science and art behind self-report FR measurement, aswell as the need for self-report FR survey methods that recognize and address inconsistency in customerresponses.
Important information that could only be gathered through in-depth interviews with qualitative andquantitative investigations was obtained through the depth approach. The process used to derive theconsensus FR estimates provided in-depth participant-specific assessment of any inconsistencies andderived the best FR accordingly.
2.3.5 Spillover
The Largest Saver's self-report method for participant spillover followed NYSERDA's prior surveymethod, which was a direct query, self-report approach. Only 3 of the 21 Largest Savers with NTGinterviews provided any indication of participant spillover or NYSERDA market effect on participantdecision-making. These largest savers had lower spillover than seen in the general program evaluations.However, the fact that they incorporated all savings opportunities within their program participation maybe one of the reasons they were in the group of largest expected savers. Given the size of these projects,however, even a small percentage of participant spillover savings is meaningful. Participant inside andoutside spillover is presented in Table 2-8.
' In previous NTG studies, NYSERDA has interviewed some of the different decision-makers, but there was no clear method toweigh the results to account for the relative influence of the each party in the decision-making process.
2-13

Portfolio-Level Reporting
Table 2-8. NYSERDA-induced Participant Spillover
Projects' n Participant Inside Spillover Participant Outside Spillover
CIPP 3 1.2% 3.9%
PLMP 5 0% 2.8%
'These results are for the projects studied only and will not be applied to the entire program. The program name is used tomaintain the confidentiality of the participants.
Non-participant spillover, based on results from prior studies, was also added to the results for theprojects included in the Largest Savers study. Non-participant spillover for the new construction projectswas 17%.8 For all other projects in existing facilities, it was 15%.9
The interviews also suggest that NYSERDA programs may be inducing market effects that have not beencaptured by NYSERDA's methodologies to estimate spillover. An unsolicited comment during the NTGinterviews supports an estimate of significant program-induced market effects. This information suggeststhat the evaluation designs and processes might be re-examined, creating an evaluation method to bettercapture market effects.
2.3.6 Overall Results and Findings
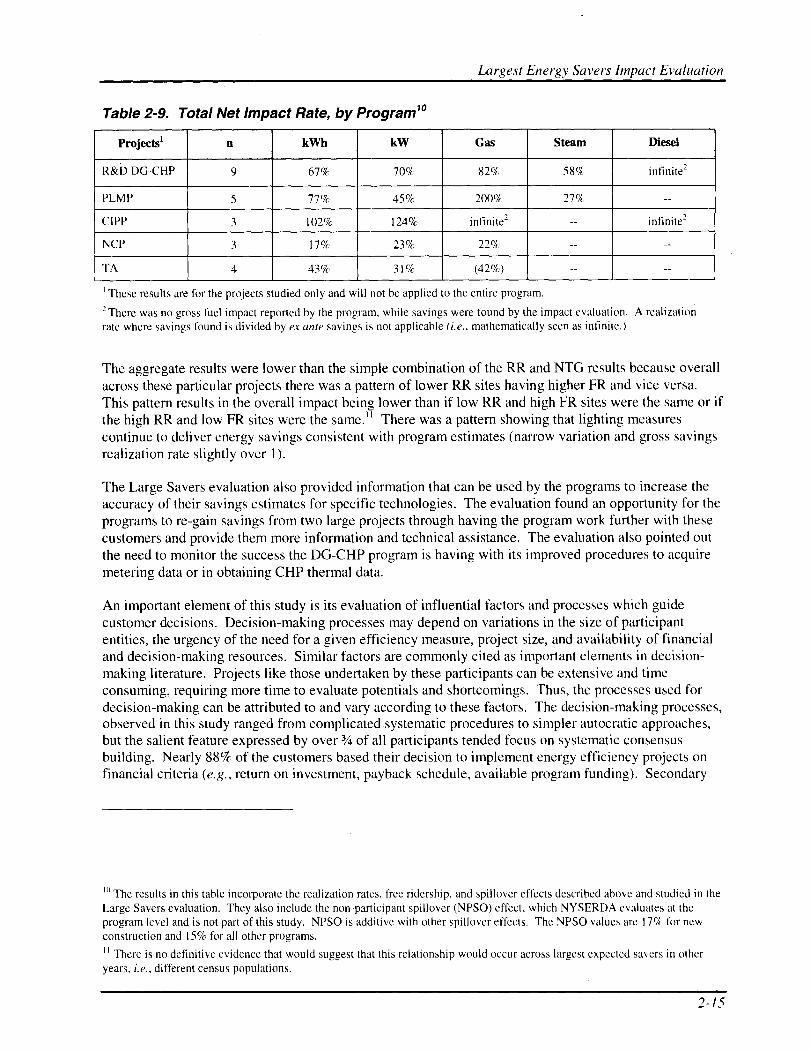
The overall Realization Rate results for all participants, combining the realization rates and the NTGfactors site-by-site, are shown at the program level in Table 2-9. This table is provided for illustrativepurposes only. Actual adjustments were made on a project-by-project basis, not for all projects within agiven program that were studied.
"New Construction Program Market Characterization, Market Assessment and Causality Evaluation, prepared by Summit Bluefor NYSERDA, May 2006.y Commercial and Industrial Market Effects Evaluation, prepared by Summit Blue Consulting for NYSERDA, October 2007.
2-14
Largest Energy Savers Impact Evaluation
Table 2-9. Total Net Impact Rate, by Program10
Projects' n kWh kW Gas Steam Diesel
R&D DG-CHP 9 67% 70% 82% 58% infinite'
PLMP 5 77% 45% 200% 27% --
CIPP 3 102% 124% infinite2 -- infinite2
NCP 3 17% 23% 22% -- --
TA 4 43% 31% (42%) -- --
1 These results are for the projects studied only and will not be applied to the entire program.2 There was no gross fuel impact reported by the program, while savings were found by the impact evaluation. A realizationrate where savings found is divided by ex ante savings is not applicable (i.e., mathematically seen as infinite.)
The aggregate results were lower than the simple combination of the RR and NTG results because overallacross these particular projects there was a pattern of lower RR sites having higher FR and vice versa.This pattern results in the overall impact being lower than if low RR and high FR sites were the same or ifthe high RR and low FR sites were the same." There was a pattern showing that lighting measurescontinue to deliver energy savings consistent with program estimates (narrow variation and gross savingsrealization rate slightly over 1).
The Large Savers evaluation also provided information that can be used by the programs to increase theaccuracy of their savings estimates for specific technologies. The evaluation found an opportunity for theprograms to re-gain savings from two large projects through having the program work further with thesecustomers and provide them more information and technical assistance. The evaluation also pointed outthe need to monitor the success the DG-CHP program is having with its improved procedures to acquiremetering data or in obtaining CHP thermal data.
An important element of this study is its evaluation of influential factors and processes which guidecustomer decisions. Decision-making processes may depend on variations in the size of participantentities, the urgency of the need for a given efficiency measure, project size, and availability of financialand decision-making resources. Similar factors are commonly cited as important elements in decision-making literature. Projects like those undertaken by these participants can be extensive and timeconsuming, requiring more time to evaluate potentials and shortcomings. Thus, the processes used fordecision-making can be attributed to and vary according to these factors. The decision-making processes,observed in this study ranged from complicated systematic procedures to simpler autocratic approaches,but the salient feature expressed by over 3/4 of all participants tended focus on systematic consensusbuilding. Nearly 88% of the customers based their decision to implement energy efficiency projects onfinancial criteria (e.g., return on investment, payback schedule, available program funding). Secondary
10 The results in this table incorporate the realization rates, free ridership, and spillover effects described above and studied in theLarge Savers evaluation. They also include the non-participant spillover (NPSO) effect, which NYSERDA evaluates at theprogram level and is not part of this study. NPSO is additive with other spillover effects. The NPSO values are 17% for newconstruction and 15% for all other programs.
11 There is no definitive evidence that would suggest that this relationship would occur across largest expected savers in otheryears, i.e., different census populations.
2-15
Portfolio-Level Reporting
factors such as technical assistance, environmental benefits, and reduced energy costs were cited asinfluential considerations in customer decision-making. NYSERDA's program benefits, coupled withfinancial payback, were credited as primary considerations in most of the customers' decision to moveforward with their respective energy efficiency projects. These benefits included program funding, time(i.e., implementing projects in a more timely manner), and the ability to enhance the scope of a project.
The intense exam provided by the Large Savers Evaluation also suggests findings for improvingevaluations themselves. Lessons learned from this evaluation will be examined as detailed work plans aremade for the large savings participants (the census strata) within the commercial and industrialevaluations going forward. The large NCP projects were found to be the most complex in terms ofevaluation and this was considered when designing the future evaluation of this program. The evaluationprovides information that could lead to refinements to the free-ridership method and process, or at leastideas for testing these refinements within future evaluations.
2.3.7 Overall Conclusion
It must be reiterated that these results are only applied to the 24 specific projects studied; as this is acensus of the largest expected savers, results cannot be applied to any other groups of participants in anyof these programs or to provide any general conclusions about the programs overall. However, the LargeSavers study serves to inform the programs and increase the reliability of NYSERDA's overall programand portfolio savings estimates due to the increased reliability in the estimates for these specific largeprojects.
The customized site-specific inquiries that were possible due to the salad bar free-ridership approachallowed the gathering of important information that could only be obtained through in-depth interviewswith qualitative and quantitative investigations. Both the interviews and the estimation process reliedupon a mixed-methods approach, using qualitative and quantitative data and processes, to derive theconsensus free-ridership estimates. These estimates provided in-depth, participant-specific assessment forany inconsistencies, effects of common social psychology concerns, and assessment of interactionsbetween the flow of information between the different players and that site's decision to invest inefficiency. The method and process produced free-ridership estimates that demonstrate construct validity,consistency, low variation (as an indicator of estimate reliability). The method and process also provideda deeper understanding of these decisions at these particular firms, enabling the evaluators to stronglysupport the reliability of the free-ridership estimates produced.
NYSERDA's Large Savers' evaluation study developed and conducted in-depth customer and technologyspecific gross and net evaluation methods, instruments, and analyses. This in-depth evaluation was alsocost-effective.
A recent survey12 of energy efficiency programs around the country found that sponsors typically fundthem at levels ranging between $0.12 to $0.24 per annual kWh saved. Evaluation funding typically is 2%to 8% of implementation funding. Using the midpoints of those ranges, typical evaluation funding isabout $0.009 (5% of $0.18) per gross annual kWh saved.
12 Conducted by Energy and Resource Solutions, ERS, Inc.
2-16

Largest Energy Savers Impact Evaluation
Total funding for this large savers evaluation was about $330,000. Based on total evaluated energysavings of 125 million kWh/year,'3 the evaluation cost was less than $0.003 /kWh/yr saved. This meansthat the Large Savers evaluation study was completed for 70 percent less than a typical evaluation andwithout sampling error.
13 The team fully evaluated projects totaling 103 GWh/yr in savings and reviewed and adjusted projects totaling an additional 22million kWh/yr in a database cleaning exercises that was part of the study.
2-17
Commercial/Industrial Programs
3.1 Commercial/Industrial Evaluation Activities
3.1.1 Completed Evaluation Activities
• Largest Savers Evaluation• Quality Assurance review of the NCP database
3.1.2 Evaluation Activities in Progress and Planned
As NYSERDA's detailed evaluation plans are reviewed and approved by DPS, additional evaluationactivities will be scheduled and described in future quarterly reports.
3.2 Summary of C/I Evaluation Results
3.2.1 Progress Toward Non-Energy Goals
As part of the SBC Program, across the C/I programs, five logic-model driven goals were set for otherkey metrics besides energy savings, such as the number of customers receiving assistance, fundsleveraged, and allies participating. The programs are performing well with respect to these non-energygoals. Specifically, 36 months into the five-year measurement period:
• Two of the five goals have been exceeded
• One of the five goals has reached or exceeded 50% progress
• Progress on the remaining two goals is at 50% or less.
3.2.2 Energy, Peak Demand, and Fuel Savings
Table 3-1 shows the electricity savings achieved by the C/I programs as well as progress toward the five-year goals that have been established for selected programs. Table 3-2 shows peak demand savings andprogress toward several program-specific goals in that area. Table 3-3 shows other fuel savings.
3-1
Commercial/Industrial Programs
Table 3-1. CI! Program Cumulative Annual Electricity Savings through June 30, 2009 andProgress toward SBC Goals (Combined Programs)
Energy Savings (GWh)
Savings achieved through July 1, ProgressProgram 2006 Toward
June 30,June 30, 2009 through
l3GGoal
2006 (Cumulative) June 30, oa (%(Cumulative) 2009 achieved)
Existing Facilities Program' 837.Oa 1,297.8 460.8 427 108%
Business Partners Program 54.1 85.8 31.6 80 40%
Loan Fund and Financing 49.6 87.9 38.2 N/A N/A
New Construction Program
New York Energy $martsM 223.2b 329.8 141.6 210.0 67%
EEPS Fast Track 0.0 0 0 278.9 0%
Flex Tech Technical Assistance
New York Energy $martSM 644.1 855.7 211.6 400 53%
EEPS Fast Track 0.0 0 0 267.1 .0%
Industry and Process Efficiency 0.0 0 0 840.0 <1%
(EEPS)
Overlap Removed2 126.7 202.0 75.3 N/A N/A
Statewide Cl! Total 1,646.3 2,454.9 808.7 N/A N/A
Note: N/A means not applicable (i.e., a goal has not been set for this program).
a Savings reported previously included projects funded through the Con Edison Power Savings Partners Program. Thesesavings have been removed to more accurately reflect accomplishments.
b These savings were adjusted following an extensive clean-up of the program database, which resulted in a change to theprogram realization rate applied.
1 The original Peak Load Managament Program, now a component of the Existing Facilities Program, had a goal of 55 GWhin Con Edison and has achieved 60% of the goal as of 2nd quarter 2009. ECIPP did not have a goal for permanent reductionin Con Edison territory, thus combining the two programs results in the 5 year goal not being applicable.2 Overlap factors were updated in Ql 2008.
3 SBC Program goals are in effect through December 31, 2011. Saving goals for the EEPS-funded programs are throughDecember 31, 2015.
Summary of C/I Evaluation Results
Table 3-2. C11 Program Cumulative Peak Demand Savings through June 30, 2009 andProgress toward Five-Year SBC Goals (Combined Programs)
Peak Demand Savings (MW)
Savings Achieved through July 1 Five-YearProgress
Program,
2006 GoalToward
Five-YearJune 30,June 30, 2009 through through Goal2006 (Cumulative) June 30, June 30,
(%(Cumulative) 2009 2011cachieved)
Existing Facilities Program175 Oa 255 7 80 7 110 73%
Permanent'. . .
Existing Facilities: Callable 42 1. l a 479.8 58.7 240 24%
Business Partners Program 11.8 21.2 9.4 16 59%
Loan Fund and Financing 14.3 52.0 37.7 N/A N/A
New Construction Program
New York Energy $martsM 41.Ob 81.6 40.6 24.0 1697%
EEPS Fast Track 0.0 0 0 N/A N/A
Flex Tech TA
New York Energy $martsM 120.9 174.9 54.0 80.0 67%
EEPS Fast Track 0.0 0 0 N/A N/A
Flex Tech TA: Callable 10.2 12.5 2.4 N/A N/A
Industry and Process Efficiency0.0 0.0 0.0 N/A N/A
(EEPS)
Overlap Removed2 24.5 46.2 21.7 N/A N/A
Statewide C/I Total 769.9 1,031.4 261.5 N/A N/A
Note: N/A means not applicable (i.e., a goal has not been set for this program).
a Savings reported previously included projects funded through the Con Edison Power Savings Partners Program. Thesesavings have been removed to more accurately reflect accomplishments.
b These savings were adjusted following an extensive clean-up of the program database, which resulted in a change to theprogram realization rate applied.
c Peak Demand savings goals were not identified for EEPS Fast Track and enhanced New York Energy $martsM Programs:the goals listed in the table reflect the original SBC goals.
1 The original Peak Load Management Program, now a component of the Existing Facilities Program, had a goal of 45 MW ofpermanent reduction in Con Edison and has achieved 26% of the goal as of 2nd quarter 2009. ECIPP did not have a goal forpermanent reduction in Con Edison territory, thus combining the two programs results in the 5 year goal not being applicable.2 Overlap factors were updated in Q l 2008.
3-3
Commercial/Industrial Programs
Table 3-3. C11 Program Cumulative Annual Fuel Savings through June 30, 2009(Combined Programs)
Fuel Savings (MMBtu)
Program Savings Achieved through
June 30, 2006 June 30, 2009
Existing Facilities Program 3,252 -76.363
Loan Fund and Financing 137,239 598,666
Flex Tech Technical Assistance'
New York Energy $marts"1
EEPS Fast Track
3,164,000
0
3,394,133
0
Industry and Process Efficiency (EEPS) 0 0
Overlap Removed 158,200 169,707
Statewide C/I Total 3,146,291 3,755,515
Note: There were no five-year goals for fuel savings.
1 The methodology to assess impacts focuses on developing samples based on electricity savings, rather than fuel, resulting in aless than optimal sample for fuel-savings projects and fluctuation over time in the calculated impacts. Also, the programrecommends on-site generation, which would result in an increase in fuel use, offsetting fuel reductions achieved.
3.3 Existing Facilities Program (EFP)
The Existing Facilities Program (EFP) promotes energy efficiency and demand management. This newprogram is a consolidation of two precursor NYSERDA programs -- the Peak Load Management Program(PLMP) and the Enhanced Commercial and Industrial Performance Program" (ECIPP). Building uponthe success of these two programs, the July 1, 2008 merger provides a less complicated, more accessibleprogram presentation to potential customers in the marketplace. EFP targets sectors of customers thatinclude commercial and industrial businesses, healthcare facilities, universities and colleges, State andlocal governments, and mission critical facilities such as data centers and communications facilities.
The EFP offers incentives for a variety of energy projects, which include: Pre-Qualified measures,
Performance-based Energy Efficiency measures, Demand Response-Load Management, Interval Meters,
and Combined Heat and Power.
22 The Enhanced Commercial/Indust.ial Performance Program combined two early programs - Commercial/IndustrialPerformance and Smart Equipment Choices.
3-4
Existing Facilities Program (EFP)
3.3.1 Progress Toward Goals
With EFP being the product of merging the PLMP and ECIPP programs, continued tracking of theoriginal individual program goals is no longer possible.2' NYSERDA, however does track programoutputs that somewhat parallel the former goal activities: a count of EFP customer projects and theleveraged funds for the entire program are listed in Table 3-4.
Table 3-4. Existing Facilities Program - Program Outputs
Output Value
Customer projects 6,925
Leveraged Funds ($ million) $602 million
3.3.2 Energy, Peak Demand and Fuel Savings
Cumulative annual savings for EFP, as a single program, are a combination of the savings achieved underPLMP and ECIPP.24 Results from projects with signed contracts prior to July 1, 2008 will be reflectedunder the earlier separate programs. Thus, Table 3-5 lists cumulative annual peak demand and electricitysavings from ECIPP plus the PLMP components: the Dispatchable and Emergency Generator Initiative(DEGI), Load Curtailment/Shifting (LC/S), Interval Meters (IM), Permanent Demand Reduction Efforts(PDRE), and the discontinued Cooling Recommissioning element. Realization rates and net-to-grossratios are applied to adjust the program reported savings based on the most recent Measurement andVerification (M&V) and Attribution evaluation studies. As those studies were performed on thecomponent programs and not the EFP as a whole, the realization rates and net-to-gross ratios are notdisplayed. Net savings in the rightmost column are the total savings being claimed by the program afterthese evaluation activities.
23 the goals for PLMP (750 customers receiving assistance) and ECIPP (3,300-3,500 customer projects) are similar, theyare not the same metric; consequently the goals cannot be merged. As for the ECIPP leveraged funds goal ($400-$450 million),again the data merge does not permit continued tracking of this information.
24The Enhanced Commercial/Industrial Performance Program combined two former programs - Commercial/IndustrialPerformance and Smart Equipment Choices.
3-5
Commercial/Industrial Programs
Table 3-5. EFP Cumulative Annual Energy and Peak Demand Savings (through June 30,2009)
Program,ReportedSavings
Realiza-tion Rate
AdjustedGross
Savings
Freerider-ship
SpilloverNet-to-GrossRatio
NetSavings
Existing Facilities Program (EFP) - Total
MWh/year 1,301,320 N/A 1,299,664 N/A N/A N/A 1,297,782
MW On-Peak 310.2 N/A 257.6 N/A N/A N/A 256.1
MW - curtailable 536.2 N/A 467.5 N/A N/A N/A 479.8
MMBtu/year -66,843 N/A -122,840 N/A N/A N/A -76,363
N/A - Not Applicable
3.4 New York Energy $martsM Business Partners
3.4.1 Progress Toward Goals
Table 3-6 shows the Business Partners Program goal to sign up 1,500 partners over five years. Althoughalmost 800 allies are currently participating in the commercial lighting program element, a total of 112new partners have signed up since July 1, 2006. Program staff expects an increase in allies as the coreservices and program elements continue to ramp up.
Table 3-6. New York Energy $mart" Business Partners Program - Goal andAchievement
Program Goals Achieved July 1, 2006Activity (July 1, 2006 through through June 30, 2009 % of Goal Achieved
June 30, 2011)
Business Partners (signed up) 1,500 175 12%
3.4.2 Energy, Peak Demand and Fuel Savings
Table 3-7 shows the cumulative annual energy and peak demand savings from the Business PartnersProgram. A realization rate and net-to-gross ratio are applied to adjust the program-reported savings,based on the most recent Measurement and Verification and Attribution evaluations. Net savings in therightmost column are the total savings being claimed by the program after these evaluation activities.
New York Energy $martSM Business Partners
Table 3-7. New York Energy $mart" Business Partners Cumulative Annual Energy andPeak Demand Savings (through June 2009)
Program-Realization
Adjusted Net-to-Net
Reported RateGross Freeridership Spillover Gross
,Savings
Savings Savings Ratio
Commercial Lighting
MWh/year 59,524 0.94 55,952 39% 80% 1.10 61,548
MW On- 15.4 1.0 15.4 39% 80% 1.10 16.9
Peak
Premium-Efficiency Motors2
MWh/year 9,885 1.0 9,885 67% 168% 0.88 8,776
MW On- 1.9 1.0 1.9 67% 113% 0.70 1.3
Peak
Commercial HVAC3
MWh/ 6,767 Not 6,767 Not Not N/A 6,767
Evaluated Evaluated Evaluatedyear
MW On- 2.0 Not 2.0 Not Not N/A 2.0
Peak Evaluated Evaluated Evaluated
Hospitality Lighting
MWh/ 8,660 Not 8,660 Not Not Not 8,660
year Evaluated Evaluated Evaluated Evaluated
MW On- 0.9 Not 0.9 Not Not Not 0.9
Peak Evaluated Evaluated Evaluated Evaluated
Total Business Partners
MWh/ 84,836 N/A 81,264 N/A N/A N/A 85,751
year
MW On- 20.2 N/A 20.2 N/A N/A N/A 21.2
Peak
Net-to-Gross Ratio = (1-Freeridership) * (1+Spillover).
2 Savings from the prior motor incentive program have been held constant. Savings achieved in 2006 from the new motormanagement program and the STAC 100 Motors program, in the amount of 296,202 kWh and 48 kW, have been added in theNet Savings column.
i Savings for the Commercial HVAC portion of the program have been reduced as of 4`h Quarter 2006. This approach wastaken due to the known short-term nature of savings from advanced diagnostics and commissioning, which were part of theprogram.
N/A - Not Applicable
Commercial/Industrial Programs
3.5 New York Energy $martsM Loan Fund and Financing Program
3.5.1 Progress Toward Goals
Three longer-term non-energy goals have been set for the Loan Fund and Financing Program. These five-year goals and progress are shown in Table 3-8. The Loan Fund has already far surpassed its five-yeargoals for participating lenders and total loan amount. The Program is more than half way towardachieving its goal for the number of customers receiving assistance.
Table 3-8. New York Energy $martsM Loan Fund and Financing Program - Goals andAchievements for Commercial/Industrial Projects
Program Goals
Activity(July 1, 2006 Achieved July 1, 2006
% of Goal Achievedthrough June 30, through June 30, 2009
2011)
Customers receiving assistance (closed500 292 58%
commercial/industrial loans)'
Participating lenders (signed participation75 151 >100%
agreements)
Leveraged loan amount (for closedcommercial/industrial loans)'
$60 million $106 million >100%
'Starting in the second quarter of 2009, closed loans only represents loans with certificates of completion. Previously, all loansregardless of submittal of a certificate were counted as complete.
3.5.2 Energy, Peak Demand and Fuel Savings
Table 3-9 shows the cumulative annual energy and peak demand savings from the Loan Fund and
Financing Program. A realization rate and net-to-gross ratio are applied to adjust the program reported
savings based on the most recent Measurement and Verification and Attribution evaluation studies. Net
savings in the rightmost column are the total savings being claimed by the program after these evaluation
activities.
Energy Smart Focus Program
Table 3-9. Loan Fund Cumulative Annual Energy and Peak Demand Savings (throughJune 2009)'
Program-Realiza-
Adjusted Freerider- Net-to-Gross NetReported tion Rate
Grossship
SpilloverRatio2 Savings
Savings Savings
MWh/year 112,938 0.81 a 94,482 27% 20% 0.93 87,868
MW On-Peak 34.6 1.73a 55.9 27% 20% 0.93 52.0
MMBtu 404,860 1.59 643,727 27% 20% 0.93 598,666
1 Starting in the second quarter of 2009, savings represent only those projects with certificates of completion. Previously, allloans savings regardless of submittal of a certificate were counted as complete.
2 Net-to-Gross Ratio = 1-Freeridership+Spillover.aThe realization rates calculated only apply to the custom measure kWh and kW savings. Savings arising from pre-qualifiedmeasures have a realization rate of 1.0.
3.6 Energy Smart Focus Program
3.6.1 Progress Toward Goals
Table 3-10 shows the Energy Smart Focus Program five-year goal for participants receiving assistance. Anumber of programmatic and procedural issues have delayed program ramp-up, and thus the participationlevel to date is less than initially anticipated.
Table 3-10. Energy Smart Focus Program - Goal and Achievement
Program Goals Achieved July 1, 2006 % of GoalActivity (July 1, 2006 through through June 30, 2009 Achieved
June 30, 2011)
Participants Receiving Assistance' 21,000 1,930 9%
Focus Sector Partnerships N/A 340 N/A
'This metric is new and was not part of the original SBC3 Operating Plan goals.2 This metric does not include updates from the Local Government, Colleges and Universities, and the Hospital sectors as thesesectors are ramping up.
N/A - Not Applicable
3-9

Commercial/Industrial Programs
3.6.2 Energy, Peak Demand and Fuel Savings
Energy Smart Focus is primarily a sector-based energy information and services program. Servicesprovided vary by sector, but ultimately many customers served by Energy Smart Focus will elect toparticipate in other New York Energy $marts"' programs. Energy and demand savings that may beattributable to the Focus Program are tracked and reported under the other New York Energy $martsntprograms.
3.6.3 Sector Highlights
As a sector-based energy information and services program, many aspects of the Focus Program cannotbe quantified and are presented as sector highlights. Sector highlights indicate success in penetratingmarkets and influencing the energy efficiency of individual sectors. As the Focus Program matures andthe sector activities evolve, sector highlights will be revised to show progress and milestones.
Focus on Colleges and Universities
• Developed a two-tiered Top 40 list focusing on largest institutions and those most active insustainability efforts.
• Held 11 one-on-one campus meetings. Follow up visits have been requested by customers tofurther discuss participation in NYSERDA programs. There are six upcoming campus visitsscheduled.
• Twenty-five private campuses and 64 SUNY campuses have been contacted via phone/e-mail.• There have been four presentations made to Colleges & Universities organizations and their
members.• Three leads/meetings have been passed along to the Focus on Hospitality (commercial kitchens)
sector.
• There have been a total of four projects brought into NYSERDA incentives programs; oneTechnical Assistance project and three Existing Facilities projects.
• The Focus on Colleges & Universities website has had 2,294 views by 1,667 unique visitors.
Focus on Commercial Real Estate (CRE)
• Met with the Urban Land Institute regarding the financial case for energy efficiency investment inlight of the current economic climate for commercial real estate.
• A Presentation was made at Green Buildings NY regarding energy efficient leasing and theavailability of the Energy Efficient Lease Guidance document to assist tenants and owners innegotiating leases that encourage investment in energy efficiency.
• Continue to give ongoing support to the New York City Mayor's Office of Long Term Planningand Economic Development Corporation in facilitating proposed legislation in support ofbenchmarking buildings over 50,000 square feet and requiring energy audits and lighting retrofits.
• Has launched plans to conduct direct outreach to large portfolio owners and to older buildingswhere small tenants predominate as prime targets through influential Business ImprovementDistricts (BID) organizations.
Focus on Healthcare
The Focus on Healthcare agreement with Luthin Associates, Inc (Luthin) was fully executed in Decemberof 2008. The following items represent a sampling of work completed to date:
3-10

Energy Smart Focus Program
• Luthin has developed a list of the 127 largest (by number of beds) healthcare facilities in the state.The facilities were divided between upstate and downstate, as well as were compared to the NYSDOH Certificate of Need files to help prioritize outreach efforts.
• Luthin has met with or had significant conference calls with 22 organizations from the TopHospitals List representing 12,321 beds. To date, Luthin has penetrated 41% of the beds (21% ofthe facilities) in the targeted hospital outreach list. Of these organizations, 16 have one or morepending projects.
• During this quarter NYSERDA received applications for four major projects.
• Luthin held a kick-off meeting of the Healthcare Advisory Board on June 24, 2009.
• Luthin presented NYSERDA's program at three unique New York State healthcare organizationevents.
• The program is continuing its focus on conducting one-on-one customer visits in the next quarterand execution of the projects discussed in this past quarter.
Focus on Industry
• Focus on Industry developed a list of 33 customers in the Capital District to target for outreachand initiated contact with those customers.
• Worked directly with customers to encourage them to apply to NYSERDA programs (NCP andEFP).
• Provided outreach to the National Institute of Standards and Technology (NIST) ManufacturingExtension Program (MEP) Centers, Technology Development Centers and Local DevelopmentCenters to promote NYSERDA's Industrial programs.
• Presented NYSERDA's industrial programs to Supply Channel partners and;
• Provided updates to calendar of events for speaking, attending, or having a booth.
Focus on Institutions
K-12 SCI 1001 _'
• Submitted a posting of information to the NYSERDA website directing design professionals tothe NY-Collaborative for High Performance Schools (CHPS) implementation tools andpresentations.
• Developed the first draft of the NY-CHPS Specification Language for the Project Specificationsbooks.
• Developed a cross-walk showing how NY-CHPS 1.1 can be used to supplement the New YorkState Education Departments (NYSED)-required 2010 Building Condition Survey.
• Developed a draft of the NY-CHPS 1.2 including updates to the wording and inclusion of the new
NY-CHPS Verified Application Template.
• Completed a first draft of the NY-CHPS 2.0 for review by NYSERDA in early July. The NY-
CHPS 2.0 integrates new Existing Buildings Guidelines along with the Guidelines for new
buildings additions and major renovations.
• Facilitated 42 US EPA ENERGY STAR Building Labels since April 1, 2009. Twenty of the 42
buildings are first time applicants for the label.
• Facilitated two US EPA ENERGY STAR Leader Awards since April 1, 2009.
• Benchmarked 91 schools in 21 districts this quarter.
• Finalized the upgrade to the much-in-demand Plug-Load Estimator Tool.
Commercial/Industrial Programs
• Coordinated training efforts with the State University of New York (SUNY) and the Division ofMilitary and Naval Affairs (DMNA) for two Board of Certification (BOC) courses to includepersonnel from both organizations.
• Worked with NYS DOT officials to analyze present energy usage data and also to locate missingor abnormal data in an effort to benchmark their facilities, in preparation of upcoming AmericanRecovery and Investment Act (ARRA) funding opportunities.
• Worked with SUNY officials and completed the clarification and resolution of anomalous datafor their ten year reports.
Focus on Local Governments (LG)
Have held meetings on:
• June 10`h for the Infrastructure Alliance (Focus on LG made a presentation), and for the NYSDEC Infrastructure Alliance.
• June 30`h, Kickoff meeting held with Red Oak and NYSERDA, where approval of the work planwas received.
Point of Contact (POC) training dates set:
• July 20-22, Training of POCs, NYSERDA: Representatives from the DEC Office of ClimateChange and the International Council for Local Environmental Initiatives (ICLEI) will providetraining.
• Local Government Alliance membership: An invitation was extended to current members of theWater and Wastewater Infrastructure Alliance, as well as 17 additional organizations/individualsto join the LG Alliance. A meeting to convene this new group will be held later this year.
Focus on Municipal Water and Wastewater Facilities
I1"kRIV"^:E it'-HIPS
• Focus on Municipal Water and Wastewater Facilities (Focus W/WW) is developing the energyefficiency language to be included in the 2009 update to the Design Standards for WastewaterTreatment Works for NYSERDA and NYS Department of Environmental Conservation (DEC).Focus W/WW has also leveraged its relationships with the NYS DEC and the NYS Departmentof Health (DOH) to ensure that all new water and wastewater operators in the state are trained inthe benefits of energy efficiency and are introduced to NYSERDA's programs.
ItM "1"IAIl'
• Focus W/WW is developing a "Best Practices Handbook" to assist the sector with understanding,identifying, and implementing energy efficiency improvements.
• NYSERDA's "Basic Operator Training" presentation was incorporated into the NYS DEC BasicOperator Certification Program curriculum as well as in the NYS DOH Water Operator ModelCurriculum this quarter. NYSERDA's "Basic Training" course was presented at the U.S.Environmental Protection Agency (EPA) National Operator Trainer's Conference by arepresentative from the NYS DEC. This national exposure generated interest in the programfrom officials in Illinois, Ohio, and Montana. Additionally, the West Virginia EnvironmentalTraining Center is interested in creating a "Basic Training" workshop based on NYSERDA'smodel.
3-12
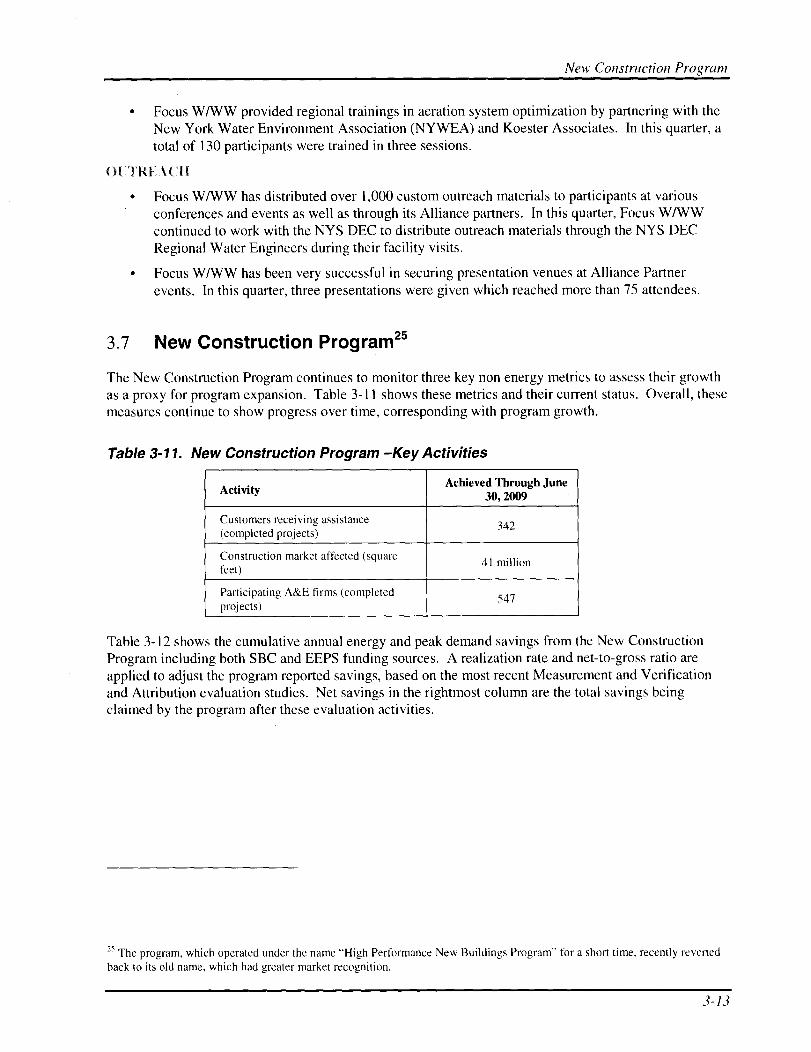
New Construction Program
• Focus W/WW provided regional trainings in aeration system optimization by partnering with theNew York Water Environment Association (NYWEA) and Koester Associates. In this quarter, atotal of 130 participants were trained in three sessions.
0(1
• Focus W/WW has distributed over 1,000 custom outreach materials to participants at variousconferences and events as well as through its Alliance partners. In this quarter, Focus W/WWcontinued to work with the NYS DEC to distribute outreach materials through the NYS DECRegional Water Engineers during their facility visits.
• Focus W/WW has been very successful in securing presentation venues at Alliance Partnerevents. In this quarter, three presentations were given which reached more than 75 attendees.
3.7 New Construction Program25
The New Construction Program continues to monitor three key non energy metrics to assess their growthas a proxy for program expansion. Table 3-11 shows these metrics and their current status. Overall, thesemeasures continue to show progress over time, corresponding with program growth.
Table 3-11. New Construction Program -Key Activities
ActivityAchieved Through June
30, 2009
Customers receiving assistance342
(completed projects)
Construction market affected (square41 million
feet)
Participating A&E firms (completed547
projects)
Table 3-12 shows the cumulative annual energy and peak demand savings from the New ConstructionProgram including both SBC and EEPS funding sources. A realization rate and net-to-gross ratio areapplied to adjust the program reported savings, based on the most recent Measurement and Verificationand Attribution evaluation studies. Net savings in the rightmost column are the total savings beingclaimed by the program after these evaluation activities.
25 The program, which operated under the name "High Performance New Buildings Program" for a short time, recently revertedhack to its old name, which had greater market recognition.
3-13
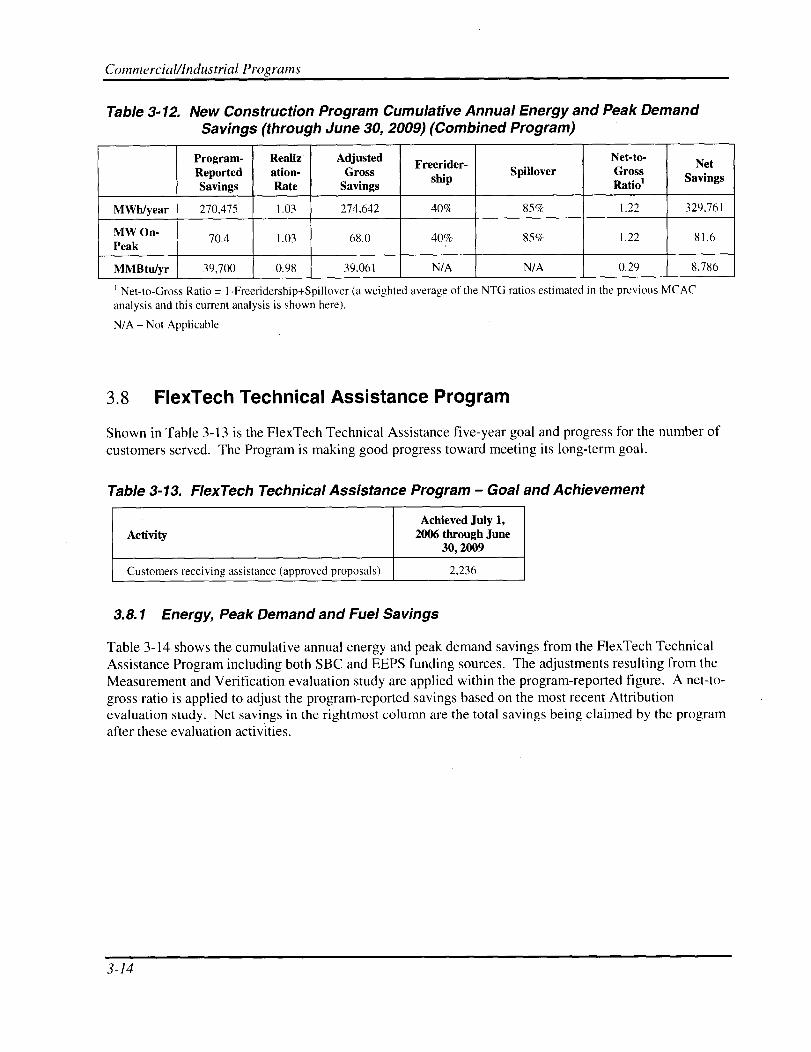
Commercial/industrial Programs
Table 3-12. New Construction Program Cumulative Annual Energy and Peak DemandSavings (through June 30, 2009) (Combined Program)
Program- Realiz AdjustedFreerider-
Net-to-Net
Reported ation- Gross shipSpillover Gross
'Savings
Savings Rate Savings Ratio
MWh/year 270,475 1.03 274,642 40% 85% 1.22 329,761
MW On-70.4 1.03 68.0 40% 85% 1.22 81.6
Peak
MMBtu/yr 39,700 0.98 39,061 N/A N/A 0.29 8,786
1 Net-to-Gross Ratio = 1-Freeridership+Spillover (a weighted average of the NTG ratios estimated in the previous MCACanalysis and this current analysis is shown here).
N/A - Not Applicable
3.8 FlexTech Technical Assistance Program
Shown in Table 3-13 is the FlexTech Technical Assistance five-year goal and progress for the number ofcustomers served. The Program is making good progress toward meeting its long-term goal.
Table 3-13. FlexTech Technical Assistance Program - Goal and Achievement
Achieved July 1,Activity 2006 through June
30, 2009
Customers receiving assistance (approved proposals) 2,236
3.8.1 Energy, Peak Demand and Fuel Savings
Table 3-14 shows the cumulative annual energy and peak demand savings from the FlexTech TechnicalAssistance Program including both SBC and EEPS funding sources. The adjustments resulting from theMeasurement and Verification evaluation study are applied within the program-reported figure. A net-to-gross ratio is applied to adjust the program-reported savings based on the most recent Attributionevaluation study. Net savings in the rightmost column are the total savings being claimed by the program
after these evaluation activities.
3-14
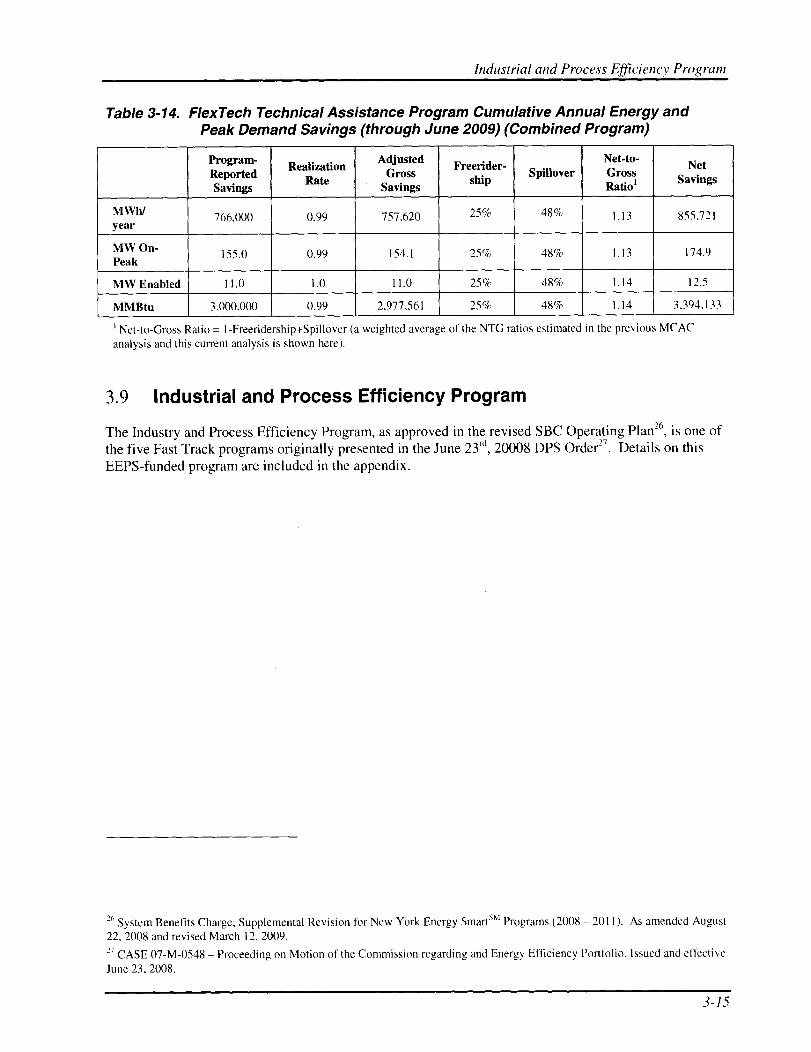
Industrial and Process Efficiency Program
Table 3-14. FlexTech Technical Assistance Program Cumulative Annual Energy andPeak Demand Savings (through June 2009) (Combined Program)
Program- RealizationAdjusted
Freerider-Net-to- Net
ReportedRate
Grossship
Spillover Gross SavingsSavings Savings Ratio
MWh/766,000 0.99 757,620 25% 48% 1.13 855,721
year
MW On-155.0 0.99 154.1 25% 48% 1.13 174.9
Peak
MW Enabled 11.0 1.0 11.0 25% 48% 1.14 12.5
MMBtu 3,000,000 0.99 2,977,561 25% 48% 1.14 3,394,133
1 Net-to-Gross Ratio = I -Freeridership+Spillover (a weighted average of the NTG ratios estimated in the previous MCACanalysis and this current analysis is shown here).
3.9 Industrial and Process Efficiency Program
The Industry and Process Efficiency Program, as approved in the revised SBC Operating Plan', is one ofthe five Fast Track programs originally presented in the June 23`d, 20008 DPS Order27. Details on thisEEPS-funded program are included in the appendix.
'(' System Benefits Charge, Supplemental Revision for New York Energy $mart'M Programs (2008 - 2011). As amended August22, 2008 and revised March 12, 2009.27 CASE 07-M-0548 - Proceeding on Motion of the Commission regarding and Energy Efficiency Portfolio. Issued and effective
June 23, 2008.
3-15
4Residential and Low-Income Programs
4.1 Residential and Low-Income Evaluation Activities
4.1.1 Completed Evaluation Activities
During the first quarter of 2009, the following evaluation projects were completed by NYSERDA'sindependent evaluation contractor teams on the Residential and Low-Income programs:
• A random digit dial (RDD) survey conducted in New York State, New York City and threecomparison areas as part of the new Energy Efficiency Portfolio Standard (EEPS) CompactFluorescent Lamp (CFL) Expansion Program.
4.1.2 Evaluation Activities in Progress and Planned
In the coming quarters, NYSERDA expects to complete the following evaluation projects:
A residential saturation study conducted in New York State, New York City and three comparisonareas as part of the CFL Expansion Program evaluation. Findings from this study, as well as theRDD study, will be incorporated into an overarching evaluation of the CFL Expansion Program.Data will also be collected in this study for home electronics products to support a New YorkEnergy $marts"' Products evaluation.
4.2 Summary of Residential and Low-Income Evaluation Results
4.2.1 Progress Toward Non-Energy Goals
Across the Residential and Low-Income programs, 25 additional logic-model driven goals were set forother key metrics besides energy savings, such as the number of customers receiving assistance, fundsleveraged, allies participating, and outreach activities completed. The programs are making progresstoward achieving these goals. Specifically, thirty-six months into the five-year measurement period:
• Eleven of the 25 goals have been surpassed
Another five of the 25 goals have reached 50% or greater progress
Residential and Low-Income Programs
Progress on the remaining nine goals has not yet reached 50%
4.2.2 Energy, Peak Demand, and Fuel Savings
Table 4-1 shows Residential and Low-Income program electric savings through June 30, 2009 andprogress toward goals. Table 4-2 and Table 4-3 shows peak demand reductions and fuel savings,respectively.
Table 4-1. Residential and Low-Income Program Cumulative Annual Electricity Savingsthrough June 30, 2009 and Progress toward Goals (Combined Program)
Energy Savings (GWh)
Savings Achieved July 1, 2006 ProgressProgram through through 3 Toward Goal
June 30, June 30,, June 30,Goal (% achieved)
2006a 2009 2009
Single Family Home Performance 13.5 22.2 8.7 26.1 33%%
Program: Existing Homes'
Single Family Home Performance 7.3 22.2 14.9 8.9 167%
Program: New Homes
Multifamily Performance Program: 31.0 68.5 37.5 225.5 17%
Existing Buildings2
Multifamily Performance Program: 0 0.1 0.1 24 0%
New Buildings
Market Support Program 539.1a 657.6b 118.6 200 59%
CFL Expansion Program (EEPS) 0.0 0.0 0.0 1,083 0%
EmPower New York
NYE$ SBC 20.1 48.9 28.9 51.1 56`70
EEPS Fast Track 0.0 0.8 0.8 29.4 3%1
Statewide Residential & Low- 610.9 820.4 209.5 N/A N/AIncome Total
a This baseline savings figure does not match the 2nd quarter 2006 published value. The impacts for Energy Star Products arederived annually from market data, and the 2"" quarter savings value was estimated retrospectively to provide a more accuratebaseline for measuring progress.
b. Savings for the New York Energy $marts"' Products Program are estimated based on market data, survey research, anddeemed savings values. Savings for this program were last fully captured in 2006. An update, completed and applied inQuarter 1 2009, added electricity, demand, and fuel savings for 2007 appliances only. Once necessary market-level data areavailable, appliance savings for 2008, as well as lighting savings for 2007 and 2008 will be analyzed and applied.
1 Savings for the low-income Assisted Home Performance Program (6.5 GWh) are included in this row.
2 Savings for the low-income Assisted Multifamily Program (45.3 GWh) are included in this row, the remainder are savingsfrom the closed Residential Comprehensive Energy and Direct Install programs.
3 New York Energy $martsM Program goals are in effect through December 31, 201 1 . Saving goals for the EEPS-fundedprograms are through December 31, 2015.
N/A - Not Applicable
4-2
Summary of Residential and Low-Income Evaluation Results
Table 4-2. Residential and Low-Income Program Cumulative Peak Demand Savingsthrough June 30, 2009
Demand Savings (MW)
Program Savings Achieved through
June 30, 2006 June 30, 2009a
Single Family Home Performance Program: Existing Homes'2.0 2.8
Single Family Home Performance Program: New Homes0.9 7.5
Multifamily Performance Program: Existing Buildings`3.9 9.1
Multifamily Performance Program: New Buildings0.0 0.0
Market Support Program 104.3 136.1 b
CFL Expansion (EEPS) 0.0 0.0
EmPower New York
NYE$TM SBC
EEPS Fast Track
2.5
0.0
8.0
0.1
Statewide Residential & Low-Income Total 113.7 163.6
Note: No goals were set for peak demand savings.
a. Peak Demand savings goals were not identified for EEPS Fast Track and enhanced New York Energy $martsx' Programs
b Savings for the New York Energy $marts' Products Program are estimated based on market data, survey research, anddeemed savings values. Savings for this program were last fully captured in 2006. An update, completed and applied inQuarter 1 2009, added electricity, demand, and fuel savings for 2007 appliances only. Once necessary market-level data areavailable, appliance savings for 2008, as well as lighting savings for 2007 and 2008 will be analyzed and applied.
1 Includes 0.8 MW from the low-income Assisted Home Performance Program.
2 Savings for the low-income Assisted Multifamily Program are included in this row. They represent 6.1 MW of these savings.
Residential and Low-Income Programs
Table 4-3. Residential and Low-Income Program Cumulative Annual Fuel Savingsthrough June 30, 2009 and Progress toward Goals
Fuel Savings (MMBtu)
Savings Achieved through Five- ProgressJuly 1, 2006 Year Toward Five-
Programthrough Goal Year Goal
June 30, June 30, June 30, through (% achieved)2006 2009 2009 June 30,
2011
Single Family Home Performance 454,958a 984,463 529,505 1,199,000 44%
Program: Existing Homes'
Single Family Home Performance 376,103b 744,412 368,310 518.500 71%
Program: New Homes
Multifamily Performance Program: 43,932 448,838 401,906 6,014,500 7%
Existing Buildings'`
Multifamily Performance Program: 0.0 771 771 649,000 0%New Buildings
Market Support Program; 241,998 296,607c 54,609 N/A N/A
EmPower New York4
NYE$"" SBC 38,151 155,427 117,276 108.500 108%
EEPS Fast Track 0 0 0 N/A N/A
Statewide Residential & Low- 1,155,142 2,627,517 1,472,376 N/A N/AIncome Total
1 Energy savings for the low-income Assisted Home Performance Program are included in this row. They represent 337,285MMBtu of these savings.
2 Energy savings for the low-income Assisted Multifamily Program are included in this row. They represent 321,250 MMBtuof these savings.i These values do not match earlier published values as an error in the tracking spreadsheet was found and repaired for thisquarter.
4 The MMBtu savings for Empower is reduced as compared to past quarters as savings had included some non-SBC sources,which are removed in this quarter. This change also impacted the savings through June 30, 2006, so the value shown here willnot match earlier published values.a This value does not match an earlier published value due to changes made to the program tracking database in response toevaluation completed by the M&V contractor.
b This value does not match earlier published values as the realization rate for MMBtu was reassessed during this period to alower level and applied retroactively in order to accurately reflect progress made during the year.
c Savings for the New York Energy $martsM Products Program are estimated based on market data, survey research, anddeemed savings values. Savings for this program were last fully captured in 2006. An update, completed and applied inQuarter 1 2009, added electricity, demand, and fuel savings for 2007 appliances only. Once necessary market-level data areavailable, appliance savings for 2008, as well as lighting savings for 2007 and 2008 will be analyzed and applied.
N/A - Not Applicable
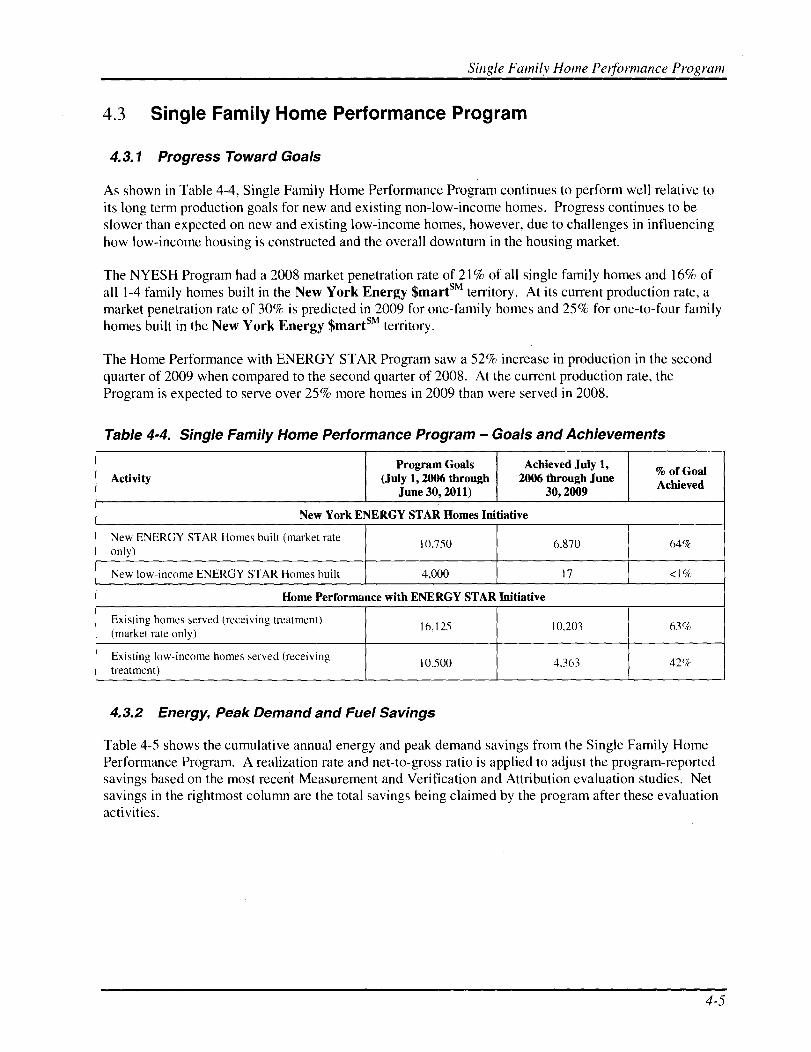
Single Family Home Performance Program
4.3 Single Family Home Performance Program
4.3.1 Progress Toward Goals
As shown in Table 4-4, Single Family Home Performance Program continues to perform well relative toits long term production goals for new and existing non-low-income homes. Progress continues to beslower than expected on new and existing low-income homes, however, due to challenges in influencinghow low-income housing is constructed and the overall downturn in the housing market.
The NYESH Program had a 2008 market penetration rate of 21% of all single family homes and 16% ofall 1-4 family homes built in the New York Energy $martsm territory. At its current production rate, amarket penetration rate of 30% is predicted in 2009 for one-family homes and 25% for one-to-four familyhomes built in the New York Energy $martsM territory.
The Home Performance with ENERGY STAR Program saw a 52% increase in production in the secondquarter of 2009 when compared to the second quarter of 2008. At the current production rate, theProgram is expected to serve over 25% more homes in 2009 than were served in 2008.
Table 4-4. Single Family Home Performance Program - Goals and Achievements
Program Goals Achieved July 1,% of Goal
Activity (July 1, 2006 through 2006 through JuneAchieved
June 30, 2011) 30, 2009
New York ENERGY STAR Homes Initiative
New ENERGY STAR Homes built (market rate10,750 6,870 64%
only)
New low-income ENERGY STAR Homes built 4,000 17 <1%
Home Performance with ENERGY STAR Initiative
Existing homes served (receiving treatment)16,125 10,203 63%
)(market rate only)
Existing low-income homes served (receiving10,500 4,363 42%
treatment)
4.3.2 Energy, Peak Demand and Fuel Savings
Table 4-5 shows the cumulative annual energy and peak demand savings from the Single Family Home
Performance Program. A realization rate and net-to-gross ratio is applied to adjust the program-reportedsavings based on the most recent Measurement and Verification and Attribution evaluation studies. Net
savings in the rightmost column are the total savings being claimed by the program after these evaluation
activities.
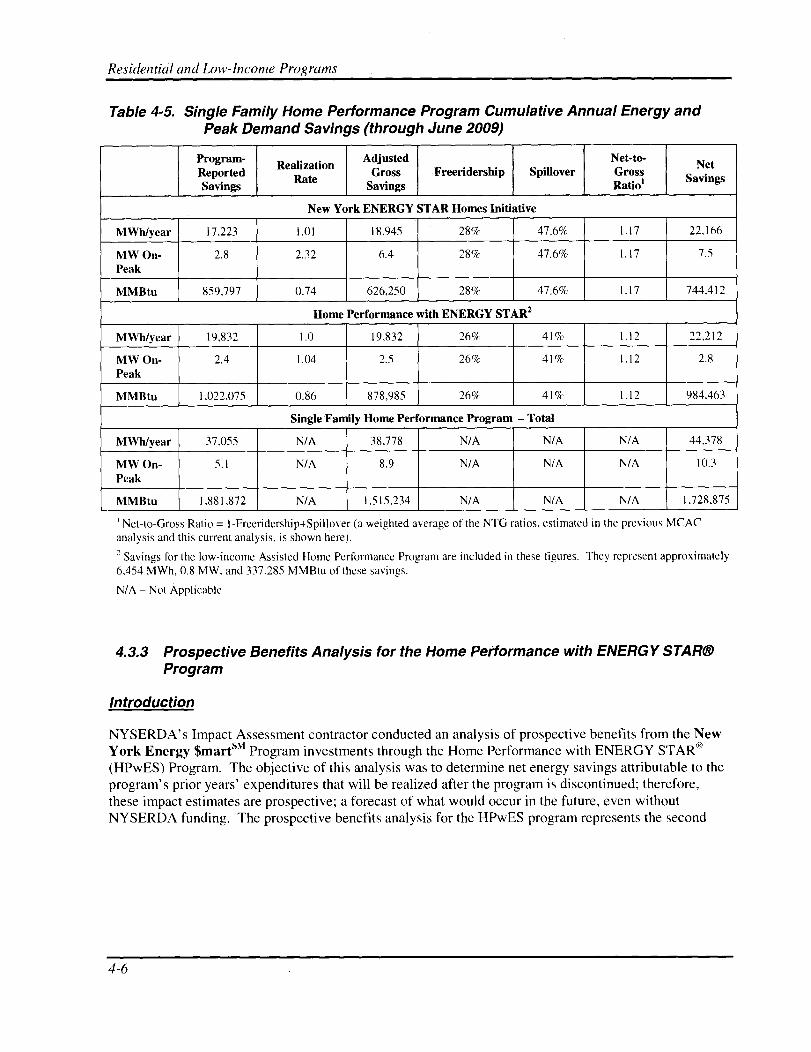
Residential and Low-Income Programs
Table 4-5. Single Family Home Performance Program Cumulative Annual Energy andPeak Demand Savings (through June 2009)
Program-ReportedSavings
RealizationRate
AdjustedGross
SavingsFreeridership Spillover
Net-to-GrossRatio'
NetSavings
New York ENERGY STAR Homes Initiative
MWh/year 17,223 1.01 18,945 28% 47.6% 1.17 22,166
MW On-Peak
2.8 2.32 6.4 28% 47.6% 1.17 7.5
MMBtu 859,797 0.74 626,250 28% 47.6% L 1.17 744,412_
Home Performance with ENERGY STAR2
MWh/year 19,832 1.0 19,832 26% 41% 1.12 22,212
MW On-Peak
2.4 1.04 2.5 26% 41% 1.12 2.8
MMBtu 1,022,075 0.86 878,985 26% 41% 1.12 984,463
Single Family Home Performance Program - Total
MWh/year 37,055 N/A 38,778 N/A N/A N/A 44,378
MW On-Peak
5.1 N/A 8.9 N/A N/A N/A 10.3
MMBtu 1,881,872 N/A 1,515,234 N/A N/A N/A 1,728,875
1 Net-to-Gross Ratio = I -Freeridership+Spill over (a weighted average of the NTG ratios, estimated in the previous MCACanalysis and this current analysis, is shown here).2 Savings for the low-income Assisted Home Performance Program are included in these figures. They represent approximately6,454 MWh, 0.8 MW, and 337,285 MMBtu of these savings.
N/A - Not Applicable
4.3.3 Prospective Benefits Analysis for the Home Performance with ENERGY STAR®Program
Introduction
NYSERDA's Impact Assessment contractor conducted an analysis of prospective benefits from the NewYork Energy $martsM Program investments through the Home Performance with ENERGY STAR"(HPwES) Program. The objective of this analysis was to determine net energy savings attributable to theprogram's prior years' expenditures that will be realized after the program is discontinued; therefore,these impact estimates are prospective; a forecast of what would occur in the future, even withoutNYSERDA funding. The prospective benefits analysis for the HPwES program represents the second
Single Family Home Performance Program
pilot effort by NYSERDA to estimate future program benefits from its New York Energy $marts"tProgram investments. A summary of NYSERDA's prospective benefits analysis for the CommercialNew Construction Program (NCP) was published in the Quarterly Evaluation and Status Report for thequarter ending March 31, 2008. A detailed report of the NCP prospective benefits analysis was publishedby NYSERDA in November 2008.28
The Home Performance with ENERGY STAR® (HPwES) Initiative is designed to enhance the currentmarket capacity for delivering comprehensive energy efficiency services to existing one- to four-familyresidences. The program seeks to create a "one-stop shopping" experience for consumers looking tomake energy efficiency improvements to their homes. This objective is accomplished by requiring theparticipating contractor who performs the comprehensive home assessment to have the capability toprepare a scope of work and install the energy efficiency measures as well as identify any health andsafety issues. The program also fosters consumer protection by offering training, a robust qualityassurance/quality control (QA/QC) process and a one-year warranty29 , and by requiring certification andaccreditation for participating contractors. Customers generate energy savings as efficiencyimprovements are completed.
The HPwES program is also designed to transform the home renovation and improvement market toinclude comprehensive energy efficiency assessments. Measuring potential future benefits from theprogress accomplished to-date is an important component of the evaluation goal of assessing thisprogram's progress in transforming the market.
Prospective energy savings are a forecast of savings to be realized from program-promoted energyefficiency measures and design approaches that are implemented after the program ends and that wouldnot have occurred without the program investments made to date.
Prospective benefits were evaluated for four groups of market actors:
Currently participating contractors
Formerly participating contractors
• Non-participating contractors (whose practices have been influenced by the HPwES program)
Participating homeowners
The prospective benefits forecast chosen for this evaluation is based on telephone surveys that occurred
during the summer of 2008. The forecast is based on the hypothetical situation that the program wasterminated on December 31, 2008. A more likely medium-term hypothetical situation would be toassume that the program will be terminated at the end of SBC III (June 30, 2011), and to estimate the
impacts in the following years. However, the impacts for the 2009-2011 program years are not knownyet, so the uncertainty in the prospective benefits estimates would be greatly increased through the
28 Prospective Benefits Impact Evaluation of the New Construction Program, prepared by Megdal & Associates, Project Number3.15, November 2008
29 The contractor is required by their Partnership Agreement with NYSERDA to warrant the products and services rendered forone year. NYSERDA does not warrant any of the products or services itself.
4-7
Residential and Low-Income Programs
additional uncertainty in the underlying starting point for these estimates. In order to reduce theuncertainties in these estimates, the hypothetical situation that the program ended at the end of 2008 wasused. Then the estimated prospective benefits are the energy and demand savings that would be expectedto occur due to actions taken in 2009 and beyond, given prior program efforts and the state of the marketin 2008.3°
All forecasting has some level of uncertainty. The measurement of near-term prospective benefits is rarein the energy efficiency evaluation field. There have been projects that estimate longer-term futuremarket transformational impacts. Many of these are seen as having significant measurement challenges,often with large uncertainty ranges. Over the long run markets can change significantly. Generally,efficiency programs designed and evaluated as MT programs begun in the U.S. around 2000, relativelyrecently in the 30 years of efficiency programs. Market interventions are still on-going in most of thesemarkets. So there is little actual experience with examining market reactions after programs have beenwithdrawn. There are very few studies that provide insight into the sustainability of market changesproduced by market transformation efforts. This means there is little information that would helpdetermine the extent to which withdrawal of the intervention will, in the long term, cause the market torevert back to the market trends before the intervention. With the NCP prospective benefits analysis andthis effort, NYSERDA has chosen to instead begin by estimating short-term forecasted impacts in orderto systematically address some of the challenges seen in prior work elsewhere. This new impactevaluation effort assesses and estimates near-term prospective benefits of the HPwES program.
Methodology
The prospective benefits analysis is based on an assessment of the percentage of current annualincremental program benefits that can be expected to persist after the program's termination. Thisapproach means that rather than building post-program effects up from an assumption of zero,NYSERDA started with the 2008 incremental net GWh, MW and fuel savings - a reasonable expectationof future annual program energy savings if the program continued - and adjusted these savings byexpected changes in the supply of, and demand for, program-supported measures after the program ends.This adjustment was made through use of Prospective Benefit (PB) Factors that were developed throughsurveys of participating contractors, formerly participating, and non-participating contractors as well asparticipating homeowners. These surveys were conducted jointly with the Market Characterization andAssessment team.
PB Factors take on a value between 0 and I to reflect the percentage of current savings that is expected topersist after the program ends. For example, a PB Factor of 0.7 means that 70% of current annualprogram savings are expected to still be realized after the program ends. PB factors are multiplied by2008 incremental net savings to estimate prospective benefits in the year after program termination.
30 The NYSERDA definition of prospective benefits for this evaluation is significantly constrained from one of forecasting theimpacts of all market transformational (MT) effects into a long-term future given the HPwES cumulative efforts from SBC Ithrough 2008. The current prospective benefits definition was specifically selected by NYSERDA as their first step in estimatingfuture impacts, a definition that could produce the most reliable estimates, conservative for market transformation impacts butestimates expected to be more precise (less uncertainty).
4-8
Single Family Home Performance Program
The evaluation also calculated and used Net of Free-ridership (NFR) Weights for participatinghomeowners. These weights estimate the level of program influence on the respondents' actions.
Since the 2008 estimate of incremental net GWh and MW savings did not include former and non-participant spillover, i.e., savings by formerly participating and non-participating contractors who wereinfluenced by the HPwES program, NYSERDA estimated spillover rates for these two groups ofcontractors through this evaluation project. The spillover analysis with 2007 spillover rates waspublished in the September 2008 Quarterly Report Program Evaluation and Status Report - IssuedNovember 2008 and is briefly summarized in the section `Former Participant and NonparticipantSpillover Savings'. This summary includes an update with 2008 spillover rates based upon the surveyresults being applied to 2008 program estimated savings.
The PB Factors and NFR Weights estimated for this analysis are outlined in the following sections. Afull discussion of these estimates and other aspects of the prospective benefits analysis will be provided inthe forthcoming report Prospective Benefits Impact Evaluation of the Home Performance with ENERGYSTAR® Program.
Prospective Benefit Factors
The analysis uses four different PB Factors for participating contractors and three different factors each
for formerly participating contractors, non-participating contractors, and participating homeowners.
Table 4-6 summarizes these factors. Some of the PB Factors are first calculated for individual measure
groups.' These measure-specific estimates are then averaged for the respondent to obtain that
respondent's PB Factor. The overall PB Factor for each survey respondent is calculated by taking the
average of the respondent's individual factors (e.g., averaging the respondent's PB Factor 1, PB Factor 2,
etc.).
31 Program measures with potential energy savings fall into the following categories: insulation/air sealing, heating, cooling,water heating, windows/doors, lighting, and appliances.
4-9
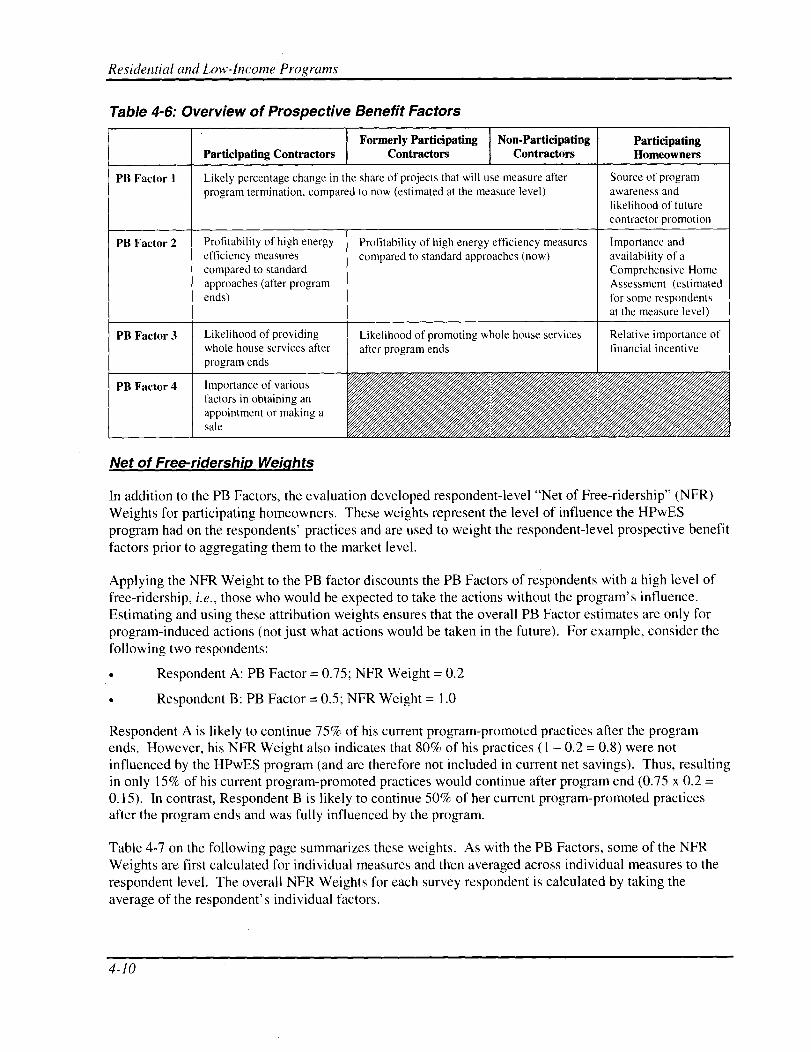
Residential and Low-Income Programs
Table 4-6: Overview of Prospective Benefit Factors
Formerly Participating Non-Participating ParticipatingParticipating Contractors Contractors Contractors Homeowners
PB Factor 1 Likely percentage change in the share of projects that will use measure after Source of programprogram termination, compared to now (estimated at the measure level) awareness and
likelihood of futurecontractor promotion
PB Factor 2 Profitability of high energy Profitability of high energy efficiency measures Importance andefficiency measures compared to standard approaches (now) availability of acompared to standard Comprehensive Homeapproaches (after program Assessment (estimatedends) for some respondents
at the measure level)
PB Factor 3 Likelihood of providing Likelihood of promoting whole house services Relative importance ofwhole house services after after program ends financial incentiveprogram ends
PB Factor 4 Importance of variousfactors in obtaining anappointment or making asale
Net of Free-ridership Weights
In addition to the PB Factors, the evaluation developed respondent-level "Net of Free-ridership" (NFR)Weights for participating homeowners. These weights represent the level of influence the HPwESprogram had on the respondents' practices and are used to weight the respondent-level prospective benefitfactors prior to aggregating them to the market level.
Applying the NFR Weight to the PB factor discounts the PB Factors of respondents with a high level offree-ridership, i.e., those who would be expected to take the actions without the program's influence.Estimating and using these attribution weights ensures that the overall PB Factor estimates are only forprogram-induced actions (not just what actions would be taken in the future). For example, consider thefollowing two respondents:
• Respondent A: PB Factor = 0.75; NFR Weight = 0.2
• Respondent B: PB Factor = 0.5; NFR Weight = 1.0
Respondent A is likely to continue 75% of his current program-promoted practices after the programends. However, his NFR Weight also indicates that 80% of his practices (1 - 0.2 = 0.8) were notinfluenced by the HPwES program (and are therefore not included in current net savings). Thus, resultingin only 15% of his current program-promoted practices would continue after program end (0.75 x 0.2 =0.15). In contrast, Respondent B is likely to continue 50% of her current program-promoted practicesafter the program ends and was fully influenced by the program.
Table 4-7 on the following page summarizes these weights. As with the PB Factors, some of the NFRWeights are first calculated for individual measures and then averaged across individual measures to therespondent level. The overall NFR Weights for each survey respondent is calculated by taking theaverage of the respondent's individual factors.
4-10

Single Family Home Performance Program
Table 4-7. Overview of NFR Weights
Participating Homeowners
NFR Weight 1 Importance of CHA (and incentives) in decision to install energy efficiency measures.(Estimated for some respondents at the measure level.)
NFR Weight 2 Importance of being "green" in decision to install energy efficiency measures.
NFR Weight 3 7rAwareness of energy efficient measures and source of awareness.
Former Participant and Non-Participant Spillover Savin-gs
The 2008 estimate of incremental net GWh and MW savings for the HPwES program did not includeformer and non-participant spillover. As a result, the Megdal & Associates' Impact Assessment Teamdeveloped an estimate of non-participant spillover savings for 2008 for NYSERDA's HPwES program.The estimate was based on the following four measure groups3':
• Insulation/air sealing
• Heating/cooling
• Hot water
• Windows/doors
The non-participant spillover estimate is based on the results of surveys of former participating and non-participating home renovation contractors conducted as part of the 2008 market characterization study ledby Summit Blue. The final number of survey completes available for the spillover analysis included 17 ofthe 38 former participating contractors and 82 interviews with randomly selected non-participatingcontractors. Separate spillover estimates were developed for former participating and non-participating
contractors.
Two screening questions determined a contractor's eligibility to produce spillover savings: contractorswho (1) had not heard about the HPwES program or (2) had low levels of familiarity with the programwere assigned zero spillover savings.33 For the remaining contractors, a series of survey questionsdetermined (1) the change in a contractor's energy efficiency practices over the past few years and (2)NYSERDA's influence on that change, by measure group. Using the results of these questions,NYSERDA was able to attribute some of the savings realized by the installation of high efficiencymeasures at these contractors' projects to the influence of the HPwES program.
32 Survey data was not available to estimate spillover for lighting and appliances. NYSERDA non-HPwES and ENERGY STARHome lighting and appliance savings is estimated through market effects studies. These would overlap with any spillover fromthese programs on lighting and appliances. Developing spillover estimates here would double-count those savings given thedifferences in methodologies used.33 Contractors unaware of the program would not be able to answer the question on the degree of influence of the program ontheir actions. This means that the survey is measuring direct spillover savings. It does not measure other potential programmarket effects, e.g., savings from program-induced changes to the structure of market operations that are not directly seen bycontractors as due to the NYSERDA program.
4-11
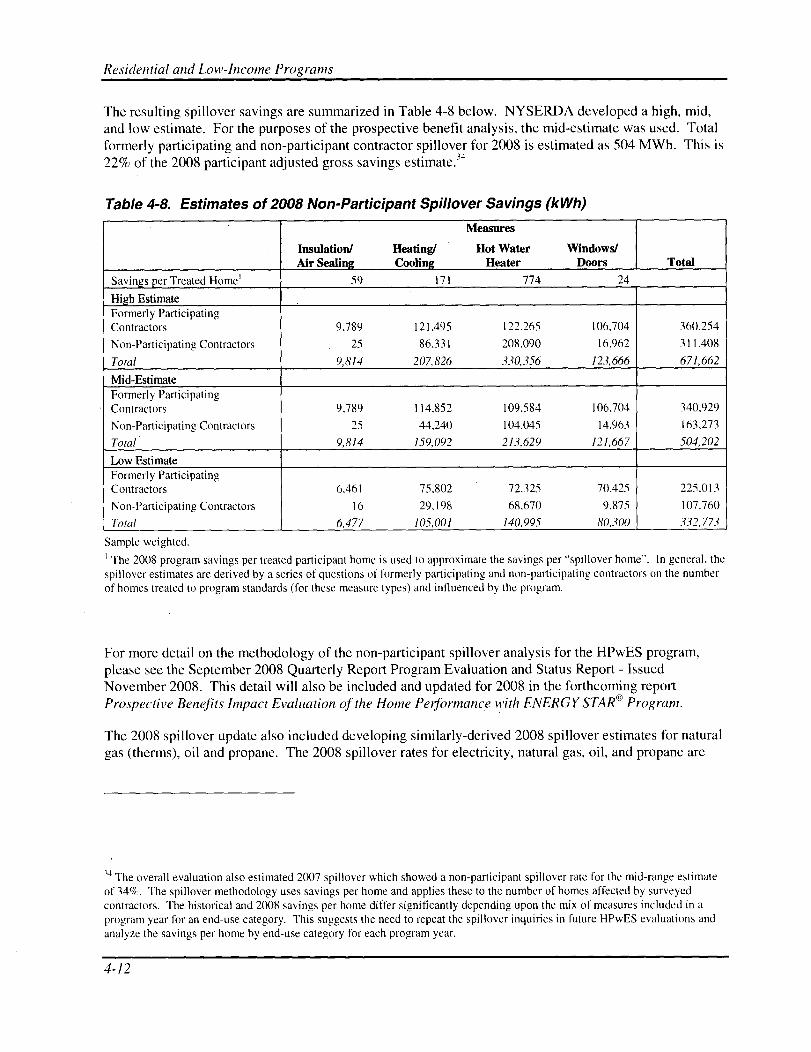
Residential and Low-Income Programs
The resulting spillover savings are summarized in Table 4-8 below. NYSERDA developed a high, mid,and low estimate. For the purposes of the prospective benefit analysis, the mid-estimate was used. Totalformerly participating and non-participant contractor spillover for 2008 is estimated as 504 MWh. This is22% of the 2008 participant adjusted gross savings estimate .14
Table 4-8. Estimates of 2008 Non-Participant Spillover Savings (kWh)
Measures
Insulation/ Heating/ Hot Water Windows/Air Sealing Cooling Heater Doors Total
Savings per Treated Home' 59 171 774 24
High EstimateFormerly ParticipatingContractors 9,789 121,495 122,265 106,704 360,254
Non-Participating Contractors 25 86,331 208,090 16,962 311,408
Total 9,814 207,826 330,356 123,666 671,662
Mid-EstimateFormerly ParticipatingContractors 9,789 114,852 109,584 106,704 340.929
Non-Participating Contractors 25 44,240 104.045 14,963 163,273
Total 9,814 159,092 213,629 121,667 504,202
Low EstimateFormerly ParticipatingContractors 6,461 75,802 72,325 70,425 225,013
Non-Participating Contractors 16 29,198 68,670 9,875 107,760
Total 6,477 105,001 140,995 80,300 332,773
Sample weighted.
1 The 2008 program savings per treated participant home is used to approximate the savings per "spillover home". In general, thespillover estimates are derived by a series of questions of formerly participating and non-participating contractors on the numberof homes treated to program standards (for these measure types) and influenced by the program.
For more detail on the methodology of the non-participant spillover analysis for the HPwES program,please see the September 2008 Quarterly Report Program Evaluation and Status Report - IssuedNovember 2008. This detail will also be included and updated for 2008 in the forthcoming reportProspective Benefits Impact Evaluation of the Home Performance with ENERGY STAR® Program.
The 2008 spillover update also included developing similarly-derived 2008 spillover estimates for naturalgas (therms), oil and propane. The 2008 spillover rates for electricity, natural gas, oil, and propane are
34 The overall evaluation also estimated 2007 spillover which showed a non-participant spillover rate for the mid-range estimateof 34%. The spillover methodology uses savings per home and applies these to the number of homes affected by surveyedcontractors. The historical and 2008 savings per home differ significantly depending upon the mix of measures included in aprogram year for an end-use category. This suggests the need to repeat the spillover inquiries in future HPwES evaluations andanalyze the savings per home by end-use category for each program year.
4-12
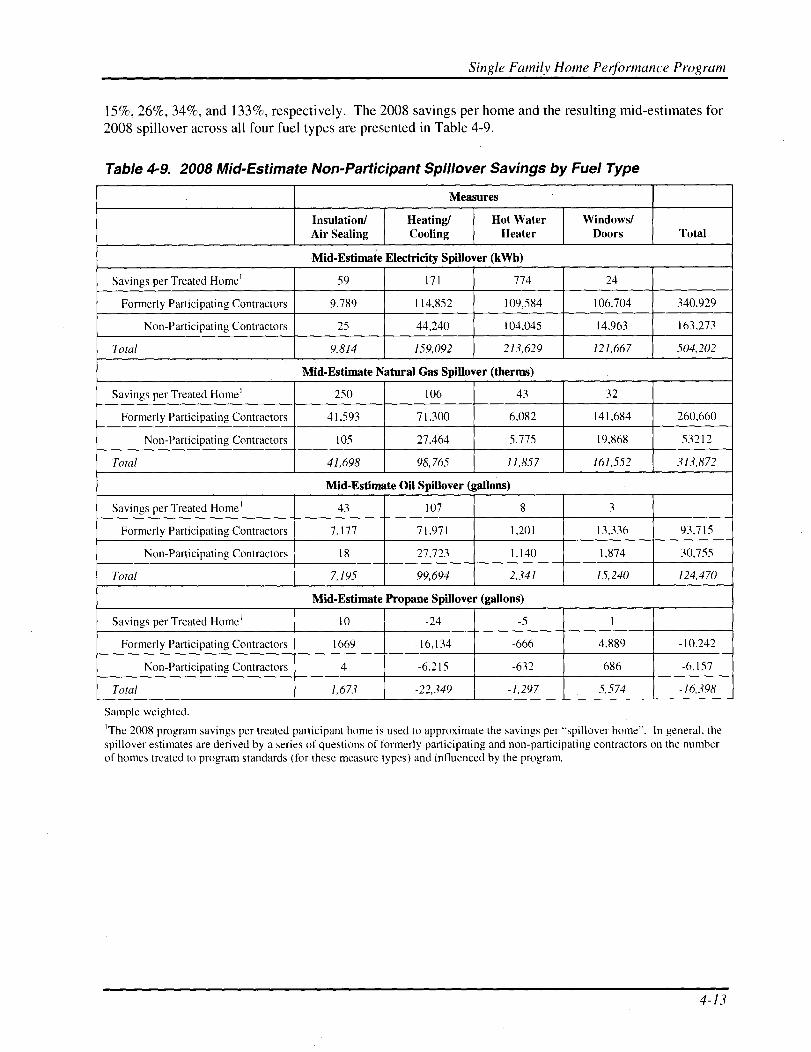
Single Family Home Performance Program
15%, 26%, 34%, and 133%, respectively. The 2008 savings per home and the resulting mid-estimates for2008 spillover across all four fuel types are presented in Table 4-9.
Table 4-9. 2008 Mid-Estimate Non-Participant Spillover Savings by Fuel Type
Measures
Insulation/Air Sealing
Heating/Cooling
Hot WaterHeater
Windows/Doors Total
Mid-Estimate Electricity Spillover (kWh)
Savings per Treated Home' 59 171 774 24
Formerly Participating Contractors 9,789 114,852 109,584 106,704 340,929
Non-Participating Contractors 25 44,240 104,045 14,963 163,273
Total 9,814 159,092 213,629 121,667 504,202
Mid-Estimate Natural Gas Spillover (therms)
Savings per Treated Home' 250 106 43 32
Formerly Participating Contractors 41,593 71,300 6,082 141,684 260,660
Non-Participating Contractors 105 27,464 5,775 19,868 53212
Total 41,698 98,765 11,857 161,552 313,872
Mid-Estimate Oil Spillover (gallons)
Savings per Treated Home' 43 107 8 3
Formerly Participating Contractors 7.177 71,971 1,201 13,336 93,715
Non-Participating Contractors 18 27,723 1,140 1,874 30,755
Total 7,195 99,694 2,341 15,240 124,470
Mid-Estimate Propane Spillover (gallons)
Savings per Treated Home' 10 -24 -5 1
Formerly Participating Contractors 1669 -16,134 -666 4,889 -10,242
Non-Participating Contractors 4 -6,215 -632 686 -6,157
Total 1,673 -22,349 -1,297 5,574 -16,398
Sample weighted.
'The 2008 program savings per treated participant home is used to approximate the savings per "spillover home". In general, thespillover estimates are derived by a series of questions of formerly participating and non-participating contractors on the numberof homes treated to program standards (for these measure types) and influenced by the program.
4-13

Residential and Low-Income Programs
Prospective Benefits Calculation
Prospective benefits for the HPwES program are the sum of participant, former participant, and non-participant prospective benefits (homeowners and contractors for the first and contractors for the lattertwo). Participant prospective benefits are estimated by applying the NFR-weighted PB Factors to 2008program net savings. Former participant and non-participant prospective benefits are estimated bymultiplying the 2008 spillover estimate for these two groups by their estimated PB Factors.
Total PB = Participant Prospective Benefits + Former Participant Prospective Benefits +Non-Participant Prospective Benefits
[2008 Gross Savings * (1 - 2006 FR Rate + 2006 Inside SO Rate + 2006 PartialParticipant SO Rate + 2006 Outside SO Rate) * Participant PB Factor]
+ [2008 Former Participant Spillover Savings * Former Participant PB Factor]
+ [2008 Non-Participant Spillover Savings * Non-Participant PB Factor]
Results
The prospective benefit factors measure the proportion of current year savings expected to be achieved inthe following year due to the program's influence. Based on the analytical approach described above, theImpact Assessment team estimates short-term annual incremental Prospective Benefits for the HPwESprogram to be approximately 2,895 MWh and 0.18 MW, representing 78% of 2008 total incremental netsavings. Table 4-10 presents these results, as well as the 2008 gross savings, the 2006 attributionassumptions, the 2008 spillover estimates, and the Prospective Benefits Factors used to develop theProspective Benefits estimates. The analysis shows that participants are expected to continue their energyefficiency practices at a rate of 66% compared to 93% for program-influenced former participants and73% for program-influenced non-participants.35
35 Prospective benefit results are based on the following sample sizes: 84 participating contractors; 145 participatinghomeowners; 17 former participating contractors; and 82 non-participating contractors.
4-14
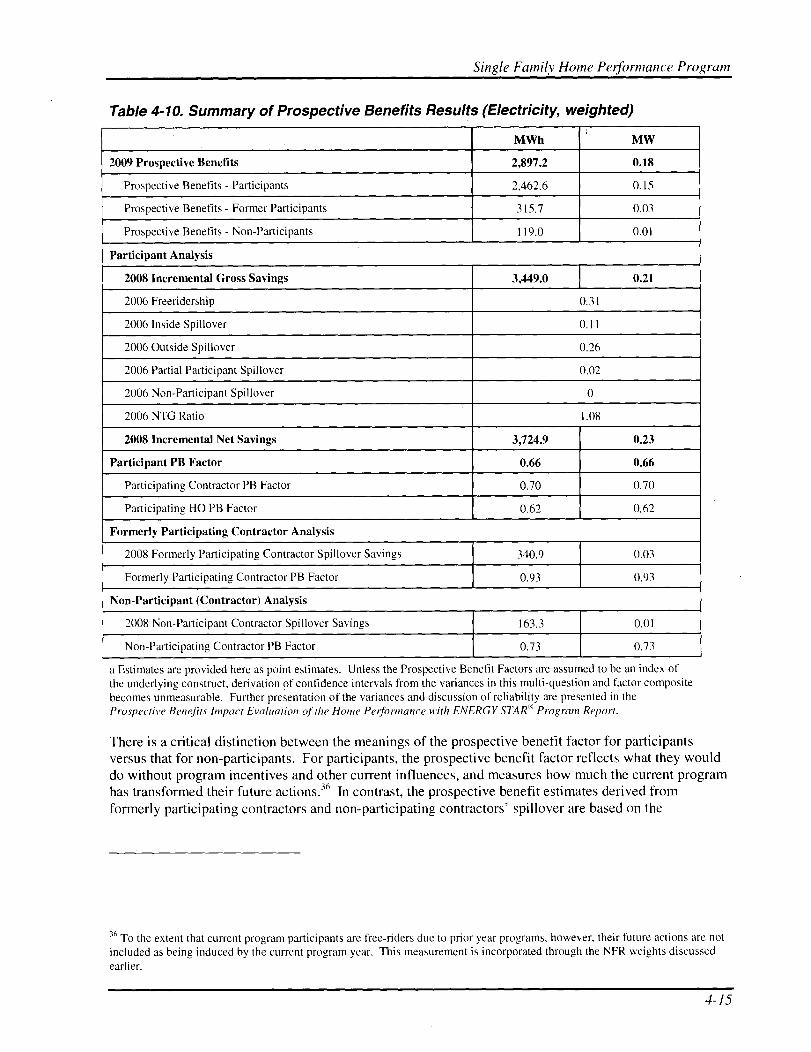
Single Family Home Performance Program
Table 4-10. Summary of Prospective Benefits Results (Electricity, weighted)
MWh MW
2009 Prospective Benefits 2,897.2 0.18
Prospective Benefits - Participants 2,462.6 0.15
Prospective Benefits - Former Participants 315.7 0.03
Prospective Benefits - Non-Participants 119.0 0.01
Participant Analysis
2008 Incremental Gross Savings 3,449.0 0.21
2006 Freeridership 0.31
2006 Inside Spillover 0.11
2006 Outside Spillover 0.26
2006 Partial Participant Spillover 0.02
2006 Non-Participant Spillover 0
2006 NTG Ratio 1.08
2008 Incremental Net Savings 3,724.9 0.23
Participant PB Factor 0.66 0.66
Participating Contractor PB Factor 0.70 0.70
Participating HO PB Factor 0.62 0.62
Formerly Participating Contractor Analysis
2008 Formerly Participating Contractor Spillover Savings 340.9 0.03
Formerly Participating Contractor PB Factor 0.93 0.93
Non-Participant (Contractor) Analysis
2008 Non-Participant Contractor Spillover Savings 163.3 0.01
Non-Participating Contractor PB Factor 0.73 0.73
a Estimates are provided here as point estimates. Unless the Prospective Benefit Factors are assumed to be an index of
the underlying construct, derivation of confidence intervals from the variances in this multi-question and factor composite
becomes immeasurable. Further presentation of the variances and discussion of reliability are presented in the
Prospective Benefits Impact Evaluation of the Home Performance with ENERGY STAR© Program Report.
There is a critical distinction between the meanings of the prospective benefit factor for participantsversus that for non-participants. For participants, the prospective benefit factor reflects what they woulddo without program incentives and other current influences, and measures how much the current programhas transformed their future actions.; In contrast, the prospective benefit estimates derived fromformerly participating contractors and non-participating contractors' spillover are based on the
36 To the extent that current program participants are free-riders due to prior year programs, however, their future actions are notincluded as being induced by the current program year. This measurement is incorporated through the NFR weights discussedearlier.
4-15
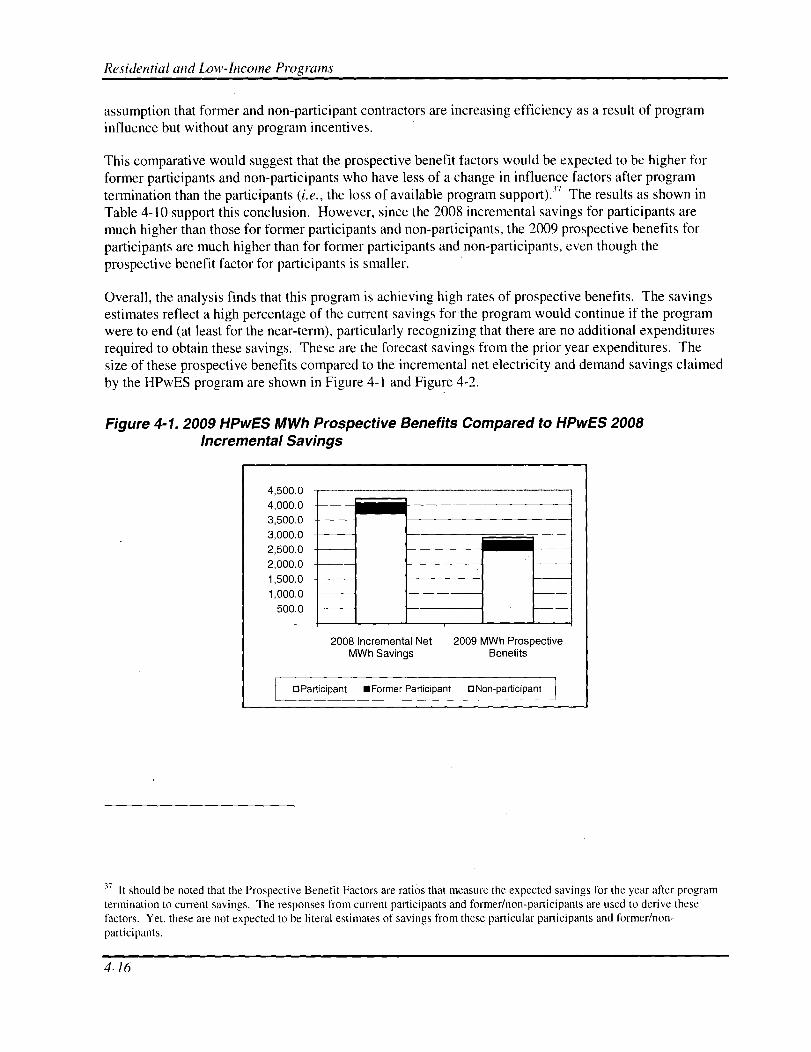
Residential and Low-Income Programs
assumption that former and non-participant contractors are increasing efficiency as a result of programinfluence but without any program incentives.
This comparative would suggest that the prospective benefit factors would be expected to be higher forformer participants and non-participants who have less of a change in influence factors after programtermination than the participants (i.e., the loss of available program support).' The results as shown inTable 4-10 support this conclusion. However, since the 2008 incremental savings for participants aremuch higher than those for former participants and non-participants, the 2009 prospective benefits forparticipants are much higher than for former participants and non-participants, even though theprospective benefit factor for participants is smaller.
Overall, the analysis finds that this program is achieving high rates of prospective benefits. The savingsestimates reflect a high percentage of the current savings for the program would continue if the programwere to end (at least for the near-term), particularly recognizing that there are no additional expendituresrequired to obtain these savings. These are the forecast savings from the prior year expenditures. Thesize of these prospective benefits compared to the incremental net electricity and demand savings claimedby the HPwES program are shown in Figure 4-1 and Figure 4-2.
Figure 4-1. 2009 HPwES MWh Prospective Benefits Compared to HPwES 2008Incremental Savings
4,500.04,000.03,500.0
3,000.02,500.02,000.0
1,500.0
1,000.0500.0
2008 Incremental Net 2009 MWh ProspectiveMWh Savings Benefits
OParticipant n Former Participant aNon-participantJ
77 It should be noted that the Prospective Benefit Factors are ratios that measure the expected savings for the year after programtermination to current savings. The responses from current participants and former/non-participants are used to derive thesefactors. Yet, these are not expected to be literal estimates of savings from these particular participants and former/non-participants.
4-16
Single Family Home Performance Program
Figure 4-2.2009 HPwES MW Prospective Benefits Compared to HPwES 2008 IncrementalSavings
0.30
0.25
0.20
0.15
0.10
0.05
2008 Incremental Net MW 2009 MW Prospective BenefitsSavings
OParticipant n Former Participant ONon-participant
These estimates are for the year immediately after the hypothetical 2008 program termination. However,benefits are likely to last beyond the first year of program termination. The rate of decay in these savingswould be dependent upon the sustainability of program-induced market transformation. There are veryfew studies concerning probability of sustainability of effects or decay for efficiency impacts. Significantresearch to estimate specific levels of decay for this program in the New York markets was beyond thescope of the current evaluation, but various decay scenarios can be examined as the prospective benefitsare added to future benefit/cost calculations.
A significant portion of the savings arising from the Home Performance Program stem from fossil fuels, asummary of the fossil fuel prospective benefits are included in Table 4-11 on the following page.
4-17
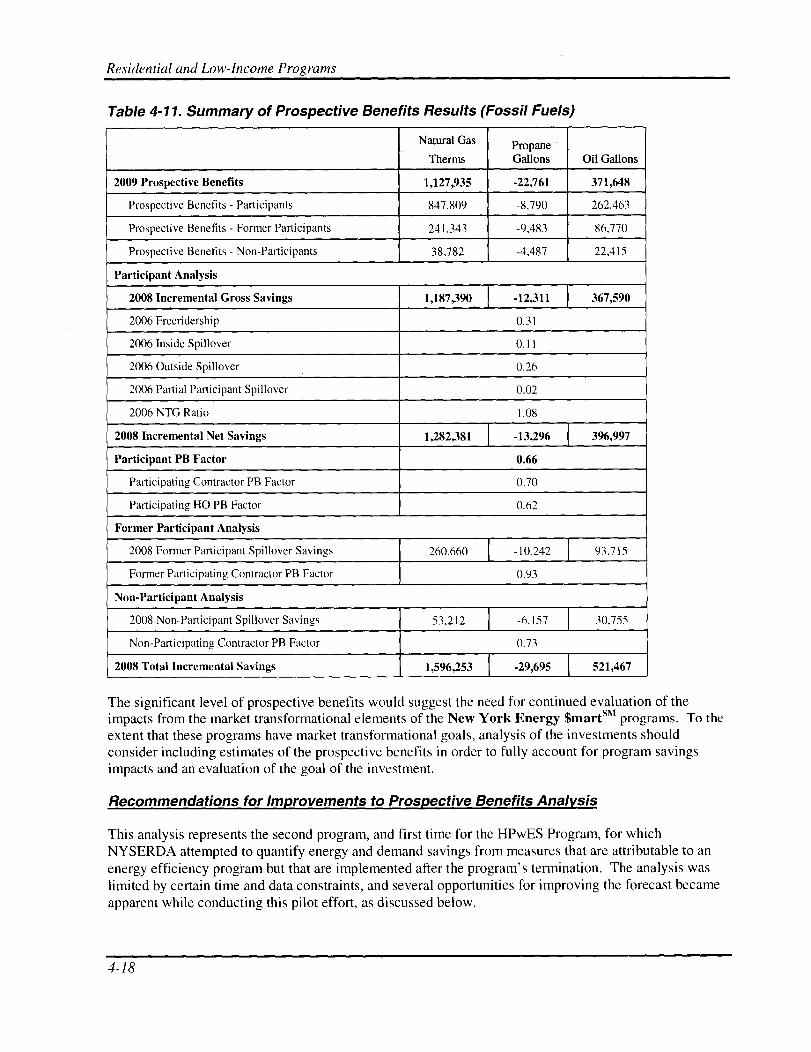
Residential and Low-Income Programs
Table 4-11. Summary of Prospective Benefits Results (Fossil Fuels)
Natural Gas
ThermsPropaneGallons Oil Gallons
2009 Prospective Benefits 1,127,935 -22,761 371,648
Prospective Benefits - Participants 847,809 -8,790 262,463
Prospective Benefits - Former Participants 241,343 -9,483 86,770
Prospective Benefits - Non-Participants 38,782 -4,487 22,415
Participant Analysis
2008 Incremental Gross Savings 1,187,390 -12,311 367,590
2006 Freeridership 0.31
2006 Inside Spillover 0.11
2006 Outside Spillover 0.26
2006 Partial Participant Spillover 0.02
2006 NTG Ratio 1.08
2008 Incremental Net Savings 1,282,381 -13,296 396,997
Participant PB Factor 0.66
Participating Contractor PB Factor 0.70
Participating HO PB Factor 0.62
Former Participant Analysis
2008 Former Participant Spillover Savings 260,660 -10,242 93,715
Former Participating Contractor PB Factor 0.93
Non-Participant Analysis
2008 Non-Participant Spillover Savings 53,212 -6,157 30,755
Non-Participating Contractor PB Factor 0.73
2008 Total Incremental Savings 1,596,253 -29,695 521,467
The significant level of prospective benefits would suggest the need for continued evaluation of theimpacts from the market transformational elements of the New York Energy $marts"t programs. To theextent that these programs have market transformational goals, analysis of the investments shouldconsider including estimates of the prospective benefits in order to fully account for program savingsimpacts and an evaluation of the goal of the investment.
Recommendations for Improvements to Prospective Benefits Analysis
This analysis represents the second program, and first time for the HPwES Program, for whichNYSERDA attempted to quantify energy and demand savings from measures that are attributable to anenergy efficiency program but that are implemented after the program's termination. The analysis waslimited by certain time and data constraints, and several opportunities for improving the forecast becameapparent while conducting this pilot effort, as discussed below.
4-18
Multifamily Building Programs
• Developing prospective benefit estimates at the same time as impact estimates would increasecertainty about the free-ridership status of participants and eliminate the need for the NFRweights used in this analysis.
• Program-specific hypotheses of the decay of prospective benefits require further research.
• Conducting similar prospective benefit impact evaluations for other programs will increaseknowledge about how to design and improve these types of evaluations.
4.4 Multifamily Building Programs
The Multifamily Building Programs include the closed Low-Income Direct Installation andComprehensive Energy Management (CEM) programs, the currently operating Assisted MultifamilyProgram (AMP), and the new Multifamily Performance Program (MPP).
4.4.1 Progress Toward Goals
As shown in Table 4-12, several long-term non-energy goals have been set for the new MultifamilyPerformance Program. Achievements include ongoing activities completed during this time period for theAMP. Progress has been slow due to time devoted to program design, as well as lengthy timelines forindividual projects.
Table 4-12. Multifamily Performance Program - Goals and Achievements
ProgramAchieved July
Goals 1, 2006 % of GoalActivity (July 1, 2006
through June Achievedthrough
30, 2009June 30, 2011)
Number of existing market rate multifamily units receiving energy39,000 562 114
efficiency services (completed projects)
Number of new market-rate multifamily units receiving energy7,500 0 0%
efficiency services
Tenant energy savings per year (at $250/unit) $34,875,000 $140,500 <1%
Number of existing low-income multifamily units receiving energy148,200 37 166 25%0
efficiency services (completed projects),
Number of new low-income multifamily units receiving energy12,700 443 3%^
efficiency services
Low-income tenant energy savings per year (at $195/unit) $31,375,500 $7.333,755 23%%
4.4.2 Energy, Peak Demand and Fuel Savings
Table 4-13 shows the cumulative annual energy and peak demand savings from the Multifamily BuildingPrograms. A realization rate and net-to-gross ratio is applied to adjust the program-reported savingsbased on the most recent Measurement and Verification and Attribution evaluation studies. Net savingsin the rightmost column are the total savings being claimed by the program after these evaluationactivities.
Residential and Low-Income Programs
Table 4-13. Multifamily Building Programs Cumulative Annual Energy and Peak DemandSavings (through June 2009)
Program-ReportedSavings
RealizationRate
AdjustedGross
Savings
Free-ridership
SpilloverNet-to-GrossRatio
NetSavings
Multifamily Performance Program (MPP)
MWh/year 8,065 NotEvaluated
8,065 NotEvaluated
NotEvaluated
NotEvaluated
8.065
MW On-Peak 0.8 NotEvaluated
0.8 NotEvaluated
NotEvaluated
NotEvaluated
0.8
MMBtu 125,359 NotEvaluated
125,359 NotEvaluated
NotEvaluated
NotEvaluated
125.359
Assisted Multifamily Program (AMP)2
MWh/year 55,597 0.97 53,929 27% 15% 0.84 45,273
MW On-Peak 5.7 1.26 7.2 27% 15% 0.84 6.1
MMBtu 382,668 1.0 382,668 27% 15% 0.84 321,250
Comprehensive Energy Management (CEM) Program3
MWh/year 5,712 0.97 5,541 2% 18% 1.16 6.408
MW On-Peak 0.3 1.77 0.5 2% 18% 1.16 0.6
Low-income Direct Installation3
MWh/year 11,494 1.0 11,494 NotEvaluated
NotEvaluated
NotEvaluated
11,494
MW On-Peak 1.6 1.0 1.6 NotEvaluated
NotEvaluated
NotEvaluated
1.6
Multifamily Building Programs - Total
MWh/year 80,869 N/A 76,744 N/A N/A N/A 68,598
MW On-Peak 8.5 N/A 10.2 N/A N/A N/A 9.1
MMBtu 508,027 N/A 508,027 N/A N/A N/A 446,609
1 Net-to-Gross Ratio = (1-Freeridership) * (1+Spillover).2 The AMP program experienced a large increase in savings over the last quarter as two very large projects (Co-op City andBuffalo MHA) substantially completed installation of measures.3 Closed program
N/A - Not Applicable
4-20
Market Support Program
4.4.3 Other Evaluation Findings
The timeline for completing MPP projects is at least a year. Table 4-14 shows the number of housingunits involved in each point of the Program pipeline as of June 30, 2009.
Table 4-14. Number of Units Participating in MPP According to Status
Status Number of Housing Units
Existing Buildings New Construction
Participation Agreement Signed 69,876 8,039
Design 75% Complete N/A 2,327
Construction Complete 6,321 87
Totals 76,197 10,453
N/A - Not Applicable
4.5 Market Support Program
4.5.1 Progress Toward Goals
Table 4-15 shows the Program's four long-term non-energy goals and progress. The Program has madeexcellent progress, exceeding all four of its goals.
Table 4-15. Market Support Program - Goals and Achievements
Program Goals Achieved July 1,% of Goal
Activity (July 1, 2006 through 2006 through June AchievedJune 30, 2011) 30, 2009
New manufacturing partners signed up 20 25 >100%
New retail partners (independent) signed up 100 252 >100°Ic
New retail partners (big box, mass merchandisers) 6 8 >100%signed up
ENERGY STAR market share increase on targeted25% 27% >100%Ic
products (on average, across products)
Residential and Low-Income Programs
4,5.2 Energy, Peak Demand and Fuel Savings
Table 4-16 shows the cumulative annual energy and peak demand savings from the Market SupportProgram.
Table 4-16. Market Support Program Cumulative Annual Energy and Peak DemandSavings (through June 2009)
Program-ReportedSavings
Realiza-don Rate
AdjustedGross
Savings
Free-ridership
SpilloverNet-to-GrossRatio'
Net Savings
New York Energy $martsM Products (through 2007)
MWh/year 615,469
MW On-Peak Not applicable2 121.9
MMBtu 280,298
Keep Cool
MWh/year 5,159 1.0 5,159 18% 15% 0.94 4,865
MW On-Peak 8.8 1.0 8.8 18% 15% 0.94 8.3
Bulk Purchase
MWh/year 19,451 2.03 39,486 10% 5% 0.95 37.314
MW On-Peak 3.9 1.62 6.3 10% 5% 0.95 6.0
MMBtu 24,307 0.71 17,258 10% 5% 0.95 16,309
Market Support Program - Total
MWh/year N/A N/A N/A N/A N/A N/A 657,648
MW On-Peak N/A N/A N/A N/A N/A N/A 136.1
MMBtu N/A N/A N/A N/A N/A N/A 296,607
1 Net-to-Gross Ratio = (I-Freeridership) * (1+Spillover).2 Savings for the New York Energy $marts" Products Program are estimated based on market data, survey research, anddeemed savings values. Savings for this program were last fully captured in 2006. An update, completed and applied inQuarter 1 2009, added electricity, demand, and fuel savings for 2007 appliances only. Once necessary market-level data areavailable, appliance savings for 2008, as well as lighting savings for 2007 and 2008 will be analyzed and applied.
N/A - Not Applicable
4-22
Communities and Education Program
4.6 Communities and Education Program
4.6.1 Progress Toward Goals
As shown in Table 4-17, seven long-term non-energy goals have been set for the Communities andEducation Program. The Program is performing well with respect to the majority of these goals.
Table 4-17. Communities and Education Program - Goals and Achievements
Program Goals Achieved July 1,% of Goal
Activity (July 1, 2006 through 2006 through AchievedJune 30, 2011) June 30, 2009
Teachers trained 5,000 3,225 65%
Total students reached 150,000 392,973 >100%
Portion of total estimated to be low-income students 100,000 157,189 >100%
Community events held statewide 1,000 1,153 >100%
Recruiting seminars held statewide 500 416 83%
Home performance contractors, technicians, builders andraters recruited (attending seminars) for the Single Family 800 1,146 >10017cHome Performance Program
Building analysts, designers, energy consultants, equipmentinstallers, etc. recruited (attending seminars) for Multifamily 100 218 >100%E IBuilding Performance Program
4.7 CFL Expansion Program
The CFL Expansion Program, as approved in the revised SBC Operating Plan38, is one of the five FastTrack programs originally presented in the June 23d, 20008 DPS Order39. Details on this EEPS-fundedprogram are included in the appendix.
Through June 30, 2009, electricity and demand savings for the CFL Expansion Program have not yetbeen calculated. Future evaluation reports will detail savings associated with this program.
;" System Benefits Charge, Supplemental Revision for New York Energy $mart"" Programs (2008 - 2011. As amended August22, 2008 and revised March 12, 2009.'9 CASE 07-M-0548 - Proceeding on Motion of the Commission regarding and Energy Efficiency Portfolio. Issued and effectiveJune 23, 2008.
4-23
Residential and Low-Income Programs
4.8 EmPower New Yorks""
The EmPower Program continues to monitor a key non energy metrics to assess their growth as a proxyfor program expansion. Table 4-18 shows this metric and its current status. Overall, this measurecontinues to show progress over time, corresponding with program growth.
Table 4-18. EmPower New YorkSM Program - Key Activities
ActivityAchieved July 1, 2006through June 30, 2009
Households served (completed) 26,662
4.8.1 Energy, Peak Demand and Fuel Savings
Table 4-19 shows the cumulative annual energy and peak demand savings from the EmPower Programincluding both SBC and EEPS funding. A realization rate is applied to adjust the program-reportedsavings based on the most recent Measurement and Verification evaluation studies. These programs havenot undergone any attribution evaluation, so no adjustment is made for net-to-gross.
Table 4-19. EmPower New Yorks" Program Cumulative Annual Energy and PeakDemand Savings (through June 2009) (Combined Program)
Program ReportedSavings
RealizationRate
Adjusted GrossSavings
Net-to-GrossRatio
Net Savings
EmPower New York
MWh/year 52,156 0.81 42,246 Not evaluated 42.246
MW On-Peak 7.0 1.0 7.0 Not evaluated 7.0
MMBtu 155,427 1.0 155,427 Not evaluated 155,427
Weatherization Network Initiative'
MWh/year 8,242 1.0 8,242 Not evaluated 8,242
MW On-Peak 1.0 1.0 1.0 Not evaluated 1.0
EmPower New York Total
MWh/year 58,854 N/A 48,944 Not evaluated 48,944
MW On-Peak 8.0 N/A 8.0 Not evaluated 8.0
MMBtu 155,427 N/A 155,427 Not evaluated 155,427
'Closed program
N/A - Not Applicable
Buying Strategies and Energy Awareness Program
4.9 Buying Strategies and Energy Awareness Program
4.9.1 Progress Toward Goals
Four long-term non-energy goals have been set for the Buying Strategies and Energy AwarenessProgram. These five-year goals and progress are shown in Table 4-20. The Program has alreadyexceeded three of its four goals and is on track relative to the fourth one.
Table 4-20. Buying Strategies and Energy Awareness Program - Goals andAchievements
Program GoalsAchieved July 1,
Activity(July 1, 2006
2006 through June% of Goal
through30, 2009
AAchievedJune 30, 2011)
Funds leveraged through Buying Strategies initiative $20 million $16.5 - $18 million 82%
Additional low-income individuals reached via newsletters, 5 million 1,552,443 31%weekly newspapers, etc. (readership)
Additional low-income individuals reached via seminars and15,000 19,478 >100%
workshops (attendees)
Additional contractors and other partners recruited in low-50 838 >100%
income districts
4-25
5Research and Development Programs
5.1 Research & Development (R&D) Program Evaluation Activities
5.1.1 Completed Evaluation Activities
No major evaluation studies were completed this quarter for R&D programs. However, significantevaluation efforts are underway, as described in the next section.
5.1.2 Evaluation Activities in Progress and Planned
From the R&D area, the Distributed Generation/Combined Heat and Power Program is represented in theimpact evaluation project to assess the net effects of the largest energy saving projects acrossNYSERDA's portfolio. Additionally, a major impact evaluation of the R&D portfolio is underway, andis summarized below.
R&D Program Impact Evaluation
NYSERDA is undertaking the following activities in the area of R&D impact evaluation:
Metrics Database - A new database of metrics that will map to program outputs and outcomes,
demonstrating progress toward R&D program goals, continues to be developed and will be readyto start receiving data in the last quarter of 2009.
• Product Development and Demonstration Impacts -Product development program participantswere surveyed about product sales, job creation, and business expansion. The results of the surveywere summarized in the March 2009 quarterly report. Surveys of companies participating inNYSERDA's demonstration programs will be administered in late 2009. These surveys will beused to determine the extent of spillover from program-induced activities. Three market actorswill be surveyed: site owners, technology providers, and technology vendors.
• Case Studies - Three product development projects were selected for an in-depth analysis of theirenergy, economic, and environmental impacts. The case studies will be completed in the thirdquarter. Products included in the case studies are: NXP Semiconductors Power ManagementDevice, BAE Systems Hybrid Electric Vehicle Powertrain, and Anaerobics/Evocation MobilizedFilm Technology for Wastewater Treatment.
Research and Development Programs
5.2 Summary of R&D Evaluation Results
5.2.1 Progress Toward Non-Energy Goals
Across the programs, a number of long-term goals were set for key metrics such as: the number ofsolicitations, studies, and projects; the number of workshops; the number of companies doing business inNew York; new products developed and launched; and other important knowledge creation, informationdissemination, and commercialization progress metrics. Overall, the programs are performing well withrespect to these goals. Results of each program's progress toward its stated goals are shown in tableformat in this section. Many of these goals are qualitative in nature. However, some key areas ofprogress in the past 36 months include the following:
• Under the Public Benefit Power Transmission and Distribution Program, 28 projects have beenapproved to provide 21 companies about $10 million to pursue development of advancedtechnologies that will improve the efficiency and delivery of power for electric customers acrossthe State. The Program has succeeded in collaborating with major stakeholders, funding projectsin each of the electric utility companies, working with the NYISO's newly formed R&D group toprioritize critical technology needs, and partnering with the U.S. Department of Energy on smart-grid projects and technology evaluation.
The Clean Energy Infrastructure Program has released 14 competitive research solicitations.
• The Power Systems Product Development program has awarded 35 product development projectsand assisted the launching seven new products.
• The DG-CHP Demonstration Program is working on 33 new demonstration projects (since July 1,2006) with CHP systems located at 43 sites. Site characteristics are posted on the Internet(http://chp.nyserda.org) for 99 sites (includes projects originating prior to July 1, 2006), along withdaily performance data from 15 sites.'
The Demand Response and Innovative Rate Research Program completed a three-year timesensitive rate pilot, demonstrating load reduction impacts of 23% from submetering.
The Electric Transportation has approved 45 projects. Projects include both over-the-road
technologies and electrified rail. Anti-idling and electric substations are also part of the projectportfolio.
• Seven solicitations offering EMEP funding have been issued. These solicitations focused onsequestration, impacts of renewable energy, ecosystems, and air quality, and have led to 39projects being contracted.
• The Industrial Process & Product Innovation Program has approved funding for 56 cost-shareddemonstration and/or development projects.
'Performance data from 22 additional sites that have met their reporting obligations are available on the Internet.
5-2
Summary of R&D Evaluation Results
The Municipal Water and Wastewater Efficiency Program has issued two solicitations and isproviding technical assistance to six projects.
5.2.2 Energy, Peak Demand, Fuel Savings, and Clean Generation
Table 5-1 shows the energy savings and renewable energy production achieved by the R&D portfoliothrough June 30, 2009. Table 5-2 highlights demand reduction achievements, and Table 5-3 showsimpacts for other fuels such as natural gas and oil. These tables also show the change over time sinceJune 30, 2006.
Table 5-1. R&D Program Electricity Savings and Clean Generation through June 30, 2009
Energy Savings (GWh)
Program Savings Achieved through
June 30, 2006 June 30, 2009
DG-CHP Demonstration Program 82.7 126.4
Renewable Energy Production 103.8 106.2
Overlap Removed 6.6 34.1
Statewide R&D Total 179.9 198.5
Table 5-2. R&D Program Cumulative Peak Demand Savings through June 30, 2009
Demand Savings (MW)l
Program Savings Achieved through
June 30, 2006 June 30, 2009
DG-CHP Demonstration Program 18.1 28.9
Demand Response and Innovative Rate Research 137.2 99.0
Renewable Energy Production 8.1 9.8
Overlap Removed 1.3 5.8
Statewide R&D Total 162.1 131.9
MWs enabled under the SBC2 program Enabling Technologies for Price Responsive Load were not required to persist beyondthe period of the contract. As such, the available MWs have steadily declined since the program's close.
Research and Development Programs
Table 5-3. R&D Program Cumulative Annual Fuel Savings through June 30, 2009
Fuel Savings (MMBtu)
Program Savings Achieved through
June 30, 2006 June 30, 2009
DG-CHP Demonstration Program' -571,310 -1,218,370
Statewide R&D Total -571,310 -1,218,370
1 Because the electricity saved by the DG/CHP projects replaces electricity formerly purchased from the grid, the program hasreduced fuel used at central generating stations, for a net decrease statewide due to greater efficiency of the DG/CHP systems atsites where imported fuel is used. The fuel avoided at the central generating plant is determined from the electricity generatedby the DG/CHP installations. Furthermore, at additional projects such as wastewater treatment plants, electricity generation ispowered fully or partially by digester gas produced on site. Such fuel switching achieves natural gas conservation above andbeyond what is achieved through efficiency alone.
5.3 Public Benefit Power Transmission and Distribution Research
5.3.1 Progress Toward Goals
Two long-term goals have been set for the Public Benefit Power Transmission and Distribution Program(PBPTD). These goals and progress are described in Table 5-4. To date, 28 projects are in various stagesof development.
Table 5-4. Public Benefit Power Transmission and Distribution Research Program -Goals and Achievements
ActivityProgram Goals (July 1, 2006
through June 30, 2011)Achieved July 1, 2006 through June 30, 2009
Issue annual solicitations 12 or more projects resulting in The program was initiated in 2007 and a total of 15progress toward program projects were selected for funding under PON 1 102 in twoobjectives separate funding rounds. These projects are in various
stages of development and include engineering/policystudies, technology demonstration, and productdevelopment activities. Fourteen (14) contracts are inprogress: one has withdrawn.
A total of 21 proposals were received in the first fundinground of PON 1208. A technical evaluation panel (TEP)was convened on August 5th, 2008 to review and rank allof the proposed projects. Twelve (12) projects weredeemed technically meritorious; 10 projects are inprogress; one was one withdrawn and one wasincorporated into an existing contract.
A total of 12 proposals were received in the secondfunding round of PON 1208. A technical evaluation panel(TEP) was convened on March 4, 2008 to review and rankall of the proposed projects. Four (4) projects wereultimately deemed technically meritorious and contractsare in progress.

Clean Energy Infrastructure
ActivityProgram Goals (July 1, 2006
through June 30, 2011)Achieved July 1, 2006 through June 30, 2009
Technology transfer Identify successful projects, The program team continues to work closely with theundertake specific outreach and electric utilities, the NYISO, and EPRI to identify projectsknowledge transfer activities that provide significant statewide benefit. Project tasksaimed at utilities will be structured to support state energy planning
activities where appropriate.
5.4 Clean Energy Infrastructure
5.4.1 Progress Toward Goals
Several long-term non-energy goals have been set for the Clean Energy Infrastructure Program. Thesefive-year goals, as well as progress, are shown in Table 5-5. The Program is performing well with respectto its goals.
Table 5-5. Clean Energy Infrastructure Program - Goals and Achievements
ActivityProgram Goals (July 1, 2006 through June 30,
Achieved July 1,2006 through June
% of Goal2011) 30, 2009
Achieved
Education, Consumer Awareness and Market Development
New accredited training3 2 67%
institutions Self-sustaining accredited training and
New certification exams 5certification programs for clean energy 2 40%
technologies in addition to PV
Training workshops 25 27 >100%
Renewable Resource Applications
Stakeholder workshops 7 Reduction of knowledge and technical 13 >100%
barriers currently affecting installationCompetitive research 5 and operation of wholesale and end-use
14 >100%solicitations clean energy technologies
Clean Energy Technology Manufacturing and Business Development
Companies expandingrenewable business 25 Increase the number of companies 29 >100%networks developing and manufacturing clean
energy technologies, and serving theCompanies expanding 10 clean energy businesses in New York 5a 50%manufacturing
a One company expanding manufacturing that was reported in the third quarter is now "on-hold."
5.4.2 Clean Energy Generation
The installation of PV and small wind is now part of the Renewable Portfolio Standard (RPS) programand the information in this section reflects the installations prior to the transition to the RPS. Table 5-6shows the cumulative annual clean generation from the Clean Energy Infrastructure Program. Arealization rate and net-to-gross ratio is applied to adjust the program-reported generation based on the
5-5
Research and Development Programs
most recent Measurement and Verification and Attribution evaluation studies. Net clean generation in therightmost column is the total savings being claimed by the program after these evaluation activities.
Table 5-6. Clean Energy Infrastructure Program Cumulative Annual Clean Generation(through transition of Program to RPS in 2008)
Program-ReportedSavings
Realization RateAdjusted
Gross EnergyGenerations
Net-to-GrossRatio
Net EnergyGeneration
End Use Renewables
MWh/year 5,930 1.04 6,167 1.0 6,167
MW On-Peak 4.2 0.85 3.6 1.0 3.6
Wholesale Renewables
MWh/year 99,995 1.0 99,995 1.0 99,995
MW On-Peak 6.2 1.0 6.2 1.0 6.2
Clean Energy Totals
MWh/year 105,925 N/A 106,162 N/A 106,162
MW On-Peak 10.4 N/A 9.8 N/A 9.8
N/A - Not Applicable
5.5 Power Systems Product Development
5.5.1 Progress Toward Goals
Several long-term non-energy goals have been set for the Power Systems Product Development Program.Goals and accomplishments are shown in Table 5-7.
Table 5-7. Power Systems Product Development Program - Goals and Achievements
Program Goals Achieved July 1, 2006Activity
(July 1, 2006through % of Goal Achieved
through June 30,June, 30 2009
2011)
Product development contracts awarded 75 68 contracts, 35 unique 91%products
New products commercially launched since 5 7 71%,July 1, 2006
Cumulative product sales ($) since July 1,$50 million $21.2 million 42%
2006
Successful new product field tests and15 7 47%
demonstrations
Assessments and studies of new technologies20 22 >100%
completed

Power Systems Product Development
This past quarter, 12 additional projects were approved for funding. These include several solar projectsthat will reduce the cost of manufacturing photovoltaic cells by lowering materials requirements andimproving work flow. Also, reductions in manufacturing costs through the use of thin film manufacturingtechniques will be examined. Another project will develop a system to monitor the performance ofindividual photovoltaic panels, reducing diagnosis time and increasing PV system performance.
Two large-scale energy storage projects were also approved. One project is focused on the developmentof super capacitors and the other is focused on industrial-sized flow batteries. Four new fuel cell projectswill explore materials and material configurations, addressing long-standing barriers to fuel cellimplementation. Two renewable energy projects were approved. The first explores blade shaping for avertical axis wind turbine and the second explores blades for hydropower turbine to reduce fish fatalities.
Ener-G-Rotors has successfully tested a second 5 KW generator that converts low grade waste heat toelectricity using a patented process. This unit will be shipped to Con Edison to be tested by its steamcustomers to potentially convert steam condensate to electricity.
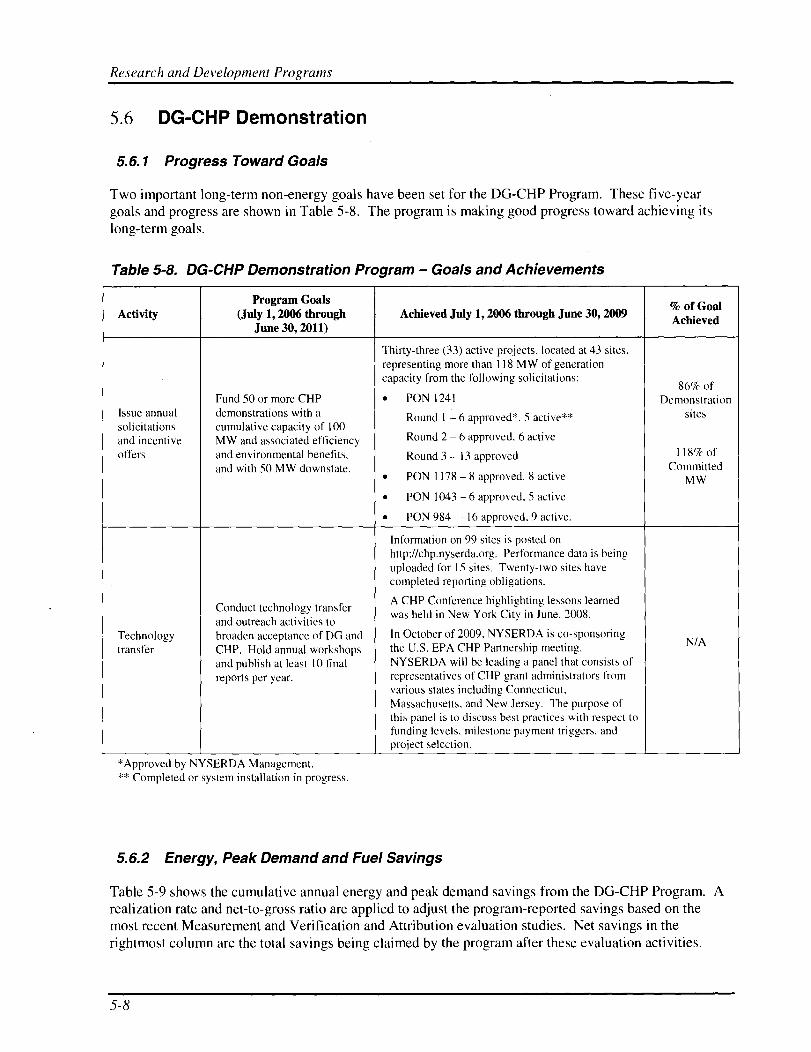
Research and Development Programs
5.6 DG-CHP Demonstration
5.6.1 Progress Toward Goals
Two important long-term non-energy goals have been set for the DG-CHP Program. These five-yeargoals and progress are shown in Table 5-8. The program is making good progress toward achieving itslong-term goals.
Table 5-8. DG-CHP Demonstration Program - Goals and Achievements
ActivityProgram Goals
(July 1, 2006 throughJune 30, 2011)
Achieved July 1, 2006 through June 30, 2009% of GoalAchieved
Thirty-three (33) active projects, located at 43 sites,representing more than 118 MW of generationcapacity from the following solicitations:
86% ofFund 50 or more CHP • PON 1241 Demonstration
Issue annual demonstrations with a Round I - 6 approved*, 5 active** sitessolicitations cumulative capacity of 100and incentive MW and associated efficiency Round 2 - 6 approved. 6 active
offers and environmental benefits, Round 3 - 13 approved 118% of
and with 50 MW downstate. Committed• PON 1178 - 8 approved, 8 active MW
• PON 1043 - 6 approved, 5 active
• PON 984 - 16 approved, 9 active.
Information on 99 sites is posted onhttp://chp.nyserda.org. Performance data is beinguploaded for 15 sites. Twenty-two sites havecompleted reporting obligations.
Conduct technology transferA CHP Conference highlighting lessons learned
and outreach activities towas held in New York City in June, 2008.
Technology broaden acceptance of DG and In October of 2009, NYSERDA is co-sponsoringN/A
transfer CHP. Hold annual workshops the U.S. EPA CHP Partnership meeting.
and publish at least 10 final NYSERDA will be leading a panel that consists of
reports per year. representatives of CHP grant administrators fromvarious states including Connecticut,Massachusetts, and New Jersey. The purpose ofthis panel is to discuss best practices with respect to
funding levels, milestone payment triggers, andproject selection.
*Approved by NYSERDA Management.** Completed or system installation in progress.
5.6.2 Energy, Peak Demand and Fuel Savings
Table 5-9 shows the cumulative annual energy and peak demand savings from the DG-CHP Program. Arealization rate and net-to-gross ratio are applied to adjust the program-reported savings based on themost recent Measurement and Verification and Attribution evaluation studies. Net savings in therightmost column are the total savings being claimed by the program after these evaluation activities.
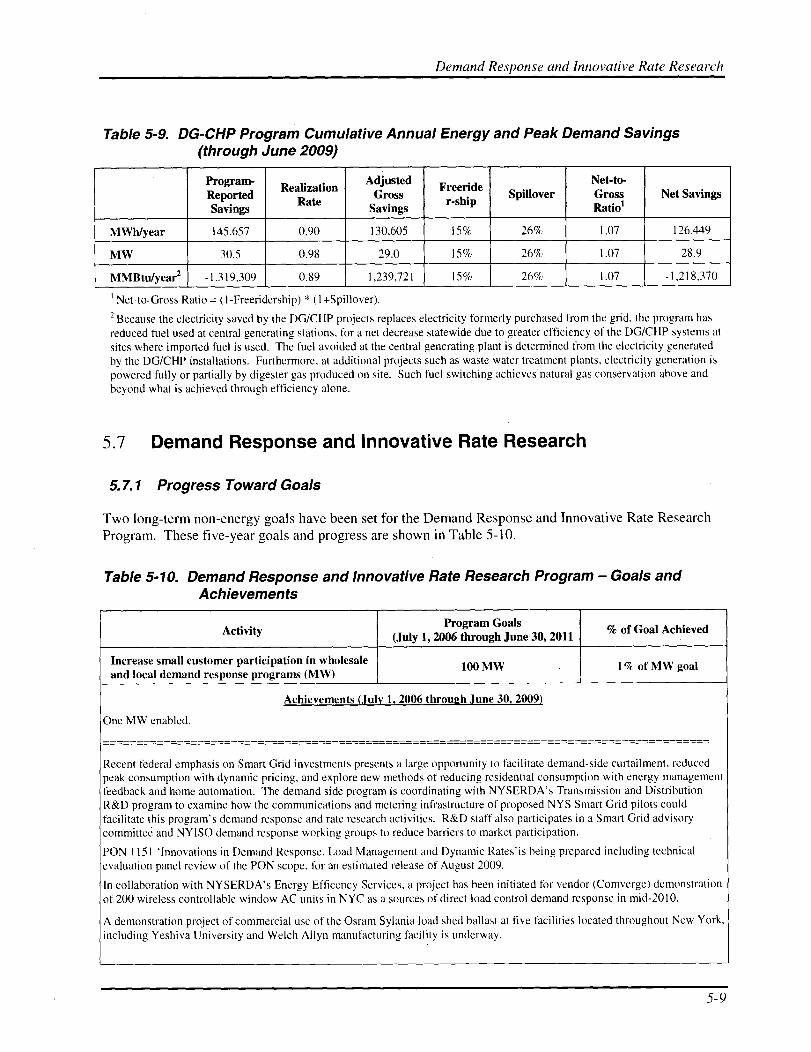
Demand Response and Innovative Rate Research
Table 5-9. DG-CHP Program Cumulative Annual Energy and Peak Demand Savings(through June 2009)
Program-Realization
AdjustedFreeride
Net-to-Reported
RateGross
r-shipSpillover Gross
sNet Savings
Savings Savings Ratio
MWh/year 145,657 0.90 130,605 15% 26% 1.07 126,449
MW 30.5 0.98 29.0 15% 26% 1.07 28.9
MMBtu/year2 -1,319,309 0.89 -1,239,721 15% 26% 1.07 -1,218,370
'Net-to-Gross Ratio = (1-Freeridership) * (1+Spillover).
2 Because the electricity saved by the DG/CHP projects replaces electricity formerly purchased from the grid, the program hasreduced fuel used at central generating stations, for a net decrease statewide due to greater efficiency of the DG/CHP systems atsites where imported fuel is used. The fuel avoided at the central generating plant is determined from the electricity generatedby the DG/CHP installations. Furthermore, at additional projects such as waste water treatment plants, electricity generation ispowered fully or partially by digester gas produced on site. Such fuel switching achieves natural gas conservation above andbeyond what is achieved through efficiency alone.
5.7 Demand Response and Innovative Rate Research
5.7.1 Progress Toward Goals
Two long-term non-energy goals have been set for the Demand Response and Innovative Rate ResearchProgram. These five-year goals and progress are shown in Table 5-10.
Table 5-10. Demand Response and Innovative Rate Research Program - Goals andAchievements
ActivityProgram Goals
(July 1, 2006 through June 30, 2011% of Goal Achieved
Increase small customer participation in wholesaleand local demand response programs (MW)
100 MW
Achievements (July 1, 2006 through June 30, 2009)
One MW enabled.
1% of MW goal
------------------------------------------------------------------------------------------------------------------------------------------------------------------------------------
Recent federal emphasis on Smart Grid investments presents a large opportunity to facilitate demand-side curtailment, reducedpeak consumption with dynamic pricing, and explore new methods of reducing residential consumption with energy managementfeedback and home automation. The demand side program is coordinating with NYSERDA's Transmission and DistributionR&D program to examine how the communications and metering infrastructure of proposed NYS Smart Grid pilots couldfacilitate this program's demand response and rate research activities. R&D staff also participates in a Smart Grid advisorycommittee and NYISO demand response working groups to reduce barriers to market participation.
PON 1 151 `Innovations in Demand Response, Load Management and Dynamic Rates'is being prepared including technicalevaluation panel review of the PON scope, for an estimated release of August 2009.
In collaboration with NYSERDA's Energy Efficency Services, a project has been initiated for vendor (Comverge) demonstrationof 200 wireless controllable window AC units in NYC as a sources of direct load control demand response in mid-2010.
A demonstration project of commercial use of the Osram Sylania load shed ballast at five facilities located throughout New York,including Yeshiva University and Welch Allyn manufacturing facility is underway.
5-9
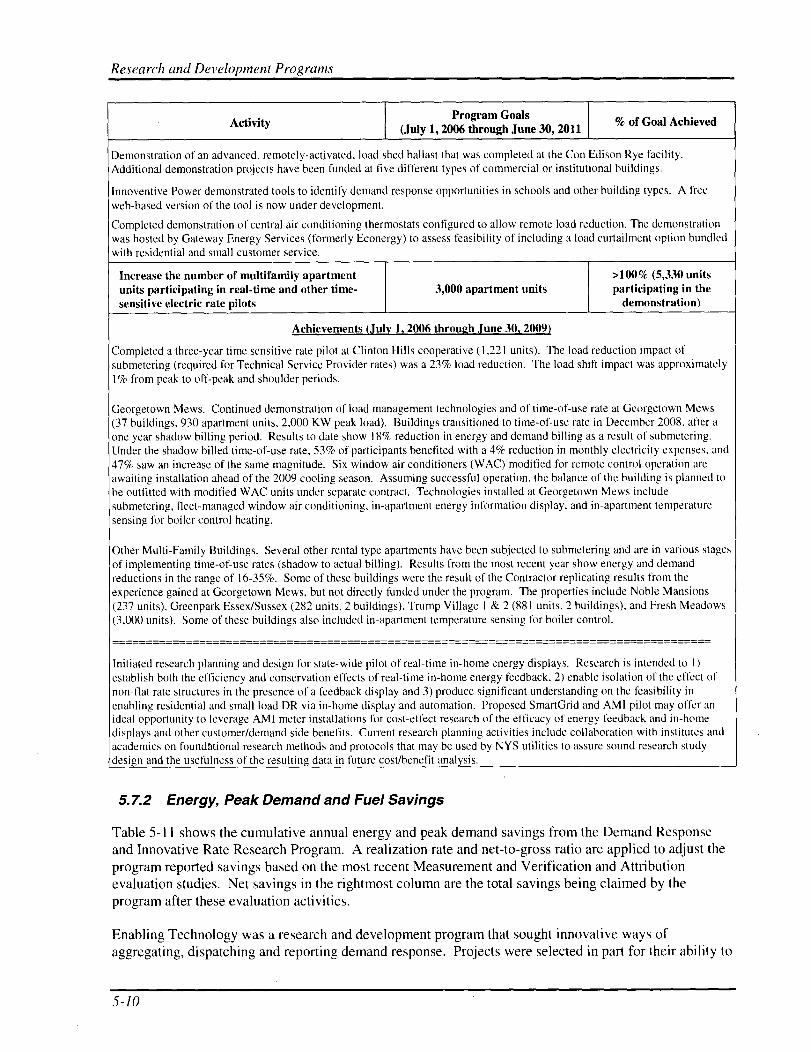
Research and Development Programs
ActivityProgram Goals
(July 1, 2006 through June 30, 2011% of Goal Achieved
Demonstration of an advanced, remotely-activated, load shed ballast that was completed at the Con Edison Rye facility.Additional demonstration projects have been funded at five different types of commercial or institutional buildings.
Innoventive Power demonstrated tools to identify demand response opportunities in schools and other building types. A freeweb-based version of the tool is now under development.
Completed demonstration of central air conditioning thermostats configured to allow remote load reduction. The demonstrationwas hosted by Gateway Energy Services (formerly Econergy) to assess feasibility of including a load curtailment option bundledwith residential and small customer service.
Increase the number of multifamily apartment >100% (5,330 unitsunits participating in real-time and other time- 3,000 apartment units participating in thesensitive electric rate pilots demonstration)
Achievements (July 1, 2006 through June 30, 2009)
Completed a three-year time sensitive rate pilot at Clinton Hills cooperative (1,221 units). The load reduction impact ofsubmetering (required for Technical Service Provider rates) was a 23% load reduction. The load shift impact was approximately1% from peak to off-peak and shoulder periods.
Georgetown Mews. Continued demonstration of load management technologies and of time-of-use rate at Georgetown Mews(37 buildings, 930 apartment units, 2,000 KW peak load). Buildings transitioned to time-of-use rate in December 2008, after aone year shadow billing period. Results to date show 18% reduction in energy and demand billing as a result of submetering.Under the shadow billed time-of-use rate, 53% of participants benefited with a 4% reduction in monthly electricity expenses, and47% saw an increase of the same magnitude. Six window air conditioners (WAC) modified for remote control operation areawaiting installation ahead of the 2009 cooling season. Assuming successful operation, the balance of the building is planned tobe outfitted with modified WAC units under separate contract. Technologies installed at Georgetown Mews includesubmetering, fleet-managed window air conditioning, in-apartment energy information display, and in-apartment temperaturesensing for boiler control heating.
Other Multi-Family Buildings. Several other rental type apartments have been subjected to submetering and are in various stagesof implementing time-of-use rates (shadow to actual billing). Results from the most recent year show energy and demandreductions in the range of 16-35%. Some of these buildings were the result of the Contractor replicating results from theexperience gained at Georgetown Mews, but not directly funded under the program. The properties include Noble Mansions(237 units), Greenpark Essex/Sussex (282 units, 2 buildings), Trump Village I & 2 (881 units, 2 buildings), and Fresh Meadows(3,000 units). Some of these buildings also included in-apartment temperature sensing for boiler control.
----------------------------------------------------------------------------------------------------------------------------------------------------------------------------------
Initiated research planning and design for state-wide pilot of real-time in-home energy displays. Research is intended to 1)establish both the efficiency and conservation effects of real-time in-home energy feedback, 2) enable isolation of the effect ofnon-flat rate structures in the presence of a feedback display and 3) produce significant understanding on the feasibility inenabling residential and small load DR via in-home display and automation. Proposed SmartGrid and AMI pilot may offer anideal opportunity to leverage AMI meter installations for cost-effect research of the efficacy of energy feedback and in-homedisplays and other customer/demand side benefits. Current research planning activities include collaboration with institutes andacademics on foundational research methods and protocols that may be used by NYS utilities to assure sound research studydesign and the usefulness of the resulting data in future cost/benefit analysis.
5.7.2 Energy, Peak Demand and Fuel Savings
Table 5-11 shows the cumulative annual energy and peak demand savings from the Demand Responseand Innovative Rate Research Program. A realization rate and net-to-gross ratio are applied to adjust theprogram reported savings based on the most recent Measurement and Verification and Attributionevaluation studies. Net savings in the rightmost column are the total savings being claimed by theprogram after these evaluation activities.
Enabling Technology was a research and development program that sought innovative ways ofaggregating, dispatching and reporting demand response. Projects were selected in part for their ability to
5-10
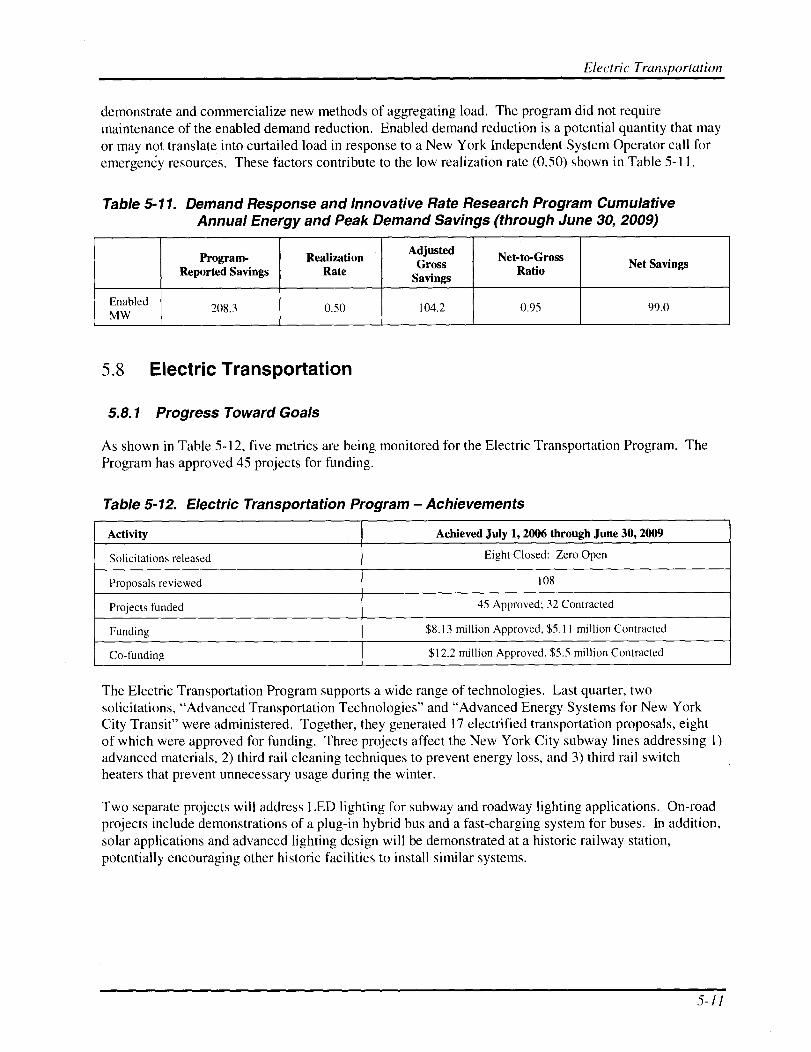
Electric Transportation
demonstrate and commercialize new methods of aggregating load. The program did not requiremaintenance of the enabled demand reduction. Enabled demand reduction is a potential quantity that mayor may not translate into curtailed load in response to a New York Independent System Operator call foremergency resources. These factors contribute to the low realization rate (0.50) shown in Table 5-11.
Table 5-11. Demand Response and Innovative Rate Research Program CumulativeAnnual Energy and Peak Demand Savings (through June 30, 2009)
Program- RealizationAdjusted Net-to-Gross
Gr sss Net SavingsReported Savings Rate
o RatioSa n
Enabled208 3 0.50 104.2 0.95 99.0
MW.
5.8 Electric Transportation
5.8.1 Progress Toward Goals
As shown in Table 5-12, five metrics are being monitored for the Electric Transportation Program. TheProgram has approved 45 projects for funding.
Table 5-12. Electric Transportation Program - Achievements
Activity Achieved July 1, 2006 through June 30, 2009
Solicitations released Eight Closed: Zero Open
Proposals reviewed 108
Projects funded 45 Approved: 32 Contracted
Funding $8.13 million Approved, $5,11 million Contracted
Co-funding $12.2 million Approved, $5.5 million Contracted
The Electric Transportation Program supports a wide range of technologies. Last quarter, twosolicitations, "Advanced Transportation Technologies" and "Advanced Energy Systems for New YorkCity Transit" were administered. Together, they generated 17 electrified transportation proposals, eightof which were approved for funding. Three projects affect the New York City subway lines addressing 1)advanced materials, 2) third rail cleaning techniques to prevent energy loss, and 3) third rail switchheaters that prevent unnecessary usage during the winter.
Two separate projects will address LED lighting for subway and roadway lighting applications. On-roadprojects include demonstrations of a plug-in hybrid bus and a fast-charging system for buses. In addition,solar applications and advanced lighting design will be demonstrated at a historic railway station,potentially encouraging other historic facilities to install similar systems.

Research and Development Programs
5.9 Environmental Monitoring, Evaluation, and Protection (EMEP)
5.9.1 Progress Toward Goals
Several long-term goals have been set for the Environmental Monitoring, Evaluation and ProtectionProgram. These five-year goals and progress are shown in Table 5-13.
Table 5-13. Environmental Monitoring, Evaluation, and Protection Program - Goals andAchievements
Activity
Develop detailed multi-year EMEP research planwith input frompolicymakers, scientists,and stakeholders
Develop, contract, andmanage research projectsaimed at priority energy-related environmentalresearch areas
Sponsor workshops,conferences, and seminars
Program Goals (July 1,2006 through June 30,
2011)
Complete EMEP researchplan and update researchplan as needed to ensure
relevancy
n Issue 6 to 10 solicitations
n Contract 40 projects
n Leverage $20 millioninto New York, helpbuild a knowledge-basedresearch infrastructure inNew York
5 to 10
Achieved July 1, 2006 throughJune 30, 2009
One planning meeting was held with theEMEP advisors, and three other majorresearch planning meetings were held toassist in plan development. All of theattendees at the planning meetings werestate or nationally recognized experts fromthe policy and scientific communities.NYSERDA contracted with the New YorkAcademy of Sciences to assist in thedevelopment of the research plan, whichwas finalized and released in September2007.
The Alternative Energy section was updatedin April 2008, with details discussing theimpacts of wind power development onwildlife in New York State.
Eight solicitations have been issued thatincluded EMEP funding (focusing onsequestration, impacts of renewable energy,ecosystems, air quality, and climatechange).
47 projects have been contracted.leveraging over $8.5 million in outside co-funding.
EMEP co-sponsored three workshops on thecreation of a soil-monitoring network in theNortheast.
EMEP hosted a seminar (and "webinar") formultiple agency staff on recent findingsfrom the Intergovernmental Panel onClimate Change with IPCC member Dr.Cynthia Rosenzweig.
EMEP sponsored three AdirondackResearch Consortium conferences.
EMEP co-sponsored a conference onclimate change at MIT's Endicott House.
EMEP hosted its two-day biennialconference on Linking Science and Policyat the Albany Marriott.
% of GoalAchieved
N/A
80-100% ofsolicitation goal
>100%70 ofprojects goal
43% ofleveraged funds
goal
>100%
5-12
Environmental Monitoring, Evaluation, and Protection (EMEP)
Program Goals (July 1,Achieved July 1, 2006 through % of Goal
Activity 2006 through June 30,June 30, 2009 Achieved
2011)
Co-sponsored a workshop at ColumbiaUniversity on offshore carbon sequestration.
Co-sponsored the America Response toClimate Change conference held in TupperLake in June 2008.
Co-sponsored an Emissions InventoryWorkshop in November 2008.
Provide web-based EMEP 200,000 total customer During this period, there were nearlydata and information visits, inquiries, and 160,000 hits on EMEP websites, bringing
>100%downloads to the EMEP total hits on EMEP sites to over 317,000
website and total downloads to more than 63,000.
Publish NYSERDA 40 18 research reports and five summaryresearch reports communications were published, including
a study of options for the design of the58%
emission allowance auction under theRegional Greenhouse Gas Initiative(RGGI).
Publish peer-reviewed 100 18 articles were published in the area of Airjournal articles Quality/Health Effects, 39 articles were
published in the area of Ecosystems, one59%
article was published in the area of ClimateChange, and one article was published inthe area of Crosscutting Research.
Provide briefings to 15 Held two day-long sessions fordecision makers environmental stakeholders on EMEP's and
NYSERDA's activities.
Sponsored a meeting with policymakersconcerning wind and wildlife.
Briefed the new Department ofEnvironmental Conservation (DEC)Climate Change Program Director onEMEP program activities.
Arranged for a briefing to DEC staff oncarbonaceous fine particle issues in New 60%York and the region.
Briefed NYSDOT's climate change and
energy efficiency team on the EMEPprogram's climate change activities.
Gave two briefings to NYSDEC and theGovernor's Office regarding the resultsfrom the Environmental Impacts of LiquidBiofuels project.
Briefed the ISO-NE EnvironmentalAdvisory Group on multi-pollutant policy.
5-13

Research and Development Programs
5.10 Industrial Process and Product Innovation Program
5.10.1 Progress Toward Goals
IPPI offers funding for projects that result in energy benefits to New York's industrial sector. Theprogram attracts a wide range of projects that make industrial processes better, faster, and cheaper;strengthening New York's economy. Although the projects are diverse, a common theme at this time isthe development of processes that fabricate ceramic and composite materials faster and are less energyintensive. Examples include microwave curing, laser-assisted chemical vapor deposition, processintensification, and laser machining. Projects funded through the program target energy saving duringprocessing as well as products that save energy such as light-weight composites applicable to thetransportation industry. For example, Rensselaer Polytechnic Institute is working with a firm to develop afaster and more energy-efficient forming process to make carbon-fiber aeronautical composites.
Table 5-14 shows long-term goals and progress for the Industrial Process and Product Innovation (IPPI)Program. The Program is making excellent progress with regard to the first goal. The second and thirdgoals are being monitored over the longer-term.
Table 5-14. Industrial Process and Product Innovation Program - Goals andAchievements
Program GoalsAchieved from July 1, 2006 through June 30, % of Goal
Activity (July 1, 2006 through2009 Achieved
June 30, 2011)
Issue annual Fund 30 to 40 cost-shared 56 projects approved for funding, 29 under contract.100%
solicitations projects
Conduct technology transfer andoutreach activities to broadenthe acceptance of successful
Technology technologies and technical This ongoing activity usually occurs near the end ofNot
transfer approaches via participation in a project; no projects have been completed for thisapplicable
at least two workshops new program.
Publish at least six final reportsper year
Industrial Process andProductivity Improvement(IPPI) projects supported during Projects are being contracted with requirements for
Program metricsthe SBC III period are expected documentation of performance metrics. Projects Notto result in-cumulative energy have not yet been completed; therefore, metrics applicablesavings of $5 million, and cannot be ascertained at this time.project-related incremental salesof $10 million
5-14
As shown in Table 5-15, 56 projects (from various NYSERDA solicitations) have been approved forfunding. At this time, 29 projects have signed contracts.
Table 5-15. Status of IPPI Projects by Solicitation
Number Number of SBC- Number of Signed Number of
Proposals s fundedContracts Completed Projects
Received Projects Approved
PON 998: Industrial Process & 42 II * 6 0Productivity Improvement
PON 1130: Industrial Research, 62 13 13 0Development and Demonstration
PON 1190: Industrial Process & 79 15 9 0Product Innovation
PON 1206: Data Center and Server 26 2 0 0Efficiency
PON 1236: Energy Productivity in 24 3 0 0Innovative Local Food ProductionSystems
PON 1276: Industrial Process and 47 11 0 0Product Innovation
Other** I I I I
Total 280 56 29 1
*Five projects were terminated after NYSERDA approval.** Represents one purchase order for Agriculture Worksheets.
Shown in Table 5-16 is a distribution of contracted projects by type.
Table 5-16. IPPI Contracts by Project Type
Number of Projects Contracted(Since July 2006)
Funds Awarded
($ million)
Research Studies (feasibility studies, market assessments,etc.)
10 $0.986
Process Improvement 10 $5.002
Product Development 8 $2.247
Other (Technology Transfer) 1 $0.012
Total 29 $8.259
5-15
Research and Development Programs
5.11 Municipal Water and Wastewater Efficiency
There are 20 contracted SBC-funded water and wastewater projects. These 20 projects were derived fromnine solicitations, developed jointly by NYSERDA's R&D and EES staffs, as follows:
• Six of the nine solicitations were PONs that solicited proposals to demonstrate and evaluateinnovative or underused energy-efficient water and wastewater technologies.
• The seventh solicitation was an RFP that solicited proposals to demonstrate real-time monitoringof energy and environmental performance at wastewater treatment plants, with the goal ofattracting the energy service sector to the municipal wastewater market.
The eighth solicitation was an RFP that solicited proposals to benchmark energy use and evaluatethe potential for energy efficiency and energy production improvements in the sector.
The ninth solicitation was a PON to establish the Energy Smart Focus on municipal water andwastewater.
NYSERDA's Technical Assistance (TA) Program has served municipal water and wastewatercustomers since 1997, including 84 site-specific analyses, and municipal water and wastewatercustomers are eligible to participate in the Existing Facilities program.
5.11.1 Recent Program Accomplishments
Several long-term goals have been set for the Municipal Water and Wastewater Efficiency Program.These five-year goals and progress are shown in Table 5-17. The Program is making good progresstoward all of its long-term goals.
Table 5-17. Municipal Water and Wastewater Efficiency Program Goals achieved fromJuly 1, 2006 through June 30, 2009
Activity Program Goals (July 1, 2006 through June 30, 2011)A% of GoalAchieved
Select and fund 25 or more projects
Issue annual solicitation Provide assistance to a minimum of 25 municipal wastewater and water 24%
treatment facilities in New York
Achievements from July 1, 2006 through June 30, 2009
PON 1040 was issued and 17 proposals were received requesting $3.9 million in NYSERDA funding. In total, five projects weredeveloped from the solicitation; two using SBC funds. The two SBC-funded projects directly affect three facilities in the nearterm.
PON 1 171 was issued and a total of 27 proposals were received requesting $7.2 million in NYSERDA funding. Four projectswere funded with SBC 3 monies. The four SBC-funded projects selected from the first round directly affect three facilities in thenear term.
Projects recommended for funding come from proposals received in response to the annual solicitation. One goal of thesolicitation is that all projects selected ultimately produce results with widespread applicability to the municipal wastewater andwater sector in New York; this is referred to as "long term assistance". The six SBC-funded projects are ultimately anticipated toprovide long term assistance to multiple municipal wastewater and water treatment facilities in New York.
Provide critical information on ways to optimize energy use at municipalwastewater and water treatment facilities
Technology transfer 100%%Provide information to 1,000 individuals serving the municipal wastewater andwater treatment sector in New York
5-16

Municipal Water and Wastewater Efficiency
ActivityJ
Program Goals (July 1, 2006 through June 30, 2011)% of GoalAchieved
Achievements from July 2006 - December 2006
Four presentations were given throughout the State as part of the NY Co-funding for Water and Sewer Infrastructure conferences.The total attendance for the four conferences was approximately 300 individuals.
A presentation was given as part of a webcast hosted by the Comptroller's Office.
An energy management training conference was co-developed with Global Energy Partners (an offshoot of EPRI) and the NewYork Water Environment Association (NYWEA). Approximately 70 individuals (municipal operators and elected officials,consultants, engineers) attended the two-day session held in Cooperstown in November.
Achievements from January 2007 - December 2007
The submetering and evaluation of 20 wastewater treatment plants were completed. The final site reports and summaries offindings were posted online.
Four presentations were given throughout the State as part of the NY Co-funding for Water and Sewer Infrastructure conferences.The total attendance for the four conferences was approximately 300 individuals.
An Energy Management issue of Clearwaters (published by NYWEA) was developed. NYWEA is the NYS chapter of thenation's premier professional organization for the wastewater treatment profession (Water Environment Federation). The EnergyManagement issue will be published in spring.
Achievements from January 2008 - December 2008
Ten presentations were given to diverse audiences: three to Congresswoman Gillebrand's constituency, one at the annualNYWEA conference in NYC, one to local elected officials in White Plains, one at the NY section AWWA spring meeting; one aspart of the Genesee/Finger Lakes Regional Planning Commission's summer conference; one as part of the Adirondack ResearchConsortium annual meeting; one during the NYWEA spring meeting; and one at the national AWWA conference. In total,approximately 550 individuals attended the presentations.
The Energy Management issue of Cleat-waters (developed by NYSERDA) was published.
An article titled "Supporting the Sustainability of Municipal Water Treatment Assets through Energy Efficiency" was publishedin the winter issue of Cleat-waters, which was devoted to sustainable infrastructure.
Achievements from January 2009 - June 30, 2009
A presentation was given at the Greater Buffalo Environmental Conference, which was sponsored by the Western NY Section ofNYWEA. The meeting was attended by approximately 120 individuals.
Achievements On-point
The Energy Smart Focus program is providing customized services to support energy efficiency in the sector. The programoffers outreach materials and training to individuals associated with the sector statewide.
Energy and cost savings $2-3 million per year See Section 5.1 1.3
Technical Assistance Develop, review and approve 30 projects 40%
July 2006 - December 2007
Five projects were approved to begin work totaling $1 12K in NYSERDA funds. Five projects totaling $63K in NYSERDAfunds were completed.
January 2008 - December 2008
Four projects were approved to begin work totaling $74K in NYSERDA funds. Four projects totaling approximately $81 K inNYSERDA funds were completed.
January 2009 - June 30, 2009
Three projects were approved to begin work totaling $87.6K in NYSERDA funds.
5-17
Research and Development Programs
5.11.2 Long-Term Program Accomplishments
Since July 1, 2006, $4.64 million has been committed under the targeted water and wastewater initiative.An additional $1.428 million has been awarded for municipal water/wastewater projects under the TAProgram. Table 5-18 summarizes the funding status of the programs.
Table 5-18. Project and Funding Status through June 30, 20091
Number of Projects Funds Awarded Co-funding ($Approved ($ million) million)
RFP 769 Energy Efficiency Improvements at 1 $0.13 $0.05Water & Wastewater Treatment Plants
RFP 601 (Submetering) 2 2 $1.1 $0.4
Demonstration Projects (569, 786, 857, 935, 16 $2.99 $4.091040, 1171)
Technical Assistance 3 84 $1.428 $1.428
Technology Transfer 1 $0.1 $0.1
Table does not include metrics on the Energy Smart Focus PON2 Funded in part under the general Technical Assistance Programi
Funded under the general Technical Assistance Program
5.11.3 Program Impact Evaluation
Energy Savings
On average, these projects take five to seven years from conception to implementation. However, onceimplementation is complete, the projects should lead to nearly 45,940 MWh of electricity savings and15,803 kW of peak demand reduction. Depending on the effectiveness of information dissemination fromknowledge created, the potential exists for substantial MWh savings and demand reductions due toreplication across the broader New York municipal water/wastewater market sector.
5.12 Next Generation and Emerging Technologies
5.12.1 Progress Toward Goals
Several long-term goals have been set for the Next Generation and Emerging Technologies Program.These five-year goals and progress are shown in Table 5-19. Overall, the Program is making goodprogress toward achieving its long-term goals.
5-18

Next Generation and Emerging Technologies
Table 5-19. Next Generation and Emerging Technologies Program - Goals andAchievements
ActivityProgram Goals
(July 1, 2006 through June 30, 2011)% of Goal Achieved
Advanced Building ProgramTwo solicitations
Two or more demonstration test beds
>100% of solicitations goal
>100% of demo beds goal
Achievements (July 1, 2006 through June 30, 2009)
Seven solicitations completed and two new solicitations have been released in 2009. PON 1232 Emerging Insulation Practicesfor Existing Residential Buildings Pilot and PON 1294 Emerging Technologies for Residential Buildings were both released inSpring 2009.
Twenty projects are contracted consisting of six feasibility studies, eight product development projects, and six demonstrations.
----------------------------------------------------------------------------------------------------------------------------------------------------------------------------------
RFP 1032 Reference Design Guidebook. This project identified incremental measures needed to raise energy performance ofnew residential construction. The final report was submitted in October 2007.
PON 1062 Advanced Building Envelopes and Energy Systems. Proof of concept is complete for one project; continued workwill be funded under PON 1215. Both projects are completed, submission of final report pending.
PON 1 126 Next Generation Technologies for Residential Buildings. Two rounds of solicitations have been completed and sevenprojects from the first round are underway. Under round two, only one project is SBC funded and work is underway. Theprojects will develop and demonstrate technologies that reduce air conditioning loads, on-site power production systems, designstrategies for reducing electric load, and other energy efficient technologies.
PON 1096 Demonstration of High Performance Residential Homes. Four teams were formed to design, build, and demonstrateas many as 25 high-performance residential homes illustrating the importance of tight building envelopes and improving on-siteconstruction practices. Eight houses have been built to date; seven are in the process of being built.
PON 1215 Next Generation and Emerging Technologies for Residential Buildings. Under round one, four projects are underway.Under round two, three projects are in the contracting stage, one project is underway.
PON 1232 Emerging Insulation Practices for Existing Residential Buildings Pilot was released in spring 2009 with a due date inJuly.
PON 1294 Emerging Technologies for Residential Buildings was released in spring 2009. Under round one. 14 proposals werereceived with a total requested funding of $3 million.
This program has explored advanced building systems with areas of focus such as whole-house ventilation, compression-less airconditioning, window improvements, and micro-CHP.
5-19

Research and Development Programs
ActivityProgram Goals % of Goal Achieved
(July 1, 2006 through June 30, 2011)
50-100 design assistance projects 10-20% of the design
Daylighting Applications Five daylighting implementations in assistance goal
buildings 20% of the daylighting goal
Achievements (July 1, 2006 through June 301, 2009)
Ten clients have received daylighting design assistance services.
One daylighting implementation project is underway.
PON 1079: Daylight Technical Services, Training and Demonstrations. All five contracts have been signed and work isunderway.
RFP 1068: Establishment of a Lighting Incubator Center to Support Lighting Start-up Companies in New York. The office forthe Lighting Green House incubator has been established at STEP. Business assistance work is underway.
PON 1122: Innovation in Lighting: New Products, Demonstrations, and Testing: all five contracts have been signed and work isunderway. Release of a new PON is pending due to lack of available funds.
PON 1207: Solid State Lighting Research and Demonstration was released for the first time. Six projects were selected forfunding; all are in the contract negotiation stage..
Two solicitations50% of the solicitations goal
Solar Thermal Applications >20% of the goal forFive demonstrations
demonstration projects
Achievements (July 1, 2006 through June 30, 2009)
One solicitation is completed. Solar Thermal applications may continue to be funded under EEPS. Development of a newsolicitation is on hold until a decision has been made. One demonstration project is under contract.
PON 1085 - Solar Thermal Demonstrations. Six contracts are signed; three are being negotiated. Eight of the nine projects aredemonstrations focusing on combinations of solar thermal collectors, radiant floor heating systems, and storage. Five out of 12systems have been installed. One out of nine projects is SBC funded.
5-20

Next Generation and Emerging Technologies
ActivityProgram Goals
(July 1, 2006 through June 30, 2011)% of Goal Achieved
Emerging TechnologiesFive solicitations
25 product development projects
>100% of the solicitations goal
80% of the projects goal
Achievements (July 1, 2006 through June 30, 2009)
Nine solicitations completed to date. Two rounds completed under PON 1105, and one round out of two is completed forPON 1031, PON 1164, and PON 1206. A continuation of the Next Generation Emerging Technologies solicitation (PON 1105)
is expected to be released in Fall 2009.
Twenty product development projects underway.
PON 1 105 Next Generation Emerging Technologies: Under Round One, nine contracts are signed and work is underway. UnderRound Two, five contracts are signed, and four contracts are in negotiation.
PON 1031: Advanced Sensors & Controls for Energy Management, Power Quality & Electricity System Reliability. Underround one, five contracts are signed, two are under negotiation.
PON 1164: Advanced Sensors and Controls for Building and Industrial Applications. Under round one, two contracts areunderway. Under round two, two projects are in the contract negotiation stage, and one project is underway.
PON 1206: Data Centers & Server Efficiency was released for the first time. Under round one, Two projects are underway: twoare in the contract negotiation stage. Under round two, four projects were selected for funding: all are in the contract negotiationstage.
This program has funded a wide variety of product development and demonstration of end-use technologies including thermo-photovoltaic applications, micro-CHP, solid cooper rotor electric motors, high-efficiency billboard displays, and solar thermal airconditioning.
5-21
APPENDIX A
This appendix provides a compilation of quarterly narrative and numeric progress updates required by theDepartment of Public Service in their June 29, 2009 Energy Efficiency Program Information ReportingManual.' The appendix focuses on NYSERDA's five Fast Track EEPS programs. Numeric progressupdates were also filed with DPS, as required, in spreadsheet form, but are organized here in table formatfor ease of review by other parties.
New Construction Program
Program Description and Background
Program Status
Program Performance Goals
(a) Describe and discuss circumstances that may haveperformance goals (positive or negative).
an impact on the achievement of project
• The State and national economies have experienced a dramatic downturn in the time since the2007 NYSERDA Fast Track proposal to the June 23, 2008 Order and to the March 13, 2009Supplemental Revision to the SBC Operating Plan.
Newly planned or accelerated upgrades to New York City, New York State and federal energy
codes, standards, regulations and executive orders have been identified since the 2007
NYSERDA Fast Track proposal, the June 23, 2008 Order and the March 13, 2009 Supplemental
Revision to the SBC Operating Plan.
(b) Describe and discuss other key aspects of program performance goals that were not discussed in (a).
None to report.
New York Department of Public Service, Energy Efficiency Program Information Reporting Manual, June, 29, 2009.
A-I

Appendix A
(c) Provide updates to the forecast of net energy and demand impacts. The forecast should be updated atleast annually. Note and explain any discrepancies between the filed program goal and the latest forecast.
Program Implementation Activities
(a) Marketing Activities
None to report.
(b) Evaluation Activities
• NYSERDA has worked with DPS Staff and their evaluation advisor consultant to addresscomments on the detailed evaluation plan for this program. NYSERDA submitted a final detailedevaluation plan to DPS on July 15, 2009 and is awaiting approval.
(c) Other Activities
None to report.
Customer Complaints and/or Disputes
None to report.
Changes to Subcontractors or Staffing
None to report.
Additional Issues
None to report.
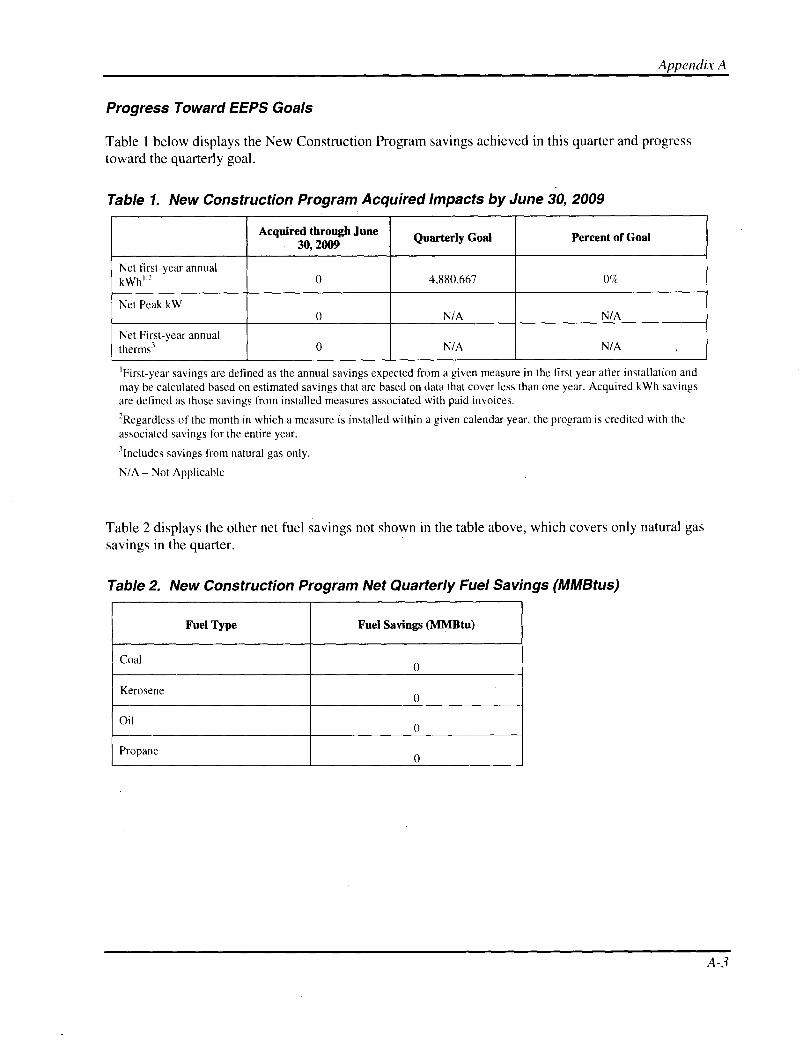
Appendix A
Progress Toward EEPS Goals
Table 1 below displays the New Construction Program savings achieved in this quarter and progresstoward the quarterly goal.
Table 1. New Construction Program Acquired Impacts by June 30, 2009
Acquired through JuneQuarterly Goal Percent of Goal
30, 2009
Net first-year annualkWh 1' 0 4,880,667 0%
Net Peak kW0 N/A N/A
Net First-year annualtherms; 0 N/A N/A
'First-year savings are defined as the annual savings expected from a given measure in the first year after installation andmay be calculated based on estimated savings that are based on data that cover less than one year. Acquired kWh savingsare defined as those savings from installed measures associated with paid invoices.
2Regardless of the month in which a measure is installed within a given calendar year, the program is credited with theassociated savings for the entire year.
3Includes savings from natural gas only.
N/A - Not Applicable
Table 2 displays the other net fuel savings not shown in the table above, which covers only natural gassavings in the quarter.
Table 2. New Construction Program Net Quarterly Fuel Savings (MMBtus)
Fuel Type Fuel Savings (MMBtu)
Coal0
Kerosene0
Oil0
Propane0
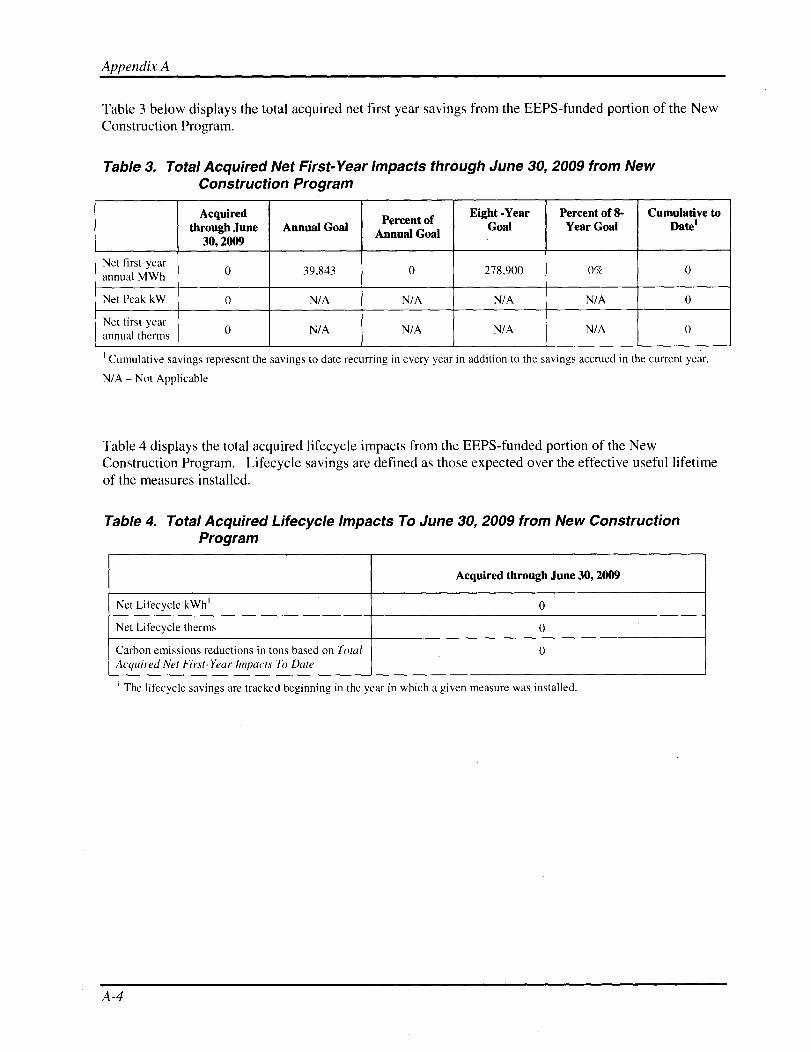
Appendix A
Table 3 below displays the total acquired net first year savings from the EEPS-funded portion of the NewConstruction Program.
Table 3. Total Acquired Net First-Year Impacts through June 30, 2009 from NewConstruction Program
Acquired Eight -Year Percent of 8- Cumulative tothrough June Annual Goal
Percent of Goal Year Goal Date'30, 2009
Annual Goal
Net first-yearannual MWh 0 39,843 0 278,900 0% 0
Net Peak kW 0 N/A N/A N/A N/A 0
Net first-yearannual therms 0 N/A N/A N/A N/A 0
1 Cumulative savings represent the savings to date recurring in every year in addition to the savings accrued in the current year.
N/A - Not Applicable
Table 4 displays the total acquired lifecycle impacts from the EEPS-funded portion of the NewConstruction Program. Lifecycle savings are defined as those expected over the effective useful lifetimeof the measures installed.
Table 4. Total Acquired Lifecycle Impacts To June 30, 2009 from New ConstructionProgram
Acquired through June 30, 2009
Net Lifecycle kWh' 0
Net Lifecycle therms 0
Carbon emissions reductions in tons based on TotalAcquired Net First- Year Impacts To Date
0
The lifecycle savings are tracked beginning in the year in which a given measure was installed.
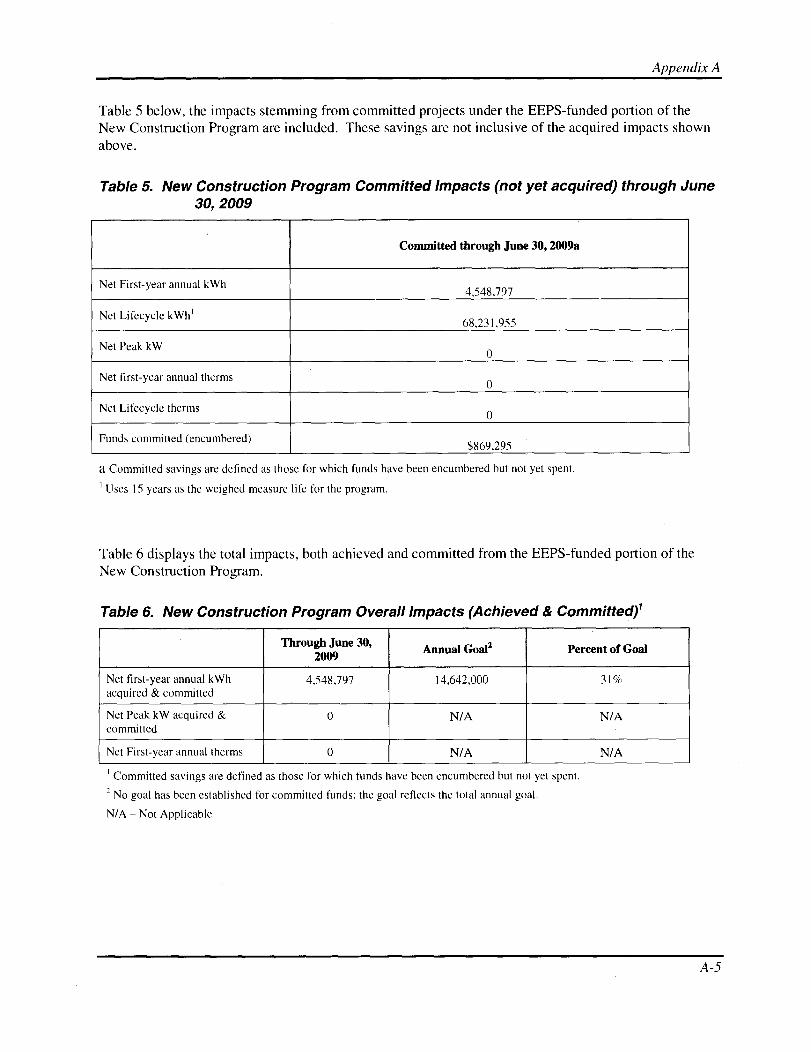
Appendix A
Table 5 below, the impacts stemming from committed projects under the EEPS-funded portion of theNew Construction Program are included. These savings are not inclusive of the acquired impacts shownabove.
Table 5. New Construction Program Committed Impacts (not yet acquired) through June30, 2009
Committed through June 30,2009a
Net First-year annual kWh4,548,797
Net Lifecycle kWh'68,231, 955
Net Peak kW0
Net first-year annual therms 0
Net Lifecycle therms0
Funds committed (encumbered)$869,295
a Committed savings are defined as those for which funds have been encumbered but not yet spent.
1 Uses 15 years as the weighed measure life for the program.
Table 6 displays the total impacts, both achieved and committed from the EEPS-funded portion of theNew Construction Program.
Table 6. New Construction Program Overall Impacts (Achieved & Committed)'
Through June 30, Annual Goal2 Percent of Goal2009
Net first-year annual kWh 4,548,797 14,642,000 31%acquired & committed
Net Peak kW acquired & 0 N/A N/Acommitted
Net First-year annual therms 0 N/A N/A
Committed savings are defined as those for which funds have been encumbered but not yet spent.2 No goal has been established for committed funds; the goal reflects the total annual goal.
N/A - Not Applicable
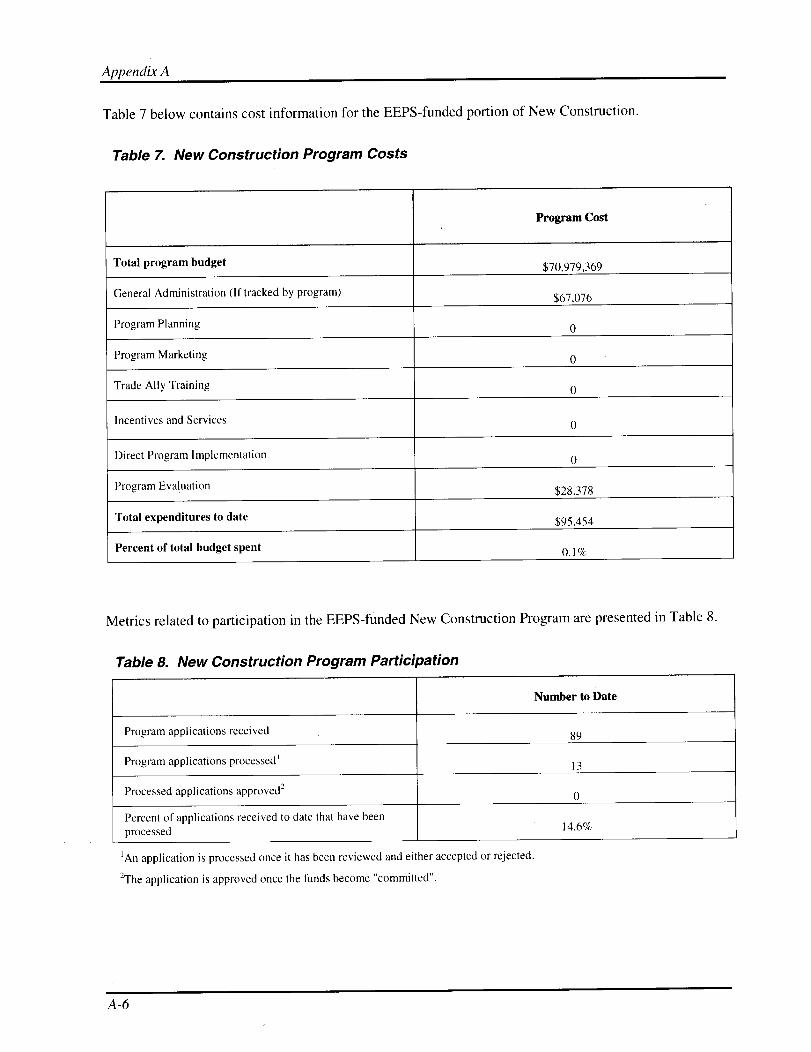
Appendix A
Table 7 below contains cost information for the EEPS-funded portion of New Construction.
Table 7. New Construction Program Costs
Program Cost
Total program budget $70,979,369
General Administration (If tracked by program) $67,076
Program Planning 0
Program Marketing 0
Trade Ally Training 0
Incentives and Services 0
Direct Program Implementation 0
Program Evaluation $28,378
Total expenditures to date $95,454
Percent of total budget spent 0.1%
Metrics related to participation in the EEPS-funded New Construction Program are presented in Table 8.
Table 8. New Construction Program Participation
Number to Date
Program applications received 89
Program applications processed' 13
Processed applications approved2 0
Percent of applications received to date that have beenprocessed 14.6%
'An application is processed once it has been reviewed and either accepted or rejected.
2The application is approved once the funds become "committed".
Appendix A
FLEX TECH PROGRAM
Program Description and Background
Program Status
Program Performance Goals
(a) Describe and discuss circumstances that may have an impact on the achievement of projectperformance goals (positive or negative).
• The State and national economies have experienced a dramatic downturn in the time period fromthe 2007 NYSERDA. Fast Track proposal, to the June 23, 2008 Order, and to the March 13, 2009Supplemental Revision to the SBC Operating Plan.
(b) Describe and discuss other key aspects of program performance goals that were not discussed in (a).
N/A
(c) Provide updates to the forecast of net energy and demand impacts. The forecast should be updated atleast annually. Note and explain any discrepancies between the filed program goal and the latest forecast.
N/A

Appendix A
Program Implementation Activities
(a) Marketing Activities
The following are highlights of Outreach activities conducted:
• On April 16, 2009, held a FlexTech Consultant information session in Buffalo, NY to update theconsultants on NYSERDA Programs and receive feedback on the FlexTech program and outreachapproach.
• Initiated development of a top 50 customer hit list for key sectors starting with healthcare andcolleges and universities. The Industrial and Process Efficiency Outreach is already addressingthese sectors for FlexTech and process efficiency. The goal is to engage customers and facilitateparticipation in FlexTech and other SBC/EEPS Programs.
(b) Evaluation Activities
• NYSERDA is currently working with DPS Staff and their evaluation advisor consultant toaddress comments on the detailed evaluation plan for this program. The evaluation willcommence upon receiving approval of the final plan from DPS.
(c) Other Activities
• On June 22, 2009, received 63 proposals for the Flexible Technical Assistance Services(FlexTech) Program for Consolidated Edison Company of New York, Inc. and Orange andRockland Utilities, Inc. Electric and Gas Service Territories.
Customer Complaints and/or Disputes
None to report.
Changes to Subcontractors or Staffing
None to report.
Additional Issues
None to report.

Appendix A
Progress Toward EEPS Goals
Table 9 below displays the Flex Tech / Technical Assistance Program savings achieved in this quarter andprogress toward the quarterly goal.
Table 9. Quarterly Flex Tech / Technical Assistance Program Acquired Impacts by June30, 2009
Acquired through June Quarterly Goal Percent of Goal30, 2009
Net first-year annual 0 1,962,667 0kWh1.2
Net Peak kW 0 N/A N/A
Net First-year annual 0 N/A N/Atherms;
1 First-year savings are defined as the annual savings expected from a given measure in the first year after installationand may be calculated based on estimated savings that cover less than one year. Acquired kWh savings are defined assavings from measures recommended in completed studies.
2 Regardless of the month in which a measure is installed within a given calendar year, the program is credited with theassociated savings for the entire year.
3 Includes savings from natural gas only.
N/A - Not Applicable
Table 10 displays the other net fuel savings not shown in the table above, which covers only natural gassavings in the quarter.
Table 10. Flex Tech / Technical Assistance Program Net Quarterly Fuel Savings(MMBtus)
Fuel Type Fuel Savings (MMBtu)
Coal 0
Kerosene 0
Oil 0
Propane 0
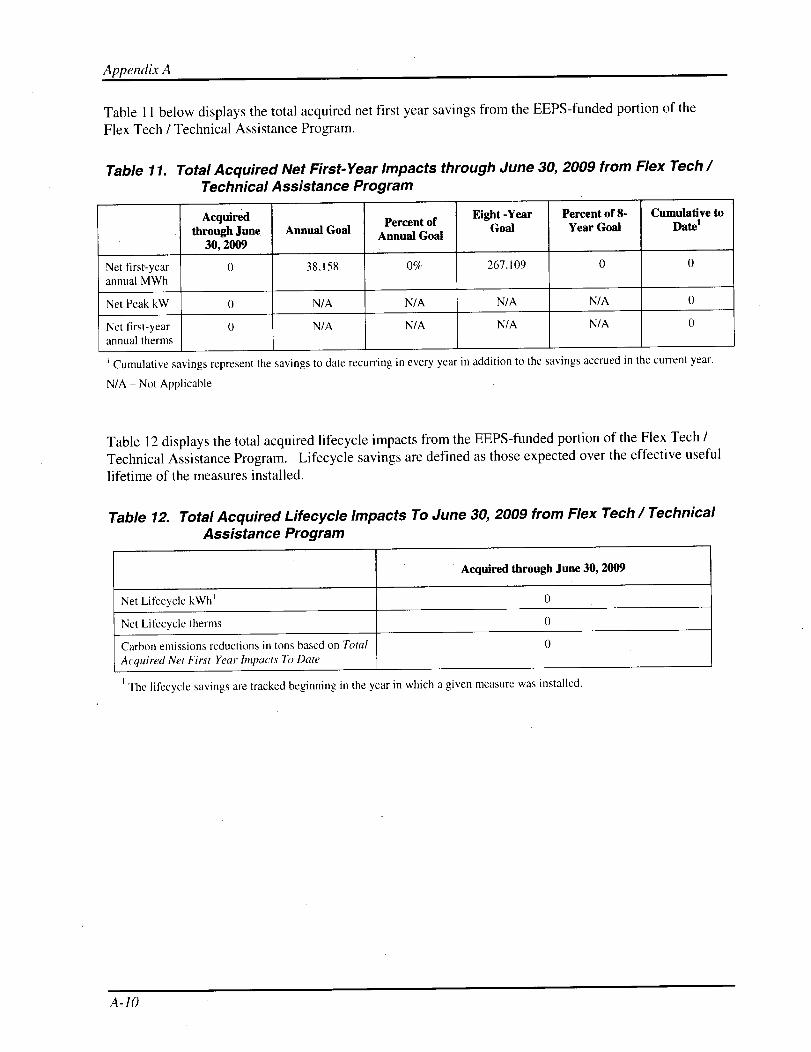
Appendix A
Table 11 below displays the total acquired net first year savings from the EEPS-funded portion of theFlex Tech / Technical Assistance Program.
Table 11. Total Acquired Net First-Year Impacts through June 30, 2009 from Flex Tech /Technical Assistance Program
Acquired fP tEight -Year Percent of 8- Cumulative to
'through June Annual Goalercen o
Annual GoalGoal Year Goal Date
30, 2009
Net first-year 0 38,158 0% 267,109 0 0
annual MWh
Net Peak kW 0 N/A N/A N/A N/A 0
Net first-year 0 N/A N/A N/A N/A 0
annual therms
1 Cumulative savings represent the savings to date recurring in every year in addition to the savings accrued in the current year.
N/A - Not Applicable
Table 12 displays the total acquired lifecycle impacts from the EEPS-funded portion of the Flex Tech /
Technical Assistance Program. Lifecycle savings are defined as those expected over the effective useful
lifetime of the measures installed.
Table 12. Total Acquired Lifecycle Impacts To June 30, 2009 from Flex Tech / TechnicalAssistance Program
Acquired through June 30, 2009
Net Lifecycle kWh' 0
Net Lifecycle therms 0
Carbon emissions reductions in tons based on TotalAcquired Net First-Year Impacts To Date
0
The lifecycle savings are tracked beginning in the year in which a given measure was installed.
A-10
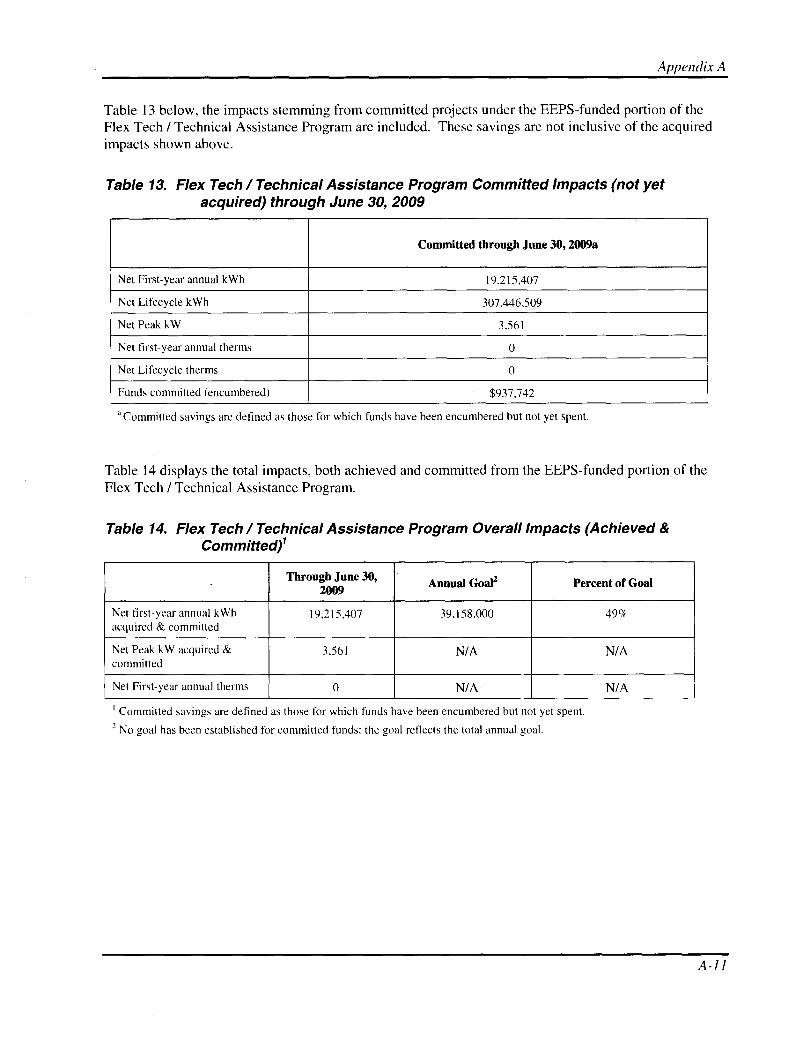
Appendix A
Table 13 below, the impacts stemming from committed projects under the EEPS-funded portion of theFlex Tech / Technical Assistance Program are included. These savings are not inclusive of the acquiredimpacts shown above.
Table 13. Flex Tech / Technical Assistance Program Committed Impacts (not yetacquired) through June 30, 2009
Committed through June 30,2009a
Net First-year annual kWh 19,215,407
Net Lifecycle kWh 307,446,509
Net Peak kW 3,561
Net first-year annual therms 0
Net Lifecycle therms 0
Funds committed (encumbered) $937,742
Committed savings are defined as those for which funds have been encumbered but not yet spent.
Table 14 displays the total impacts, both achieved and committed from the EEPS-funded portion of theFlex Tech / Technical Assistance Program.
Table 14. Flex Tech / Technical Assistance Program Overall Impacts (Achieved &Committed)'
Through June 30,Annual GoaP Percent of Goal
2009
Net first-year annual kWh 19,215,407 39,158,000 49%acquired & committed
Net Peak kW acquired & 3,561 N/A N/Acommitted
Net First-year annual therms 0 N/A N/A
1 Committed savings are defined as those for which funds have been encumbered but not yet spent.
2 No goal has been established for committed funds; the goal reflects the total annual goal.
A-I1
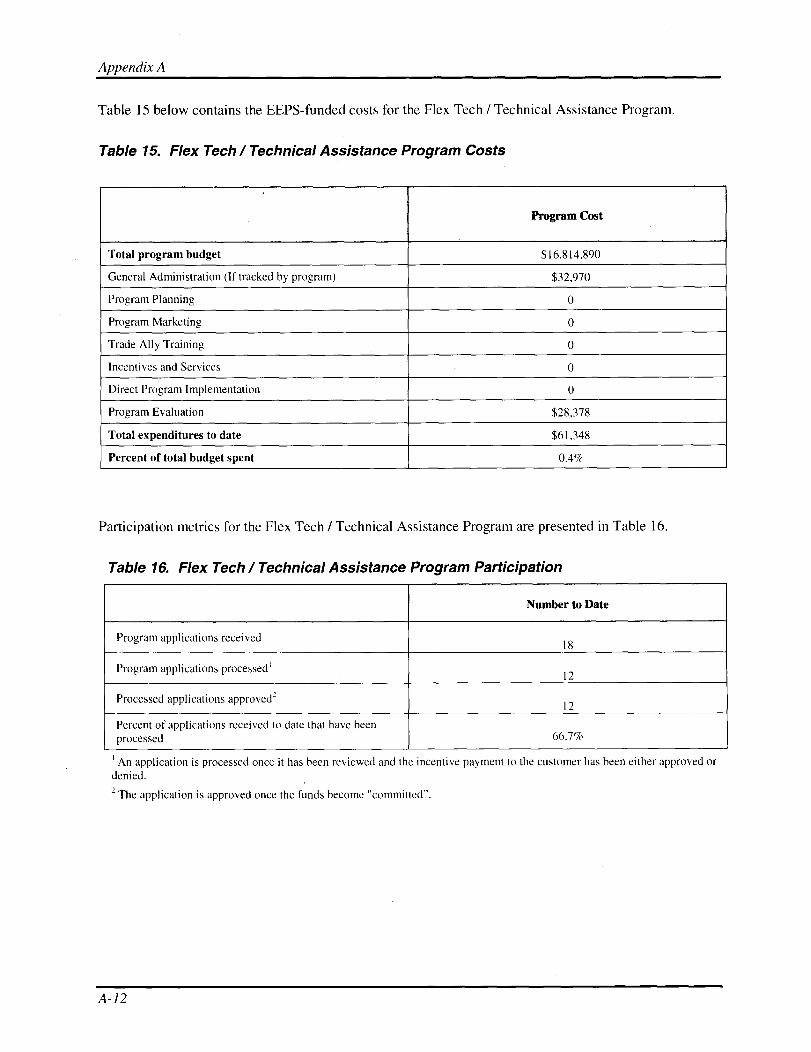
Appendix A
Table 15 below contains the EEPS-funded costs for the Flex Tech / Technical Assistance Program.
Table 15. Flex Tech / Technical Assistance Program Costs
Program Cost
Total program budget $16,814,890
General Administration (If tracked by program) $32,970
Program Planning 0
Program Marketing 0
Trade Ally Training 0
Incentives and Services 0
Direct Program Implementation 0
Program Evaluation $28,378
Total expenditures to date $61,348
Percent of total budget spent 0.4%
Participation metrics for the Flex Tech / Technical Assistance Program are presented in Table 16.
Table 16. Flex Tech / Technical Assistance Program Participation
Number to Date
Program applications received18
Program applications processed'12
Processed applications approved212
Percent of applications received to date that have beenprocessed 66.7%
1 An application is processed once it has been reviewed and the incentive payment to the customer has been either approved ordenied.2 The application is approved once the funds become "committed".
A-12

Appendix A
Industrial and Process Efficiency Program
Program Description and Background
Program Status
Program Performance Goals
(a) Describe and discuss circumstances that may have an impact on the achievement of projectperformance goals (positive or negative).
• The State and national economies have experienced a dramatic downturn in the time periodfrom the 2007 NYSERDA Fast Track proposal, to the June 23, 2008 Order, and to the March13, 2009 Supplemental Revision to the SBC Operating Plan.
(b) Describe and discuss other key aspects of program performance goals that were not discussed in (a).
N/A
(c) Provide updates to the forecast of net energy and demand impacts. The forecast should be updated atleast annually. Note and explain any discrepancies between the filed program goal and the latestforecast.
N/A
A-13

Appendix A
Program Implementation Activities
(a) Marketing Activities
The following are highlights of Outreach activities conducted:
• On June 3, 2009, received 15 proposals for the Industrial and Process Efficiency Focuscontractor.
• On April 15, 2009, held a meeting of key data center stakeholders and received feedback onprogram design and outreach approach.
• Developed a continuously improved and updated list of 110 of the largest industrial customers fortargeted outreach and relationship development.
(b) Evaluation Activities
• NYSERDA is currently working with DPS Staff and their evaluation advisor consultant toaddress comments on the detailed evaluation plan for this program. The evaluation willcommence upon receiving approval of the final plan from DPS.
(c) Other Activities
• Established a team of NYSERDA Key Account Managers that have been assigned to focusedrelationship and project development with the Industrial and Process Efficiency customers withthe largest potential opportunity.
Customer Complaints and/or Disputes
None to report.
Changes to Subcontractors or Staffing
None to report.
Additional Issues
None to report.
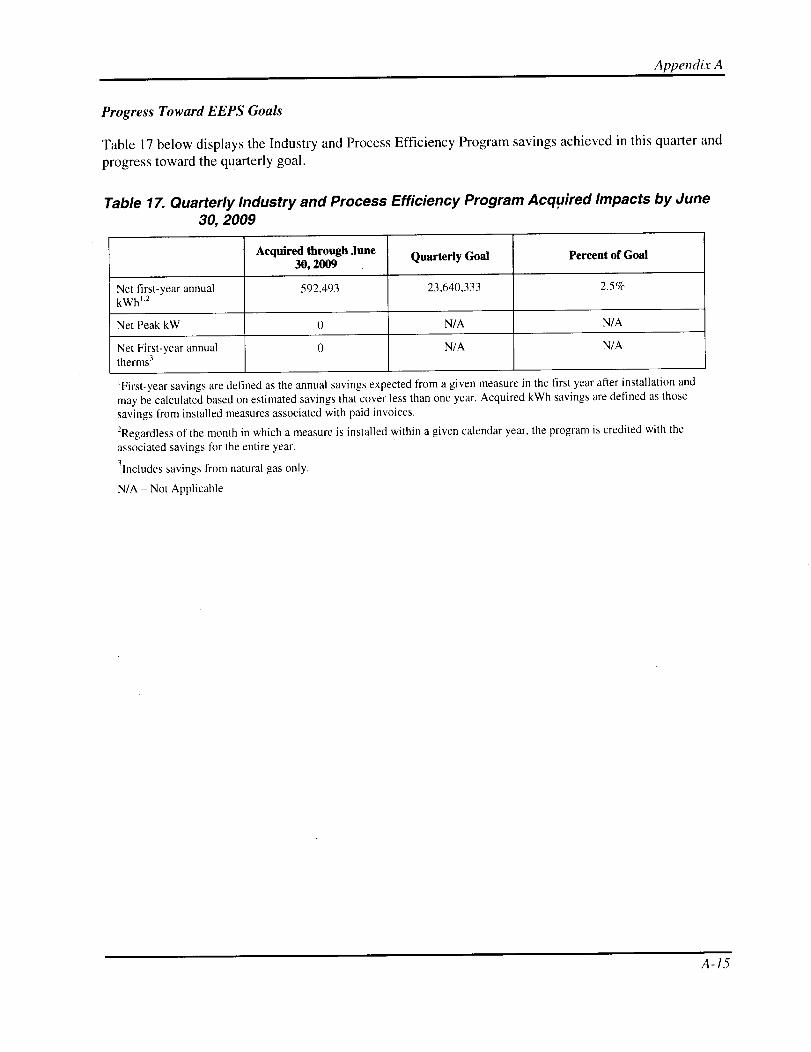
Appendix A
Progress Toward EEPS Goals
Table 17 below displays the Industry and Process Efficiency Program savings achieved in this quarter and
progress toward the quarterly goal.
Table 17. Quarterly Industry and Process Efficiency Program Acquired Impacts by June30, 2009
Acquired through June Quarterly Goal Percent of Goal30, 2009
Net first-year annual 592,493 23,640,333 2.5%
kWh'-'
Net Peak kW 0 N/A N/A
Net First-year annual 0 N/A N/A
therms3
'First-year savings are defined as the annual savings expected from a given measure in the first year after installation andmay be calculated based on estimated savings that cover less than one year. Acquired kWh savings are defined as thosesavings from installed measures associated with paid invoices.
'-Regardless of the month in which a measure is installed within a given calendar year, the program is credited with the
associated savings for the entire year.
3lncludes savings from natural gas only.
N/A - Not Applicable
A-15
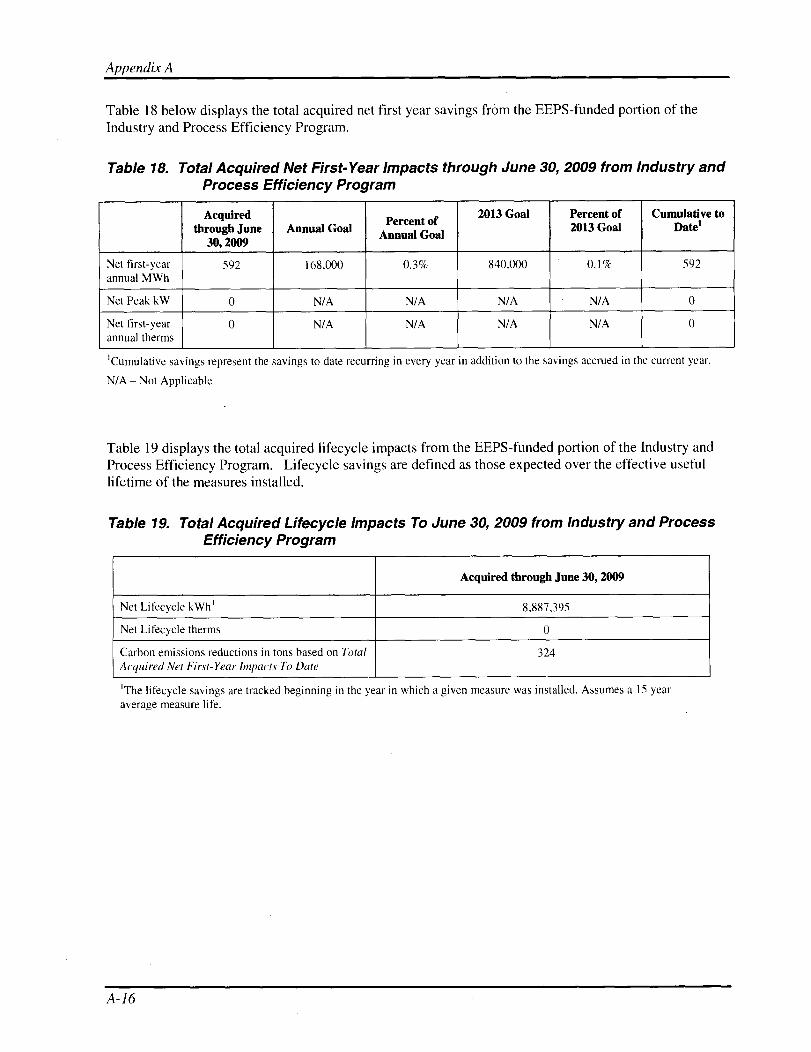
Appendix A
Table 18 below displays the total acquired net first year savings from the EEPS-funded portion of theIndustry and Process Efficiency Program.
Table 18. Total Acquired Net First-Year Impacts through June 30, 2009 from Industry andProcess Efficiency Program
Acquired Percent of2013 Goal Percent of Cumulative to
through June Annual Goal Annual Goal2013 Goal Date'
30, 2009
Net first-year 592 168.000 0.3% 840,000 0.1% 592annual MWh
Net Peak kW 0 N/A N/A N/A N/A 0
Net first-year 0 N/A N/A N/A N/A 0annual therms
Cumulative savings represent the savings to date recurring in every year in addition to the savings accrued in the current year.
N/A - Not Applicable
Table 19 displays the total acquired lifecycle impacts from the EEPS-funded portion of the Industry andProcess Efficiency Program. Lifecycle savings are defined as those expected over the effective usefullifetime of the measures installed.
Table 19. Total Acquired Lifecycle Impacts To June 30, 2009 from Industry and ProcessEfficiency Program
Acquired through June 30, 2009
Net Lifecycle kWh' 8,887,395
Net Lifecycle therms 0
Carbon emissions reductions in tons based on TotalAcquired Net First- Year Impacts To Date
324
'The lifecycle savings are tracked beginning in the year in which a given measure was installed. Assumes a 15 yearaverage measure life.
A-16
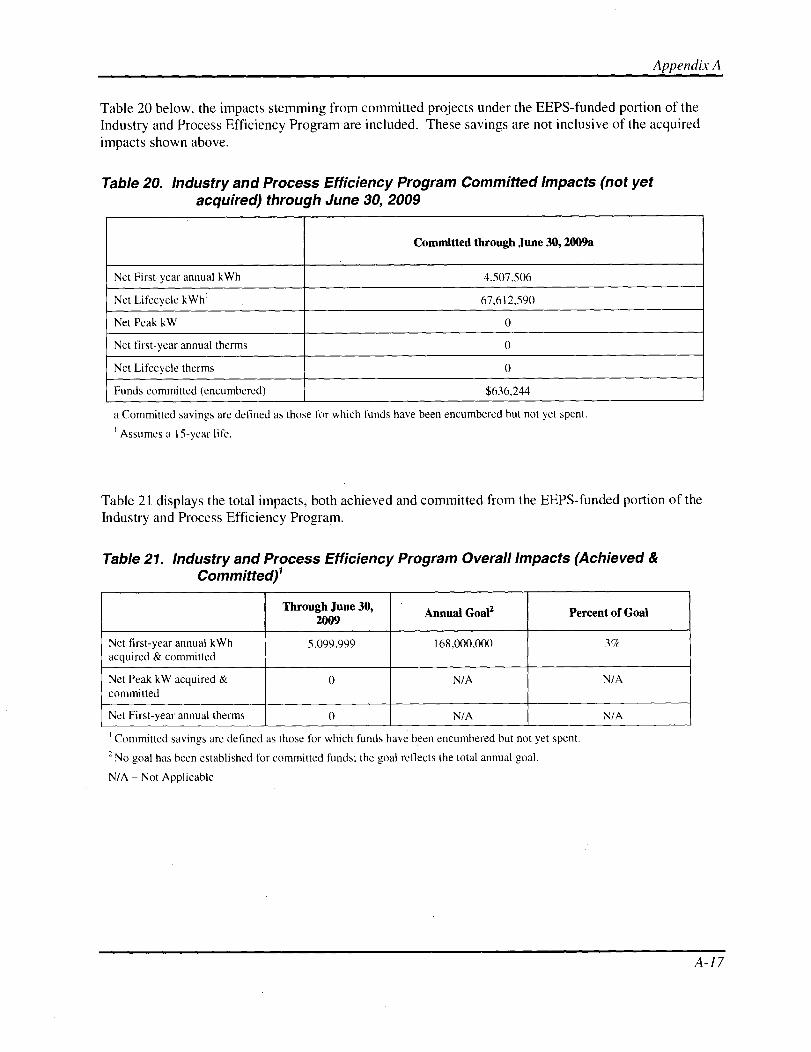
Appendix A
Table 20 below, the impacts stemming from committed projects under the EEPS-funded portion of theIndustry and Process Efficiency Program are included. These savings are not inclusive of the acquiredimpacts shown above.
Table 20. Industry and Process Efficiency Program Committed Impacts (not yetacquired) through June 30, 2009
Committed through June 30,2009a
Net First-year annual kWh 4,507,506
Net Lifecycle kWh' 67,612,590
Net Peak kW 0
Net first-year annual therms 0
Net Lifecycle therms 0
Funds committed (encumbered) $636,244
a Committed savings are defined as those for which funds have been encumbered but not yet spent.
Assumes a 15-year life.
Table 21 displays the total impacts, both achieved and committed from the EEPS-funded portion of theIndustry and Process Efficiency Program.
Table 21. Industry and Process Efficiency Program Overall Impacts (Achieved &Committed)'
Through June 30,Annual Goa12 Percent of Goal
2009
Net first-year annual kWh 5,099,999 168,000,000 3%acquired & committed
Net Peak kW acquired & 0 N/A N/Acommitted
Net First-year annual therms 0 N/A N/A
1 Committed savings are defined as those for which funds have been encumbered but not yet spent.2 No goal has been established for committed funds; the goal reflects the total annual goal.
N/A - Not Applicable
A-17
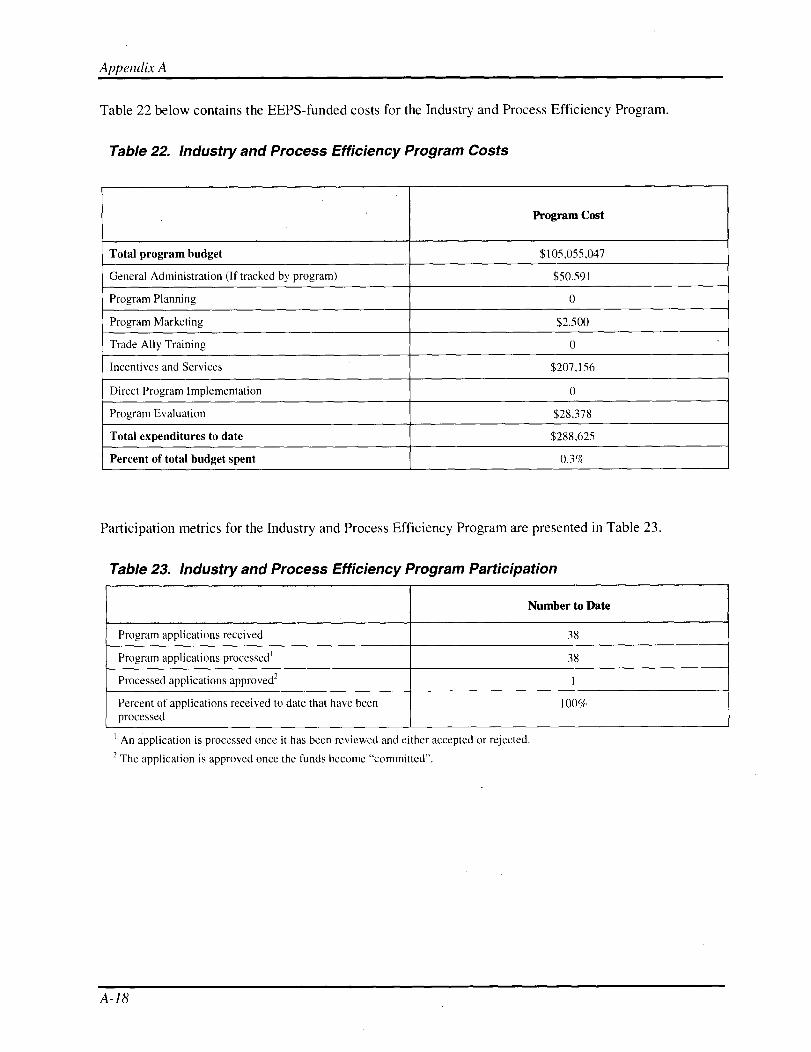
Appendix A
Table 22 below contains the EEPS-funded costs for the Industry and Process Efficiency Program.
Table 22. Industry and Process Efficiency Program Costs
Program Cost
Total program budget $105,055,047
General Administration (If tracked by program) $50,591
Program Planning 0
Program Marketing $2,500
Trade Ally Training 0
Incentives and Services $207,156
Direct Program Implementation 0
Program Evaluation $28,378
Total expenditures to date $288,625
Percent of total budget spent 0.3%
Participation metrics for the Industry and Process Efficiency Program are presented in Table 23.
Table 23. Industry and Process Efficiency Program Participation
Number to Date
Program applications received 38
Program applications processed' 38
Processed applications approved2 1
Percent of applications received to date that have beenprocessed
100%
1 An application is processed once it has been reviewed and either accepted or rejected.2 The application is approved once the funds become "committed".
A-18
Appendix A
CFL EXPANSION PROGRAM
Program Description and Background
Program Status
Program Performance Goals
(a) Describe and discuss issues and events that may alter the achievement of project performance goals(positive or negative).
• Program staff is working with retailers and manufacturers that are accessing the EEPS CFLProgram incentive dollars to determine an efficient way to collect data from the field, aggregateit, and include it within these reports. Due to the structure of the Program, reporting on savingsfrom retail and manufacturer special promotion proposals is expected to have a two-month lagand will therefore not be available until the August report. The amount of CFLs that will besold through incentives is 37% of the total goal of the Program.
The additional 67% of the CFLs will be moved through marketing and spillover effects that theProgram is determining how to measure through its evaluation efforts. Although retail salesdata is collected from program partners monthly, the full impact of program marketing andspillover, including sales in non-partner stores, will be evaluated on a periodic basis inaccordance with the evaluation plan. Therefore only partial reporting will be provided on amonth-to-month basis.
• Many retailers and manufacturers are beginning to see sales return to normal after the globaleconomic recession caused them to decrease dramatically. Sales data from participating retailpartners in May 2009 is a key indicator of the overall increase in sales.
• Manufacturers especially are taking advantage of the increased special promotions fundingfrom the CFL EEPS Program. Currently there is a combined thirty-two (32) retail andmanufacturer CFL promotions being implemented throughout New York State. Thesepromotions have been developed, and started implementation, within the April 1 - June 30threporting period.
(b) Describe and discuss other key issues related to program performance goals that were not discussed in(a).
N/A
A-19

Appendix A
(c) Please provide any updates to your forecast of net energy and demand impacts. The forecast shouldbe updated at least annually. Please note and explain any discrepancies between the filed program
goal and the latest forecast.
Not applicable.
Program Implementation Activities
(a) Marketing Activities
The marketing campaign for the CFL EEPS Program is in development. Program staff is working withmarketing contractors to develop the creative campaign that will position CFLs as the easiest step for aconsumer to take to save energy. Program staff anticipates receiving approval on a creative concept by
the end of July.
(b) Evaluation Activities:.
• NYSERDA received DPS approval of its detailed evaluation plan for this program on June 18,2009. Implementation of the evaluation has commenced. In early July, NYSERDA held a kickoff meeting and begin the on-site CFL saturation surveys in New York and comparison areas.Data collection instruments and protocols have been drafted and approved by DPS for full-scaleimplementation.
• A random digit dial (RDD) survey was completed and results were presented in June. This is thefirst step in a series of studies and surveys meant to characterize the status of the residential
lighting market.
• Evaluation staff is currently working on a more comprehensive evaluation plan that they will beimplementing this fall with permission from relevant parties.
(c) Other Activities
Not applicable.
Customer Complaints and/or Disputes
Not applicable.
Changes to Subcontractors or Staffing
There have been no changes in the project management or contract team.
Additional Issues
None to report.
A-20
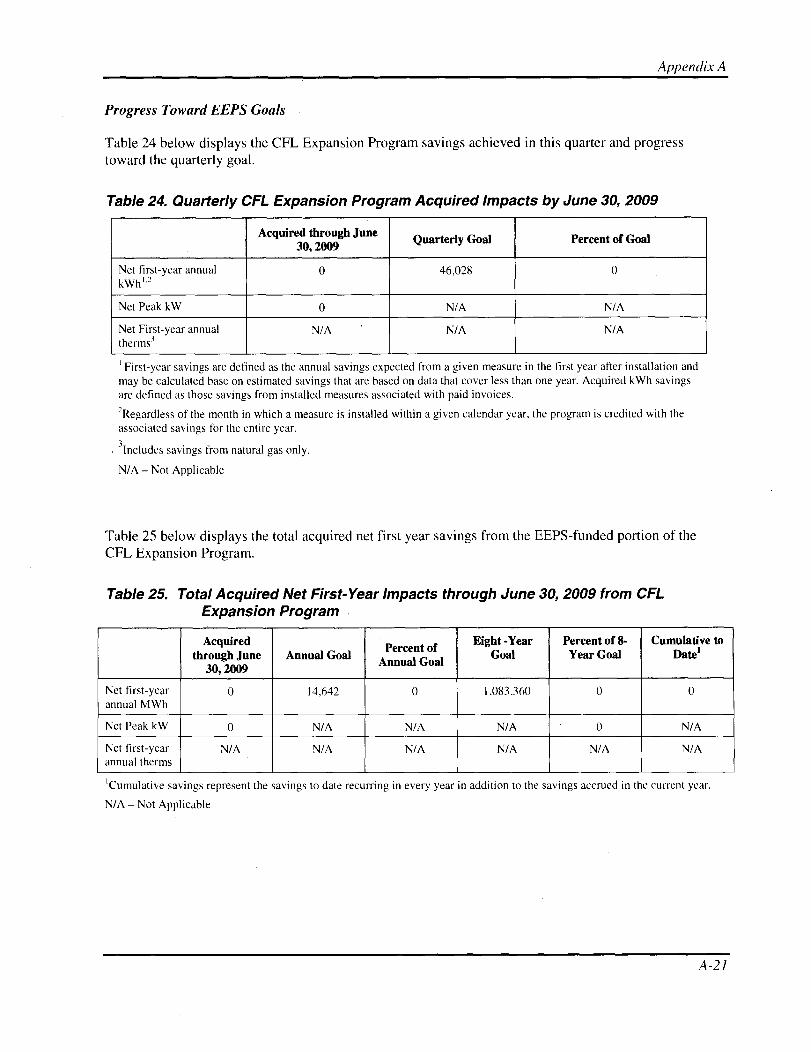
Appendix A
Progress Toward EEPS Goals
Table 24 below displays the CFL Expansion Program savings achieved in this quarter and progresstoward the quarterly goal.
Table 24. Quarterly CFL Expansion Program Acquired Impacts by June 30, 2009
Acquired through JuneQuarterly Goal Percent of Goal
30, 2009
Net first-year annual 0 46,028 0kWh' 2
Net Peak kW 0 N/A N/A
Net First-year annual N/A N/A N/Atherms;
1 First-year savings are defined as the annual savings expected from a given measure in the first year after installation andmay be calculated base on estimated savings that are based on data that cover less than one year. Acquired kWh savingsare defined as those savings from installed measures associated with paid invoices.
2Regardless of the month in which a measure is installed within a given calendar year, the program is credited with theassociated savings for the entire year.
3 Includes savings from natural gas only.
N/A - Not Applicable
Table 25 below displays the total acquired net first year savings from the EEPS-funded portion of theCFL Expansion Program.
Table 25. Total Acquired Net First-Year Impacts through June 30, 2009 from CFLExpansion Program
Acquired Eight -Year Percent of 8- Cumulative tothrough June Annual Goal
Percent ofGoal Year Goal Date'
Annual Goal30, 2009
Net first-year 0 14,642 0 1,083,360 0 0annual MWh
Net Peak kW 0 N/A N/A N/A 0 N/A
Net first-year N/A N/A N/A N/A N/A N/Aannual therms
'Cumulative savings represent the savings to date recurring in every year in addition to the savings accrued in the current year.
N/A - Not Applicable
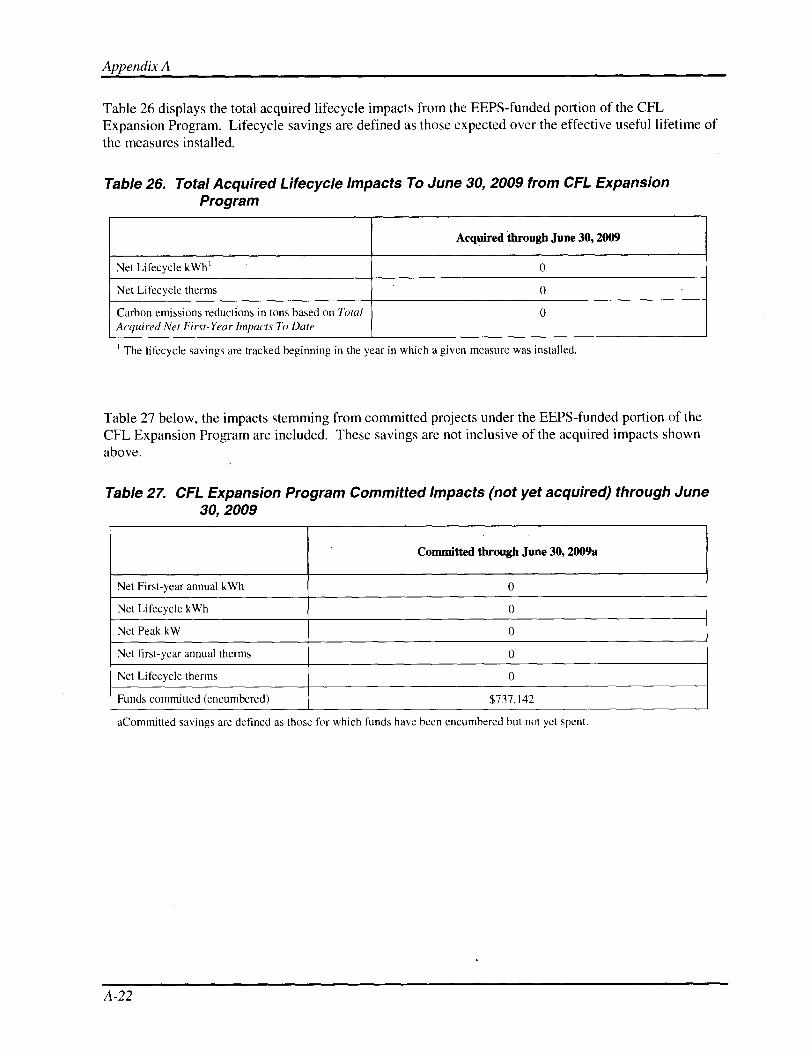
Appendix A
Table 26 displays the total acquired lifecycle impacts from the EEPS-funded portion of the CFLExpansion Program. Lifecycle savings are defined as those expected over the effective useful lifetime ofthe measures installed.
Table 26. Total Acquired Lifecycle Impacts To June 30, 2009 from CFL ExpansionProgram
Acquired through June 30, 2009
Net Lifecycle kWh' 0
Net Lifecycle therms 0
Carbon emissions reductions in tons based on TotalAcquired Net First-Year Impacts To Date
0
The lifecycle savings are tracked beginning in the year in which a given measure was installed.
Table 27 below, the impacts stemming from committed projects under the EEPS-funded portion of theCFL Expansion Program are included. These savings are not inclusive of the acquired impacts shownabove.
Table 27. CFL Expansion Program Committed Impacts (not yet acquired) through June30, 2009
Committed through June 30, 2009a
Net First-year annual kWh 0
Net Lifecycle kWh 0
Net Peak kW 0
Net first-year annual therms 0
Net Lifecycle therms 0
Funds committed (encumbered) $737,142
aCommitted savings are defined as those for which funds have been encumbered but not yet spent.
A-22
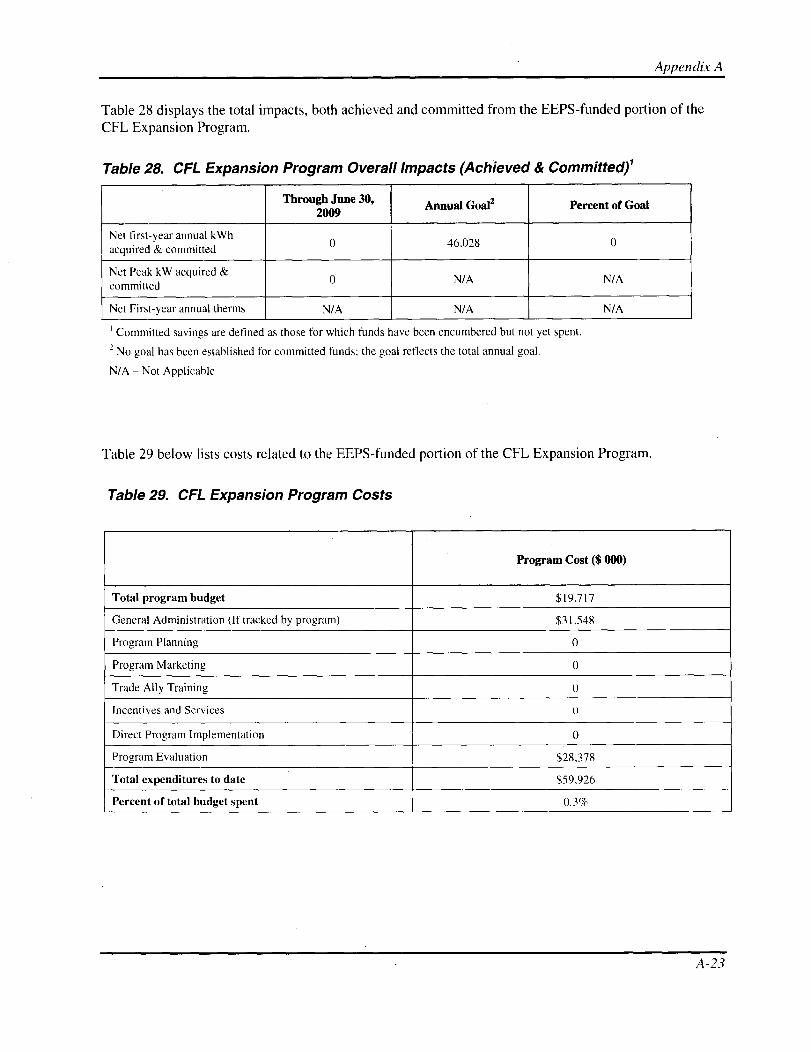
Appendix A
Table 28 displays the total impacts, both achieved and committed from the EEPS-funded portion of theCFL Expansion Program.
Table 28. CFL Expansion Program Overall Impacts (Achieved & Committed)'
Through June 30,Annual Goa12 Percent of Goal
2009
Net first-year annual kWh0 46 028 0
acquired & committed,
Net Peak kW acquired &0 N/A N/A
committed
Net First-year annual therms N/A N/A N/A
Committed savings are defined as those for which funds have been encumbered but not yet spent.2 No goal has been established for committed funds: the goal reflects the total annual goal.
N/A - Not Applicable
Table 29 below lists costs related to the EEPS-funded portion of the CFL Expansion Program.
Table 29. CFL Expansion Program Costs
Program Cost ($ 000)
Total program budget $19,717
General Administration (If tracked by program) $31,548
Program Planning 0
Program Marketing 0
Trade Ally Training 0
Incentives and Services 0
Direct Program Implementation 0
Program Evaluation $28,378
Total expenditures to date $59,926
Percent of total budget spent 0.3%
A-23
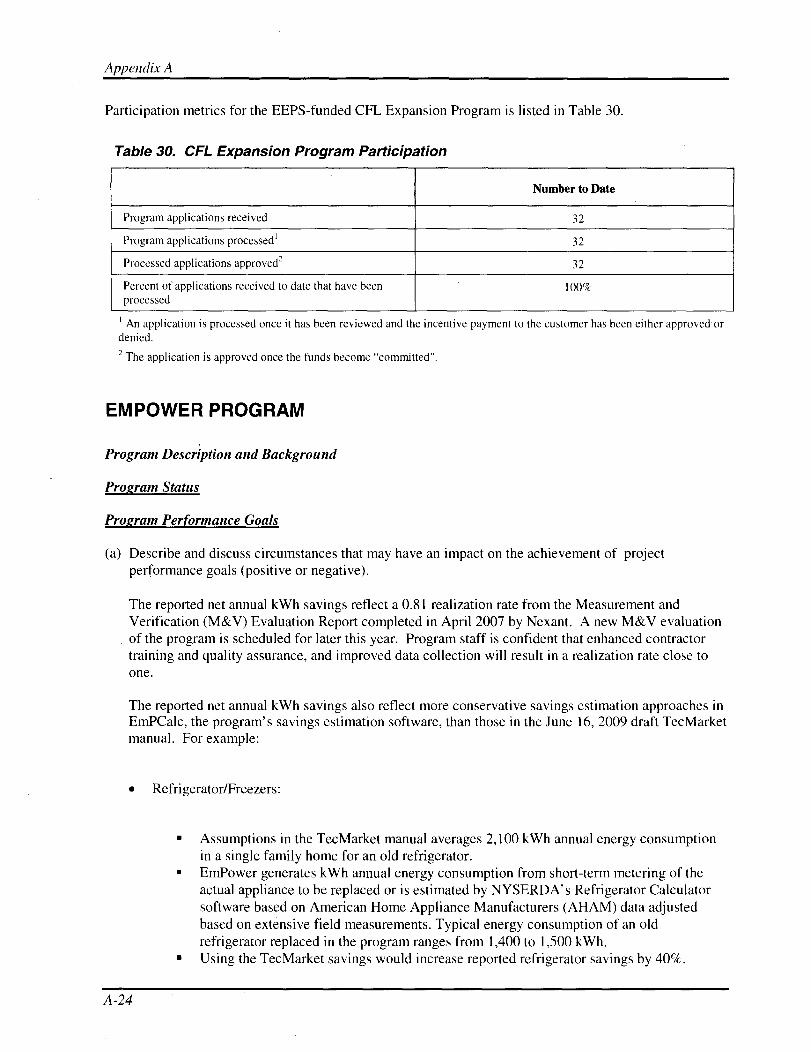
Appendix A
Participation metrics for the EEPS-funded CFL Expansion Program is listed in Table 30.
Table 30. CFL Expansion Program Participation
Number to Date
Program applications received 32
Program applications processed' 32
Processed applications approved` 32
Percent of applications received to date that have beenprocessed
100%
1 An application is processed once it has been reviewed and the incentive payment to the customer has been either approved ordenied.2 The application is approved once the funds become "committed".
EMPOWER PROGRAM
Program Description and Background
Program Status
Program Performance Goals
(a) Describe and discuss circumstances that may have an impact on the achievement of projectperformance goals (positive or negative).
The reported net annual kWh savings reflect a 0.81 realization rate from the Measurement andVerification (M&V) Evaluation Report completed in April 2007 by Nexant. A new M&V evaluationof the program is scheduled for later this year. Program staff is confident that enhanced contractortraining and quality assurance, and improved data collection will result in a realization rate close toone.
The reported net annual kWh savings also reflect more conservative savings estimation approaches inEmPCalc, the program's savings estimation software, than those in the June 16, 2009 draft TecMarketmanual. For example:
• Refrigerator/Freezers:
n Assumptions in the TecMarket manual averages 2,100 kWh annual energy consumptionin a single family home for an old refrigerator.
n EmPower generates kWh annual energy consumption from short-term metering of theactual appliance to be replaced or is estimated by NYSERDA's Refrigerator Calculatorsoftware based on American Home Appliance Manufacturers (AHAM) data adjustedbased on extensive field measurements. Typical energy consumption of an oldrefrigerator replaced in the program ranges from 1,400 to 1,500 kWh.
n Using the TecMarket savings would increase reported refrigerator savings by 40%.
A-24
Appendix A
• Shower Heads
n EmPCalc assumes 100 kWh annual savings per person in the household per fixturereplaced. The TecMarket manual assumes two showers per day per household and willsave 1,065 kWh annually per fixture.
n The TecMarket savings are 255% above typical kWh savings in EmPower for showerhead replacement.
(b) Describe and discuss other key aspects of program performance goals that were not discussed in (a)
• The TecMarket manual assumptions for Hardwired Fixtures appear overly conservative. Forexample, the estimated hours per day are only 2.5 compared to 3.2 for CFLs. This is counter toour experience in EmPower where contractors are instructed to install hardwired fixtures only inhigh use areas. Additionally, TecMarket assumes that a CFL and a hardwired fixture each have aneffective useful life (EUL) of 7 years. This is particularly inappropriate as EmPower provides areplacement pin bulb with each fixture retrofit. The California DEER Effective Useful Life table,which is cited by TecMarket in its very next entry, lists a 16 year EUL and the NYSERDADeemed Savings Base lists 12 years. Program efforts to increase the number of hardwired fixturesdue to a higher persistence of savings will be hampered if the TecMarket perspective prevails.
(c) Provide updates to the forecast of net energy and demand impacts. The forecast should be updated atleast annually. Note and explain any discrepancies between the filed program goal and the latest forecast.
No Changes to report at this time.

Appendix A
Program Implementation Activities
(a) Marketing Activities [List and describe major accomplishments related to marketing. Describe workactivities in both quantitative and qualitative terms. Provide copies of key marketing materials.]
N/A
(b) Evaluation Activities:
NYSERDA has worked with DPS Staff and their evaluation advisor consultant to address commentson the detailed evaluation plan for this program. NYSERDA submitted a final detailed evaluationplan to DPS on July 1, 2009 and is awaiting approval.
(c) Other Activities [List and describe major accomplishments not captured in either the spreadsheet ofthis form. Describe work activities in both quantitative and qualitative terms.]
N/A
(d) Customer Complaints and/or Disputes
[Describe any customer disputes or complaints and how they have been resolved.]
N/A
Changes to Subcontractors or Staffing
[Describe any staff or subcontractor/consultant changes. ]
N/A -
Additional Issues
None to report.
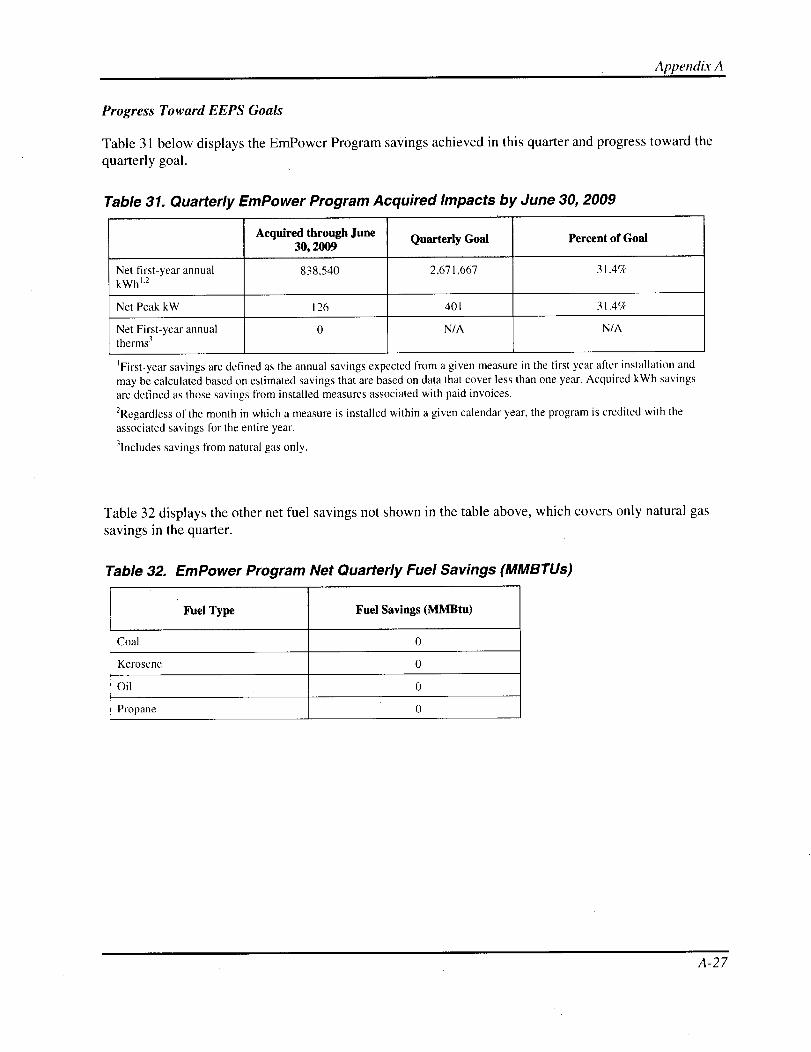
Appendix A
Progress Toward EEPS Goals
Table 31 below displays the EmPower Program savings achieved in this quarter and progress toward thequarterly goal.
Table 31. Quarterly EmPower Program Acquired Impacts by June 30, 2009
Acquired through June Quarterly Goal Percent of Goal30, 2009
Net first-year annual 838,540 2,671,667 31.4%
kWh'-'
Net Peak kW 126 401 31.4%
Net First-year annual 0 N/A N/A
therms'
'First-year savings are defined as the annual savings expected from a given measure in the first year after installation andmay be calculated based on estimated savings that are based on data that cover less than one year. Acquired kWh savingsare defined as those savings from installed measures associated with paid invoices.
2 Regardless of the month in which a measure is installed within a given calendar year, the program is credited with the
associated savings for the entire year.
3Includes savings from natural gas only.
Table 32 displays the other net fuel savings not shown in the table above, which covers only natural gassavings in the quarter.
Table 32. EmPower Program Net Quarterly Fuel Savings (MMBTUs)
Fuel Type Fuel Savings (MMBtu)
Coal 0
Kerosene 0
Oil 0
Propane 0
A-27
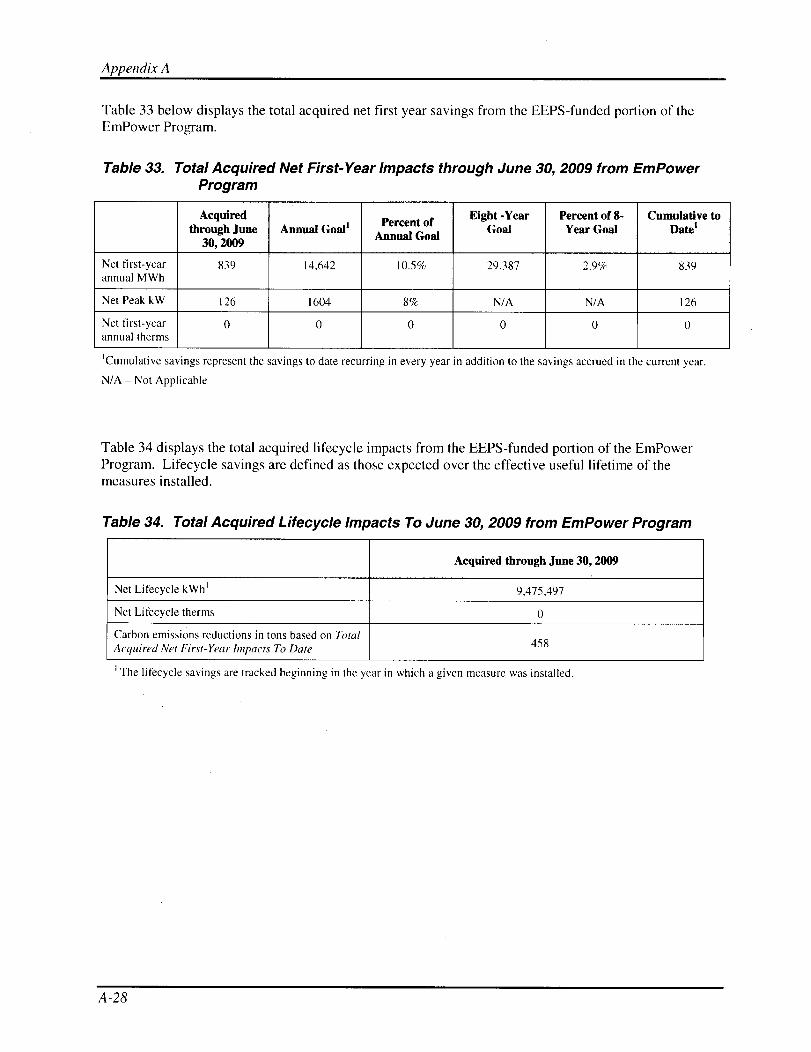
Appendix A
Table 33 below displays the total acquired net first year savings from the EEPS-funded portion of theEmPower Program.
Table 33. Total Acquired Net First-Year Impacts through June 30, 2009 from EmPowerProgram
AcquiredPercent of
Eight -Year Percent of 8- Cumulative tothrough June Annual Goal'
Annual GoalGoal Year Goal Date
30, 2009
Net first-year 839 14,642 10.5% 29,387 2.9% 839annual MWh
Net Peak kW 126 1604 8% N/A N/A 126
Net first-year 0 0 0 0 0 0annual therms
'Cumulative savings represent the savings to date recurring in every year in addition to the savings accrued in the current year.
N/A - Not Applicable
Table 34 displays the total acquired lifecycle impacts from the EEPS-funded portion of the EmPowerProgram. Lifecycle savings are defined as those expected over the effective useful lifetime of themeasures installed.
Table 34. Total Acquired Lifecycle Impacts To June 30, 2009 from EmPower Program
Acquired through June 30, 2009
Net Lifecycle kWh' 9,475,497
Net Lifecycle therms 0
Carbon emissions reductions in tons based on TotalAcquired Net First- Year Impacts To Date 458
1 The lifecycle savings are tracked beginning in the year in which a given measure was installed.
A-28
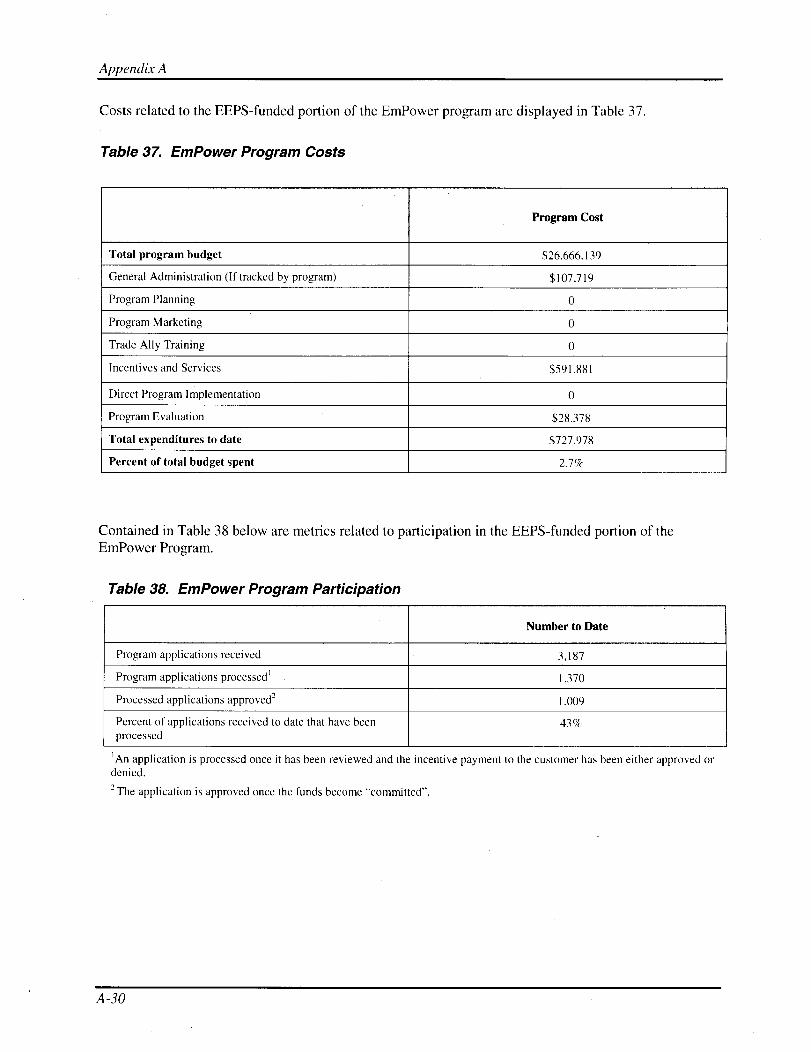
Appendix A
Costs related to the EEPS-funded portion of the EmPower program are displayed in Table 37.
Table 37. EmPower Program Costs
Program Cost
Total program budget $26,666,139
General Administration (If tracked by program) $107,719
Program Planning 0
Program Marketing 0
Trade Ally Training 0
Incentives and Services $591,881
Direct Program Implementation 0
Program Evaluation $28,378
Total expenditures to date $727,978
Percent of total budget spent 2.7%
Contained in Table 38 below are metrics related to participation in the EEPS-funded portion of theEmPower Program.
Table 38. Empower Program Participation
Number to Date
Program applications received 3,187
Program applications processed' 1,370
Processed applications approved2 1,009
Percent of applications received to date that have beenprocessed
43%
'An application is processed once it has been reviewed and the incentive payment to the customer has been either approved ordenied.
2 The application is approved once the funds become "committed".
A-30
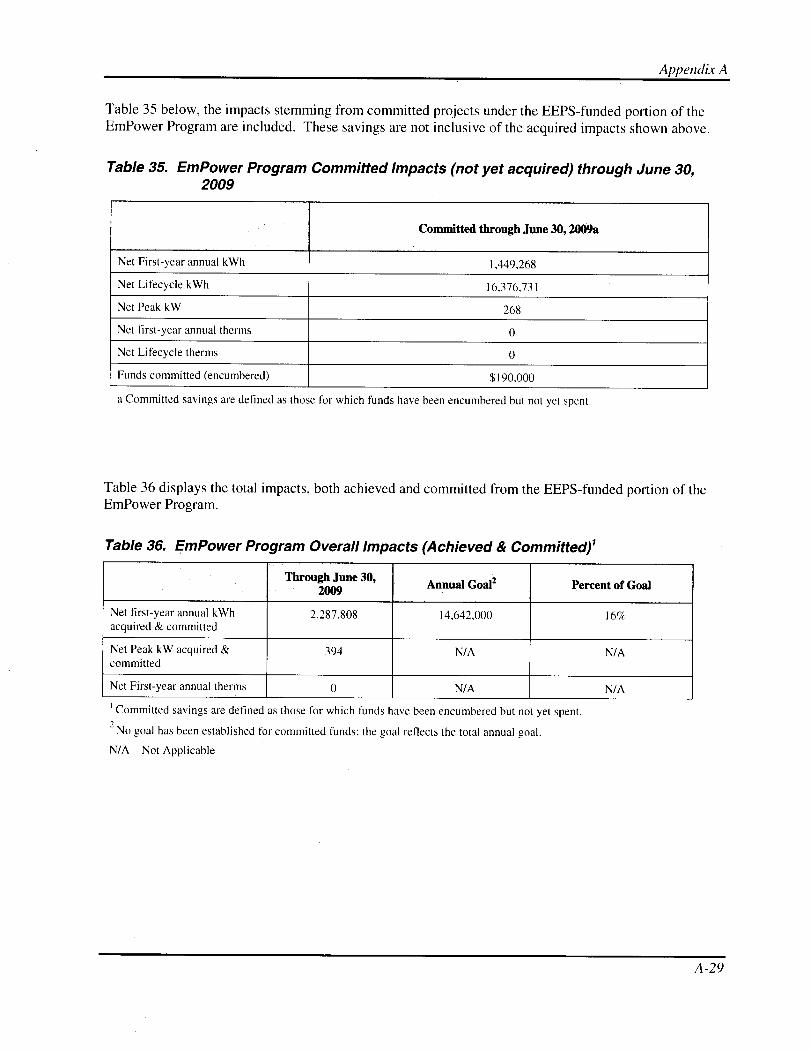
Appendix A
Table 35 below, the impacts stemming from committed projects under the EEPS-funded portion of theEmPower Program are included. These savings are not inclusive of the acquired impacts shown above.
Table 35. EmPower Program Committed Impacts (not yet acquired) through June 30,2009
Committed through June 30,2009a
Net First-year annual kWh 1,449,268
Net Lifecycle kWh 16,376,731
Net Peak kW 268
Net first-year annual therms 0
Net Lifecycle therms 0
Funds committed (encumbered) $190,000
a Committed savings are defined as those for which funds have been encumbered but not yet spent.
Table 36 displays the total impacts, both achieved and committed from the EEPS-funded portion of theEmPower Program.
Table 36. EmPower Program Overall Impacts (Achieved & Committed)'
Through June 30,Annual Goall2 Percent of Goal2009
Net first-year annual kWh 2,287,808 14,642,000 16%acquired & committed
Net Peak kW acquired & 394 N/A N/Acommitted
Net First-year annual therms 0 N/A N/A
1 Committed savings are defined as those for which funds have been encumbered but not yet spent.2
No goal has been established for committed funds; the goal reflects the total annual goal.
N/A - Not Applicable
A-29
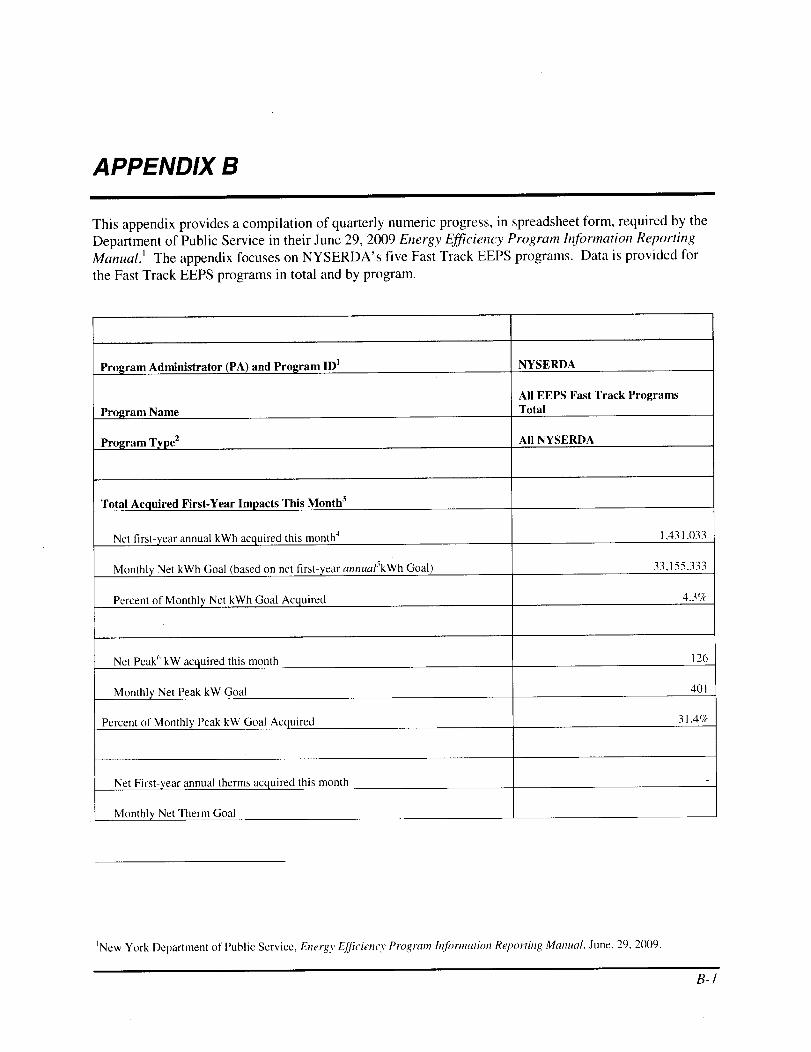
APPENDIX B
This appendix provides a compilation of quarterly numeric progress, in spreadsheet form, required by theDepartment of Public Service in their June 29, 2009 Energy Efficiency Program Information ReportingManual.' The appendix focuses on NYSERDA's five Fast Track EEPS programs. Data is provided forthe Fast Track EEPS programs in total and by program.
Program Administrator (PA) and Program ID' NYSERDA
Program Name
All EEPS Fast Track ProgramsTotal
Program Type 2 All NYSERDA
Total Acquired First-Year Impacts This Month3
Net first ear annual kWh acquired this month' 1.431.033
Monthly Net kWh Goal (based on net first-year annuals kWh Goal) 33,155.333
Percent of Monthly Net kWh Goal Acquired 4.317(
Net Peak' kW acquired this month 126
Monthly Net Peak kW Goal 401
Percent of Monthly Peak kW Goal Acquired 3 I.4%
Net First ear annual therms acquired this month -
Monthly Net Therm Goal -
'New York Department of Public Service, Energy Efficiency Program Information Reporting Manual, June, 29, 2009.
B-1

Appendix B
Percent of Monthly Therm Goal Acquired 0.0%
Net Lifecycle kWh acquired this month 9,475,497
Net Lifecycle therms acquired this month -
Net Other Monthly Savings (MMBTUs) Acquired
Coal -
Kerosene -
Oil -
Propane -
Total Acquired Net First-Year Impacts To Date
Net first ear annual kWh acquired to date 1,431,033
Net first-year annual kWh acquired to date as a percent of annual goal 1.49k
Net first ear annual kWh acquired to date as a percent of 8-year goal 0.11h
Net cumulative first-year annual kWh acquired to date 1.431.033
Net utility kW reductions acquired to date 126
Net utility peak kW reductions acquired to date as a percent of utility annual goal 10.5%
Net utility peak kW reductions acquired to date as a percent of 8-year goal 2.9(7(
Net NYISO peak kW reductions acquired to date -
Net first ear annual therms acquired to date -
Net first-year annual therms acquired to date as a percent of annual goal 0.0%
Net first ear annual therms acquired to date as a percent of 8-year goal 0.0%
Net cumulative therms acquired to date -
Appendix B
Total Acquired Lifecycle Impacts To Date?
Net Lifecycle kWh acquired to date 9,475,497
Net Lifecycle therms acquired to date -
Committed8 Impacts (not yet acquired) This Month
Net First ear annual kWh committed this month 29,720,978
Net Lifecycle kWh committed this month 328.330,745
Net Utility Peak kW committed this month 3,829
Net first-year annual therms committed this month -
Net Lifecycle therms committed this month -
Funds committed at this point in time 3,370,423
Overall Impacts (Acquired & Committed)
Net first-year annual kWh acquired & committed this month 31,152,011
Net utility peak kW acquired & committed this month 3,955
Net First-year annual therms acquired & committed this month -
Costs
Total program budget 259,481,498
General Administration 289.904
Program Planning -
Program Marketing 2.500
Trade Ally Training -
Incentives and Services 799,037
Direct Program Implementation -
Evaluation 170,268
Total expenditures to date 1,261,709
B-3
Appendix B
Percent of total budget spent to date 0.570
Participation
Number of program applications received to date 3,364
Number of program applications processed to date1' 1,465
Number of processed applications approved to date" 1,054
Percent of applications received to date that have been processed 43.5%
Carbon Emission Reductions (in tons)
Total Acquired Net First-Year Carbon Emission Reductions To Date 12781
Total Acquired Cumulative Net Carbon Emission Reductions To Date 781
NOTES:
' First-year savings are defined as the annual savings expected from a given measure in the first year after installation. Theannual savings are sometimes the result of annualizing estimated savings that are based on data that cover less than one year.2 Peak is defined uniquely for each utility.
3 Committed savings are defined as those for which funds have been encumbered by not yet spent. When the funds are spent(i.e., a rebate check has been sent to the participant on a specific date), the savings are then considered "acquired."
4An application is, processed once the PA has reviewed the application and made a decision whether to approve the incentivepayment to the customer. Once the decision has been made to pay the incentive to the customer, these funds and theirassociated energy and demand impacts become "Committed."
5The application is approved once the decision has been made to pay the incentive to the customer. Note that these funds andtheir associated energy and demand impacts become "Committed" once this decision is made.
"See CO7 Reduction Values tab.
Appendix B
Program Administrator (PA) and Program ID' NYSERDA
Program Name High Performance New Buildings
Program Type 2 Business and Institutional
Total Acquired First-Year Impacts This Month3
Net first ear annual kWh acquired this month -
Monthly Net kWh Goal (based on net first-year annuahskWh Goal) 4,880,667
Percent of Monthly Net kWh Goal Acquired 0.0%
Net Peak6 kW acquired this month -
Monthly Net Peak kW Goal -
Percent of Monthly Peak kW Goal Acquired 0.0^_^
Net First-year annual therms acquired this month -
Monthly Net Therm Goal -
Percent of Monthly Therm Goal Acquired 0.0%
Net Lifecycle kWh acquired this month -
Net Lifecycle therms acquired this month -
Net Other Monthly Savings (MMBTUs) Acquired
Coal -
Kerosene -
Oil -
Propane
B-5
Appendix B
Total Acquired Net First-Year Impacts To Date
Net first ear annual kWh acquired to date -
Net first-year annual kWh acquired to date as a percent of annual goal 0.01/(
Net first-year annual kWh acquired to date as a percent of 8-year goal 0.0e%
Net cumulative first-year annual kWh acquired to date -
Net utility kW reductions acquired to date -
Net utility peak kW reductions acquired to date as a percent of utilityannual goal 0.O_k
Net utility peak kW reductions acquired to date as a percent of 8-yeargoal 0.0%
Net NYISO peak kW reductions acquired to date -
Net first ear annual therms acquired to date -
Net first-year annual therms acquired to date as a percent of annual goal 0.017
Net first-year annual therms acquired to date as a percent of 8-year goal O.O(I
Net cumulative therms acquired to date -
Total Acquired Lifecycle Impacts To Date?
Net Lifec cle kWh acquired to date -
Net Lifecycle therms acquired to date -
Committeds Impacts (not yet acquired) This Month
Net First ear annual kWh committed this month 4,548,797
Net Lifecycle kWh committed this month -
Net Utility Peak kW committed this month -
Net first-year annual therms committed this month
Net Lifecycle therms committed this month -
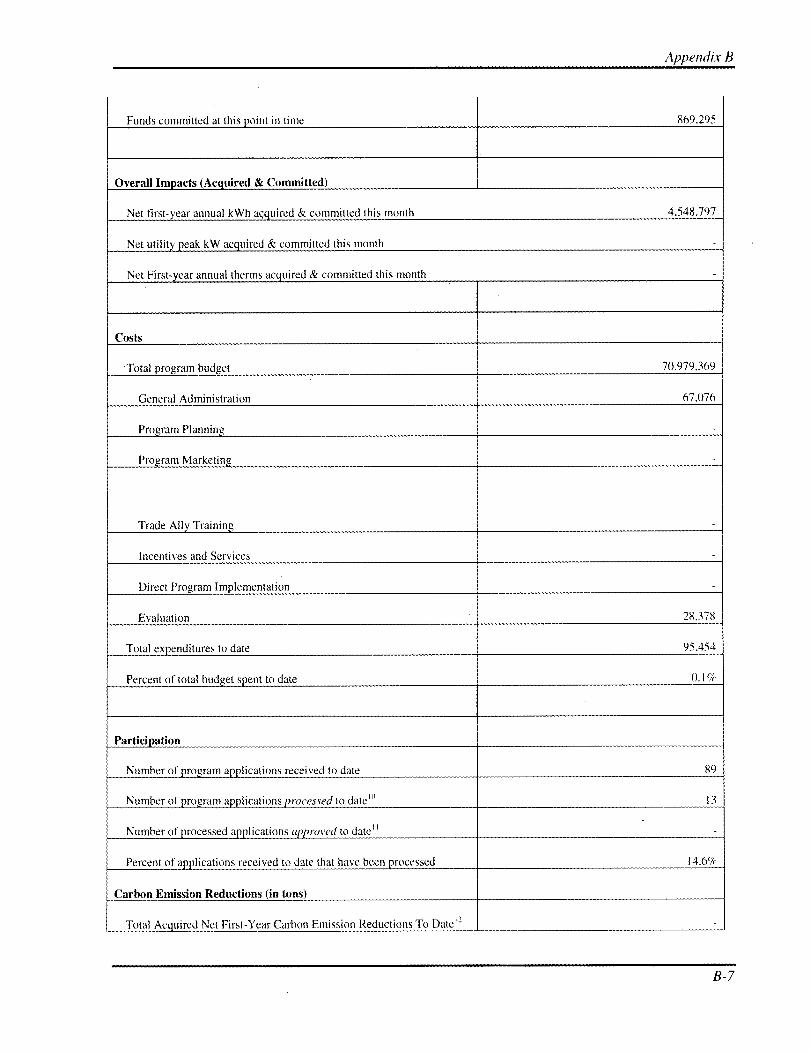
Appendix B
Funds committed at this point in time 869,295
Overall Impacts (Acquired & Committed)
Net first-year annual kWh acquired & committed this month 4.548,797
Net utility peak kW acquired & committed this month -
Net First-year annual therms acquired & committed this month -
Costs
Total program budget 70,979,369
General Administration 67,076
Program Planning -
Program Marketing
Trade Ally Training
Incentives and Services -
Direct Program Implementation -
Evaluation 28.378
Total expenditures to date 95,454
Percent of total budget spent to date 0.1 %
Participation
Number of program applications received to date 89
Number of program applications processed to date"' 13
Number of processed a lications approved to date" -
Percent of applications received to date that have been processed 14.6%
Carbon Emission Reductions (in tons)
Total Acquired Net First-Year Carbon Emission Reductions To Date 12 -
B-7

Appendix B
Total Acquired Cumulative Net Carbon Emission Reductions To Date
NOTES:
First-year savings are defined as the annual savings expected from a given measure in the first year after installation. Theannual savings are sometimes the result of annualizing estimated savings that are based on data that cover less than one year.
2 Peak is defined uniquely for each utility.s Committed savings are defined as those for which funds have been encumbered by not yet spent. When the funds are spent(i.e., a rebate check has been sent to the participant on a specific date), the savings are then considered "acquired."
4An application is processed once the PA has reviewed the application and made a decision whether to approve the incentivepayment to the customer. Once the decision has been made to pay the incentive to the customer, these funds and theirassociated energy and demand impacts become "Committed."
3The application is approved once the decision has been made to pay the incentive to the customer. Note that these funds andtheir associated energy and demand impacts become "Committed" once this decision is made.
6 See CO2 Reduction Values tab
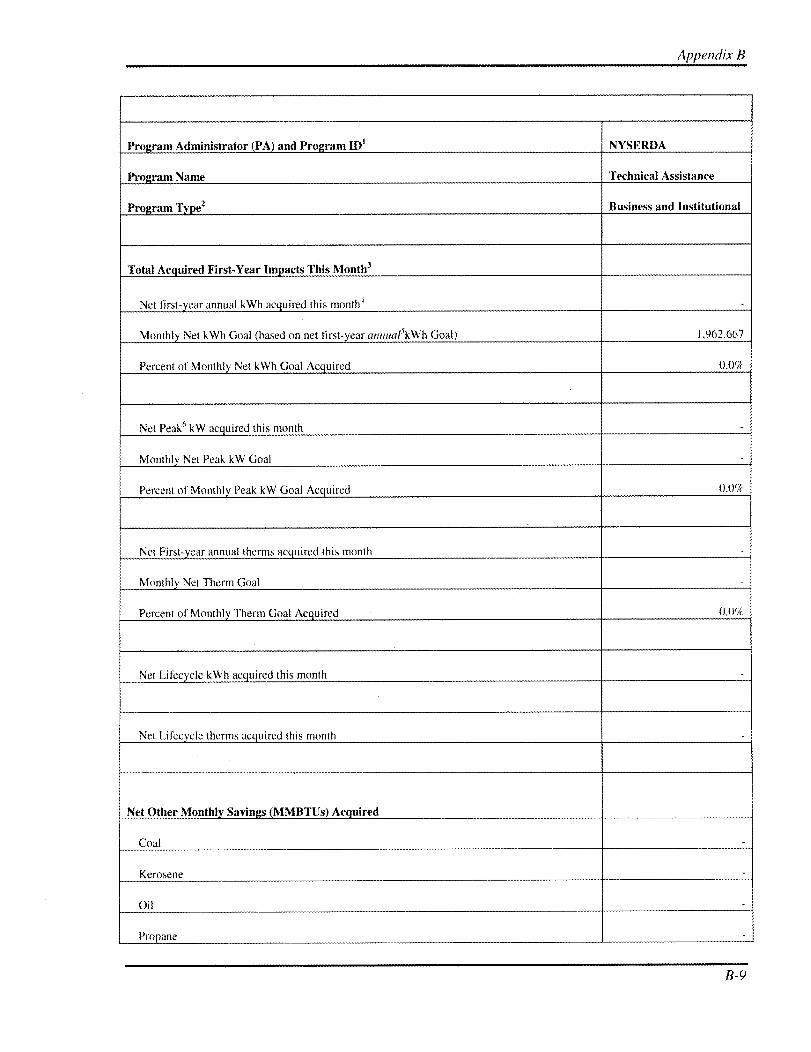
Appendix B
Program Administrator (PA) and Program ID' NYSERDA
Program Name Technical Assistance
Program Type 2 Business and Institutional
Total Acquired First-Year Impacts This Month;
Net first-year annual kWh acquired this month4 -
Monthly Net kWh Goal (based on net first-year anmiafskWh Goal) 1,962,667
Percent of Monthly Net kWh Goal Acquired 0.017(
Net Peak' kW acquired this month -
Monthly Net Peak kW Goal -
Percent of Monthly Peak kW Goal Acquired 0.0%
Net First-year annual therms acquired this month -
Monthl Net Therm Goal -
Percent of Monthly Therm Goal Acquired
Net Lifecycle kWh ac uired this month -
Net Lifecycle therms acquired this month -
Net Other Monthly Savings (MMBTUs) Acquired
Coal -
Kerosene -
Oil -
Propane -
B-9
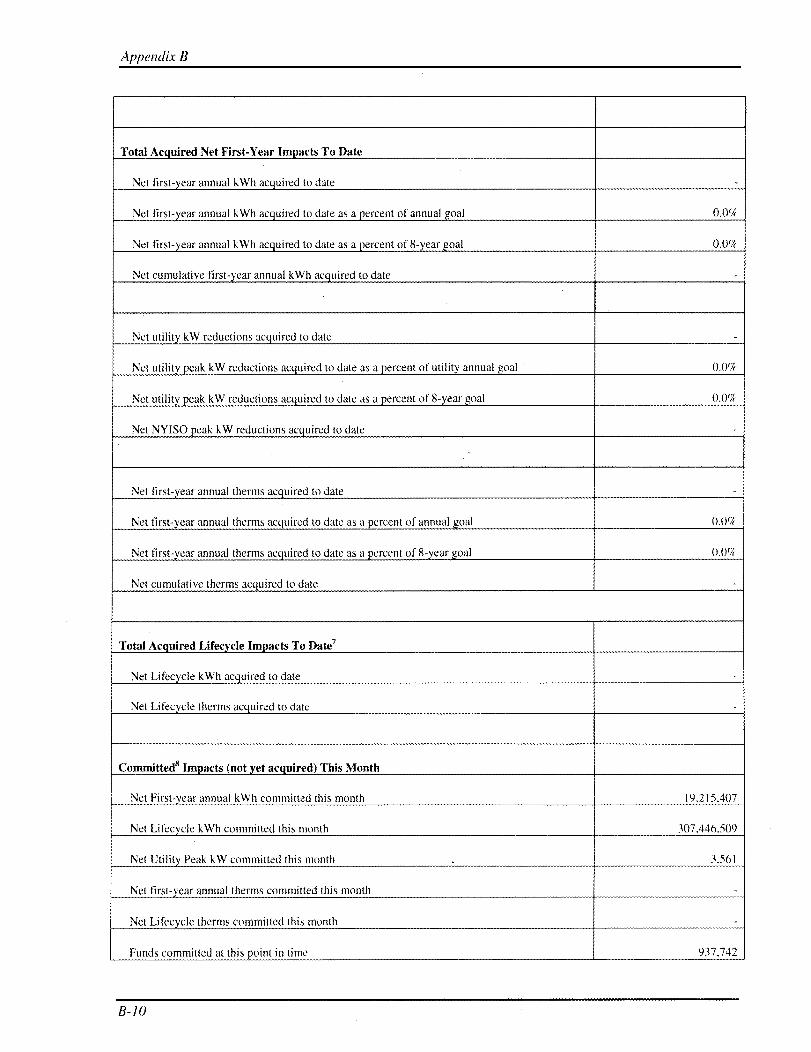
Appendix B
Total Acquired Net First-Year Impacts To Date
Net first-year annual kWh acquired to date -
Net first-year annual kWh acquired to date as a percent of annual goal 0.0%
Net first-year annual kWh acquired to date as a percent of 8-year goal 0.0%
Net cumulative first-year annual kWh acquired to date -
Net utility kW reductions acquired to date -
Net utility peak kW reductions acquired to date as a percent of utility annual goal 0.017C
Net utility peak kW reductions acquired to date as a percent of 8 -year goal 0.0%
Net NYISO peak kW reductions acquired to date -
Net first-year annual therms acquired to date -
Net first-year annual therms acquired to date as a percent of annual goal 0.0r%c
Net first-year annual therms acquired to date as a percent of 8-year goal C/I
Net cumulative therms acquired to date -
Total Acquired Lifecycle Impacts To Date?
Net Lifecycle kWh acquired to date -
Net Lifecycle therms acquired to date -
Committed Impacts (not yet acquired) This Month
Net First-year annual kWh committed this month 19,215,407
Net Lifecycle kWh committed this month 307,446.509
Net Utility Peak kW committed this month 3.561
Net first-year annual therms committed this month -
Net Lifecycle therms committed this month -
Funds committed at this point in time 937,742
B-10
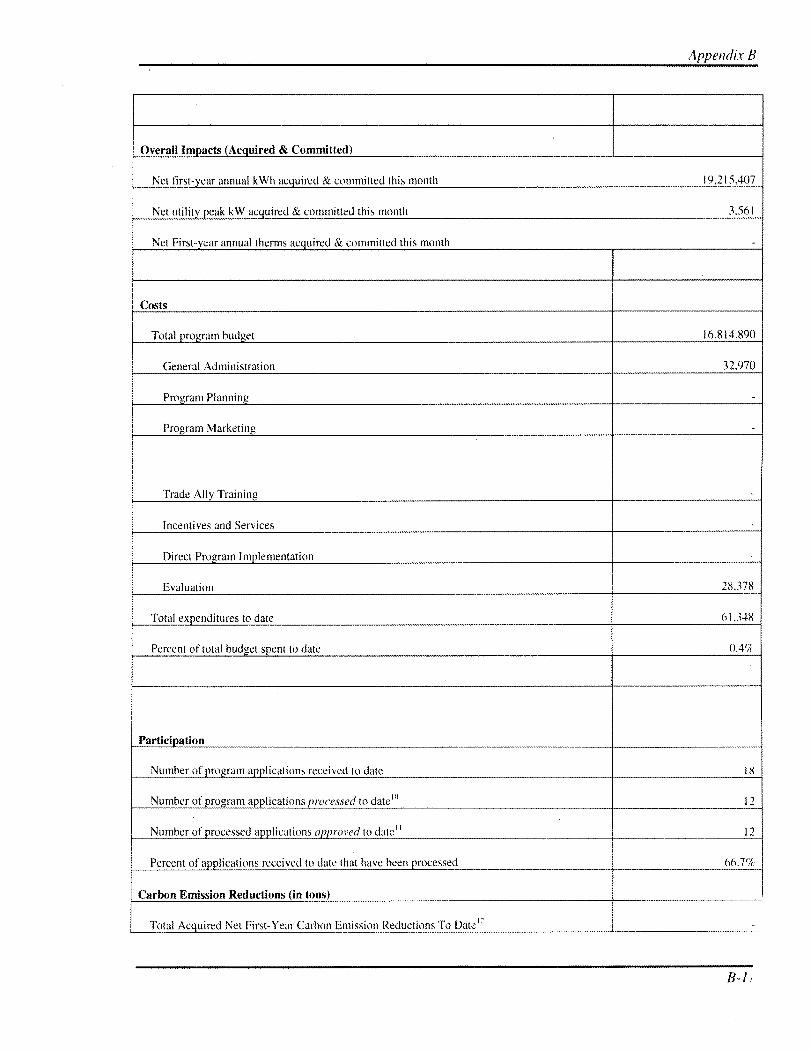
Appendix B
Overall Impacts (Acquired & Committed)
Net first-year annual kWh acquired & committed this month 19,215,407
Net utility peak kW acquired & committed this month 3,561
Net First ear annual therms acquired & committed this month -
Costs
Total program budget 16,814,890
General Administration 31970
Program Planning -
Program Marketing
Trade Ally Training -
Incentives and Services -
Direct Program Implementation -
Evaluation 28,378
Total expenditures to date 61,348
Percent of total budget spent to date 0.417(
Participation
Number of program applications received to date 18
Number of program applications processed to date10 12
Number of processed applications approved to date" 12
Percent of applications received to date that have been processed 66.7'7
Carbon Emission Reductions (in tons)
Total Acquired Net First-Year Carbon Emission Reductions To Date'' -
B-1,

Appendix B
Total Acquired Cumulative Net Carbon Emission Reductions To Date
NOTES:
1 First-year savings are defined as the annual savings expected from a given measure in the first year after installation. The annualsavings are sometimes the result of annualizing estimated savings that are based on data that cover less than one year.
2 Peak is defined uniquely for each utility.3 Committed savings are defined as those for which funds have been encumbered by not yet spent. When the funds are spent (i.e.,a rebate check has been sent to the participant on a specific date). the savings are then considered "acquired."
4An application is processed once the PA has reviewed the application and made a decision whether to approve the incentivepayment to the customer. Once the decision has been made to pay the incentive to the customer, these funds and their associatedenergy and demand impacts become "Committed."
5The application is approved once the decision has been made to pay the incentive to the customer. Note that these funds andtheir associated energy and demand impacts become "Committed" once this decision is made.
6 See CO2 Reduction Values tab.
B-12
Appendix B
Program Administrator (PA) and Program ID' NYSERDA
Program Name Technical Assistance Industrial Process
Program Type 2 Business and Institutional
Total Acquired First-Year Impacts This Month 3
Net first-year annual kWh acquired this month 592,493
Monthly Net kWh Goal (based on net first-year annua15kWhGoal) 23,640,333
Percent of Monthly Net kWh Goal Acquired 2.5%
Net Peak6 kW acquired this month -
Monthly Net Peak kW Goal -
Percent of Monthly Peak kW Goal Acquired 0.07
Net First-year annual therms acquired this month -
Monthly Net Therm Goal -
Percent of Monthly Therm Goal Acquired 0.014
Net Lifec cle kWh acquired this month -
Net Lifec cle therms acquired this month -
Net Other Monthly Savings (MMBTUs) Acquired
Coal -
Kerosene -
Oil -
B_ 12
Appendix B
Propane
Total Acquired Net First-Year Impacts To Date
Net first ear annual kWh acquired to date 592,493
Net first-year annual kWh acquired to date as a percent of annualgoal 0.8%
Net first-year annual kWh acquired to date as a percent of 8-yeargoal 0.1%
Net cumulative first ear annual kWh acquired to date 592,493
Net utility kW reductions acquired to date -
Net utility peak kW reductions acquired to date as a percent ofutility annual goal 0.0%
Net utility peak kW reductions acquired to date as a percent of 8-year goal 0.0`%
Net NYISO peak kW reductions acquired to date -
Net first-year annual therms acquired to date -
Net first-year annual therms acquired to date as a percent ofannual goal 0.0y&
Net first-year annual therms acquired to date as a percent of 8-year goal 0.017
Net cumulative therms acquired to date -
Total Acquired Lifecycle Impacts To Date?
Net Lifecycle kWh acquired to date -
Net Lifecycle therms acquired to date -
Committed8 Impacts (not yet acquired) This Month
Net First-year annual kWh committed this month 4,507 506
Net Lifecycle kWh committed this month 4,507,501
B-14
Appendix B
Net Utility Peak kW committed this month
Net first-year annual therms committed this month -
Net Lifecycle therms committed this month
Funds committed at this point in time 636,244
Overall Impacts (Acquired & Committed)
Net first-year annual kWh acquired & committed this month 5.099.999
Net utility peak kW acquired & committed this month -
Net First-year annual therms acquired & committed this month -
Costs
Total program budget 105,055,047
General Administration 50,591
Program Planning -
Program Marketing 2,500
Trade Ally Training -
Incentives and Services 207,156
Direct Program Implementation -
Evaluation 28.378
Total expenditures to date 288,625
Percent of total budget spent to date 0.31%
Participation
Number of program applications received to date 38
Number of program applications processed to date1° 3F
Number of processed applications approved to date
Percent of applications received to date that have been processed 100.0
B

Appendix B
Carbon Emission Reductions (in tons)
Total Acquired Net First-Year Carbon Emission Reductions To
Date 12 324
Total Acquired Cumulative Net Carbon Emission Reductions To
Date 324
NOTES:
1 First-year savings are defined as the annual savings expected from a given measure in the first year after installation. The annualsavings are sometimes the result of annualizing estimated savings that are based on data that cover less than one year.2 Peak is defined uniquely for each utility.
3Committed savings are defined as those for which funds have been encumbered by not yet spent. When the funds are spent (i.e.,
a rebate check has been sent to the participant on a specific date), the savings are then considered "acquired."
4An application is processed once the PA has reviewed the application and made a decision whether to approve the incentivepayment to the customer. Once the decision has been made to pay the incentive to the customer, these funds and their associatedenergy and demand impacts become "Committed."
5The application is approved once the decision has been made to pay the incentive to the customer. Note that these funds andtheir associated energy and demand impacts become "Committed" once this decision is made.
e See CO2 Reduction Values tab.
B-16

Appendix B
Program Administrator (PA) and Program ID' NYSERDA
Program Name CFL Expansion
Program Type 2 Residential
Total Acquired First-Year Impacts This Month"
Net first ear annual kWh acquired this month4 -
Monthly Net kWh Goal (based on net first-year annualskWh Goal) -
Percent of Monthly Net kWh Goal Acquired 0.0%
Net Peak kW acquired this month -
Monthly Net Peak kW Goal -
Percent of Monthly Peak kW Goal Acquired 0.0%%
Net First-year annual therms acquired this month -
Monthly Net Therm Goal -
Percent of Monthly Therm Goal Acquired 0.0`%
Net Lifecycle kWh acquired this month -
Net Lifecycle therms acquired this month -
Net Other Monthly Savings (MMBTUs) Acquired
Coal -
Kerosene
Oil
Propane
B
Appendix B
Total Acquired Net First-Year Impacts To Date
Net first ear annual kWh acquired to date -
Net first-year annual kWh acquired to date as a percent of annual goal 0.0%4,
Net first-year annual kWh acquired to date as a percent of 8 -year goal 0.0%
Net cumulative first-year annual kWh acquired to date -
Net utility kW reductions acquired to date -
Net utility peak kW reductions acquired to date as a percent of utility annual goal 0.0%
Net utility peak kW reductions acquired to date as a percent of 8-year goal 0.0%
Net NYISO peak kW reductions acquired to date -
Net first ear annual therms acquired to date -
Net first-year annual therms acquired to date as a percent of annual goal 0.0%
Net first-year annual therms acquired to date as a percent of 8 -year goal 0.01h,
Net cumulative therms acquired to date -
Total Acquired Lifecycle Impacts To Date?
Net Lifecycle kWh acquired to date -
Net Lifec cle therms acquired to date -
Committeds Impacts (not yet acquired) This Month
Net First-year annual kWh committed this month
Net Lifecycle kWh committed this month
Net Utility Peak kW committed this month
Net first-year annual therms committed this month
Net Lifecycle therms committed this month
Funds committed at this point in time 71
B-18
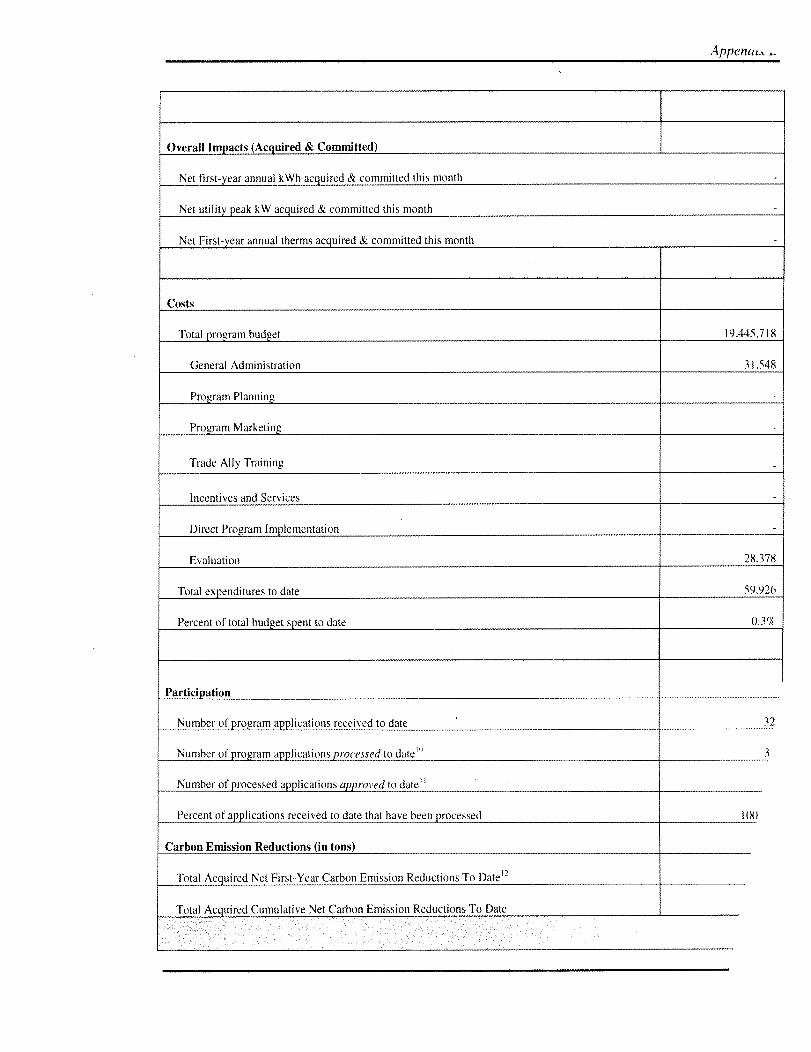
Appenat,
Overall Impacts (Acquired & Committed)
Net first-year annual kWh acquired & committed this month -
Net utility peak kW acquired & committed this month -
Net First ear annual therms acquired & committed this month -
Costs
Total program budget 19,445,718
General Administration 31,548
Program Planning -
Program Marketing
Trade Ally Training -
Incentives and Services -
Direct Program Implementation -
Evaluation 28,378
Total expenditures to date 59.920
Percent of total budget spent to date 0.3%
Participation
Number of program applications received to date 32
Number of program applications processed to date"' 3
Number of processed applications approved to date"
Percent of applications received to date that have been processed 100
Carbon Emission Reductions (in tons)
Total Acquired Net First-Year Carbon Emission Reductions To Date'
Total Acquired Cumulative Net Carbon Emission Reductions To Date

Appendix B
NOTES:
First-year savings are defined as the annual savings expected from a given measure in the first yearafter installation. The annual savings are sometimes the result of annualizing estimated savings that arebased on data that cover less than one year.
2 Peak is defined uniquely for each utility.
3Committed savings are defined as those for which funds have been encumbered by not yet spent.When the funds are spent (i.e., a rebate check has been sent to the participant on a specific date), thesavings are then considered "acquired."
4An application is processed once the PA has reviewed the application and made a decision whether toapprove the incentive payment to the customer. Once the decision has been made to pay the incentiveto the customer, these funds and their associated energy and demand impacts become "Committed."
The application is approved once the decision has been made to pay the incentive to the customer.Note that these funds and their associated energy and demand impacts become "Committed" once thisdecision is made.
B-20
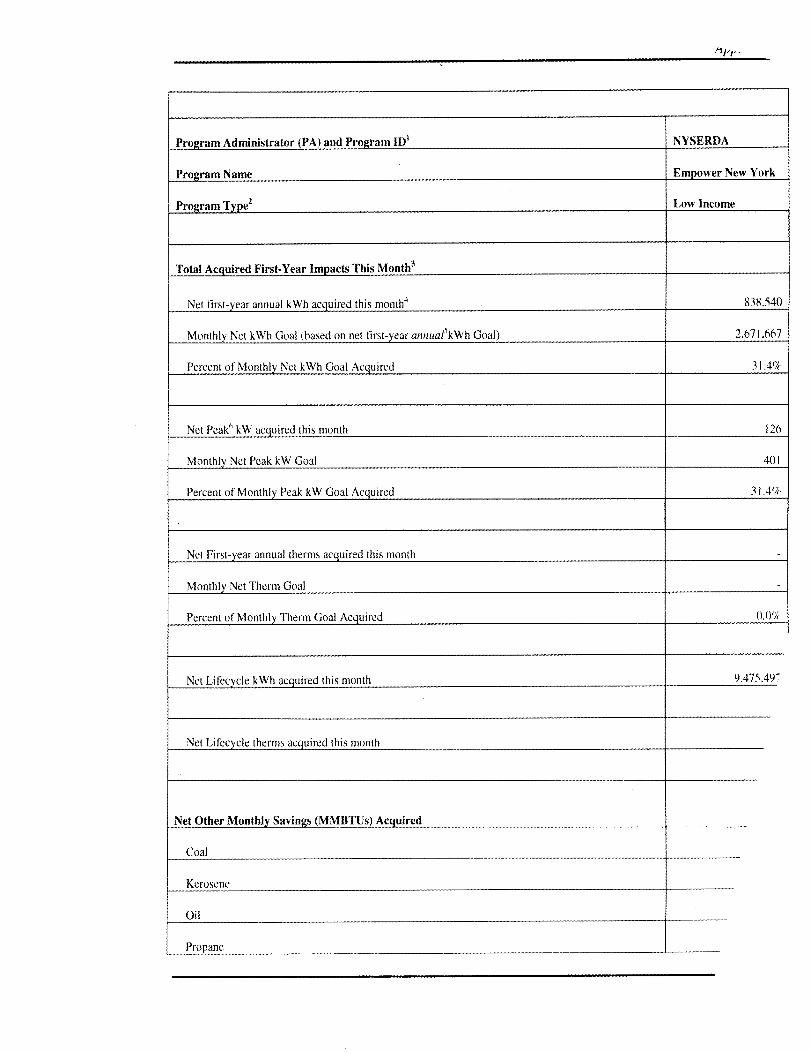
Pro ram Administrator (PA) and Program ID' NYSERDA
Program Name Empower New York
Program Type 2 Low Income
Total Acquired First-Year Impacts This Month;
Net first-year annual kWh acquired this month 838,540
Monthly Net kWh Goal (based on net first-ear annualskWh Goal) 2,671,667
Percent of Monthly Net kWh Goal Acquired 31.4(1(-
Net Peaks kW acquired this month 126
Monthly Net Peak kW Goal 401
Percent of Monthly Peak kW Goal Acquired 3 1.4 (7t
Net First-year annual therms acquired this month -
Monthly Net Therm Goal -
Percent of Monthly Therm Goal Acquired 0.0`1
Net Lifecycle kWh acquired this month 9,475.49"
Net Lifecycle therms acquired this month
Net Other Monthly Savings (MMBTUs) Acquired
coal
Kerosene
Oil
Propane
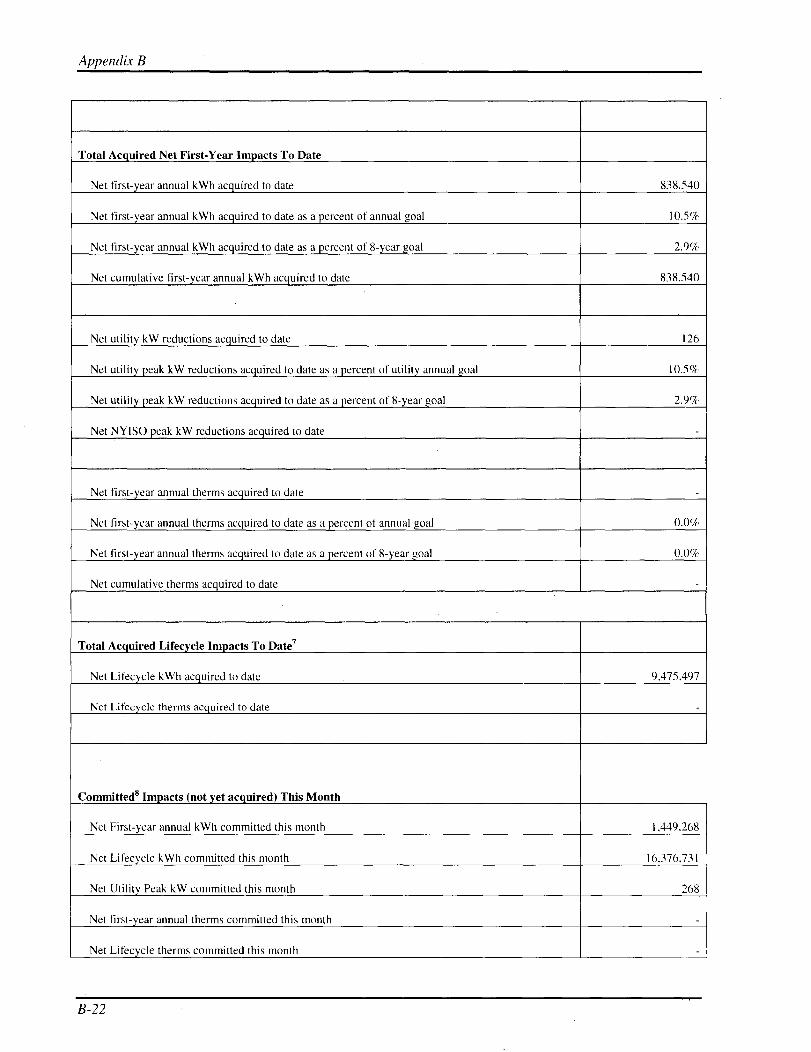
Appendix B
Total Acquired Net First-Year Impacts To Date
Net first-year annual kWh acquired to date 838,540
Net first-year annual kWh acquired to date as a percent of annual goal 10.5%
Net first-year annual kWh acquired to date as a percent of 8-year goal 2.9%
Net cumulative first ear annual kWh acquired to date 838,540
Net utility kW reductions acquired to date 126
Net utility peak kW reductions acquired to date as a percent of utility annual goal 10.5%
Net utility peak kW reductions acquired to date as a percent of 8-year goal 2.9%
Net NYISO peak kW reductions acquired to date -
Net first ear annual therms acquired to date -
Net first-year annual therms acquired to date as a percent of annual goal 0.0%
Net first-year annual therms acquired to date as a percent of 8-year goal 0.0%
Net cumulative therms acquired to date -
Total Acquired Lifecycle Impacts To Date?
Net Lifecycle kWh acquired to date 9,475,497
Net Lifecycle therms acquired to date -
Committed8 Impacts (not yet acquired) This Month
Net First-year annual kWh committed this month 1,449,268
Net Lifecycle kWh committed this month 16,376,731
Net Utility Peak kW committed this month 268
Net first-year annual therms committed this month -
Net Lifecycle therms committed this month -
B-22
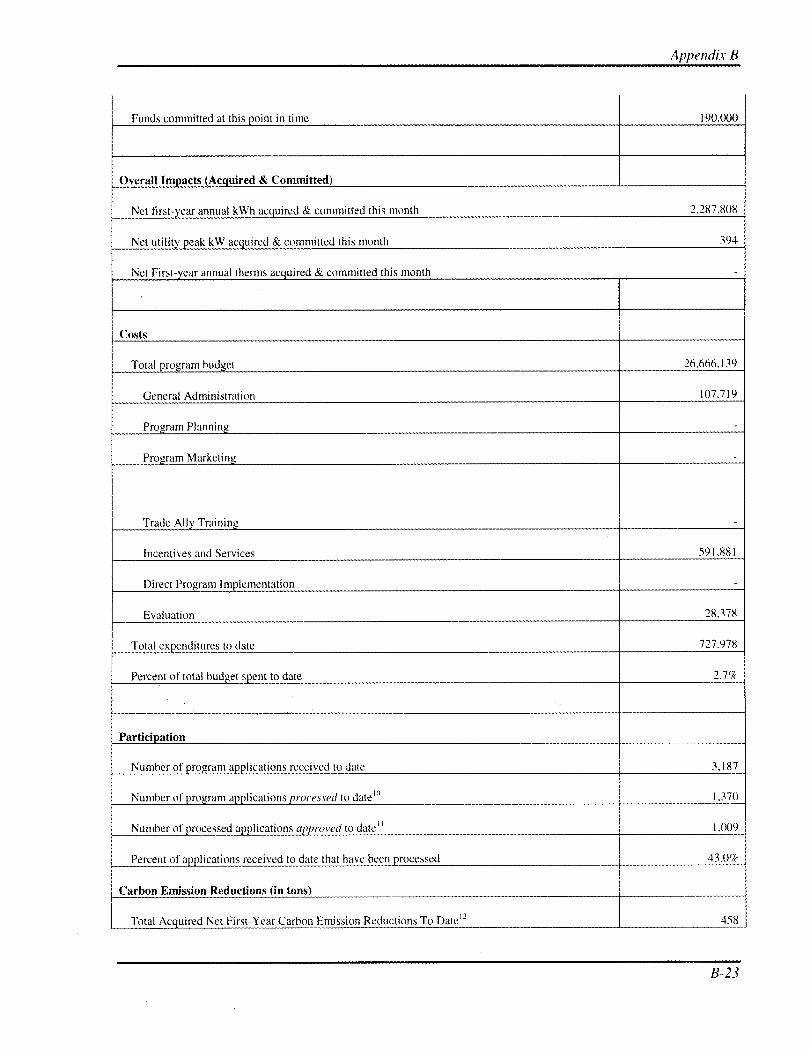
Appendix B
Funds committed at this point in time 190,000
Overall Impacts (Acquired & Committed)
Net first ear annual kWh acquired & committed this month 2,287,808
Net utility peak kW acquired & committed this month 394
Net First ear annual therms acquired & committed this month -
Costs
Total program budget 26.666,1 39
General Administration 107,719
Program Planning -
Program Marketing
Trade Ally Training -
Incentives and Services 591,881
Direct Program Implementation -
Evaluation 28.378
Total expenditures to date 727.978
Percent of total budget spent to date 2.717(
Participation
Number of program applications received to date 3,187
Number of program applications processed to date10 1.370
Number of processed applications approved to date'' 1,009
Percent of applications received to date that have been processed 43.0%
Carbon Emission Reductions (in tons)
Total Acquired Net First-Year Carbon Emission Reductions To Date'2 458
B-23

Appendix B
Total Acquired Cumulative Net Carbon Emission Reductions To Date 458
NOTES:
'First-year savings are defined as the annual savings expected from a given measure in the first year after installation. The annualsavings are sometimes the result of annualizing estimated savings that are based on data that cover less than one year.
2 Peak is defined uniquely for each utility.
;Committed savings are defined as those for which funds have been encumbered by not yet spent. When the funds are spent (i.e.,a rebate check has been sent to the participant on a specific date), the savings are then considered "acquired."
4An application is processed once the PA has reviewed the application and made a decision whether to approve the incentivepayment to the customer. Once the decision has been made to pay the incentive to the customer, these funds and their associatedenergy and demand impacts become "Committed."
5The application is approved once the decision has been made to pay the incentive to the customer. Note that these funds andtheir associated energy and demand impacts become "Committed" once this decision is made.
"See C02 Reduction Values tab.
B-24

Appendix B
Program Administrator (PA) and Program ID' NYSERDA
Program Name General Awareness
Program Type 2
Total Acquired First-Year Impacts This Month3
Net first ear annual kWh acquired this month4 -
Monthly Net kWh Goal (based on net first-year annualSkWh Goal) -
Percent of Monthly Net kWh Goal Acquired 0.0%
Net Peak' kW acquired this month -
Monthly Net Peak kW Goal -
Percent of Monthly Peak kW Goal Acquired 0.017(_
Net First ear annual therms acquired this month -
Monthly Net Therm Goal -
Percent of Monthly Therm Goal Acquired 0.0%7C
Net Lifecycle kWh acquired this month -
Net Lifecycle therms acquired this month -
Net Other Monthly Savings (MMBTUs) Acquired
Coal -
Kerosene -
Oil -
Propane -
B-25

Appendix B
Total Acquired Net First-Year Impacts To Date
Net first ear annual kWh acquired to date -
Net first-year annual kWh acquired to date as a percent of annual goal 0.017(
Net first ear annual kWh acquired to date as a percent of 8-year goal 0.0%
Net cumulative first-year annual kWh acquired to date -
Net utility kW reductions acquired to date -
Net utility peak kW reductions acquired to date as a percent of utility annual goal 0.0°Ic
Net utility peak kW reductions acquired to date as a percent of 8 -year goal 0.0%
Net NYISO peak kW reductions acquired to date -
Net first-year annual therms acquired to date -
Net first-year annual therms acquired to date as a percent of annual goal 0.0%
Net first ear annual therms acquired to date as a percent of 8-year goal 0.070
Net cumulative therms acquired to date -
Total Acquired Lifecycle Impacts To Date?
Net Lifec cle kWh acquired to date -
Net Lifecycle therms acquired to date -
Committeds Impacts (not yet acquired) This Month
Net First-year annual kWh committed this month -
Net Lifecycle kWh committed this month -
Net Utility Peak kW committed this month -
Net first-year annual therms committed this month -
Net Lifecycle therms committed this month -
Funds committed at this point in time -
B-26
Appendix B
Overall Impacts (Acquired & Committed)
Net first-year annual kWh acquired & committed this month -
Net utility peak kW acquired & committed this month -
Net First-year annual therms acquired & committed this month -
Costs
Total program budget 20,520,335
General Administration -
Program Planning
Program Marketing -
Trade Ally Training -
Incentives and Services -
Direct Program Implementation -
Evaluation 28,378
Total expenditures to date 28.378
Percent of total budget spent to date 0.1%
Participation
Number of program applications received to date
Number of program applications processed to date"' -
Number of processed applications approved to date'
Percent of applications received to date that have been processed 0.0°h
Carbon Emission Reductions (in tons)
Total Acquired Net First-Year Carbon Emission Reductions To Date 12 -
Total Acquired Cumulative Net Carbon Emission Reductions To Date -
B-27

Appendix B
NOTES:
First-year savings are defined as the annual savings expected from a given measure in the first year after installation. The annualsavings are sometimes the result of annualizing estimated savings that are based on data that cover less than one year.
2peak is defined uniquely for each utility.
3Committed savings are defined as those for which funds have been encumbered by not yet spent. When the funds are spent (i.e.,a rebate check has been sent to the participant on a specific date), the savings are then considered "acquired."
4An application is processed once the PA has reviewed the application and made a decision whether to approve the incentivepayment to the customer. Once the decision has been made to pay the incentive to the customer, these funds and their associatedenergy and demand impacts become "Committed."
5The application is approved once the decision has been made to pay the incentive to the customer. Note that these funds andtheir associated energy and demand impacts become "Committed" once this decision is made.
'See C02 Reduction Values tab.
B-28