Embed Size (px)
Citation preview

WWW.DEC.NY.GOV
RAMAPO RIVER
Stream Assessment Survey – Data Report
July 1, 2019

WWW.DEC.NY.GOV
Stream Assessment Survey – Data Report
Ramapo River
Orange and Rockland County, New York
Ramapo River Drainage Basin
Survey date: June to October 2018
Report date: July 1, 2019
Charles G. Stoll Brian T. Duffy
Diana L. Heitzman Jeff J. Lojpersberger
Carrie E. Smith Alexander J. Smith
Stream Monitoring and Assessment Section New York State Department of Environmental Conservation
Division of Water Bureau of Water Assessment and Management
Albany, New York

NYS DEC Stream Assessment Survey – Data Report
Ramapo River 2018 Report 2019
Page 3 of 102
For additional information regarding this report please contact:
Charles G. Stoll New York State Department of Environmental Conservation Stream Monitoring and Assessment Section 625 Broadway, 4th Floor, Albany, NY 12233 P: (518) 285-5699 | F: (518) 285-5601 | [email protected]

NYS DEC Stream Assessment Survey – Data Report
Ramapo River 2018 Report 2019
Page 4 of 102
Table of Contents
List of Tables .......................................................................................................................... 5 List of Figures ......................................................................................................................... 5 Background ............................................................................................................................ 6 Section I: Overview ..............................................................................................................10
Water chemistry and stream discharge ..............................................................................10 Benthic Macroinvertebrate Community ..............................................................................32 Stream Reach Physical Habitat Characteristics .................................................................34 Observer Ranking of Recreational Ability ...........................................................................36 Sediment and Porewater Microtox® Analysis .....................................................................39
Section II: Site-Specific Data Summary ................................................................................40 Ramapo River – River mile 18.6 ........................................................................................40 Kiryas-Joel Tributary 25 to Ramapo – River mile 0.3 .........................................................42 Kiryas-Joel Tributary 25 to Ramapo – Kiryas-Joel WWTF 001 ...........................................44 Kiryas-Joel Tributary 25 to Ramapo – River mile 0.2 .........................................................46 Ramapo River – River mile 16.8 ........................................................................................48 Ramapo River – River mile 16.7 ........................................................................................50 Ramapo River – Orange County STP 001 .........................................................................52 Ramapo River – River mile 16.5 ........................................................................................54 Ramapo River – River mile 16.1 ........................................................................................56 Ramapo River – River mile 13.3 ........................................................................................58 Ramapo River – River mile 11.8 ........................................................................................61 Ramapo River – River mile 4.8 ..........................................................................................63 Ramapo River – River mile 1.1 ..........................................................................................65
Section III: Literature Cited ....................................................................................................67 Section IV: Appendix ..............................................................................................................69
Appendix I: Instantaneous Discharge Measurements Methods ..........................................69 Appendix II: Discharge field sheet used for collection of flow data .....................................78 Appendix III: QA/QC Summary Report ...............................................................................79 Appendix IV: Assessment of Stream Reach Physical Habitat Field Sheet ..........................98 Appendix V: Observer Ranking of Recreational Ability Field Sheet .................................. 100 Appendix VI: Toxicity Fact Sheet ..................................................................................... 101

NYS DEC Stream Assessment Survey – Data Report
Ramapo River 2018 Report 2019
Page 5 of 102
List of Tables
Table 1. Ramapo River sampling locations (2018). .................................................................... 7 Table 2. Water chemistry analytes .............................................................................................11 Table 2. Water chemistry analytes .............................................................................................12 Table 3. Ranked habitat characteristics and calculated HMA ....................................................35 Table 4. Mean observer ranked values for contact recreation ...................................................37 Table 5. Ramapo River Microtox® sediment and porewater toxicity. .........................................39
LIST OF FIGURES
Figure 1. Map of 2018 Ramapo River sampling locations. ......................................................... 8 Figure 2. Map of WWTF discharges, public water supply intakes and well locations. ................. 9 Figure 3, Aluminum, Dissolved. .................................................................................................14 Figure 4, Chloride. ....................................................................................................................15 Figure 5, Copper, Dissolved. .....................................................................................................16 Figure 6, Copper, Total. ............................................................................................................17 Figure 7, Dissolved Oxygen (in situ). .........................................................................................18 Figure 8, Iron, Total. ..................................................................................................................19 Figure 9, Lead, Total. ................................................................................................................20 Figure 10, Nickel, Dissolved. .....................................................................................................21 Figure 11, Nitrogen, Nitrate. ......................................................................................................22 Figure 12, Nitrogen, Nitrite. .......................................................................................................23 Figure 13, Nitrogen, Total. ........................................................................................................24 Figure 14, pH (in situ). ...............................................................................................................25 Figure 15, Sodium. ....................................................................................................................26 Figure 17, Phosphorus, Total. ...................................................................................................28 Figure 18, Total Dissolved Solids. .............................................................................................29 Figure 19, Zinc, Dissolved. ........................................................................................................30 Figure 20, Zinc, Total. ...............................................................................................................31 Figure 21. Biological Assessment Profile (BAP) score impact categories. .................................32 Figure 22. Biological Assessment Profile (BAP). .......................................................................33 Figure 23. Mean observer ranking of recreational ability. ..........................................................37 Figure 24. Most frequently ranked factors for contact recreation. ..............................................38

NYS DEC Stream Assessment Survey – Data Report
Ramapo River 2018 Report 2019
Page 6 of 102
BACKGROUND The Ramapo River flows south and drains approximately 94 square miles within
southeastern New York State. Overall, 14 percent of the basin land use is identified as developed
with a concentrated area of development and impervious surface in the most upstream and
northernmost portion of the basin. Primary water quality concerns relate to waste water
discharges, nutrients, and stormwater runoff in the densely populated areas of the watershed.
In 2018, a Stream Assessment Survey was conducted by the Rotating Integrated Basin
Studies (RIBS) Program on the Ramapo River and tributaries (Figure 1). The RIBS Program
operates on a five-year, rotational schedule to generate statewide water quality data in support of
the Waterbody Inventory/Priority Waterbody List (WI/PWL) towards the goal of protection and
restoration of water quality resources (RIBS QAPP, 2018). The RIBS Program also conducts
special surveys outside of this five-year cycle to support Department-initiated priorities related to
water quality (RIBS QAPP, 2018). The objective of the Ramapo survey was to update condition
assessments for Waterbody Inventory/Priority Waterbody List (WI/PWL) segments 1501-0012,
1501-0036, and 1501-0037 and document potential impacts to the Ramapo River resulting from
two State Pollutant Discharge Elimination System (SPDES) permitted waste water treatment
facility (WWTF) (RAS QAPP, 2018).
Thirteen sampling locations (2 tributary, 2 WWTF outfalls, 9 mainstem Ramapo) were
selected to characterize the biological and chemical conditions within each WI/PWL segment of
the Ramapo River and to isolate potential impacts of point sources in the most upstream WI/PWL
segment (1501-0037). Two sampling locations were located in each WI/PWL segment for
condition assessments in both the downstream and middle WI/PWL segments (1501-0012 and
1501-0036, respectively), and nine sampling locations were distributed throughout the upstream
WI/PWL segment (1501-0037) where the WWTFs of interest are located (Table 1, Figure 1 and
Figure 2). The upstream WI/PWL locations, coupled with WWTF outfall sampling1 for Kiryas-Joel
(KJSTP-001) and Orange County Sewer District (OCSDSTP-001), were included to bracket
discharge outfalls for select WWTFs, and to characterize relative influence of those facilities on
water quality in the mainstem river. A reference site was also selected upstream of all selected
WWTFs for this evaluation to provide background condition information (Table 1, Figure 1 and
Figure 2). Additional WWTF discharge locations were identified throughout the watershed but not
selected for sampling. Locations are identified for reference (Table 1 and Figure 2).
To characterize the Ramapo River, the Bureau of Water Assessment and Management’s
Stream Monitoring and Assessment Section (SMAS) collected several measures of water quality
at each of the thirteen sampling locations between the months of July and October in 2018 (Table
1, Figure 1 and Figure 2). Measures of water quality included:
A) Water Chemistry and Stream Discharge
B) Benthic Macroinvertebrate Community
C) Stream Reach Physical Habitat Characteristics
D) Observer Ranking of Recreational Ability
1 OUTFALL SAMPLES WERE COLLECTED AT THE POINT OF DISCHARGE TO THE RECEIVING WATER

NYS DEC Stream Assessment Survey – Data Report
Ramapo River 2018 Report 2019
Page 7 of 102
E) Sediment and Porewater Microtox® Analysis
This data report provides water quality information in a format designed to update the
WI/PWL and document water quality violations. It has been structured into two primary sections:
I) an overview to convey results from the five measures of water quality described above at the
watershed and WI/PWL scale, and II) a site-specific data summary to present all major findings
for each sampling location. Additional sections (III, IV) include literature cited and appendices
covering all references and additional source material.
Table 1. Ramapo River (RAMA) sampling locations (2018). Locations are ordered from upstream to downstream according to river mile and mainstem confluence. Hashed red cell borders indicate the location of WWTF discharges between sampling locations and site location IDs in red indicate WWTF outfalls that were directly sampled as part of this survey. WWTF outfall numbers are included in the WWTF Location ID. *Locations sampled on a tributary to the mainstem river.
Location ID
River Mile
WI/PWL Waterbody
Classification Description Latitude Longitude
Upstr
eam
Sam
plin
g
Locatio
ns
RAMA 18.6 1501-0037
B Freeland Street 41.3237700 -74.1723000
RAMA_T25_3* 0.3 1501-0037
C Upstream of KJ outfall at Bakertown Rd
41.3324300 -74.1542600
WW
TF
KFSTP-001 0.25 1501-0037
C
Plant discharge entering Unnamed Trib to Ramapo
41.3330690 -74.1588700
Locatio
ns b
etw
een
sele
ct
WW
TF
RAMA_T25_3* 0.2 1501-0037
C Downstream of KJ outfall at Bakertown Rd
41.3350300 -74.1614600
RAMA 16.8 1501-0037
B 20 m below River Rd. bridge
41.3122200 -74.1488900
RAMA 16.7 1501-0037
B 5 m below Monroe Park pond
41.3102800 -74.1436100
WW
TF
OCSDSTP-001 16.6 1501-0037
C Plant discharge entering Ramapo
41.3104996 -74.1431091
Locatio
ns d
ow
nstr
eam
of
sele
cte
d W
WT
F
outf
alls
RAMA 16.5 1501-0037
C 50 m downstream of Route 17 bridge
41.3100000 -74.1427800
RAMA 16.1 1501-0037
C At Nepera plant bridge
41.3072200 -74.1369500
RAMA 13.3 1501-0036
A(T) 0.2 mi south of Arden bridge; end of Water St
41.2736100 -74.1533400
RAMA 11.8 1501-0036
A(T)
Adjacent to State Hwy 17, downstream of Warwick Brook
41.2501600 -74.1683200
RAMA 4.8 1501-0012
A(T) Seven Lakes D 41.1621000 -74.1887000
RAMA 1.1 1501-0012
A 50 m above 4th St. bridge
41.1251600 -74.1645500

NYS DEC Stream Assessment Survey – Data Report
Ramapo River 2018 Report 2019
Page 8 of 102
Figure 1. Map of 2018 Ramapo River (RAMA) sampling locations. Site names reference the Location ID and River Mile presented in Table 1.

NYS DEC Stream Assessment Survey – Data Report
Ramapo River 2018 Report 2019
Page 9 of 102
Figure 2. Map of WWTF discharges, public water supply intakes and well locations. Site names reference the Location ID and River Mile presented in Table 1.
NYS DEC Stream Assessment Survey – Data Report
Ramapo River 2018 Report 2019
Page 10 of 102
Section I: OVERVIEW
A) Water Chemistry and Stream Discharge
Methods used for water chemistry data collection are described by NYSDEC standard
operating procedures (SOP). The collection of water chemistry samples followed procedures
described in SOP #210-18 Collection of Water Column Samples for the Rotating Integrated Basin
Studies (RIBS) Program. Where the depth of water permitted, water chemistry samples were
collected using the depth-integrating suspended sediment sampler – wading (DH-81) method
(SOP #210-18, section 11.2). Where the depth of water was too shallow and when sampling
WWTF outfalls, water chemistry samples were collected using the direct grab method (SOP #210-
18, section 11.6). Water samples were processed using a contract lab with NYS Environmental
Laboratory Approval Program (ELAP) certification.
Stream discharge was measured using the velocity-area method according to Turnipseed
and Saur (2010). The velocity-area method (Midsection Method) calculates discharge by
subdividing a stream cross-section into 10 equally spaced stations and measuring depth and
velocity within each station and summing the products (Turnipseed and Saur, 2010). A top-set
wading rod and Sontek FlowTracker was used. Methods are described in detail in Turnipseed
and Sauer (2010) and Appendix I provides pertinent elements. Appendix II provides the field sheet
used in collection of stream depth and velocity for discharge calculations.
The collection of water chemistry samples and stream discharge included six sampling
events at all locations across a range of discharge conditions. Two sampling events (July 23,
2018 and October 1-2, 2018) were aimed at capturing the influence of a chicken processing facility
in Kiryas-Joel by sampling during planned plant shut-downs. Remaining sampling events were
conducted to document stream conditions at baseflow discharge. Ambient water chemistry
sampling included in situ and lab measured water quality analytes (Table 2). Chemistry results
were analyzed for exceedances of state water quality standards and summarized below using R
programing software (R Core Team, 2017). All raw chemistry results (in situ and lab reported)
with all applicable standards and exceedance determinations accompany this report as
Attachment I.
All Ramapo River survey data were subjected to the quality assurance/quality control
(QA/QC) protocols detailed in Appendix III. For water chemistry, an evaluation of the precision,
accuracy, and completeness of processed water chemistry samples after lab analyses were
performed following the methods detailed in part A of Appendix III of this report. Appendix III.B
includes a compilation of quality assurance results for each site. Only data meeting the highest
data quality standard are reported and used in this report (Appendix III).

NYS DEC Stream Assessment Survey – Data Report
Ramapo River 2018 Report 2019
Page 11 of 102
Table 2. Water chemistry analytes sampled as part of the Ramapo River Stream Assessment Survey. Table lists sampled analytes and analytical specifications. ^ Precision objectives are defined by results of duplicate samples as described in Appendix III.A
Analytes Analytical Lab Standard Method
Precision Accuracy Calibration Method
Detection Limit
Reporting Limit Initial Ongoing Blanks
Temperature in situ 2550 B ± 1oC ± 1.5oC Factory Set ~ ~ ~ ~
Dissolved Oxygen in situ 4500-O G ± 1% ± 2% Daily ~ ~ ~ ~
pH in situ 4500-H+B ± .05 SU ± .2 SU Weekly ~ ~ ~ ~
Salinity in situ Calculated 0.001 ppt ± 1% N/A ~ ~ ~ ~
Specific Conductance in situ 2510 B ± 1µs/cm ± 1% Weekly ~ ~ ~ ~
Nitrogen, Ammonia ALS D6919-09 ^ ± 20% As needed Every 10 Every 10 0.008 mg/L 0.01 mg/L
Total Kjeldahl Nitrogen ALS EPA 351.2 ^ ± 20% Daily Every 10 Every 10 0.08 mg/L 0.1 mg/L
Nitrogen, Nitrate ALS EPA 353.2 ^ ± 20% Daily Every 10 Every 10 0.02 mg/L 0.05 mg/L
Nitrogen, Total ALS Calculated ^
Total Phosphorus ALS EPA 365.1 ^ ± 20% Daily Every 10 Every 10 0.002 mg/L 0.003 mg/L
Ortho-phosphate ALS EPA 365.1 ^ ± 20% Daily Every 10 Every 10 0.001 mg/L 0.005 mg/L
Total Dissolved Solids ALS SM 2540C ^ ± 20% Daily Every 20 Every 20 4.0 mg/L 10 mg/L
Turbidity ALS EPA 180.1 ^ ± 10% Daily Every 10 Every 10 0.06 NTU 0.1 NTU
Dissolved Organic Carbon ALS 5310C ^ ± 20% As needed Ever 10 Every 10 0.4 mg/L 10 mg/L
Alkalinity ALS SM 2320B ^ ± 20% Daily Every 10 Every 10 1.0 mg/L 2.0 mg/L
Hardness ALS SM 2340C ^ ± 20% Daily Every 10 Every 10 0.3 mg/L 2.0 mg/L
Calcium ALS EPA 200.7 ^ ± 20% Daily Every 10 Every 10 0.1 mg/L 1.0 mg/L
Magnesium ALS EPA 200.7 ^ ± 20% Daily Every 10 Every 10 0.04 mg/L 1.0 mg/L
Potassium ALS EPA 200.7 ^ ± 20% Daily Every 10 Every 10 0.06 mg/L 2.0 mg/L

NYS DEC Stream Assessment Survey – Data Report
Ramapo River 2018 Report 2019
Page 12 of 102
Table 2. Water chemistry analytes sampled as part of the Ramapo River Stream Assessment Survey. Table lists sampled analytes and analytical specifications.
Analytes Analytical Lab Standard Method
Precision Accuracy Calibration Method
Detection Limit
Reporting Limit Initial Ongoing Blanks
Sodium ALS EPA 200.7 ^ ± 20% Daily Every 10 Every 10 0.03 mg/L 1.0 mg/L
Chloride ALS EPA 300.0 ^ ± 20% As needed Every 10 Every 10 0.02 mg/L 0.2 mg/L
Fluoride ALS EPA 300.0 ^ ± 20% As needed Every 10 Every 10 0.004 mg/L 0.1 mg/L
Sulfate ALS EPA 300.0 ^ ± 20% As needed Every 10 Every 10 0.02 mg/L 0.2 mg/L
Iron (total) ALS EPA 200.7 ^ ± 20% Daily Every 10 Every 10 6 µ/L 100 µ/L
Manganese (total) ALS EPA 200.7 ^ ± 20% Daily Every 10 Every 10 0.5 µ/L 10 µ/L
Arsenic (total) ALS EPA 200.8 ^ ± 20% Daily Every 10 Every 10 0.3 µ/L 1 µ/L
Silver (total) ALS EPA 200.8 ^ ± 20% Daily Every 10 Every 10 0.07 µ/L 1 µ/L
Aluminum (total) ALS EPA 200.8 ^ ± 20% Daily Every 10 Every 10 4.0 µ/L 50 µ/L
Cadmium (total) ALS EPA 200.8 ^ ± 20% Daily Every 10 Every 10 0.03 µ/L 1 µ/L
Copper (total) ALS EPA 200.8 ^ ± 20% Daily Every 10 Every 10 0.04 µ/L 1 µ/L
Lead (total) ALS EPA 200.8 ^ ± 20% Daily Every 10 Every 10 0.08 µ/L 1 µ/L
Nickel (total) ALS EPA 200.8 ^ ± 20% Daily Every 10 Every 10 0.04 µ/L 1 µ/L
Zinc (total) ALS EPA 200.8 ^ ± 20% Daily Every 10 Every 10 0.7 µ/L 10 µ/L
Aluminum (dissolved) ALS EPA 200.8 ^ ± 20% Daily Every 10 Every 10 0.9 µ/L 10 µ/L
Cadmium (dissolved) ALS EPA 200.8 ^ ± 20% Daily Every 10 Every 10 0.02 µ/L 1 µ/L
Copper (dissolved) ALS EPA 200.8 ^ ± 20% Daily Every 10 Every 10 0.02 µ/L 1 µ/L
Lead (dissolved) ALS EPA 200.8 ^ ± 20% Daily Every 10 Every 10 0.02 µ/L 1 µ/L
Nickel (dissolved) ALS EPA 200.8 ^ ± 20% Daily Every 10 Every 10 0.1 µ/L 1 µ/L
Zinc (dissolved) ALS EPA 200.8 ^ ± 20% Daily Every 10 Every 10 3 µ/L 5 µ/L

NYS DEC Stream Assessment Survey – Data Report
Ramapo River 2018 Report 2019
Page 13 of 102
Exceedances of Water Quality Standards
Exceedances of water quality standards occurred at every sampling location for several
of the analytes tested. A total of 30 lab-measured, and 6 in situ water quality analytes, were
analyzed at each of the 13 sampling locations. Out of the 1,444 lab-measured records and 396
in situ water quality records, there were 73 exceedances of established water quality standards
(6 NYCRR Part 703). There were exceedances in Aluminum (dissolved), Chloride, Copper
(dissolved), Dissolved Oxygen, Iron (total), Nitrite (expressed as Nitrogen), pH, and Total
Dissolved Solids. Nutrients are regulated by a narrative water quality standard stating: “None in
amounts that result in growths of algae, weeds, and slimes that will impair the waters for their
best usages” (6 NYCRR 703.2). There were instances of nutrient concentrations (Nitrate
(expressed as Nitrogen), Total Nitrogen, or Total Phosphorus) exceeding thresholds shown to
cause impacts to aquatic life (Smith et al. 2007; Smith and Tran 2010; Smith et al. 2013; Smith et
al. 2014). Exceedances varied in magnitude and were generally greater at sampling locations
closer to Kiryas-Joel and Orange County WWTFs.
Plots illustrating the range of analyte concentration values at each sampling location, in
river mile sequence from upstream to downstream, are included in this report (Figures 3 – 20).
Locations on a tributary are inserted between mainstem river mile locations. Analytes selected for
presentation were subset to those of specific interest to the study and those, as described above,
with exceedances of water quality standards and thresholds shown to impact aquatic life (Smith
et al. 2014). Therefore, the analytes presented here include: Aluminum (dissolved); Chloride;
Specific Conductance (in situ); Copper (total & dissolved); Dissolved Oxygen (in situ); Iron (total);
Lead (total); Nickel (dissolved); Nitrate, Nitrite, Total Nitrogen; pH (in situ); Sodium; Total
Phosphorus; Total Dissolved Solids; Zinc (total & dissolved). Site specific exceedances are
quantified in Section II.

NYS DEC Stream Assessment Survey – Data Report
Ramapo River 2018 Report 2019
Page 14 of 102
Figure 3, Aluminum, Dissolved. The X-axis presents sampling locations from upstream to downstream and axis labels correspond with Table 1, Figure 1 and Figure 2. The y-axis represents base log10 analyte concentrations. Point symbols match with WI/PWL segmentation as indicated in the plot legend. Gray symbols depict sampling dates (July 23, Oct 1-2) corresponding to shut down of the chicken processing facility and black corresponds to all other sample dates. The total number of reported values illustrated for each sampling location can vary due to non-detection and QA/QC procedures. Descriptions of removed records are presented in Appendix III. Exceedances of applicable water quality standards are listed in Section II.

NYS DEC Stream Assessment Survey – Data Report
Ramapo River 2018 Report 2019
Page 15 of 102
Figure 4, Chloride. The X-axis presents sampling locations from upstream to downstream and axis labels correspond with Table 1, Figure 1 and Figure 2. The y-axis represents base log10 analyte concentrations. Point symbols match with WI/PWL segmentation as indicated in the plot legend. Gray symbols depict sampling dates (July 23, Oct 1-2) corresponding to shut down of the chicken processing facility and black corresponds to all other sample dates. The total number of reported values illustrated for each sampling location can vary due to non-detection and the QA/QC procedures. Descriptions of removed records are presented in Appendix III. Where there are applicable standards and exceedances they are listed in Section II.

NYS DEC Stream Assessment Survey – Data Report
Ramapo River 2018 Report 2019
Page 16 of 102
Figure 5, Copper, Dissolved. The X-axis presents sampling locations from upstream to downstream and axis labels correspond with Table 1, Figure 1 and Figure 2. The y-axis represents base log10 analyte concentrations. Point symbols match with WI/PWL segmentation as indicated in the plot legend. Gray symbols depict sampling dates (July 23, Oct 1-2) corresponding to shut down of the chicken processing facility and black corresponds to all other sample dates. The total number of reported values illustrated for each sampling location can vary due to non-detection and the QA/QC procedures. Descriptions of removed records are presented in Appendix III. Where there are applicable standards and exceedances they are listed in Section II.

NYS DEC Stream Assessment Survey – Data Report
Ramapo River 2018 Report 2019
Page 17 of 102
Figure 6, Copper, Total. The X-axis presents sampling locations from upstream to downstream and axis labels correspond with Table 1, Figure 1 and Figure 2. The y-axis represents base log10 analyte concentrations. Point symbols match with WI/PWL segmentation as indicated in the plot legend. Gray symbols depict sampling dates (July 23, Oct 1-2) corresponding to shut down of the chicken processing facility and black corresponds to all other sample dates. The total number of reported values illustrated for each sampling location can vary due to non-detection and the QA/QC procedures. Descriptions of removed records are presented in Appendix III. Where there are applicable standards and exceedances they are listed in Section II.

NYS DEC Stream Assessment Survey – Data Report
Ramapo River 2018 Report 2019
Page 18 of 102
Figure 7, Dissolved Oxygen (in situ). The X-axis presents sampling locations from upstream to downstream and axis labels correspond with Table 1, Figure 1 and Figure 2. The y-axis represents base log10 analyte concentrations. Point symbols match with WI/PWL segmentation as indicated in the plot legend. Gray symbols depict sampling dates (July 23, Oct 1-2) corresponding to shut down of the chicken processing facility and black corresponds to all other sample dates. The total number of reported values illustrated for each sampling location can vary due to non-detection and the QA/QC procedures. Descriptions of removed records are presented in Appendix III. Where there are applicable standards and exceedances they are listed in Section II.
NYS DEC Stream Assessment Survey – Data Report
Ramapo River 2018 Report 2019
Page 19 of 102
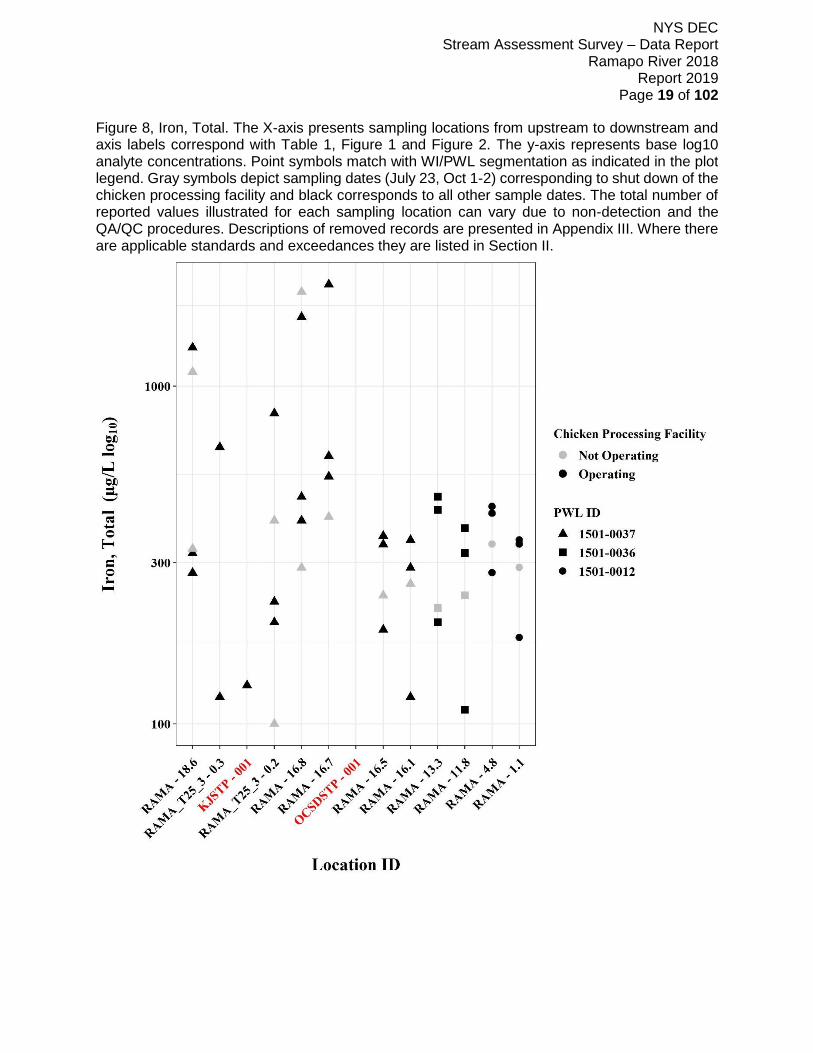
Figure 8, Iron, Total. The X-axis presents sampling locations from upstream to downstream and axis labels correspond with Table 1, Figure 1 and Figure 2. The y-axis represents base log10 analyte concentrations. Point symbols match with WI/PWL segmentation as indicated in the plot legend. Gray symbols depict sampling dates (July 23, Oct 1-2) corresponding to shut down of the chicken processing facility and black corresponds to all other sample dates. The total number of reported values illustrated for each sampling location can vary due to non-detection and the QA/QC procedures. Descriptions of removed records are presented in Appendix III. Where there are applicable standards and exceedances they are listed in Section II.

NYS DEC Stream Assessment Survey – Data Report
Ramapo River 2018 Report 2019
Page 20 of 102
Figure 9, Lead, Total. The X-axis presents sampling locations from upstream to downstream and axis labels correspond with Table 1, Figure 1 and Figure 2. The y-axis represents base log10 analyte concentrations. Point symbols match with WI/PWL segmentation as indicated in the plot legend. Gray symbols depict sampling dates (July 23, Oct 1-2) corresponding to shut down of the chicken processing facility and black corresponds to all other sample dates. The total number of reported values illustrated for each sampling location can vary due to non-detection and the QA/QC procedures. Descriptions of removed records are presented in Appendix III. Where there are applicable standards and exceedances they are listed in Section II.

NYS DEC Stream Assessment Survey – Data Report
Ramapo River 2018 Report 2019
Page 21 of 102
Figure 10, Nickel, Dissolved. The X-axis presents sampling locations from upstream to downstream and axis labels correspond with Table 1, Figure 1 and Figure 2. The y-axis represents base log10 analyte concentrations. Point symbols match with WI/PWL segmentation as indicated in the plot legend. Gray symbols depict sampling dates (July 23, Oct 1-2) corresponding to shut down of the chicken processing facility and black corresponds to all other sample dates. The total number of reported values illustrated for each sampling location can vary due to non-detection and the QA/QC procedures. Descriptions of removed records are presented in Appendix III. Where there are applicable standards and exceedances they are listed in Section II.

NYS DEC Stream Assessment Survey – Data Report
Ramapo River 2018 Report 2019
Page 22 of 102
Figure 11, Nitrogen, Nitrate. The X-axis presents sampling locations from upstream to downstream and axis labels correspond with Table 1, Figure 1 and Figure 2. The y-axis represents base log10 analyte concentrations. Point symbols match with WI/PWL segmentation as indicated in the plot legend. Gray symbols depict sampling dates (July 23, Oct 1-2) corresponding to shut down of the chicken processing facility and black corresponds to all other sample dates. The total number of reported values illustrated for each sampling location can vary due to non-detection and the QA/QC procedures. Descriptions of removed records are presented in Appendix III. Where there are applicable standards and exceedances they are listed in Section II.

NYS DEC Stream Assessment Survey – Data Report
Ramapo River 2018 Report 2019
Page 23 of 102
Figure 12, Nitrogen, Nitrite. The X-axis presents sampling locations from upstream to downstream and axis labels correspond with Table 1, Figure 1 and Figure 2. The y-axis represents base log10 analyte concentrations. Point symbols match with WI/PWL segmentation as indicated in the plot legend. Gray symbols depict sampling dates (July 23, Oct 1-2) corresponding to shut down of the chicken processing facility and black corresponds to all other sample dates. The total number of reported values illustrated for each sampling location can vary due to non-detection and the QA/QC procedures. Descriptions of removed records are presented in Appendix III. Where there are applicable standards and exceedances they are listed in Section II.
NYS DEC Stream Assessment Survey – Data Report
Ramapo River 2018 Report 2019
Page 24 of 102
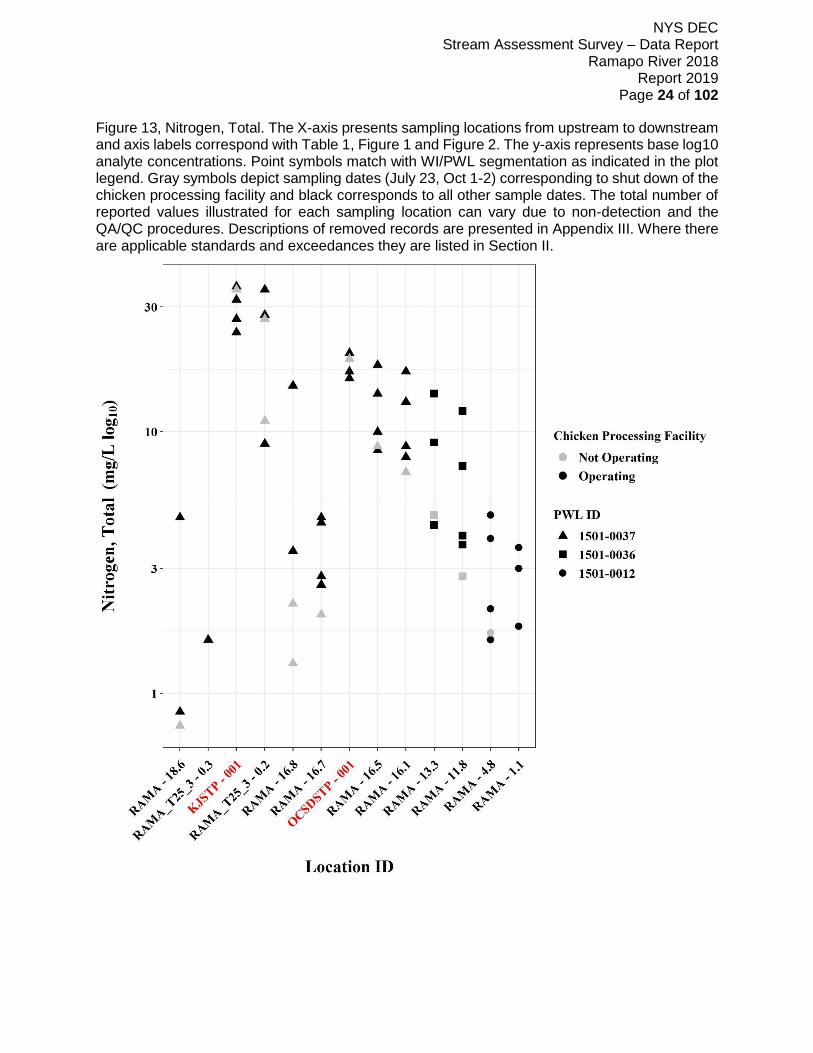
Figure 13, Nitrogen, Total. The X-axis presents sampling locations from upstream to downstream and axis labels correspond with Table 1, Figure 1 and Figure 2. The y-axis represents base log10 analyte concentrations. Point symbols match with WI/PWL segmentation as indicated in the plot legend. Gray symbols depict sampling dates (July 23, Oct 1-2) corresponding to shut down of the chicken processing facility and black corresponds to all other sample dates. The total number of reported values illustrated for each sampling location can vary due to non-detection and the QA/QC procedures. Descriptions of removed records are presented in Appendix III. Where there are applicable standards and exceedances they are listed in Section II.

NYS DEC Stream Assessment Survey – Data Report
Ramapo River 2018 Report 2019
Page 25 of 102
Figure 14, pH (in situ). The X-axis presents sampling locations from upstream to downstream and axis labels correspond with Table 1, Figure 1 and Figure 2. Point symbols match with WI/PWL segmentation as indicated in the plot legend. Gray symbols depict sampling dates (July 23, Oct 1-2) corresponding to shut down of the chicken processing facility and black corresponds to all other sample dates. The total number of reported values illustrated for each sampling location can vary due to non-detection and the QA/QC procedures. Descriptions of removed records are presented in Appendix III. Where there are applicable standards and exceedances they are listed in Section II.

NYS DEC Stream Assessment Survey – Data Report
Ramapo River 2018 Report 2019
Page 26 of 102
Figure 15, Sodium. The X-axis presents sampling locations from upstream to downstream and axis labels correspond with Table 1, Figure 1 and Figure 2. The y-axis represents base log10 analyte concentrations. Point symbols match with WI/PWL segmentation as indicated in the plot legend. Gray symbols depict sampling dates (July 23, Oct 1-2) corresponding to shut down of the chicken processing facility and black corresponds to all other sample dates. The total number of reported values illustrated for each sampling location can vary due to non-detection and the QA/QC procedures. Descriptions of removed records are presented in Appendix III. Where there are applicable standards and exceedances they are listed in Section II.

NYS DEC Stream Assessment Survey – Data Report
Ramapo River 2018 Report 2019
Page 27 of 102
Figure 16, Specific conductance (in situ). The X-axis presents sampling locations from upstream
to downstream and axis labels correspond with Table 1, Figure 1 and Figure 2. The y-axis
represents base log10 analyte concentrations. Point symbols match with WI/PWL segmentation
as indicated in the plot legend. Gray symbols depict sampling dates (July 23, Oct 1-2)
corresponding to shut down of the chicken processing facility and black corresponds to all other
sample dates. The total number of reported values illustrated for each sampling location can vary
due to non-detection and the QA/QC procedures. Descriptions of removed records are presented
in Appendix III. Where there are applicable standards and exceedances they are listed in Section
II.

NYS DEC Stream Assessment Survey – Data Report
Ramapo River 2018 Report 2019
Page 28 of 102
Figure 17, Phosphorus, Total. The X-axis presents sampling locations from upstream to downstream and axis labels correspond with Table 1, Figure 1 and Figure 2. The y-axis represents base log10 analyte concentrations. Point symbols match with WI/PWL segmentation as indicated in the plot legend. Gray symbols depict sampling dates (July 23, Oct 1-2) corresponding to shut down of the chicken processing facility and black corresponds to all other sample dates. The total number of reported values illustrated for each sampling location can vary due to non-detection and the QA/QC procedures. Descriptions of removed records are presented in Appendix III. Where there are applicable standards and exceedances they are listed in Section II.

NYS DEC Stream Assessment Survey – Data Report
Ramapo River 2018 Report 2019
Page 29 of 102
Figure 18, Total Dissolved Solids. The X-axis presents sampling locations from upstream to downstream and axis labels correspond with Table 1, Figure 1 and Figure 2. The y-axis represents base log10 analyte concentrations. Point symbols match with WI/PWL segmentation as indicated in the plot legend. Gray symbols depict sampling dates (July 23, Oct 1-2) corresponding to shut down of the chicken processing facility and black corresponds to all other sample dates. The total number of reported values illustrated for each sampling location can vary due to non-detection and the QA/QC procedures. Descriptions of removed records are presented in Appendix III. Where there are applicable standards and exceedances they are listed in Section II.

NYS DEC Stream Assessment Survey – Data Report
Ramapo River 2018 Report 2019
Page 30 of 102
Figure 19, Zinc, Dissolved. The X-axis presents sampling locations from upstream to downstream and axis labels correspond with Table 1, Figure 1 and Figure 2. The y-axis represents base log10 analyte concentrations. Point symbols match with WI/PWL segmentation as indicated in the plot legend. Gray symbols depict sampling dates (July 23, Oct 1-2) corresponding to shut down of the chicken processing facility and black corresponds to all other sample dates. The total number of reported values illustrated for each sampling location can vary due to non-detection and the QA/QC procedures. Descriptions of removed records are presented in Appendix III. Where there are applicable standards and exceedances they are listed in Section II.

NYS DEC Stream Assessment Survey – Data Report
Ramapo River 2018 Report 2019
Page 31 of 102
Figure 20, Zinc, Total. The X-axis presents sampling locations from upstream to downstream and axis labels correspond with Table 1, Figure 1 and Figure 2. The y-axis represents base log10 analyte concentrations. Point symbols match with WI/PWL segmentation as indicated in the plot legend. Gray symbols depict sampling dates (July 23, Oct 1-2) corresponding to shut down of the chicken processing facility and black corresponds to all other sample dates. The total number of reported values illustrated for each sampling location can vary due to non-detection and the QA/QC procedures. Descriptions of removed records are presented in Appendix III. Where there are applicable standards and exceedances they are listed in Section II.

NYS DEC Stream Assessment Survey – Data Report
Ramapo River 2018 Report 2019
Page 32 of 102
B) Benthic Macroinvertebrate Community
Benthic macroinvertebrate communities were sampled to evaluate water quality impacts
to the aquatic life use. Where appropriate riffle habitat was present, collection of
macroinvertebrates was preformed using the kick method described in section 9.4 of SOP #208-
18 Biological Monitoring of Surface Waters in New York State. The two WWTF outfalls and one
mainstem Ramapo River site (RAMA-16.7), situated immediately downstream of a ponded area
in Mary Harriman Park, Harriman, NY, where excluded from collection of macroinvertebrates.
Replicate (n=4/site) macroinvertebrate samples were collected once at base flow
discharge at each sampled location. The contents of replicate kick samples for each site were
field-inspected to determine major groups of organisms present, and then preserved in alcohol
for lab inspection and identification of 100-specimen subsamples. Specimens were identified to
lowest possible taxonomic resolution, typically genus or species.
Biological assessments of water quality are generated from Biological Assessment Profile
(BAP) scores (SOP #208-18). BAP scores are calculated by taking the average of five normalized
10-scale community metrics and assigning that score to a four-tiered system of impact category
of non (7.5-10), slight (5.0-7.5), moderate (2.5-5.0), or severe (0-2.5) impacts (Figure 21). A final
BAP score below 5 suggests that the sampled stream is not achieving its aquatic life use goals
(Figure 21; SOP #208-18). A BAP score above 5 indicates that the sampled stream is attaining
its aquatic life use goals (Figure 21; SOP #208-18). Expected variability in the results of benthic
macroinvertebrate community samples is presented in Smith and Bode (2004).
On average, Biological Assessment Profile (BAP) scores ranged from moderately to
slightly impacted across all sites on the Ramapo River and tributaries (SOP #208-18; Figure 22).
The three locations in closest downstream proximity to Kiryas-Joel (RAMA_T2-3-0.2) and Orange
County WWTFs (RAMA-16.5, RAMA-16.1) were below the BAP impairment threshold (Figure 22).
The three most downstream sites in the watershed (RAMA-11.8, RAMA-4.8, RAMA-1.1) fell
above the impairment threshold (Figure 22). Ninety-five percent confidence intervals suggest
inconclusive results for RAMA-18.6 and RAMA-13.3 (Figure 22).
Figure 21. Biological Assessment Profile (BAP) score impact categories based on the macroinvertebrate community. Scores below 5 suggest impairment to aquatic life and scores above 5 indicate attainment of aquatic life of use.

NYS DEC Stream Assessment Survey – Data Report
Ramapo River 2018 Report 2019
Page 33 of 102
Figure 22. Biological Assessment Profile (BAP) Scores and 95% confidence intervals for benthic macroinvertebrate community assessment data for the Ramapo River Survey, 2018. Symbology corresponds with WI/PWL segmentation as indicated in the plot legend. Solid and dashed red lines correspond to the Kiryas-Joel and Orange County WWTF discharge locations, respectively.
Se
ve
re
M
ode
rate
S
light N
on

NYS DEC Stream Assessment Survey – Data Report
Ramapo River 2018 Report 2019
Page 34 of 102
C) Stream Reach Physical Habitat Characteristics
Assessments of physical habitat conditions were performed by field crews at all sites
during macroinvertebrate collections following the methods detailed in section 9.10 of SOP #208-
18. The information collected in these assessments are used to calculate the Habitat Model
Affinity (HMA) (Table 3), an overall estimate of habitat quality which describes potential habitat
stress on aquatic life. The HMA is based on rankings of individual habitat characteristics on a
scale from 0 (poor) to 20 (optimal) which are then compared to a statewide reference condition
(Appendix IV). HMA scores are used to make final physical habitat assessments; Natural (80-
100), Altered (70 – 80), Moderate (60 – 70), and Severe (< 60). Results are described in terms of
percent similarity to the reference condition.
Habitat model affinity (HMA) scores and resulting final physical habitat assessments
ranged from natural to severe alteration across all sites (SOP #208-18; Table 3). Physical habitat
final assessments demonstrate that habitat was not a determining factor influencing benthic
communities at most sampling locations where macroinvertebrates were collected (Table 3);
natural (n=5), altered (n=3), moderate (n=1), severe (n=1). This was, in part, due to the extent of
undeveloped areas surrounding stream reaches near selected sites. Similarly, while many of the
sampling locations in the upstream WI/PWL segment (1501-0037) were situated in urbanized
areas, the physical habitat directly surrounding sampling locations is protected from development
due to land ownership; i.e. municipal and state property.

NYS DEC Stream Assessment Survey – Data Report
Ramapo River 2018 Report 2019
Page 35 of 102
Table 3. Ranked habitat characteristics and calculated HMA for the Ramapo River Survey, 2018. Epifaunal substrate (Epi. Cover); Embeddedness/Pool Substrate Characterization (Embed. Pool.); Velocity Depth Regime/Pool Variability (Vel/Dep Reg.); Sediment Deposition (Sed. Dep.); Channel Flow Status (Flow Status); Channel Alteration (Chan. Alt.); Riffle Frequency/Stream Sinuosity (Rif. Freq.); Left/Right Bank Stability (L/R Bank Stab.); Left/Right Bank Vegetative Cover (L/R Bank Veg.); Left/Right Bank Riparian Vegetative Zone Width (L/R Rip. Width).
Location ID Collection
Date Gradient
Epi. Cover
Embed. Pool.
Vel/Dep Reg.
Sed. Dep.
Flow Status
Chan. Alt.
Rif. Freq.
RAMA-18.6 9/6/2018 High 15 15 16 16 8 15 16
RAMA_T25_3-0.3
8/22/2018 High 16 12 12 10 15 4 15
RAMA_T25_3-0.2
8/22/2018 High 11 12 16 15 20 10 12
RAMA-16.8 9/6/2018 High 12 8 7 10 15 15 5
RAMA-16.5 8/21/2018 High 15 13 20 20 20 18 19
RAMA-16.1 8/21/2018 High 20 3 18 14 19 17 10
RAMA-13.3 8/21/2018 High 10 15 15 20 18 5 16
RAMA-11.8 8/21/2018 High 15 14 15 20 20 20 4
RAMA-4.8 8/21/2018 High 19 17 20 20 20 18 13
RAMA-1.1 8/21/2018 High 16 13 15 15 20 16 18
Location ID Collection
Date Gradient
L Bank Stab.
R Bank Stab.
L Bank Veg.
R Bank Veg.
L Rip. Width
R Rip. Width
HMA Score
Final Assessment
RAMA-18.6 9/6/2018 High 6 5 6 8 6 8 77.35 Altered
RAMA_T25_3-0.3
8/22/2018 High 6 8 8 8 3 8 69.06 Altered
RAMA_T25_3-0.2
8/22/2018 High 10 10 10 10 7 10 81.77 Natural
RAMA-16.8 9/6/2018 High 8 6 4 6 2 3 55.8 Severe
RAMA-16.5 8/21/2018 High 10 10 10 10 10 10 96.69 Natural
RAMA-16.1 8/21/2018 High 4 6 8 8 10 10 78.45 Altered
RAMA-13.3 8/21/2018 High 6 6 6 6 2 1 68.51 Moderate
RAMA-11.8 8/21/2018 High 7 7 9 9 10 10 84.53 Natural
RAMA-4.8 8/21/2018 High 10 10 10 10 6 5 92.82 Natural
RAMA-1.1 8/21/2018 High 10 10 10 10 7 3 87.29 Natural
NYS DEC Stream Assessment Survey – Data Report
Ramapo River 2018 Report 2019
Page 36 of 102
D) Observer Ranking of Recreational Ability
Perceptions of recreational ability were ranked at all sampling locations during each site
visit as per standard site visit protocols (SOP #208-18). The observer ranking of recreational
ability is a method of evaluating impacts to recreational use of a stream segment. Impacts to
recreational use have been correlated with “impairment of aquatic life use from nutrient
enrichment” and rankings below slightly impacted are indicative of significant impacts to
recreational ability (Smith et al. 2014). The ranking assesses primary (1°) and secondary (2°)
contact recreation, as well as a user’s desire to fish.
The first two questions of the recreational use evaluation describe the observers perceived
ability to participate in 1° and 2° contact recreation (Appendix V). Results of this ranking are the
primary gauge of whether the Ramapo River is achieving its designated recreational uses. Figure
22 illustrates the average observer ranking for desire to participate in 1° and 2° contact recreation
at each sampling location. Results of this survey suggest observers (NYSDEC field staff)
considered the desire to participate in 1° and 2° contact recreation to be slightly impacted at
sampling locations RAMA-13.3 south to RAMA 1.1, the Ramapo sampling location directly above
the pond in Mary Harriman Park, Harriman, NY (RAMA-16.8), and the upstream reference site
(RAMA-18.6). Sampling locations located in the upper WI/PWL segment (1501-0037), especially
those in proximity to WWTF, were largely considered impossible for 1° and 2° contact recreation.
Additional questions on a scale of 0-10 (0 – Best/Natural; 10 Worst/Severe) help
determine the factors influencing the user’s perception. Those factors are: 1) Water Clarity; 2)
Trash; 3) Periphyton; 4) Odor; 5) Discharge Pipes. Table 4 shows the mean recorded value for
these factors at each sampling location and Figure 23 shows the most commonly selected factors
reducing an observer’s desire to participate in 1° and 2° contact recreation. Other factors
described by observers were: 1) Low Dissolved Oxygen; 2) Proximity to Road; 3) Proximity to a
State Superfund Site; 4) Proximity to WWTF effluent discharge.

NYS DEC Stream Assessment Survey – Data Report
Ramapo River 2018 Report 2019
Page 37 of 102
Table 4. Mean observer ranked value for factors influencing desire to participate in 1° and 2° contact recreation in the Ramapo River, 2018. Factors were ranked on a 10 scale (0 – Best/Natural; 10 Worst/Severe) according to perceived impact on a location. Ranking of recreation ability was performed for all locations during each site visit.
Location ID Water Clarity
Suspended Phytoplankton
Periphyton Macrophyte Odor Trash Discharge
Pipes
RAMA-18.6 3 0 1 1 0 1 0
RAMA_T25_3-0.3 5 0 5 0 7 10 1
KJSTP-001 3 0 6 3 6 9 10
RAMA_T25_3-0.2 4 0 5 2 5 8 7
RAMA-16.8 5 0 3 1 1 3 0
RAMA-16.7 5 3 6 3 7 2 10
OCSDSTP-001 3 1 5 0 9 2 10
RAMA-16.5 2 1 7 2 5 4 1
RAMA-16.1 3 0 5 1 6 1 0
RAMA-13.3 3 0 2 0 4 1 0
RAMA-11.8 2 0 4 0 3 4 0
RAMA-4.8 5 0 5 0 2 3 1
RAMA-1.1 2 0 4 1 4 3 3
0
1
2
3
4
5
6
1° CONTACT
2° CONTACT
6: Not applicable (headwater/high flows/dry, etc.)
5: Awful! 1° and 2° degree contact recreation impossible.
4: Desire to participate in 1° and 2° contact recreation substantially reduced.
3: 1° and 2° contact recreation slightly impacted.
2: Minor aesthetic problems, but still excellent for 1° and 2° contact recreation.
1: Beautiful, could not be nicer. Ability to swim, wade, dive, water ski, etc…fully attained.
Location ID
Me
an
Ob
serv
er
Ra
nkin
g
Figure 23. Mean observer ranking of recreational ability for Ramapo River sampling locations. Columns represent observer rankings for the desire to participate in 1° and 2° contact recreation. Ranking of recreation ability was performed for all locations during each site visit.

NYS DEC Stream Assessment Survey – Data Report
Ramapo River 2018 Report 2019
Page 38 of 102
0
1
2
3
4
5
6
1° CONTACT
2° CONTACT
6: Other
5: Discharge Pipes
4: Odor
3: Periphyton
2: Trash
1: Water Clarity
Figure 24. Most frequently ranked factor influencing observer desire to participate in 1° and 2° contact recreation in the Ramapo River. Factors influencing desire to recreate were ranked and a primary factor influencing the desire to participate in 1° and 2° contact recreation was chosen during each site visit. Column values represent the factor selected most frequently at each site.
LOCATION
ID
Dom
inant F
acto
r In
fluencin
g
1°
and 2
° C
onta
ct R
ecre
ation

NYS DEC Stream Assessment Survey – Data Report
Ramapo River 2018 Report 2019
Page 39 of 102
E) Sediment and Porewater Microtox® Analysis
Toxicity testing of surface waters, sediments, porewaters, and effluents are routinely
performed as part of the RIBS program (https://www.dec.ny.gov/chemical/29854.html). Sediment
toxicity was evaluated according to SOP #403-16 Microtox® Acute Toxicity Test for Sediments,
Porewaters and Effluents. Testing procedures use a bioassay to assess potential acute toxicity in
sediments and surface waters to aquatic life (SOP #403-16). Sediment and extracted sediment
porewater samples are tested using a bioluminescent bacterium Vibrio fischeri (V. fischeri). Tests
are a measure of light reduction between collected samples and a control following a 15-minute
exposure period and expressed as the median effect concentration (EC50) of a sample that
causes a 50% reduction in light emission from the V. fischeri. Appendix VI (Fact Sheet: Acute &
Chronic Toxicity Assessments of NY Streams & Rivers) describes toxicity testing procedures,
Assessment criteria and results classifications.
Porewater toxicity was found to be non-toxic at all sampled locations while sediment
toxicity ranged from non-toxic to severely toxic (Table 5). Sediment at the upstream reference
sampling location (RAMA-18.6) was non-toxic. Sediment at the sampling location on Tributary 25
immediately downstream of the Kiryas-Joel WWTF (RAMA_T25-0.2) was severely toxic (Table
5). Sediment at the two Ramapo River sampling locations immediately downstream of the Orange
County WWTF (RAMA-16.5, RAMA-16.1) was severely toxic (Table 5). Sediment at the most
downstream Ramapo River sampling location (RAMA-1.1) was slightly toxic (Table 5).
Table 5. Ramapo River Microtox® sediment and porewater toxicity results for select locations in the Ramapo River Survey, 2018. Sediment samples were collected for toxicity testing in baseflow conditions during macroinvertebrate community collection at sampling locations.
Location ID Sample
Date Test Date
Sediment
Assessment
Porewater
Assessment
Sediment
EC50 Porewater EC50
RAMA-18.6 9/6/2018 10/11/2018 Non-toxic Non-toxic 68.75 > 100
RAMA_T25_3-0.2 8/22/2018 10/11/2018 Severely Toxic Non-toxic 6.842 > 100
RAMA-16.5 8/21/2018 10/11/2018 Severely Toxic Non-toxic 13.78 > 100
RAMA-16.1 8/21/2018 10/11/2018 Severely Toxic Non-toxic 19.64 > 100
RAMA-1.1 8/21/2018 10/11/2018 Slightly Toxic Non-toxic 44.05 > 100

NYS DEC Stream Assessment Survey – Data Report
Ramapo River 2018 Report 2019
Page 40 of 102
Section II: SITE-SPECIFIC DATA SUMMARY
Section II provides a summary of results from each sampling location. Data provided includes
waterbody class and WI/PWL number along with a summary of metal, general chemistry, and in
situ chemistry results, BAP scores and instantaneous discharge. Water chemistry results are
summarized by number of records reported after quality assurance (Appendix III), exceedances
of water quality standards and a statistical summary that includes mean, median, minimum, and
maximum concentrations. Specific exceedances of water quality standards are also specified.
Complete, quality assured raw chemistry data results accompanied by all applicable standards
are available in Attachment I. BAP scores are provided and include a statistical summary of
results for each site that includes mean, impairment threshold, minimum, maximum, standard
deviation and standard error. Instantaneous stream discharge (cubic feet/second) is reported for
dates when conditions allowed safe, wadeable access to streams (RAS QAPP 2018; SOP
#210-18).
Ramapo River – River mile 18.6
Waterbody Class: B | WI/PWL: 1501-0037
Metals:
General Chemistry:
Analyte Fraction Record Count
Exceedances Mean Median Min Max Units
Total Alkalinity Total 6 N/A 103.33 104.5 69 130 mg/L
Dissolved Organic Carbon
Dissolved 6 N/A 6.22 6 3.4 8.5 mg/L
Chloride Total 6 N/A 148.17 135 99 240 mg/L
Fluoride Total 2 0 0.1 0.1 0.1 0.1 mg/L
Hardness Total 6 N/A 159.67 135 98 290 mg/L
Nitrate+Nitrite as Nitrogen
Total 3 N/A 1.57 0.35 0.17 4.2 mg/L
Nitrogen, Total Total 3 N/A 2.1 0.85 0.75 4.7 mg/L
Nitrogen, Ammonia Total 3 0 0.06 0.03 0.025 0.12 mg/L
Total Kjeldahl Nitrogen
Total 2 N/A 0.54 0.54 0.44 0.64 mg/L
Nitrogen, Nitrate Total 6 N/A 0.89 0.26 0.11 4.2 mg/L
Analyte Fraction Record Count
Exceedances Mean Median Min Max Units
Aluminum Dissolved 2 0 37.5 37.5 22 53 µg/L
Arsenic Total 3 0 1.5 1.5 1.4 1.6 µg/L
Calcium Total 6 N/A 45000 38000 28000 83000 µg/L
Copper Dissolved 6 0 3.62 3 2 7.2 µg/L
Copper Total 6 N/A 4.28 3.95 2.4 7.3 µg/L
Iron Total 5 N/A 666 330 280 1300 µg/L
Lead Dissolved 1 0 1 1 1 1 µg/L
Lead Total 2 N/A 2.35 2.35 2.1 2.6 µg/L
Magnesium Total 6 N/A 11300 9400 7200 20000 µg/L
Manganese Total 6 N/A 426.33 190 88 1700 µg/L
Nickel Dissolved 4 0 1.48 1.4 1.1 2 µg/L
Sodium Total 6 N/A 106333 83000 66000 220000 µg/L
Zinc Total 2 0 7.5 7.5 7 8 µg/L

NYS DEC Stream Assessment Survey – Data Report
Ramapo River 2018 Report 2019
Page 41 of 102
General Chemistry:
Analyte Fraction Record Count
Exceedances Mean Median Min Max Units
Nitrogen, Nitrite Total 1 0 0.01 0.01 0.01 0.01 mg/L
Ortho-phosphate Dissolved 4 N/A 0.03 0.02 0.02 0.04 mg/L
Total Phosphorus Total 6 N/A 0.07 0.05 0.03 0.12 mg/L
Sulfate Total 5 N/A 11.84 11 7.4 19 mg/L
Total Dissolved Solids
Total 5 0 342 350 280 410 mg/L
Turbidity Total 2 N/A 8.8 8.8 3.6 14 ntu
In situ Water Quality Characteristics:
Analyte Fraction Record Count
Exceedances Mean Median Min Max Units
Specific Conductance
Total 6 N/A 765 710 510 1200 µS/cm
Dissolved Oxygen Dissolved 6 1 5.92 6.15 3.4 7.8 mg/L
Percent Saturation Total 6 N/A 68 73 38 81 std unit
pH Total 6 0 7.38 7.45 7.1 7.5 pH
units
Salinity Total 6 N/A 0.38 0.35 0.25 0.6 ppm
Water Temperature Total 6 N/A 21.67 22.5 17 25 deg c
Water Quality Standard Exceedances:
Analyte Fraction Sample Date Standard Result Value Units
Dissolved Oxygen Dissolved 7/11/2018 < 4.0 3.4 mg/L
Biological Assessment Profile Score Summary:
n Mean Impairment Threshold Min Max Std. Dev Std. Err
4 4.85 5 4.39 5.2 0.34 0.17
Instantaneous Discharge (ft3/s), Ramapo - 18.6. Points represent the calculated instantaneous
stream discharge measured during each site visit when conditions permitted.
0
10
20
30
40
50
60
10-Jul 24-Jul 7-Aug 21-Aug 4-Sep 18-Sep 2-OctInsta
nta
neous D
ischarg
e (
ft3
/s)
Collection Date

NYS DEC Stream Assessment Survey – Data Report
Ramapo River 2018 Report 2019
Page 42 of 102
Kiryas-Joel Tributary 25 to Ramapo – River mile 0.3
Waterbody Class: C | WI/PWL: 1501-0037
Metals:
Analyte Fraction Record Count
Exceedances Mean Median Min Max Units
Aluminum Dissolved 2 1 72.5 72.5 15 130 µg/L
Arsenic Total 1 0 1 1 1 1 µg/L
Calcium Total 2 N/A 20000 20000 14000 26000 µg/L
Copper Dissolved 2 0 2.75 2.75 2.4 3.1 µg/L
Copper Total 2 N/A 3.2 3.2 2.9 3.5 µg/L
Iron Total 2 N/A 390 390 120 660 µg/L
Lead Dissolved 1 0 1.1 1.1 1.1 1.1 µg/L
Lead Total 1 N/A 1.5 1.5 1.5 1.5 µg/L
Magnesium Total 2 N/A 4400 4400 3300 5500 µg/L
Manganese Total 2 N/A 55 55 47 63 µg/L
Nickel Dissolved 2 0 2.15 2.15 1.5 2.8 µg/L
Potassium Total 1 N/A 6200 6200 6200 6200 µg/L
Sodium Total 2 N/A 41500 41500 28000 55000 µg/L
Zinc Total 1 0 8.5 8.5 8.5 8.5 µg/L
General Chemistry:
Analyte Fraction Record Count
Exceedances Mean Median Min Max Units
Total Alkalinity Total 2 N/A 50 50 42 58 mg/L
Dissolved Organic Carbon
Dissolved 2 N/A 7.6 7.6 5.2 10 mg/L
Chloride Total 2 N/A 61.5 61.5 35 88 mg/L
Hardness Total 2 N/A 67.5 67.5 48 87 mg/L
Nitrate+Nitrite as Nitrogen
Total 1 N/A 0.52 0.52 0.52 0.52 mg/L
Nitrogen, Total Total 1 N/A 1.6 1.6 1.6 1.6 mg/L
Nitrogen, Ammonia Total 1 0 0.02 0.02 0.02 0.02 mg/L
Nitrogen, Nitrate Total 2 N/A 0.81 0.81 0.52 1.1 mg/L
Ortho-phosphate Dissolved 1 N/A 0.05 0.05 0.05 0.05 mg/L
Total Phosphorus Total 2 N/A 0.06 0.06 0.03 0.09 mg/L
Sulfate Total 1 N/A 9.2 9.2 9.2 9.2 mg/L
Total Dissolved Solids
Total 2 0 215 215 150 280 mg/L

NYS DEC Stream Assessment Survey – Data Report
Ramapo River 2018 Report 2019
Page 43 of 102
In situ Water Quality Characteristics:
Analyte Fraction Record Count
Exceedances Mean Median Min Max Units
Specific Conductance
Total 2 N/A 335 335 220 450 µS/cm
Dissolved Oxygen Dissolved 2 0 7.3 7.3 7.1 7.5 mg/L
Percent Saturation Total 2 N/A 85 85 84 86 std unit
pH Total 2 0 6.95 6.95 6.9 7 pH
units
Salinity Total 2 N/A 0.17 0.17 0.11 0.22 ppm
Water Temperature Total 2 N/A 20.5 20.5 20 21 deg c
Water Quality Standard Exceedances:
Analyte Fraction Sample Date Standard Result Value Units
Aluminum Dissolved 8/22/2018 100 130 µg/L
Biological Assessment Profile Score Summary:
No benthic macroinvertebrates were collected at this location due to stream reach physical
habitat.
Instantaneous Discharge (ft3/s), Kiryas-Joel Tributary 25 to Ramapo – 0.3. Points represent the
calculated instantaneous stream discharge measured during each site visit when conditions
permitted.
0
1
2
10-Jul 24-Jul 7-Aug 21-Aug 4-Sep 18-Sep 2-OctInsta
nta
neous D
ischarg
e (
ft3
/s)
Collection Date

NYS DEC Stream Assessment Survey – Data Report
Ramapo River 2018 Report 2019
Page 44 of 102
Kiryas-Joel Tributary 25 to Ramapo – Kiryas-Joel WWTF 001
Waterbody Class: C | WI/PWL: 1501-0037
Metals:
Analyte Fraction Record Count
Exceedances Mean Median Min Max Units
Aluminum Dissolved 5 N/A 40.4 26 16 110 µg/L
Arsenic Total 1 N/A 1.1 1.1 1.1 1.1 µg/L
Calcium Total 6 N/A 67666.7 66000 58000 81000 µg/L
Copper Dissolved 6 N/A 17.4 14.5 4.3 40 µg/L
Copper Total 6 N/A 17.95 14.5 4.6 40 µg/L
Iron Total 2 N/A 130 130 130 130 µg/L
Magnesium Total 6 N/A 20000 19500 19000 22000 µg/L
Manganese Total 6 N/A 321.67 285 110 570 µg/L
Nickel Dissolved 6 N/A 7.73 7.75 4.4 10 µg/L
Sodium Total 6 N/A 658333 790000 11000
0 120000
0 µg/L
Zinc Dissolved 5 N/A 33.12 36 9.6 62 µg/L
Zinc Total 5 N/A 34.2 38 11 61 µg/L
General Chemistry:
Analyte Fraction Record Count
Exceedances Mean Median Min Max Units
Total Alkalinity Total 6 N/A 14.2 8.2 5.6 46 mg/L
Dissolved Organic Carbon
Dissolved 6 N/A 4.11667 3.8 3 6.1 mg/L
Chloride Total 6 N/A 1113.33 1300 220 2100 mg/L
Fluoride Total 3 N/A 0.116667 0.1 0.1 0.15 mg/L
Hardness Total 6 N/A 251.667 250 220 290 mg/L
Nitrate+Nitrite as Nitrogen
Total 3 N/A 30.6667 34 24 34 mg/L
Nitrogen, Total Total 6 N/A 31 32 24 36 mg/L
Nitrogen, Ammonia
Total 5 N/A 0.414 0.38 0.17 0.68 mg/L
Total Kjeldahl Nitrogen
Total 3 N/A 1.4 1.4 1.3 1.5 mg/L
Nitrogen, Nitrate Total 6 N/A 30 31 24 34 mg/L
Nitrogen, Nitrite Total 5 N/A 0.1186 0.099 0.041 0.25 mg/L
Ortho-phosphate Dissolved 4 N/A 0.0899 0.022 0.0056 0.31 mg/L
Total Phosphorus Total 6 N/A 0.1615 0.096 0.068 0.42 mg/L
Sulfate Total 5 N/A 54 51 49 60 mg/L
Total Dissolved Solids
Total 6 N/A 2115 2350 630 3800 mg/L
Turbidity Total 1 N/A 1.2 1.2 1.2 1.2 ntu

NYS DEC Stream Assessment Survey – Data Report
Ramapo River 2018 Report 2019
Page 45 of 102
In situ Water Quality Characteristics:
Analyte Fraction Record Count
Exceedances Mean Median Min Max Units
Specific Conductance
Total 6 N/A 3733.33 4150 1100 6600 µS/cm
Dissolved Oxygen Dissolved 6 N/A 7.6 7.65 6.9 8.2 mg/L
Percent Saturation Total 6 N/A 91.5 92 82 100 std unit
pH Total 6 N/A 6.93 6.95 6.6 7.2 pH
units
Salinity Total 6 N/A 2.00 2.2 0.56 3.6 ppm
Water temperature Total 6 N/A 23.5 23.5 21 26 deg c
Water Quality Standard Exceedances:
Water quality standards are not applicable due to this sampling location occurring at the point at
which a WWTF outfall discharges into the stream.
Biological Assessment Profile Score Summary:
No benthic macroinvertebrates were collected at this location due to stream reach physical
habitat.
Instantaneous Discharge (ft3/s), Kiryas-Joel Tributary 25 to Ramapo – Kiryas-Joel WWTF 001
(KJSTP-001). Points represent the calculated instantaneous stream discharge measured during
each site visit when conditions permitted.
0
1
2
10-Jul 24-Jul 7-Aug 21-Aug 4-Sep 18-Sep 2-OctInsta
nta
neous D
ischarg
e (
ft3
/s)
Collection Date

NYS DEC Stream Assessment Survey – Data Report
Ramapo River 2018 Report 2019
Page 46 of 102
Kiryas-Joel Tributary 25 to Ramapo – River mile 0.2
Waterbody Class: C | WI/PWL: 1501-0037
Metals:
Analyte Fraction Record Count
Exceedances Mean Median Min Max Units
Aluminum Dissolved 5 1 56.2 21 13 160 µg/L
Arsenic Total 1 0 1.2 1.2 1.2 1.2 µg/L
Calcium Total 6 N/A 56666.7 62500 31000 81000 µg/L
Copper Dissolved 6 1 13.32 11.45 3.9 34 µg/L
Copper Total 6 N/A 14.83 13 4.1 37 µg/L
Iron Total 5 N/A 352 230 100 830 µg/L
Lead Dissolved 1 0 1 1 1 1 µg/L
Lead Total 1 N/A 1.6 1.6 1.6 1.6 µg/L
Magnesium Total 6 N/A 16333.3 18000 9100 22000 µg/L
Manganese Total 6 N/A 258.67 225 92 510 µg/L
Nickel Dissolved 6 0 6.32 5.5 3.6 9.8 µg/L
Potassium Total 1 N/A 32000 32000 32000 32000 µg/L
Sodium Total 6 N/A 555000 575000 77000 120000
0 µg/L
Zinc Dissolved 5 0 23.42 21 6.1 42 µg/L
Zinc Total 5 N/A 26.8 25 11 45 µg/L
General Chemistry:
Analyte Fraction Record Count
Exceedances Mean Median Min Max Units
Total Alkalinity Total 6 N/A 24.1 23 6.8 47 mg/L
Dissolved Organic Carbon
Dissolved 6 N/A 5.3 4.5 2.9 8.3 mg/L
Chloride Total 6 N/A 898.33 880 140 2000 mg/L
Fluoride Total 1 0 0.1 0.1 0.1 0.1 mg/L
Hardness Total 6 N/A 210 235 120 290 mg/L
Nitrate+Nitrite as Nitrogen
Total 3 N/A 22.63 26 7.9 34 mg/L
Nitrogen, Total Total 6 N/A 22.83 27 9 35 mg/L
Nitrogen, Ammonia Total 4 0 0.38 0.33 0.19 0.68 mg/L
Total Kjeldahl Nitrogen
Total 3 N/A 1.17 1.2 1 1.3 mg/L
Nitrogen, Nitrate Total 6 N/A 21.72 26 7.9 34 mg/L
Nitrogen, Nitrite Total 5 3 0.10 0.11 0.03 0.18 mg/L
Ortho-phosphate Dissolved 3 N/A 0.07 0.04 0.02 0.16 mg/L
Total Phosphorus Total 6 N/A 0.12 0.10 0.06 0.23 mg/L
Sulfate Total 5 N/A 42.6 44 23 57 mg/L
Total Dissolved Solids
Total 6 5 1701.67 1700 360 3600 mg/L
Turbidity Total 2 N/A 5.7 5.7 1.4 10 ntu

NYS DEC Stream Assessment Survey – Data Report
Ramapo River 2018 Report 2019
Page 47 of 102
In situ Water Quality Characteristics:
Analyte Fraction Record Count
Exceedances Mean Median Min Max Units
Specific Conductance
Total 6 N/A 3091.67 2850 960 6300 µS/cm
Dissolved Oxygen Dissolved 6 0 6.45 6.35 6.2 6.9 mg/L
Percent Saturation Total 6 N/A 77 78 71 81 std unit
pH Total 6 0 7.18 7.2 7 7.3 pH
units
Salinity Total 6 N/A 1.65 1.51 0.47 3.4 ppm
Water temperature Total 6 N/A 22.5 22.5 20 25 deg c
Water Quality Standard Exceedances:
Analyte Fraction Sample Date Standard Result Value Units
Aluminum Dissolved 8/22/2018 100 160 µg/L
Copper Dissolved 9/6/2018 22.44 34 µg/L
Nitrogen, Nitrite Total 7/11/2018 0.1 0.11 mg/L
Nitrogen, Nitrite Total 9/6/2018 0.1 0.15 mg/L
Nitrogen, Nitrite Total 10/2/2018 0.1 0.18 mg/L
Total Dissolved Solids Total 7/11/2018 500 2300 mg/L
Total Dissolved Solids Total 8/1/2018 500 2300 mg/L
Total Dissolved Solids Total 8/22/2018 500 1100 mg/L
Total Dissolved Solids Total 9/6/2018 500 3600 mg/L
Total Dissolved Solids Total 10/2/2018 500 550 mg/L
Biological Assessment Profile Score Summary: n Mean Impairment Threshold Min Max Std. Dev Std. Err
4 4.04 5 3.65 4.2 0.26 0.13
Instantaneous Discharge (ft3/s), Kiryas-Joel Tributary 25 to Ramapo – 0.2. Points represent the
calculated instantaneous stream discharge measured during each site visit when conditions
permitted.
0
1
2
3
4
5
10-Jul 24-Jul 7-Aug 21-Aug 4-Sep 18-Sep 2-OctInsta
nta
neous D
ischarg
e (
ft3
/s)
Collection Date

NYS DEC Stream Assessment Survey – Data Report
Ramapo River 2018 Report 2019
Page 48 of 102
Ramapo River – River mile 16.8
Waterbody Class: B | WI/PWL: 1501-0037
Metals:
Analyte Fraction Record Count
Exceedances Mean Median Min Max Units
Aluminum Dissolved 2 0 64 64 40 88 µg/L
Arsenic Total 2 0 1.5 1.5 1.5 1.5 µg/L
Calcium Total 6 N/A 45666.7 41500 29000 81000 µg/L
Copper Dissolved 6 0 4.07 3.55 3 7.4 µg/L
Copper Total 6 N/A 5.08 4.75 3.2 8.2 µg/L
Iron Total 5 N/A 932 470 290 1900 µg/L
Lead Total 2 N/A 2.4 2.4 2.4 2.4 µg/L
Magnesium Total 6 N/A 12016.7 10500 7100 23000 µg/L
Manganese Total 6 N/A 179.83 170 69 330 µg/L
Nickel Dissolved 5 0 1.8 1.4 1 3.9 µg/L
Potassium Total 1 N/A 4600 4600 4600 4600 µg/L
Sodium Total 6 N/A 148333 86500 64000 420000 µg/L
Zinc Dissolved 1 0 5.9 5.9 5.9 5.9 µg/L
Zinc Total 3 N/A 11.3 11 6.9 16 µg/L
General Chemistry:
Analyte Fraction Record Count
Exceedances Mean Median Min Max Units
Total Alkalinity Total 6 N/A 100.83 104 76 120 mg/L
Dissolved Organic Carbon
Dissolved 6 N/A 5.78 5.35 4.7 7.3 mg/L
Chloride Total 6 N/A 289.5 205 97 740 mg/L
Fluoride Total 1 0 0.11 0.11 0.11 0.11 mg/L
Hardness Total 6 N/A 165 150 100 300 mg/L
Nitrate+Nitrite as Nitrogen
Total 3 N/A 0.79 0.49 0.17 1.7 mg/L
Nitrogen, Total Total 4 N/A 5.5 2.85 1.3 15 mg/L
Nitrogen, Ammonia Total 3 0 0.04 0.02 0.02 0.06 mg/L
Total Kjeldahl Nitrogen
Total 2 N/A 0.67 0.67 0.64 0.69 mg/L
Nitrogen, Nitrate Total 6 N/A 3.47 1.18 0.16 15 mg/L
Nitrogen, Nitrite Total 2 0 0.02 0.02 0.01 0.04 mg/L
Ortho-phosphate Dissolved 4 N/A 0.03 0.03 0.03 0.04 mg/L
Total Phosphorus Total 6 N/A 0.07 0.05 0.03 0.13 mg/L
Sulfate Total 5 N/A 19.1 15 9.5 40 mg/L
Total Dissolved Solids
Total 5 2 480 390 260 810 mg/L
Turbidity Total 2 N/A 15.45 15.45 2.9 28 ntu

NYS DEC Stream Assessment Survey – Data Report
Ramapo River 2018 Report 2019
Page 49 of 102
In situ Water Quality Characteristics:
Analyte Fraction Record Count
Exceedances Mean Median Min Max Units
Specific Conductance
Total 6 N/A 1201.67 945 540 2700 µS/cm
Dissolved Oxygen Dissolved 6 0 7.68 7.7 6.6 8.6 mg/L
Percent Saturation Total 6 N/A 87.17 88 79 94 std unit
pH Total 6 0 7.65 7.75 7.2 7.8 pH
units
Salinity Total 6 N/A 0.61 0.46 0.26 1.4 ppm
Water temperature Total 6 N/A 21.5 22 16 24 deg c
Water Quality Standard Exceedances:
Analyte Fraction Sample Date Standard Result Value Units
Total Dissolved Solids Total 8/1/2018 500 620 mg/L
Total Dissolved Solids Total 9/6/2018 500 810 mg/L
Biological Assessment Profile Score Summary:
n Mean Impairment Threshold Min Max Std. Dev Std. Err
4 5.6 5 5.55 5.69 0.06 0.03
Instantaneous Discharge (ft3/s), Ramapo – 16.8. Points represent the calculated instantaneous
stream discharge measured during each site visit when conditions permitted.
0
10
20
30
40
50
60
70
80
90
10-Jul 24-Jul 7-Aug 21-Aug 4-Sep 18-Sep 2-OctInsta
nta
neous D
ischarg
e (
ft3
/s)
Collection Date

NYS DEC Stream Assessment Survey – Data Report
Ramapo River 2018 Report 2019
Page 50 of 102
Ramapo River – River mile 16.7
Waterbody Class: B | WI/PWL: 1501-0037
Metals:
Analyte Fraction Record Count
Exceedances Mean Median Min Max Units
Aluminum Dissolved 3 0 16.67 12 12 26 µg/L
Arsenic Total 3 0 1.73 1.9 1.4 1.9 µg/L
Calcium Total 5 N/A 46800 46000 41000 55000 µg/L
Copper Dissolved 5 0 4.36 4 2.9 6.9 µg/L
Copper Total 5 N/A 5.42 4.8 3.3 10 µg/L
Iron Total 4 N/A 892.5 580 410 2000 µg/L
Lead Total 2 N/A 2.5 2.5 1.6 3.4 µg/L
Magnesium Total 5 N/A 13000 12000 10000 16000 µg/L
Manganese Total 5 N/A 178 180 110 250 µg/L
Nickel Dissolved 5 0 1.82 1.7 1.4 2.4 µg/L
Sodium Total 5 N/A 157600 130000 78000 240000 µg/L
Zinc Dissolved 1 0 7.4 7.4 7.4 7.4 µg/L
Zinc Total 3 N/A 10.43 5.8 5.5 20 µg/L
General Chemistry:
Analyte Fraction Record Count
Exceedances Mean Median Min Max Units
Total Alkalinity Total 5 N/A 113.2 120 96 120 mg/L
Dissolved Organic Carbon
Dissolved 5 N/A 5.7 5.8 5 6.2 mg/L
Chloride Total 5 N/A 268 220 130 430 mg/L
Fluoride Total 4 0 0.11 0.11 0.1 0.12 mg/L
Hardness Total 5 N/A 168 160 140 200 mg/L
Nitrate+Nitrite as Nitrogen
Total 3 N/A 2.4 2.2 1.4 3.6 mg/L
Nitrogen, Total Total 5 N/A 3.32 2.8 2 4.7 mg/L
Nitrogen, Ammonia Total 2 0 0.06 0.06 0.05 0.06 mg/L
Total Kjeldahl Nitrogen
Total 1 N/A 1.2 1.2 1.2 1.2 mg/L
Nitrogen, Nitrate Total 5 N/A 2.46 2.2 1.4 3.6 mg/L
Nitrogen, Nitrite Total 3 0 0.04 0.03 0.02 0.09 mg/L
Ortho-phosphate Dissolved 1 N/A 0.02 0.02 0.02 0.02 mg/L
Total Phosphorus Total 5 N/A 0.06 0.06 0.04 0.07 mg/L
Sulfate Total 5 N/A 18.4 17 13 28 mg/L
Total Dissolved Solids
Total 5 4 612 540 390 840 mg/L
Turbidity Total 2 N/A 4.1 4.1 3.5 4.7 ntu

NYS DEC Stream Assessment Survey – Data Report
Ramapo River 2018 Report 2019
Page 51 of 102
In situ Water Quality Characteristics:
Analyte Fraction Record Count
Exceedances Mean Median Min Max Units
Specific Conductance
Total 5 N/A 1114 940 650 1700 µS/cm
Dissolved Oxygen Dissolved 5 0 9.32 9 7.6 12 mg/L
Percent Saturation Total 5 N/A 113.8 110 94 150 std unit
pH Total 5 2 8.36 7.9 7.9 9.3 pH
units
Salinity Total 5 N/A 0.55 0.46 0.32 0.84 ppm
Water temperature Total 5 N/A 25.2 25 17 30 deg c
Water Quality Standard Exceedances:
Analyte Fraction Sample Date Standard Result Value Units
PH Total 7/10/2018 8.5-6.5 9.3 pH units
PH Total 9/5/2018 8.5-6.5 8.8 pH units
Total Dissolved Solids Total 7/10/2018 500 840 mg/L
Total Dissolved Solids Total 7/31/2018 500 540 mg/L
Total Dissolved Solids Total 8/21/2018 500 500 mg/L
Total Dissolved Solids Total 9/5/2018 500 790 mg/L
Biological Assessment Profile Score Summary:
No benthic macroinvertebrates were collected at this location due to stream reach physical
habitat.
Instantaneous Discharge (ft3/s), Ramapo – 16.7.
No flow data acquired at this sampling location due to influence of dam weir and stream braiding.
NYS DEC Stream Assessment Survey – Data Report
Ramapo River 2018 Report 2019
Page 52 of 102
Ramapo River – Orange County STP 001
Waterbody Class: C | WI/PWL: 1501-0037
Metals:
Analyte Fraction Record Count
Exceedances Mean Median Min Max Units
Calcium Total 5 N/A 62400 62000 58000 67000 µg/L
Copper Dissolved 5 N/A 15.4 15 14 17 µg/L
Copper Total 5 N/A 16.2 16 15 18 µg/L
Magnesium Total 5 N/A 16200 16000 14000 20000 µg/L
Manganese Total 5 N/A 23.4 23 14 40 µg/L
Nickel Dissolved 5 N/A 2.82 2.8 2.5 3.1 µg/L
Sodium Total 5 N/A 148000 150000 140000 160000 µg/L
Zinc Dissolved 4 N/A 34.5 32 25 49 µg/L
Zinc Total 4 N/A 35.25 33 26 49 µg/L
General Chemistry:
Analyte Fraction Record Count
Exceedances Mean Median Min Max Units
Total Alkalinity Total 5 N/A 107.8 110 99 110 mg/L
Dissolved Organic Carbon
Dissolved 5 N/A
7.2 6.8 6.6 8.2 mg/L
Chloride Total 5 N/A 252 250 240 270 mg/L
Fluoride Total 5 N/A 0.12 0.12 0.12 0.13 mg/L
Hardness Total 5 N/A 222 220 200 250 mg/L
Nitrate+Nitrite as Nitrogen
Total 3 N/A
17 17 16 18 mg/L
Nitrogen, Total Total 5 N/A 18.2 19 16 20 mg/L
Nitrogen, Ammonia Total 3 N/A 0.14 0.08 0.06 0.3 mg/L
Total Kjeldahl Nitrogen
Total 2 N/A
1.2 1.2 1.2 1.2 mg/L
Nitrogen, Nitrate Total 5 N/A 16.6 17 15 18 mg/L
Nitrogen, Nitrite Total 4 N/A 0.06 0.04 0.01 0.14 mg/L
Ortho-phosphate Dissolved 2 N/A 2.75 2.75 2.3 3.2 mg/L
Total Phosphorus Total 5 N/A 2.86 3.2 2.1 3.4 mg/L
Sulfate Total 4 N/A 39.25 38 36 45 mg/L
Total Dissolved Solids
Total 5 N/A
700 710 650 740 mg/L
Turbidity Total 1 N/A 1.3 1.3 1.3 1.3 ntu

NYS DEC Stream Assessment Survey – Data Report
Ramapo River 2018 Report 2019
Page 53 of 102
In situ Water Quality Characteristics:
Analyte Fraction Record Count
Exceedances Mean Median Min Max Units
Specific Conductance
Total 5 N/A
1200 1200 1100 1400 µS/cm
Dissolved Oxygen Dissolved 5 N/A 8.32 8.4 7.8 8.5 mg/L
Percent Saturation Total 5 N/A
97.8 100 92 100 std unit
pH Total 5 N/A
7.4 7.4 7.2 7.6 pH
units
Salinity Total 5 N/A 0.60 0.61 0.54 0.7 ppm
Water temperature Total 5 N/A 22.6 23 21 24 deg c
Water Quality Standard Exceedances:
Water quality standards are not applicable due to this sampling location occurring at the point at
which a WWTF outfall discharges into the stream.
Biological Assessment Profile Score Summary:
No benthic macroinvertebrates were collected at this location due to stream reach physical
habitat.
Instantaneous Discharge (ft3/s), Orange County STP 001. Points represent the calculated
instantaneous stream discharge measured during each site visit when conditions permitted.
0
1
2
3
4
5
6
7
8
9
10-Jul 24-Jul 7-Aug 21-Aug 4-Sep 18-Sep 2-OctInsta
nta
neous D
ischarg
e (
ft3
/s)
Collection Date

NYS DEC Stream Assessment Survey – Data Report
Ramapo River 2018 Report 2019
Page 54 of 102
Ramapo River – River mile 16.5
Waterbody Class: C | WI/PWL: 1501-0037
Metals:
Analyte Fraction Record Count
Exceedances Mean Median Min Max Units
Aluminum Dissolved 1 0 11 11 11 11 µg/L
Arsenic Total 2 0 1.1 1.1 1 1.2 µg/L
Calcium Total 5 N/A 56200 53000 47000 66000 µg/L
Copper Dissolved 5 0 10.5 8.6 7.6 14 µg/L
Copper Total 5 N/A 11.58 9.7 8.1 16 µg/L
Iron Total 4 N/A 282.5 290 190 360 µg/L
Lead Total 1 N/A 1.2 1.2 1.2 1.2 µg/L
Magnesium Total 5 N/A 14800 14000 11000 20000 µg/L
Manganese Total 5 N/A 75.6 66 35 120 µg/L
Nickel Dissolved 5 0 2.32 2 1.8 3 µg/L
Sodium Total 5 N/A 140000 140000 100000 170000 µg/L
Zinc Dissolved 4 0 24.25 25.5 11 35 µg/L
Zinc Total 4 N/A 26.75 27 13 40 µg/L
General Chemistry:
Analyte Fraction Record Count
Exceedances Mean Median Min Max Units
Total Alkalinity Total 5 N/A 114 110 110 120 mg/L
Dissolved Organic Carbon
Dissolved 5 N/A 6.68 6.3 6 7.9 mg/L
Chloride Total 5 N/A 244 240 170 300 mg/L
Fluoride Total 5 0 0.12 0.11 0.11 0.13 mg/L
Hardness Total 5 N/A 202 190 160 250 mg/L
Nitrate+Nitrite as Nitrogen
Total 3 N/A 9.6 8.1 7.7 13 mg/L
Nitrogen, Total Total 5 N/A 11.86 10 8.5 18 mg/L
Nitrogen, Ammonia Total 2 0 0.08 0.08 0.07 0.10 mg/L
Total Kjeldahl Nitrogen
Total 1 N/A 1.2 1.2 1.2 1.2 mg/L
Nitrogen, Nitrate Total 5 N/A 11 9.2 7.7 17 mg/L
Nitrogen, Nitrite Total 4 0 0.03 0.04 0.01 0.05 mg/L
Ortho-phosphate Dissolved 3 N/A 1.43 1.2 0.98 2.1 mg/L
Total Phosphorus Total 5 N/A 1.72 1.3 0.92 2.9 mg/L
Sulfate Total 5 N/A 31.4 33 23 44 mg/L
Total Dissolved Solids
Total 5 4 634 620 480 750 mg/L
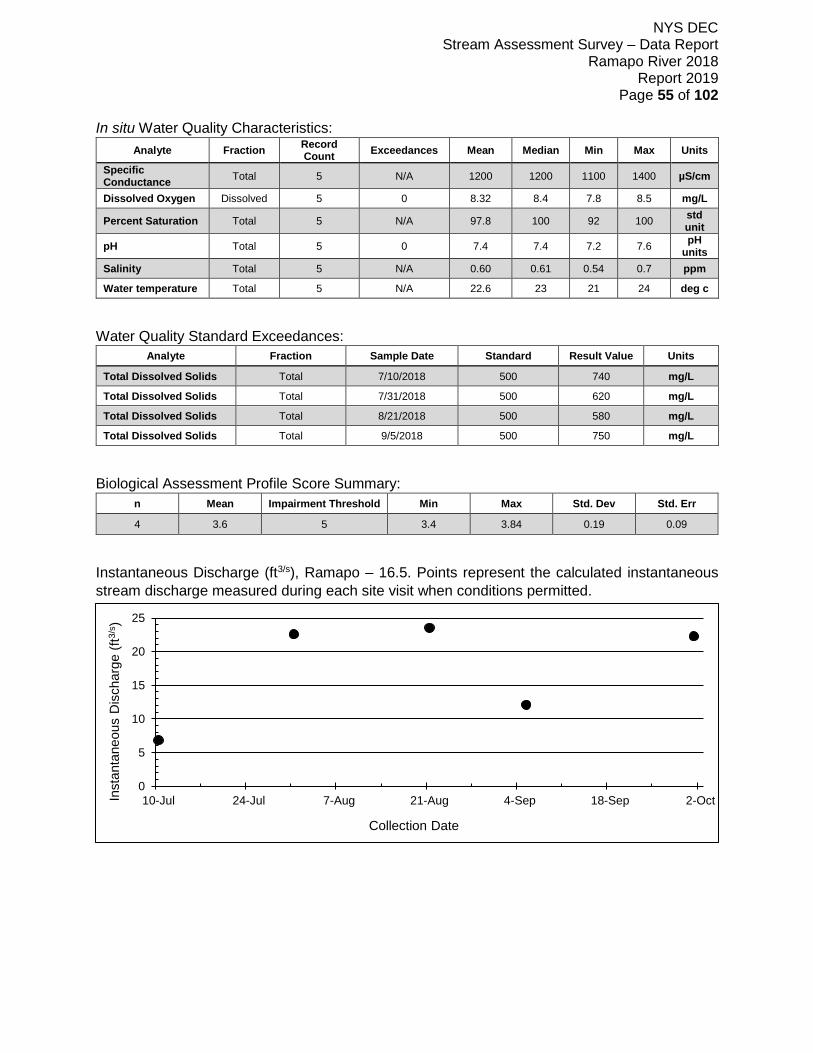
NYS DEC Stream Assessment Survey – Data Report
Ramapo River 2018 Report 2019
Page 55 of 102
In situ Water Quality Characteristics:
Analyte Fraction Record Count
Exceedances Mean Median Min Max Units
Specific Conductance
Total 5 N/A 1200 1200 1100 1400 µS/cm
Dissolved Oxygen Dissolved 5 0 8.32 8.4 7.8 8.5 mg/L
Percent Saturation Total 5 N/A 97.8 100 92 100 std unit
pH Total 5 0 7.4 7.4 7.2 7.6 pH
units
Salinity Total 5 N/A 0.60 0.61 0.54 0.7 ppm
Water temperature Total 5 N/A 22.6 23 21 24 deg c
Water Quality Standard Exceedances:
Analyte Fraction Sample Date Standard Result Value Units
Total Dissolved Solids Total 7/10/2018 500 740 mg/L
Total Dissolved Solids Total 7/31/2018 500 620 mg/L
Total Dissolved Solids Total 8/21/2018 500 580 mg/L
Total Dissolved Solids Total 9/5/2018 500 750 mg/L
Biological Assessment Profile Score Summary:
n Mean Impairment Threshold Min Max Std. Dev Std. Err
4 3.6 5 3.4 3.84 0.19 0.09
Instantaneous Discharge (ft3/s), Ramapo – 16.5. Points represent the calculated instantaneous
stream discharge measured during each site visit when conditions permitted.
0
5
10
15
20
25
10-Jul 24-Jul 7-Aug 21-Aug 4-Sep 18-Sep 2-OctInsta
nta
neous D
ischarg
e (
ft3
/s)
Collection Date
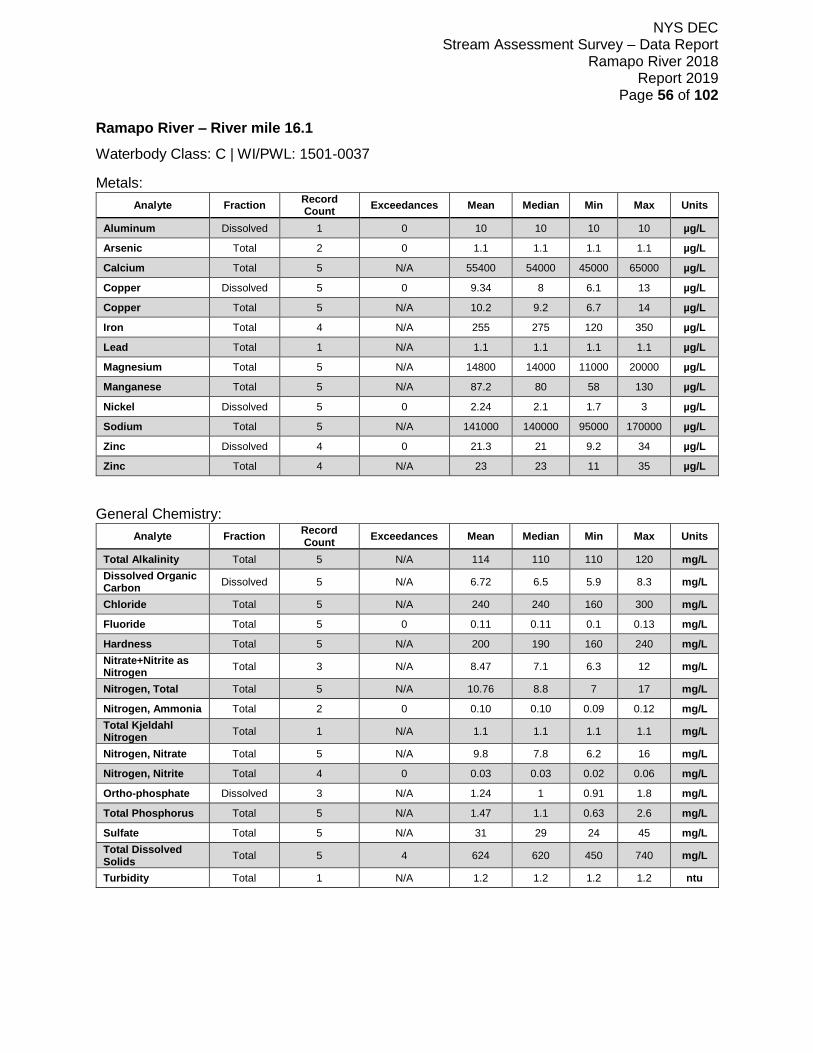
NYS DEC Stream Assessment Survey – Data Report
Ramapo River 2018 Report 2019
Page 56 of 102
Ramapo River – River mile 16.1
Waterbody Class: C | WI/PWL: 1501-0037
Metals:
Analyte Fraction Record Count
Exceedances Mean Median Min Max Units
Aluminum Dissolved 1 0 10 10 10 10 µg/L
Arsenic Total 2 0 1.1 1.1 1.1 1.1 µg/L
Calcium Total 5 N/A 55400 54000 45000 65000 µg/L
Copper Dissolved 5 0 9.34 8 6.1 13 µg/L
Copper Total 5 N/A 10.2 9.2 6.7 14 µg/L
Iron Total 4 N/A 255 275 120 350 µg/L
Lead Total 1 N/A 1.1 1.1 1.1 1.1 µg/L
Magnesium Total 5 N/A 14800 14000 11000 20000 µg/L
Manganese Total 5 N/A 87.2 80 58 130 µg/L
Nickel Dissolved 5 0 2.24 2.1 1.7 3 µg/L
Sodium Total 5 N/A 141000 140000 95000 170000 µg/L
Zinc Dissolved 4 0 21.3 21 9.2 34 µg/L
Zinc Total 4 N/A 23 23 11 35 µg/L
General Chemistry:
Analyte Fraction Record Count
Exceedances Mean Median Min Max Units
Total Alkalinity Total 5 N/A 114 110 110 120 mg/L
Dissolved Organic Carbon
Dissolved 5 N/A 6.72 6.5 5.9 8.3 mg/L
Chloride Total 5 N/A 240 240 160 300 mg/L
Fluoride Total 5 0 0.11 0.11 0.1 0.13 mg/L
Hardness Total 5 N/A 200 190 160 240 mg/L
Nitrate+Nitrite as Nitrogen
Total 3 N/A 8.47 7.1 6.3 12 mg/L
Nitrogen, Total Total 5 N/A 10.76 8.8 7 17 mg/L
Nitrogen, Ammonia Total 2 0 0.10 0.10 0.09 0.12 mg/L
Total Kjeldahl Nitrogen
Total 1 N/A 1.1 1.1 1.1 1.1 mg/L
Nitrogen, Nitrate Total 5 N/A 9.8 7.8 6.2 16 mg/L
Nitrogen, Nitrite Total 4 0 0.03 0.03 0.02 0.06 mg/L
Ortho-phosphate Dissolved 3 N/A 1.24 1 0.91 1.8 mg/L
Total Phosphorus Total 5 N/A 1.47 1.1 0.63 2.6 mg/L
Sulfate Total 5 N/A 31 29 24 45 mg/L
Total Dissolved Solids
Total 5 4 624 620 450 740 mg/L
Turbidity Total 1 N/A 1.2 1.2 1.2 1.2 ntu

NYS DEC Stream Assessment Survey – Data Report
Ramapo River 2018 Report 2019
Page 57 of 102
In situ Water Quality Characteristics:
Analyte Fraction Record Count
Exceedances Mean Median Min Max Units
Specific Conductance
Total 5 N/A 1114 1100 790 1400 µS/cm
Dissolved Oxygen Dissolved 5 0 7.78 8 6.6 8.7 mg/L
Percent Saturation Total 5 N/A 93.4 94 80 110 std unit
pH Total 5 0 7.54 7.5 7.4 7.7 pH
units
Salinity Total 5 N/A 0.55 0.53 0.39 0.7 ppm
Water temperature Total 5 N/A 23.2 23 19 26 deg c
Water Quality Standard Exceedances:
Analyte Fraction Sample Date Standard Result Value Units
Total Dissolved Solids Total 7/10/2018 500 740 mg/L
Total Dissolved Solids Total 7/31/2018 500 620 mg/L
Total Dissolved Solids Total 8/21/2018 500 570 mg/L
Total Dissolved Solids Total 9/5/2018 500 740 mg/L
Biological Assessment Profile Score Summary:
n Mean Impairment Threshold Min Max Std. Dev Std. Err
2 3.8 5 3.78 3.83 0.04 0.03
Instantaneous Discharge (ft3/s), Ramapo – 16.1. Points represent the calculated instantaneous
stream discharge measured during each site visit when conditions permitted.
0
5
10
15
20
25
30
10-Jul 24-Jul 7-Aug 21-Aug 4-Sep 18-Sep 2-Oct
Inst
anta
neo
us
Dis
char
ge
(ft3
/s)
Collection Date

NYS DEC Stream Assessment Survey – Data Report
Ramapo River 2018 Report 2019
Page 58 of 102
Ramapo River – River mile 13.3
Waterbody Class: A(T) | WI/PWL: 1501-0036
Metals:
Analyte Fraction Record Count
Exceedances Mean Median Min Max Units
Arsenic Total 2 0 1.3 1.3 1.3 1.3 µg/L
Calcium Total 5 N/A 52400 51000 44000 61000 µg/L
Copper Dissolved 5 0 6.32 5.4 3.9 9.2 µg/L
Copper Total 5 0 6.96 6 4.8 10 µg/L
Iron Total 4 2 330 325 200 470 µg/L
Lead Total 1 0 1 1 1 1 µg/L
Magnesium Total 5 0 14200 13000 11000 18000 µg/L
Manganese Total 5 0 97.6 75 41 170 µg/L
Nickel Dissolved 5 0 1.84 1.8 1.3 2.5 µg/L
Sodium Total 5 N/A 120800 120000 84000 140000 µg/L
Zinc Dissolved 4 0 14.98 14.1 5.7 26 µg/L
Zinc Total 4 N/A 18.08 17.9 7.5 29 µg/L
General Chemistry:
Analyte Fraction Record Count
Exceedances Mean Median Min Max Units
Total Alkalinity Total 5 N/A 120 120 110 130 mg/L
Dissolved Organic Carbon
Dissolved 5 N/A 5.84 5.7 5.1 6.8 mg/L
Chloride Total 5 2 206 200 130 270 mg/L
Fluoride Total 5 0 0.12 0.12 0.11 0.13 mg/L
Hardness Total 5 N/A 188 180 150 230 mg/L
Nitrate+Nitrite as Nitrogen
Total 3 0 5.4 4.1 3.8 8.3 mg/L
Nitrogen, Total Total 5 N/A 7.34 4.8 4.4 14 mg/L
Nitrogen, Ammonia Total 2 0 0.06 0.06 0.06 0.06 mg/L
Total Kjeldahl Nitrogen
Total 1 N/A 0.96 0.96 0.96 0.96 mg/L
Nitrogen, Nitrate Total 5 1 6.54 4 3.6 13 mg/L
Nitrogen, Nitrite Total 5 3 0.04 0.04 0.02 0.05 mg/L
Ortho-phosphate Dissolved 3 N/A 0.73 0.47 0.41 1.3 mg/L
Total Phosphorus Total 5 N/A 0.98 0.64 0.37 2 mg/L
Sulfate Total 5 0 26 23 19 39 mg/L
Total Dissolved Solids
Total 5 4 550 520 410 670 mg/L

NYS DEC Stream Assessment Survey – Data Report
Ramapo River 2018 Report 2019
Page 59 of 102
In situ Water Quality Characteristics:
Analyte Fraction Record Count
Exceedances Mean Median Min Max Units
Specific Conductance
Total 5 N/A 956 920 700 1200 µS/cm
Dissolved Oxygen Dissolved 5 0 8.9 9.1 7.2 9.8 mg/L
Percent Saturation Total 5 N/A 100.6 110 81 110 std unit
pH Total 5 0 7.54 7.5 7.3 7.8 pH
units
Salinity Total 5 N/A 0.48 0.45 0.34 0.62 ppm
Water temperature Total 5 N/A 21 21 17 24 deg c
Water Quality Standard Exceedances:
Analyte Fraction Sample Date Standard Result Value Units
Chloride Total 7/10/2018 250 270 mg/L
Chloride Total 9/5/2018 250 250 mg/L
Iron Total 7/31/2018 300 430 µg/L
Iron Total 8/21/2018 300 470 µg/L
Nitrogen, Nitrate Total 7/10/2018 10 13 mg/L
Nitrogen, Nitrite Total 7/10/2018 0.02 0.054 mg/L
Nitrogen, Nitrite Total 7/31/2018 0.02 0.04 mg/L
Nitrogen, Nitrite Total 9/5/2018 0.02 0.045 mg/L
Total Dissolved Solids Total 7/10/2018 500 670 mg/L
Total Dissolved Solids Total 7/31/2018 500 520 mg/L
Total Dissolved Solids Total 8/21/2018 500 500 mg/L
Total Dissolved Solids Total 9/5/2018 500 650 mg/L
Biological Assessment Profile Score Summary: n Mean Impairment Threshold Min Max Std. Dev Std. Err
4 4.94 5 4.59 5.25 0.28 0.14

NYS DEC Stream Assessment Survey – Data Report
Ramapo River 2018 Report 2019
Page 60 of 102
Instantaneous Discharge (ft3/s), Ramapo – 13.3. Points represent the calculated instantaneous
stream discharge measured during each site visit when conditions permitted.
0
5
10
15
20
25
30
35
10-Jul 24-Jul 7-Aug 21-Aug 4-Sep 18-Sep 2-OctInsta
nta
neous D
ischarg
e (
ft3
/s)
Collection Date

NYS DEC Stream Assessment Survey – Data Report
Ramapo River 2018 Report 2019
Page 61 of 102
Ramapo River – River mile 11.8
Waterbody Class: A(T) | WI/PWL: 1501-0036
Metals:
Analyte Fraction Record Count
Exceedances Mean Median Min Max Units
Aluminum Dissolved 1 0 14 14 14 14 µg/L
Calcium Total 5 N/A 40200 40000 27000 54000 µg/L
Copper Dissolved 5 0 5.22 4.4 2.8 8.7 µg/L
Copper Total 5 0 5.5 4.9 3 9.1 µg/L
Iron Total 4 2 262.5 280 110 380 µg/L
Magnesium Total 5 0 10880 10000 7000 16000 µg/L
Manganese Total 5 0 48.6 36 32 74 µg/L
Nickel Dissolved 4 0 1.65 1.5 1.3 2.3 µg/L
Sodium Total 5 N/A 92200 90000 52000 130000 µg/L
Zinc Dissolved 2 0 16.5 16.5 14 19 µg/L
Zinc Total 3 N/A 13.83 14 7.5 20 µg/L
General Chemistry:
Analyte Fraction Record Count
Exceedances Mean Median Min Max Units
Total Alkalinity Total 5 N/A 95 100 73 110 mg/L
Dissolved Organic Carbon
Dissolved 5 N/A 4.92 4.9 4.7 5.1 mg/L
Chloride Total 5 0 156.8 140 84 240 mg/L
Fluoride Total 5 0 0.11 0.12 0.1 0.13 mg/L
Hardness Total 5 N/A 145.2 140 96 200 mg/L
Nitrate+Nitrite as Nitrogen
Total 3 0 4.2 3.4 2.3 6.9 mg/L
Nitrogen, Total Total 5 N/A 5.98 4 2.8 12 mg/L
Nitrogen, Ammonia Total 1 0 0.05 0.05 0.05 0.05 mg/L
Total Kjeldahl Nitrogen
Total 1 N/A 0.86 0.86 0.86 0.86 mg/L
Nitrogen, Nitrate Total 5 1 5.34 3.4 2.3 11 mg/L
Nitrogen, Nitrite Total 3 1 0.02 0.02 0.01 0.022 mg/L
Ortho-phosphate Dissolved 3 N/A 0.50 0.43 0.21 0.87 mg/L
Total Phosphorus Total 5 N/A 0.75 0.43 0.22 1.7 mg/L
Sulfate Total 5 0 20.6 17 13 34 mg/L
Total Dissolved Solids
Total 5 2 420 390 260 590 mg/L
Turbidity Total 1 N/A 2.1 2.1 2.1 2.1 ntu
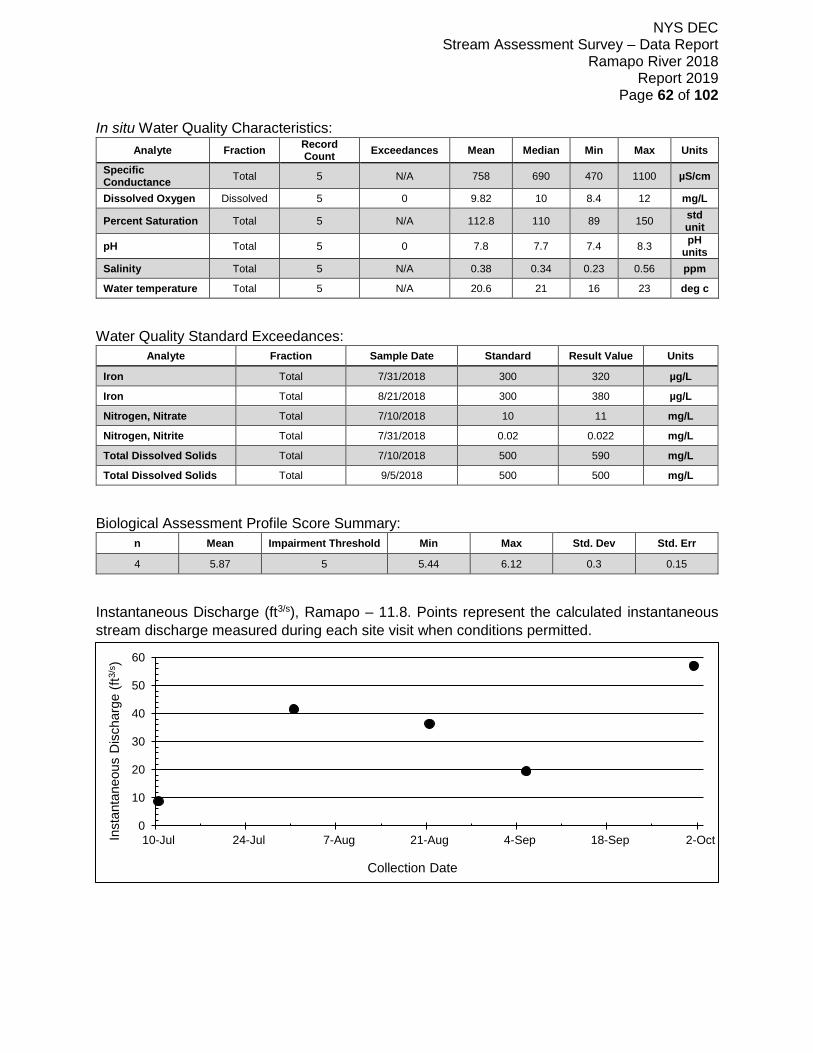
NYS DEC Stream Assessment Survey – Data Report
Ramapo River 2018 Report 2019
Page 62 of 102
In situ Water Quality Characteristics:
Analyte Fraction Record Count
Exceedances Mean Median Min Max Units
Specific Conductance
Total 5 N/A 758 690 470 1100 µS/cm
Dissolved Oxygen Dissolved 5 0 9.82 10 8.4 12 mg/L
Percent Saturation Total 5 N/A 112.8 110 89 150 std unit
pH Total 5 0 7.8 7.7 7.4 8.3 pH
units
Salinity Total 5 N/A 0.38 0.34 0.23 0.56 ppm
Water temperature Total 5 N/A 20.6 21 16 23 deg c
Water Quality Standard Exceedances:
Analyte Fraction Sample Date Standard Result Value Units
Iron Total 7/31/2018 300 320 µg/L
Iron Total 8/21/2018 300 380 µg/L
Nitrogen, Nitrate Total 7/10/2018 10 11 mg/L
Nitrogen, Nitrite Total 7/31/2018 0.02 0.022 mg/L
Total Dissolved Solids Total 7/10/2018 500 590 mg/L
Total Dissolved Solids Total 9/5/2018 500 500 mg/L
Biological Assessment Profile Score Summary:
n Mean Impairment Threshold Min Max Std. Dev Std. Err
4 5.87 5 5.44 6.12 0.3 0.15
Instantaneous Discharge (ft3/s), Ramapo – 11.8. Points represent the calculated instantaneous
stream discharge measured during each site visit when conditions permitted.
0
10
20
30
40
50
60
10-Jul 24-Jul 7-Aug 21-Aug 4-Sep 18-Sep 2-OctInsta
nta
neous D
ischarg
e (
ft3
/s)
Collection Date

NYS DEC Stream Assessment Survey – Data Report
Ramapo River 2018 Report 2019
Page 63 of 102
Ramapo River – River mile 4.8
Waterbody Class: A(T) | WI/PWL: 1501-0012
Metals:
Analyte Fraction Record Count
Exceedances Mean Median Min Max Units
Aluminum Dissolved 2 0 14 14 12 16 µg/L
Calcium Total 5 N/A 28600 28000 20000 39000 µg/L
Copper Dissolved 5 0 3.56 3.1 2.4 5 µg/L
Copper Total 5 0 3.9 3.7 2.7 5.7 µg/L
Iron Total 4 3 370 380 280 440 µg/L
Lead Total 1 0 1.4 1.4 1.4 1.4 µg/L
Magnesium Total 5 0 7660 7300 5000 11000 µg/L
Manganese Total 5 0 72 76 43 88 µg/L
Nickel Dissolved 2 0 1.35 1.35 1 1.7 µg/L
Sodium Total 5 N/A 67400 61000 42000 100000 µg/L
Zinc Dissolved 2 0 11.85 11.85 7.7 16 µg/L
Zinc Total 4 0 8.3 7 5.2 14 µg/L
General Chemistry:
Analyte Fraction Record Count
Exceedances Mean Median Min Max Units
Total Alkalinity Total 5 N/A 70 72 53 89 mg/L
Dissolved Organic Carbon
Dissolved 5 N/A 4.98 5.1 4.4 5.5 mg/L
Chloride Total 5 0 116.2 94 67 190 mg/L
Fluoride Total 5 0 0.12 0.12 0.11 0.13 mg/L
Hardness Total 5 N/A 102.8 100 69 140 mg/L
Nitrate+Nitrite as Nitrogen
Total 3 0 2.1 1.6 1.3 3.4 mg/L
Nitrogen, Total Total 5 N/A 2.82 2.1 1.6 4.8 mg/L
Nitrogen, Ammonia Total 2 0 0.07 0.07 0.05 0.1 mg/L
Total Kjeldahl Nitrogen
Total 1 N/A 1.1 1.1 1.1 1.1 mg/L
Nitrogen, Nitrate Total 5 0 2.19 1.6 0.95 3.7 mg/L
Nitrogen, Nitrite Total 2 1 0.03 0.03 0.01 0.04 mg/L
Ortho-phosphate Dissolved 4 N/A 0.32 0.29 0.12 0.58 mg/L
Total Phosphorus Total 5 N/A 0.31 0.22 0.14 0.58 mg/L
Sulfate Total 5 0 13.26 11 9.3 21 mg/L
Total Dissolved Solids
Total 5 0 308 280 200 450 mg/L
Turbidity Total 1 N/A 2.5 2.5 2.5 2.5 ntu

NYS DEC Stream Assessment Survey – Data Report
Ramapo River 2018 Report 2019
Page 64 of 102
In situ Water Quality Characteristics:
Analyte Fraction Record Count
Exceedances Mean Median Min Max Units
Specific Conductance
Total 5 N/A 556 470 360 870 µS/cm
Dissolved Oxygen Dissolved 5 0 8.2 8 7.6 9 mg/L
Percent Saturation Total 5 N/A 92.2 91 87 98 std unit
pH Total 5 0 7.76 7.7 7.4 8.2 pH
units
Salinity Total 5 N/A 0.27 0.23 0.18 0.43 ppm
Water temperature Total 5 N/A 21 22 16 23 deg c
Water Quality Standard Exceedances:
Analyte Fraction Sample Date Standard Result Value Units
Iron Total 7/31/2018 300 440 µg/L
Iron Total 8/21/2018 300 420 µg/L
Iron Total 10/1/2018 300 340 µg/L
Nitrogen, Nitrite Total 10/1/2018 0.02 0.042 mg/L
Biological Assessment Profile Score Summary:
n Mean Impairment Threshold Min Max Std. Dev Std. Err
4 7.23 5 6.76 7.68 0.46 0.23
Instantaneous Discharge (ft3/s), Ramapo – 4.8. Points represent the calculated instantaneous
stream discharge measured during each site visit when conditions permitted.
0
20
40
60
80
100
120
140
10-Jul 24-Jul 7-Aug 21-Aug 4-Sep 18-Sep 2-OctInsta
nta
neous D
ischarg
e (
ft3
/s)
Collection Date

NYS DEC Stream Assessment Survey – Data Report
Ramapo River 2018 Report 2019
Page 65 of 102
Ramapo River – River mile 1.1
Waterbody Class: A | WI/PWL: 1501-0012
Metals:
Analyte Fraction Record Count
Exceedances Mean Median Min Max Units
Aluminum Dissolved 2 0 14 14 12 16 µg/L
Calcium Total 5 N/A 25600 24000 15000 35000 µg/L
Copper Dissolved 5 0 3.24 2.8 2.1 5.2 µg/L
Copper Total 5 0 3.44 3.2 2.2 5.2 µg/L
Iron Total 4 2 290 315 180 350 µg/L
Lead Total 1 0 1.3 1.3 1.3 1.3 µg/L
Magnesium Total 5 0 6900 6200 3800 10000 µg/L
Manganese Total 5 0 41.4 40 27 54 µg/L
Nickel Dissolved 2 0 1.3 1.3 1.2 1.4 µg/L
Sodium Total 5 N/A 62000 53000 32000 91000 µg/L
Zinc Dissolved 3 0 11.7 12 6.1 17 µg/L
Zinc Total 3 0 8.97 6.8 5.1 15 µg/L
General Chemistry:
Analyte Fraction Record Count
Exceedances Mean Median Min Max Units
Total Alkalinity Total 5 N/A 61.8 60 41 80 mg/L
Dissolved Organic Carbon
Dissolved 5 N/A 4.22 4.3 3.3 5 mg/L
Chloride Total 5 0 109.2 89 53 180 mg/L
Fluoride Total 5 0 0.12 0.12 0.11 0.12 mg/L
Hardness Total 5 N/A 91.6 85 52 130 mg/L
Nitrate+Nitrite as Nitrogen
Total 3 0 1.78 1.3 0.83 3.2 mg/L
Nitrogen, Total Total 3 N/A 2.8 3 1.8 3.6 mg/L
Nitrogen, Ammonia Total 2 0 0.04 0.04 0.03 0.05 mg/L
Total Kjeldahl Nitrogen
Total 1 N/A 0.45 0.45 0.45 0.45 mg/L
Nitrogen, Nitrate Total 5 0 1.76 1.3 0.83 3.2 mg/L
Nitrogen, Nitrite Total 1 0 0.02 0.02 0.02 0.02 mg/L
Ortho-phosphate Dissolved 3 N/A 0.17 0.15 0.08 0.28 mg/L
Total Phosphorus Total 5 N/A 0.21 0.17 0.10 0.31 mg/L
Sulfate Total 5 0 12.4 11 8.3 18 mg/L
Total Dissolved Solids
Total 5 0 276 240 150 390 mg/L
Turbidity Total 1 N/A 1.5 1.5 1.5 1.5 ntu

NYS DEC Stream Assessment Survey – Data Report
Ramapo River 2018 Report 2019
Page 66 of 102
In situ Water Quality Characteristics:
Analyte Fraction Record Count
Exceedances Mean Median Min Max Units
Specific Conductance
Total 5 N/A 508 420 290 780 µS/cm
Dissolved Oxygen Dissolved 5 0 8.7 8.3 7.7 11 mg/L
Percent Saturation Total 5 N/A 95.8 96 88 110 std unit
pH Total 5 0 7.5 7.6 7.3 7.7 pH
units
Salinity Total 5 N/A 0.25 0.2 0.14 0.38 ppm
Water temperature Total 5 N/A 20.4 21 16 23 deg c
Water Quality Standard Exceedances:
Analyte Fraction Sample Date Standard Result Value Units
Iron Total 7/31/2018 300 339 µg/L
Iron Total 8/21/2018 300 350 µg/L
Biological Assessment Profile Score Summary:
n Mean Impairment Threshold Min Max Std. Dev Std. Err
4 6.15 5 5.47 6.6 0.49 0.24
Instantaneous Discharge (ft3/s), Ramapo – 1.1. Points represent the calculated instantaneous
stream discharge measured during each site visit when conditions permitted.
0
50
100
150
200
250
10-Jul 24-Jul 7-Aug 21-Aug 4-Sep 18-Sep 2-OctInsta
nta
neous D
ischarg
e (
ft3
/s)
Collection Date

NYS DEC Stream Assessment Survey – Data Report
Ramapo River 2018 Report 2019
Page 67 of 102
Section III: LITERATURE CITED
Classifications--Surface Waters and Groundwaters, 55 NY Jur 2d, Environmental Rights and
Remedies § 134 (2018)
New York State Department of Environmental Conservation. (2018). Standard Operating
Procedure # 210-18: Collection of Water Column Samples for the Rotating Integrated
Basin Studies (RIBS) Program As Part of the Statewide Ambient Water Quality
Monitoring Strategy. Division of Water, New York State Department of Environmental
Conservation. 625 Broadway Albany, NY.
New York State Department of Environmental Conservation. (2018). Quality Assurance Project
Plan (QAPP): Rotating Integrated Basin Studies, Rivers and Streams. Division of Water,
New York State Department of Environmental Conservation. 625 Broadway Albany, NY.
New York State Department of Environmental Conservation. (2018). Quality Assurance Project
Plan (QAPP): Rapid Biological Assessment Surveys (RAS). Division of Water, New York
State Department of Environmental Conservation. 625 Broadway Albany, NY.
New York State Department of Environmental Conservation. (2018). Standard Operating
Procedure # 208-18: Biological Monitoring of Surface Waters in New York State. Division
of Water, New York State Department of Environmental Conservation. 625 Broadway
Albany, NY.
New York State Department of Environmental Conservation. (2016). Standard Operating
Procedure # 403-16: Microtox® Acute Toxicity Test for Sediments, Porewaters, and
Effluents. Division of Water, New York State Department of Environmental Conservation,
625 Broadway Albany, NY.
New York State Department of Environmental Conservation (2018). Toxicity Testing Unit [Unit
Webpage]. Retrieved from https://www.dec.ny.gov/chemical/29854.html (Last Accessed
January 18, 2019).
R Core Team (2017). R: A language and environment for statistical computing. R Foundation for
Statistical Computing, Vienna, Austria. https://www.R-project.org/. (Last Accessed January
18, 2019)
Smith, A. J., Bode, R. W. (2004). Analysis of Variability in New York State Benthic
Macroinvertebrate Samples. Division of Water, New York State Department of
Environmental Conservation, 625 Broadway, Albany, New York, Technical Report, 43
pages.
Smith, A. J., Bode, R. W., and Kleppel, G. S. (2007). A nutrient biotic index (nbi) for use with
benthic macroinvertebrate communities. Ecological Indicators, 7: 371-386.
Smith, A. J., and Tran, C. P. 2010. A weight-of-evidence approach to define nutrient criteria
protective of aquatic life in large rivers. Journal of the North American Benthological
Society, 29: 875-891.
Smith, A. J., Thomas, R. L. Nolan, J. K., Velinsky, D. J., Klein, S., and Duffy, B. T. (2013). Regional
nutrient thresholds in wadeable streams of New York State protective of aquatic life.
Ecological Indicators, 29: 455-467.

NYS DEC Stream Assessment Survey – Data Report
Ramapo River 2018 Report 2019
Page 68 of 102
Smith, A. J., Duffy, B. T., and Novak, M. A. (2014). Observer rating of recreational use in wadeable
streams of New York State, USA: Implications for nutrient criteria development. Water
Research, 69: 195-209.
6 NYCRR Part 703, Surface Water and Groundwater Quality Standards and Groundwater Effluent
Limitations, Environmental Conservation Law, §§ 3-0301[2][m], 15-0313 (2018).
Turnipseed, D.P., and Sauer, V.B. (2010). Discharge measurements at gaging stations: U.S.
Geological Survey Techniques and Methods book 3: chapter A8, page 87. Published
Online: https://pubs.usgs.gov/tm/tm3-a8/. (Last Accessed January 18, 2019).

NYS DEC Stream Assessment Survey – Data Report
Ramapo River 2018 Report 2019
Page 69 of 102
Section IV: APPENDIX
Appendix I: Instantaneous Discharge Measurements Methods taken from Turnipseed and
Sauer (2010)
A. Midsection Method (p2-3)

NYS DEC Stream Assessment Survey – Data Report
Ramapo River 2018 Report 2019
Page 70 of 102

NYS DEC Stream Assessment Survey – Data Report
Ramapo River 2018 Report 2019
Page 71 of 102
B. Site Selection and Tag Lines (p8-9)

NYS DEC Stream Assessment Survey – Data Report
Ramapo River 2018 Report 2019
Page 72 of 102

NYS DEC Stream Assessment Survey – Data Report
Ramapo River 2018 Report 2019
Page 73 of 102
C. Use of a Wading Rod (p12)

NYS DEC Stream Assessment Survey – Data Report
Ramapo River 2018 Report 2019
Page 74 of 102
D. Current-Meter Measurement by Wading (p26)

NYS DEC Stream Assessment Survey – Data Report
Ramapo River 2018 Report 2019
Page 75 of 102

NYS DEC Stream Assessment Survey – Data Report
Ramapo River 2018 Report 2019
Page 76 of 102
E. Current Meters (p56-58)

NYS DEC Stream Assessment Survey – Data Report
Ramapo River 2018 Report 2019
Page 77 of 102

NYS DEC Stream Assessment Survey – Data Report
Ramapo River 2018 Report 2019
Page 78 of 102
Appendix II: Discharge field sheet used for collection of flow data
Discharge Field Sheet Project:
Point# Distance (ft) Depth (ft) Vel. @ 6/10ths depth (ft/s)
0 (water edge)
1
Site ID: 2
Date/Time: 3
Crew: 4
Weather: 5
Flow: Baseline or Event 6
Discharge: 7
8
9
10
11 (water edge)
Additional Notes:
Point# Distance (ft) Depth (ft) Vel. @ 6/10ths depth (ft/s)
0 (water edge)
1
Site ID: 2
Date/Time: 3
Crew: 4
Weather: 5
Flow: Baseline or Event 6
Discharge: 7
8
9
10
11 (water edge)
Additional Notes:

NYS DEC Stream Assessment Survey – Data Report
Ramapo River 2018 Report 2019
Page 79 of 102
Appendix III: QA/QC Summary Report
A. QA/QC Analysis and Flagging of Non-Organic Water Chemistry Data
A.1. For non-organic water chemistry data sets, the designated staff performs quality assurance
quality control review using the BWAM QAQC R script. This script is maintained on GitHub
to preserve the revision history (https://github.com/BWAM/QAQC.git) and a locked version
is stored on the NYSDEC server in the BWAM folder on the L:Drive. The components of
the quality review are described below.
A.2. Laboratory QAQC. The BWAM QAQC R script checks that the laboratory analyses met all
internal QAQC checks by examining the laboratory applied qualifiers (see Fig.1). The
QAQC script assigns validator qualifiers to the data records if these criteria are met:
• Data accepted based on QAQC review (“A”)
• Rejected validator qualifier (“R”) is applied to all data with laboratory qualifiers B, N, *, D, or W
• Estimated validator qualifier (“J”) is applied to all data with laboratory qualifiers E or J
• Non-Detect validator qualifier (“U”) is applied to all data with laboratory qualifier U

NYS DEC Stream Assessment Survey – Data Report
Ramapo River 2018 Report 2019
Page 80 of 102
A.3. Accuracy Analysis. The BWAM QAQC R script checks that the spiked QA samples met
acceptable percent recovery criteria.
A.3.1. The sample matrix spike samples are used to document the bias of a method in a given
sample matrix. Matrix Spike Samples are collected at a percentage of sampling locations
specified in the QAPP and spiked in the analytic laboratory with a known concentration of
analyte. The samples are then analyzed to determine the accuracy (percent recovery) of
the analytic results for a given matrix. Spike samples are acceptable if the percent
recovery is 100% +/- the accuracy criteria specified in the QAPP. Otherwise, the spike
and its associated samples are flagged as rejected. Furthermore, if the sample is >4x the
spiked amount, the spike assessment is irrelevant and flagged NA.
A.3.2. The accuracy assessments are performed on a subset of samples. The errors discovered
with these QC assessments are applied to all regular ambient samples. This is done by
associating ambient samples to those QC samples closest in date/time to each sample.
A.3.3. The matrix spike duplicate samples are only analyzed when measuring organics.
A.4. Precision Analysis. The BWAM QAQC R script checks that the duplicate samples met
acceptable precision criteria.
A.4.1. Duplicate samples are analyzed from the same date/location to assess the method
precision. The relative % difference (%RPD) between these samples must satisfy
precision criteria as used by Ohio EPA (2018). Duplicate samples are rejected where
%RPD > (0.9465x^-0.344)100 +5
Where: x = sample / detection limit %RPD = [diff(duplicate pair)/av(duplicate pair)]*100
The precision assessments are performed on a subset of samples. The errors discovered with these QC assessments are applied to all regular ambient samples. This is done by associating normal samples to those QC samples closest in date/time to each sample. NOTE: the quantitation limit is NOT the method detection limit. Both are set by the lab and can vary week to week. The quantitation limit is the practical limit the lab was able to achieve and has confidence in on that date.
The complete Ohio EPA method can be found in Ohio EPA, 2018. Surface Water Field Sampling Manual. Appendix IV. https://epa.ohio.gov/Portals/35/documents/SW-Sampling-Manual-2018-AppIV.pdf.
A.5. Equipment Blank Analysis. The BWAM QAQC R script checks for contaminated equipment
blanks and based on the relative concentration of the ambient sample, determines whether
the level of contamination render the associated ambient sample results invalid.
A.5.1 An equipment blank is considered contaminated if the result value exceeds the
quantitation limit.

NYS DEC Stream Assessment Survey – Data Report
Ramapo River 2018 Report 2019
Page 81 of 102
A.5.2 If the equipment blank is contaminated, the results may still be useable depending on the
concentration in the ambient sample vs. the concentration in the equipment blank.
Acceptable thresholds are laid out in table 1 below. According to the Ohio EPA Surface
Water Field Sampling Manual (Ohio EPA 2018), the logic for these thresholds is as
follows:
“Laboratories often use a factor of three to differentiate a detected compound from background “noise” present in the system (analytical instrument, etc.). When a result exceeds three times the background noise, it is considered to be positively identified in the sample. We can consider blank contamination as extra “noise” in the system, since we don’t know the source of the contamination, and use this factor of three to help us assess our data. To do so, the sample concentration must be at least three times the blank concentration for us to be confident that analyte is truly present in the sample”
A.5.3 Table 1: Acceptable thresholds for equipment blank (EB) contamination
Sample Result Interpretation Validator Qualifier
Sample ≤ 3x EB Reject sample results in this range as insufficiently different from blank results
R
3x EB < Sample ≤ 5x EB Likely indication that the analyte is present but poor confidence in the numerical result - generally limit data use to data “trend” applications
T
5x EB < Sample ≤ 10x EB Consider the sample result to be an estimated concentration (qualified “J”) but still suitable for most data uses
J
< 10x EB Do not qualify data (blank contamination does not significantly change the result within the uncertainty of the value reported)
A.5.4 The equipment blanks are collected at a percentage of locations specified in the
QAPP. Contaminated equipment blank samples are applied to project sample results that
are nearest in date/time.
A.6. Parameter Pair Analysis. The BWAM QAQC R script flags data where component
parameters exceed total amounts.
A.6.1. The following component parameters should not exceed total parameters. Those that do
are rejected and the R validator qualifier is applied.
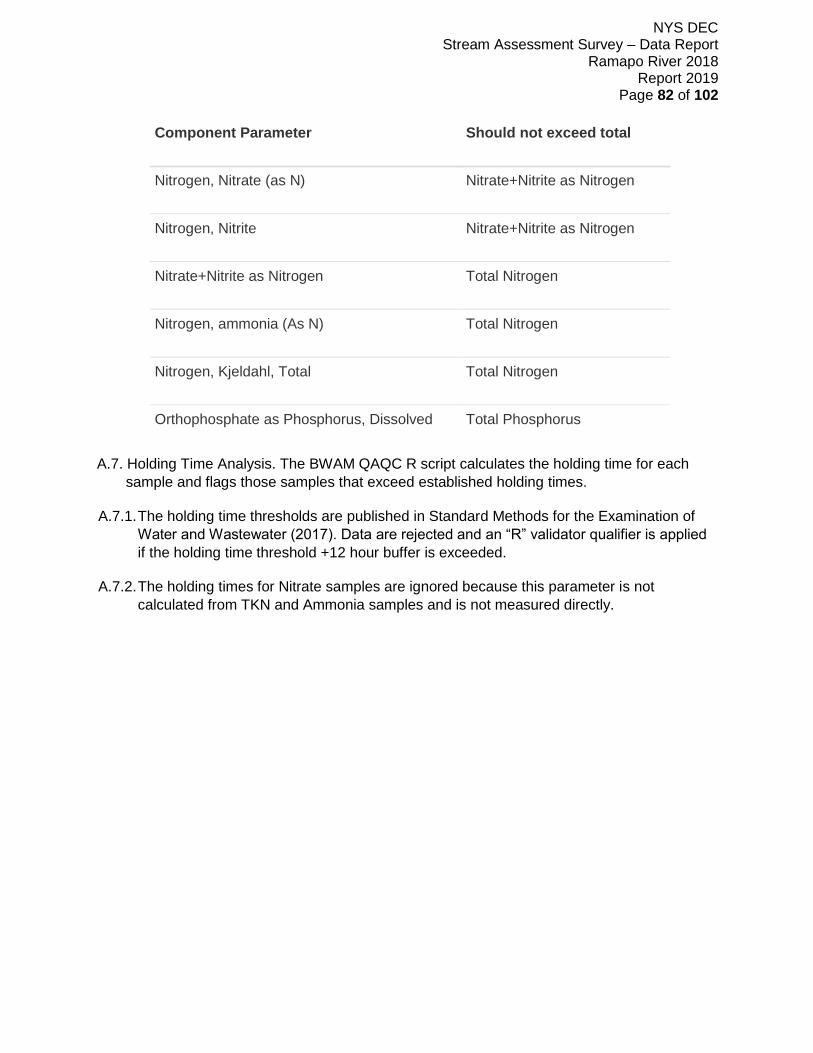
NYS DEC Stream Assessment Survey – Data Report
Ramapo River 2018 Report 2019
Page 82 of 102
Component Parameter Should not exceed total
Nitrogen, Nitrate (as N) Nitrate+Nitrite as Nitrogen
Nitrogen, Nitrite Nitrate+Nitrite as Nitrogen
Nitrate+Nitrite as Nitrogen Total Nitrogen
Nitrogen, ammonia (As N) Total Nitrogen
Nitrogen, Kjeldahl, Total Total Nitrogen
Orthophosphate as Phosphorus, Dissolved Total Phosphorus
A.7. Holding Time Analysis. The BWAM QAQC R script calculates the holding time for each
sample and flags those samples that exceed established holding times.
A.7.1. The holding time thresholds are published in Standard Methods for the Examination of
Water and Wastewater (2017). Data are rejected and an “R” validator qualifier is applied
if the holding time threshold +12 hour buffer is exceeded.
A.7.2. The holding times for Nitrate samples are ignored because this parameter is not
calculated from TKN and Ammonia samples and is not measured directly.
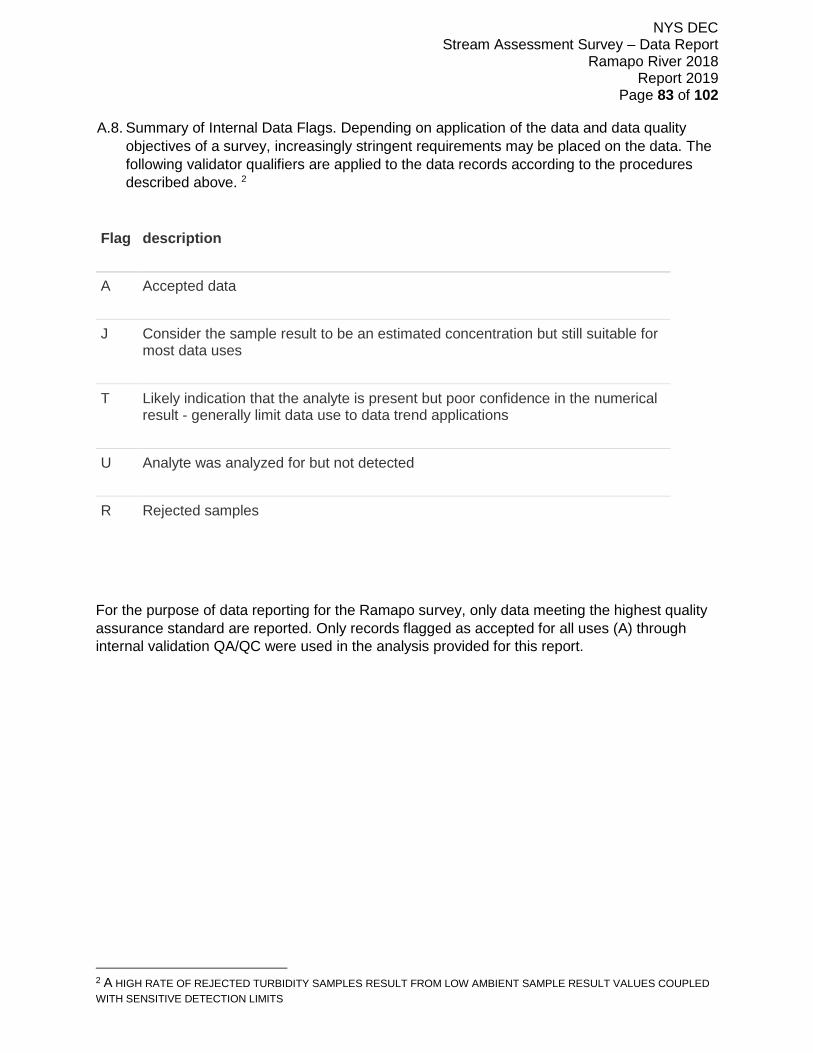
NYS DEC Stream Assessment Survey – Data Report
Ramapo River 2018 Report 2019
Page 83 of 102
A.8. Summary of Internal Data Flags. Depending on application of the data and data quality
objectives of a survey, increasingly stringent requirements may be placed on the data. The
following validator qualifiers are applied to the data records according to the procedures
described above. 2
Flag description
A Accepted data
J Consider the sample result to be an estimated concentration but still suitable for most data uses
T Likely indication that the analyte is present but poor confidence in the numerical result - generally limit data use to data trend applications
U Analyte was analyzed for but not detected
R Rejected samples
For the purpose of data reporting for the Ramapo survey, only data meeting the highest quality
assurance standard are reported. Only records flagged as accepted for all uses (A) through
internal validation QA/QC were used in the analysis provided for this report.
2 A HIGH RATE OF REJECTED TURBIDITY SAMPLES RESULT FROM LOW AMBIENT SAMPLE RESULT VALUES COUPLED
WITH SENSITIVE DETECTION LIMITS

NYS DEC Stream Assessment Survey – Data Report
Ramapo River 2018 Report 2019
Page 84 of 102
B. Laboratory and Internal QA/QC Results
B.1. Laboratory QC Results
Conclusions from the lab reports
SDG Errors
lab_sdg
R1806960
Method 180.1 (turbidity), R1806960-002,003: The analysis was performed slightly outside the 48 hour
holding time due to a laboratory error
lab_sdg
R1806960
Method 200.7 (analyzes Calcium, Iron, Magnesium, Potassium, and Sodium) R1806960-001, 002: The
Relative Percent Difference (RPD) for the serial dilution test of one or more analytes was above the
method control limits which indicates the presence of physical or chemical interference for analysis of
these analytes in this sample matrix. Exceedances have been flagged.
lab_sdg
R1806960
Method 353.2 (analyzes Nitrite and Nitrite + Nitrate),R1806960-004:The analysis was initially
performed within the recommended holding time but due to a spiking error the sample could not be
reported. The reanalysis was performed past the recommended holding time.
lab_sdg
R1806961
Method 180.1 (turbidity), R1806961-001,002: The analysis was analyzed slightly outside the 48 hour
holding time of the method due to a laboratory error.
lab_sdg
R1806961
Method 353.2 (analyzes Nitrite and Nitrite + Nitrate),R1806961-012:The analysis was initially
performed within the recommended holding time. Reanalysis at a dilution was required. The reanalysis
was performed past the recommended holding time
lab_sdg
R1807763
Method 180.1 (turbidity): One or more samples were received with sufficient hold time remaining to
complete the analysis within the recommended limit. Due to Lab error the analysis was performed as
soon as possible after receipt by the laboratory. The data is flagged to indicate the holding time
violation.
lab_sdg
R1808566
Method 200.7 (analyzes Calcium, Iron, Magnesium, Potassium, and Sodium), R1808566-014: The
Relative Percent Difference (RPD) for the serial dilution test of one or more analytes was above the
method control limits which indicates the presence of physical or chemical interference for analysis of
these analytes in this sample matrix. Exceedances have been flagged.
lab_sdg
R1808568
Method 180.1 (turbidity): Due to analyst error one sample was analyzed out of hold time. The data is
flagged to indicate the holding time violation.
lab_sdg
R1808568
Method 180.1 (turbidity): One or more samples were received with insufficient hold time remaining to
complete the analysis within the recommended limit. The analysis was performed as soon as possible
after receipt by the laboratory. The data is flagged to indicate the holding time violation.
lab_sdg
R1808568
Method 353.2 (analyzes Nitrite and Nitrite + Nitrate): One or more samples were received with
insufficient hold time remaining to complete the analysis within the recommended limit. The analysis
was performed as soon as possible after receipt by the laboratory. The data is flagged to indicate the
holding time violation.
lab_sdg
R1809619
Method 180.1 (turbidity): One or more samples were received with insufficient hold time remaining to
complete the analysis within the recommended limit. The analysis was performed as soon as possible
after receipt by the laboratory. The data is flagged to indicate the holding time violation.
lab_sdg
R1809619
Method 353.2 (analyzes Nitrite and Nitrite + Nitrate): One or more samples were received with
insufficient hold time remaining to complete the analysis within the recommended limit. The analysis
was performed as soon as possible after receipt by the laboratory. The data is flagged to indicate the
holding time violation.
lab_sdg
R1809619
Method 353.2 (analyzes Nitrite and Nitrite + Nitrate): One or more samples were received with
insufficient hold time remaining to complete the analysis within the recommended limit. The analysis
was performed as soon as possible after receipt by the laboratory. The data is flagged to indicate the
holding time violation.

NYS DEC Stream Assessment Survey – Data Report
Ramapo River 2018 Report 2019
Page 85 of 102
B.2. Lab and Internal QA/QC Validation
RAMA-18.6 totals for applied QA/QC flags. Table describes the total number of each lab QA/QC flag and internal validation QA/QC flag applied to every analyte analyzed. All records with a lab flag were removed from the analysis provided for this report. Only records flagged as accepted for all uses (A) through internal validation QA/QC were used in the analysis provided for this report.
Lab Flags QA/QC Flags
Analyte Total Records E EJ J N NJ U UN J R T U A
Alkalinity 6 N/A N/A N/A N/A N/A N/A N/A N/A N/A N/A N/A 6
Aluminum (dissolved) 6 N/A N/A 4 N/A N/A N/A N/A 3 1 N/A N/A 2
Nitrogen, Ammonia 6 N/A N/A N/A N/A N/A N/A N/A N/A 3 N/A N/A 3
Arsenic 6 N/A N/A 1 N/A N/A N/A N/A 1 2 N/A N/A 3
Cadmium (dissolved) 6 N/A N/A 2 N/A N/A 4 N/A 2 N/A N/A 4 N/A
Calcium 6 N/A N/A N/A N/A N/A N/A N/A N/A N/A N/A N/A 6
Chloride 6 N/A N/A N/A N/A N/A N/A N/A N/A N/A N/A N/A 6
Copper (dissolved) 6 N/A N/A N/A N/A N/A N/A N/A N/A N/A N/A N/A 6
Copper (total) 6 N/A N/A N/A N/A N/A N/A N/A N/A N/A N/A N/A 6
Dissolved Organic Carbon 6 N/A N/A N/A N/A N/A N/A N/A N/A N/A N/A N/A 6
Fluoride 6 N/A N/A N/A N/A N/A 4 N/A N/A N/A N/A 4 2
Hardness 6 N/A N/A N/A N/A N/A N/A N/A N/A N/A N/A N/A 6
Iron (total) 6 N/A N/A N/A N/A N/A N/A N/A N/A 1 N/A N/A 5
Lead (dissolved) 6 N/A N/A 4 N/A N/A 1 N/A 4 N/A N/A 1 1
Lead (total) 6 N/A N/A 4 N/A N/A N/A N/A 4 N/A N/A N/A 2
Magnesium 6 N/A N/A N/A N/A N/A N/A N/A N/A N/A N/A N/A 6
Manganese (total) 6 N/A N/A N/A N/A N/A N/A N/A N/A N/A N/A N/A 6
Nickel (dissolved) 6 N/A N/A 2 N/A N/A N/A N/A 2 N/A N/A N/A 4
Nitrate+Nitrite as Nitrogen 6 N/A N/A N/A N/A N/A N/A N/A N/A 3 N/A N/A 3
Nitrogen, Nitrate 6 N/A N/A N/A N/A N/A N/A N/A N/A N/A N/A N/A 6
Nitrogen, Nitrite 6 N/A N/A N/A N/A N/A 5 N/A N/A N/A N/A 5 1
Nitrogen, Total 6 N/A N/A N/A N/A N/A N/A N/A 1 N/A 2 N/A 3
Ortho-phosphate 6 N/A N/A N/A N/A N/A N/A N/A N/A 2 N/A N/A 4
Potassium 6 3 2 1 N/A N/A N/A N/A 6 N/A N/A N/A N/A
Silver (total) 6 N/A N/A N/A N/A N/A 6 N/A N/A N/A N/A 6 N/A
Sodium 6 N/A N/A N/A N/A N/A N/A N/A N/A N/A N/A N/A 6
Sulfate 6 N/A N/A N/A N/A N/A N/A N/A N/A 1 N/A N/A 5
Total Dissolved Solids 6 N/A N/A N/A N/A N/A N/A N/A N/A 1 N/A N/A 5
Total Kjeldahl Nitrogen 6 N/A N/A N/A N/A N/A N/A N/A 1 1 2 N/A 2
Total Phosphorus 6 N/A N/A N/A N/A N/A N/A N/A N/A N/A N/A N/A 6
Turbidity 6 N/A N/A N/A N/A N/A N/A N/A N/A 3 1 N/A 2
Zinc (dissolved) 6 N/A N/A 4 N/A N/A 2 N/A 4 1 N/A 1 N/A
Zinc (total) 6 N/A N/A 3 N/A N/A 1 N/A 3 1 N/A N/A 2
Totals 198 3 2 25 N/A N/A 23 N/A 31 20 5 21 121

NYS DEC Stream Assessment Survey – Data Report
Ramapo River 2018 Report 2019
Page 86 of 102
RAMA_T25_3-0.3 totals for applied QA/QC flags. Table describes the total number of each lab QA/QC flag and internal validation QA/QC flag applied to every analyte analyzed. All records with a lab flag were removed from the analysis provided for this report. Only records flagged as accepted for all uses (A) through internal validation QA/QC were used in the analysis provided for this report.
Lab Flags QA/QC Flags
Analyte Total Records E EJ J N NJ U UN J R T U A
Alkalinity 2 N/A N/A N/A N/A N/A N/A N/A N/A N/A N/A N/A 2
Aluminum (dissolved) 2 N/A N/A N/A N/A N/A N/A N/A N/A N/A N/A N/A 2
Nitrogen, Ammonia 2 N/A N/A N/A N/A N/A N/A N/A N/A 1 N/A N/A 1
Arsenic 2 N/A N/A 1 N/A N/A N/A N/A N/A 1 N/A N/A 1
Cadmium (dissolved) 2 N/A N/A 1 N/A N/A 1 N/A 1 N/A N/A 1 N/A
Calcium 2 N/A N/A N/A N/A N/A N/A N/A N/A N/A N/A N/A 2
Chloride 2 N/A N/A N/A N/A N/A N/A N/A N/A N/A N/A N/A 2
Copper (dissolved) 2 N/A N/A N/A N/A N/A N/A N/A N/A N/A N/A N/A 2
Copper (total) 2 N/A N/A N/A N/A N/A N/A N/A N/A N/A N/A N/A 2
Dissolved Organic Carbon 2 N/A N/A N/A N/A N/A N/A N/A N/A N/A N/A N/A 2
Fluoride 2 N/A N/A N/A N/A N/A 2 N/A N/A N/A N/A 2 N/A
Hardness 2 N/A N/A N/A N/A N/A N/A N/A N/A N/A N/A N/A 2
Iron (total) 2 N/A N/A N/A N/A N/A N/A N/A N/A N/A N/A N/A 2
Lead (dissolved) 2 N/A N/A 1 N/A N/A N/A N/A 1 N/A N/A N/A 1
Lead (total) 2 N/A N/A 1 N/A N/A N/A N/A 1 N/A N/A N/A 1
Magnesium 2 N/A N/A N/A N/A N/A N/A N/A N/A N/A N/A N/A 2
Manganese (total) 2 N/A N/A N/A N/A N/A N/A N/A N/A N/A N/A N/A 2
Nickel (dissolved) 2 N/A N/A N/A N/A N/A N/A N/A N/A N/A N/A N/A 2
Nitrate+Nitrite as Nitrogen 2 N/A N/A N/A N/A N/A N/A N/A N/A 1 N/A N/A 1
Nitrogen, Nitrate 2 N/A N/A N/A N/A N/A N/A N/A N/A N/A N/A N/A 2
Nitrogen, Nitrite 2 N/A N/A N/A N/A N/A 2 N/A N/A N/A N/A 2 N/A
Nitrogen, Total 2 N/A N/A N/A N/A N/A N/A N/A 1 N/A N/A N/A 1
Ortho-phosphate 2 N/A N/A N/A N/A N/A N/A N/A N/A 1 N/A N/A 1
Potassium 2 1 N/A N/A N/A N/A N/A N/A 1 N/A N/A N/A 1
Silver (total) 2 N/A N/A N/A N/A N/A 2 N/A N/A N/A N/A 2 N/A
Sodium 2 N/A N/A N/A N/A N/A N/A N/A N/A N/A N/A N/A 2
Sulfate 2 N/A N/A N/A N/A N/A N/A N/A N/A 1 N/A N/A 1
Total Dissolved Solids 2 N/A N/A N/A N/A N/A N/A N/A N/A N/A N/A N/A 2
Total Kjeldahl Nitrogen 2 N/A N/A N/A N/A N/A N/A N/A 1 1 N/A N/A N/A
Total Phosphorus 2 N/A N/A N/A N/A N/A N/A N/A N/A N/A N/A N/A 2
Turbidity 2 N/A N/A N/A N/A N/A N/A N/A N/A 2 N/A N/A N/A
Zinc (dissolved) 2 N/A N/A 2 N/A N/A N/A N/A 1 1 N/A N/A N/A
Zinc (total) 2 N/A N/A 1 N/A N/A N/A N/A N/A 1 N/A N/A 1
Totals 66 1 N/A 7 N/A N/A 7 N/A 7 10 N/A 7 42

NYS DEC Stream Assessment Survey – Data Report
Ramapo River 2018 Report 2019
Page 87 of 102
KJSTP-001 totals for applied QA/QC flags. Table describes the total number of each lab QA/QC flag and internal validation QA/QC flag applied to every analyte analyzed. All records with a lab flag were removed from the analysis provided for this report. Only records flagged as accepted for all uses (A) through internal validation QA/QC were used in the analysis provided for this report.
Lab Flags QA/QC Flags
Analyte Total Records E EJ J N NJ U UN J R T U A
Alkalinity 6 N/A N/A N/A N/A N/A N/A N/A N/A N/A N/A N/A 6
Aluminum (dissolved) 6 N/A N/A N/A N/A N/A N/A N/A N/A 1 N/A N/A 5
Nitrogen, Ammonia 6 N/A N/A N/A N/A N/A N/A N/A N/A 1 N/A N/A 5
Arsenic 6 N/A N/A 3 N/A N/A 2 N/A 2 2 N/A 1 1
Cadmium (dissolved) 6 N/A N/A 2 N/A N/A 4 N/A 2 N/A N/A 4 N/A
Calcium 6 N/A N/A N/A N/A N/A N/A N/A N/A N/A N/A N/A 6
Chloride 6 N/A N/A N/A N/A N/A N/A N/A N/A N/A N/A N/A 6
Copper (dissolved) 6 N/A N/A N/A N/A N/A N/A N/A N/A N/A N/A N/A 6
Copper (total) 6 N/A N/A N/A N/A N/A N/A N/A N/A N/A N/A N/A 6
Dissolved Organic Carbon 6 N/A N/A N/A N/A N/A N/A N/A N/A N/A N/A N/A 6
Fluoride 6 N/A N/A N/A N/A N/A 3 N/A N/A N/A N/A 3 3
Hardness 6 N/A N/A N/A N/A N/A N/A N/A N/A N/A N/A N/A 6
Iron (total) 6 N/A N/A 4 N/A N/A N/A N/A 3 1 N/A N/A 2
Lead (dissolved) 6 N/A N/A 4 N/A N/A 2 N/A 4 N/A N/A 2 N/A
Lead (total) 6 N/A N/A 4 N/A N/A 2 N/A 4 N/A N/A 2 N/A
Magnesium 6 N/A N/A N/A N/A N/A N/A N/A N/A N/A N/A N/A 6
Manganese (total) 6 N/A N/A N/A N/A N/A N/A N/A N/A N/A N/A N/A 6
Nickel (dissolved) 6 N/A N/A N/A N/A N/A N/A N/A N/A N/A N/A N/A 6
Nitrate+Nitrite as Nitrogen 6 N/A N/A N/A N/A N/A N/A N/A N/A 3 N/A N/A 3
Nitrogen, Nitrate 6 N/A N/A N/A N/A N/A N/A N/A N/A N/A N/A N/A 6
Nitrogen, Nitrite 6 N/A N/A N/A N/A N/A N/A N/A N/A 1 N/A N/A 5
Nitrogen, Total 6 N/A N/A N/A N/A N/A N/A N/A N/A N/A N/A N/A 6
Ortho-phosphate 6 N/A N/A N/A N/A N/A N/A N/A 1 1 N/A N/A 4
Potassium 6 6 N/A N/A N/A N/A N/A N/A 6 N/A N/A N/A N/A
Silver (total) 6 N/A N/A N/A N/A N/A 6 N/A N/A N/A N/A 6 N/A
Sodium 6 N/A N/A N/A N/A N/A N/A N/A N/A N/A N/A N/A 6
Sulfate 6 N/A N/A N/A N/A N/A N/A N/A N/A 1 N/A N/A 5
Total Dissolved Solids 6 N/A N/A N/A N/A N/A N/A N/A N/A N/A N/A N/A 6
Total Kjeldahl Nitrogen 6 N/A N/A N/A N/A N/A N/A N/A 3 N/A N/A N/A 3
Total Phosphorus 6 N/A N/A N/A N/A N/A N/A N/A N/A N/A N/A N/A 6
Turbidity 6 N/A N/A N/A N/A N/A N/A N/A 1 4 N/A N/A 1
Zinc (dissolved) 6 N/A N/A N/A 1 N/A N/A N/A N/A 1 N/A N/A 5
Zinc (total) 6 N/A N/A N/A N/A N/A N/A N/A N/A 1 N/A N/A 5
Totals 198 6 N/A 17 1 N/A 19 N/A 26 17 N/A 18 137

NYS DEC Stream Assessment Survey – Data Report
Ramapo River 2018 Report 2019
Page 88 of 102
RAMA_T25_3-0.2 totals for applied QA/QC flags. Table describes the total number of each lab QA/QC flag and internal validation QA/QC flag applied to every analyte analyzed. All records with a lab flag were removed from the analysis provided for this report. Only records flagged as accepted for all uses (A) through internal validation QA/QC were used in the analysis provided for this report.
Lab Flags QA/QC Flags
Analyte Total Records E EJ J N NJ U UN J R T U A
Alkalinity 6 N/A N/A N/A N/A N/A N/A N/A N/A N/A N/A N/A 6
Aluminum (dissolved) 6 N/A N/A N/A N/A N/A N/A N/A N/A 1 N/A N/A 5
Nitrogen, Ammonia 6 N/A N/A N/A N/A N/A N/A N/A 1 1 N/A N/A 4
Arsenic 6 N/A N/A 4 N/A N/A 1 N/A 2 2 N/A 1 1
Cadmium (dissolved) 6 N/A N/A 2 N/A N/A 4 N/A 2 N/A N/A 4 N/A
Calcium 6 N/A N/A N/A N/A N/A N/A N/A N/A N/A N/A N/A 6
Chloride 6 N/A N/A N/A N/A N/A N/A N/A N/A N/A N/A N/A 6
Copper (dissolved) 6 N/A N/A N/A N/A N/A N/A N/A N/A N/A N/A N/A 6
Copper (total) 6 N/A N/A N/A N/A N/A N/A N/A N/A N/A N/A N/A 6
Dissolved Organic Carbon 6 N/A N/A N/A N/A N/A N/A N/A N/A N/A N/A N/A 6
Fluoride 6 N/A N/A N/A N/A N/A 5 N/A N/A N/A N/A 5 1
Hardness 6 N/A N/A N/A N/A N/A N/A N/A N/A N/A N/A N/A 6
Iron (total) 6 N/A N/A 1 N/A N/A N/A N/A N/A 1 N/A N/A 5
Lead (dissolved) 6 N/A N/A 3 N/A N/A 2 N/A 3 N/A N/A 2 1
Lead (total) 6 N/A N/A 5 N/A N/A N/A N/A 5 N/A N/A N/A 1
Magnesium 6 N/A N/A N/A N/A N/A N/A N/A N/A N/A N/A N/A 6
Manganese (total) 6 N/A N/A N/A N/A N/A N/A N/A N/A N/A N/A N/A 6
Nickel (dissolved) 6 N/A N/A N/A N/A N/A N/A N/A N/A N/A N/A N/A 6
Nitrate+Nitrite as Nitrogen 6 N/A N/A N/A N/A N/A N/A N/A N/A 3 N/A N/A 3
Nitrogen, Nitrate 6 N/A N/A N/A N/A N/A N/A N/A N/A N/A N/A N/A 6
Nitrogen, Nitrite 6 N/A N/A N/A N/A N/A N/A N/A N/A 1 N/A N/A 5
Nitrogen, Total 6 N/A N/A N/A N/A N/A N/A N/A N/A N/A N/A N/A 6
Ortho-phosphate 6 N/A N/A N/A N/A N/A 1 N/A 1 1 N/A 1 3
Potassium 6 5 N/A N/A N/A N/A N/A N/A 5 N/A N/A N/A 1
Silver (total) 6 N/A N/A N/A N/A N/A 6 N/A N/A N/A N/A 6 N/A
Sodium 6 N/A N/A N/A N/A N/A N/A N/A N/A N/A N/A N/A 6
Sulfate 6 N/A N/A N/A N/A N/A N/A N/A N/A 1 N/A N/A 5
Total Dissolved Solids 6 N/A N/A N/A N/A N/A N/A N/A N/A N/A N/A N/A 6
Total Kjeldahl Nitrogen 6 N/A N/A N/A N/A N/A N/A N/A 3 N/A N/A N/A 3
Total Phosphorus 6 N/A N/A N/A N/A N/A N/A N/A N/A N/A N/A N/A 6
Turbidity 6 N/A N/A N/A N/A N/A N/A N/A N/A 3 1 N/A 2
Zinc (dissolved) 6 N/A N/A N/A N/A N/A N/A N/A N/A 1 N/A N/A 5
Zinc (total) 6 N/A N/A N/A N/A N/A N/A N/A N/A 1 N/A N/A 5
Totals 198 5 N/A 15 N/A N/A 19 N/A 22 16 1 19 140

NYS DEC Stream Assessment Survey – Data Report
Ramapo River 2018 Report 2019
Page 89 of 102
RAMA-16.8 totals for applied QA/QC flags. Table describes the total number of each lab QA/QC flag and internal validation QA/QC flag applied to every analyte analyzed. All records with a lab flag were removed from the analysis provided for this report. Only records flagged as accepted for all uses (A) through internal validation QA/QC were used in the analysis provided for this report.
Lab Flags QA/QC Flags
Analyte Total Records E EJ J N NJ U UN J R T U A
Alkalinity 6 N/A N/A N/A N/A N/A N/A N/A N/A N/A N/A N/A 6
Aluminum (dissolved) 6 N/A N/A 4 N/A N/A N/A N/A 3 1 N/A N/A 2
Nitrogen, Ammonia 6 N/A N/A N/A N/A N/A N/A N/A N/A 3 N/A N/A 3
Arsenic 6 N/A N/A 2 N/A N/A N/A N/A 2 2 N/A N/A 2
Cadmium (dissolved) 6 N/A N/A 2 N/A N/A 4 N/A 2 N/A N/A 4 N/A
Calcium 6 N/A N/A N/A N/A N/A N/A N/A N/A N/A N/A N/A 6
Chloride 6 N/A N/A N/A N/A N/A N/A N/A N/A N/A N/A N/A 6
Copper (dissolved) 6 N/A N/A N/A N/A N/A N/A N/A N/A N/A N/A N/A 6
Copper (total) 6 N/A N/A N/A N/A N/A N/A N/A N/A N/A N/A N/A 6
Dissolved Organic Carbon 6 N/A N/A N/A N/A N/A N/A N/A N/A N/A N/A N/A 6
Fluoride 6 N/A N/A N/A N/A N/A 5 N/A N/A N/A N/A 5 1
Hardness 6 N/A N/A N/A N/A N/A N/A N/A N/A N/A N/A N/A 6
Iron (total) 6 N/A N/A N/A N/A N/A N/A N/A N/A 1 N/A N/A 5
Lead (dissolved) 6 N/A N/A 6 N/A N/A N/A N/A 6 N/A N/A N/A N/A
Lead (total) 6 N/A N/A 4 N/A N/A N/A N/A 4 N/A N/A N/A 2
Magnesium 6 N/A N/A N/A N/A N/A N/A N/A N/A N/A N/A N/A 6
Manganese (total) 6 N/A N/A N/A N/A N/A N/A N/A N/A N/A N/A N/A 6
Nickel (dissolved) 6 N/A N/A 1 N/A N/A N/A N/A 1 N/A N/A N/A 5
Nitrate+Nitrite as Nitrogen 6 N/A N/A N/A N/A N/A N/A N/A N/A 3 N/A N/A 3
Nitrogen, Nitrate 6 N/A N/A N/A N/A N/A N/A N/A N/A N/A N/A N/A 6
Nitrogen, Nitrite 6 N/A N/A N/A N/A N/A 4 N/A N/A N/A N/A 4 2
Nitrogen, Total 6 N/A N/A N/A N/A N/A N/A N/A 2 N/A N/A N/A 4
Ortho-phosphate 6 N/A N/A N/A N/A N/A N/A N/A N/A 2 N/A N/A 4
Potassium 6 5 N/A N/A N/A N/A N/A N/A 5 N/A N/A N/A 1
Silver (total) 6 N/A N/A N/A N/A N/A 6 N/A N/A N/A N/A 6 N/A
Sodium 6 N/A N/A N/A N/A N/A N/A N/A N/A N/A N/A N/A 6
Sulfate 6 N/A N/A N/A N/A N/A N/A N/A N/A 1 N/A N/A 5
Total Dissolved Solids 6 N/A N/A N/A N/A N/A N/A N/A N/A 1 N/A N/A 5
Total Kjeldahl Nitrogen 6 N/A N/A N/A N/A N/A N/A N/A 1 N/A 3 N/A 2
Total Phosphorus 6 N/A N/A N/A N/A N/A N/A N/A N/A N/A N/A N/A 6
Turbidity 6 N/A N/A N/A N/A N/A N/A N/A 1 3 N/A N/A 2
Zinc (dissolved) 6 N/A N/A 1 N/A N/A 4 N/A 1 1 N/A 3 1
Zinc (total) 6 N/A N/A 3 N/A N/A N/A N/A 2 1 N/A N/A 3
Totals 198 5 N/A 23 N/A N/A 23 N/A 30 19 3 22 124

NYS DEC Stream Assessment Survey – Data Report
Ramapo River 2018 Report 2019
Page 90 of 102
RAMA-16.7 totals for applied QA/QC flags. Table describes the total number of each lab QA/QC flag and internal validation QA/QC flag applied to every analyte analyzed. All records with a lab flag were removed from the analysis provided for this report. Only records flagged as accepted for all uses (A) through internal validation QA/QC were used in the analysis provided for this report.
Lab Flags QA/QC Flags
Analyte Total Records E EJ J N NJ U UN J R T U A
Alkalinity 5 N/A N/A N/A N/A N/A N/A N/A N/A N/A N/A N/A 5
Aluminum (dissolved) 5 N/A N/A 1 N/A N/A N/A N/A 1 1 N/A N/A 3
Nitrogen, Ammonia 5 N/A N/A N/A N/A N/A N/A N/A N/A 2 1 N/A 2
Arsenic 5 N/A N/A 2 N/A N/A N/A N/A 1 1 N/A N/A 3
Cadmium (dissolved) 5 N/A N/A 2 N/A N/A 3 N/A 2 N/A N/A 3 N/A
Calcium 5 N/A N/A N/A N/A N/A N/A N/A N/A N/A N/A N/A 5
Chloride 5 N/A N/A N/A N/A N/A N/A N/A N/A N/A N/A N/A 5
Copper (dissolved) 5 N/A N/A N/A N/A N/A N/A N/A N/A N/A N/A N/A 5
Copper (total) 5 N/A N/A N/A N/A N/A N/A N/A N/A N/A N/A N/A 5
Dissolved Organic Carbon 5 N/A N/A N/A N/A N/A N/A N/A N/A N/A N/A N/A 5
Fluoride 5 N/A N/A N/A N/A N/A 1 N/A N/A N/A N/A 1 4
Hardness 5 N/A N/A N/A N/A N/A N/A N/A N/A N/A N/A N/A 5
Iron (total) 5 N/A N/A N/A N/A N/A N/A N/A N/A 1 N/A N/A 4
Lead (dissolved) 5 N/A N/A 5 N/A N/A N/A N/A 5 N/A N/A N/A N/A
Lead (total) 5 N/A N/A 3 N/A N/A N/A N/A 3 N/A N/A N/A 2
Magnesium 5 N/A N/A N/A N/A N/A N/A N/A N/A N/A N/A N/A 5
Manganese (total) 5 N/A N/A N/A N/A N/A N/A N/A N/A N/A N/A N/A 5
Nickel (dissolved) 5 N/A N/A N/A N/A N/A N/A N/A N/A N/A N/A N/A 5
Nitrate+Nitrite as Nitrogen 5 N/A N/A N/A N/A N/A N/A N/A N/A 2 N/A N/A 3
Nitrogen, Nitrate 5 N/A N/A N/A N/A N/A N/A N/A N/A N/A N/A N/A 5
Nitrogen, Nitrite 5 N/A N/A N/A N/A N/A 1 N/A N/A 1 N/A 1 3
Nitrogen, Total 5 N/A N/A N/A N/A N/A N/A N/A N/A N/A N/A N/A 5
Ortho-phosphate 5 N/A N/A N/A N/A N/A 1 N/A N/A 3 N/A 1 1
Potassium 5 5 N/A N/A N/A N/A N/A N/A 5 N/A N/A N/A N/A
Silver (total) 5 N/A N/A N/A N/A N/A 5 N/A N/A N/A N/A 5 N/A
Sodium 5 N/A N/A N/A N/A N/A N/A N/A N/A N/A N/A N/A 5
Sulfate 5 N/A N/A N/A N/A N/A N/A N/A N/A N/A N/A N/A 5
Total Dissolved Solids 5 N/A N/A N/A N/A N/A N/A N/A N/A N/A N/A N/A 5
Total Kjeldahl Nitrogen 5 N/A N/A N/A N/A N/A N/A N/A 3 N/A 1 N/A 1
Total Phosphorus 5 N/A N/A N/A N/A N/A N/A N/A N/A N/A N/A N/A 5
Turbidity 5 N/A N/A N/A N/A N/A N/A N/A 2 1 N/A N/A 2
Zinc (dissolved) 5 N/A N/A N/A N/A N/A 3 1 N/A 1 N/A 3 1
Zinc (total) 5 N/A N/A 1 N/A N/A N/A N/A 1 1 N/A N/A 3
Totals 165 5 N/A 14 N/A N/A 14 1 23 14 2 14 112

NYS DEC Stream Assessment Survey – Data Report
Ramapo River 2018 Report 2019
Page 91 of 102
OCSDSTP-001 totals for applied QA/QC flags. Table describes the total number of each lab QA/QC flag and internal validation QA/QC flag applied to every analyte analyzed. All records with a lab flag were removed from the analysis provided for this report. Only records flagged as accepted for all uses (A) through internal validation QA/QC were used in the analysis provided for this report.
Lab Flags QA/QC Flags
Analyte Total Records E EJ J N NJ U UN J R T U A
Alkalinity 5 N/A N/A N/A N/A N/A N/A N/A N/A N/A N/A N/A 5
Aluminum (dissolved) 5 N/A N/A 5 N/A N/A N/A N/A 4 1 N/A N/A N/A
Nitrogen, Ammonia 5 N/A N/A N/A N/A N/A N/A N/A N/A 1 1 N/A 3
Arsenic 5 N/A N/A 5 N/A N/A N/A N/A 4 1 N/A N/A N/A
Cadmium (dissolved) 5 N/A N/A 2 N/A N/A 3 N/A 2 N/A N/A 3 N/A
Calcium 5 N/A N/A N/A N/A N/A N/A N/A N/A N/A N/A N/A 5
Chloride 5 N/A N/A N/A N/A N/A N/A N/A N/A N/A N/A N/A 5
Copper (dissolved) 5 N/A N/A N/A N/A N/A N/A N/A N/A N/A N/A N/A 5
Copper (total) 5 N/A N/A N/A N/A N/A N/A N/A N/A N/A N/A N/A 5
Dissolved Organic Carbon 5 N/A N/A N/A N/A N/A N/A N/A N/A N/A N/A N/A 5
Fluoride 5 N/A N/A N/A N/A N/A N/A N/A N/A N/A N/A N/A 5
Hardness 5 N/A N/A N/A N/A N/A N/A N/A N/A N/A N/A N/A 5
Iron (total) 5 N/A N/A 5 N/A N/A N/A N/A 4 1 N/A N/A N/A
Lead (dissolved) 5 N/A N/A 5 N/A N/A N/A N/A 5 N/A N/A N/A N/A
Lead (total) 5 N/A N/A 5 N/A N/A N/A N/A 5 N/A N/A N/A N/A
Magnesium 5 N/A N/A N/A N/A N/A N/A N/A N/A N/A N/A N/A 5
Manganese (total) 5 N/A N/A N/A N/A N/A N/A N/A N/A N/A N/A N/A 5
Nickel (dissolved) 5 N/A N/A N/A N/A N/A N/A N/A N/A N/A N/A N/A 5
Nitrate+Nitrite as Nitrogen 5 N/A N/A N/A N/A N/A N/A N/A N/A 2 N/A N/A 3
Nitrogen, Nitrate 5 N/A N/A N/A N/A N/A N/A N/A N/A N/A N/A N/A 5
Nitrogen, Nitrite 5 N/A N/A N/A N/A N/A 1 N/A N/A 1 N/A N/A 4
Nitrogen, Total 5 N/A N/A N/A N/A N/A N/A N/A N/A N/A N/A N/A 5
Ortho-phosphate 5 N/A N/A N/A N/A N/A N/A N/A N/A 3 N/A N/A 2
Potassium 5 5 N/A N/A N/A N/A N/A N/A 5 N/A N/A N/A N/A
Silver (total) 5 N/A N/A N/A N/A N/A 5 N/A N/A N/A N/A 5 N/A
Sodium 5 N/A N/A N/A N/A N/A N/A N/A N/A N/A N/A N/A 5
Sulfate 5 N/A N/A N/A N/A N/A N/A N/A N/A 1 N/A N/A 4
Total Dissolved Solids 5 N/A N/A N/A N/A N/A N/A N/A N/A N/A N/A N/A 5
Total Kjeldahl Nitrogen 5 N/A N/A N/A N/A N/A N/A N/A 3 N/A N/A N/A 2
Total Phosphorus 5 N/A N/A N/A N/A N/A N/A N/A N/A N/A N/A N/A 5
Turbidity 5 N/A N/A N/A N/A N/A N/A N/A N/A 2 2 N/A 1
Zinc (dissolved) 5 N/A N/A N/A 1 N/A N/A N/A N/A 1 N/A N/A 4
Zinc (total) 5 N/A N/A N/A N/A N/A N/A N/A N/A 1 N/A N/A 4
Totals 165 5 N/A 27 1 N/A 9 N/A 32 15 3 8 107

NYS DEC Stream Assessment Survey – Data Report
Ramapo River 2018 Report 2019
Page 92 of 102
RAMA-16.5 totals for applied QA/QC flags. Table describes the total number of each lab QA/QC flag and internal validation QA/QC flag applied to every analyte analyzed. All records with a lab flag were removed from the analysis provided for this report. Only records flagged as accepted for all uses (A) through internal validation QA/QC were used in the analysis provided for this report.
Lab Flags QA/QC Flags
Analyte Total Records E EJ J N NJ U UN J R T U A
Alkalinity 5 N/A N/A N/A N/A N/A N/A N/A N/A N/A N/A N/A 5
Aluminum (dissolved) 5 N/A N/A 4 N/A N/A N/A N/A 3 1 N/A N/A 1
Nitrogen, Ammonia 5 N/A N/A N/A N/A N/A N/A N/A 1 1 1 N/A 2
Arsenic 5 N/A N/A 3 N/A N/A N/A N/A 2 1 N/A N/A 2
Cadmium (dissolved) 5 N/A N/A 2 N/A N/A 3 N/A 2 N/A N/A 3 N/A
Calcium 5 N/A N/A N/A N/A N/A N/A N/A N/A N/A N/A N/A 5
Chloride 5 N/A N/A N/A N/A N/A N/A N/A N/A N/A N/A N/A 5
Copper (dissolved) 5 N/A N/A N/A N/A N/A N/A N/A N/A N/A N/A N/A 5
Copper (total) 5 N/A N/A N/A N/A N/A N/A N/A N/A N/A N/A N/A 5
Dissolved Organic Carbon 5 N/A N/A N/A N/A N/A N/A N/A N/A N/A N/A N/A 5
Fluoride 5 N/A N/A N/A N/A N/A N/A N/A N/A N/A N/A N/A 5
Hardness 5 N/A N/A N/A N/A N/A N/A N/A N/A N/A N/A N/A 5
Iron (total) 5 N/A N/A 1 N/A N/A N/A N/A N/A 1 N/A N/A 4
Lead (dissolved) 5 N/A N/A 5 N/A N/A N/A N/A 5 N/A N/A N/A N/A
Lead (total) 5 N/A N/A 4 N/A N/A N/A N/A 4 N/A N/A N/A 1
Magnesium 5 N/A N/A N/A N/A N/A N/A N/A N/A N/A N/A N/A 5
Manganese (total) 5 N/A N/A N/A N/A N/A N/A N/A N/A N/A N/A N/A 5
Nickel (dissolved) 5 N/A N/A N/A N/A N/A N/A N/A N/A N/A N/A N/A 5
Nitrate+Nitrite as Nitrogen 5 N/A N/A N/A N/A N/A N/A N/A N/A 2 N/A N/A 3
Nitrogen, Nitrate 5 N/A N/A N/A N/A N/A N/A N/A N/A N/A N/A N/A 5
Nitrogen, Nitrite 5 N/A N/A N/A N/A N/A N/A N/A N/A 1 N/A N/A 4
Nitrogen, Total 5 N/A N/A N/A N/A N/A N/A N/A N/A N/A N/A N/A 5
Ortho-phosphate 5 N/A N/A N/A N/A N/A N/A N/A N/A 2 N/A N/A 3
Potassium 5 5 N/A N/A N/A N/A N/A N/A 5 N/A N/A N/A N/A
Silver (total) 5 N/A N/A N/A N/A N/A 5 N/A N/A N/A N/A 5 N/A
Sodium 5 N/A N/A N/A N/A N/A N/A N/A N/A N/A N/A N/A 5
Sulfate 5 N/A N/A N/A N/A N/A N/A N/A N/A N/A N/A N/A 5
Total Dissolved Solids 5 N/A N/A N/A N/A N/A N/A N/A N/A N/A N/A N/A 5
Total Kjeldahl Nitrogen 5 N/A N/A N/A N/A N/A N/A N/A 3 N/A 1 N/A 1
Total Phosphorus 5 N/A N/A N/A N/A N/A N/A N/A N/A N/A N/A N/A 5
Turbidity 5 N/A N/A N/A N/A N/A N/A N/A 3 1 1 N/A N/A
Zinc (dissolved) 5 N/A N/A N/A 1 N/A N/A N/A N/A 1 N/A N/A 4
Zinc (total) 5 N/A N/A N/A N/A N/A N/A N/A N/A 1 N/A N/A 4
Totals 165 5 N/A 19 1 N/A 8 N/A 28 12 3 8 114

NYS DEC Stream Assessment Survey – Data Report
Ramapo River 2018 Report 2019
Page 93 of 102
RAMA-16.1 totals for applied QA/QC flags. Table describes the total number of each lab QA/QC flag and internal validation QA/QC flag applied to every analyte analyzed. All records with a lab flag were removed from the analysis provided for this report. Only records flagged as accepted for all uses (A) through internal validation QA/QC were used in the analysis provided for this report.
Lab Flags QA/QC Flags
Analyte Total Records E EJ J N NJ U UN J R T U A
Alkalinity 5 N/A N/A N/A N/A N/A N/A N/A N/A N/A N/A N/A 5
Aluminum (dissolved) 5 N/A N/A 4 N/A N/A N/A N/A 3 1 N/A N/A 1
Nitrogen, Ammonia 5 N/A N/A N/A N/A N/A N/A N/A 2 1 N/A N/A 2
Arsenic 5 N/A N/A 3 N/A N/A N/A N/A 2 1 N/A N/A 2
Cadmium (dissolved) 5 N/A N/A 1 N/A N/A 4 N/A 1 N/A N/A 4 N/A
Calcium 5 N/A N/A N/A N/A N/A N/A N/A N/A N/A N/A N/A 5
Chloride 5 N/A N/A N/A N/A N/A N/A N/A N/A N/A N/A N/A 5
Copper (dissolved) 5 N/A N/A N/A N/A N/A N/A N/A N/A N/A N/A N/A 5
Copper (total) 5 N/A N/A N/A N/A N/A N/A N/A N/A N/A N/A N/A 5
Dissolved Organic Carbon 5 N/A N/A N/A N/A N/A N/A N/A N/A N/A N/A N/A 5
Fluoride 5 N/A N/A N/A N/A N/A N/A N/A N/A N/A N/A N/A 5
Hardness 5 N/A N/A N/A N/A N/A N/A N/A N/A N/A N/A N/A 5
Iron (total) 5 N/A N/A N/A N/A N/A N/A N/A N/A 1 N/A N/A 4
Lead (dissolved) 5 N/A N/A 5 N/A N/A N/A N/A 5 N/A N/A N/A N/A
Lead (total) 5 N/A N/A 4 N/A N/A N/A N/A 4 N/A N/A N/A 1
Magnesium 5 N/A N/A N/A N/A N/A N/A N/A N/A N/A N/A N/A 5
Manganese (total) 5 N/A N/A N/A N/A N/A N/A N/A N/A N/A N/A N/A 5
Nickel (dissolved) 5 N/A N/A N/A N/A N/A N/A N/A N/A N/A N/A N/A 5
Nitrate+Nitrite as Nitrogen 5 N/A N/A N/A N/A N/A N/A N/A N/A 2 N/A N/A 3
Nitrogen, Nitrate 5 N/A N/A N/A N/A N/A N/A N/A N/A N/A N/A N/A 5
Nitrogen, Nitrite 5 N/A N/A N/A N/A N/A N/A N/A N/A 1 N/A N/A 4
Nitrogen, Total 5 N/A N/A N/A N/A N/A N/A N/A N/A N/A N/A N/A 5
Ortho-phosphate 5 N/A N/A N/A N/A N/A N/A N/A N/A 2 N/A N/A 3
Potassium 5 5 N/A N/A N/A N/A N/A N/A 5 N/A N/A N/A N/A
Silver (total) 5 N/A N/A N/A N/A N/A 5 N/A N/A N/A N/A 5 N/A
Sodium 5 N/A N/A N/A N/A N/A N/A N/A N/A N/A N/A N/A 5
Sulfate 5 N/A N/A N/A N/A N/A N/A N/A N/A N/A N/A N/A 5
Total Dissolved Solids 5 N/A N/A N/A N/A N/A N/A N/A N/A N/A N/A N/A 5
Total Kjeldahl Nitrogen 5 N/A N/A N/A N/A N/A N/A N/A 3 N/A 1 N/A 1
Total Phosphorus 5 N/A N/A N/A N/A N/A N/A N/A N/A N/A N/A N/A 5
Turbidity 5 N/A N/A N/A N/A N/A N/A N/A 1 1 2 N/A 1
Zinc (dissolved) 5 N/A N/A N/A 1 N/A N/A N/A N/A 1 N/A N/A 4
Zinc (total) 5 N/A N/A N/A N/A N/A N/A N/A N/A 1 N/A N/A 4
Totals 165 5 N/A 17 1 N/A 9 N/A 26 12 3 9 115

NYS DEC Stream Assessment Survey – Data Report
Ramapo River 2018 Report 2019
Page 94 of 102
RAMA-13.3 totals for applied QA/QC flags. Table describes the total number of each lab QA/QC flag and internal validation QA/QC flag applied to every analyte analyzed. All records with a lab flag were removed from the analysis provided for this report. Only records flagged as accepted for all uses (A) through internal validation QA/QC were used in the analysis provided for this report.
Lab Flags QA/QC Flags
Analyte Total Records E EJ J N NJ U UN J R T U A
Alkalinity 5 N/A N/A N/A N/A N/A N/A N/A N/A N/A N/A N/A 5
Aluminum (dissolved) 5 N/A N/A 5 N/A N/A N/A N/A 4 1 N/A N/A N/A
Nitrogen, Ammonia 5 N/A N/A N/A N/A N/A N/A N/A N/A 3 N/A N/A 2
Arsenic 5 N/A N/A 2 N/A N/A N/A N/A 2 1 N/A N/A 2
Cadmium (dissolved) 5 N/A N/A 1 N/A N/A 4 N/A 1 N/A N/A 4 N/A
Calcium 5 N/A N/A N/A N/A N/A N/A N/A N/A N/A N/A N/A 5
Chloride 5 N/A N/A N/A N/A N/A N/A N/A N/A N/A N/A N/A 5
Copper (dissolved) 5 N/A N/A N/A N/A N/A N/A N/A N/A N/A N/A N/A 5
Copper (total) 5 N/A N/A N/A N/A N/A N/A N/A N/A N/A N/A N/A 5
Dissolved Organic Carbon 5 N/A N/A N/A N/A N/A N/A N/A N/A N/A N/A N/A 5
Fluoride 5 N/A N/A N/A N/A N/A N/A N/A N/A N/A N/A N/A 5
Hardness 5 N/A N/A N/A N/A N/A N/A N/A N/A N/A N/A N/A 5
Iron (total) 5 N/A N/A N/A N/A N/A N/A N/A N/A 1 N/A N/A 4
Lead (dissolved) 5 N/A N/A 4 N/A N/A 1 N/A 4 N/A N/A 1 N/A
Lead (total) 5 N/A N/A 4 N/A N/A N/A N/A 4 N/A N/A N/A 1
Magnesium 5 N/A N/A N/A N/A N/A N/A N/A N/A N/A N/A N/A 5
Manganese (total) 5 N/A N/A N/A N/A N/A N/A N/A N/A N/A N/A N/A 5
Nickel (dissolved) 5 N/A N/A N/A N/A N/A N/A N/A N/A N/A N/A N/A 5
Nitrate+Nitrite as Nitrogen 5 N/A N/A N/A N/A N/A N/A N/A N/A 2 N/A N/A 3
Nitrogen, Nitrate 5 N/A N/A N/A N/A N/A N/A N/A N/A N/A N/A N/A 5
Nitrogen, Nitrite 5 N/A N/A N/A N/A N/A N/A N/A N/A N/A N/A N/A 5
Nitrogen, Total 5 N/A N/A N/A N/A N/A N/A N/A N/A N/A N/A N/A 5
Ortho-phosphate 5 N/A N/A N/A N/A N/A N/A N/A N/A 2 N/A N/A 3
Potassium 5 5 N/A N/A N/A N/A N/A N/A 5 N/A N/A N/A N/A
Silver (total) 5 N/A N/A N/A N/A N/A 5 N/A N/A N/A N/A 5 N/A
Sodium 5 N/A N/A N/A N/A N/A N/A N/A N/A N/A N/A N/A 5
Sulfate 5 N/A N/A N/A N/A N/A N/A N/A N/A N/A N/A N/A 5
Total Dissolved Solids 5 N/A N/A N/A N/A N/A N/A N/A N/A N/A N/A N/A 5
Total Kjeldahl Nitrogen 5 N/A N/A N/A N/A N/A N/A N/A 2 N/A 2 N/A 1
Total Phosphorus 5 N/A N/A N/A N/A N/A N/A N/A N/A N/A N/A N/A 5
Turbidity 5 N/A N/A N/A N/A N/A N/A N/A 2 3 N/A N/A N/A
Zinc (dissolved) 5 N/A N/A N/A 1 N/A N/A N/A N/A 1 N/A N/A 4
Zinc (total) 5 N/A N/A N/A N/A N/A N/A N/A N/A 1 N/A N/A 4
Totals 165 5 N/A 16 1 N/A 10 N/A 24 15 2 10 114

NYS DEC Stream Assessment Survey – Data Report
Ramapo River 2018 Report 2019
Page 95 of 102
RAMA-11.8 totals for applied QA/QC flags. Table describes the total number of each lab QA/QC flag and internal validation QA/QC flag applied to every analyte analyzed. All records with a lab flag were removed from the analysis provided for this report. Only records flagged as accepted for all uses (A) through internal validation QA/QC were used in the analysis provided for this report.
Lab Flags QA/QC Flags
Analyte Total Records E EJ J N NJ U UN J R T U A
Alkalinity 5 N/A N/A N/A N/A N/A N/A N/A N/A N/A N/A N/A 5
Aluminum (dissolved) 5 N/A N/A 4 N/A N/A N/A N/A 3 1 N/A N/A 1
Nitrogen, Ammonia 5 N/A N/A N/A N/A N/A 1 N/A N/A 3 N/A 1 1
Arsenic 5 N/A N/A 5 N/A N/A N/A N/A 4 1 N/A N/A N/A
Cadmium (dissolved) 5 N/A N/A 2 N/A N/A 3 N/A 2 N/A N/A 3 N/A
Calcium 5 N/A N/A N/A N/A N/A N/A N/A N/A N/A N/A N/A 5
Chloride 5 N/A N/A N/A N/A N/A N/A N/A N/A N/A N/A N/A 5
Copper (dissolved) 5 N/A N/A N/A N/A N/A N/A N/A N/A N/A N/A N/A 5
Copper (total) 5 N/A N/A N/A N/A N/A N/A N/A N/A N/A N/A N/A 5
Dissolved Organic Carbon 5 N/A N/A N/A N/A N/A N/A N/A N/A N/A N/A N/A 5
Fluoride 5 N/A N/A N/A N/A N/A N/A N/A N/A N/A N/A N/A 5
Hardness 5 N/A N/A N/A N/A N/A N/A N/A N/A N/A N/A N/A 5
Iron (total) 5 N/A N/A N/A N/A N/A N/A N/A N/A 1 N/A N/A 4
Lead (dissolved) 5 N/A N/A 5 N/A N/A N/A N/A 5 N/A N/A N/A N/A
Lead (total) 5 N/A N/A 5 N/A N/A N/A N/A 5 N/A N/A N/A N/A
Magnesium 5 N/A N/A N/A N/A N/A N/A N/A N/A N/A N/A N/A 5
Manganese (total) 5 N/A N/A N/A N/A N/A N/A N/A N/A N/A N/A N/A 5
Nickel (dissolved) 5 N/A N/A 1 N/A N/A N/A N/A 1 N/A N/A N/A 4
Nitrate+Nitrite as Nitrogen 5 N/A N/A N/A N/A N/A N/A N/A N/A 2 N/A N/A 3
Nitrogen, Nitrate 5 N/A N/A N/A N/A N/A N/A N/A N/A N/A N/A N/A 5
Nitrogen, Nitrite 5 N/A N/A N/A N/A N/A 2 N/A N/A N/A N/A 2 3
Nitrogen, Total 5 N/A N/A N/A N/A N/A N/A N/A N/A N/A N/A N/A 5
Ortho-phosphate 5 N/A N/A N/A N/A N/A N/A N/A N/A 2 N/A N/A 3
Potassium 5 5 N/A N/A N/A N/A N/A N/A 5 N/A N/A N/A N/A
Silver (total) 5 N/A N/A N/A N/A N/A 5 N/A N/A N/A N/A 5 N/A
Sodium 5 N/A N/A N/A N/A N/A N/A N/A N/A N/A N/A N/A 5
Sulfate 5 N/A N/A N/A N/A N/A N/A N/A N/A N/A N/A N/A 5
Total Dissolved Solids 5 N/A N/A N/A N/A N/A N/A N/A N/A N/A N/A N/A 5
Total Kjeldahl Nitrogen 5 N/A N/A N/A N/A N/A N/A N/A N/A 1 3 N/A 1
Total Phosphorus 5 N/A N/A N/A N/A N/A N/A N/A N/A N/A N/A N/A 5
Turbidity 5 N/A N/A N/A N/A N/A N/A N/A N/A 2 2 N/A 1
Zinc (dissolved) 5 N/A N/A 2 1 N/A N/A N/A 2 1 N/A N/A 2
Zinc (total) 5 N/A N/A 1 N/A N/A N/A N/A 1 1 N/A N/A 3
Totals 165 5 N/A 25 1 N/A 11 N/A 28 15 5 11 106

NYS DEC Stream Assessment Survey – Data Report
Ramapo River 2018 Report 2019
Page 96 of 102
RAMA-4.8 totals for applied QA/QC flags. Table describes the total number of each lab QA/QC flag and internal validation QA/QC flag applied to every analyte analyzed. All records with a lab flag were removed from the analysis provided for this report. Only records flagged as accepted for all uses (A) through internal validation QA/QC were used in the analysis provided for this report.
Lab Flags QA/QC Flags
Analyte Total Records E EJ J N NJ U UN J R T U A
Alkalinity 5 N/A N/A N/A N/A N/A N/A N/A N/A N/A N/A N/A 5 Aluminum (dissolved) 5 N/A N/A 3 N/A N/A N/A N/A 2 1 N/A N/A 2 Nitrogen, Ammonia 5 N/A N/A N/A N/A N/A N/A N/A N/A 3 N/A N/A 2 Arsenic 5 N/A N/A 5 N/A N/A N/A N/A 4 1 N/A N/A N/A
Cadmium (dissolved) 5 N/A N/A 2 N/A N/A 3 N/A 2 N/A N/A 3 N/A
Calcium 5 N/A N/A N/A N/A N/A N/A N/A N/A N/A N/A N/A 5 Chloride 5 N/A N/A N/A N/A N/A N/A N/A N/A N/A N/A N/A 5 Copper (dissolved) 5 N/A N/A N/A N/A N/A N/A N/A N/A N/A N/A N/A 5 Copper (total) 5 N/A N/A N/A N/A N/A N/A N/A N/A N/A N/A N/A 5 Dissolved Organic Carbon 5 N/A N/A N/A N/A N/A N/A N/A N/A N/A N/A N/A 5 Fluoride 5 N/A N/A N/A N/A N/A N/A N/A N/A N/A N/A N/A 5 Hardness 5 N/A N/A N/A N/A N/A N/A N/A N/A N/A N/A N/A 5 Iron (total) 5 N/A N/A N/A N/A N/A N/A N/A N/A 1 N/A N/A 4 Lead (dissolved) 5 N/A N/A 5 N/A N/A N/A N/A 5 N/A N/A N/A N/A
Lead (total) 5 N/A N/A 4 N/A N/A N/A N/A 4 N/A N/A N/A 1 Magnesium 5 N/A N/A N/A N/A N/A N/A N/A N/A N/A N/A N/A 5 Manganese (total) 5 N/A N/A N/A N/A N/A N/A N/A N/A N/A N/A N/A 5 Nickel (dissolved) 5 N/A N/A 3 N/A N/A N/A N/A 3 N/A N/A N/A 2 Nitrate+Nitrite as Nitrogen 5 N/A N/A N/A N/A N/A N/A N/A N/A 2 N/A N/A 3 Nitrogen, Nitrate 5 N/A N/A N/A N/A N/A N/A N/A N/A N/A N/A N/A 5 Nitrogen, Nitrite 5 N/A N/A N/A N/A N/A 3 N/A N/A N/A N/A 3 2 Nitrogen, Total 5 N/A N/A N/A N/A N/A N/A N/A N/A N/A N/A N/A 5 Ortho-phosphate 5 N/A N/A N/A N/A N/A N/A N/A 1 N/A N/A N/A 4 Potassium 5 3 2 N/A N/A N/A N/A N/A 5 N/A N/A N/A N/A
Silver (total) 5 N/A N/A N/A N/A N/A 5 N/A N/A N/A N/A 5 N/A
Sodium 5 N/A N/A N/A N/A N/A N/A N/A N/A N/A N/A N/A 5 Sulfate 5 N/A N/A N/A N/A N/A N/A N/A N/A N/A N/A N/A 5 Total Dissolved Solids 5 N/A N/A N/A N/A N/A N/A N/A N/A N/A N/A N/A 5 Total Kjeldahl Nitrogen 5 N/A N/A N/A N/A N/A N/A N/A N/A 1 3 N/A 1 Total Phosphorus 5 N/A N/A N/A N/A N/A N/A N/A N/A N/A N/A N/A 5 Turbidity 5 N/A N/A N/A N/A N/A N/A N/A 2 1 1 N/A 1 Zinc (dissolved) 5 N/A N/A 2 N/A 1 N/A N/A 2 1 N/A N/A 2 Zinc (total) 5 N/A N/A 1 N/A N/A N/A N/A N/A 1 N/A N/A 4
Totals 165 3 2 25 N/A 1 11 N/A 30 12 4 11 108

NYS DEC Stream Assessment Survey – Data Report
Ramapo River 2018 Report 2019
Page 97 of 102
RAMA-1.1 totals for applied QA/QC flags. Table describes the total number of each lab QA/QC flag and internal validation QA/QC flag applied to every analyte analyzed. All records with a lab flag were removed from the analysis provided for this report. Only records flagged as accepted for all uses (A) through internal validation QA/QC were used in the analysis provided for this report.
Lab Flags QA/QC Flags
Analyte Total Records E EJ J N NJ U UN J R T U A
Alkalinity 5 N/A N/A N/A N/A N/A N/A N/A N/A N/A N/A N/A 5
Aluminum (dissolved) 5 N/A N/A 3 N/A N/A N/A N/A 2 1 N/A N/A 2
Nitrogen, Ammonia 5 N/A N/A N/A N/A N/A N/A N/A N/A 3 N/A N/A 2
Arsenic 5 N/A N/A 5 N/A N/A N/A N/A 4 1 N/A N/A N/A
Cadmium (dissolved) 5 N/A N/A 2 N/A N/A 3 N/A 2 N/A N/A 3 N/A
Calcium 5 N/A N/A N/A N/A N/A N/A N/A N/A N/A N/A N/A 5
Chloride 5 N/A N/A N/A N/A N/A N/A N/A N/A N/A N/A N/A 5
Copper (dissolved) 5 N/A N/A N/A N/A N/A N/A N/A N/A N/A N/A N/A 5
Copper (total) 5 N/A N/A N/A N/A N/A N/A N/A N/A N/A N/A N/A 5
Dissolved Organic Carbon 5 N/A N/A N/A N/A N/A N/A N/A N/A N/A N/A N/A 5
Fluoride 5 N/A N/A N/A N/A N/A N/A N/A N/A N/A N/A N/A 5
Hardness 5 N/A N/A N/A N/A N/A N/A N/A N/A N/A N/A N/A 5
Iron (total) 5 N/A N/A 1 N/A N/A N/A N/A N/A 1 N/A N/A 4
Lead (dissolved) 5 N/A N/A 5 N/A N/A N/A N/A 5 N/A N/A N/A N/A
Lead (total) 5 N/A N/A 4 N/A N/A N/A N/A 4 N/A N/A N/A 1
Magnesium 5 N/A N/A N/A N/A N/A N/A N/A N/A N/A N/A N/A 5
Manganese (total) 5 N/A N/A N/A N/A N/A N/A N/A N/A N/A N/A N/A 5
Nickel (dissolved) 5 N/A N/A 3 N/A N/A N/A N/A 3 N/A N/A N/A 2
Nitrate+Nitrite as Nitrogen 5 N/A N/A N/A N/A N/A N/A N/A N/A 2 N/A N/A 3
Nitrogen, Nitrate 5 N/A N/A N/A N/A N/A N/A N/A N/A N/A N/A N/A 5
Nitrogen, Nitrite 5 N/A N/A N/A N/A N/A 4 N/A N/A N/A N/A 4 1
Nitrogen, Total 5 N/A N/A N/A N/A N/A N/A N/A 2 N/A N/A N/A 3
Ortho-phosphate 5 N/A N/A N/A N/A N/A N/A N/A 1 1 N/A N/A 3
Potassium 5 2 3 N/A N/A N/A N/A N/A 5 N/A N/A N/A N/A
Silver (total) 5 N/A N/A N/A N/A N/A 5 N/A N/A N/A N/A 5 N/A
Sodium 5 N/A N/A N/A N/A N/A N/A N/A N/A N/A N/A N/A 5
Sulfate 5 N/A N/A N/A N/A N/A N/A N/A N/A N/A N/A N/A 5
Total Dissolved Solids 5 N/A N/A N/A N/A N/A N/A N/A N/A N/A N/A N/A 5
Total Kjeldahl Nitrogen 5 N/A N/A N/A N/A N/A N/A N/A N/A 1 3 N/A 1
Total Phosphorus 5 N/A N/A N/A N/A N/A N/A N/A N/A N/A N/A N/A 5
Turbidity 5 N/A N/A N/A N/A N/A N/A N/A N/A 1 3 N/A 1
Zinc (dissolved) 5 N/A N/A 1 1 N/A N/A N/A 1 1 N/A N/A 3
Zinc (total) 5 N/A N/A 2 N/A N/A N/A N/A 1 1 N/A N/A 3
Totals 165 2 3 26 1 N/A 12 N/A 30 13 6 12 104

NYS DEC Stream Assessment Survey – Data Report
Ramapo River 2018 Report 2019
Page 98 of 102
Appendix IV: Assessment of Stream Reach Physical Habitat Field Sheet

NYS DEC Stream Assessment Survey – Data Report
Ramapo River 2018 Report 2019
Page 99 of 102

NYS DEC Stream Assessment Survey – Data Report
Ramapo River 2018 Report 2019
Page 100 of 102
Appendix V: Observer Ranking of Recreational Ability Field Sheet
Clear Intermediate Turbid
NYSDEC - Assessment of Recreational Use Perception
Circle the one answer which best describes your ability to participate in 10 contact
recreation:
a. Beautiful, could not be nicer. Ability to swim, wade, dive, water ski
etc…fully attained.
b. Minor aesthetic problems, but still excellent for 10 contact recreation.
c. 10 contact recreation slightly impacted.
d. Desire to participate in 10 contact recreation substantially reduced.
e. Awful! 10 contact recreation impossible.
f. Not applicable (headwater/high flows/dry, etc.)
Circle the one answer which best describes your ability to participate in 20
contact
recreation:
a. Beautiful, could not be nicer. Ability to fish and boat fully attained.
b. Minor aesthetic problems, but still excellent for 20 contact recreation.
c. 20 contact recreation slightly impacted.
d. Desire to participate in 20 contact recreation substantially reduced.
e. Awful! 20 contact recreation impossible.
f. Not applicable (headwater/high flows/dry, etc.)
Weather conditions (Current): Sun Rain Clouds
Weather conditions (Past 24hrs): Sun Rain Clouds
Water Clarity: 0 1 2 3 4 5 6 7 8 9 10
Phytoplankton: 0 1 2 3 4 5 6 7 8 9 10
(suspended)
Periphyton Cover: 0 1 2 3 4 5 6 7 8 9 10
Macrophyte Cover: 0 1 2 3 4 5 6 7 8 9 10
Odor: 0 1 2 3 4 5 6 7 8 9 10
Trash: 0 1 2 3 4 5 6 7 8 9 10
Discharges/Pipes: 0 1 2 3 4 5 6 7 8 9 10
Natural Intermediate Severe
Natural Intermediate Severe
Natural Intermediate Severe
Natural Intermediate Noxious
None Intermediate Landfill
None Intermediate Dominant
Circle all the variables that negatively affect your opinion of recreational use of the
waterbody today.
Water Clarity Phytoplankton Periphyton Macrophytes Odor Trash
Discharges/Pipes
Other (Please list):

NYS DEC Stream Assessment Survey – Data Report
Ramapo River 2018 Report 2019
Page 101 of 102
Appendix VI: Toxicity Fact Sheet

NYS DEC Stream Assessment Survey – Data Report
Ramapo River 2018 Report 2019
Page 102 of 102