Embed Size (px)
Citation preview

NYP/Q DSRIP PPS – Finance Meeting
Page 1
Meeting Purpose:
1. Discuss current status of DSRIP deliverables for Finance.
# Topic
Document
Responsible Person
1. Welcome & Purpose of Meeting
Chris
2. Audit Updates
NYS I.A. (October 6th
, 2016)
Amanda
3.
(2) At-Risk Network Partners
Visiting Nurse Service of New York
Lexington Hearing and Speech Center
Follow-Up Plan - VNSNY.docx
Follow-Up Action Plan - Lexington.docx
Daniel
4.
Equity Updates
EIP
EPP
Amanda
5. Revenue & Expense Trend Updates
Revenue & Expense Forecast.xlsx
Amanda
6.
ACTION ITEM:
VBP Baseline Assessment (PowerPoint)
Value Based Payment (VBP) Survey Results [Final].pptx
Daniel
7. Partner Incentive Distribution #3 Amanda
8.
Next Steps:
Engage At-Risk Partners and execute follow-up plan
Finalize distribution checklist for payment #3 partner
incentives
All
Meeting Title: NYP/Q DSRIP Finance Meeting :
Finance Progress Overview
Meeting
Date: November 1
st, 2016
Facilitator(s): Amanda Simmons/Daniel Notarnicola Meeting
Time: 1:00 PM – 2:00 PM
Attendees: Finance Committee
Chair : Christopher Caulfield
NYP/Q 56-45 Main Street K.W Board Room

NYP/Q DSRIP PPS – Finance Meeting
Page 2
9. Questions / Adjourn All

Financial Sustainability Follow-Up Evaluation Plan:
Lexington Hearing & Speech Center:
1. Confirm with the provider that the reported financial numbers are accurate, and that the
metrics have, indeed, identified a financial challenge.
2. Inquire about the availability of mid-year consolidated financials that can be used to
supplement the trend being reviewed.
3. Gain an understanding as to why this provider is setting off key financial risk indicators
and if there is any visible trend.
4. NO visible risk indicator trend:
a. Activity flagged initially may indicate an outlier performance.
i. Partner requires no immediate intervention.
5. YES visible risk indicator trend:
a. Detective
i. Partner will go through a monitoring program that will assess financials on
a 6-month basis in order to isolate risk occurrence.
b. Corrective
i. Reconcile partner DSRIP funding receipts with funds flow model to
identify any possible discrepancies.
ii. Identify potentials for engaging in additional projects to maximize funds
flow.
iii. Identify alternative funding sources; e.g. grants.
iv. Seek alternative providers that could fulfill the project goals.
c. Report findings to the Finance Committee and solicit advice on the
implementation of one of the above strategies or an alternative one.

Financial Sustainability Follow-Up Evaluation Plan:
Visiting Nurse Service of New York:
1. Confirm with the provider that the reported financial numbers are accurate, and that the
metrics have, indeed, identified a financial challenge.
a. Current notes show that 2015 financials for VNSNY were unaudited.
Confirmation needs to be obtained that the status here has been updated to
“audited”
2. Inquire about the availability of mid-year consolidated financials that can be used to
supplement the trend being reviewed.
3. Gain an understanding as to why this provider is setting off key financial risk indicators
and if there is any visible trend.
4. NO visible risk indicator trend:
a. Activity flagged initially may indicate an outlier performance.
i. Partner requires no immediate intervention.
5. YES visible risk indicator trend:
a. Detective
i. Partner will go through a monitoring program that will assess financials on
a 6-month basis in order to isolate risk occurrence.
b. Corrective
i. Reconcile partner DSRIP funding receipts with funds flow model to
identify any possible discrepancies.
ii. Identify potentials for engaging in additional projects to maximize funds
flow.
iii. Identify alternative funding sources; e.g. grants.
iv. Seek alternative providers that could fulfill the project goals.
c. Report findings to the Finance Committee and solicit advice on the
implementation of one of the above strategies or an alternative one.
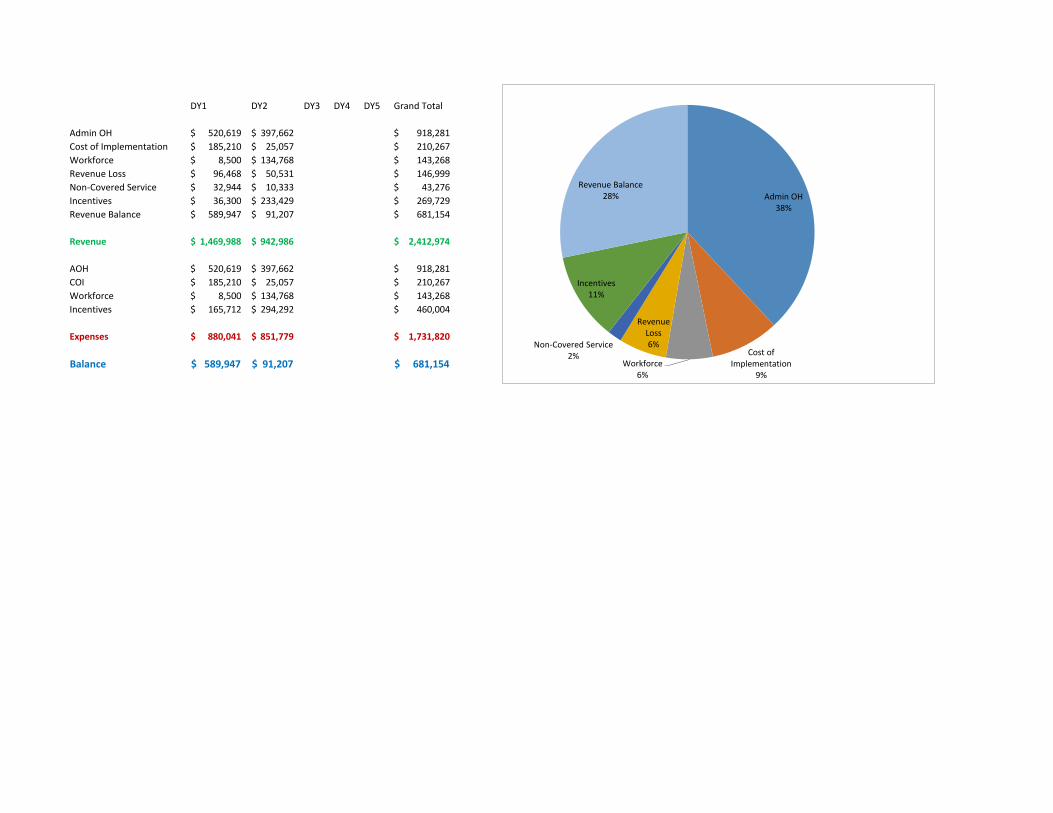
DY1 DY2 DY3 DY4 DY5 Grand Total
Admin OH 520,619$ 397,662$ 918,281$
Cost of Implementation 185,210$ 25,057$ 210,267$
Workforce 8,500$ 134,768$ 143,268$
Revenue Loss 96,468$ 50,531$ 146,999$
Non-Covered Service 32,944$ 10,333$ 43,276$
Incentives 36,300$ 233,429$ 269,729$
Revenue Balance 589,947$ 91,207$ 681,154$
Revenue 1,469,988$ 942,986$ 2,412,974$
AOH 520,619$ 397,662$ 918,281$
COI 185,210$ 25,057$ 210,267$
Workforce 8,500$ 134,768$ 143,268$
Incentives 165,712$ 294,292$ 460,004$
Expenses 880,041$ 851,779$ 1,731,820$
Balance 589,947$ 91,207$ 681,154$
Admin OH 38%
Cost of Implementation
9%
Workforce 6%
Revenue Loss 6% Non-Covered Service
2%
Incentives 11%
Revenue Balance 28%

Revenue & Expense Forecast
April 1, 2015 -
March 31, 2016
April 1, 2016 -
March 31, 2017
April 1, 2017 -
March 31, 2018
April 1, 2018 -
March 31, 2019
April 1, 2019 -
March 31, 2020
Month DY1 DY2 DY3 DY4 DY5
April -$ 369,789.82$
May -$ 112,921.80$
June -$ 115,451.78$
July -$ 151,266.75$
August -$ 57,824.39$
September -$ 44,524.12$
October 302,360.27$
November 31,398.01$
December 57,335.99$
January 49,764.83$
February 332,645.87$
March 106,536.12$
Grand Total 880,041.09$ 851,778.66$ -$ -$ -$
April 1, 2015 -
March 31, 2016
April 1, 2016 -
March 31, 2017
April 1, 2017 -
March 31, 2018
April 1, 2018 -
March 31, 2019
April 1, 2019 -
March 31, 2020
Month DY1 DY2 DY3 DY4 DY5
April -$
May -$
June 1,102,491.00$
July -$ 367,497.09$
August -$ 575,489.00$
September -$
October -$
November -$
December -$
January 367,497.00$
February -$
March -$
Grand Totals 1,469,988.00$ 942,986.09$ -$ -$ -$
EXPENSE
REVENUE
$-
$50,000.00
$100,000.00
$150,000.00
$200,000.00
$250,000.00
$300,000.00
$350,000.00
$400,000.00
DY1 DY2
$-
$200,000.00
$400,000.00
$600,000.00
$800,000.00
$1,000,000.00
$1,200,000.00
DY1 DY2
10/27/2016 CONFIDENTIAL

Revenue & Expense Forecast
April 1, 2015 -
March 31, 2016
April 1, 2016 -
March 31, 2017
April 1, 2017 -
March 31, 2018
April 1, 2018 -
March 31, 2019
April 1, 2019 -
March 31, 2020
Month DY1 DY2 DY3 DY4 DY5
April 77,613.29$
May 85,205.19$
June 36,758.15$
July 107,551.10$
August 51,877.41$
September 38,656.47$
October 202,490.27$
November 31,273.01$
December 679.33$
January 26,402.61$
February 166,415.78$
March 93,358.03$
Grand Total 520,619.03$ 397,661.61$ -$ -$ -$
April 1, 2015 -
March 31, 2016
April 1, 2016 -
March 31, 2017
April 1, 2017 -
March 31, 2018
April 1, 2018 -
March 31, 2019
April 1, 2019 -
March 31, 2020
Month DY1 DY2 DY3 DY4 DY5
April (14,563.17)$
May 13,862.65$
June 7,995.00$
July 5,947.65$
August 5,946.98$
September 5,867.65$
October 99,870.00$
November 125.00$
December 56,656.66$
January 14,279.22$
February 14,279.22$
March -$
Grand Total 185,210.10$ 25,056.76$ -$ -$ -$
EXPENSE : Administrative Overhead
EXPENSE : Cost of Implementation
$-
$50,000.00
$100,000.00
$150,000.00
$200,000.00
$250,000.00
DY1 DY2
$(40,000.00)
$(20,000.00)
$-
$20,000.00
$40,000.00
$60,000.00
$80,000.00
$100,000.00
$120,000.00
DY1 DY2
10/27/2016
All expenses are reflected in GL290 file exported from Lawson General Ledger System
No Cost of Implementation expenses for March ‘16
No Workforce expenses for March ‘16
No Revenue Loss cleared the GL during March ‘16 CONFIDENTIAL

Revenue & Expense Forecast
April 1, 2015 -
March 31, 2016
April 1, 2016 -
March 31, 2017
April 1, 2017 -
March 31, 2018
April 1, 2018 -
March 31, 2019
April 1, 2019 -
March 31, 2020
Month DY1 DY2 DY3 DY4 DY5
April 22,500.00$
May -$
June 72,000.00$
July 40,268.00$
August
September
October
November
December
January 4,083.00$
February 4,083.00$
March 334.00$
Grand Total 8,500.00$ 134,768.00$ -$ -$ -$
April 1, 2015 -
March 31, 2016
April 1, 2016 -
March 31, 2017
April 1, 2017 -
March 31, 2018
April 1, 2018 -
March 31, 2019
April 1, 2019 -
March 31, 2020
Month DY1 DY2 DY3 DY4 DY5
April 50,530.84$
May
June
July
August
September
October
November
December
January
February 96,467.99$
March -$
Grand Total 96,467.99$ 50,530.84$ -$ -$ -$
EXPENSE : Workforce
EXPENSE : Revenue Loss
$-
$10,000.00
$20,000.00
$30,000.00
$40,000.00
$50,000.00
$60,000.00
$70,000.00
$80,000.00
DY1 DY2
$-
$20,000.00
$40,000.00
$60,000.00
$80,000.00
$100,000.00
$120,000.00
DY1 DY2
10/27/2016
All expenses are reflected in GL290 file exported from Lawson General Ledger System
No Cost of Implementation expenses for March ‘16
No Workforce expenses for March ‘16
No Revenue Loss cleared the GL during March ‘16 CONFIDENTIAL

Revenue & Expense Forecast
April 1, 2015 -
March 31, 2016
April 1, 2016 -
March 31, 2017
April 1, 2017 -
March 31, 2018
April 1, 2018 -
March 31, 2019
April 1, 2019 -
March 31, 2020
Month DY1 DY2 DY3 DY4 DY5
April 10,332.57$
May
June
July
August
September
October
November
December
January
February 25,199.84$
March 7,743.70$
Grand Total 32,943.54$ 10,332.57$ -$ -$ -$
April 1, 2015 -
March 31, 2016
April 1, 2016 -
March 31, 2017
April 1, 2017 -
March 31, 2018
April 1, 2018 -
March 31, 2019
April 1, 2019 -
March 31, 2020
Month DY1 DY2 DY3 DY4 DY5
April 223,376.29$
May 13,853.96$
June (1,301.37)$
July (2,500.00)$
August
September
October
November
December
January
February 31,200.04$
March 5,100.39$
Grand Total 36,300.43$ 233,428.88$ -$ -$ -$
EXPENSE : Incentives
EXPENSE : Non-Covered Services
$-
$5,000.00
$10,000.00
$15,000.00
$20,000.00
$25,000.00
$30,000.00
DY1 DY2
$(50,000.00)
$-
$50,000.00
$100,000.00
$150,000.00
$200,000.00
$250,000.00
DY1 DY2
10/27/2016
All expenses are reflected in GL290 file exported from Lawson General Ledger System
No Cost of Implementation expenses for March ‘16
No Workforce expenses for March ‘16
No Revenue Loss cleared the GL during March ‘16 CONFIDENTIAL

Type Payment # Description Month/Year NYP/Q CY Amount Received Anticipated Amount Variance Notes
Grant Grant 1 Grant Payment #1 Pre DSRIP 2015 500,000$ 500,000$
Grant Grant 2 Grant Payment #2 Pre DSRIP 2015 1,299,999$ 1,299,999$
DSRIP DY1-1 Project Plan Payment Jun-15 2016 1,102,491$ 1,102,491$
DSRIP DY1-2 DY1 Q1 & Q2 Jan-16 2016 367,497$ 367,497$
DSRIP DY1-3 DY1 Q3 & Q4 Jul-16 2016 367,497$ 367,497$
EIP DY1 Emblem (Health Insurance Plan) Aug-16 2016 127,950$ 149,270$ 21,320$ EIP PPM rate issue NYS - MCO ; pending adjustment
EIP DY1 Empire (Amerigroup) Aug-16 2016 447,539$ 447,539$
Payment received Sept 2016 - need confirmation on
amount
EIP DY1 Fidelis Oct-16 2016 305,165$ Contracts executed - pending payment
EIP DY1 Health First Oct-16 2016 757,571$ Contracts executed - pending payment
EIP DY1 MetroPlus Oct-16 2016 179,286$ Contracts executed - pending payment
EIP DY1 United Oct-16 2016 196,998$ Contracts executed - pending payment
EIP DY2-1 Emblem (Health Insurance Plan) Oct-16 2016 74,635$
EIP DY2-1 Empire (Amerigroup) Oct-16 2016 223,770$
EIP DY2-1 Fidelis Oct-16 2016 152,583$
EIP DY2-1 Health First Oct-16 2016 378,786$
EIP DY2-1 MetroPlus Oct-16 2016 89,643$
EIP DY2-1 United Oct-16 2016 98,499$
DSRIP DY2-1 DY2 Q1 & Q2 Jan-17 2017 906,854$
EPP DY1 Emblem (Health Insurance Plan) Jan-17 2017 99,513$ Pending DOH release of EPP data - Guess January 2017
EPP DY1 Empire (Amerigroup) Jan-17 2017 298,359.22$ Pending DOH release of EPP data - Guess January 2017
EPP DY1 Fidelis Jan-17 2017 203,443$ Pending DOH release of EPP data - Guess January 2017
EPP DY1 Health First Jan-17 2017 505,047$ Pending DOH release of EPP data - Guess January 2017
EPP DY1 MetroPlus Jan-17 2017 119,524$ Pending DOH release of EPP data - Guess January 2017
EPP DY1 United Jan-17 2017 131,332$ Pending DOH release of EPP data - Guess January 2017
EIP DY2-2 Emblem (Health Insurance Plan) Apr-17 2017 74,635$
EIP DY2-2 Empire (Amerigroup) Apr-17 2017 223,770$
EIP DY2-2 Fidelis Apr-17 2017 152,583$
EIP DY2-2 Health First Apr-17 2017 378,786$
EIP DY2-2 MetroPlus Apr-17 2017 89,643$
EIP DY2-2 United Apr-17 2017 98,499$
DSRIP DY2-2 DY2 Q3 & Q4 Jul-17 2017 1,051,470$
EIP DY3-1 Emblem (Health Insurance Plan) Oct-17 2017 74,635$
EIP DY3-1 Empire (Amerigroup) Oct-17 2017 223,770$
EIP DY3-1 Fidelis Oct-17 2017 152,583$
EIP DY3-1 Health First Oct-17 2017 378,786$
EIP DY3-1 MetroPlus Oct-17 2017 89,643$
EIP DY3-1 United Oct-17 2017 98,499$
Grand Totals 4,212,973$ 12,042,600$ 21,320$
Will we get DY2 EPP in 2017??
Source of Revenue numbers is reconciliation cover page for DSRIP account.

Value Based Payment (V.B.P.)
Baseline & Readiness Network Assessment
September 2016

Purpose
Create a baseline assessment of the New York-Presbyterian/Queens PPS partner network to
include contracting status and a readiness assessment for moving to alternative payment
methodologies.
________________________________________________________________
Financial sustainability is an overall goal of the DSRIP program; therefore, the NYS DOH has
established milestones related to value based payment methodologies inclusive of a
comprehensive baseline assessment. The assessment was completed utilizing a survey
methodology for all network partners and is summarized in the below slide deck. This analysis
is inclusive of a baseline assessment of actual alternative payment models as well as a
readiness assessment for moving toward such models.
To ensure compliance with all local and federal regulations, all survey questions were not
specific to payer or contractual relationships but included general questions relating to
categories associated with value based payment arrangements.
The PPS’ collaborative model will utilize this analysis to focus on education, connectivity, and
quality analytics, which our network partners will be able to use to provide tools and resources
for individual teams to work with MCO’s in order to move towards risk based models.
2016 V.B.P. Survey 2

Governing Process
The VBP baseline assessment was completed by the Project Management Office
with reviews and approvals for publishing by the Finance Committee as well as
the Executive Committee.
Approvals of this assessment will be completed in October 2016.
Presentation Title 3

What is Value Based Payment (V.B.P.)?
National healthcare strategy used by healthcare systems to promote quality and
value of health care services utilizing non fee for service payment methodologies
focused to quality based outcomes. Goals include:
Shift from pure volume-based payment (Fee-for-Service) to those that are
outcome related
Implement pay for performance programs that reward improvements in
quality metrics & aligns risks of all parties
Establish methodologies that align with the complexity of the patient base
as well as the offerings of the system with the strategies of the managed
care organization
Engage multiple facets of the healthcare system to encourage quality
based outcomes by assigning levels of risk
Establish data reporting & warehousing mechanisms for tracking and
ongoing performance reporting
2016 V.B.P. Survey 4

Survey Categories
I. Organization Type
II. Current Value/Equity Payment Arrangements
III. V.B.P. Model Preferences
IV. Current V.B.P. Aligned Medicaid Managed Care Organization (M.C.O.)
Strategies
V. Readiness to convert 90% of Medicaid revenue sources to a V.B.P.
methodology
VI. Training Topic Interest Areas
The following slides summarize the data compiled by category &
organization type.
2016 V.B.P. Survey 5

Organization Types
2016 V.B.P. Survey 6
0 2 4 6 8 10 12 14 16 18 20
Outpatient Behavioral Health (Art 31 & Art 32)
Article 28 Diagnostic & Treatment Centers
Article 16 Clinics (OPWDD)
Private Practice Provider – Primary Care
Private Practice Provider – Specialty Care
Hospital Article 28 Outpatient Clinics
Inpatient Home Care Agency
Licensed Hospice
Long-Term Acute Care Hospital
Nursing Home/SNF
Non-licensed CBO
Article 36 Certified Home Health Agency
4. Type of Organization

Results
All network partners were sent the VBP survey
(35) unique partners provided responses
(40) organization types reported
- Some partners counted their business operations among multiple
classifications
Nursing Homes/Skilled Nursing Facilities represented 45% of the total
responses
2016 V.B.P. Survey 7

Current Value/Equity Payment Arrangements
2016 V.B.P. Survey 8
0 5 10 15 20 25
Yes
No
N/A

Results
34% of the partner reporting population indicated, YES, to current
arrangements
62% of the partner reporting population indicated, NO, to current arrangements
PPS Opportunities:
- Education to increase familiarity with VBP concepts
- Growth opportunity to introduce unique VBP concepts
2016 V.B.P. Survey 9
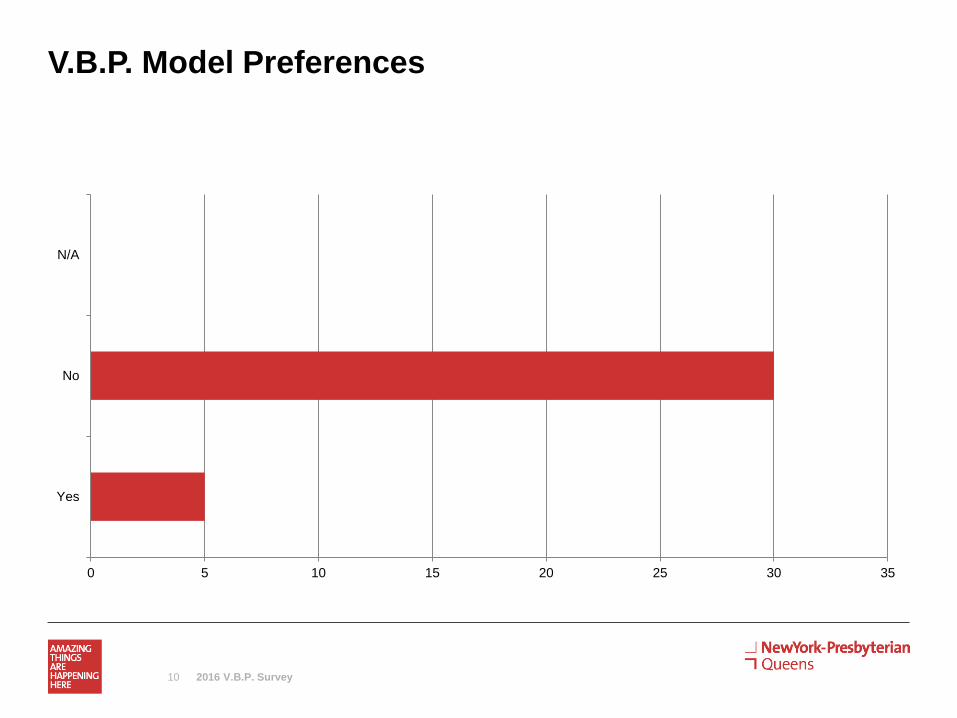
V.B.P. Model Preferences
2016 V.B.P. Survey 10
0 5 10 15 20 25 30 35
Yes
No
N/A

Results
85% indicated NO preference to any specific V.B.P. model
15% indicated YES to a preference of a specific V.B.P. model
PPS Opportunities:
- Education of unique types of VBP arrangements in the local market
- Alignment of education with the findings from the Rapid Cycle Evaluation
Unit
- Engagement with MCO’s for discussions of concepts that align with
population strategies
2016 V.B.P. Survey 11

Current V.B.P. Aligned Medicaid Managed Care
Organization (M.C.O.) Strategies
2016 V.B.P. Survey 12
0 5 10 15 20 25 30
Yes
No
N/A

Results
80% indicated No to having any current V.B.P. Aligned Medicaid Managed
Care Organization (M.C.O.) Strategies
20% indicated YES to having any current V.B.P. Aligned Medicaid Managed
Care Organization (M.C.O.) Strategies
PPS Opportunities:
- Incorporation of multiple provider / payer strategies by network partners
- Lessons learned among network partners for VBP arrangements
2016 V.B.P. Survey 13

Readiness to convert 90% of Medicaid revenue sources
to a V.B.P. methodology
2016 V.B.P. Survey 14
0 2 4 6 8 10 12 14
Confident our organization is ready for the change
Slightly confident our organization is ready for the change
No confidence that our organization is ready for the change
Unsure of our readiness

Results
37% Unsure
34% Slightly confident
25% Confident
PPS Opportunities:
- Provide basic education models for partner network
- Partner with Medicaid MCO’s to roll-out any existing educational programs
for VBP
- Utilize Rapid Cycle Evaluation Unit quality analysis to provide partners
baseline quality assessments
2016 V.B.P. Survey 15

Training Topic Interest Areas
2016 V.B.P. Survey 16
0 5 10 15 20 25 30 35
Overall education of VBP options
Alignment of VBP with DSRIP programs
Quality based outcome analytics
MCO sponsored learning collaborative aligned with their benefit plans
National trends of value based payment methodologies
Maximizing IT tools for VBP scenarios
Other

Results
(3) Highest Requested Topics:
- Overall Education (85%)
- Quality Based Outcome Analytics (85%)
- I.T. Tool Maximization (80%)
PPS Opportunities:
- High interest in education of VBP models
- Utilization of Rapid Cycle Evaluation Unit data analytics for quality reporting
2016 V.B.P. Survey 17

Existing V.B.P. Arrangements Within NewYork-
Presbyterian/Queens PPS Network
2016 V.B.P. Survey 18
99.5%
3.0%
65.0%
0.0%
40.0%
0.49%
1%
0%
0%
60%
0%
0%
0%
0.90%
0%
0%
0%
0%
0%
0%
0% 10% 20% 30% 40% 50% 60% 70% 80% 90% 100%
1. All care for total population
2. All care for total population
3. Acute and Chronic Bundles
4. Acute and Chronic Bundles
5. All care for total population
Level 3 VBP
Level 2 VBP
Level 1 VBP
Level 0 VBP

Next Steps
Receive approvals from Finance & Executive Committees
Establish an educational program for value based payment opportunities
Await VBP NYS DOH updates to all deliverables
Align VBP data needs with the Rapid Cycle Evaluation Unit (in development)
Establish communication channels specific to VBP utilizing website,
Healthstreams, or Performance Logic
Presentation Title 19

Summary
Thank you to all our network partners that provided us with responses
- Any questions regarding what was discussed or for copies of anything
presented, please feel free to contact:
2016 V.B.P. Survey 20
Sadia Choudhury
Director
DSRIP PMO Office
E-Mail: [email protected]
Daniel M. Notarnicola
Financial Analyst
DSRIP PMO Office
E-Mail: [email protected]


![Microsoft PowerPoint - NYP talk.ppt [Read-Only]](https://img.pdfslide.us/doc/110x75/5589527ad8b42aea0b8b45d6/microsoft-powerpoint-nyp-talkppt-read-only.jpg)