Embed Size (px)
Citation preview
1 | City Bar Benchmarking Report | 2015
2015 DIVERSITY BENCHMARKING REPORT
EXECUTIVE SUMMARY
Methodology & Updates
After a decade of collecting diversity and inclusion metrics from signatory law firms and reporting stalled progress for minority and women attorneys, the New York City Bar Association (“City Bar”) Committee to Enhance Diversity in the Profession created a Task Force to review the benchmarking survey and recommend updates to strengthen the impact of the resulting data. Consequently, the 2015 Diversity Benchmarking Survey included several significant changes which are reflected in this year’s report.
First, participation in the survey was mandatory in order to be listed as a signatory to the City Bar Statement of Diversity Principles. As a result, signatory law firm participation in the survey nearly doubled, thus providing robust data not available in 2014 and a more accurate reflection of our signatory firms. We applaud the 75 law firms that have committed the time and energy to participate.
Additionally, for the first time since we began administering the survey in 2004, we requested a breakdown of individual racial/ethnic groups for men and women, rather than data on “minority attorneys” as an aggregate. This important change allows us to report specific details in each category where representative data was collected. We believe this specificity will allow the firms to explore challenges in a more nuanced way and create solutions tailored to a diverse population of lawyers.
To contextualize the data and empower law firms to look beyond the numbers to measure progress, the survey included three new sections: questions on workflow and bonus structures within the firm, engagement in pipeline efforts, and a “better practices” section to highlight initiatives that yield results within each firm. We have highlighted several of these initiatives throughout the report, in hopes that the information will inspire and connect firms facing similar challenges.
Reflecting on a decade of collecting and reporting data, one thing is patently clear: transparency and collaboration are necessary to effect meaningful change. The updates to the survey have equipped the City Bar with more detailed content to illustrate successes and challenges, so we are better positioned to advise our signatory firms and arm them with data to better guide and inform their efforts. It is our intent that this report—along with the individualized, confidential reports sent to each firm participant—will offer new, powerful tools to streamline each firm’s efforts while also allowing for greater accountability and collaboration. Since “you can’t fix what you can’t measure,” we consider this data collection to be a critical element in moving the needle toward quantitative and qualitative improvements within our firms and within our profession.

2 | City Bar Benchmarking Report | 2015
Trends & Challenges
In 2014, the City Bar reported increased support for diversity initiatives in firms as well as successes for women in leadership roles in firms; but we also found that overall representation of minority attorneys declined, and that attrition rates for both women and minorities remain significantly higher than rates for white men.
The 2015 data remains relatively consistent with these findings:
• Voluntary attrition continues to disproportionately impact minority and women attorneys, with 18.4% of women and 20.8% of minorities leaving signatory firms in 2015— a slight decrease from 2014, but still well above the 12.9% rate for white men.
• Erosion in the associate pipeline stalls progress for women and minority attorneys, and may have a long-term effect on the future of firm leadership. Gender diversity in the associate pipeline has leveled off at 45% for junior and mid-level women associates and 42% for senior women associates. Minority representation has leveled off or declined for junior, mid- and senior level associates from 2014 to 2015; in particular, fourth and fifth-year associates declined to around 25%, and seventh and eighth-year associates declined to around 20%. Asian/Pacific Islander women associates are the only group showing consistent increases since 2004.
• Women attorneys saw gains in leadership bodies, but racial/ethnic diversity among women partners, erosion in the associate pipeline, and voluntary attrition remain challenges. In 2015, women showed notable gains in representation on firm management committees and among practice group heads, and women partners peaked at 19%. However, white women make up 85% of all women partners and minority women make up less than 3% of all partners in signatory firms.
• Although representation of minority attorneys overall remains relatively flat, representation at the Special Counsel level increased, as well as minority representation in leadership bodies. The percentage of minority management committee members and minority practice group heads increased, and the percentage of law firms with three or more minority attorneys on the management committee doubled from 7% in 2014 to 14% in 2015.
• LGBT attorney representation has more than doubled since the City Bar began collecting self-reported data in 2004 and representation of LGBT partners has increased from 1.4% to 2.4%.
• In 2015, white men represented 77% of all equity partners at signatory firms. Minority and women partners continue to be concentrated at the income partner level, rather than among the ranks of equity partners. Furthermore, the turnover rate for women and minority income partners in 2015 was 8.6%, more than double the turnover rate of women and minority equity partners at 3.2%.
• Flexible work arrangements are used primarily by Special Counsel attorneys, and firms saw increased participation by men in these programs in 2015. Of all attorneys who report flexible work arrangements, 13% are racial/ethnic minorities.
• Signatory firms are enhancing diversity efforts within the firm and implementing initiatives to focus on firm leadership engagement, as well as undertaking comprehensive efforts to retain and promote minority and women attorneys.
59% of firms have no
minorities on management
committee
More than 1 in 3 firms have no minority
practice group heads
1 in 4 firms have no women on management
committee
1 in 8 firms have no women
practice group heads

3 | City Bar Benchmarking Report | 2015
Women attorneys make up 35% of all attorneys reported in our signatory firms, despite representing almost half of graduating law school classes for nearly two decades and 47% of summer associates in 2015. The 2015 benchmarking data reflects increases in representation at the leadership level, which indicates that long-term investment in women attorneys seems to be paying off. However, the data also raises concerns about erosion of the associate pipeline, and the lack of minority women within leadership roles.
Women Attorneys Gain in Leadership Roles
The City Bar benchmarking data has reflected incremental gains for women in leadership at signatory law firms since 2007. In 2015, women partners at signatory firms reached 19.7%, the highest level since the City Bar began tracking diversity data in 2004, but only a slight increase from 19.4% in 2014.
CHART A: REPRESENTATION OF WOMEN ATTORNEYS IN LEADERSHIP ROLES
LEVEL March 2004
Jan 2006
Jan 2007
March 2009
March 2010
Dec 2011
Dec 2013
Dec 2014
Dec 2015
Partner 15.6
16.6 16.6 17.8 17.5 18.3 18.8
19.4 19.7
Management Comm.
NA
NA 13.5 17.8 17.1 17.7 16.9
18.3 20.3
Practice Group Heads
NA NA 15.3 14.0 15.4 17.3 16.5
16.9 18.7
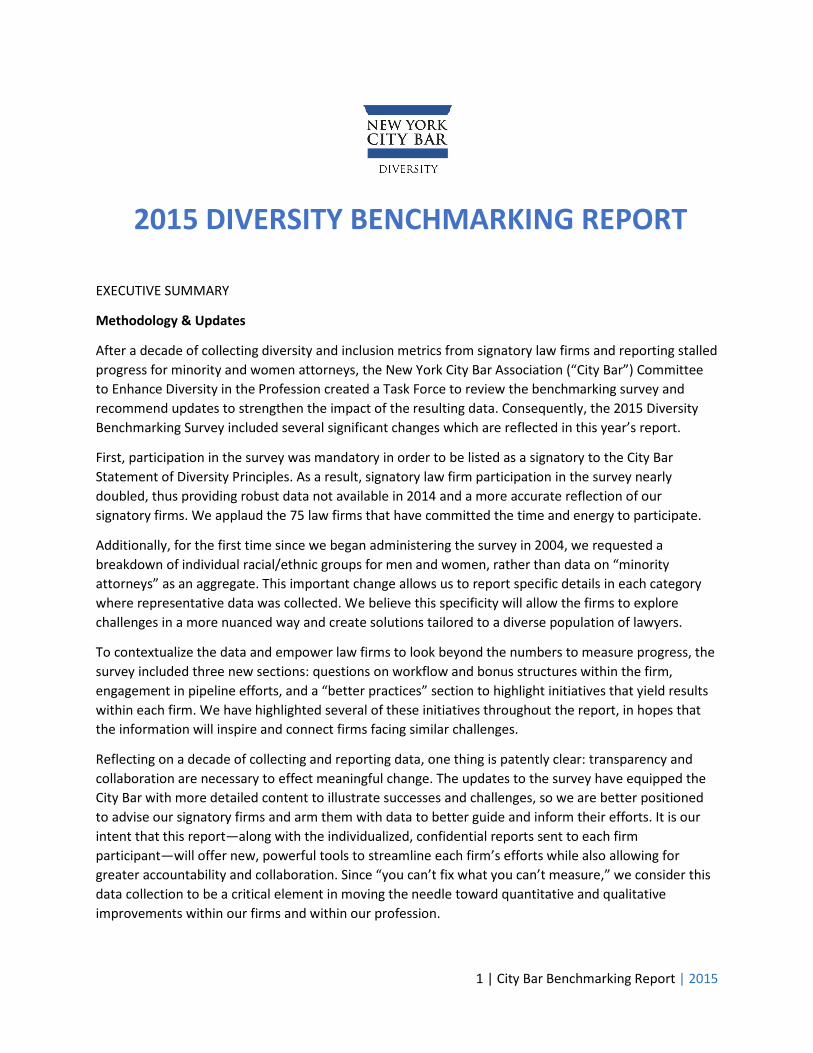
The 2015 data also reflected continued gains for women among top leadership bodies. The percentage of women serving on firms’ management committees rose to 20.3% in 2015, an increase from 13.5% in 2007 when diversity data on senior leaders at signatory firms was first captured, and a 2.0% increase from 2014. The percentage of law firms with three or more women serving on management committees increased from 26% in 2013 to 37% in 2015. The percentage of women practice group heads increased from 16.9% in 2014 to 18.7% in 2015, and the percentage of firms with three or more women practice group heads increased slightly from 60% to 62%. (See Chart B, p. 4)
These gains for women attorneys indicate the results of long-term efforts to increase representation and advancement of women, including comprehensive sponsorship and monitoring initiatives, which go beyond traditional mentoring programs to cultivate development and progression opportunities for high-performing women attorneys. (See Better Practices: Women’s Initiatives, p. 6)
WOMEN ATTORNEYS
4 | City Bar Benchmarking Report | 2015
15.6% 16.6% 16.6% 17.8% 17.5%
18.3% 18.8% 19.4% 19.7%
20.3%
29.0% 32.6% 32.8% 31.9% 33.0% 33.2%
29.2% 29.7%
12.8%
20.3% 16.0% 17.3%
17.1% 21.6%
23.9% 23.7% 21.6%
CHART C: WOMEN ATTORNEYS
Partners New Partner Promotes Lateral Partner Hires
25% 15% 22% 16% 15% 12%
50% 62% 42%
33% 25% 26%
26% 24% 37%
51% 60% 62%
0% 10% 20% 30% 40% 50% 60% 70% 80% 90%
100%
Wom MC
2013
Wom MC
2014
Wom MC
2015
Wom PGH 2013
Wom PGH 2014
Wom PGH 2015
3 or more
1 or 2
Zero
CHART B: REPRESENTATION OF WOMEN ATTORNEYS ON FIRM MANAGEMENT COMMITTEES (“WOM MC”)
AND PRACTICE GROUP HEADS (“WOM PGH”)
Despite the increased representation at the partner level and on leadership bodies, challenges remain. One in four signatory firms has no women on its management committee and one in eight has no women practice group leaders. While the trend line for women partners and women in leadership roles continues to increase, the 2015 benchmarking data reflects that the percentage of female new partner promotions was essentially unchanged at 29.7% and has not reached the higher rates of prior years (2007 through 2013.) The representation of women lateral partner hires was slightly lower at 21.6% this year. Current flattening of the pool of female talent may affect the long-term representation of women leaders.

5 | City Bar Benchmarking Report | 2015
Racial/Ethnic Diversity Among Women Attorneys Remains a Challenge The 2015 benchmarking data reveals a lack of racial/ethnic diversity amongst women in leadership. Of all women partners reported, 85.2% are Caucasian, 7.0% are Asian/Pacific Islanders, 3.6% are Black/African American, and 2.5% are Hispanic. (See accompanying Chart D) Among all partners, male and female, Caucasian women make up 16.8%, Asian/Pacific Islanders make up 1.4%, and Black and Hispanic partners represent 0.7% and 0.5%, respectively. (See Chart E) In leadership bodies, which include practice group heads, management committee members, and New York office or firm-wide managing partners, these numbers remain staggeringly non-diverse. Of this group, 88.9% are Caucasian women, with Asian/Pacific Islander women representing 5.4%, and with Black/African American women and Hispanic women making up 2.6% and 2.3%, respectively. Women attorneys at the associate level are more racially and ethnically diverse, although the numbers still reflect a greater representation of Asian/Pacific Islander attorneys over Black/African American or Hispanic attorneys.
Caucasian 85.2%
Black/AA 3.6%
Hispanic 2.5%
APA 7.1%
Multi-Racial 1.4%
CHART D: WOMEN PARTNERS BY RACE/ ETHNICITY
Men 80.3%
Caucasian 16.8%
Black/AA 0.7%
Hispanic 0.5%
APA 1.4%
Mutli-Racial 0.3%
CHART E: ALL PARTNERS BY GENDER, RACE/ ETHNICITY
Women 19.7%
0% 10% 20% 30% 40% 50% 60% 70% 80% 90% 100%
Equity Partners
Income Partners
NewPromotions to Partners
Senior Associates
Associates
CHART F: WOMEN ATTORNEYS - REPRESENTATION BY LEVEL AND RACE/ ETHNICITY
Caucasian Black/Afr Am Hispanic Am Indian/Alaskan Asian and Pac Isl

6 | City Bar Benchmarking Report | 2015
49.6% 47.7%
45.2% 43.2%
39.5%
39.3% 39.5%
33.1%
46.3%
47.3% 47.3% 45.1% 45.1%
43.4%
43.9%
44.0%
47.2%
46.4% 47.1% 45.0%
43.5%
44.5%
44.0%
40.3%
45.2% 45.7%
43.5%
45.4%
45.6%
41.8% 42.7% 42.1%
0%
10%
20%
30%
40%
50%
60%
1st years 2nd years 3rd years 4th years 5th years 6th years 7th years 8th years
CHART G: GENDER DIVERSITY ACROSS THE ASSOCIATE PIPELINE
in 2004
in 2013
in 2014
in 2015
Erosion in the Women Associate Pipeline
There is evidence that the increased gender diversity in the associate pipeline has begun to level off. While the first-year class was 50% female in 2004, representation has declined to just over 45% in 2015. The gender diversity of the mid-level associates has leveled off at 45% and senior-level associates at 42%.
To strengthen the pipeline to partnership, several firms have employed long-term initiatives to invest in the professional development of women in the firm and advance them to top leadership and professional roles within the firm and in the wider legal community.
For examples, please visit:
Cadwalader Sponsorship Program
Norton Rose Fulbright Career Strategies Program
Paul Hastings Women in the Boardroom
Proskauer Women’s Sponsorship Program
Skadden Women’s Leadership Forum
Winston & Strawn Women’s Leadership Initiative
BETTER PRACTICES: WOMEN’S INITIATIVES RECOMMENDATIONS Many law firms have developed programs to enhance career opportunities for women attorneys, including: • targeted business development and leadership
training on communication styles, emotional quotient (EQ), leadership presence, and strategic career planning;
• sponsorship programs, which match women associates with partners;
• initiatives to strengthen relationships with clients; • efforts to address intersectionality in women’s
initiatives to ensure that programs support women of color; and
• efforts to enhance gender diversity on corporate boards.
For specific examples, please see Better Practices: Women’s Initiatives.
7 | City Bar Benchmarking Report | 2015
4.7% 5.0% 5.4% 6.6% 6.3% 6.6% 8.4% 8.2% 8.4%
5.5% 8.2% 8.9% 9.5% 9.1% 10.2%
12.0% 10.9% 12.9%
21.1% 21.3% 22.8% 25.0% 23.5% 24.0%
26.9% 26.2% 25.9%
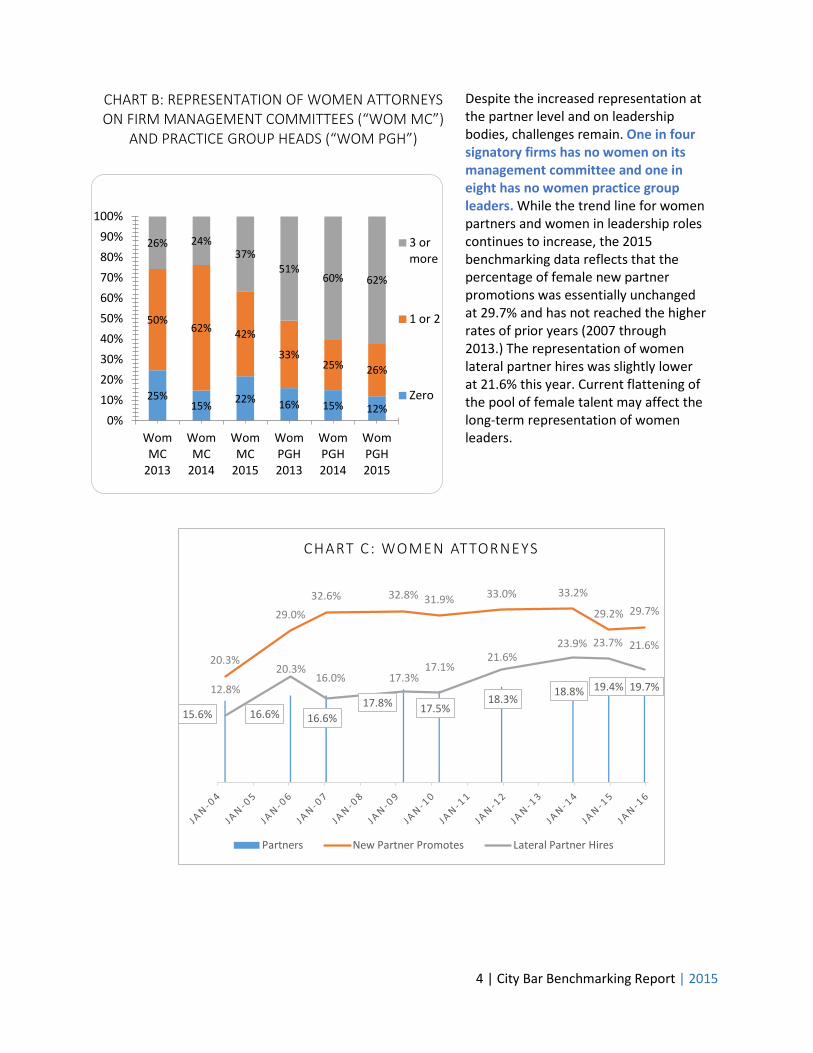
CHART H: MINORITY ATTORNEYS
Partners
Special Counsel
Associates
Minority Attorney Representation Stalled, But Gains in Leadership Levels
While signatory firms are more diverse at every level than they were when the City Bar first began tracking diversity benchmarking data, the 2015 data indicates that overall representation of minority attorneys has stalled in recent years. Overall representation of minority attorneys was largely unchanged in 2015 compared to 2014: minority associates dropped slightly to 25.9% in 2015 compared to 26.2% in 2014, which is nonetheless comparable to the National Association for Law Placement (NALP) data, which lists minorities at 26% representation within all NALP New York City firms. Minority special counsel attorneys increased to 12.9% in 2015 compared to 10.9% in 2014 and minority partners increased slightly to 8.4% in 2015, compared to 8.2% in 2014.
Minority attorney representation in firm leadership showed modest increases, as the percentage of management committee members increased from 6.4% in 2014 to 7.1% in 2015 and minority practice group heads increased from 6.1% in 2014 to 7.0% in 2015. Within this subset, Asian/Pacific Islander attorneys make up 3%, Hispanic attorneys make up 2%, and Black/African American Attorneys make up 1%. (See Chart L, p. 8)
CHART J: REPRESENTATION OF MINORITY ATTORNEYS IN LEADERSHIP ROLES
Caucasian,
81.2%
Black/AA,
3.1%
Hisp., 3.7%
Multi-Racial, 2.0%
Asian & Pac.
Isl. , 9.9%
CHART I: REPRESENTATION BY
RACE/ ETHNICITY
LEVEL Jan 2007 March 2009
March 2010
Dec 2011 Dec 2013 Dec 2014 Dec 2015
Partner 5.4 6.6 6.3 6.6 8.4
8.2 8.4
Management Comm.
4.7 6.3 6.9 5.7 5.2
6.4 7.1
Practice Group Heads 5.1 4.5 5.7 5.9 5.8 6.1 7.0
MINORITY ATTORNEYS

8 | City Bar Benchmarking Report | 2015
CHART K: REPRESENTATION OF MINORITY ATTORNEYS ON FIRM MANAGEMENT COMMITTEES (“MIN MC”) AND PRACTICE GROUP HEADS (“MIN PGH”)
The percentage of firms with three or more minority attorneys on the management committee doubled from 7% in 2014 to 14% in 2015, and the percentage of firms with three or more minority practice group heads increased from 27% in 2014 to 34% in 2015. However, the majority of signatory firms have no minorities on their management committees and more than one-third have no racial/ethnic minorities as practice group heads.
CHART L: LEADERSHIP ROLES BY GENDER, RACE/ETHNICITY
69% 71% 59% 34% 33% 37%
26% 22% 27%
41% 40% 29%
5% 7% 14%
25% 27% 34%
0%
20%
40%
60%
80%
100%
Min MC 2013
Min MC 2014
Min MC 2015
Min PGH 2013
Min PGH 2014
Min PGH 2015
3 or more
1 or 2
Zero
9 | City Bar Benchmarking Report | 2015
0.8% 2.0% 1.9% 2.3%
1.5% 2.4% 1.9%
2.5%
1.8% 2.5% 2.8% 2.6% 2.9% 2.8% 2.3% 2.7%
4.3%
6.1% 5.1% 5.4% 5.7% 5.9% 6.1%
5.3%
0.0%
2.0%
4.0%
6.0%
8.0%
10.0%
12.0%
20
08
20
09
20
10
20
11
20
12
20
13
20
14
20
15
CHART N: MEN MINORITY ASSOCIATE ATTORNEYS BY
CLASS Black Afr Am Hispanic Asian
26.9%
23.9% 23.8% 23.8% 20.8%
19.7% 18.8% 19.1%
33.7% 32.0%
29.5% 30.0%
27.4% 25.4% 25.4%
22.5%
33.0% 30.6%
27.8% 25.1%
27.2%
22.2%
21.8% 24.0%
30.8%
27.9% 28.0% 24.1% 25.3%
24.0%
22.0% 19.8%
0%
5%
10%
15%
20%
25%
30%
35%
40%
1st years 2nd years 3rd years 4th years 5th years 6th years 7th years 8th years
CHART M: RACIAL/ETHNIC DIVERSITY ACROSS THE ASSOCIATE PIPELINE
in 2004
in 2013
in 2014
in 2015
1.9% 2.4% 1.9% 1.5% 1.3% 2.4% 2.2%
3.4% 1.9%
1.1% 1.9%
2.5% 1.6%
2.4% 2.4% 3.6%
5.8% 5.8%
7.3% 7.7% 8.5% 8.1%
9.6% 9.9%
0.0%
2.0%
4.0%
6.0%
8.0%
10.0%
12.0%
20
08
20
09
20
10
20
11
20
12
20
13
20
14
20
15
CHART O: WOMEN MINORITY ASSOCIATE ATTORNEYS BY
CLASS
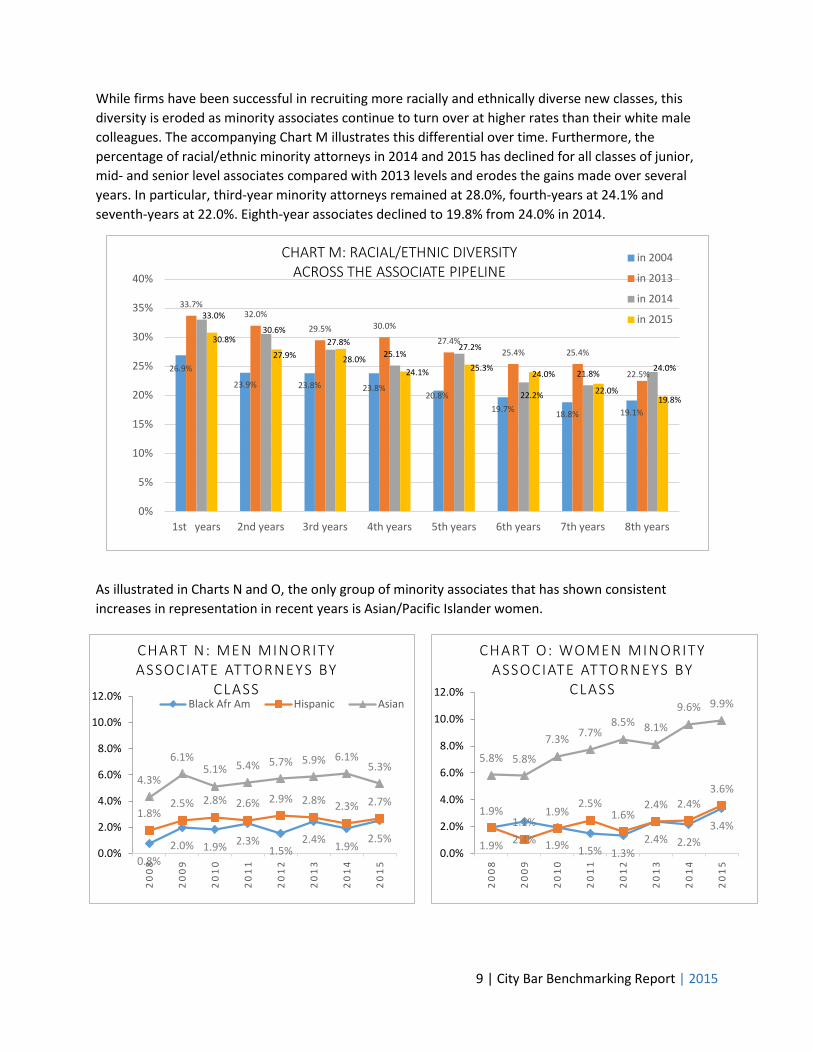
While firms have been successful in recruiting more racially and ethnically diverse new classes, this diversity is eroded as minority associates continue to turn over at higher rates than their white male colleagues. The accompanying Chart M illustrates this differential over time. Furthermore, the percentage of racial/ethnic minority attorneys in 2014 and 2015 has declined for all classes of junior, mid- and senior level associates compared with 2013 levels and erodes the gains made over several years. In particular, third-year minority attorneys remained at 28.0%, fourth-years at 24.1% and seventh-years at 22.0%. Eighth-year associates declined to 19.8% from 24.0% in 2014.
As illustrated in Charts N and O, the only group of minority associates that has shown consistent increases in representation in recent years is Asian/Pacific Islander women.
10 | City Bar Benchmarking Report | 2015
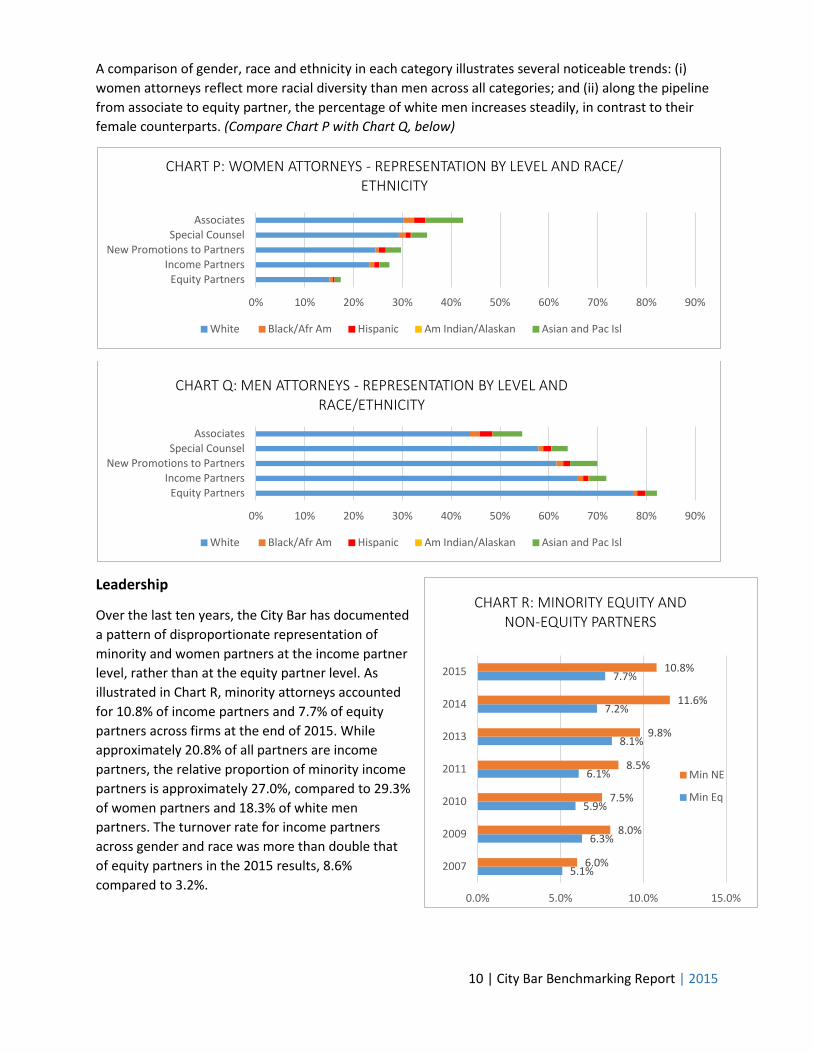
A comparison of gender, race and ethnicity in each category illustrates several noticeable trends: (i) women attorneys reflect more racial diversity than men across all categories; and (ii) along the pipeline from associate to equity partner, the percentage of white men increases steadily, in contrast to their female counterparts. (Compare Chart P with Chart Q, below)
Leadership
Over the last ten years, the City Bar has documented a pattern of disproportionate representation of minority and women partners at the income partner level, rather than at the equity partner level. As illustrated in Chart R, minority attorneys accounted for 10.8% of income partners and 7.7% of equity partners across firms at the end of 2015. While approximately 20.8% of all partners are income partners, the relative proportion of minority income partners is approximately 27.0%, compared to 29.3% of women partners and 18.3% of white men partners. The turnover rate for income partners across gender and race was more than double that of equity partners in the 2015 results, 8.6% compared to 3.2%.
0% 10% 20% 30% 40% 50% 60% 70% 80% 90%
Equity Partners Income Partners
New Promotions to Partners Special Counsel
Associates
CHART P: WOMEN ATTORNEYS - REPRESENTATION BY LEVEL AND RACE/ ETHNICITY
White Black/Afr Am Hispanic Am Indian/Alaskan Asian and Pac Isl
0% 10% 20% 30% 40% 50% 60% 70% 80% 90%
Equity Partners Income Partners
New Promotions to Partners Special Counsel
Associates
CHART Q: MEN ATTORNEYS - REPRESENTATION BY LEVEL AND RACE/ETHNICITY
White Black/Afr Am Hispanic Am Indian/Alaskan Asian and Pac Isl
5.1%
6.3%
5.9%
6.1%
8.1%
7.2%
7.7%
6.0%
8.0%
7.5%
8.5%
9.8%
11.6%
10.8%
0.0% 5.0% 10.0% 15.0%
2007
2009
2010
2011
2013
2014
2015
CHART R: MINORITY EQUITY AND NON-EQUITY PARTNERS
Min NE
Min Eq

11 | City Bar Benchmarking Report | 2015
RECOMMENDATIONS
In recent years, law firms have directed resources toward innovative efforts to retain and promote minority attorneys, including:
• engaging practice group leaders in monitoring work allocation protocols and quality of assignments;
• providing opportunity to expand practice area expertise; • intentional pairing of partners and associates, where a partner is responsible for the
associate’s development; • training partners to understand and interrupt implicit bias and develop objective evaluation
and feedback methods; • implementing bias neutralization trainings for minority attorneys; • assessing client team composition and product on the firm’s most significant matters; • developing multi-year action plans for diverse associates; • providing foundational skill-development opportunities; • providing associates with executive coaches; and • monitoring exit interviews of departing associates.
For specific examples, please see Better Practices: Inclusion & Retention Efforts for Minority Attorneys.
Additionally, our qualitative research revealed a wide array of efforts to enhance the profiles of diverse associates through external leadership opportunities, which supplement the firm’s existing professional development programs. These include fellowship programs, executive leadership programs, board service opportunities, speaking/publishing opportunities, and bar association activity.
To cultivate an environment that embraces and promotes diversity, several firms have utilized a holistic approach to recruit, retain, and promote minority associates to advance within the firm and in their legal careers. For examples, please visit:
Cleary Gottlieb Strategies for Success
Debevoise Accelerated Mentoring Program (AMP)
Latham Diversity Leadership Academy
Katten Sponsorship Program
Upstander@Weil Ally Program
BETTER PRACTICES: INCLUSION & RETENTION EFFORTS FOR MINORITY ATTORNEYS
12 | City Bar Benchmarking Report | 2015
Increased Representation of LGBT Attorneys
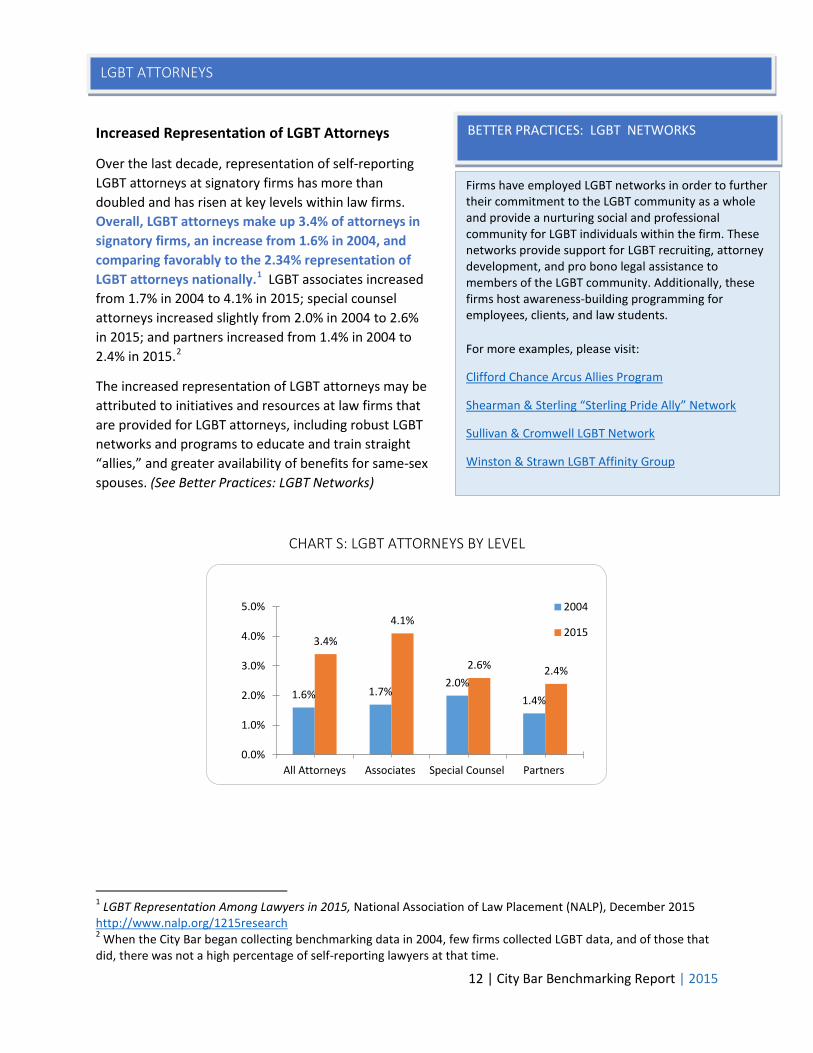
Over the last decade, representation of self-reporting LGBT attorneys at signatory firms has more than doubled and has risen at key levels within law firms. Overall, LGBT attorneys make up 3.4% of attorneys in signatory firms, an increase from 1.6% in 2004, and comparing favorably to the 2.34% representation of LGBT attorneys nationally.1 LGBT associates increased from 1.7% in 2004 to 4.1% in 2015; special counsel attorneys increased slightly from 2.0% in 2004 to 2.6% in 2015; and partners increased from 1.4% in 2004 to 2.4% in 2015.2
The increased representation of LGBT attorneys may be attributed to initiatives and resources at law firms that are provided for LGBT attorneys, including robust LGBT networks and programs to educate and train straight “allies,” and greater availability of benefits for same-sex spouses. (See Better Practices: LGBT Networks)
CHART S: LGBT ATTORNEYS BY LEVEL
1 LGBT Representation Among Lawyers in 2015, National Association of Law Placement (NALP), December 2015 http://www.nalp.org/1215research 2 When the City Bar began collecting benchmarking data in 2004, few firms collected LGBT data, and of those that did, there was not a high percentage of self-reporting lawyers at that time.
1.6% 1.7% 2.0%
1.4%
3.4%
4.1%
2.6% 2.4%
0.0%
1.0%
2.0%
3.0%
4.0%
5.0%
All Attorneys Associates Special Counsel Partners
2004
2015
Firms have employed LGBT networks in order to further their commitment to the LGBT community as a whole and provide a nurturing social and professional community for LGBT individuals within the firm. These networks provide support for LGBT recruiting, attorney development, and pro bono legal assistance to members of the LGBT community. Additionally, these firms host awareness-building programming for employees, clients, and law students. For more examples, please visit:
Clifford Chance Arcus Allies Program
Shearman & Sterling “Sterling Pride Ally” Network
Sullivan & Cromwell LGBT Network
Winston & Strawn LGBT Affinity Group
BETTER PRACTICES: LGBT NETWORKS
LGBT ATTORNEYS
13 | City Bar Benchmarking Report | 2015
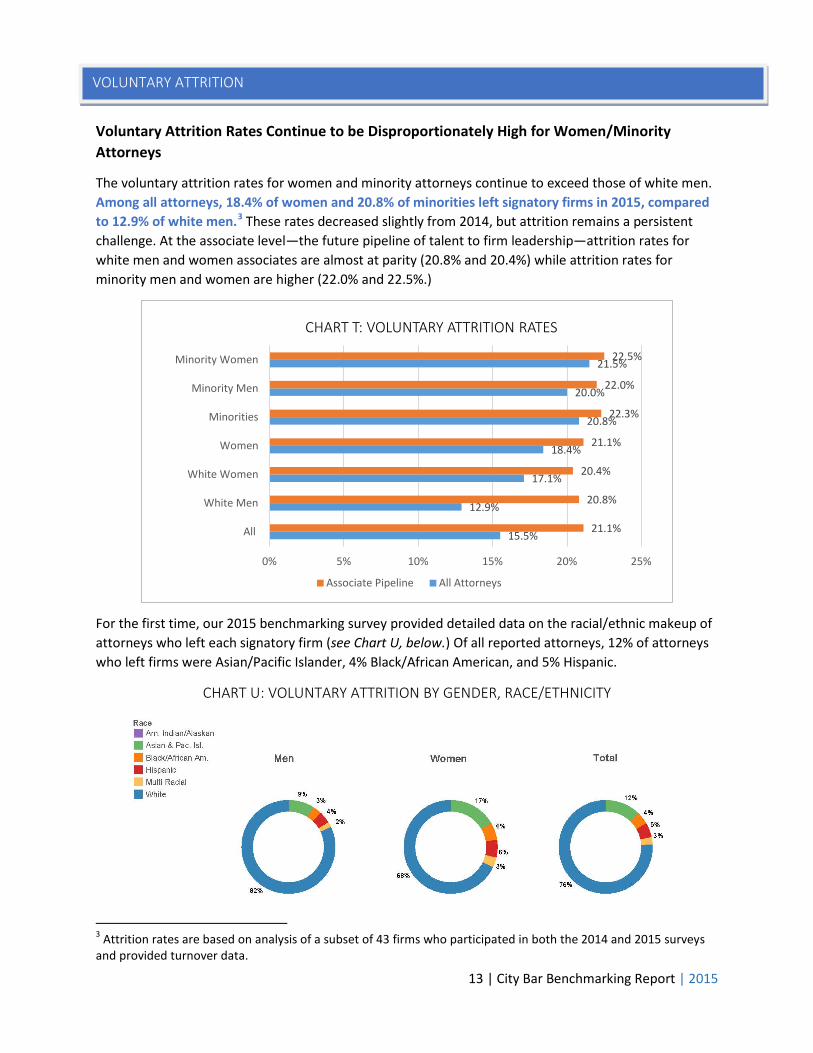
Voluntary Attrition Rates Continue to be Disproportionately High for Women/Minority Attorneys
The voluntary attrition rates for women and minority attorneys continue to exceed those of white men. Among all attorneys, 18.4% of women and 20.8% of minorities left signatory firms in 2015, compared to 12.9% of white men.3
These rates decreased slightly from 2014, but attrition remains a persistent challenge. At the associate level—the future pipeline of talent to firm leadership—attrition rates for white men and women associates are almost at parity (20.8% and 20.4%) while attrition rates for minority men and women are higher (22.0% and 22.5%.)
For the first time, our 2015 benchmarking survey provided detailed data on the racial/ethnic makeup of attorneys who left each signatory firm (see Chart U, below.) Of all reported attorneys, 12% of attorneys who left firms were Asian/Pacific Islander, 4% Black/African American, and 5% Hispanic.
CHART U: VOLUNTARY ATTRITION BY GENDER, RACE/ETHNICITY
3 Attrition rates are based on analysis of a subset of 43 firms who participated in both the 2014 and 2015 surveys and provided turnover data.
15.5%
12.9%
17.1%
18.4%
20.8%
20.0%
21.5%
21.1%
20.8%
20.4%
21.1%
22.3%
22.0%
22.5%
0% 5% 10% 15% 20% 25%
All
White Men
White Women
Women
Minorities
Minority Men
Minority Women
CHART T: VOLUNTARY ATTRITION RATES
Associate Pipeline All Attorneys
VOLUNTARY ATTRITION
14 | City Bar Benchmarking Report | 2015
Differences in overall voluntary turnover by race and gender continue to reflect the historical effect of the concentration of women and minorities at lower levels compared to Caucasian men, since attrition rates are highest at the associate level. In comparison, attrition among equity partners is 3.1% for Caucasian men, 3.8% for women and 4.4% for minorities. Only 44% of current associates are Caucasian men compared to 75% of current partners; 44% of associates are women compared to 20% of partners and 26% of associates are racial/ethnic minorities compared to 8% of partners.
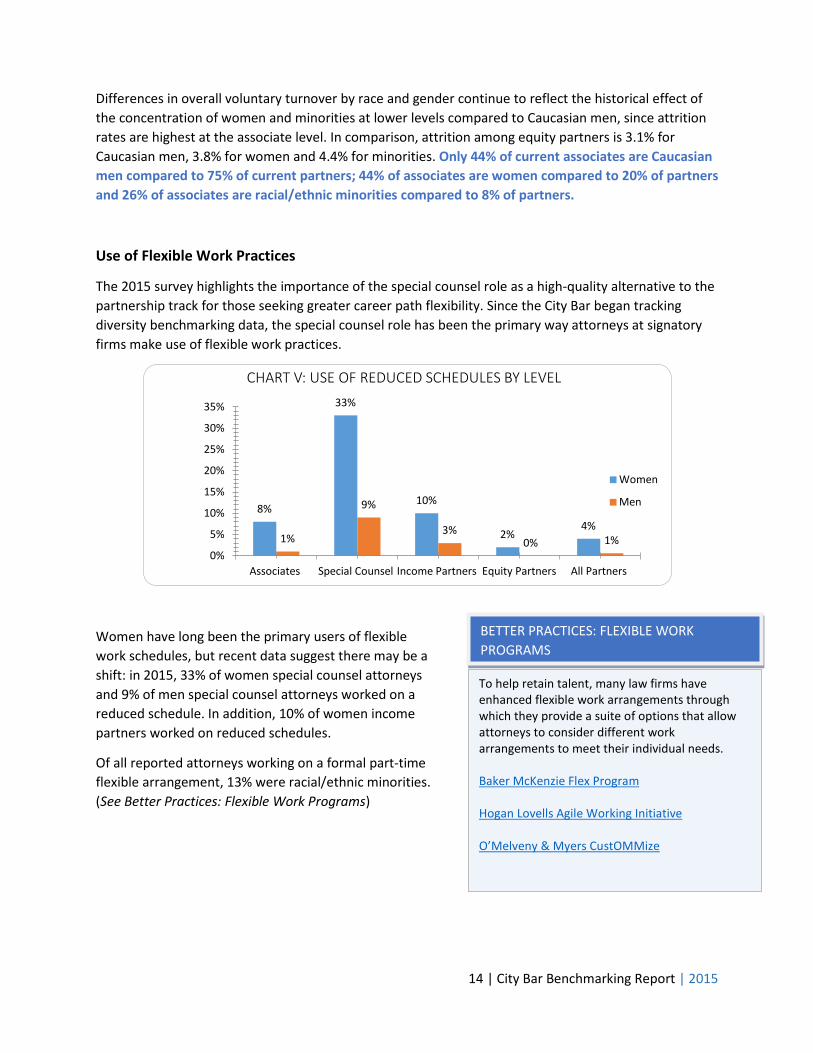
Use of Flexible Work Practices
The 2015 survey highlights the importance of the special counsel role as a high-quality alternative to the partnership track for those seeking greater career path flexibility. Since the City Bar began tracking diversity benchmarking data, the special counsel role has been the primary way attorneys at signatory firms make use of flexible work practices.
Women have long been the primary users of flexible work schedules, but recent data suggest there may be a shift: in 2015, 33% of women special counsel attorneys and 9% of men special counsel attorneys worked on a reduced schedule. In addition, 10% of women income partners worked on reduced schedules.
Of all reported attorneys working on a formal part-time flexible arrangement, 13% were racial/ethnic minorities. (See Better Practices: Flexible Work Programs)
8%
33%
10%
2% 4%
1%
9%
3% 0% 1%
0%
5%
10%
15%
20%
25%
30%
35%
Associates Special Counsel Income Partners Equity Partners All Partners
CHART V: USE OF REDUCED SCHEDULES BY LEVEL
Women
Men
BETTER PRACTICES: FLEXIBLE WORK PROGRAMS
To help retain talent, many law firms have enhanced flexible work arrangements through which they provide a suite of options that allow attorneys to consider different work arrangements to meet their individual needs. Baker McKenzie Flex Program Hogan Lovells Agile Working Initiative O’Melveny & Myers CustOMMize
15 | City Bar Benchmarking Report | 2015
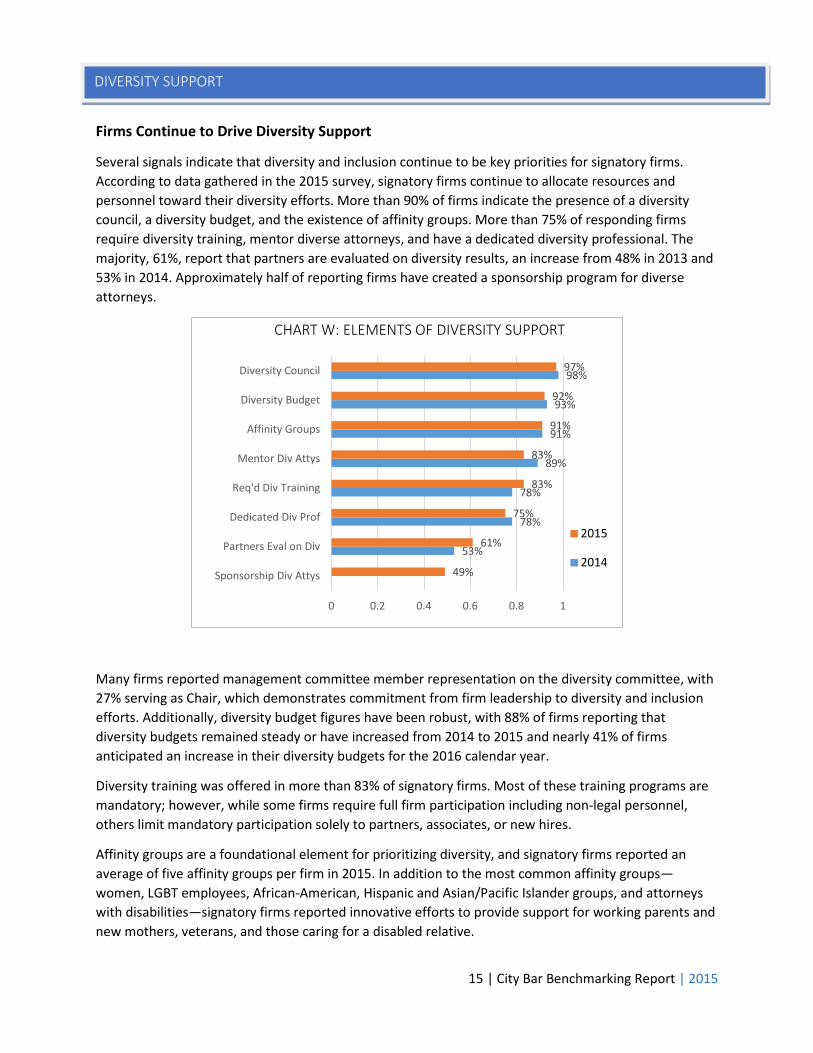
Firms Continue to Drive Diversity Support
Several signals indicate that diversity and inclusion continue to be key priorities for signatory firms. According to data gathered in the 2015 survey, signatory firms continue to allocate resources and personnel toward their diversity efforts. More than 90% of firms indicate the presence of a diversity council, a diversity budget, and the existence of affinity groups. More than 75% of responding firms require diversity training, mentor diverse attorneys, and have a dedicated diversity professional. The majority, 61%, report that partners are evaluated on diversity results, an increase from 48% in 2013 and 53% in 2014. Approximately half of reporting firms have created a sponsorship program for diverse attorneys.
Many firms reported management committee member representation on the diversity committee, with 27% serving as Chair, which demonstrates commitment from firm leadership to diversity and inclusion efforts. Additionally, diversity budget figures have been robust, with 88% of firms reporting that diversity budgets remained steady or have increased from 2014 to 2015 and nearly 41% of firms anticipated an increase in their diversity budgets for the 2016 calendar year.
Diversity training was offered in more than 83% of signatory firms. Most of these training programs are mandatory; however, while some firms require full firm participation including non-legal personnel, others limit mandatory participation solely to partners, associates, or new hires.
Affinity groups are a foundational element for prioritizing diversity, and signatory firms reported an average of five affinity groups per firm in 2015. In addition to the most common affinity groups—women, LGBT employees, African-American, Hispanic and Asian/Pacific Islander groups, and attorneys with disabilities—signatory firms reported innovative efforts to provide support for working parents and new mothers, veterans, and those caring for a disabled relative.
53%
78%
78%
89%
91%
93%
98%
49%
61%
75%
83%
83%
91%
92%
97%
0 0.2 0.4 0.6 0.8 1
Sponsorship Div Attys
Partners Eval on Div
Dedicated Div Prof
Req'd Div Training
Mentor Div Attys
Affinity Groups
Diversity Budget
Diversity Council
CHART W: ELEMENTS OF DIVERSITY SUPPORT
2015
2014
DIVERSITY SUPPORT

16 | City Bar Benchmarking Report | 2015
46%
60%
53%
63%
77%
68%
82%
85%
23%
15%
32%
24%
9%
25%
12%
9%
0% 50% 100%
Partners Evaluated on Diversity
Sponsorship Div Attys
Diversity Training
Mentor Diverse Attorneys
Dedicated Diversity Professional
Affinity Groups
Diversity Council
Dedicated Diversity Budget
CHART X: IMPORTANCE OF DIVERSITY SUPPORTS IN DRIVING PROGRESS
Extremely important Very important
Respondents were also asked to rate the importance of the diversity elements and practices in helping their firms reach their diversity goals. In 2015 dedicated diversity budgets, diversity councils, and dedicated diversity professionals ranked as the three most important elements in driving change. This year’s data reflected an increase in the number of law firms that attributed at least one element of diversity support as a matter of “extreme importance.” More than three-quarters of signatory firms reported that having a diversity council and a dedicated diversity professional were of extreme importance; affinity groups and mentorship and sponsorship of diverse attorneys were also rated as extremely important by most firms. The importance of a dedicated diversity budget increased to 85% in 2015 from 72% in 2014.
The importance of partners being evaluated on diversity metrics has increased from 33% in 2013 to 46% in the 2015 survey results.
In the qualitative interviews and “better practices” data, firms emphasized the role of the diversity professional. Many firms indicated that the position has the most impact when the diversity professional has direct access to law firm leadership, and can influence decisions regarding hiring, workflow, access to clients and business development opportunities, and promotion of minority and women members of the firm. (See Better Practices: Diversity Professional)
TOP-DOWN COMMITMENT
“Our firm Chairman established a 15-member Inclusion Advisory Committee, which he chairs. The Committee launched a firm-wide strategic
change initiative, launched an implicit bias campaign, and developed a tip sheet to
interrupt biases in the performance review process that was distributed to all attorney
reviewers firm-wide.”
“The topic of the advancement of our diverse lawyers is on the agenda of every Executive
Committee meeting as well as other firmwide meetings.”
“Our Management Committee sponsors understand the experiences and issues (of
associates) through personal relationships that you can’t get by just looking at tables of
numbers.”
BETTER PRACTICES: DIVERSITY PROFESSIONAL
Of all reporting firms in 2015, 73% reported dedicated diversity staff, with 26% reporting one diversity professional, 36% reporting a staff of 2-3 professionals, and the remaining 11% reporting a staff of 4 or more. Given the scope of data collection and survey completion alone, all signatory firms should have at least one dedicated diversity professional.
The presence of a Director of Diversity & Inclusion or Chief Diversity Officer will illustrate the firm’s commitment. This position is best utilized when he/she has access to firm leadership, can advise on the quantifiable analysis, and can influence hiring, workflow, promotion, and compensation decisions.
Diversity Managers & Coordinators and other support staff can support analytic processes, event planning, and implementation of mentor programs and other diversity-related efforts.

17 | City Bar Benchmarking Report | 2015
Observations for Driving Change at all Levels
We believe that monitoring metrics is a critical tool to advance diversity — by helping firms understand which diversity efforts are working and where the biggest challenges remain. For law firms to recruit, retain, and promote a diverse pool of talent, several elemental factors must be in place. The qualitative research revealed the roles that a host of stakeholders in the firm must play in executing impactful inclusion practices. Women and minority associates will stay and thrive in an environment that genuinely values diversity, and one in which they can see the firm’s demonstrated, long-term investment in their individual success. And while the tone must come from the top, every member of the firm has a responsibility to ensure the traction of the firm’s efforts and, ultimately, its success. We believe this study will have a lasting impact on our ability to make the profession more reflective of the increasing diversity of corporate America, and inspire the next generation to continue to aspire toward legal careers. With this goal in mind, we offer the following observations for law firm participants, and will continue this dialogue throughout the year.
Managing Partners
Diversity efforts within law firms are most impactful when law firm leaders are actively engaged in prioritizing and advocating for their success. Managing partners can incorporate diversity strategy into firm management by placing it on the agenda at Executive Committee, Compensation Committee, Elevation Committee meetings, and other firmwide gatherings. (See City Bar Managing Partners Toolkit)
Partners
Law firm partners, three-quarters of whom are white males, undoubtedly have the most access to clients and opportunities and, therefore, are well-positioned to take an active role in fostering the development of diverse associates. Partners can place associates in the path of a big case or deal, invest in and mentor associates, provide practical feedback, and advocate on their behalf to firm leadership. Additionally, partners can become engaged members of diversity initiatives in the firm and encourage their peers to join.
Associates
Associates can ensure their success in the profession by strengthening their awareness of the firm culture and how they fit into it, empower themselves to seek out meaningful work, professional development opportunities and constructive feedback, and cultivate an engaged network of mentors and sponsors. Associates should have individualized plans and regular assessments of their progress. (See City Bar Attorney Toolkit)
Clients
Clients can play a key role in advancing the diversity of the law firms that serve them by providing financial incentives to law firms to reflect their commitment to diversity. To help move the needle, they can make a concentrated effort to ensure that diverse attorneys are staffed on their matters and given substantive work, increase the specificity of their RFP diversity metrics, and ultimately, drive change by reducing the volume of business directed to law firms that do not demonstrate improvement.
CONCLUSION

18 | City Bar Benchmarking Report | 2015
The 2015 Benchmarking Report was created under the leadership of New York City Bar President John S. Kiernan; Executive Director Bret I. Parker; and Director of Diversity and Inclusion Gabrielle Lyse Brown. Amy Richman of WFD Consulting led the research effort. The survey update effort was led by Joseph Drayton of Cooley LLP, Chair of the Task Force, and supported by Nate Saint-Victor, Sheila Boston, and Hon. Rosalyn Richter, Former & Current Co-Chairs of the Committee to Enhance Diversity in the Profession.
Profound thanks to Deloitte Transactions and Business Analytics LLP and Deloitte Financial Services LLP for the individual firm reports, especially Kamran Masood, Elene Karanicolas, Allison May, Stephen Palazola, and Vivian Yeh for the innovative redesign of the individual firm reports and graphics for the public report.
And special thanks to research Fellows Karla Perez, Indira Murillo, and Raabia Qasim; Monica Parks, Maria Cilenti, Mary Margulis-Ohnuma and Dr. Arin Reeves for editorial support and guidance; and to IBM for fielding the SPSS survey.
And last but certainly not least, we give our deepest thanks to the signatory law firms who participated in the survey and qualitative interviews, particularly in light of the more laborious effort this year.
Questions about the report and reprint permission can be directed to:
Gabrielle Lyse Brown, Director of Diversity & Inclusion
Office for Diversity and Inclusion | New York City Bar | 42 West 44th Street, New York, NY 10036
(212) 382-6713 | [email protected] | www.nycbar.org/diversity
For press inquiries, please contact Eric Friedman (212) 382-6754 | [email protected].
ACKNOWLEDGEMENTS