Embed Size (px)
Citation preview

NY Green Bank
Metrics, Reporting & Evaluation
Quarterly Report No. 9
(Through September 30, 2016)
Case 13-M-0412
November 15, 2016
i
NYGB_Quarterly_Report_PSC_September_2016_161115_FINAL.docx
Contents 1 Performance at a Glance – As of September 30, 2016 ........................................................................ 1 2 Introduction............................................................................................................................................ 2 3 Business Update ................................................................................................................................... 2
3.1 Overview ....................................................................................................................................... 2
3.2 Investment Portfolio ...................................................................................................................... 3
3.2.1 Highlights ............................................................................................................................... 3 3.2.2 New Investments ................................................................................................................... 3
3.3 Active Pipeline ............................................................................................................................... 5
3.4 Operational & Risk Matters ........................................................................................................... 7
4 Quarterly Metrics ................................................................................................................................... 8 5 Progress Against Plan Deliverables .................................................................................................... 10 Tables & Figures Table 1. Quarterly Metrics ............................................................................................................................ 8 Table 2: Status of Plan Deliverables (2016 – 2017) .................................................................................. 10 Figure 1. Transaction Status & Active Pipeline ($ Millions) ......................................................................... 3 Figure 2. Active Pipeline by Technology ...................................................................................................... 6 Figure 3. Active Pipeline by End-Use Customer Segment .......................................................................... 6 Figure 4. Active Pipeline by Geographic Distribution ................................................................................... 7 Schedule Transaction Profiles: Vivint Solar Inc. & Investec Bank PLC Solar Mosaic, Inc. (Updated)

1
NYGB_Quarterly_Report_PSC_September_2016_161115_FINAL.docx
1 Performance at a Glance – As of September 30, 2016 NY Green Bank (“NYGB”) has received $1.6 billion in investment proposals since inception, representing total proposed clean energy investment in New York State exceeding $5.3 billion. The Active Pipeline of potential investments proceeding to close is $638.7 million.1 NYGB’s investments support clean energy projects with a total project cost of up to $953.0 million in aggregate, based on an overall NYGB portfolio size of $198.5 million.
NYGB’s investment portfolio represents an expected mobilization ratio of total project costs to NYGB funds of up to ~5:1, which will be realized as planned clean energy projects are successfully implemented by NYGB’s clients and counterparties. Over 10 years, assuming periodic reinvestment in comparable transactions, the expected mobilization ratio is up to 9:1. Continued revenue growth – over $6.7 million in revenues has been generated since NYGB’s inception. NYGB’s investment portfolio drives estimated gross lifetime GHG reductions of up to 4.2 million metric tons, equivalent to removing more than 49,000 cars from the road for a period of 19 years.
1 Note that at any time, the value of the Active Pipeline is separate from the value of the investment portfolio. So, for example, as
of September 30, 2016, the $638.7 million in Active Pipeline does not include the $198.5 million in closed transactions that comprises NYGB’s investment portfolio.
Stimulating New Clean Energy Proposals in the
State
Strong Active Pipeline
Portfolio Driving Material Clean Energy Investments
Across NYS
Mobilizing Private Capital
Revenue Growth Paving the Way to Self-Sufficiency
Contributing to CEF Objectives, REV & the
CES

2
NYGB_Quarterly_Report_PSC_September_2016_161115_FINAL.docx
2 Introduction This Quarterly Report (“Report”) is filed by NYGB with the New York State Public Service Commission (the “Commission”) pursuant to the Metrics, Reporting & Evaluation Plan developed in consultation with the New York State Department of Public Service (“DPS”) and filed with the Commission2 (the “Metrics Plan”). Defined terms used in the text of this Report but not separately described have the meanings respectively
given to them in the Metrics Plan.
3 Business Update 3.1 Overview NYGB’s investment activities fall into two broad categories, respectively relating to: (a) Transactions that have closed, which collectively comprise NYGB’s investments – the “Portfolio”;
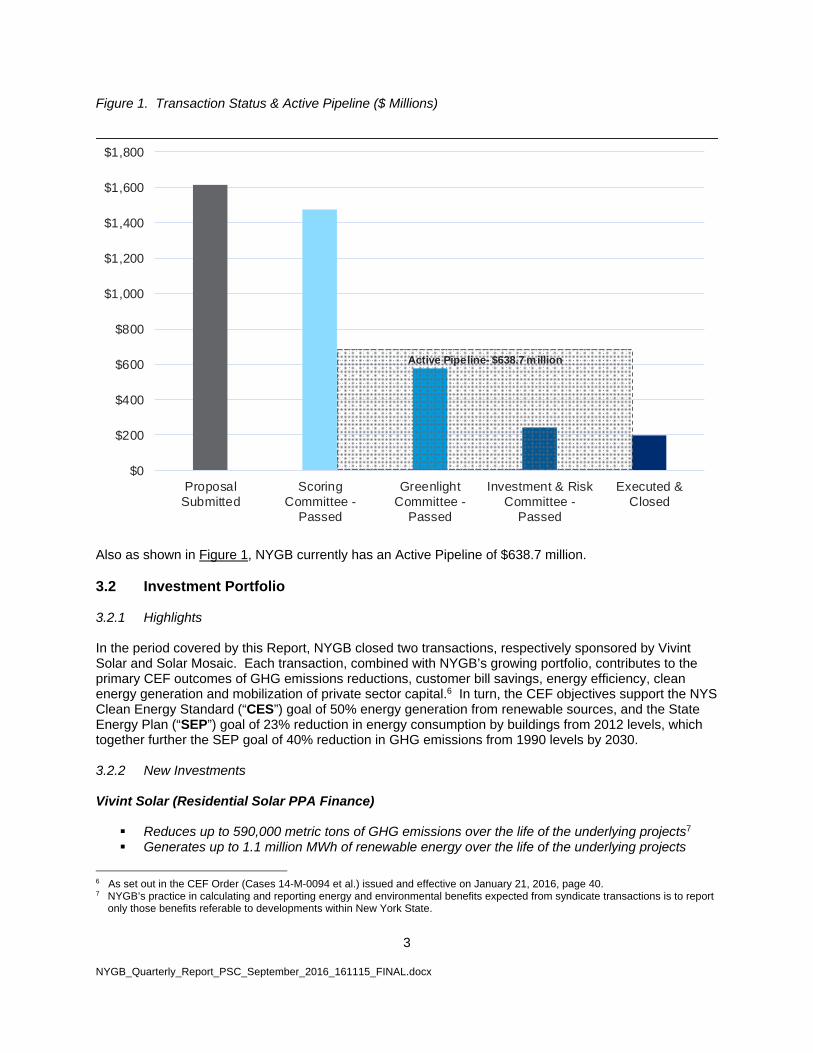
and (b) Transactions that are in process but not yet closed, which collectively comprise NYGB’s “Pipeline”. Each proposed NYGB investment is categorized by the stage it has reached in NYGB’s internal processes. NYGB closed two new investments during the quarter ending September 30, 2016, adding $77.5 million to NYGB’s growing investment portfolio. The Vivint transaction was publicly announced on August 5, 2016.3 The existing Solar Mosaic facility was completed in April 20164, with an additional “upsizing” transaction closed on August 22, 2016. These transactions are discussed in Section 3.2. NYGB’s overall transaction status and Active Pipeline are summarized in Figure 1,5 showing that since inception through September 30, 2016: (a) $1.6 billion of proposals have been received and evaluated by NYGB’s Scoring Committee; (b) $1.5 billion of proposals have passed Scoring Committee evaluation – representing potential
investments that meet NYGB’s mandate and proposal evaluation criteria; (c) $576.4 million of proposals have received Greenlight Committee recommendation for advancement; (d) $245.9 million of proposals have been vetted by the IRC and approved by NYSERDA’s President &
CEO; and (e) $198.5 million of transactions have been closed - comprising the Portfolio - mobilizing public and
private investments to support up to $953.0 million in total project costs for new clean energy deployment in the State.
2 Case 13-M-0412, “NY Green Bank – Metrics, Reporting & Evaluation Plan”, Version 3.0, dated June 20, 2016. 3 The press release, entitled “NY Green Bank Announces $37 Million Solar Deal” is available on NYGB’s website at
www.greenbank.ny.gov/News/In-The-News. 4 See “Mosaic raises $200 million from DZ BANK and NY Green Bank to Fund Demand for Rapidly Growing Residential Solar in
the US”, available at www.greenbank.ny.gov/News/In-The-News. 5 Note that all these amounts change over time as proposals and transactions evolve.
3
NYGB_Quarterly_Report_PSC_September_2016_161115_FINAL.docx
Figure 1. Transaction Status & Active Pipeline ($ Millions)
Also as shown in Figure 1, NYGB currently has an Active Pipeline of $638.7 million. 3.2 Investment Portfolio 3.2.1 Highlights In the period covered by this Report, NYGB closed two transactions, respectively sponsored by Vivint Solar and Solar Mosaic. Each transaction, combined with NYGB’s growing portfolio, contributes to the primary CEF outcomes of GHG emissions reductions, customer bill savings, energy efficiency, clean energy generation and mobilization of private sector capital.6 In turn, the CEF objectives support the NYS Clean Energy Standard (“CES”) goal of 50% energy generation from renewable sources, and the State Energy Plan (“SEP”) goal of 23% reduction in energy consumption by buildings from 2012 levels, which together further the SEP goal of 40% reduction in GHG emissions from 1990 levels by 2030. 3.2.2 New Investments Vivint Solar (Residential Solar PPA Finance)
Reduces up to 590,000 metric tons of GHG emissions over the life of the underlying projects7 Generates up to 1.1 million MWh of renewable energy over the life of the underlying projects
6 As set out in the CEF Order (Cases 14-M-0094 et al.) issued and effective on January 21, 2016, page 40. 7 NYGB’s practice in calculating and reporting energy and environmental benefits expected from syndicate transactions is to report
only those benefits referable to developments within New York State.
$0
$200
$400
$600
$800
$1,000
$1,200
$1,400
$1,600
$1,800
ProposalSubmitted
ScoringCommittee -
Passed
GreenlightCommittee -
Passed
Investment & RiskCommittee -
Passed
Executed &Closed
Active Pipeline- $638.7 million

4
NYGB_Quarterly_Report_PSC_September_2016_161115_FINAL.docx
Increases renewable energy installed generation capacity by up to 38 MW NYGB has committed $37.5 million as part of a five-year term loan for Vivint Solar. Vivint Solar is a national residential solar provider that installs solar energy systems at no upfront cost to customers, and generates revenue through 20-year power purchase agreements and lease agreements. Over 11% of Vivint Solar’s current portfolio is located in NYS and Vivint Solar has placed an emphasis on growing its business in the State. Vivint Solar engaged Investec Bank PLC to structure, arrange, and syndicate a $313.0 million credit facility to refinance an existing aggregation facility. NYGB’s participation provides additional needed liquidity to support Vivint Solar’s need for additional solar deployment capital. It also helps to establish a medium-term lending market as an alternative to refinancing through the traditional asset-backed security market. As the first transaction of its kind, this term loan has drawn in new investors and financial institutions into the marketplace, enhancing liquidity, decreasing the cost of capital for solar developers and installers, and helping reduce the cost of solar power to homeowners. NYGB’s commitment will refinance an existing portfolio of approximately 34 MW of solar assets in NYS. The liquidity provided by the refinancing is expected to facilitate up to 38 MW of new residential solar energy systems in NYS (approximately 5,000 systems). This is anticipated to result in the reduction of up to 23,000 metric tons of GHG emissions annually or up to 590,000 metric tons of GHG emissions over a 25-year project life. Guggenheim, DZ BANK & Solar Mosaic (Residential Solar Loan Finance)
Reduces up to 920,000 metric tons of GHG emissions over the life of the underlying projects8 Generates up to 1.8 million MWh of renewable energy over the life of the underlying projects Increases renewable energy installed generation capacity by up to 60.0 MW
Mosaic is a financial technology company which, utilizing a third party contractor network, provides homeowners with loans to finance the installation of solar systems on their homes. At the request of Guggenheim Partners, a global investment and advisory financial services firm, and in partnership with Germany’s DZ BANK, NYGB participated in a $110.0 million senior secured credit facility in April, 2016.9 Since the close of the original credit facility, Mosaic’s loan originations are occurring at a faster pace than previously anticipated and, simultaneously, Mosaic and its network of developers are increasingly focused on NYS. Following the success of Mosaic’s loan product and the strong performance of the loans within the credit facility, Mosaic sought greater credit availability to satisfy increased demand. Mosaic requested NYGB and private capital providers to participate in a $130.0 million increase of the original facility, bringing the total size to $240.0 million, with an additional $40.0 million from NYGB and $90.0 million from BNP Paribas, a global bank and financial services company. NYGB’s entire $50.0 million contribution to the larger credit facility is intended to drive deployment of projects in NYS. Additionally, NYGB’s participation: (i) will provide increased financing scale and diversity that will result in larger term securitizations that should assist creation of greater market liquidity and drive down financing costs; (ii) increase deployment by Mosaic in NYS benefiting homeowners and the contractors serving them; and (iii) motivate new participants in the market given NYGB’s financial expertise in clean energy financings.
8 NYGB’s practice in calculating and reporting energy and environmental benefits expected from syndicate transactions is to report
only those benefits referable to developments within New York State. 9 This transaction was included in the NYGB’s Quarterly Report No. 8 (Through June 30, 2016) that was filed on August 15, 2016
and is available at www.greenbank.ny.gov/About/Public-Filings. The Transaction Profile relating to this investment has been updated from April 2016 and is included in the Schedule to this Report, as well as being available at www.greenbank.ny.gov/Investments/Transaction-Profiles.
5
NYGB_Quarterly_Report_PSC_September_2016_161115_FINAL.docx
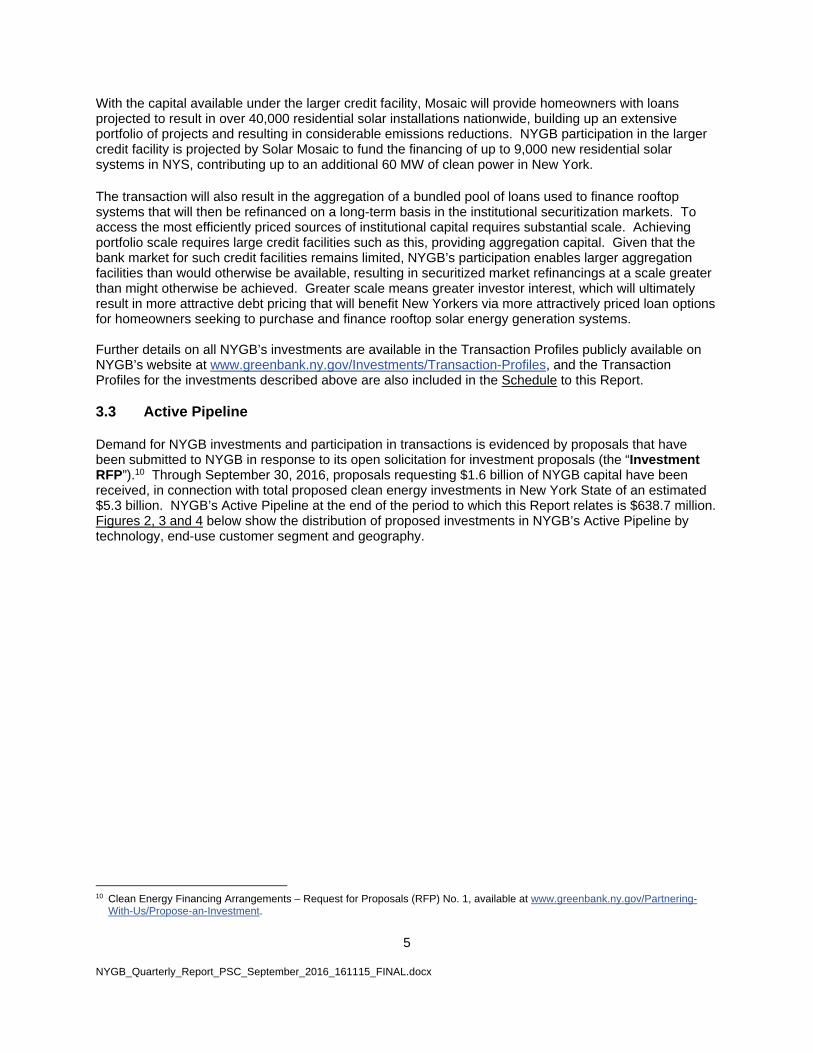
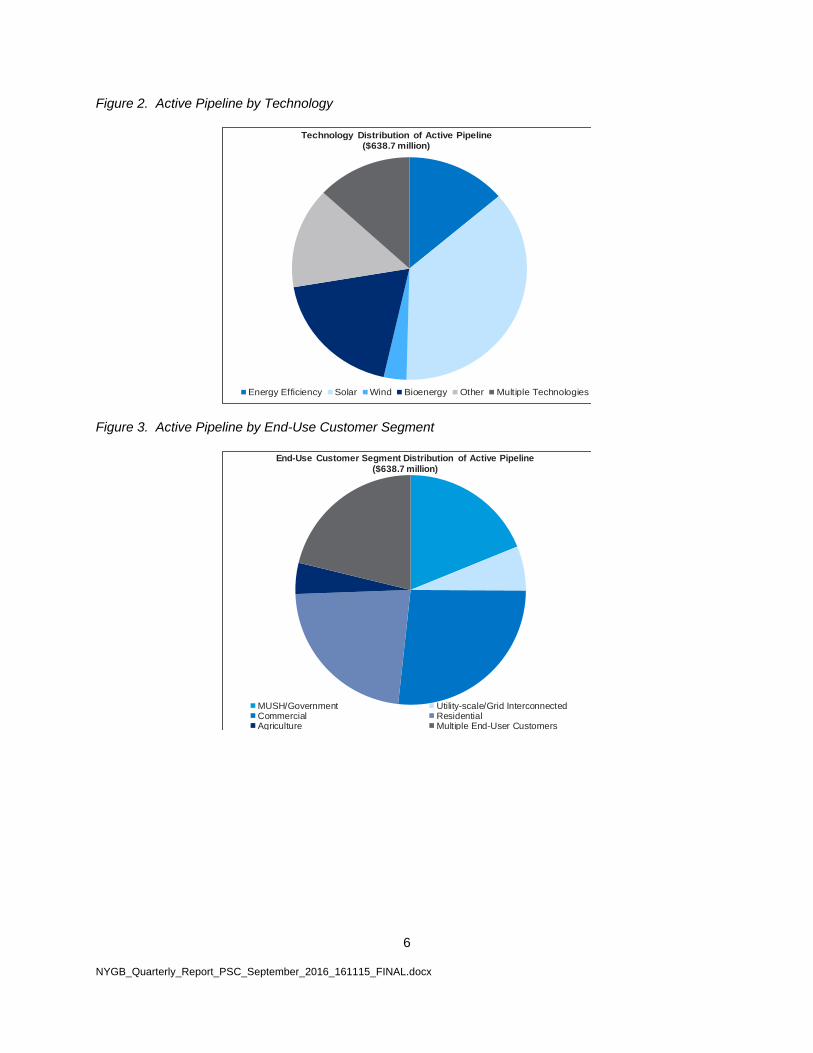
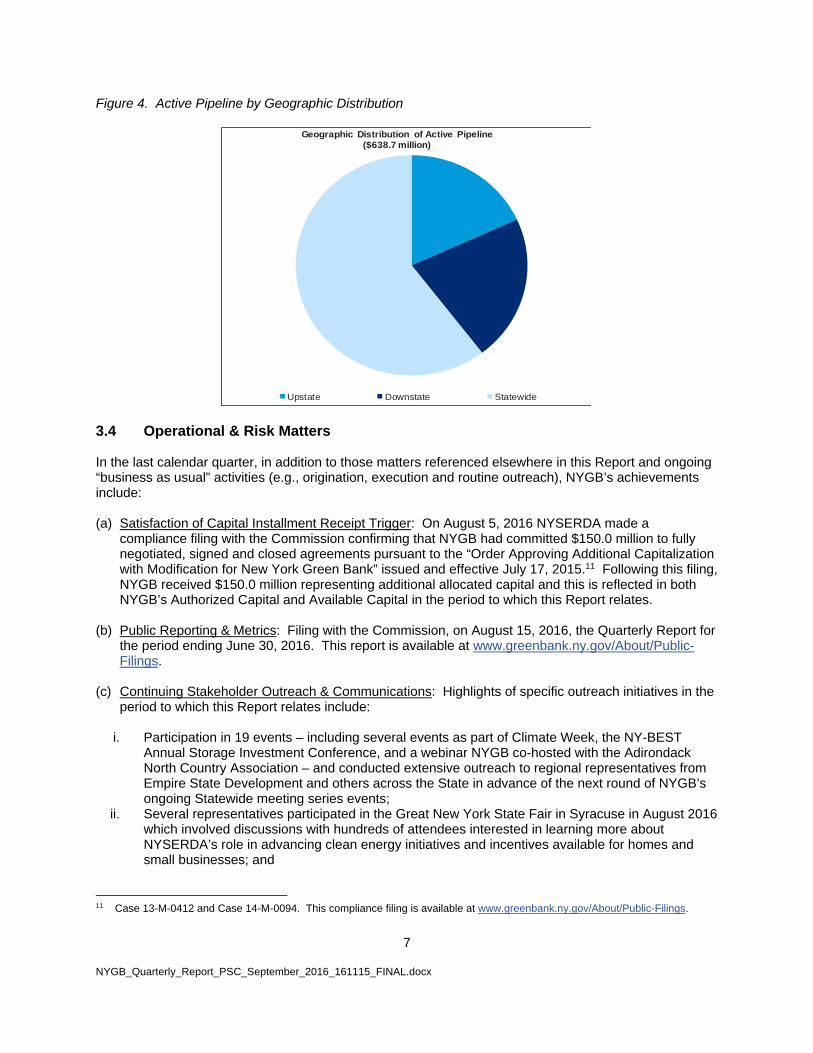
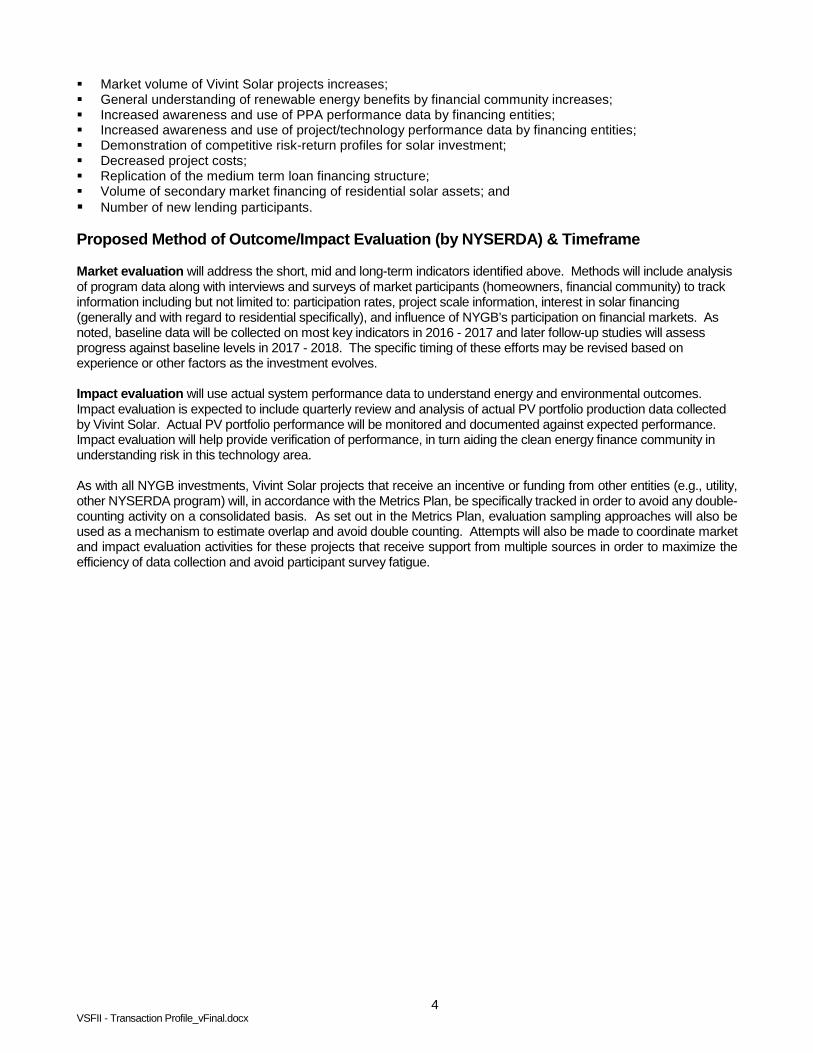
With the capital available under the larger credit facility, Mosaic will provide homeowners with loans projected to result in over 40,000 residential solar installations nationwide, building up an extensive portfolio of projects and resulting in considerable emissions reductions. NYGB participation in the larger credit facility is projected by Solar Mosaic to fund the financing of up to 9,000 new residential solar systems in NYS, contributing up to an additional 60 MW of clean power in New York. The transaction will also result in the aggregation of a bundled pool of loans used to finance rooftop systems that will then be refinanced on a long-term basis in the institutional securitization markets. To access the most efficiently priced sources of institutional capital requires substantial scale. Achieving portfolio scale requires large credit facilities such as this, providing aggregation capital. Given that the bank market for such credit facilities remains limited, NYGB’s participation enables larger aggregation facilities than would otherwise be available, resulting in securitized market refinancings at a scale greater than might otherwise be achieved. Greater scale means greater investor interest, which will ultimately result in more attractive debt pricing that will benefit New Yorkers via more attractively priced loan options for homeowners seeking to purchase and finance rooftop solar energy generation systems. Further details on all NYGB’s investments are available in the Transaction Profiles publicly available on NYGB’s website at www.greenbank.ny.gov/Investments/Transaction-Profiles, and the Transaction Profiles for the investments described above are also included in the Schedule to this Report. 3.3 Active Pipeline Demand for NYGB investments and participation in transactions is evidenced by proposals that have been submitted to NYGB in response to its open solicitation for investment proposals (the “Investment RFP”).10 Through September 30, 2016, proposals requesting $1.6 billion of NYGB capital have been received, in connection with total proposed clean energy investments in New York State of an estimated $5.3 billion. NYGB’s Active Pipeline at the end of the period to which this Report relates is $638.7 million. Figures 2, 3 and 4 below show the distribution of proposed investments in NYGB’s Active Pipeline by technology, end-use customer segment and geography.
10 Clean Energy Financing Arrangements – Request for Proposals (RFP) No. 1, available at www.greenbank.ny.gov/Partnering-
With-Us/Propose-an-Investment.
6
NYGB_Quarterly_Report_PSC_September_2016_161115_FINAL.docx
Figure 2. Active Pipeline by Technology
Figure 3. Active Pipeline by End-Use Customer Segment
Technology Distribution of Active Pipeline($638.7 million)
Energy Efficiency Solar Wind Bioenergy Other Multiple Technologies
End-Use Customer Segment Distribution of Active Pipeline ($638.7 million)
MUSH/Government Utility-scale/Grid InterconnectedCommercial ResidentialAgriculture Multiple End-User Customers
7
NYGB_Quarterly_Report_PSC_September_2016_161115_FINAL.docx
Figure 4. Active Pipeline by Geographic Distribution
3.4 Operational & Risk Matters In the last calendar quarter, in addition to those matters referenced elsewhere in this Report and ongoing “business as usual” activities (e.g., origination, execution and routine outreach), NYGB’s achievements include: (a) Satisfaction of Capital Installment Receipt Trigger: On August 5, 2016 NYSERDA made a
compliance filing with the Commission confirming that NYGB had committed $150.0 million to fully negotiated, signed and closed agreements pursuant to the “Order Approving Additional Capitalization with Modification for New York Green Bank” issued and effective July 17, 2015.11 Following this filing, NYGB received $150.0 million representing additional allocated capital and this is reflected in both NYGB’s Authorized Capital and Available Capital in the period to which this Report relates.
(b) Public Reporting & Metrics: Filing with the Commission, on August 15, 2016, the Quarterly Report for
the period ending June 30, 2016. This report is available at www.greenbank.ny.gov/About/Public-Filings.
(c) Continuing Stakeholder Outreach & Communications: Highlights of specific outreach initiatives in the
period to which this Report relates include:
i. Participation in 19 events – including several events as part of Climate Week, the NY-BEST Annual Storage Investment Conference, and a webinar NYGB co-hosted with the Adirondack North Country Association – and conducted extensive outreach to regional representatives from Empire State Development and others across the State in advance of the next round of NYGB’s ongoing Statewide meeting series events;
ii. Several representatives participated in the Great New York State Fair in Syracuse in August 2016 which involved discussions with hundreds of attendees interested in learning more about NYSERDA’s role in advancing clean energy initiatives and incentives available for homes and small businesses; and
11 Case 13-M-0412 and Case 14-M-0094. This compliance filing is available at www.greenbank.ny.gov/About/Public-Filings.
Geographic Distribution of Active Pipeline($638.7 million)
Upstate Downstate Statewide

8
NYGB_Quarterly_Report_PSC_September_2016_161115_FINAL.docx
iii. Stakeholder meeting held on September 22, 2016 organized and moderated by NYGB for interested developers, tax equity providers, advisors and lenders as part of two Requests for Information (“RFIs”) that NYGB issued in June 2016 to solicit input on two forthcoming Requests for Proposal for specific products/offerings that NYGB is developing. The RFIs relate respectively to financing: (x) commercial real estate and multi-family solar system and/or energy efficiency purchases; and (y) ground-mounted solar systems targeting corporate and industrial end-users.
(d) Advisory Committee: An Advisory Committee meeting was held on July 26, 2016. Information
regarding NYGB’s Advisory Committee – including its membership and charter - is accessible on NYGB’s website at www.greenbank.ny.gov/About/Advisory-Committee. Advisory Committee meetings occur at least semi-annually.
4 Quarterly Metrics Required metrics for the period July 1, through September 30, 2016 are set out in Table 112 below. Table 1. Quarterly Metrics
Quarterly Metric Prior Quarter Current Quarter Capital Position Authorized Capital ($) $1.0 billion $1.0 billion
Authorized Administrative Expenses ($) $17.5 million $17.5 million Authorized Evaluation Expenses ($) $4.0 million $4.0 million
Available Capital ($) $159.0 million $236.6 million Operational Matters Cumulative Revenues13 ($) $4.4 million $6.7 million Cumulative Operating Expenses ($) $11.0 million $12.7 million
Direct Operating Expenses ($) $6.0 million $7.0 million Allocated Expenses ($) $5.0 million $5.7 million
Credit Facility (if in place) Credit Facility Amount ($) Not Applicable Not Applicable Credit Facility Drawn Amount ($) Not Applicable Not Applicable Credit Facility Fees & Interest
(Cumulative) ($) Not Applicable Not Applicable
Investment Portfolio Committed Funds (Cumulative) ($) $68.2 million $72.7 million Deployed Funds (Cumulative)14 ($) $52.8 million $125.8 million Current Portfolio ($) $121.0 million $198.5 million Overall Investments to Date ($) $121.0 million $198.5 million Total Project Costs (Cumulative) ($) Up to $518.3 million Up to $953.0 million Mobilization Ratio Up to 4:1 Up to 5:1 Commitment Ratio (%) 55.0% 54.0%
12 Note that the energy and environmental metrics included in this Report reflect rounding for ease of representation. 13 In this Report, NYGB revenue figures do not reflect quarterly fair market value adjustments (either increases or decreases)
relating to NYGB capital held in U.S. Treasury securities. These valuation adjustments are included in NYGB’s quarterly and year-end financial statements based on generally accepted accounting principles. However, given that NYGB’s unused capital balances from time to time consist of U.S. Treasury securities with laddered maturities, and those securities are largely held to maturity or liquidated closer to maturity to meet cash needs, fair market valuation adjustments are anticipated to be largely temporary and so are omitted from Quarterly Metrics Reports to provide a clearer indication of NYGB’s revenues. For the period ending September 30, 2016, NYGB’s cumulative fair market valuation adjustment was an increase of ~$111,000.
14 Deployed Funds (Cumulative) as presented in Table 1 is net of all capital repaid to the reporting date.

9
NYGB_Quarterly_Report_PSC_September_2016_161115_FINAL.docx
Quarterly Metric Prior Quarter Current Quarter Portfolio Concentrations15 (%) 75.0% Renewable Energy 85.0% Renewable Energy
25.0% Energy Efficiency 15.0% Energy Efficiency Number & Type of NYGB Investments 6 – Renewable Energy 7 – Renewable Energy
4 – Energy Efficiency 4 – Energy Efficiency
Number & General Type of NYGB Counterparties16
24 – Local Development Corporation, Global Corporate & Investment Banks, Commercial/Regional Banks, Specialty Finance Company, Energy Project Developers
28 – Local Development Corporation, Global Corporate & Investment Banks, Commercial/Regional Banks, Specialty Finance Company, Energy Project Developers
Estimated Gross Lifetime Energy Saved by
Fuel Type from Energy Efficiency Projects (MWh/MMBtu) and/or Estimated Gross Lifetime Clean Energy Generated (MWh) for Committed Funds & Deployed Funds
Estimated Gross Lifetime Energy Saved by Fuel Type
(Energy Efficiency): 960,000 – 1.0 million MWh;
and 9.0 – 9.9 million MMBtu
Estimated Gross Lifetime Energy Saved by Fuel Type
(Energy Efficiency): 960,000 – 1.0 million MWh;
and 9.0 – 9.9 million MMBtu
Estimated Gross Lifetime Clean Energy Generated:
1.8 – 3.4 million MWh
Estimated Gross Lifetime Clean Energy Generated:
3.2 – 6.1 million MWh Estimated Gross First Year17 Energy Saved
by Fuel Type from Energy Efficiency Projects (MWh/MMBtu) and/or Estimated Gross First Year Clean Energy Generated (MWh) for Committed Funds & Deployed Funds
Estimated Gross First Year Energy Saved by Fuel Type
(Energy Efficiency): 78,000 – 82,000 MWh; and 780,000 – 850,000 MMBtu
Estimated Gross First Year Energy Saved by Fuel Type
(Energy Efficiency): 78,000 – 82,000 MWh; and 780,000 – 850,000 MMBtu
Estimated Gross First Year Clean Energy Generated: 88,000 – 160,000 MWh
Estimated Gross First Year Clean Energy Generated: 141,000 – 260,000 MWh
Estimated Gross Lifetime Primary Energy Saved from CHP (Btu) for Committed Funds & Deployed Funds
Not Applicable Not Applicable
Estimated Gross First Year Primary Energy Saved from CHP (Btu) for Committed Funds & Deployed Funds
Not Applicable Not Applicable
Estimated Gross Clean Energy Generation Installed Capacity (MW), if applicable, for Committed Funds & Deployed Funds
77.0 – 130.0 MW 122.3 – 217.3 MW
15 Based on executed transactions, and reflecting dollar values invested by NYGB in renewable energy and energy efficiency
transactions, each as a proportion of the Current Portfolio. 16 In reporting the number and type of NYGB counterparties, NYGB seeks to reflect counterparties that are discrete (i.e., where
NYGB is involved in different transactions with the same counterparty, that party is counted only once for the purposes of this metric); and directly in the transaction with NYGB (i.e., vendors or other counterparties to NYGB’s clients or expected future transaction participants are not counted).
17 All “estimated gross first year” metrics refer to the first year of estimated gross benefits (e.g., energy saved, installed capacity, GHGs etc.) which are expected to occur when each underlying project is fully installed. This means that estimated gross first year benefits across NYGB’s Portfolio do not (and are not intended to) correspond to actual/installed benefits in any given year, and instead represent cumulative estimated benefits across NYGB’s Portfolio based on transactions executed through the CEF term. Note that underlying projects will usually be installed over one or more years following execution of investment agreements (reflecting project development/implementation and funding deployment cycles). The sum of all estimated gross first year measures will approximate the total annual CEF benefits goals for NYGB investments at the end of the CEF term (i.e., in 2025). As set out in Section 2.2.2 of the Metrics Plan, NYGB will report on actual/installed energy and environmental benefits associated with NYGB’s Portfolio in the prescribed form annually, with such reporting included in the Quarterly Metrics Report for each quarter ending December 31.

10
NYGB_Quarterly_Report_PSC_September_2016_161115_FINAL.docx
Quarterly Metric Prior Quarter Current Quarter Estimated Gross Lifetime GHG Emission
Reductions (metric tons)18 for Committed Funds & Deployed Funds
2.0 – 2.9 million metric tons 2.6 – 4.2 million metric tons
Investment Pipeline Active Pipeline (In the Quarter) ($) $524.3 million $638.7 million Investment Process Proposals Received – Value (Cumulative) ($) $1.4 billion $1.6 billion Proposals Received - Total Project Cost
(Cumulative) ($) $5.1 billion $5.3 billion
Approvals - Scoring Committee (Cumulative) ($)
$1.3 billion $1.5 billion
Approvals - Greenlight Committee (Cumulative) ($)
$464.4 million $576.4 million
Approvals - IRC (Cumulative) ($) $168.4 million $245.9 million
5 Progress Against Plan Deliverables In its annual Business Plan, filed on June 27, 2016, NYGB identified specific deliverables that collectively mark its progress in implementing key initiatives over the course of the 2016 - 2017 Plan year (the “Plan Deliverables”). Progress against the Plan Deliverables is required to be addressed in NYGB’s quarterly metrics reports, filed pursuant to the Metrics Plan, together with a brief narrative (as appropriate) of status and an explanation of any material variances relative to expectations. NYGB’s performance against the deliverables for 2016 – 2017 is summarized in Table 2 below. Table 2: Status of Plan Deliverables (2016 – 2017)
Category Deliverable Status in Quarter Ending September 30, 2016
Strong Active Pipeline Active Pipeline Maintain an Active Pipeline of at
least $300.0 million. Achieved for this Quarter: Active Pipeline
$638.7 million. CRM, Transaction
Pipeline & Portfolio Management Infrastructure
Implementation of third-party platform, full “go-live”.
Ongoing & On Track: Following execution of the contract with the preferred platform provider in mid-June 2016, the past quarter’s activities have comprised detailed implementation planning and creation of the system blueprint, platform design and system build-out, including commencing the upload of NYGB historic data and the creation and customization of platform features and reporting. These efforts are continuing.
18 NYSERDA utilizes a 1,160 lbs/MWh conversion factor to estimate GHG emissions reductions for electric generation and energy
efficiency savings across all components of the CEF.

11
NYGB_Quarterly_Report_PSC_September_2016_161115_FINAL.docx
Category Deliverable Status in Quarter Ending September 30, 2016
Portfolio Driving Material Clean Energy Investments Across NYS Committed Funds Commit $200.0 million to NYGB
investments per year, equating to an average of $50.0 million in closed transactions per quarter.
Achieved for this Quarter: $77.5 million of closed transactions in the quarter.
Financing Commercial Real Estate & Multi-Family Solar System &/or Energy Efficiency Purchases
Publicly issue RFP. Ongoing & On Track: Taking into account the input received from respondents to each of the previously-issued RFIs, NYGB convened a roundtable discussion on September 22, 2016, including developers and capital providers to further advance the relevant issues. Roundtable and all other feedback is currently being incorporated in the drafting of the proposed RFPs to structure offerings to motivate increased solar system and energy efficiency investments in the target end-user groups.
Financing Ground-Mounted Solar Systems Targeting Corporate & Industrial End-Users
Publicly issue RFP.
Fund Administration & Loan/Investment Servicing Infrastructure
Implementation of third-party platform, full “go-live”.
Ongoing & On Track: Completed negotiations and executed Fund Administration & Loan/Investment Servicing Agreement with preferred provider on August 12, 2016. Detailed system design and implementation to accommodate all NYGB processes and procedures, including inter-agency and counterparty interactions, commenced.
Available Capital Satisfy the Cash Release Trigger pursuant to the 2015 Capitalization Order through achieving a portfolio size of $150.0 million.
Achieved for the Plan Year: Portfolio size at September 30, 2016 was $198.5 million.
Mobilizing Private Capital Mobilization Ratio Achieve an average, portfolio-wide
mobilization ratio of at least 3:1, driving towards a ratio of 8:1 across all NYGB investments by the end of the CEF term in 2025.
Achieved for this Quarter: Current quarter Mobilization Ratio is up to 5:1.

12
NYGB_Quarterly_Report_PSC_September_2016_161115_FINAL.docx
Schedule – Transaction Profiles
As required by the Metrics Plan, Transaction Profiles for each of the transactions closed during the quarter to which this Report relates are attached.

1
TRANSACTION PROFILE
August 2016
Providing New Yorkers with Greater Access to Residential Solar Opportunities
Vivint Solar Inc. & Investec Bank PLC NY Green Bank (“NYGB”) is committing $37.5 million to participate in a five-year term loan for Vivint Solar Inc. (“Vivint Solar”), a national residential solar installer. As a participant with other banks in the $313.0 million credit facility, NYGB’s capital will help to establish a new medium term lending market to finance residential solar systems in New York State (“NYS”) and provide liquidity for Vivint Solar to develop additional projects in NYS. The up to 38 megawatts (“MW”) of new projects that are expected to be financed as a result of this transaction represent approximately 5,000 residential solar systems in the State.
Transaction Description Vivint Solar is a national residential solar provider that installs solar systems at no upfront cost to customers, and generates revenue through 20-year power purchase agreements (“PPAs”) and lease agreements. Over 11% of Vivint Solar’s current portfolio is located in NYS and Vivint Solar has placed an emphasis on growing its business in the State. Vivint Solar engaged Investec Bank PLC (“Investec”) to structure, arrange, and syndicate a $313.0 million credit facility to refinance an existing aggregation facility. NYGB is committing $37.5 million to participate in the transaction. NYGB’s participation provides additional needed liquidity to support Vivint Solar’s need for additional solar deployment capital. It also helps to establish a medium-term lending market as an alternative to refinancing through the traditional asset-backed security market. As the first transaction of its kind, this term loan has drawn in new investors and financial institutions into the marketplace, enhancing liquidity, decreasing the cost of capital for solar developers and installers, helping reduce the cost of solar power to homeowners. NYGB’s commitment will refinance an existing portfolio of approximately 34 MW of solar assets in NYS. The liquidity provided by the refinancing is expected to facilitate up to 38 MW, or approximately 5,000, of new residential solar systems in NYS. This is anticipated to result in the reduction of 23,000 metric tons of greenhouse gas (“GHG”) emissions annually or 590,000 metric tons of GHG emissions over a 25-year project life. This Transaction Profile is provided pursuant to the “NY Green Bank – Metrics, Reporting & Evaluation Plan, Version 3.0” (the “Metrics Plan”) developed in collaboration with the NYS Department of Public Service and filed with the NYS Public Service Commission (the “Commission”) on June 20, 2016.1 This Transaction Profile contains specific information in connection with the Vivint Solar transaction entered into on August 4, 2016, as required by the Metrics Plan.2
1 Case 13-M-0412. 2 See Section 4.0, page 8 and Schedule 3.

2 VSFII - Transaction Profile_vFinal.docx
Form of NYGB Investment
NYGB Product Product Sub-Type Committed Capital Asset Loan & Investment Medium Term Loan $37.5 million
Location(s) of Underlying Project(s) Statewide.3 Vivint Solar customers are homeowners with leases or PPA structures in regions across NYS. Types of Client & Counterparty Organizations that are Transaction Participants
Name Participant Type Client Investec Global Corporate & Investment Bank
Counterparties (current)
Vivint Solar Energy Project Developer
Various tax equity providers and commercial banks
Global Corporate & Investment Banks, Commercial/Regional Banks
Summary of Financing Market Objectives & Barriers Addressed
Technologies Involved
Technology Measures Renewable Energy Solar photovoltaic (“PV”) systems
3 Defined as projects located in four or more regions of the State.
Beneficiary Market Barrier Financing Solution Capital Market Participants
There is a limited (but growing) number of lenders actively financing residential solar projects.
NYGB’s role as a specialty clean energy lender in the term loan provides other financing parties with greater confidence, making it both a key component to drawing in other private sector financiers and critical in supporting Investec’s syndication efforts.
Today’s markets are neither liquid nor large enough for broadly syndicated term securitizations. Therefore, additional sources of liquidity are needed.
NYGB participation in this term loan helps to establish a medium term lending market as an alternative to refinancing through the securitization market. This transaction is expected to draw new investors and financial institutions into the marketplace, resulting in enhanced liquidity.
It is difficult for private sector capital providers to accurately assess performance due to lack of precedents in residential solar financing.
NYGB’s participation in this transaction is expected to help demonstrate that competitive risk-return profiles can be achieved for solar investments.
Solar Project Developers
Many solar developers face the challenge of securing sufficient financing to meet customer demand – hampering their ability to grow and achieve economies of scale.
NYGB’s participation in the term loan provides additional needed liquidity to support Vivint Solar’s growing demand from homeowners. The medium term refinancing enables Vivint Solar to use its capital to process project backlog.
Homeowners Homeowners are skeptical about savings from “going solar.”
Enhanced liquidity will result in lower capital costs for developers, reducing the lease or PPA costs to NYS homeowners beyond those currently offered.

3 VSFII - Transaction Profile_vFinal.docx
Metrics & Evaluation Plan Planned Energy & Environmental Metrics NYGB’s minimum investment criteria specifically require that “transactions will have the potential for energy savings and/or clean energy generation that will contribute to greenhouse gas [(‘GHG’)] reductions in support of New York’s energy policies”.4 In addition, the Metrics Plan requires that the following energy and environmental measures, applicable to this transaction, be reported on5: Estimated gross lifetime and first-year clean energy generated (MWh); Estimated gross clean energy generation installed capacity (MW); and Estimated gross lifetime and first-year GHG emission reductions (metric tons). Existing projects financed by the term loan are not included in the energy and environmental metrics for this transaction, as they are already installed and contributing to GHG emission reductions in NYS. The estimated gross lifetime and first-year energy and environmental impacts of Vivint Solar’s new development in NYS, facilitated by the increased liquidity due to NYGB’s participation in the term loan, are as follows:
Energy/Environmental Impact
Lifetime Low Estimate
Lifetime High Estimate
First-Year Low Estimate
First-Year High Estimate
Estimated clean energy generated
910,000 MWh 1,100,000 MWh 36,000 MWh 45,000 MWh
Estimated clean energy generation installed capacity6
31 MW 38 MW Not Applicable
Estimated GHG emission reductions7
480,000 metric tons 590,000 metric tons 19,000 metric tons 23,000 metric tons
Planned Market Characterization Baseline & Market Transformation Potential The Metrics Plan requires that market evaluation will occur when a critical mass of NYGB financing and investment arrangements are put in place. This market evaluation will be conducted on sectors that NYGB has supported and will occur approximately three to five years following initial NYGB capital deployments.8 Baseline data will be collected in 2016 - 2017 for most indicators as a comparison point against which to assess market progress in the later studies. Progress indicators are defined below for the short, mid and long-terms. Short-term progress indicators will identify early activity levels and will be regularly tracked for the duration of the transaction. These include, but are not limited to: Size (i.e., generation capacity and dollar value) and location of existing projects financed by the term loan; Performance of the underlying customer agreements for existing projects financed by the term loan; Size (i.e., generation capacity and dollar value) and location of new projects deployed as a result of
additional liquidity provided by this transaction; and Aggregate energy generation for new projects deployed as a result of additional liquidity provided by this
transaction. Mid and long-term indicators will be expected to show progress through program tracking or market evaluation over time. These include, but are not limited to:
4 Case 13-M-0412, “Order Establishing New York Green Bank and Providing Initial Capitalization” issued and effective December 19, 2013 of the Commission, Ordering Clause 6 at pages 24 – 25. 5 See Metrics Plan, Section 2.0, pages 2 - 6. 6 Built clean energy generation capacity at full deployment of funds is the same for first-year and lifetime duration. 7 As of January 1, 2016, the New York State Energy Research and Development Authority (“NYSERDA”) utilizes a 1,160 lbs/MWh conversion factor to estimate GHG emissions reductions for electric generation and energy efficiency savings across all components of the Clean Energy Fund. NYSERDA previously utilized a 625 lbs/MWh conversion factor. 8 See Metrics Plan, Section 3.3 at page 7.
4 VSFII - Transaction Profile_vFinal.docx
Market volume of Vivint Solar projects increases; General understanding of renewable energy benefits by financial community increases; Increased awareness and use of PPA performance data by financing entities; Increased awareness and use of project/technology performance data by financing entities; Demonstration of competitive risk-return profiles for solar investment; Decreased project costs; Replication of the medium term loan financing structure; Volume of secondary market financing of residential solar assets; and Number of new lending participants. Proposed Method of Outcome/Impact Evaluation (by NYSERDA) & Timeframe Market evaluation will address the short, mid and long-term indicators identified above. Methods will include analysis of program data along with interviews and surveys of market participants (homeowners, financial community) to track information including but not limited to: participation rates, project scale information, interest in solar financing (generally and with regard to residential specifically), and influence of NYGB’s participation on financial markets. As noted, baseline data will be collected on most key indicators in 2016 - 2017 and later follow-up studies will assess progress against baseline levels in 2017 - 2018. The specific timing of these efforts may be revised based on experience or other factors as the investment evolves. Impact evaluation will use actual system performance data to understand energy and environmental outcomes. Impact evaluation is expected to include quarterly review and analysis of actual PV portfolio production data collected by Vivint Solar. Actual PV portfolio performance will be monitored and documented against expected performance. Impact evaluation will help provide verification of performance, in turn aiding the clean energy finance community in understanding risk in this technology area. As with all NYGB investments, Vivint Solar projects that receive an incentive or funding from other entities (e.g., utility, other NYSERDA program) will, in accordance with the Metrics Plan, be specifically tracked in order to avoid any double-counting activity on a consolidated basis. As set out in the Metrics Plan, evaluation sampling approaches will also be used as a mechanism to estimate overlap and avoid double counting. Attempts will also be made to coordinate market and impact evaluation activities for these projects that receive support from multiple sources in order to maximize the efficiency of data collection and avoid participant survey fatigue.

1 Mosaic Updated_Transaction Profile_v5.0
TRANSACTION PROFILE
August 2016
Scaling Residential Solar & a New Asset Class
to Advance New York’s Clean Energy Goals
Solar Mosaic, Inc.1
In April, 2016, NY Green Bank (“NYGB”) participated as part of a lending group in a $200.0 million credit facility for Solar Mosaic, Inc. (“Mosaic”), a national financial technology company that provides loans to homeowners to finance the installation of solar systems on their homes. Due to greater than expected demand, that credit facility was increased by $130.0 million in August, 2016, including the provision of a further $40.0 million by NYGB, bringing NYGB’s total commitment to the facility to $50.0 million. As a participant in the lending group, NYGB’s capital is expected to facilitate Mosaic’s financing of up to 9,000 residential solar systems in New York State (“NYS”). The effect of the two related financing transactions is to provide a credit facility of greater size for Mosaic commensurate with the demand for its products, facilitating expansion of Mosaic’s statewide footprint and contributing up to 60 megawatts (“MW”) of clean, local power in NYS.
Transaction Description Mosaic is a financial technology company which, utilizing a third party contractor network, provides homeowners with loans to finance the installation of solar systems on their homes. At the request of Guggenheim Partners, a global investment and advisory financial services firm, and in partnership with Germany’s DZ BANK, NYGB participated in a $110.0 million senior secured credit facility in April, 2016. Since the close of the original credit facility, Mosaic’s loan originations are occurring at a faster pace nationally than previously anticipated and, simultaneously, Mosaic and its network of developers are increasingly focused on NYS. Following the success of Mosaic’s loan product and the strong performance of the loans within the credit facility, Mosaic sought increased credit availability to satisfy demand for their loan product. Mosaic requested NYGB and private capital providers to participate in a $130.0 million increase of the original facility, bringing the total size to $240.0 million (the “Credit Facility”), with an additional $40.0 million from NYGB and $90.0 million from BNP Paribas, a global bank and financial services company. NYGB’s entire $50.0 million contribution to the Credit Facility is intended to drive deployment of projects in NYS. Additionally, NYGB’s participation: (i) will provide increased financing scale and diversity that will result in larger term securitizations that should assist creating greater market liquidity and drive down financing costs; (ii) increase deployment by Mosaic in NYS benefiting homeowners and the contractors serving them; and (iii) motivate new participants in the market given NYGB’s financial expertise in clean energy financings. With the capital provided by the larger Credit Facility, Mosaic will provide homeowners with loans that will result in over 40,000 residential solar installations nationwide, building up an extensive portfolio of projects and resulting in considerable emissions reductions. NYGB participation in the Credit Facility will fund the financing of up to 9,000 new residential solar systems in NYS, contributing up to an additional 60 MW of clean, local power in New York.
This Transaction Profile is provided pursuant to the updated “NY Green Bank – Metrics, Reporting & Evaluation Plan” (the “Metrics Plan”) developed in collaboration with the NYS Department of Public Service and filed with the NYS Public Service Commission (the “Commission”) on February 22, 2016.2 This Transaction Profile contains specific information in connection with the Mosaic transaction (which was entered into on April 15, 2016 and increased on August 22, 2016), as required by the Metrics Plan.3
1 This Transaction Profile has been revised to reflect the increase of the Mosaic Credit Facility that occurred in August 2016. The previous
version of this profile (originally posted on NYGB’s website in April, 2016) can be obtained upon request to NYGB. 2 Case 13-M-0412. 3 See Section 4.0, pages 8 and Schedule 3.
2 Mosaic Updated_Transaction Profile_v5.0
Form of NYGB Investment
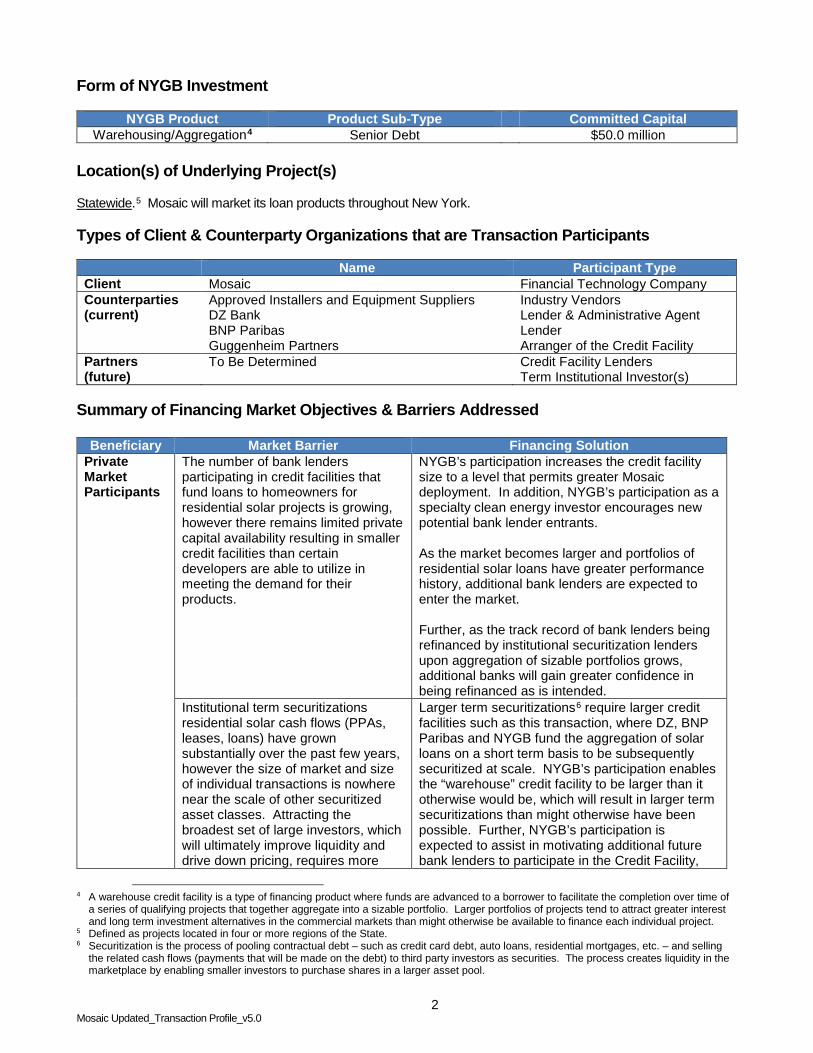
NYGB Product Product Sub-Type Committed Capital Warehousing/Aggregation4 Senior Debt $50.0 million
Location(s) of Underlying Project(s) Statewide.5 Mosaic will market its loan products throughout New York. Types of Client & Counterparty Organizations that are Transaction Participants
Name Participant Type Client Mosaic Financial Technology Company Counterparties (current)
Approved Installers and Equipment Suppliers DZ Bank BNP Paribas Guggenheim Partners
Industry Vendors Lender & Administrative Agent Lender Arranger of the Credit Facility
Partners (future)
To Be Determined Credit Facility Lenders Term Institutional Investor(s)
Summary of Financing Market Objectives & Barriers Addressed
Beneficiary Market Barrier Financing Solution Private Market Participants
The number of bank lenders participating in credit facilities that fund loans to homeowners for residential solar projects is growing, however there remains limited private capital availability resulting in smaller credit facilities than certain developers are able to utilize in meeting the demand for their products.
NYGB’s participation increases the credit facility size to a level that permits greater Mosaic deployment. In addition, NYGB’s participation as a specialty clean energy investor encourages new potential bank lender entrants. As the market becomes larger and portfolios of residential solar loans have greater performance history, additional bank lenders are expected to enter the market. Further, as the track record of bank lenders being refinanced by institutional securitization lenders upon aggregation of sizable portfolios grows, additional banks will gain greater confidence in being refinanced as is intended.
Institutional term securitizations residential solar cash flows (PPAs, leases, loans) have grown substantially over the past few years, however the size of market and size of individual transactions is nowhere near the scale of other securitized asset classes. Attracting the broadest set of large investors, which will ultimately improve liquidity and drive down pricing, requires more
Larger term securitizations6 require larger credit facilities such as this transaction, where DZ, BNP Paribas and NYGB fund the aggregation of solar loans on a short term basis to be subsequently securitized at scale. NYGB’s participation enables the “warehouse” credit facility to be larger than it otherwise would be, which will result in larger term securitizations than might otherwise have been possible. Further, NYGB’s participation is expected to assist in motivating additional future bank lenders to participate in the Credit Facility,
4 A warehouse credit facility is a type of financing product where funds are advanced to a borrower to facilitate the completion over time of
a series of qualifying projects that together aggregate into a sizable portfolio. Larger portfolios of projects tend to attract greater interest and long term investment alternatives in the commercial markets than might otherwise be available to finance each individual project.
5 Defined as projects located in four or more regions of the State. 6 Securitization is the process of pooling contractual debt – such as credit card debt, auto loans, residential mortgages, etc. – and selling
the related cash flows (payments that will be made on the debt) to third party investors as securities. The process creates liquidity in the marketplace by enabling smaller investors to purchase shares in a larger asset pool.
3 Mosaic Updated_Transaction Profile_v5.0
Beneficiary Market Barrier Financing Solution securitizations and larger securitizations.
producing larger securitizations, in turn resulting in a broader set of active investors.
NYS Residential Solar Installers
Access to financing solutions enables residential solar installers to better serve customers that seek to own solar but are more compelled to purchase if financing is provided. Well-packaged financing solutions are not readily available to many contractors.
Products such as Mosaic’s loan offering give Mosaic’s third party contractor network a packaged financing solution, allowing those contractors to install more solar and grow their businesses.
NYS Homeowners
Greater customer choice in acquiring and financing solar will result in more homeowners doing so.
With a Mosaic loan, a NYS resident will benefit from an additional financing option that allows for ownership of the system on their roof, directly enjoying remote net metering, federal tax benefits, and NYS incentives.
Technologies Involved
Technology Measures Renewable Energy Solar photovoltaic (“PV”) systems
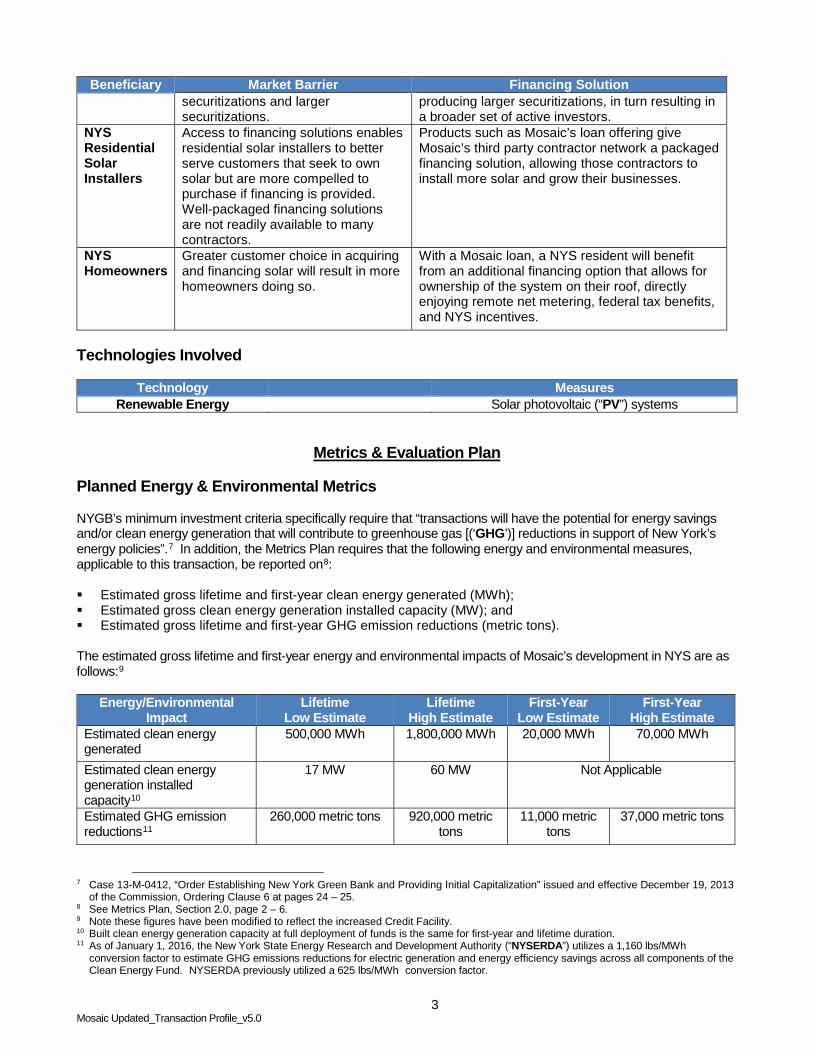
Metrics & Evaluation Plan Planned Energy & Environmental Metrics NYGB’s minimum investment criteria specifically require that “transactions will have the potential for energy savings and/or clean energy generation that will contribute to greenhouse gas [(‘GHG’)] reductions in support of New York’s energy policies”.7 In addition, the Metrics Plan requires that the following energy and environmental measures, applicable to this transaction, be reported on8: Estimated gross lifetime and first-year clean energy generated (MWh); Estimated gross clean energy generation installed capacity (MW); and Estimated gross lifetime and first-year GHG emission reductions (metric tons). The estimated gross lifetime and first-year energy and environmental impacts of Mosaic’s development in NYS are as follows:9
Energy/Environmental Impact
Lifetime Low Estimate
Lifetime High Estimate
First-Year Low Estimate
First-Year High Estimate
Estimated clean energy generated
500,000 MWh 1,800,000 MWh 20,000 MWh 70,000 MWh
Estimated clean energy generation installed capacity10
17 MW 60 MW Not Applicable
Estimated GHG emission reductions11
260,000 metric tons 920,000 metric tons
11,000 metric tons
37,000 metric tons
7 Case 13-M-0412, “Order Establishing New York Green Bank and Providing Initial Capitalization” issued and effective December 19, 2013
of the Commission, Ordering Clause 6 at pages 24 – 25. 8 See Metrics Plan, Section 2.0, page 2 – 6. 9 Note these figures have been modified to reflect the increased Credit Facility. 10 Built clean energy generation capacity at full deployment of funds is the same for first-year and lifetime duration. 11 As of January 1, 2016, the New York State Energy Research and Development Authority (“NYSERDA”) utilizes a 1,160 lbs/MWh
conversion factor to estimate GHG emissions reductions for electric generation and energy efficiency savings across all components of the Clean Energy Fund. NYSERDA previously utilized a 625 lbs/MWh conversion factor.
4 Mosaic Updated_Transaction Profile_v5.0
Planned Market Characterization Baseline & Market Transformation Potential The Metrics Plan requires that market evaluation will occur when a critical mass of NYGB financing and investment arrangements are put in place. This market evaluation will be conducted on sectors that NYGB has supported and will occur approximately three to five years following initial NYGB capital deployments.12 Baseline data will be collected in 2016 for most indicators as a comparison point against which to assess market progress in the later studies. Progress indicators are defined below for the short, mid and long-terms.
Short-term progress indicators will identify early activity levels and will be regularly tracked for the duration of the transaction. These include, but are not limited to: Number and size (generation capacity and dollar value) of projects completed; and Loan performance. Mid and long-term indicators will be expected to show progress through program tracking or market evaluation over time. These include, but are not limited to: Awareness and use of solar loan performance data produced by this project by potential financing entities; View of market actors (e.g., insurance institutions) as to investment value of renewable energy loans; and Securitizations of residential solar projects. The above indicators will remain in development until market characterization and baseline activity commences. Additional aspects may be tracked to further support baseline and market measurements. Proposed Method of Outcome/Impact Evaluation (by NYSERDA) & Timeframe Market evaluation will address the short, mid and long-term indicators identified above. Methods will include analysis of program data along with interviews and surveys of market participants to track information including but not limited to: project scale information, interest in solar financing, and influence of the intervention on financial markets. As noted, baseline data will be collected on most key indicators in 2016 and later follow up studies will assess progress against baseline levels in 2017 - 2018. The specific timing of these efforts may be revised based on experience or other factors as the project evolves. Impact evaluation will use estimated system performance data to understand energy and environmental outcomes. As with all NYGB investments, Mosaic projects that receive an incentive or funding from other entities (e.g., utility, other NYSERDA program) will, in accordance with the Metrics Plan, be specifically tracked in order to avoid any double-counting activity on a consolidated basis. Per the Metrics Plan, evaluation sampling approaches will also be used as a mechanism to estimate overlap and avoid double counting. Attempts will also be made to coordinate market and impact evaluation activities for these projects that receive support from multiple sources in order to maximize the efficiency of data collection and avoid participant survey fatigue.
12 See Metrics Plan, Section 3.3 at page 7.