Embed Size (px)
Citation preview
NWS State College Case Examples
Pennsylvania Severe Weather of September 2016 By
Richard H. Grumm National Weather Service State College, PA
1. Overview
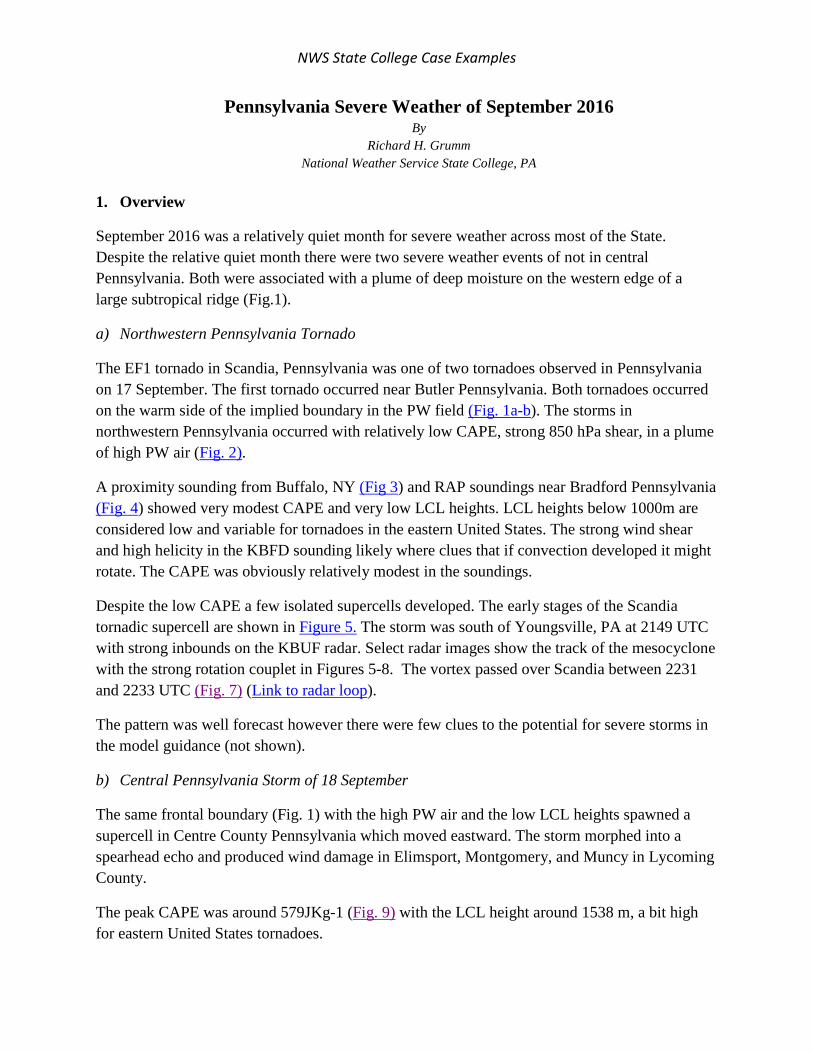
September 2016 was a relatively quiet month for severe weather across most of the State. Despite the relative quiet month there were two severe weather events of not in central Pennsylvania. Both were associated with a plume of deep moisture on the western edge of a large subtropical ridge (Fig.1).
a) Northwestern Pennsylvania Tornado
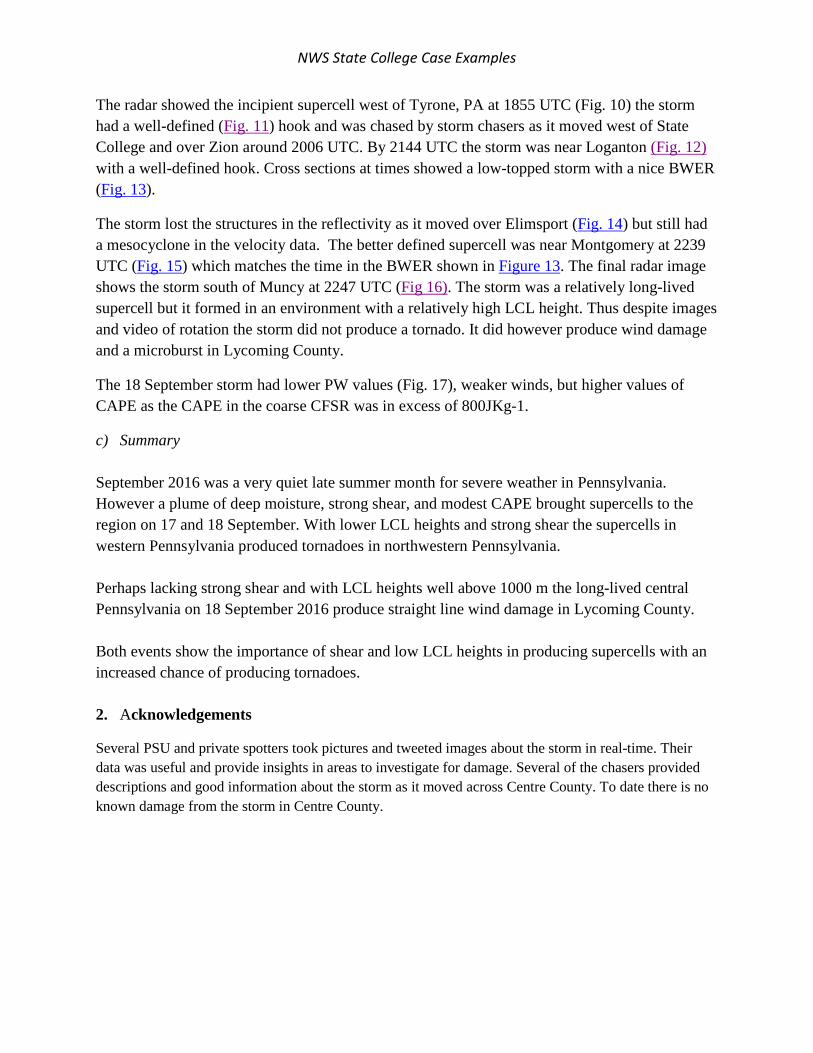
The EF1 tornado in Scandia, Pennsylvania was one of two tornadoes observed in Pennsylvania on 17 September. The first tornado occurred near Butler Pennsylvania. Both tornadoes occurred on the warm side of the implied boundary in the PW field (Fig. 1a-b). The storms in northwestern Pennsylvania occurred with relatively low CAPE, strong 850 hPa shear, in a plume of high PW air (Fig. 2).
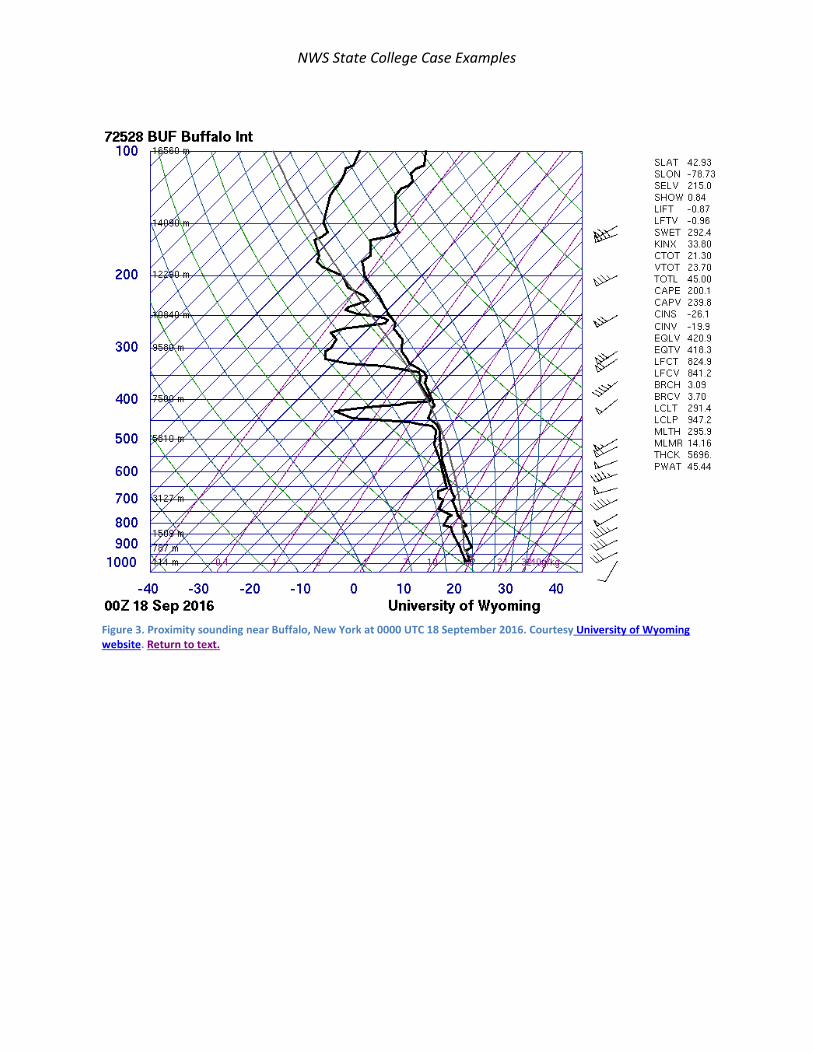
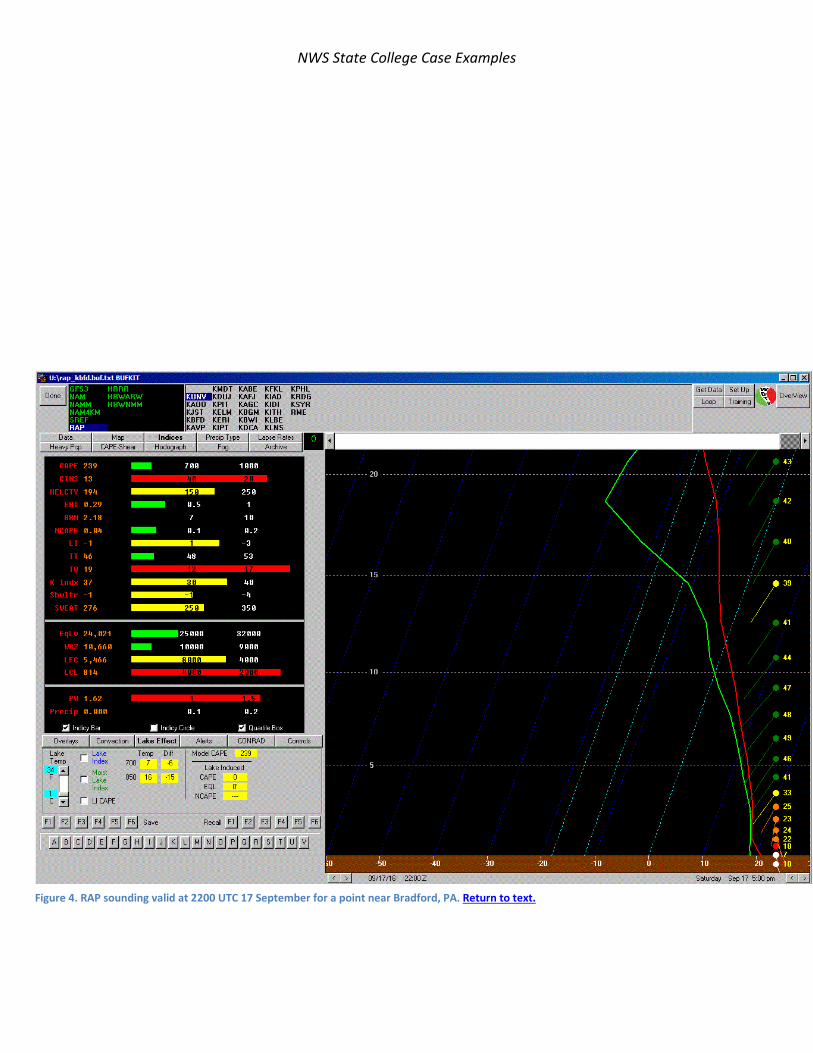
A proximity sounding from Buffalo, NY (Fig 3) and RAP soundings near Bradford Pennsylvania (Fig. 4) showed very modest CAPE and very low LCL heights. LCL heights below 1000m are considered low and variable for tornadoes in the eastern United States. The strong wind shear and high helicity in the KBFD sounding likely where clues that if convection developed it might rotate. The CAPE was obviously relatively modest in the soundings.
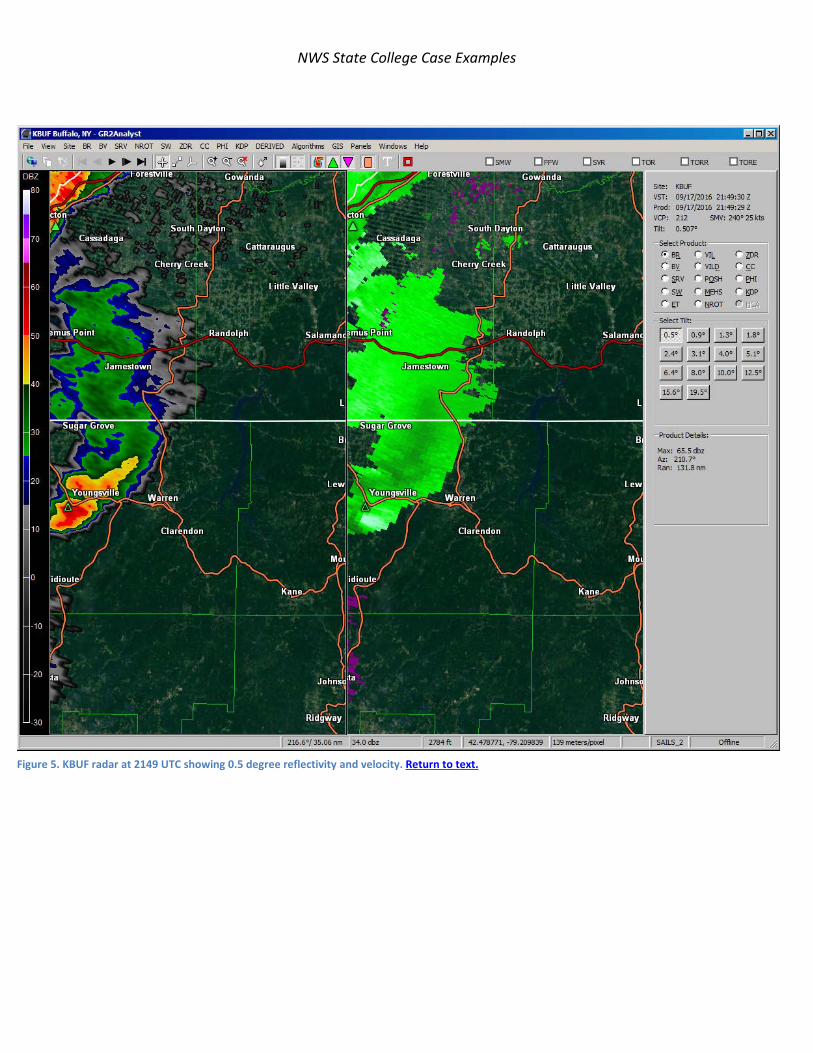
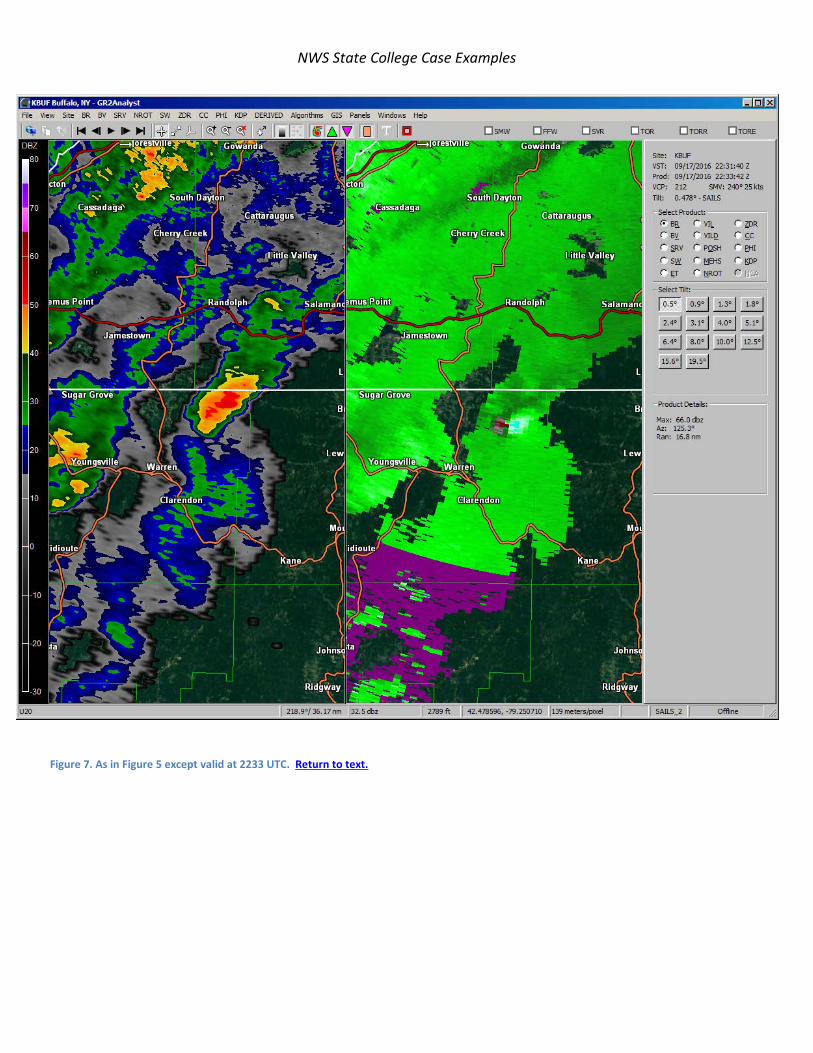
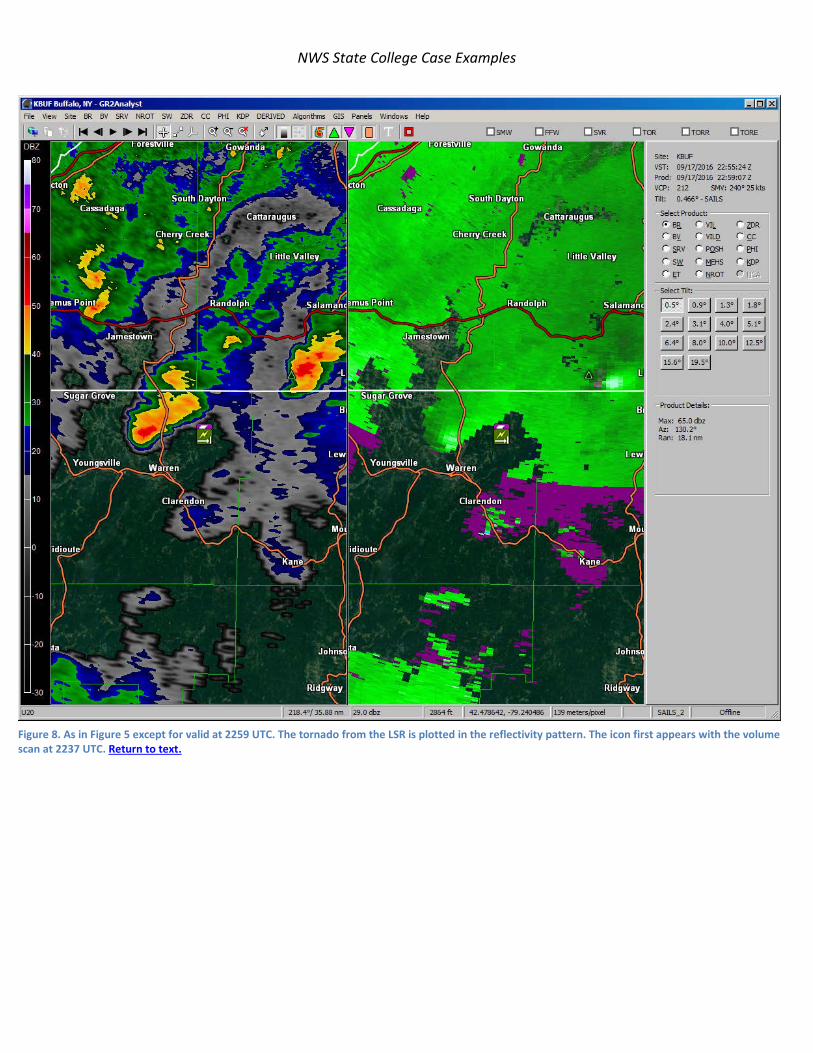
Despite the low CAPE a few isolated supercells developed. The early stages of the Scandia tornadic supercell are shown in Figure 5. The storm was south of Youngsville, PA at 2149 UTC with strong inbounds on the KBUF radar. Select radar images show the track of the mesocyclone with the strong rotation couplet in Figures 5-8. The vortex passed over Scandia between 2231 and 2233 UTC (Fig. 7) (Link to radar loop).
The pattern was well forecast however there were few clues to the potential for severe storms in the model guidance (not shown).
b) Central Pennsylvania Storm of 18 September
The same frontal boundary (Fig. 1) with the high PW air and the low LCL heights spawned a supercell in Centre County Pennsylvania which moved eastward. The storm morphed into a spearhead echo and produced wind damage in Elimsport, Montgomery, and Muncy in Lycoming County.
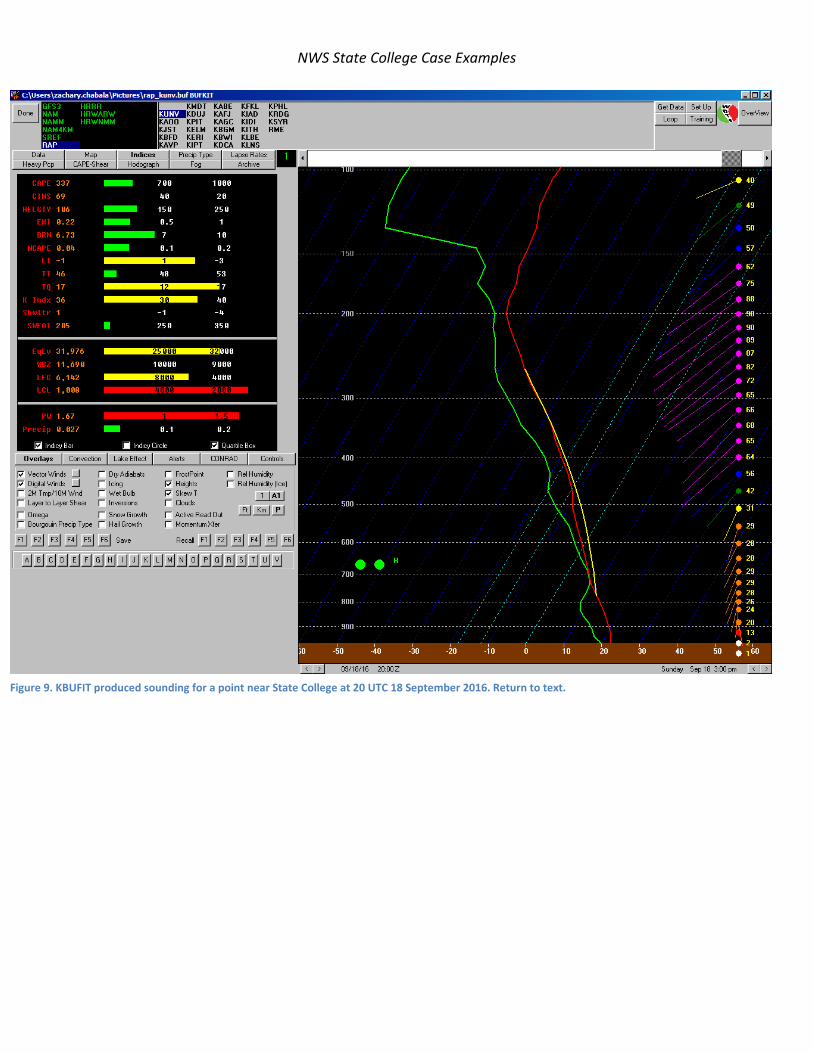
The peak CAPE was around 579JKg-1 (Fig. 9) with the LCL height around 1538 m, a bit high for eastern United States tornadoes.
NWS State College Case Examples
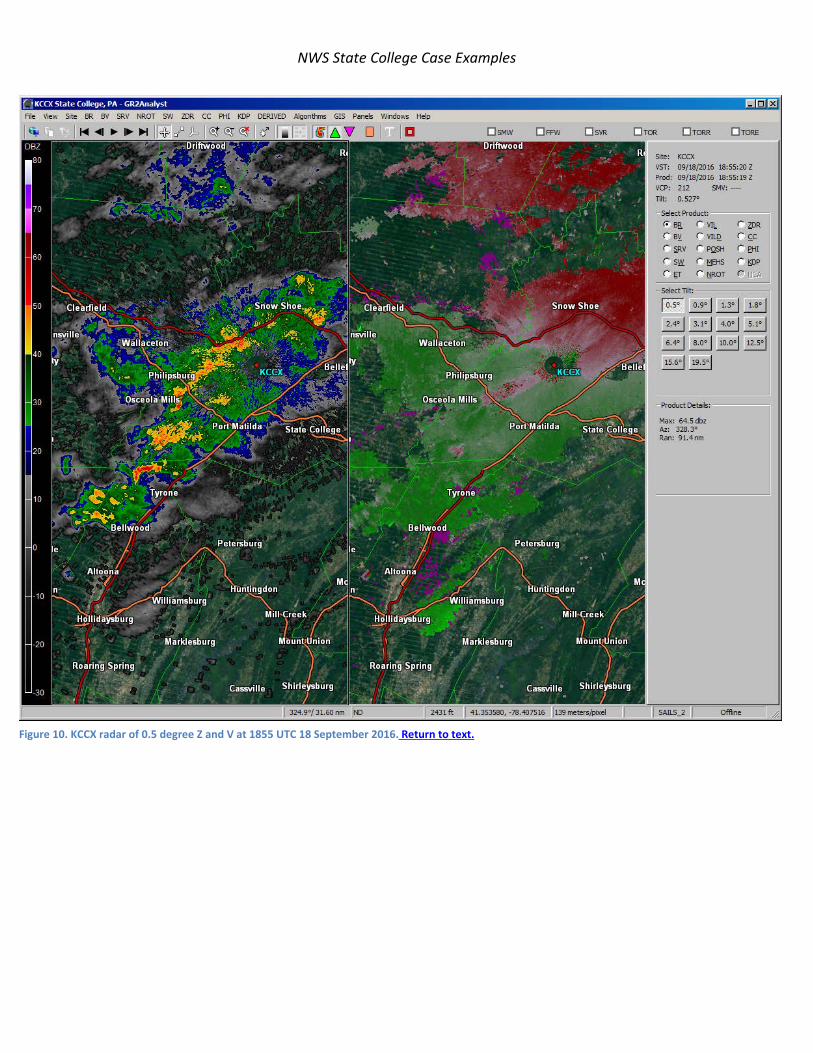
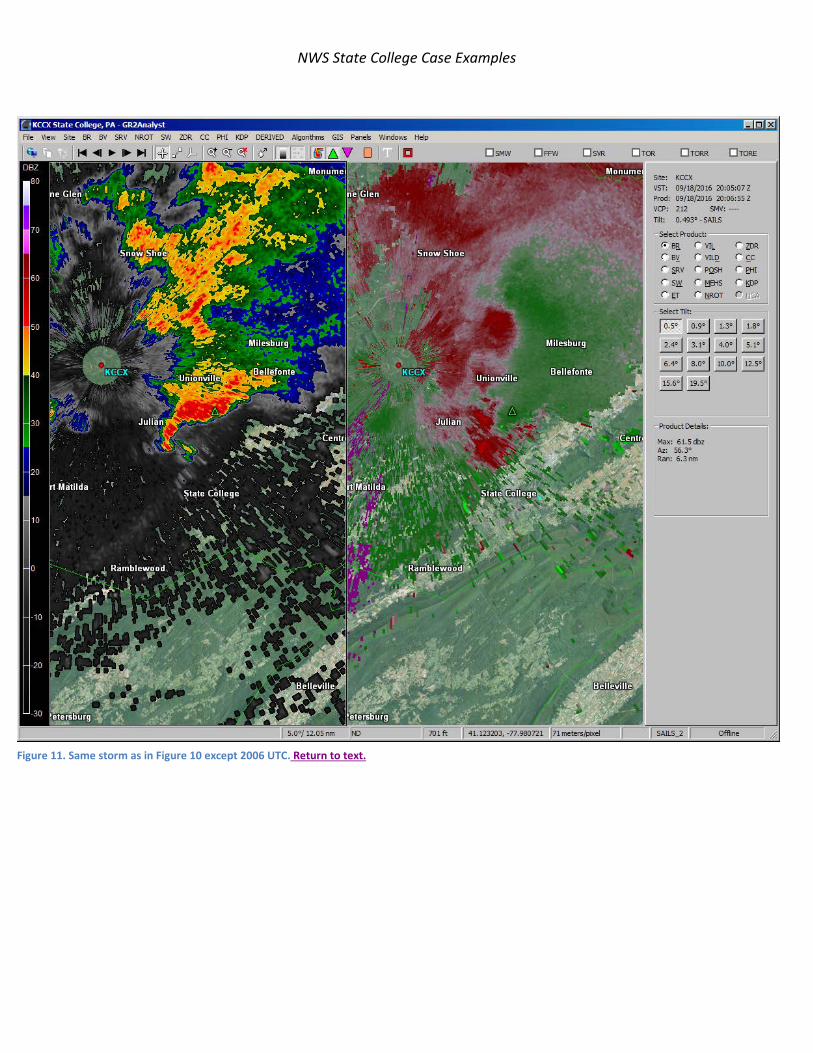
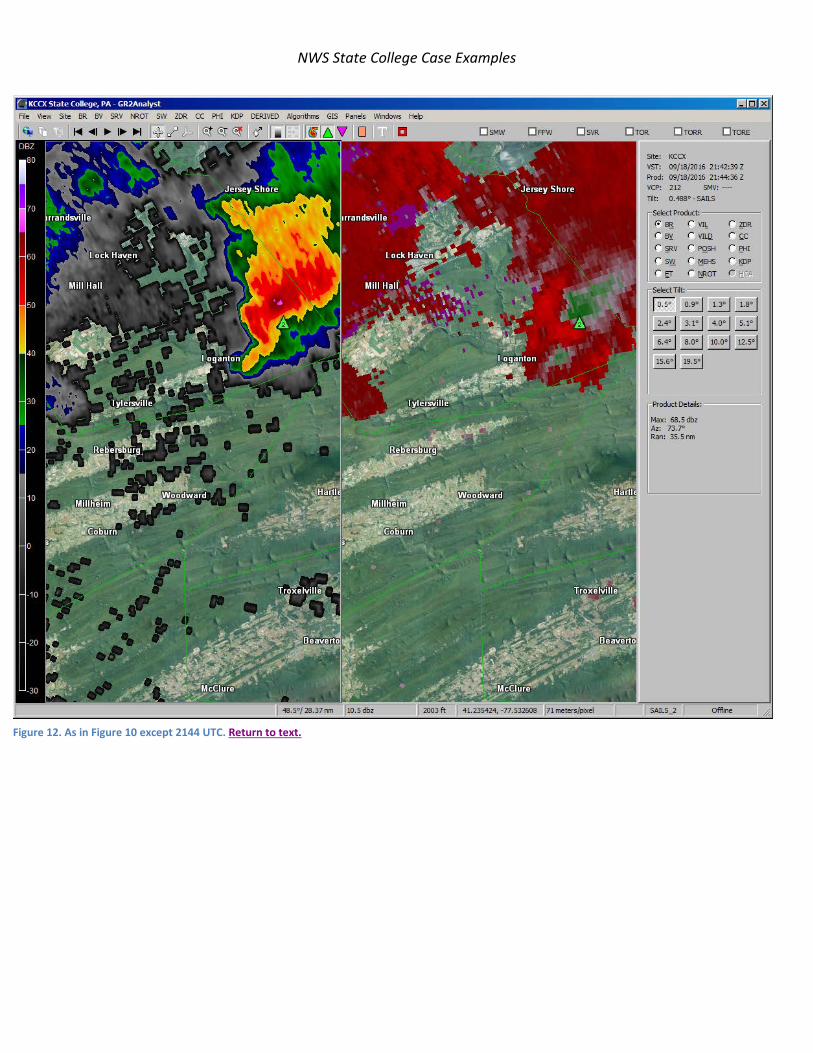
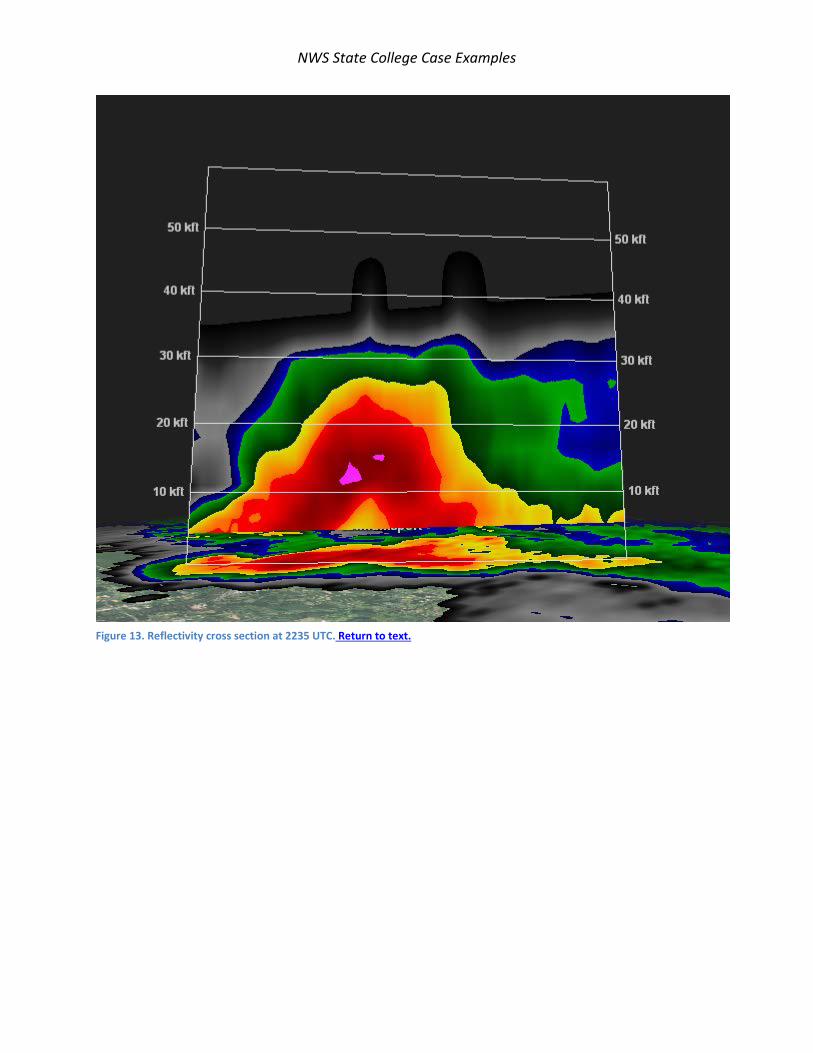
The radar showed the incipient supercell west of Tyrone, PA at 1855 UTC (Fig. 10) the storm had a well-defined (Fig. 11) hook and was chased by storm chasers as it moved west of State College and over Zion around 2006 UTC. By 2144 UTC the storm was near Loganton (Fig. 12) with a well-defined hook. Cross sections at times showed a low-topped storm with a nice BWER (Fig. 13).
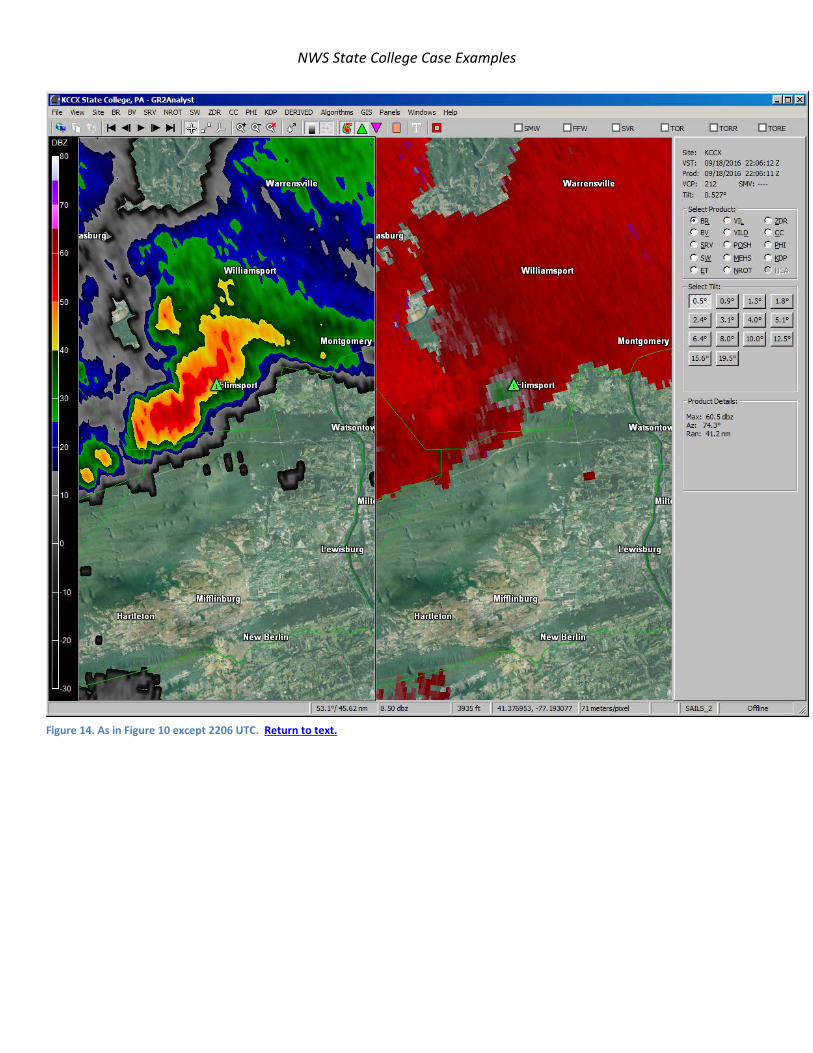
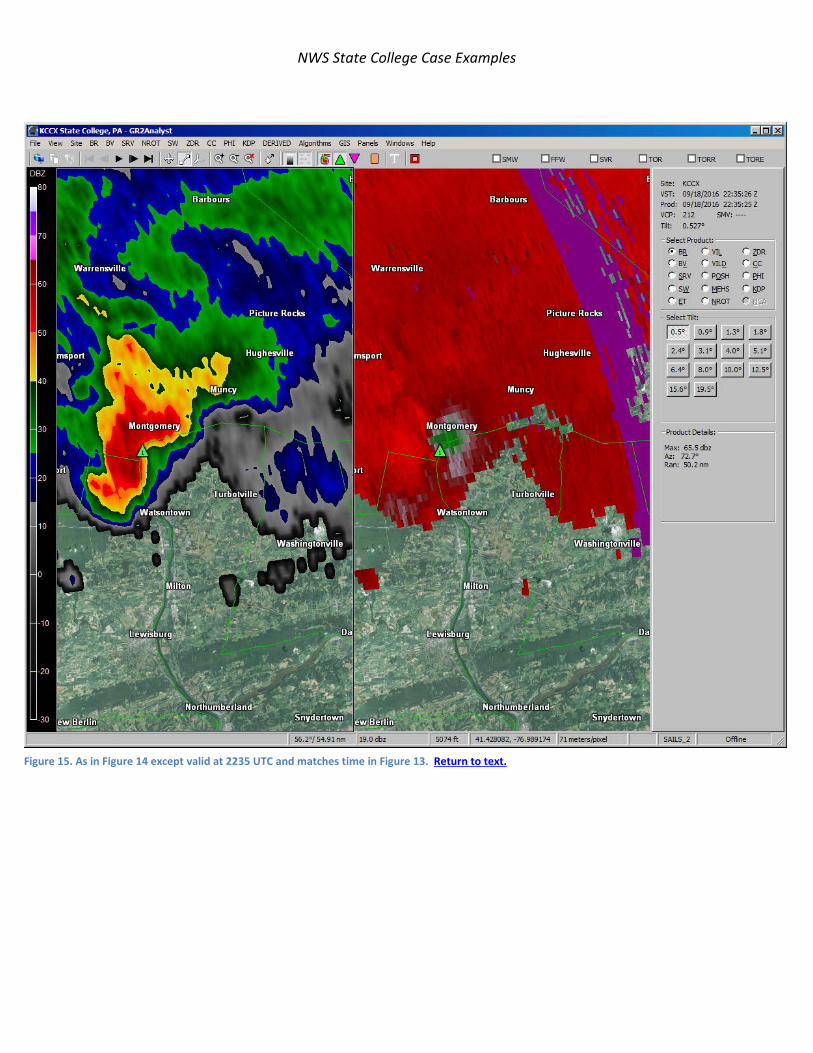
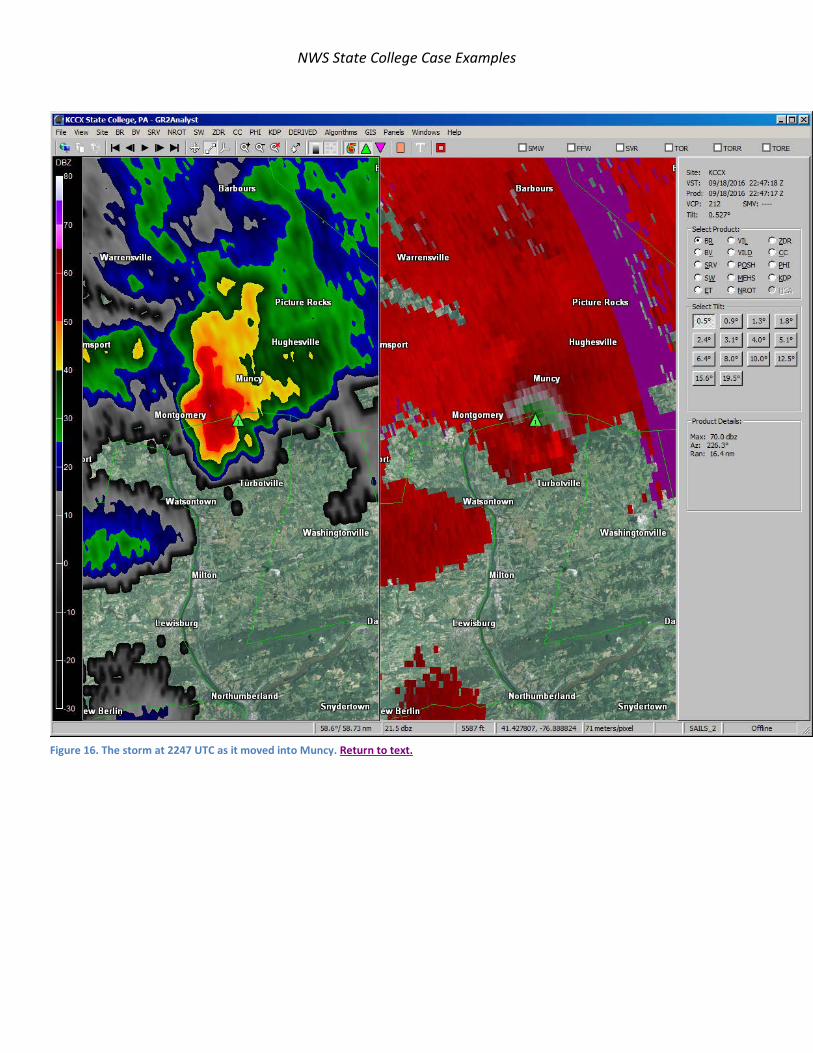
The storm lost the structures in the reflectivity as it moved over Elimsport (Fig. 14) but still had a mesocyclone in the velocity data. The better defined supercell was near Montgomery at 2239 UTC (Fig. 15) which matches the time in the BWER shown in Figure 13. The final radar image shows the storm south of Muncy at 2247 UTC (Fig 16). The storm was a relatively long-lived supercell but it formed in an environment with a relatively high LCL height. Thus despite images and video of rotation the storm did not produce a tornado. It did however produce wind damage and a microburst in Lycoming County.
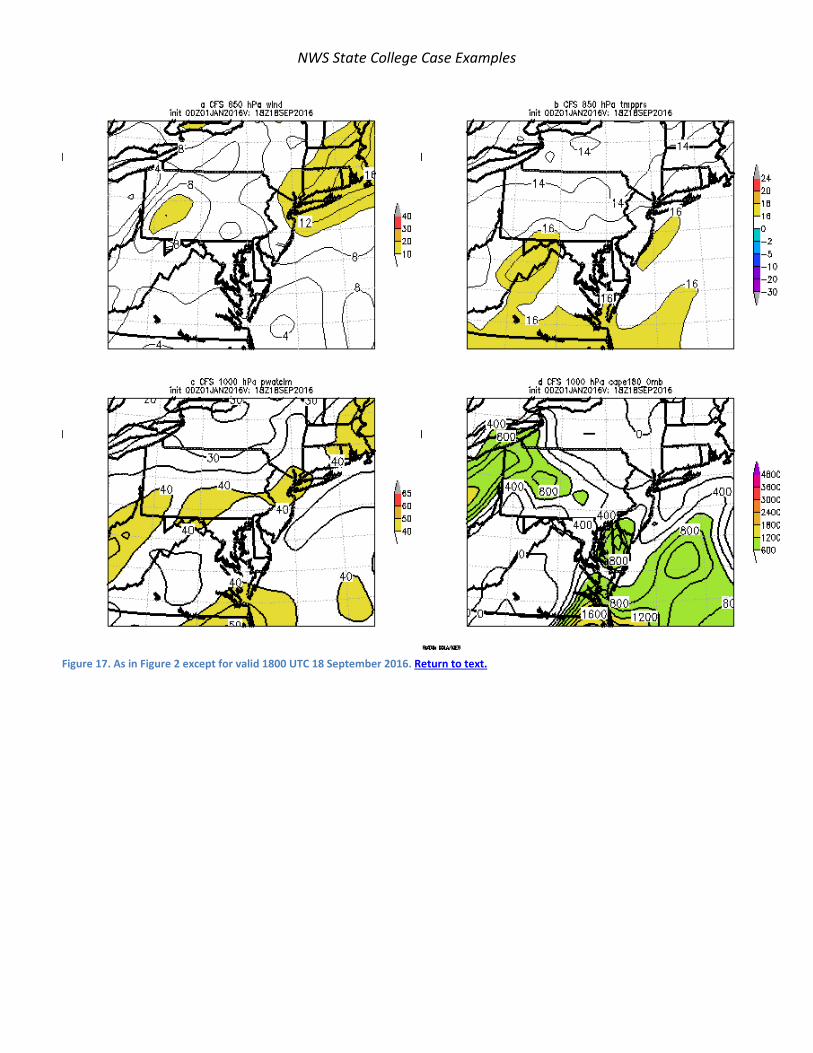
The 18 September storm had lower PW values (Fig. 17), weaker winds, but higher values of CAPE as the CAPE in the coarse CFSR was in excess of 800JKg-1.
c) Summary
September 2016 was a very quiet late summer month for severe weather in Pennsylvania. However a plume of deep moisture, strong shear, and modest CAPE brought supercells to the region on 17 and 18 September. With lower LCL heights and strong shear the supercells in western Pennsylvania produced tornadoes in northwestern Pennsylvania. Perhaps lacking strong shear and with LCL heights well above 1000 m the long-lived central Pennsylvania on 18 September 2016 produce straight line wind damage in Lycoming County. Both events show the importance of shear and low LCL heights in producing supercells with an increased chance of producing tornadoes. 2. Acknowledgements
Several PSU and private spotters took pictures and tweeted images about the storm in real-time. Their data was useful and provide insights in areas to investigate for damage. Several of the chasers provided descriptions and good information about the storm as it moved across Centre County. To date there is no known damage from the storm in Centre County.
NWS State College Case Examples
Figure 1. CFSR precipitable water and anomalies over the eastern United States in 6-hour increments from a) 1200 UTC 17 September through f) 1800 UTC 18 September 2016. Return to text.
NWS State College Case Examples
Figure 2. As in Figure 1 except for CFSR valid at a) 00000 UTC 19 Sept 2016 showing a) 850 hPa wind (ms-1), b) 850 hPa temperatures, c) precipitable water, and d) mean layer CAPE. Return to text.
NWS State College Case Examples
Figure 3. Proximity sounding near Buffalo, New York at 0000 UTC 18 September 2016. Courtesy University of Wyoming website. Return to text.
NWS State College Case Examples
Figure 4. RAP sounding valid at 2200 UTC 17 September for a point near Bradford, PA. Return to text.
NWS State College Case Examples
Figure 5. KBUF radar at 2149 UTC showing 0.5 degree reflectivity and velocity. Return to text.
NWS State College Case Examples
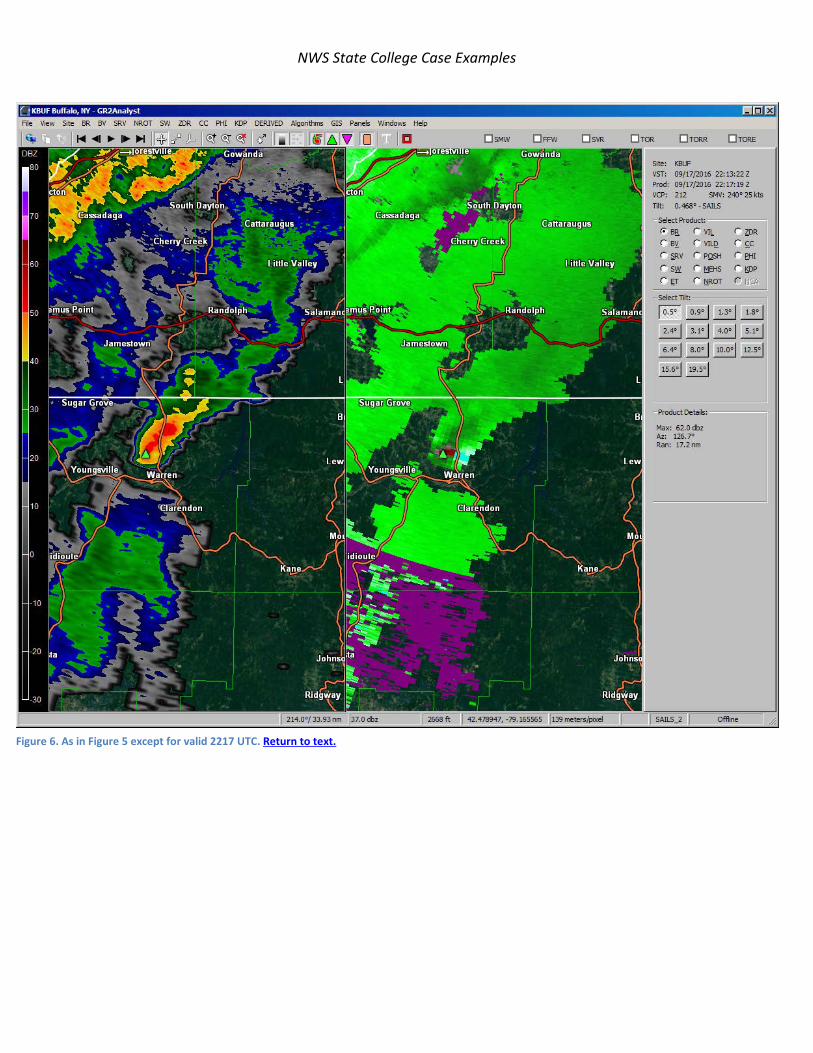
Figure 6. As in Figure 5 except for valid 2217 UTC. Return to text.
NWS State College Case Examples
Figure 7. As in Figure 5 except valid at 2233 UTC. Return to text.
NWS State College Case Examples
Figure 8. As in Figure 5 except for valid at 2259 UTC. The tornado from the LSR is plotted in the reflectivity pattern. The icon first appears with the volume scan at 2237 UTC. Return to text.
NWS State College Case Examples
Figure 9. KBUFIT produced sounding for a point near State College at 20 UTC 18 September 2016. Return to text.
NWS State College Case Examples
Figure 10. KCCX radar of 0.5 degree Z and V at 1855 UTC 18 September 2016. Return to text.
NWS State College Case Examples
Figure 11. Same storm as in Figure 10 except 2006 UTC. Return to text.
NWS State College Case Examples
Figure 12. As in Figure 10 except 2144 UTC. Return to text.
NWS State College Case Examples
Figure 13. Reflectivity cross section at 2235 UTC. Return to text.
NWS State College Case Examples
Figure 14. As in Figure 10 except 2206 UTC. Return to text.
NWS State College Case Examples
Figure 15. As in Figure 14 except valid at 2235 UTC and matches time in Figure 13. Return to text.
NWS State College Case Examples
Figure 16. The storm at 2247 UTC as it moved into Muncy. Return to text.
NWS State College Case Examples
Figure 17. As in Figure 2 except for valid 1800 UTC 18 September 2016. Return to text.