Embed Size (px)
Citation preview

NWS Holdings FY2018 Annual ResultsMedia Briefing
19 September 2018
Draft as of 14 Sep 2018
NWS Holdings FY2018 Annual ResultsMedia Briefing
19 September 2018

Performance Highlights
� Record-high revenue and earnings
� Roads, Environment and Aviation of Infrastructure division
recorded notable growth in earnings
� Mixed performances in Services division with Construction
being the bright spot
� Partial disposal and fair value gain from Beijing Capital
International Airport
� Dividend maintained at no less than 50% of Profit Attributable
to Shareholders (PAT)
� Strong funding resources to boost continual growth
2

* Total dividend for FY2018 increased by 7% after excluding the special dividend of HK$0.72 per share
for FY2017
Capital Expenditure: Over HK$5B
Total cash and bank balances: HK$6,657M (As at 31 Dec 2017: HK$6,421M)
Net Gearing Ratio: 7% (As at 31 Dec 2017: 13%)
Financial SummaryFor the year ended
30 June
2018
(HK$’M)
2017
(HK$’M)
Change %
Revenue 35,114.8 31,385.0 12
Attributable Operating Profit (AOP) 5,231.9 4,840.3 8
Profit attributable to shareholders
(PAT)6,068.8 5,628.9 8
Basic earnings per share (HK$) 1.56 1.46 7
Dividend per share (HK$) 0.78 1.45 *
3

3,500
4,500
5,500
6,500
FY2013 FY2014 FY2015 FY2016 FY2017 FY2018
4
HK$’MHK$’MHK$’MHK$’M
PAT – Five Year Summary
Achieved CAGR growth at 9%
4,3254,3254,3254,325 4,4784,4784,4784,478
4,9134,9134,9134,913
5,6295,6295,6295,629
6,0696,0696,0696,069
4,0084,0084,0084,008

5
AOP by Division
Infrastructure
72%
Services
28%
AOP by Region
Mainland China
50%
Hong Kong
39%
Others
11%
AOP Distribution

6
Performance of Infrastructure Division
Roads Environment
Logistics
Aviation

7
Infrastructure - AOP Breakdown
For the year ended 30 June2018
(HK$’M)
2017
(HK$’M)
Change %
Roads 1,947.1 1,479.1 32
Environment 494.1 392.1 26
Logistics 654.6 641.2 2
Aviation 695.2 610.5 14
Total 3,791.0 3,122.9 21

0
500
1,000
1,500
2,000
FY2017 FY2018
8
Roads
HK$’MHK$’MHK$’MHK$’M
For the year ended30 Jun
� 15 projects in Mainland China,
approx. 700km in length
� Traffic growth of 10%
� RMB exchange gains
� Six-month AOP from newly
acquired Suiyuenan Expressway
AOP
1,4791,4791,4791,4791,9471,9471,9471,947
(+32%)(+32%)(+32%)(+32%)

13,000
15,000
17,000
19,000
21,000
600
800
1,000
1,200
1,400
9
Roads (cont’d)Road Projects Five Year Summary
Average Daily Traffic Flow *
RMB’000
Average Daily Toll Revenue *
Vehicles’000
CAGR:
11%
CAGR:
9%
783858
973
1,081
1,197
14,206
15,205
17,042
18,415
19,901
* For existing projects as at 30 June 2018, excluding
Suiyuenan Expressway which was acquired in Jan 2018

0
100
200
300
400
500
FY2017 FY2018
10
Environment
HKHKHKHK$’M$’M$’M$’M(+26%)(+26%)(+26%)(+26%)
AOP
� SUEZ NWS Limited
蘇蘇蘇蘇伊士新創建伊士新創建伊士新創建伊士新創建
� Water sales and wastewater
treatment volume up 9%
� Waste treatment volume up 8%
� Chongqing Derun Environment 重慶德潤環境重慶德潤環境重慶德潤環境重慶德潤環境
� New waste-to-energy plant in
Chongqing commenced operation in
Jan 2018
� Lump sum VAT subsidy on sewage
business
494494494494392392392392
For the year ended30 Jun

11
Location ProjectDaily Capacity
(tonnes(t)/m3)Total Investment Expected Completion
Shaanxi
Wastewater
5,000 m3 RMB 80M 2019
Hainan 12,000 m3 RMB 100MPhase 1 – operational
Phase 2 – 2020
Jiangsu 40,000 m3 RMB 84MPhase 1 – operational
Phase 2 – 2021
Kaohsiung Waste Incineration 80 tonnes NT$ 650M * 2018
SUEZ NWS Limited
Location Project Scale Total Investment Expected Completion
Chongqing
Changsheng River
Remediation
River length
29 kmRMB 2.5B 2021
Changsheng Bridge
Landfill Restoration 1,037 mu RMB 253M Operational
ChengduEnvironmental
Remediation **
River length
18.68 kmRMB 1.4B 2020
Chongqing Derun Environment
Environment – Summary of New Investments
* Acquisition cost of SUEZ NWS Limited
** Selected as preferred bidder in Jun 2018
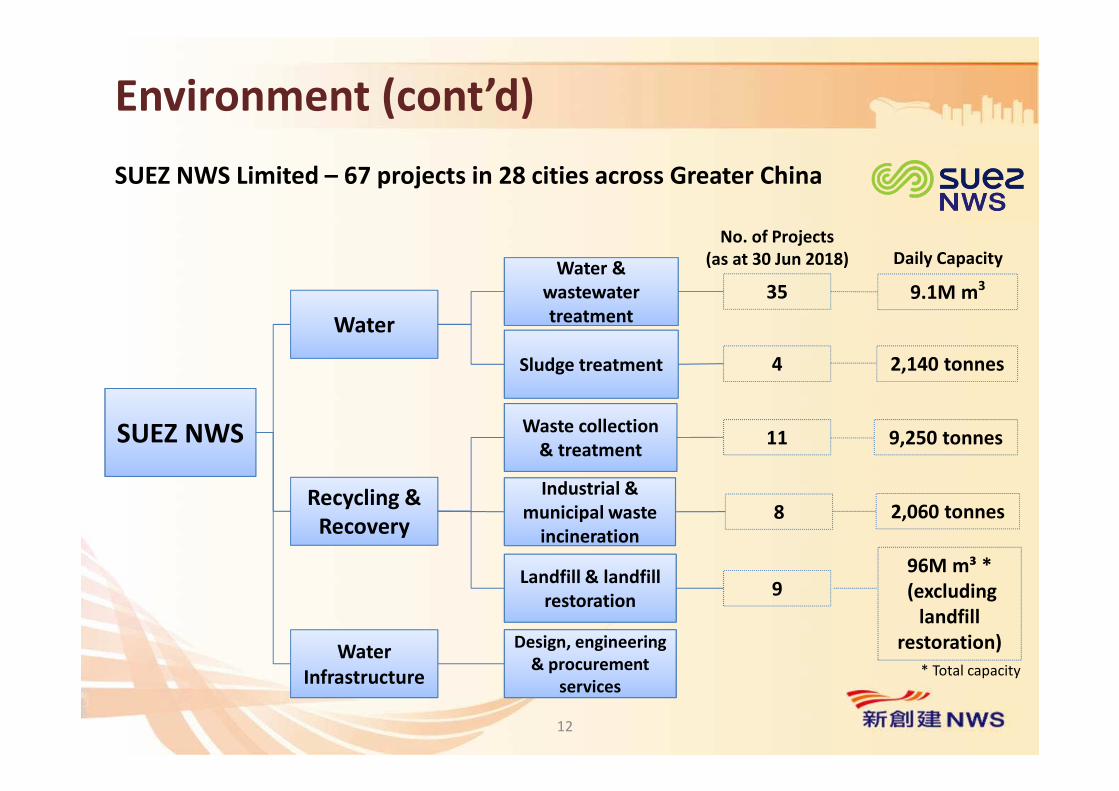
SUEZ NWS
Recycling &
Recovery
Water
Water &
treatment
Water &
wastewater
treatment
Sludge treatment
Industrial &
incineration
Industrial &
municipal waste
incineration
Waste collection
& treatment
Landfill & landfill
restoration
4
11
8
9
9.1M m335
2,140 tonnes
9,250 tonnes
2,060 tonnes
No. of Projects
(as at 30 Jun 2018) Daily Capacity
Water
Infrastructure
Design, engineering
& procurement
services
Environment (cont’d)
12
SUEZ NWS Limited – 67 projects in 28 cities across Greater China
96M m³ *
(excluding
landfill
restoration)
* Total capacity

0
200
400
600
800
FY2017 FY2018
13
Logistics
HKHKHKHK$’M$’M$’M$’M
AOP
� ATL Logistics Centre
� 97.2% average occupancy rate;
average rental up 4%
� HK$400 million renovation to be
completed in 2H2018
� Xiamen Container Terminal Group
� Stable throughput, up by 1% to
over 8.2M TEUs
� Tianjin port projects
� Throughput up 7% to 3.8M TEUs
655655655655641641641641
(+2%)(+2%)(+2%)(+2%)
For the year ended30 Jun

14
Logistics (cont’d)
� China United Int’l Rail Containers (CUIRC)
中鐵聯集
� Stable growth momentum with
throughput up 8% to over 2.7M TEUs
� Europe bound international block-train
services from five terminals*
� Guangzhou terminal under planning
10 terminals in operation
* Chongqing Qingdao
* Chengdu Kunming
* Zhengzhou Tianjin
* Wuhan Dalian
* Xian Urumqi

0
200
400
600
800
FY2017 FY2018
15
Aviation
For the year ended 30 Jun
HK$’MHK$’MHK$’MHK$’M
� Aircraft Leasing
� Robust growth - acquisition of Sky
Aviation Leasing International Limited
and direct orders
� Fleet of owned, managed and
committed aircraft increased rapidly
within three years from 27 to 223
aircraft
� Beijing Capital International Airport Co.,
Ltd.
� Disposed 208M shares in Jan 2018
� Remaining shareholding of 240M
shares reclassified as an available-for-
sale financial asset
695695695695
611611611611
(+14%)(+14%)(+14%)(+14%)
AOP
16
Performance of Services Division
Facilities Management
Construction & Transport

Services - AOP Breakdown
For the year
ended 30 June2018
(HK$’M)
2017
(HK$’M)
Change %
Facilities Management (73.1) 301.1 124
Construction & Transport 1,212.9 1,131.8 7
Strategic Investments 301.1 284.5 6
Total 1,440.9 1,717.4 16
17

(100)
0
100
200
300
400
FY2017 FY2018
Facilities Management
HKHKHKHK$’M$’M$’M$’M
For the year ended 30 Jun � HKCEC
� Won Phase II contract to 2028
through a global tender exercise
� Stable revenue growth with over
1,000 events held in FY2018
� Free Duty
� Performance impacted by
operating costs and sluggish
tourist spending
� Clear signs of recovery in second
half of FY2018
(73)(73)(73)(73)
301301301301
((((----124%)124%)124%)124%)
18
AOP

19
Facilities Management (cont’d)
� Patient volume ramp-up meets
expectation
� Full range of specialties in good
progress
� 24-hour clinic in operation since
Dec 2017
� Total of 1,000 permanent staff,
plus over 800 visiting doctors
� Gleneagles Hong Kong Hospital
0
200
400
600
800
1,000
1,200
1,400
FY2017 FY2018
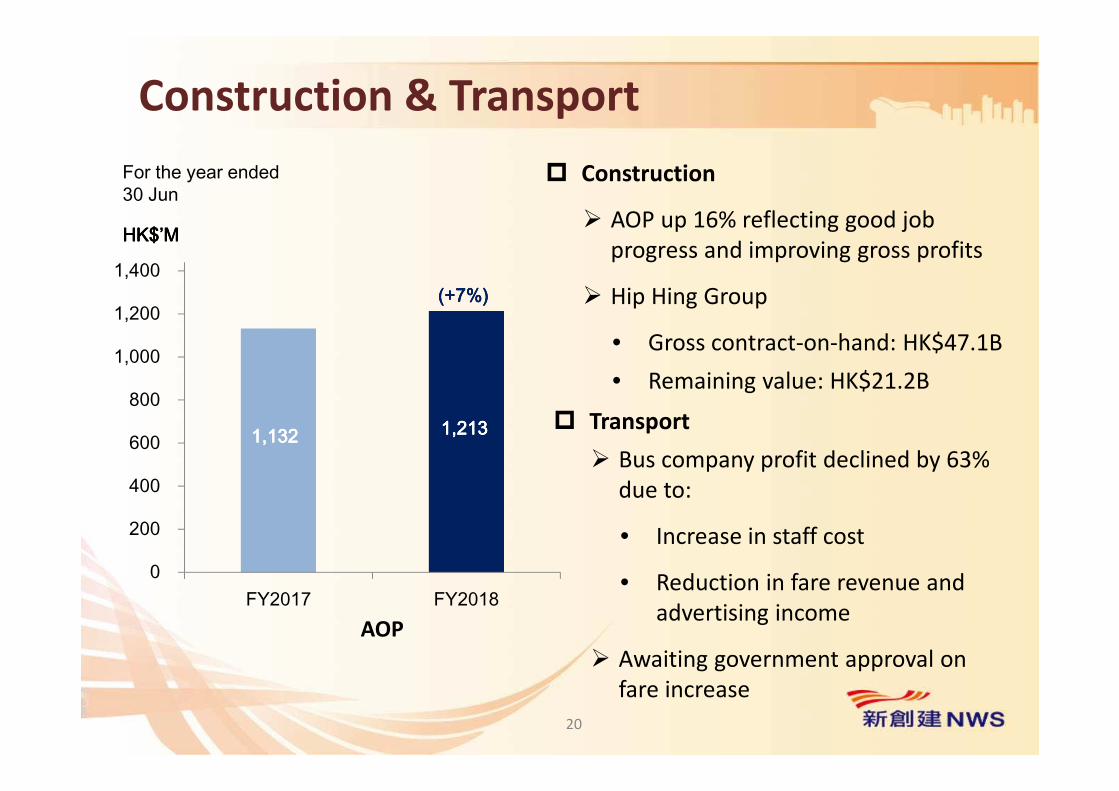
Construction & Transport
� Construction
� AOP up 16% reflecting good job
progress and improving gross profits
� Hip Hing Group
• Gross contract-on-hand: HK$47.1B
• Remaining value: HK$21.2B
HKHKHKHK$’M$’M$’M$’M
AOP
1,1321,1321,1321,132 1,2131,2131,2131,213
(+7%)(+7%)(+7%)(+7%)
20
For the year ended 30 Jun
� Transport
� Bus company profit declined by 63%
due to:
• Increase in staff cost
• Reduction in fare revenue and
advertising income
� Awaiting government approval on
fare increase

Mid- to long-term growth drivers:
� Roads
� Sustained double digit growth in traffic volume
� Environment
� Continue to leverage government environmental policies
� Construction
� Continue to benefit from the buoyant construction market in Hong Kong
� Aircraft Leasing
� Robust global air travel demand - aircraft leasing accorded high priority in
our investment strategy
21
Business Outlook

Aircraft Leasing
� Goshawk Aviation Limited
� 50/50 aircraft leasing JV with Chow Tai Fook
Enterprises, headquartered in Dublin with a
regional office set up in Hong Kong
� Young, liquid fleet (average 3.5 years) with
long leases attached (average 7.4 years
remaining)
� Acquired Sky Aviation Leasing International
Limited in Jun 2018, adding 51 aircraft and
increased its owned, managed and committed
fleet to 183 aircraft
� Subsequent first direct orders with Airbus and
Boeing for 40 new aircraft, further expanded
the fleet to 223 aircraft valued at US$11.4B
22

23
Aircraft Leasing (cont’d)
Goshawk’s Customer Composition (excluding direct orders)
More diversified airline lessees
and balanced geographical
spread resulted from fleet
expansion
Aircraft Airline Countries
Jun 2018 183 64 34
Feb 2015 27 15 13
APAC 50%
Europe 18%North America
10%
Others 9%
Middle East 13%

24
Business
Strategy
Risk
Management
An integrated solution provider with strengthening capabilities in:
� Core portfolio management
� Portfolio acquisition and merger
� Trading
� Servicing
� Focus on high demand of young, fuel efficient, new technology
aircraft
� Balanced customer base, geographical spread and staggering
leasing periods
� Best-in-class risk management processes and credit risk team
Aircraft Leasing (cont’d)
Financing
Strategy
� Prudent approach, low corporate leverage of around 70%
� Diversify funding source and location. Matching lease and
debt maturity as close as possible
� Aim to achieve public investment grade credit rating

25
Q&A Session