Embed Size (px)
Citation preview
8/7/2019 NWEA Complete Norms2008
http://slidepdf.com/reader/full/nwea-complete-norms2008 1/170
8/7/2019 NWEA Complete Norms2008
http://slidepdf.com/reader/full/nwea-complete-norms2008 2/170
i i | N W E A 2 0 0 8 R I T S c a l e N o r m s
© Northwest Evaluation Association, Lake Oswego, Oregon, 2008
Copyright © 2008 Northwest Evaluation Association
All rights reserved. No part of this manual may be reproduced or utilized in any form or by anymeans, electronic or mechanical, including photocopying, recording, or by any information storage
and retrieval system, without written permission from NWEA.
Northwest Evaluation Association5885 SW Meadows Road, Suite 200Lake Oswego, OR 97035-3256
www.nwea.org Tel 503-624-1951Fax 503-639-7873Email [email protected]
8/7/2019 NWEA Complete Norms2008
http://slidepdf.com/reader/full/nwea-complete-norms2008 3/170
N W E A 2 0 0 8 R I T S c a l e N o r m s | i i i
© Northwest Evaluation Association, Lake Oswego, Oregon, 2008
Contents
Prologue ............................................................................................................................. ix
CHAPTER 1 – Introduction ................................................................................................ 1
CHAPTER 2 – Procedures for Developing the Norms ................................................... 3
Sample Development……………………………………………………….………..… ...... 3
General Criteria for Inclusion of Candidate Test Event Records and Test Histories .... 3
Test Event Samples for Norms…………………………………………………….….. ...... 5
Development of Growth Norms…………………………………………………….…. ....... 8
Reading, language usage, and mathematics .……………………………………..… ..... 8
General science, science concepts and processes, and MAP-PG………………. ........ 12
CHAPTER 3 - Norming Samples Characteristics ………………………………….……… 15
Geographic characteristics …………………………………………………………… ........ 22
Ethnic characteristics …………………………………………………………………… ...... 25
CHAPTER 4 – Grade Level Growth and Status Norms ………………………………. ...... 29
Grades 2 through 11 – Standard MAP ……………………………………………… ......... 30
Grades Kindergarten and 1 – MAP for Primary Grades ................................................ 38
CHAPTER 5 – Growth by RIT Level ………………………………………………………… .. 39
CHAPTER 6 – Achievement Growth: Observed and Modeled ………………………… .. 115
What do we gain (or lose) by modeling achievement growth rather than using observed difference scores? ………………………………………..…… ....... 117
Conclusions ………………………………………………………………………..…… ........ 123
References …………………………………………………………………………….… ............ 125
APPENDIX A
RIT Score to Percentile Rank Conversion Tables for Reading,Language Usage, Mathematics, Upper Level Mathematics, GeneralScience Topics, and Science Concepts and Processes – Beginning,Middle and End of Instructional Year ………………………………………………… ...... 127
Reading …………………………………………………………………………..……… ....... 128-133Language ………………………………………………………………………………… ...... 134-139
8/7/2019 NWEA Complete Norms2008
http://slidepdf.com/reader/full/nwea-complete-norms2008 4/170
i v | N W E A 2 0 0 8 R I T S c a l e N o r m s
© Northwest Evaluation Association, Lake Oswego, Oregon, 2008
Mathematics …………………………………………………………………………...… ...... 140-145General Science ………………………………………………………………………… ...... 146-151Science Concepts and Processes ………………………………………………….… ....... 152-157Upper Level Mathematics……………………………………………………………… ....... 158
APPENDIX BTransition from 2005 to 2008 Norms ………………………………………………… ........ 159
8/7/2019 NWEA Complete Norms2008
http://slidepdf.com/reader/full/nwea-complete-norms2008 5/170
N W E A 2 0 0 8 R I T S c a l e N o r m s | v
© Northwest Evaluation Association, Lake Oswego, Oregon, 2008
TablesCHAPTER 2 – Procedures for Developing the Norms ................................................... 3
Table 2.1: Target Cell Proportions for Reading, Language Usage, andMathematics Status Norms Samples……………………………………….…… ....... 7
Table 2.2: Median, Mean, and Standard Deviation (SD) of InstructionalWeeks by Total Number of Test Events in Student Test Histories - Grade 4MATHEMATICS - Initial RIT 202……………………………………………..….. ....... 12
CHAPTER 3 - Norming Samples Characteristics ………………………………….……… 15
Table 3.1a: Candidate Test Record Pool Available for Beginning of Year Status Norms ……………………………………………………………………… ........ 16
Table 3.1b: Candidate Test Record Pool Available for End of Year Status Norms ...... 16
Table 3.2a: Sample Sizes for Beginning of Year Status Norms by Subjectand Grade Level …………………………………………………………………… ...... 17
Table 3.2b: Sample Sizes for End of Year Status Norms by Subject andGrade Level ………………………………………………………………………… ...... 17
Table 3.3: Local School District Information from NCES Common Core of Data and from Status Norms Candidate Pool (Across Reading,Language Usage, and Mathematics) by District Locale Classification ……… ....... 19
Table 3.4: Local Regular and Alternative School Information from NCESCommon Core of Data and from Status Norms Samples (Across Reading,Language Usage, and Mathematics) by School Locale Classification ……… ....... 20
Table 3.5: Title 1 Eligible Local Regular and Alternative Schools in theNCES Common Core of Data and in the Status Norms Candidate Pools(Across Reading, Language Usage, and Mathematics) by School LocaleClassification ……………………………………… .................................................... 21
Table 3.6: Free and Reduced Price Lunch Program Participation by LocalRegular and Alternative Schools in the NCES Common Core of Data andin the Status Norms Candidate Pools (Across Reading, Language Usage,and Mathematics) by School Locale Classification …………………………… ........ 22
Table 3.7: Number of Students in the Norming Sample by State by Gradeand Across Subjects for Tests Taken in the Beginning of Year TimeFrame of the 2006-2007 School Year ……………………………………….… ........ 23
Table 3.8: Number of Students in the Norming Sample by State byGrade and Across Subjects for Tests Taken in the End of Year TimeFrame of the 2006-2007 School Year ……………………………………..…… ........ 24
8/7/2019 NWEA Complete Norms2008
http://slidepdf.com/reader/full/nwea-complete-norms2008 6/170
v i | N W E A 2 0 0 8 R I T S c a l e N o r m s
© Northwest Evaluation Association, Lake Oswego, Oregon, 2008
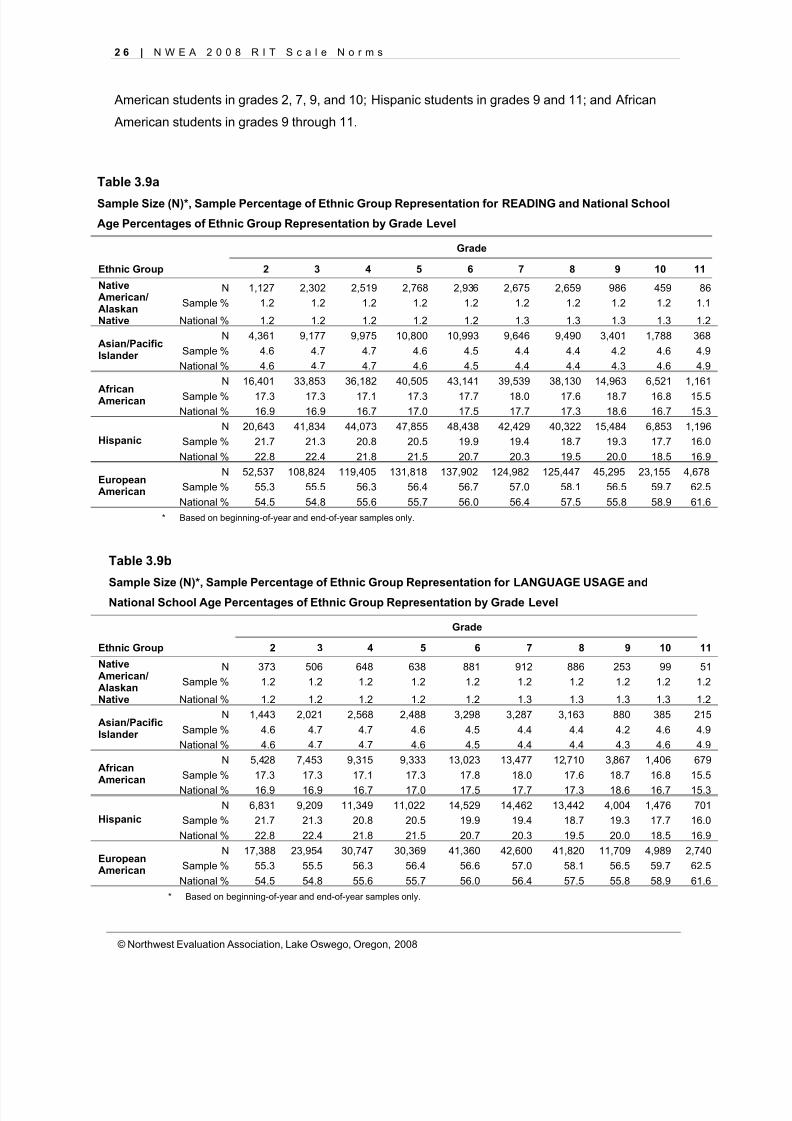
Table 3.9a: Sample Size (N), Sample Percentage of Ethnic GroupRepresentation for READING and National School Age Percentages of Ethnic Group Representation by Grade Level ........................................................ 26
Table 3.9b: Sample Size (N), Sample Percentage of Ethnic GroupRepresentation for LANGUAGE USAGE and National School AgePercentages of Ethnic Group Representation by Grade Level ……………… ........ 26
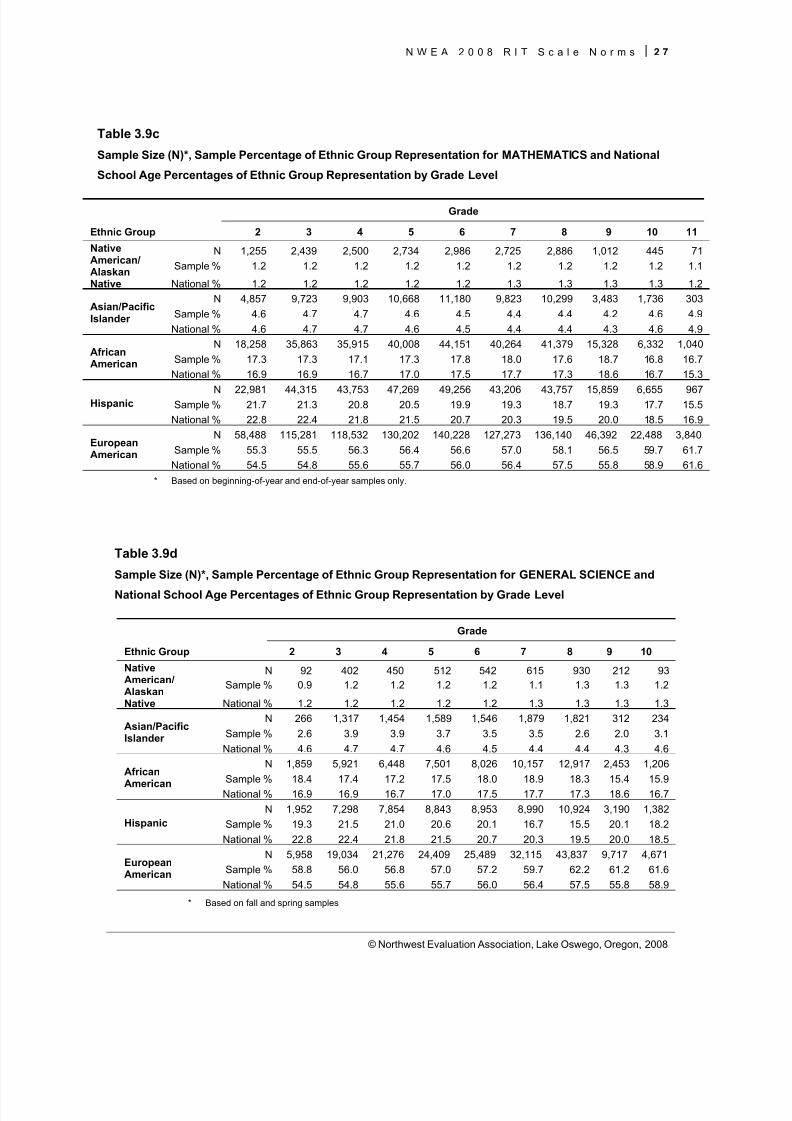
Table 3.9c: Sample Size (N), Sample Percentage of Ethnic GroupRepresentation for MATHEMATICS and National School Age Percentages of Ethnic Group Representation by Grade Level ........................................................ 27
Table 3.9d: Sample Size (N), Sample Percentage of Ethnic GroupRepresentation for GENERAL SCIENCE and National School AgePercentages of Ethnic Group Representation by Grade Level ……………… ........ 27
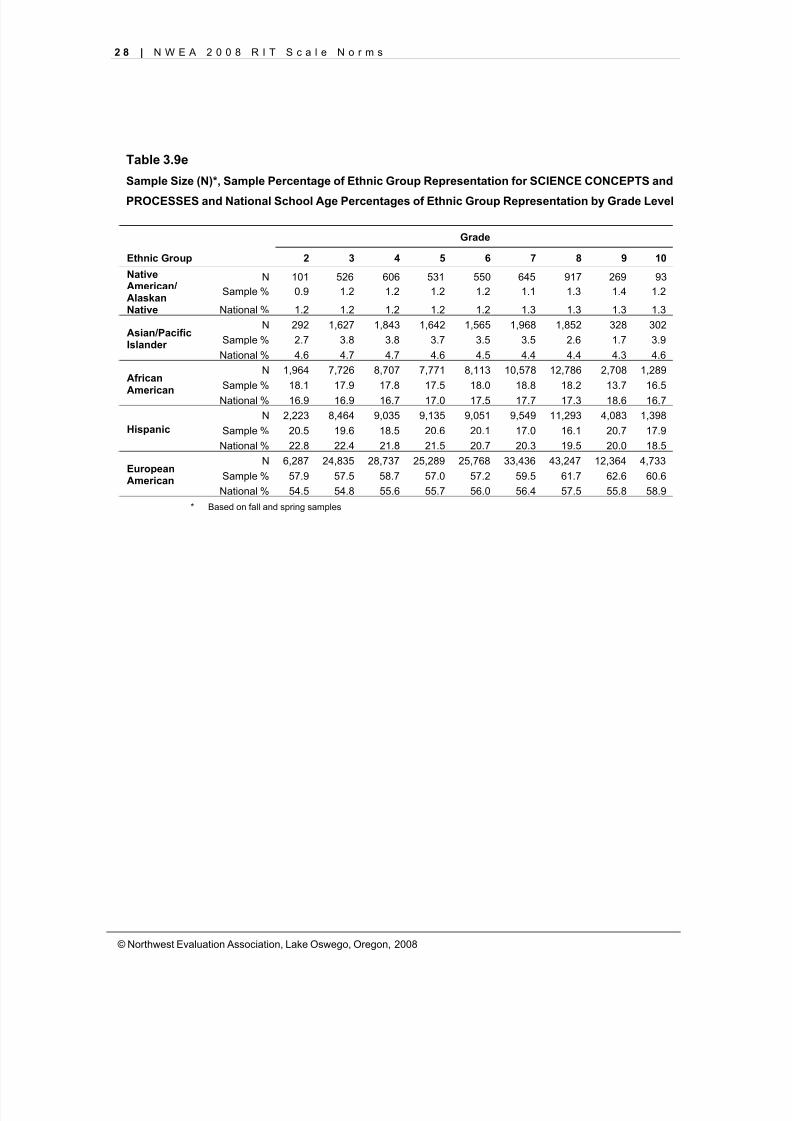
Table 3.9e: Sample Size (N), Sample Percentage of Ethnic Group
Representation for SCIENCE CONCEPTS and PROCESSES and NationalSchool Age Percentages of Ethnic Group Representation by Grade Level ……… 28
CHAPTER 4 – Grade Level Growth and Status Norms ………………………………. ...... 29
Table 4.1a: READING - Modeled Growth Means, Standard Deviation of Individual Test Scores Around Growth Trajectories (SD), Numbers of Students (N), and Mean Observed Initial RIT for Four Instructional TimePeriods ……………………………………………………………………………… ...... 32
Table 4.1b: READING - Medians, Means, Standard Deviations (SD) andNumbers of Students (N) by Grade Level of Test Events Randomly Selectedfrom Ethnicity and School Level Poverty Stratification Cells and Meetingthe Beginning, Middle and End of Year Time Frame Criteria ………………… ....... 32
Table 4.1c: READING - Differences In Medians, Means and Numbers of Students Between Stratified Samples and the Student Candidate Pool asIt Would Have Been Included Using the 2005 Norm Study Inclusion Criteria(Stratified Sample Minus Candidate Pool Values) …………………………… ......... 32
Table 4.2a: LANGUAGE USAGE - Modeled Growth Means, StandardDeviation of Individual Test Scores Around Growth Trajectories (SD),Numbers of Students (N), and Mean Observed Initial RIT for Four
Instructional Time Periods …………………………………………………..…… ...... 33Table 4.2b: LANGUAGE USAGE - Medians, Means, Standard
Deviations (SD) and Numbers of Students (N) by Grade Level of TestEvents Randomly Selected from Ethnicity and School Level PovertyStratification Cells and Meeting the Beginning, Middle and End of Year Time Frame Criteria …………………………………………………………..…… ...... 33
8/7/2019 NWEA Complete Norms2008
http://slidepdf.com/reader/full/nwea-complete-norms2008 7/170
N W E A 2 0 0 8 R I T S c a l e N o r m s | v i i
© Northwest Evaluation Association, Lake Oswego, Oregon, 2008
Table 4.2c: LANGUAGE USAGE - Differences In Medians, Means andNumbers of Students Between Stratified Samples and the StudentCandidate Pool as It Would Have Been Included Using the 2005 NormStudy Inclusion Criteria (Stratified Sample Minus Candidate Pool Values)…. ...... 33
Table 4.3a: MATHEMATICS - Modeled Growth Means, StandardDeviation of Individual Test Scores Around Growth Trajectories (SD),Numbers of Students (N), and Mean Observed Initial RIT for Four Instructional Time Periods…………………………………………………...…… ...... 34
Table 4.3b: MATHEMATICS - Medians, Means, Standard Deviations(SD) and Numbers of Students (N) by Grade Level of Test EventsRandomly Selected from Ethnicity and School Level Poverty StratificationCells and Meeting the Beginning, Middle and End of Year Time FrameCriteria ……………………………………………………………………….……… ...... 34
Table 4.3c: MATHEMATICS - Differences In Medians, Means and
Numbers of Students Between Stratified Samples and the StudentCandidate Pool as It Would Have Been Included Using the 2005 NormStudy Inclusion Criteria (Stratified Sample Minus Candidate Pool Values)…. ...... 34
Table 4.4a: UPPER LEVEL MATHEMATICS - Medians, Means, StandardDeviations (SD) and Numbers of Students (N) for NWEA End-of-CourseMATHEMATICS Tests from Within the End-of-Year Time Frame Criterion... ........ 35
Table 4.4b: UPPER LEVEL MATHEMATICS - Medians, Means, StandardDeviations (SD) and Numbers of Students (N) for NWEA End-of-CourseMATHEMATICS Tests Included Under Same Criteria Used for the 2005Norming Study ………………………………………………………………..…… ....... 35
Table 4.5a: GENERAL SCIENCE TOPICS - Observed Growth Means,Standard Deviations (SD), Numbers of Students (N) in the Intact Group,Mean Initial RIT …………………………………………………………………… ....... 36
Table 4.5b: GENERAL SCIENCE TOPICS - Medians, Means, StandardDeviations (SD) and Numbers of Students (N) by Grade Level andPart of the Year …………………………………………………………………… ....... 36
Table 4.6a: SCIENCE CONCEPTS AND PROCESSES - ObservedGrowth Means, Standard Deviations (SD), Numbers of Students (N) in the
Intact Group, Mean Initial RIT …………………………………………………… ....... 37
Table 4.6b: SCIENCE CONCEPTS AND PROCESSES - Medians, Means,Standard Deviations (SD) and Numbers of Students (N) by Grade Leveland Part of the Year ……………………………………………………………… ....... 37
8/7/2019 NWEA Complete Norms2008
http://slidepdf.com/reader/full/nwea-complete-norms2008 8/170
v i i i | N W E A 2 0 0 8 R I T S c a l e N o r m s
© Northwest Evaluation Association, Lake Oswego, Oregon, 2008
Table 4.7: Observed Fall to Spring Growth Means, Standard Deviations(SD), Numbers of Students (N) and Mean Initial RITs For Primary GradeStudents …………………………………………………………………………… ....... 38
Table 4.8: Primary Grade - Medians, Means, Standard Deviations (SD)and Numbers of Students (N) by Grade Level and Part of the Year ……..… ....... 38
CHAPTER 5 – Growth by RIT Level .................................................................................. 39
Tables 5.1 – 5.9: READING Grades 2-10 Growth Estimates, Standard Deviationof Individual Test Scores Around Growth Trajectories (SD), and Numbersof Students (N) for Four Comparison Intervals ……………………………..… ........ 42-59
Tables 5.10 – 5.18: LANGUAGE USAGE Grades 2-10 Growth Estimates, StandardDeviation of Individual Test Scores Around Growth Trajectories (SD),and Numbers of Students (N) for Four Comparison Intervals ……………… ......... 60-77
Tables 5.19 – 5.27: MATHEMATICS Grades 2-10 Growth Estimates, StandardDeviation of Individual Test Scores Around Growth Trajectories (SD), andNumbers of Students (N) for Four Comparison Intervals ………………….… ....... 78-95
Tables 5.28 – 5.36: GENERAL SCIENCE TOPICS - Grades 2-10 Term-to-TermMean Growth, Standard Deviations (SD) and Numbers of Students (N)by Starting RIT …………………………………………………………………… ........ 96-104
Tables 5.37 – 5.45: SCIENCE CONCEPTS and PROCESSES - Grades 2Term-to-Term Mean Growth, Standard Deviations (SD) and Numbers of Students (N) by Starting RIT …………………………………………………… ........ 105-113
8/7/2019 NWEA Complete Norms2008
http://slidepdf.com/reader/full/nwea-complete-norms2008 9/170
N W E A 2 0 0 8 R I T S c a l e N o r m s | i x
© Northwest Evaluation Association, Lake Oswego, Oregon, 2008
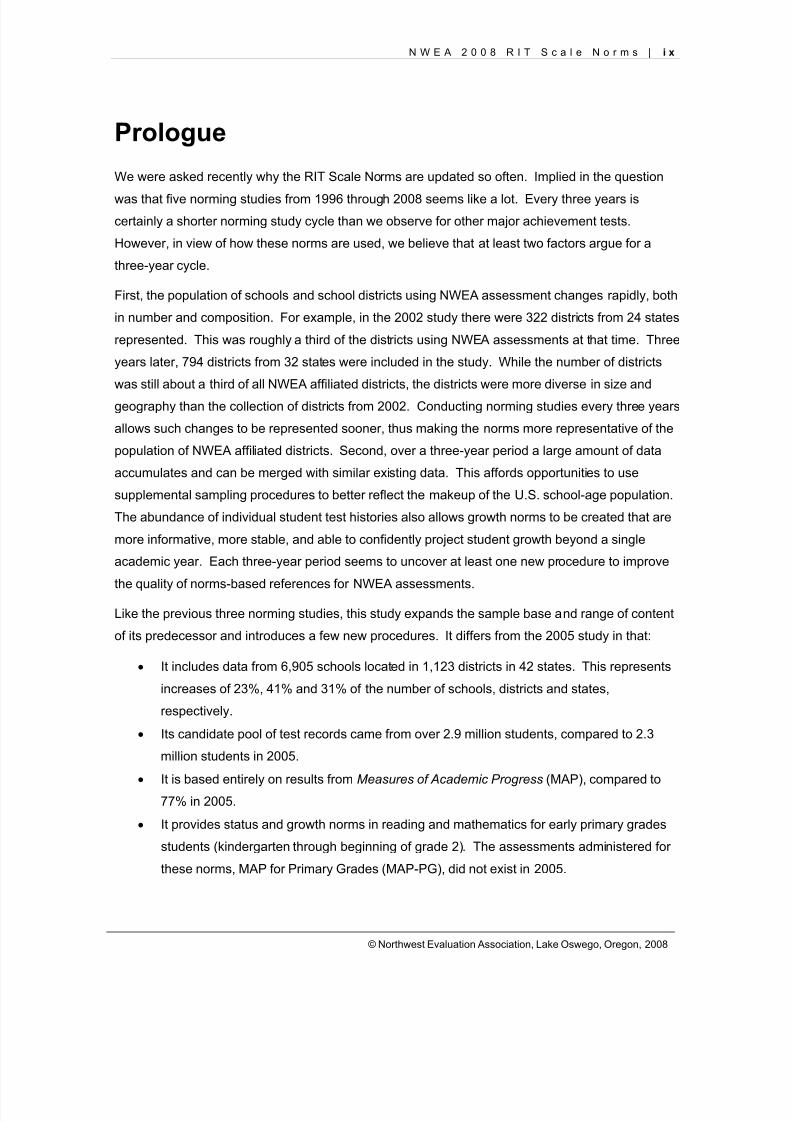
Prologue
We were asked recently why the RIT Scale Norms are updated so often. Implied in the question
was that five norming studies from 1996 through 2008 seems like a lot. Every three years is
certainly a shorter norming study cycle than we observe for other major achievement tests.
However, in view of how these norms are used, we believe that at least two factors argue for a
three-year cycle.
First, the population of schools and school districts using NWEA assessment changes rapidly, both
in number and composition. For example, in the 2002 study there were 322 districts from 24 states
represented. This was roughly a third of the districts using NWEA assessments at that time. Three
years later, 794 districts from 32 states were included in the study. While the number of districts
was still about a third of all NWEA affiliated districts, the districts were more diverse in size and
geography than the collection of districts from 2002. Conducting norming studies every three years
allows such changes to be represented sooner, thus making the norms more representative of the
population of NWEA affiliated districts. Second, over a three-year period a large amount of data
accumulates and can be merged with similar existing data. This affords opportunities to use
supplemental sampling procedures to better reflect the makeup of the U.S. school-age population.
The abundance of individual student test histories also allows growth norms to be created that are
more informative, more stable, and able to confidently project student growth beyond a single
academic year. Each three-year period seems to uncover at least one new procedure to improve
the quality of norms-based references for NWEA assessments.Like the previous three norming studies, this study expands the sample base and range of content
of its predecessor and introduces a few new procedures. It differs from the 2005 study in that:
• It includes data from 6,905 schools located in 1,123 districts in 42 states. This represents
increases of 23%, 41% and 31% of the number of schools, districts and states,
respectively.
• Its candidate pool of test records came from over 2.9 million students, compared to 2.3
million students in 2005.
•
It is based entirely on results from Measures of Academic Progress (MAP), compared to77% in 2005.
• It provides status and growth norms in reading and mathematics for early primary grades
students (kindergarten through beginning of grade 2). The assessments administered for
these norms, MAP for Primary Grades (MAP-PG), did not exist in 2005.
8/7/2019 NWEA Complete Norms2008
http://slidepdf.com/reader/full/nwea-complete-norms2008 10/170
x | N W E A 2 0 0 8 R I T S c a l e N o r m s
© Northwest Evaluation Association, Lake Oswego, Oregon, 2008
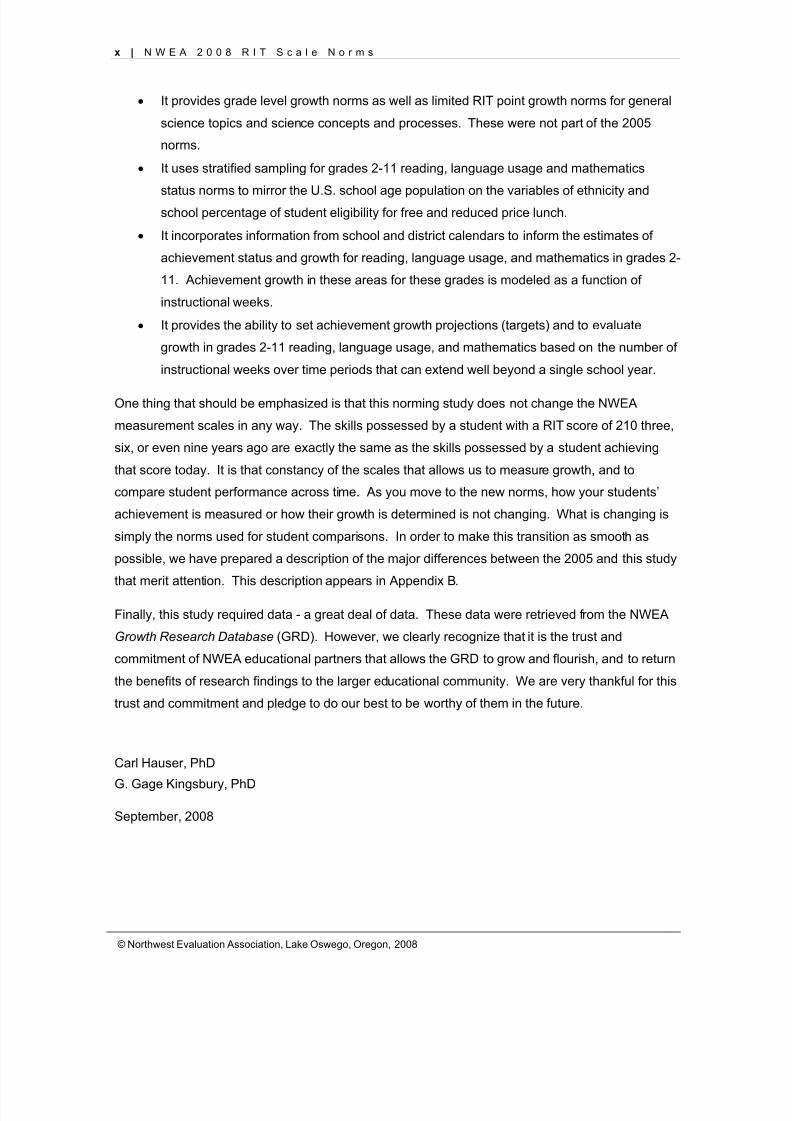
• It provides grade level growth norms as well as limited RIT point growth norms for general
science topics and science concepts and processes. These were not part of the 2005
norms.
• It uses stratified sampling for grades 2-11 reading, language usage and mathematics
status norms to mirror the U.S. school age population on the variables of ethnicity andschool percentage of student eligibility for free and reduced price lunch.
• It incorporates information from school and district calendars to inform the estimates of
achievement status and growth for reading, language usage, and mathematics in grades 2-
11. Achievement growth in these areas for these grades is modeled as a function of
instructional weeks.
• It provides the ability to set achievement growth projections (targets) and to evaluate
growth in grades 2-11 reading, language usage, and mathematics based on the number of
instructional weeks over time periods that can extend well beyond a single school year.
One thing that should be emphasized is that this norming study does not change the NWEA
measurement scales in any way. The skills possessed by a student with a RIT score of 210 three,
six, or even nine years ago are exactly the same as the skills possessed by a student achieving
that score today. It is that constancy of the scales that allows us to measure growth, and to
compare student performance across time. As you move to the new norms, how your students’
achievement is measured or how their growth is determined is not changing. What is changing is
simply the norms used for student comparisons. In order to make this transition as smooth as
possible, we have prepared a description of the major differences between the 2005 and this study
that merit attention. This description appears in Appendix B.
Finally, this study required data - a great deal of data. These data were retrieved from the NWEA
Growth Research Database (GRD). However, we clearly recognize that it is the trust and
commitment of NWEA educational partners that allows the GRD to grow and flourish, and to return
the benefits of research findings to the larger educational community. We are very thankful for this
trust and commitment and pledge to do our best to be worthy of them in the future.
Carl Hauser, PhD
G. Gage Kingsbury, PhD
September, 2008
8/7/2019 NWEA Complete Norms2008
http://slidepdf.com/reader/full/nwea-complete-norms2008 11/170
© Northwest Evaluation Association, Lake Oswego, Oregon, 2008
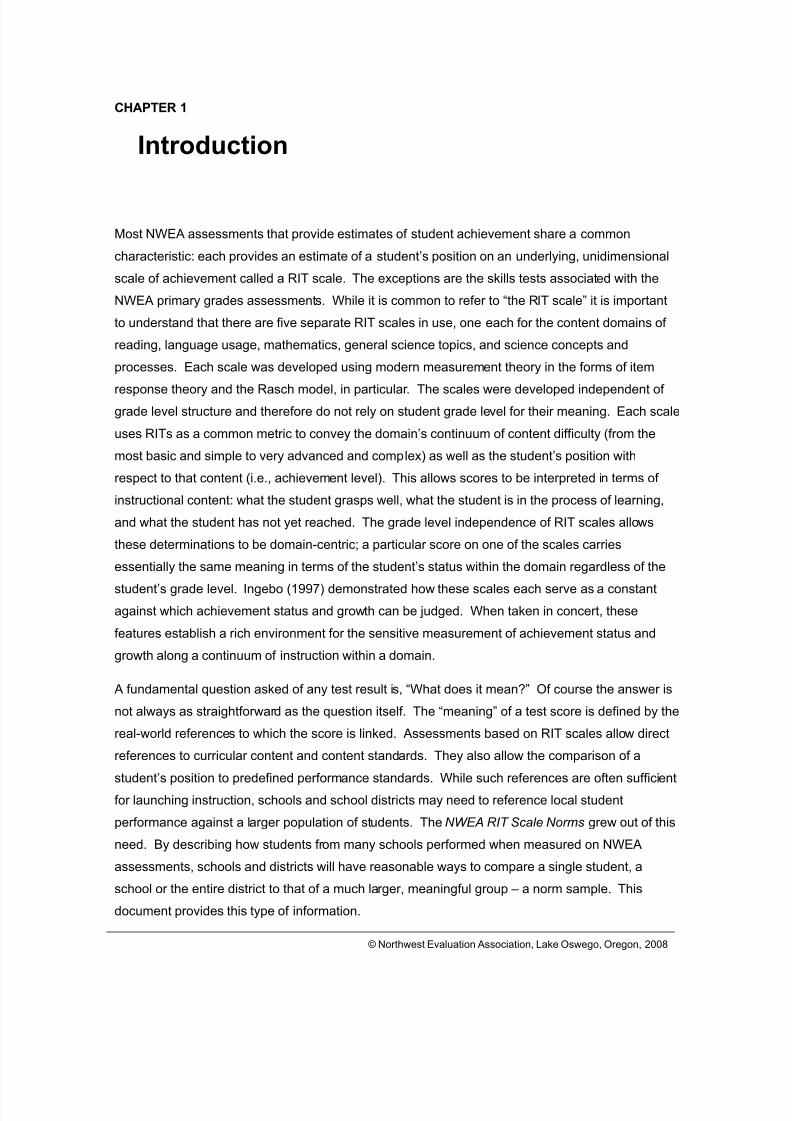
CHAPTER 1
Introduction
Most NWEA assessments that provide estimates of student achievement share a common
characteristic: each provides an estimate of a student’s position on an underlying, unidimensional
scale of achievement called a RIT scale. The exceptions are the skills tests associated with the
NWEA primary grades assessments. While it is common to refer to “the RIT scale” it is important
to understand that there are five separate RIT scales in use, one each for the content domains of
reading, language usage, mathematics, general science topics, and science concepts and
processes. Each scale was developed using modern measurement theory in the forms of item
response theory and the Rasch model, in particular. The scales were developed independent of grade level structure and therefore do not rely on student grade level for their meaning. Each scale
uses RITs as a common metric to convey the domain’s continuum of content difficulty (from the
most basic and simple to very advanced and complex) as well as the student’s position with
respect to that content (i.e., achievement level). This allows scores to be interpreted in terms of
instructional content: what the student grasps well, what the student is in the process of learning,
and what the student has not yet reached. The grade level independence of RIT scales allows
these determinations to be domain-centric; a particular score on one of the scales carries
essentially the same meaning in terms of the student’s status within the domain regardless of the
student’s grade level. Ingebo (1997) demonstrated how these scales each serve as a constantagainst which achievement status and growth can be judged. When taken in concert, these
features establish a rich environment for the sensitive measurement of achievement status and
growth along a continuum of instruction within a domain.
A fundamental question asked of any test result is, “What does it mean?” Of course the answer is
not always as straightforward as the question itself. The “meaning” of a test score is defined by the
real-world references to which the score is linked. Assessments based on RIT scales allow direct
references to curricular content and content standards. They also allow the comparison of a
student’s position to predefined performance standards. While such references are often sufficient
for launching instruction, schools and school districts may need to reference local student
performance against a larger population of students. The NWEA RIT Scale Norms grew out of this
need. By describing how students from many schools performed when measured on NWEA
assessments, schools and districts will have reasonable ways to compare a single student, a
school or the entire district to that of a much larger, meaningful group – a norm sample. This
document provides this type of information.
8/7/2019 NWEA Complete Norms2008
http://slidepdf.com/reader/full/nwea-complete-norms2008 12/170
2 | N W E A 2 0 0 8 R I T S c a l e N o r m s
© Northwest Evaluation Association, Lake Oswego, Oregon, 2008
Norming studies carried out by many test publishers often follow a common pattern. A single test
or perhaps several parallel forms of a single test are administered to and scaled using samples of
students from a selected population. A key outcome of these studies is often a set of auxiliary
scores such as percentile ranks or normal curve equivalent (NCE) scores. When parallel forms are
involved, these auxiliary scores apply to the reference test as well as its parallel versions. Norms
developed in this manner might be referred to as test or form-centric. That is, the test or test form
and the scale on which performance is reported are inextricably linked; scale score references
apply only to the reference test form and its associated parallel forms. NWEA uses a somewhat
different approach.
All of the tests used in this study were Measures of Academic Progress (MAP) assessments. All
tests were built by NWEA staff and are similar in length and content within a domain. However,
unlike traditional tests, each student is administered a test with items chosen for the student as the
test progresses. Individual tests are constructed by selecting items from banks of Rasch-
calibrated items. As a student proceeds through a test, the difficulty of items presented is adapted
to the student’s level of performance on all previous items. This has the effect of maximizing the
information in the test score. Since each test item has been calibrated to the same scale using
item response theory, scores from different tests in the same domain can be interpreted in the
same manner; all test scores refer to the same underlying scale.
Therefore, this document describes norms related to scales of measurement rather than norms
related to an individual test or set of test forms. The resulting set of norms is independent of the
specific content of any particular test. Updates to test content can be made with the confidence
that percentile ranks, and status and growth norms, will still be useful after the update.
A discussion of measurement aspects of MAP assessments is included in the Technical Manual for
the NWEA Measures of Academic Progress (NWEA, 2008).
8/7/2019 NWEA Complete Norms2008
http://slidepdf.com/reader/full/nwea-complete-norms2008 13/170
N W E A 2 0 0 8 R I T S c a l e N o r m s 3
© Northwest Evaluation Association, Lake Oswego, Oregon, 2008
CHAPTER 2
Procedures for Developing the Norms
Sample Development
General Criteria for Inclusion of Candidate Test Event Records and Test Histories
Grades 2 through 11 – Standard MAP. Test event records from all NWEA MAP test events that
had been administered as part of a school – or school district – sponsored testing program in fall
2002 through fall 2007 were considered as candidates for inclusion in the study. The content
domains for these tests included reading, language usage, mathematics, science concepts and
processes, and general science topics. All tests were built around a multi-goal structure that was
based on a set of content standards. In most instances, the content standards from the state in
which the test was to be administered were used to structure the test’s content. Mathematics test
content was partitioned into blocks that were bounded by the content specifications of multiple
grades. The objectives and skills that defined these boundaries were those provided in the state’s
content specifications for grades 2 through 5 and for grades 6 and above. When a student’s
instruction fell outside this basic structure, other MAP tests were used (such as MAP for primary
grades tests and upper level mathematics tests.
In order to be included in the candidate pool for the study, each test record from a standard MAP
test was required to meet all of several conditions. These conditions were imposed to ensure that
test scores were valid and could be associated with segments of the U.S. school age population in
terms of ethnic background and school level poverty. The conditions also ensured that the test
events could be tied to the amount of instructional time that had elapsed from the beginning of the
school year or from the last test event for the student prior to taking the test of interest. The
specific criteria required that each standard MAP test record included data to verify that the test
event:
• Represented a complete, normally terminated test administration
• Was one for which at least 40% of the items were answered correctly – a fairly liberal
lower limit for computerized adaptive tests
• Came from a school for which the 2006-2007 instructional calendar was known
• Came from a school which administered the MAP tests to at least 80% of its students
who were in the same grade in the same testing time frame (term)
8/7/2019 NWEA Complete Norms2008
http://slidepdf.com/reader/full/nwea-complete-norms2008 14/170
4 | N W E A 2 0 0 8 R I T S c a l e N o r m s
© Northwest Evaluation Association, Lake Oswego, Oregon, 2008
• Came from a school that was included in the National Center for Education Statistics
2005 Common Core of Data and had non-missing school level information concerning
the number of students who were eligible to receive free and reduced priced lunches
• Came from a school where the specific MAP test was not part of the school’s first term
of administering the test
• Was the more precise (lower standard error of measurement) of two test events in the
same domain area that were administered within a three-week period of one another
• Included the student’s ethnic code on the test event record.
Early primary grades. MAP test events from the early primary grades test, MAP-PG, were
included in the study using different criteria than those used for standard MAP tests. Different
criteria were used for several reasons. Initially, there were many fewer test events available for
inclusion; MAP-PG only had adequate numbers of test events from fall 2006 through spring 2007.Given this limited time frame, the necessity of district calendar information became moot. MAP-PG
tests also involve different test administration procedures than standard MAP tests. Tests in each
domain (reading and mathematics) are administered in two 30-item parts to accommodate younger
students’ attention levels. Due to the two-part nature of the tests, procedures used for calculating
the overall score for the domain in MAP-PG tests are somewhat different than those used for
standard MAP tests. For a standard MAP test, domain scores can be made available immediately
after the student has responded to the last item. For the MAP-PG tests, only the partial-domain
score can be made available since only half the goal areas in the domain are sampled in a single
test. To compute the RIT score for the entire domain (referred to as the “combined score”), both
partial-domain tests must be completed within 28 days of one another. A separate scoring process
is then used to combine the response vectors from each partial test to score them as a single test.
The resulting total score is different than a simple average of the two partial domain scores except
in the special case of when a student correctly answers exactly 50% of the items on each of the
two partial-domain tests. Only entire domain RIT scores are used in this study.
The conditions set for standard MAP test events were relaxed for MAP-PG tests. Criteria for
including MAP-PG test events were simply that the event:
• Represent a complete (both parts with a single score), normally terminated testadministration
• Be one for which at least 35% of the items were answered correctly
• Come from a school which administered the same test to at least 80% of its students
who were in the same grade in the same testing time frame (term)
8/7/2019 NWEA Complete Norms2008
http://slidepdf.com/reader/full/nwea-complete-norms2008 15/170
N W E A 2 0 0 8 R I T S c a l e N o r m s 5
© Northwest Evaluation Association, Lake Oswego, Oregon, 2008
• Was the more precise (lower standard error of measurement) of two test events in the
same domain area that were administered within a three-week period of one another
All MAP-PG test records that met these criteria from fall 2006, winter 2007, and spring 2007 were
included in the study.
Test Event Samples for Norms
Reading, language usage, and mathematics from standard MAP – Grades 2-11. Test event
samples were created using a two-stage process. The first stage involved using school district
calendar information to make estimates of instructional time that had elapsed between the start of a
school year and a test event or between two test events. In the second stage, student ethnic
background information and their school’s reported level of free and reduced price lunch eligibility
were used to stratify the samples in proportion to the U.S. school age population. This stratification
was only applied to the creation of status norms. Growth norms used all test events that met thegeneral criteria cited above and were one of at least three test events for the same student in the
same content domain.
Estimates of instructional days. Instructional time was an essential element in the creation of
both status norms and growth norms for students who were administered standard MAP in grades
2 through 11. The initial unit of time was an instructional day. Each district’s unique calendar for
the 2006-2007 academic year served as an anchor. Individual district (or school) calendar
information was extracted from data provided from Mountain Measurement, Inc. and the Rentrak
Corporation. This information was most frequently collected using personal interviews of district
level personnel. For each district, the first day of the school year, the last day of the school year,
and each week day between these two days for which no instruction was provided were identified.
Days that represented unanticipated instructional or non-instructional days (e.g. school closure for
an emergency) were not captured. All schools in the district were assigned the resulting schedule
unless they were identified as operating on a known alternative schedule. In those cases the
alternative schedule was assigned to the school. The process for identifying alternative schedules
was inconsistent and is a known source of variability in the instructional time data. While we
suspect that the magnitude of this variability is comparatively small, a formal estimate of its true
magnitude was not done and therefore represents a limitation in this study.
Each district’s (or school’s) base calendar data were used to extrapolate school calendars for
preceding school years, back to the fall of 2002. This was carried out under the assumption that
the pattern of instructional and non-instructional days within an academic year would be relatively
stable from year to year. Instructional days were numbered sequentially by date for each district
beginning with the first instructional day in fall of the 2002-2003 academic year and ending with the
8/7/2019 NWEA Complete Norms2008
http://slidepdf.com/reader/full/nwea-complete-norms2008 16/170
6 | N W E A 2 0 0 8 R I T S c a l e N o r m s
© Northwest Evaluation Association, Lake Oswego, Oregon, 2008
last instructional day in November 2007. The resulting vector of numbered instructional dates was
referenced by test administration date to index the number of instructional days between test
events at the individual student level. These intervals were converted to weeks to make
interpretation easier.
Using the instructional days data, time frames for beginning of year tests, middle of year tests, and
end of year tests were established. All test events that met the initial selection criteria and were
from 2006 and 2007 were used. The variable of interest here was the number of instructional days
that had elapsed from the first day of the school year for the student test taker until the day the
student took the test of interest. The mean and variance of this variable were calculated for each
grade level in each content area and in each of the commonly used nominal testing seasons: fall,
winter, and spring. Results of these calculations were used to establish assessment time frame
criteria. The centers of these time frames were roughly 20 days, 89 days, and 153 days from the
beginning of the academic year of the student’s school for the fall, winter, and spring terms
respectively. A 1.25 standard deviation band placed around these means resulted in
approximately 79% of the test events in each season being included in an interval which ranged
from 5.4 to 6.0 instructional weeks, depending on season, content area and grade level. These
time frames were considerably narrower than those used in previous NWEA norms studies, but
were considered sufficiently wide to represent schools’ most commonly used testing periods. Each
test event included in the status norms was included in one of the three time frames. Test events
falling outside their criterion time frame (based on season, content area, and grade level) were
excluded from consideration in the status norms.
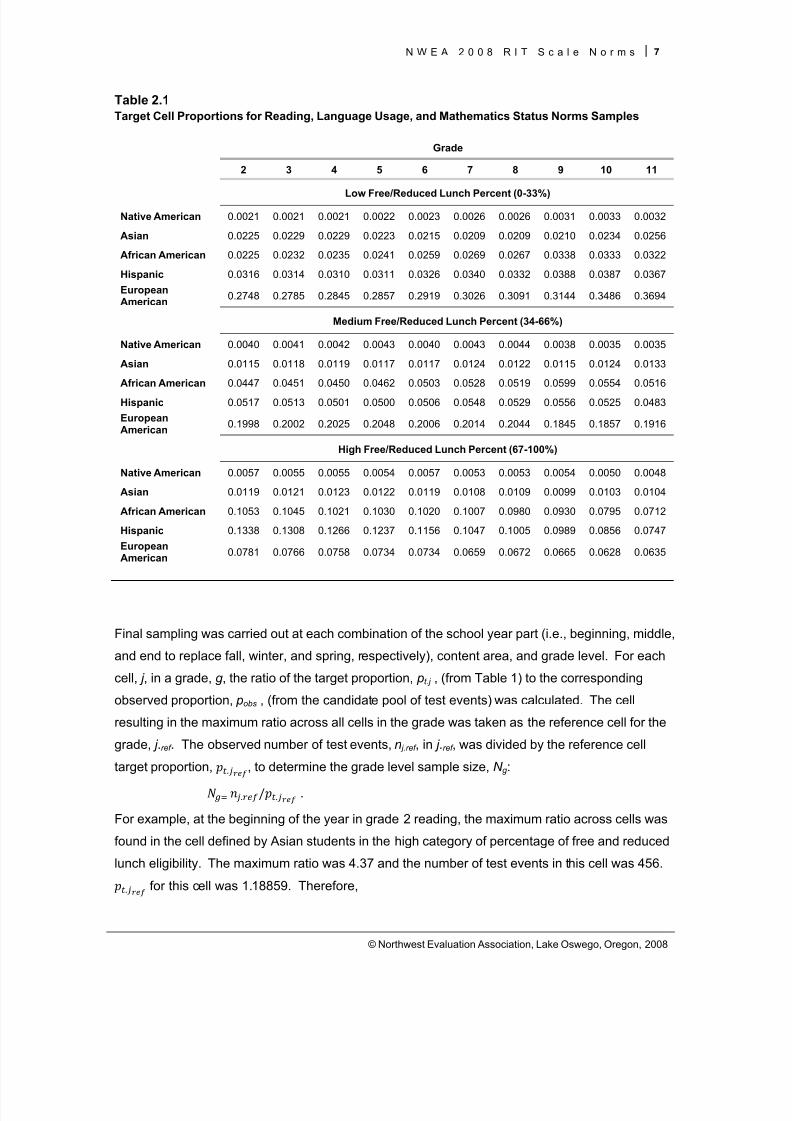
Stratification. The second part to creating status norms samples used the National Center for Education Statistics (NCES) Common Core of Data Public School Universe (CCD-PSU) 2006
dataset. The CCD-PSU was queried across schools by grade level to determine: a) which third of
the grade level distribution of student free and reduced price lunch eligibility each school-grade
combination fell into; and b) the school’s 2005-2006 enrollment in each of five ethnic groups
(Native American, African American, Asian, Hispanic, and European American [Caucasian]). The
combination of these variables formed a 15 cell (3-FRL X 5-ethnic groups) matrix at each grade, 2
through 11. These matrices were used to determine the cell proportions of test events at each
grade level that would comprise the sample for the status norms. The resulting cell proportions are
given in Table 2.1. Each test event included in the status norms was included in one of these cells.
8/7/2019 NWEA Complete Norms2008
http://slidepdf.com/reader/full/nwea-complete-norms2008 17/170
N W E A 2 0 0 8 R I T S c a l e N o r m s 7
© Northwest Evaluation Association, Lake Oswego, Oregon, 2008
Table 2.1Target Cell Proportions for Reading, Language Usage, and Mathematics Status Norms Samples
Grade
2 3 4 5 6 7 8 9 10 11
Low Free/Reduced Lunch Percent (0-33%)
Native American 0.0021 0.0021 0.0021 0.0022 0.0023 0.0026 0.0026 0.0031 0.0033 0.0032
Asian 0.0225 0.0229 0.0229 0.0223 0.0215 0.0209 0.0209 0.0210 0.0234 0.0256
African American 0.0225 0.0232 0.0235 0.0241 0.0259 0.0269 0.0267 0.0338 0.0333 0.0322
Hispanic 0.0316 0.0314 0.0310 0.0311 0.0326 0.0340 0.0332 0.0388 0.0387 0.0367EuropeanAmerican 0.2748 0.2785 0.2845 0.2857 0.2919 0.3026 0.3091 0.3144 0.3486 0.3694
Medium Free/Reduced Lunch Percent (34-66%)
Native American 0.0040 0.0041 0.0042 0.0043 0.0040 0.0043 0.0044 0.0038 0.0035 0.0035
Asian 0.0115 0.0118 0.0119 0.0117 0.0117 0.0124 0.0122 0.0115 0.0124 0.0133
African American 0.0447 0.0451 0.0450 0.0462 0.0503 0.0528 0.0519 0.0599 0.0554 0.0516
Hispanic 0.0517 0.0513 0.0501 0.0500 0.0506 0.0548 0.0529 0.0556 0.0525 0.0483EuropeanAmerican 0.1998 0.2002 0.2025 0.2048 0.2006 0.2014 0.2044 0.1845 0.1857 0.1916
High Free/Reduced Lunch Percent (67-100%)
Native American 0.0057 0.0055 0.0055 0.0054 0.0057 0.0053 0.0053 0.0054 0.0050 0.0048
Asian 0.0119 0.0121 0.0123 0.0122 0.0119 0.0108 0.0109 0.0099 0.0103 0.0104
African American 0.1053 0.1045 0.1021 0.1030 0.1020 0.1007 0.0980 0.0930 0.0795 0.0712
Hispanic 0.1338 0.1308 0.1266 0.1237 0.1156 0.1047 0.1005 0.0989 0.0856 0.0747EuropeanAmerican 0.0781 0.0766 0.0758 0.0734 0.0734 0.0659 0.0672 0.0665 0.0628 0.0635
Final sampling was carried out at each combination of the school year part (i.e., beginning, middle,
and end to replace fall, winter, and spring, respectively), content area, and grade level. For each
cell, j , in a grade, g , the ratio of the target proportion, p t.j , (from Table 1) to the corresponding
observed proportion, pobs , (from the candidate pool of test events) was calculated. The cell
resulting in the maximum ratio across all cells in the grade was taken as the reference cell for the
grade, j .ref . The observed number of test events, n j.ref , in j .ref , was divided by the reference cell
target proportion, . , to determine the grade level sample size, N g :
. / . .
For example, at the beginning of the year in grade 2 reading, the maximum ratio across cells was
found in the cell defined by Asian students in the high category of percentage of free and reduced
lunch eligibility. The maximum ratio was 4.37 and the number of test events in this cell was 456.
. for this cell was 1.18859. Therefore,
8/7/2019 NWEA Complete Norms2008
http://slidepdf.com/reader/full/nwea-complete-norms2008 18/170
8 | N W E A 2 0 0 8 R I T S c a l e N o r m s
© Northwest Evaluation Association, Lake Oswego, Oregon, 2008
.. . 38365.
The sample size for each cell in the grade, n j , was then determined simply by
. · 38365 .
General science and science concepts and processes. Samples for general science and
science concepts and processes were drawn from the fall and spring testing seasons of 2006 and
2007. Test events included were only required to meet the general criteria for inclusion listed
above and the time frame criterion. All of these test events were used for status norms.
Stratification based on ethnic background and school level percentage of free and reduced priced
lunch eligibility was not a part of the selection strategy for status norms. The candidate pool size
and structure could not support this procedure.
Development of Growth Norms
As was the case for the development of status norms, the structure of data available for samples
varied according to how the test was delivered (Standard MAP or MAP-PG) and the content area
involved. Reading, language usage, and mathematics tests taken in standard MAP were the only
test events that were part of individual student test histories extending back to fall 2002. General
science and science concepts and processes test events extended back as far as the fall 2004
testing season. MAP-PG used only test events from the 2006-2007 school year. It is important to
note that the unit of time used in estimating growth in early primary grades and in science was the
testing season while it was instructional weeks for reading, language usage, and mathematics in
grades 2 through 10.
Reading, language usage, and mathematics. Test events were included in samples for growth
norms when they met all of the general criteria for inclusion in the study and were one of at least
three test events in a student’s test history in the same content domain. Samples were formed
from these test histories at each grade level, where the “grade level” identifying the test history was
always the grade level of the first test event in the test history or a part of the test history.
Individual test histories were parceled out in two ways. First, a test event that took place in the first
half of the school year was allowed to be the first test event in a test history represented at a grade
level as long as at least two test events from the same student followed it. This same form of parceling was done for test events that took place in the second half of the school year. The result
of these two procedures resulted in a great deal of overlap of parts of test histories across the span
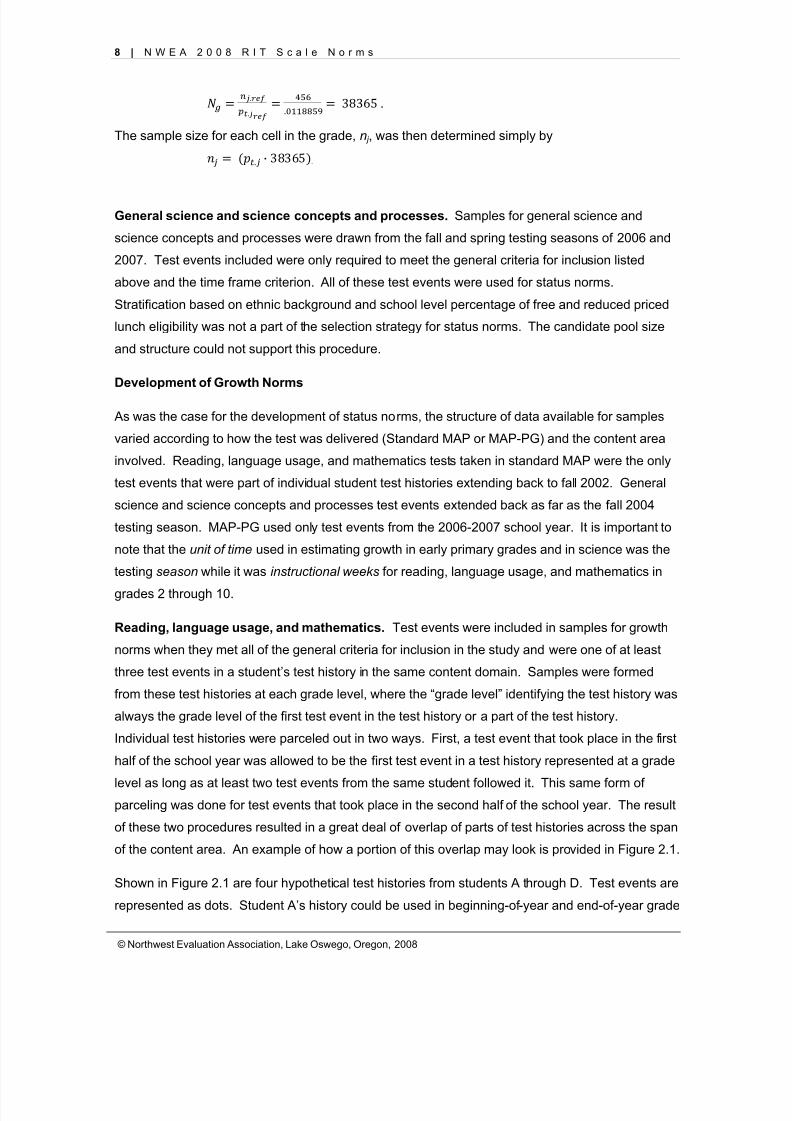
of the content area. An example of how a portion of this overlap may look is provided in Figure 2.1.
Shown in Figure 2.1 are four hypothetical test histories from students A through D. Test events are
represented as dots. Student A’s history could be used in beginning-of-year and end-of-year grade
8/7/2019 NWEA Complete Norms2008
http://slidepdf.com/reader/full/nwea-complete-norms2008 19/170
N W E A 2 0 0 8 R I T S c a l e N o r m s 9
© Northwest Evaluation Association, Lake Oswego, Oregon, 2008
level growth norms for grades 4-7. Student B’s history could only be used for the end-of-year
grade level growth norms for grades 6 and 7. Similarly, the test histories for students C and D
could only be used in beginning-of-grade growth norms for grades 6 and 9, respectively. Stated
slightly differently, the inclusion of a test history or a portion of a test history in grade level growth
norms was based only on when in the school year (beginning or end) the first test event occurred
and how many test events followed it; the particular academic year of the test event was irrelevant.
Figure 2.1. Hypothetical test histories.
Growth estimates. Different methods were used to estimate growth. The method used was
dictated by the data available. For reading, language usage, and mathematics test events that
came from standard MAP tests, a growth modeling approach was used in order to take advantage
of the longitudinal nature of the data. For general science and science concepts and processes as
well as for MAP-PG, the method used in the 2005 norming study was used; the difference in
observed RIT scores was used as the best available estimate for achievement growth.
For reading, language usage, and mathematics, achievement was modeled as a function of
instructional time. Only simple, unconditional linear and quadratic multilevel growth models were
used (Raudenbush & Bryk, 2002; Singer & Willett, 2003). These models took their customaryforms, specifically:
Level 1:
Level 2: ,
AcademicYear
2006-07
2005-06
2004-05
2003-04
2002-03
2 3 4 5 6 7 8 9 10 11
Grade Level
A
B
C
D
Instructionalweeks
8/7/2019 NWEA Complete Norms2008
http://slidepdf.com/reader/full/nwea-complete-norms2008 20/170
1 0 | N W E A 2 0 0 8 R I T S c a l e N o r m s
© Northwest Evaluation Association, Lake Oswego, Oregon, 2008
for the linear model, and
Level 1:
Level 2: ,
,
for the quadratic model.
In these models, Level 1 contains all test events, t, making up the test history for individual student,
i , as well as the measurement error, , the difference between the growth trajectory and the
observed score for test event t . Each test history is nested in a student at Level 2. represents
the number of instructional weeks that a test event, t , is from the beginning of the test history or test
history segment that is being used. The π 0i parameter represents the initial level of achievement
and the remaining π ’s represent the change in Y that is associated with each unit change in W .
The terms , , and are the means of the intercept, and the linear and quadratic change
parameters, respectively. The r ’s are the random effects associated with a particular student in the
estimation of their respective growth parameter, π .
Growth estimates were calculated for each grade level in a content area using both the linear and
the quadratic models cited above. For these estimates at each grade, the first test event for a
student that occurred in the target grade and all subsequent test events for the student were used.
The same procedure was repeated using the last test event for a student that occurred in the targetgrade as the initial reference.
Growth estimates were also calculated for successive starting RIT values across the achievement
range for each grade. This involved an iterative process within the grade level. Each iteration
included the following steps:
1. Select all test histories (or partial histories) where the initial RIT was in a specific five-point
range. The middle value in this range is taken as the reported value.
2. Calculate both the linear and the quadratic growth models (as defined above) on the
selected test histories, when the grade level was below 9; for grades 9 and 10, calculate
only the linear model.
3. For grade levels below 9, capture the parameter estimates for both models as well as the
significance tests, supporting each parameter’s inclusion in the model.
8/7/2019 NWEA Complete Norms2008
http://slidepdf.com/reader/full/nwea-complete-norms2008 21/170
N W E A 2 0 0 8 R I T S c a l e N o r m s 1 1
© Northwest Evaluation Association, Lake Oswego, Oregon, 2008
4. For grade levels below 9, determine if there is an instructional week value, W , that will yield
Y ti(L) = Y ti(Q) . If so, capture that value and assign it to the variable cross-over-point (XOP ).
5. Increment by 1 RIT the last five-point range used and repeat steps 1 through 4 until all test
histories are exhausted or there are insufficient data for stable estimates.
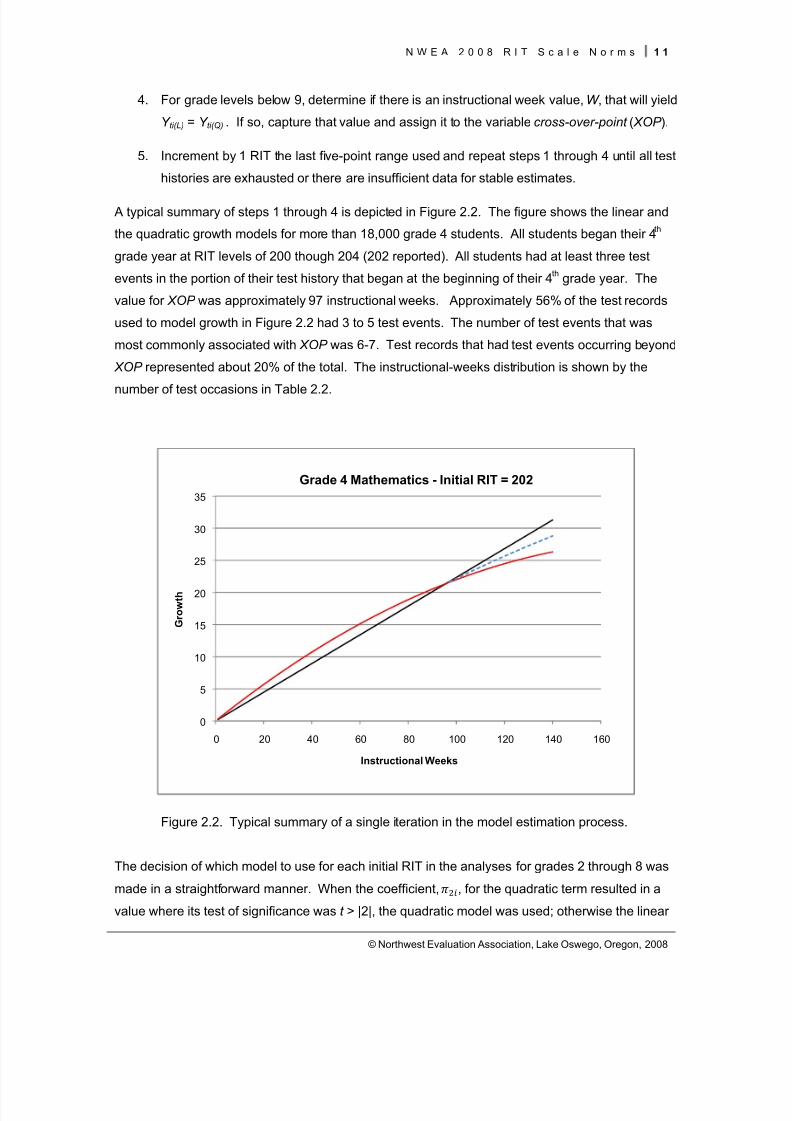
A typical summary of steps 1 through 4 is depicted in Figure 2.2. The figure shows the linear and
the quadratic growth models for more than 18,000 grade 4 students. All students began their 4 th
grade year at RIT levels of 200 though 204 (202 reported). All students had at least three test
events in the portion of their test history that began at the beginning of their 4 th grade year. The
value for XOP was approximately 97 instructional weeks. Approximately 56% of the test records
used to model growth in Figure 2.2 had 3 to 5 test events. The number of test events that was
most commonly associated with XOP was 6-7. Test records that had test events occurring beyond
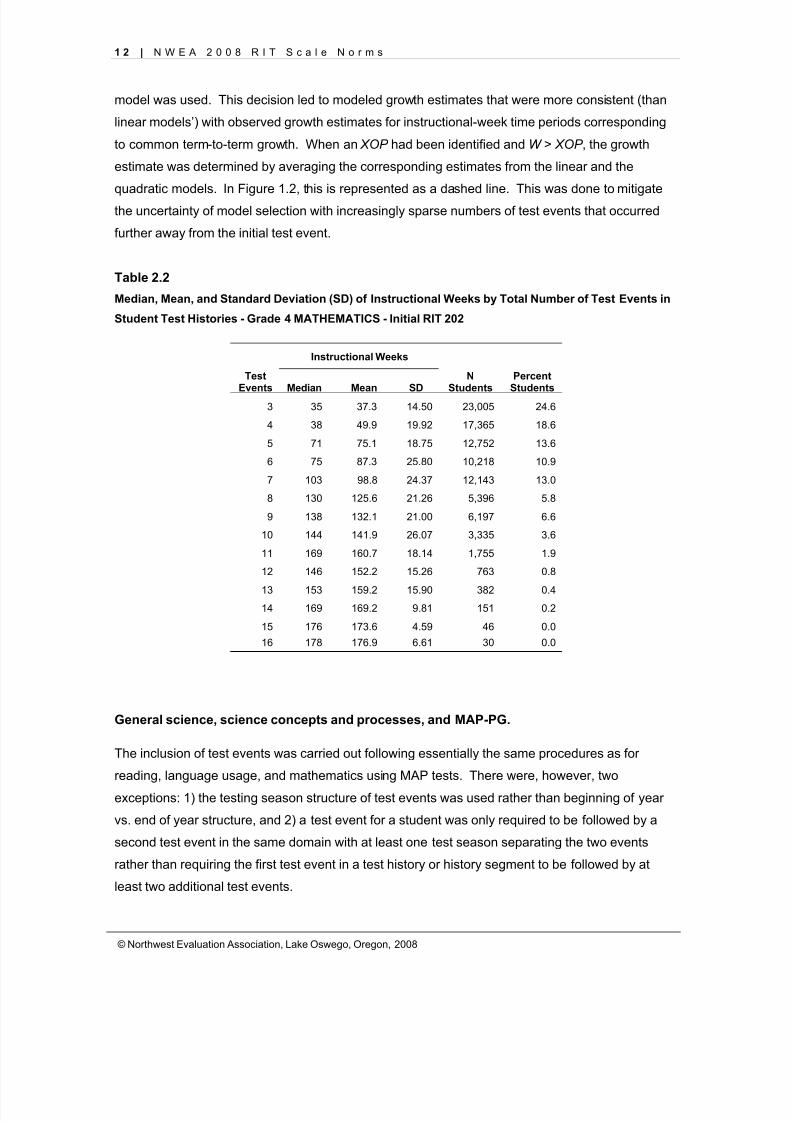
XOP represented about 20% of the total. The instructional-weeks distribution is shown by the
number of test occasions in Table 2.2.
Figure 2.2. Typical summary of a single iteration in the model estimation process.
The decision of which model to use for each initial RIT in the analyses for grades 2 through 8 was
made in a straightforward manner. When the coefficient, , for the quadratic term resulted in a
value where its test of significance was t > |2|, the quadratic model was used; otherwise the linear
0
5
10
15
20
25
30
35
0 20 40 60 80 100 120 140 160
Growth
Instructional Weeks
Grade 4 Mathematics - Initial RIT = 202
8/7/2019 NWEA Complete Norms2008
http://slidepdf.com/reader/full/nwea-complete-norms2008 22/170
1 2 | N W E A 2 0 0 8 R I T S c a l e N o r m s
© Northwest Evaluation Association, Lake Oswego, Oregon, 2008
model was used. This decision led to modeled growth estimates that were more consistent (than
linear models’) with observed growth estimates for instructional-week time periods corresponding
to common term-to-term growth. When an XOP had been identified and W > XOP , the growth
estimate was determined by averaging the corresponding estimates from the linear and the
quadratic models. In Figure 1.2, this is represented as a dashed line. This was done to mitigate
the uncertainty of model selection with increasingly sparse numbers of test events that occurred
further away from the initial test event.
Table 2.2
Median, Mean, and Standard Deviation (SD) of Instructional Weeks by Total Number of Test Events in
Student Test Histories - Grade 4 MATHEMATICS - Initial RIT 202
Instructional Weeks
Test
Events
Percent
StudentsMedian
Mean SD
N
Students3 35 37.3 14.50 23,005 24.6
4 38 49.9 19.92 17,365 18.6
5 71 75.1 18.75 12,752 13.6
6 75 87.3 25.80 10,218 10.9
7 103 98.8 24.37 12,143 13.0
8 130 125.6 21.26 5,396 5.8
9 138 132.1 21.00 6,197 6.6
10 144 141.9 26.07 3,335 3.6
11 169 160.7 18.14 1,755 1.9
12 146 152.2 15.26 763 0.8
13 153 159.2 15.90 382 0.414 169 169.2 9.81 151 0.2
15 176 173.6 4.59 46 0.0
16 178 176.9 6.61 30 0.0
General science, science concepts and processes, and MAP-PG.
The inclusion of test events was carried out following essentially the same procedures as for
reading, language usage, and mathematics using MAP tests. There were, however, two
exceptions: 1) the testing season structure of test events was used rather than beginning of year
vs. end of year structure, and 2) a test event for a student was only required to be followed by a
second test event in the same domain with at least one test season separating the two events
rather than requiring the first test event in a test history or history segment to be followed by at
least two additional test events.
8/7/2019 NWEA Complete Norms2008
http://slidepdf.com/reader/full/nwea-complete-norms2008 23/170
N W E A 2 0 0 8 R I T S c a l e N o r m s 1 3
© Northwest Evaluation Association, Lake Oswego, Oregon, 2008
Growth estimates. For the two science areas, only the term in which a student took a test and the
student’s grade in that term were used to organize growth calculations; the year in which the
student was in the grade was dropped from consideration. Therefore, if two students had spring
grade 4 tests, but one test was taken in spring 2005 and the other was spring 2007, and both
students had test scores in the same content area from the previous fall, both would have been
included in the fall-to-spring growth estimates. Fall to spring, fall to fall, spring to spring, and spring
to fall growth estimates were calculated in both areas. For each comparison, the growth estimate
was determined by subtracting the first observed score from the second observed score. All
growth estimates are based on intact sub-samples of students (students who had both test scores).
As a result, it is reasonable to expect the grade level growth estimates to differ somewhat from
differences in grade level mean scores from the total sample. The nature of these differences
varies. As a step toward detailing these differences, tables reporting growth include the mean
initial RIT score for students in each intact group involved in the comparison. These procedures
were also used for the MAP-PG test events, except that all test events came from the 2006-2007academic year.
8/7/2019 NWEA Complete Norms2008
http://slidepdf.com/reader/full/nwea-complete-norms2008 24/170
1 4 | N W E A 2 0 0 8 R I T S c a l e N o r m s
© Northwest Evaluation Association, Lake Oswego, Oregon, 2008
8/7/2019 NWEA Complete Norms2008
http://slidepdf.com/reader/full/nwea-complete-norms2008 25/170
N W E A 2 0 0 8 R I T S c a l e N o r m s 1 5
© Northwest Evaluation Association, Lake Oswego, Oregon, 2008
CHAPTER 3
Norming Samples Characteristics
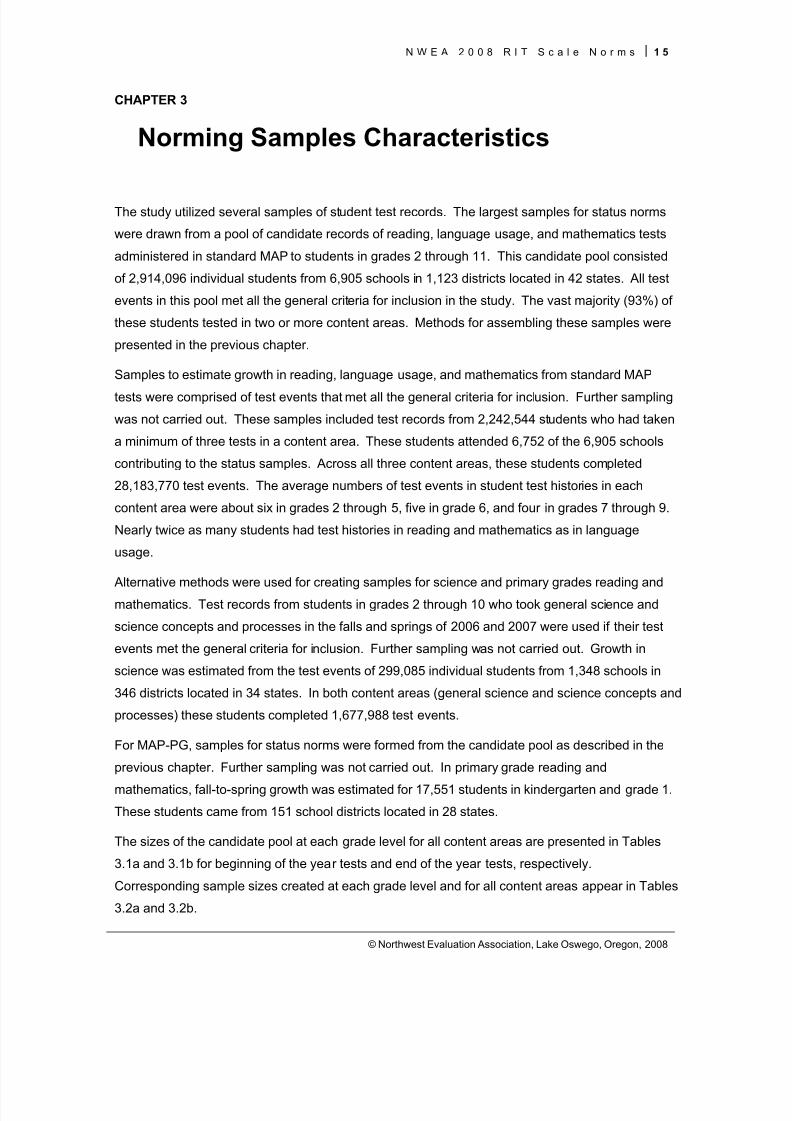
The study utilized several samples of student test records. The largest samples for status norms
were drawn from a pool of candidate records of reading, language usage, and mathematics tests
administered in standard MAP to students in grades 2 through 11. This candidate pool consisted
of 2,914,096 individual students from 6,905 schools in 1,123 districts located in 42 states. All test
events in this pool met all the general criteria for inclusion in the study. The vast majority (93%) of
these students tested in two or more content areas. Methods for assembling these samples were
presented in the previous chapter.
Samples to estimate growth in reading, language usage, and mathematics from standard MAP
tests were comprised of test events that met all the general criteria for inclusion. Further sampling
was not carried out. These samples included test records from 2,242,544 students who had taken
a minimum of three tests in a content area. These students attended 6,752 of the 6,905 schools
contributing to the status samples. Across all three content areas, these students completed
28,183,770 test events. The average numbers of test events in student test histories in each
content area were about six in grades 2 through 5, five in grade 6, and four in grades 7 through 9.
Nearly twice as many students had test histories in reading and mathematics as in language
usage.
Alternative methods were used for creating samples for science and primary grades reading and
mathematics. Test records from students in grades 2 through 10 who took general science and
science concepts and processes in the falls and springs of 2006 and 2007 were used if their test
events met the general criteria for inclusion. Further sampling was not carried out. Growth in
science was estimated from the test events of 299,085 individual students from 1,348 schools in
346 districts located in 34 states. In both content areas (general science and science concepts and
processes) these students completed 1,677,988 test events.
For MAP-PG, samples for status norms were formed from the candidate pool as described in the
previous chapter. Further sampling was not carried out. In primary grade reading and
mathematics, fall-to-spring growth was estimated for 17,551 students in kindergarten and grade 1.
These students came from 151 school districts located in 28 states.
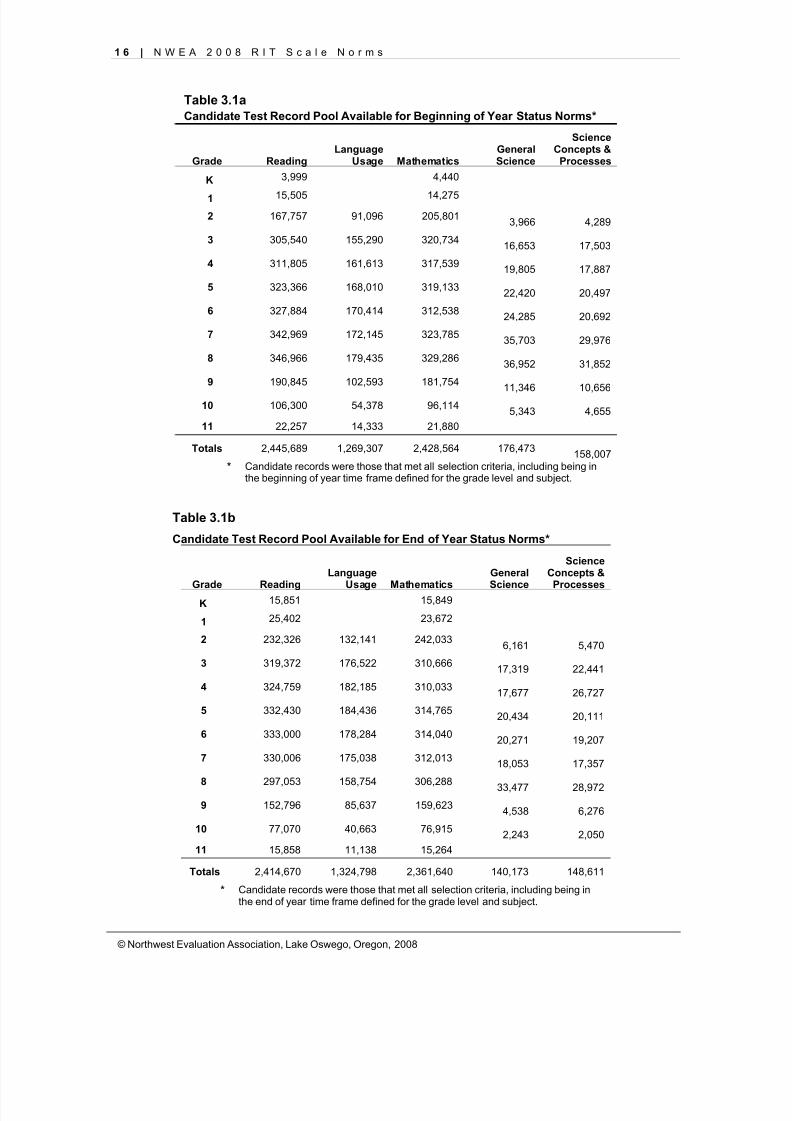
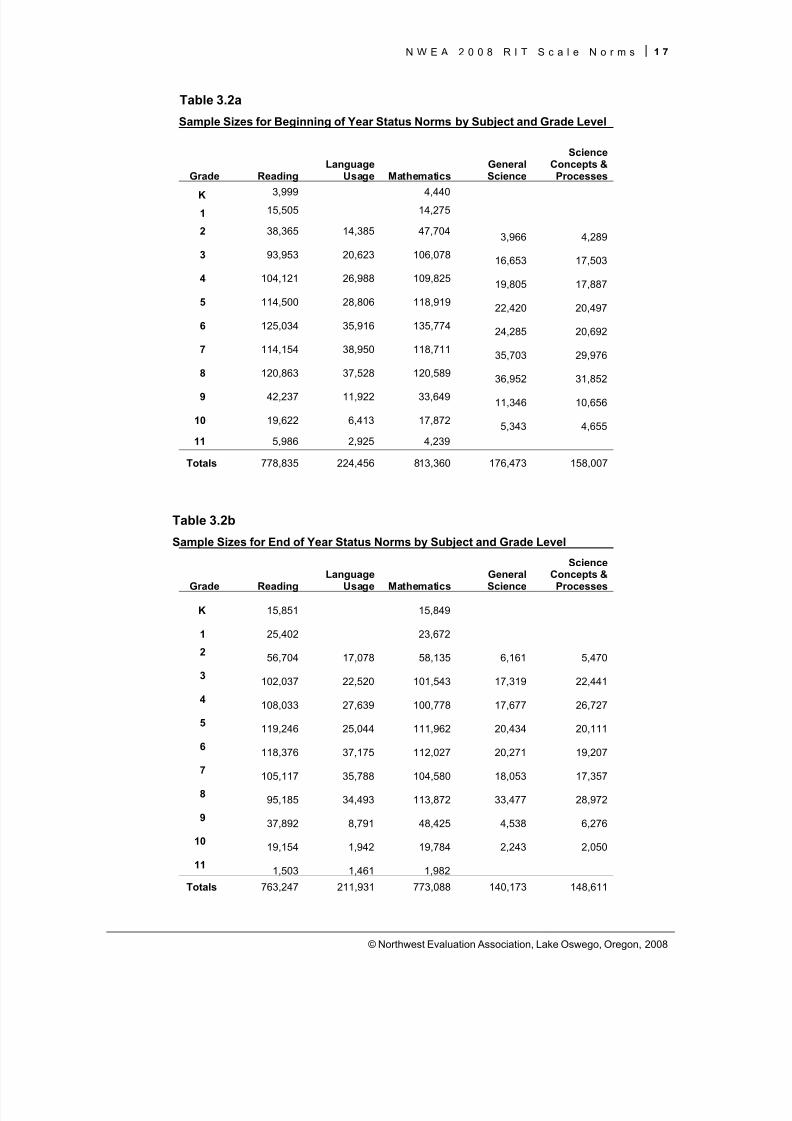
The sizes of the candidate pool at each grade level for all content areas are presented in Tables
3.1a and 3.1b for beginning of the year tests and end of the year tests, respectively.
Corresponding sample sizes created at each grade level and for all content areas appear in Tables
3.2a and 3.2b.
8/7/2019 NWEA Complete Norms2008
http://slidepdf.com/reader/full/nwea-complete-norms2008 26/170
1 6 | N W E A 2 0 0 8 R I T S c a l e N o r m s
© Northwest Evaluation Association, Lake Oswego, Oregon, 2008
Table 3.1aCandidate Test Record Pool Available for Beginning of Year Status Norms*
Grade ReadingLanguage
Usage MathematicsGeneralScience
ScienceConcepts &
Processes
K 3,999 4,440
1 15,505 14,275
2 167,757 91,096 205,801 3,966 4,289
3 305,540 155,290 320,734 16,653 17,503
4 311,805 161,613 317,539 19,805 17,887
5 323,366 168,010 319,133 22,420 20,497
6 327,884 170,414 312,538 24,285 20,692
7 342,969 172,145 323,785 35,703 29,976
8 346,966 179,435 329,286 36,952 31,852
9 190,845 102,593 181,75411,346 10,656
10 106,300 54,378 96,114 5,343 4,65511 22,257 14,333 21,880
Totals 2,445,689 1,269,307 2,428,564 176,473 158,007* Candidate records were those that met all selection criteria, including being in
the beginning of year time frame defined for the grade level and subject.
Table 3.1b
Candidate Test Record Pool Available for End of Year Status Norms*
Grade Reading
Language
Usage Mathematics
General
Science
ScienceConcepts &
ProcessesK 15,851 15,849
1 25,402 23,672
2 232,326 132,141 242,033 6,161 5,470
3 319,372 176,522 310,666 17,319 22,441
4 324,759 182,185 310,033 17,677 26,727
5 332,430 184,436 314,765 20,434 20,111
6 333,000 178,284 314,040 20,271 19,207
7 330,006 175,038 312,013 18,053 17,357
8 297,053 158,754 306,288 33,477 28,9729 152,796 85,637 159,623 4,538 6,276
10 77,070 40,663 76,915 2,243 2,05011 15,858 11,138 15,264
Totals 2,414,670 1,324,798 2,361,640 140,173 148,611
* Candidate records were those that met all selection criteria, including being inthe end of year time frame defined for the grade level and subject.
8/7/2019 NWEA Complete Norms2008
http://slidepdf.com/reader/full/nwea-complete-norms2008 27/170
N W E A 2 0 0 8 R I T S c a l e N o r m s 1 7
© Northwest Evaluation Association, Lake Oswego, Oregon, 2008
Table 3.2a
Sample Sizes for Beginning of Year Status Norms by Subject and Grade Level
Grade ReadingLanguage
Usage MathematicsGeneralScience
ScienceConcepts &
Processes
K 3,999 4,4401 15,505 14,275
2 38,365 14,385 47,704 3,966 4,289
3 93,953 20,623 106,078 16,653 17,503
4 104,121 26,988 109,825 19,805 17,887
5 114,500 28,806 118,919 22,420 20,497
6 125,034 35,916 135,774 24,285 20,692
7 114,154 38,950 118,711 35,703 29,976
8 120,863 37,528 120,589 36,952 31,852
9 42,237 11,922 33,649 11,346 10,656
10 19,622 6,413 17,872 5,343 4,65511 5,986 2,925 4,239
Totals 778,835 224,456 813,360 176,473 158,007
Table 3.2b
Sample Sizes for End of Year Status Norms by Subject and Grade Level
Grade Reading
Language
Usage Mathematics
General
Science
ScienceConcepts &
Processes
K 15,851 15,849
1 25,402 23,672
2 56,704 17,078 58,135 6,161 5,470
3 102,037 22,520 101,543 17,319 22,441
4 108,033 27,639 100,778 17,677 26,727
5 119,246 25,044 111,962 20,434 20,111
6 118,376 37,175 112,027 20,271 19,207
7 105,117 35,788 104,580 18,053 17,357
8 95,185 34,493 113,872 33,477 28,972
9 37,892 8,791 48,425 4,538 6,276
10 19,154 1,942 19,784 2,243 2,050
11 1,503 1,461 1,982
Totals 763,247 211,931 773,088 140,173 148,611
8/7/2019 NWEA Complete Norms2008
http://slidepdf.com/reader/full/nwea-complete-norms2008 28/170
1 8 | N W E A 2 0 0 8 R I T S c a l e N o r m s
© Northwest Evaluation Association, Lake Oswego, Oregon, 2008
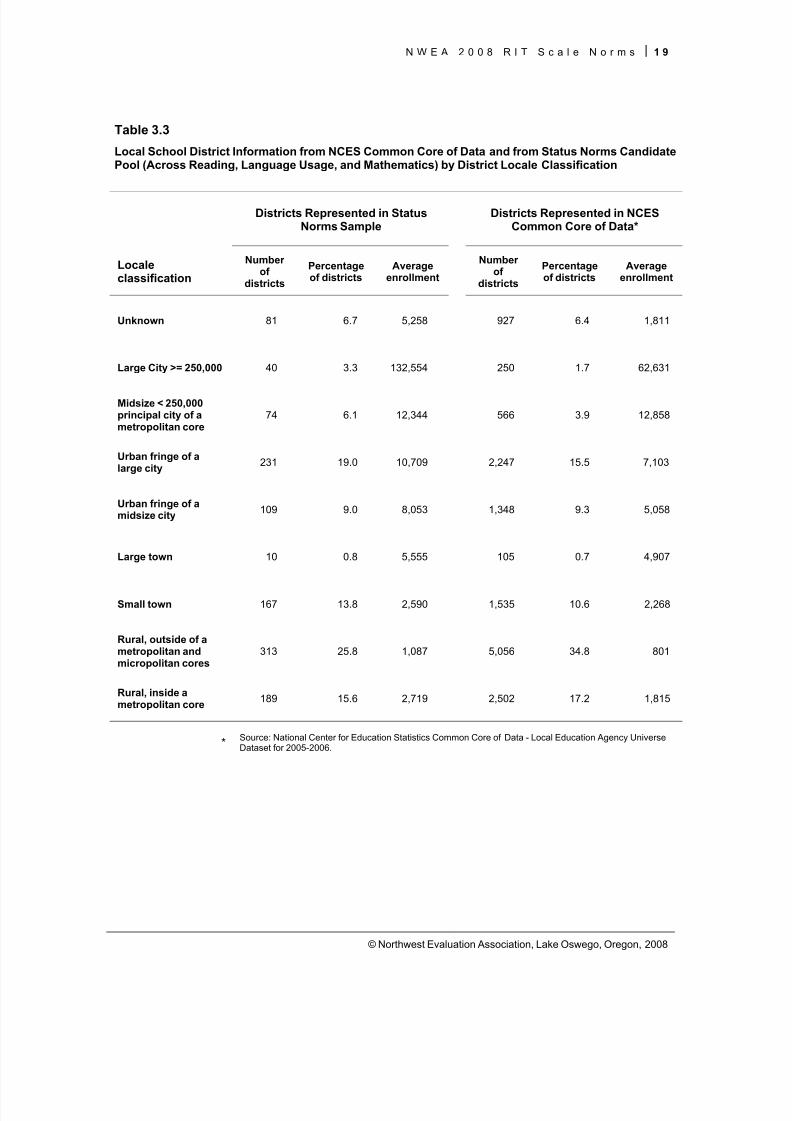
Tables 3.3 through 3.6 provide additional demographic information about the samples used for
determining status norms for reading, language usage, and mathematics in grades 2 through 11.
These tables are broken out by the organizational entity’s (i.e. district or school) locale
classification. They compare information about district or school level variables between the statusnorms samples and the National Center for Education Statistics’ Common Core of Data (NCES-
CCD). The data presented for status norms samples were compiled after the stratified sampling
process.
Table 3.3 compares the NCES-CCD and the status norms sample in terms of the numbers and
percentages of districts present in each locale category. The average enrollment in each locale
category is presented. The table shows that the districts represented in the norming sample were
generally close in percentage terms to the NCES-CCD set. Notable differences were in the over-
representation in the norms sample of districts in large and midsize cities, in fringe of large cites,
and in small towns. The norms sample under-represented school districts in rural areas. In terms
of enrollment, those districts in the norms sample located in large cities had more than twice the
average enrollment than corresponding districts from the NCES-CCD set. In all other locale
classifications, except midsize cities, the average enrollment of districts represented in the norming
sample was slightly larger than districts in the NCES-CCD set. Corresponding information at the
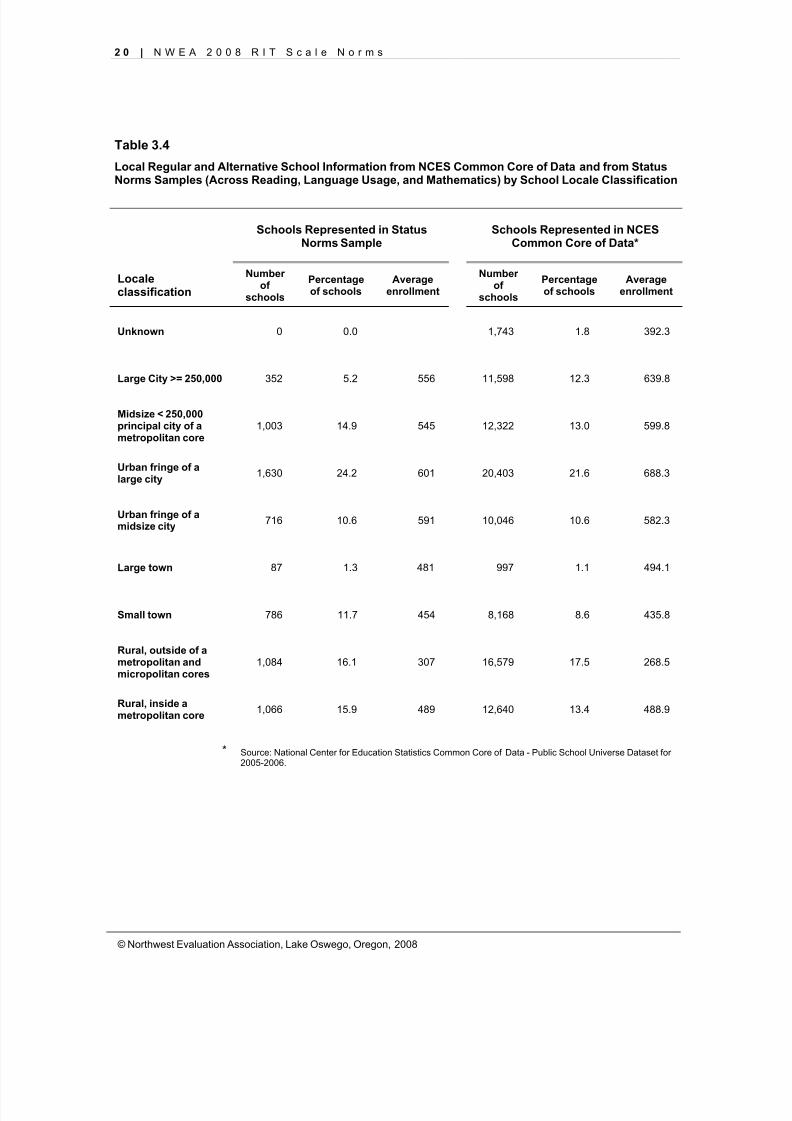
school level is presented in Table 3.4.
Table 3.4 shows that the percentage of schools represented in the norming sample in each locale
classification is generally consistent with the corresponding percentages in the NCES-CCD set.
The notable exception is in the large city locale classification where the percentage of schools inthe norming sample was less than half the percentage of schools in the NCES-CCD set.
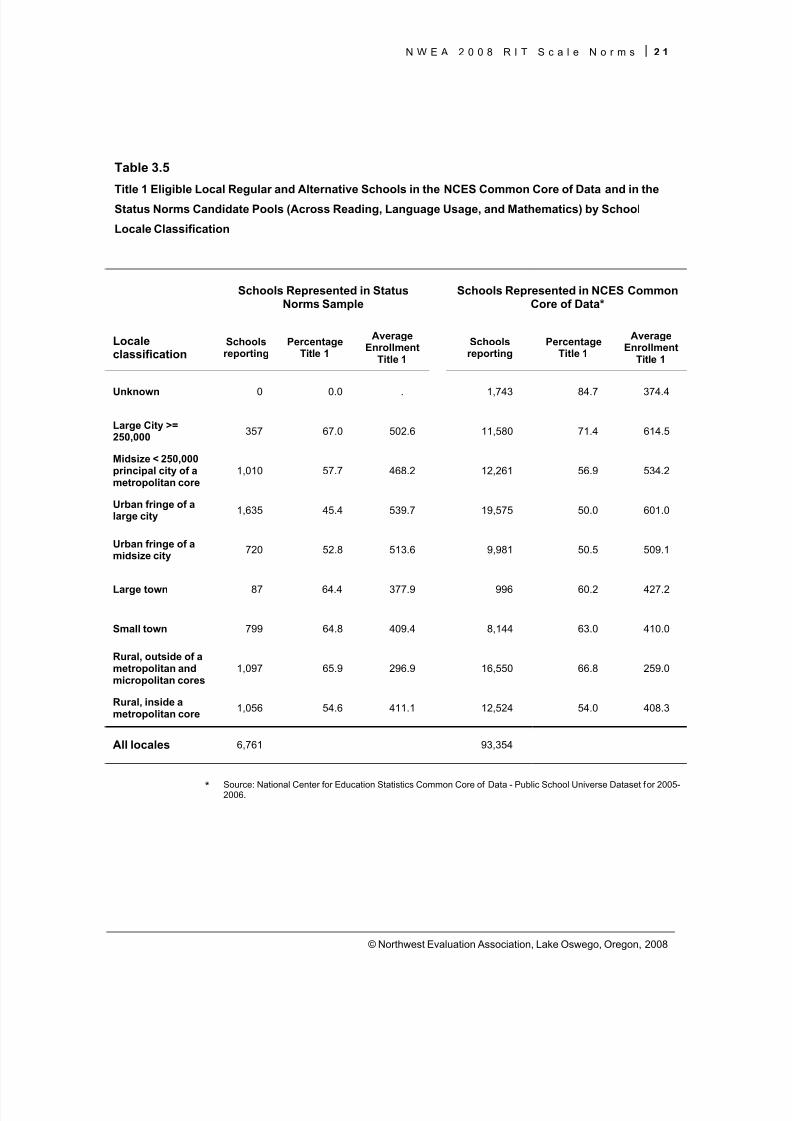
The proportional representations of Title 1 eligible schools in the norming sample and in the NCES-
CCD set are provided in Table 3.5. Differences in percentages between locale classifications
showed no consistent differences in size or direction. Average enrollment in Title 1 eligible schools
in the norming sample in larger and midsize cities in metropolitan areas was generally lower than
Title 1 eligible schools in the NCES-CCD set. In other locale classifications, average enrollments
were comparable.
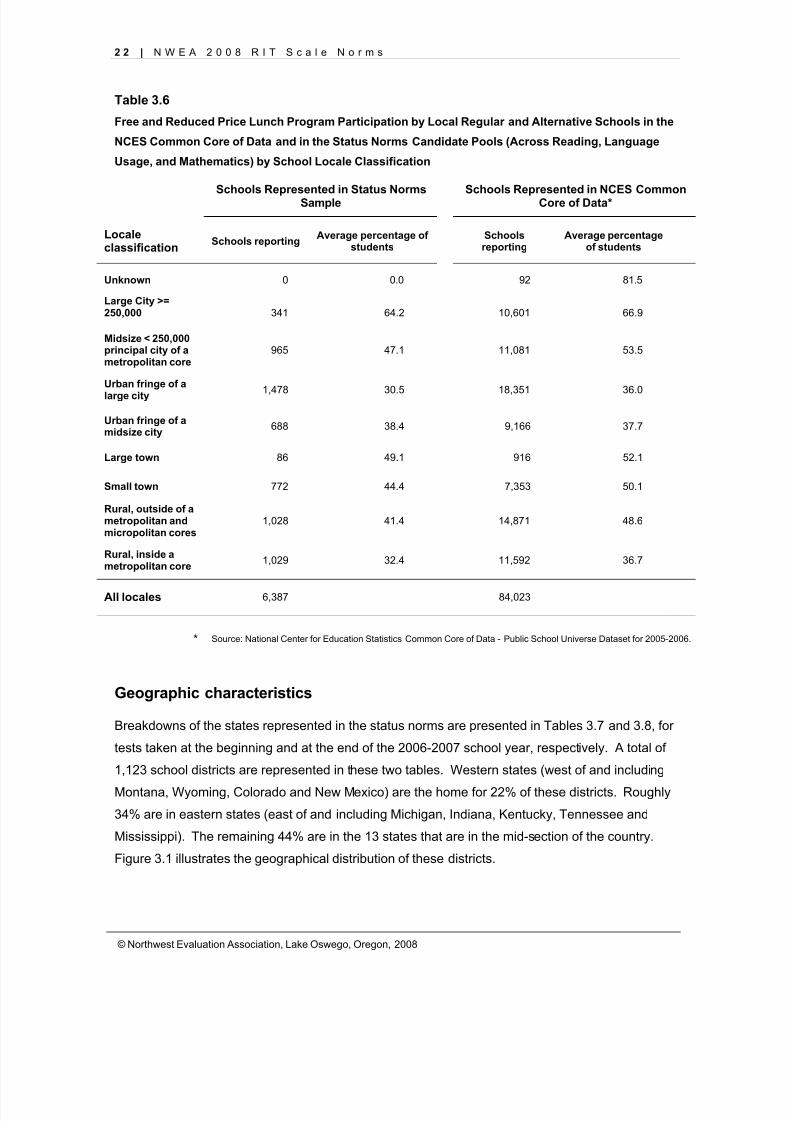
Table 3.6 compares the percentages of Federal Free and Reduced Priced Lunch Program (FRPL)participation of schools represented in the norming study and those in the NCES-CCD set, again
by locale classification. With the exception of the “urban fringe of midsize city” classification, FRPL
participation of schools represented in the norming sample was generally slightly lower than in the
NCES-CCD set.
8/7/2019 NWEA Complete Norms2008
http://slidepdf.com/reader/full/nwea-complete-norms2008 29/170
N W E A 2 0 0 8 R I T S c a l e N o r m s 1 9
© Northwest Evaluation Association, Lake Oswego, Oregon, 2008
Table 3.3
Local School District Information from NCES Common Core of Data and from Status Norms CandidatePool (Across Reading, Language Usage, and Mathematics) by District Locale Classification
Districts Represented in StatusNorms Sample
Districts Represented in NCESCommon Core of Data*
Localeclassification
Number of
districts
Percentageof districts
Averageenrollment
Number of
districts
Percentageof districts
Averageenrollment
Unknown 81 6.7 5,258 927 6.4 1,811
Large City >= 250,000 40 3.3 132,554 250 1.7 62,631
Midsize < 250,000principal city of ametropolitan core
74 6.1 12,344 566 3.9 12,858
Urban fringe of alarge city 231 19.0 10,709 2,247 15.5 7,103
Urban fringe of amidsize city 109 9.0 8,053 1,348 9.3 5,058
Large town 10 0.8 5,555 105 0.7 4,907
Small town 167 13.8 2,590 1,535 10.6 2,268
Rural, outside of ametropolitan andmicropolitan cores
313 25.8 1,087 5,056 34.8 801
Rural, inside ametropolitan core 189 15.6 2,719 2,502 17.2 1,815
* Source: National Center for Education Statistics Common Core of Data - Local Education Agency UniverseDataset for 2005-2006.
8/7/2019 NWEA Complete Norms2008
http://slidepdf.com/reader/full/nwea-complete-norms2008 30/170
2 0 | N W E A 2 0 0 8 R I T S c a l e N o r m s
© Northwest Evaluation Association, Lake Oswego, Oregon, 2008
Table 3.4
Local Regular and Alternative School Information from NCES Common Core of Data and from StatusNorms Samples (Across Reading, Language Usage, and Mathematics) by School Locale Classification
Schools Represented in StatusNorms Sample
Schools Represented in NCESCommon Core of Data*
Localeclassification
Number of
schools
Percentageof schools
Averageenrollment
Number of
schools
Percentageof schools
Averageenrollment
Unknown 0 0.0 1,743 1.8 392.3
Large City >= 250,000 352 5.2 556 11,598 12.3 639.8
Midsize < 250,000principal city of ametropolitan core
1,003 14.9 545 12,322 13.0 599.8
Urban fringe of alarge city 1,630 24.2 601 20,403 21.6 688.3
Urban fringe of amidsize city 716 10.6 591 10,046 10.6 582.3
Large town 87 1.3 481 997 1.1 494.1
Small town 786 11.7 454 8,168 8.6 435.8
Rural, outside of ametropolitan andmicropolitan cores
1,084 16.1 307 16,579 17.5 268.5
Rural, inside ametropolitan core 1,066 15.9 489 12,640 13.4 488.9
* Source: National Center for Education Statistics Common Core of Data - Public School Universe Dataset for 2005-2006.
8/7/2019 NWEA Complete Norms2008
http://slidepdf.com/reader/full/nwea-complete-norms2008 31/170
N W E A 2 0 0 8 R I T S c a l e N o r m s 2 1
© Northwest Evaluation Association, Lake Oswego, Oregon, 2008
Table 3.5
Title 1 Eligible Local Regular and Alternative Schools in the NCES Common Core of Data and in the
Status Norms Candidate Pools (Across Reading, Language Usage, and Mathematics) by School
Locale Classification
Schools Represented in StatusNorms Sample
Schools Represented in NCES CommonCore of Data*
Localeclassification
Schoolsreporting
PercentageTitle 1
AverageEnrollment
Title 1
Schoolsreporting
PercentageTitle 1
AverageEnrollment
Title 1
Unknown 0 0.0 . 1,743 84.7 374.4
Large City >=250,000 357 67.0 502.6 11,580 71.4 614.5
Midsize < 250,000principal city of ametropolitan core
1,010 57.7 468.2 12,261 56.9 534.2
Urban fringe of alarge city 1,635 45.4 539.7 19,575 50.0 601.0
Urban fringe of amidsize city 720 52.8 513.6 9,981 50.5 509.1
Large town 87 64.4 377.9 996 60.2 427.2
Small town 799 64.8 409.4 8,144 63.0 410.0
Rural, outside of ametropolitan andmicropolitan cores
1,097 65.9 296.9 16,550 66.8 259.0
Rural, inside ametropolitan core 1,056 54.6 411.1 12,524 54.0 408.3
All locales 6,761 93,354
* Source: National Center for Education Statistics Common Core of Data - Public School Universe Dataset for 2005-2006.
8/7/2019 NWEA Complete Norms2008
http://slidepdf.com/reader/full/nwea-complete-norms2008 32/170
2 2 | N W E A 2 0 0 8 R I T S c a l e N o r m s
© Northwest Evaluation Association, Lake Oswego, Oregon, 2008
Table 3.6
Free and Reduced Price Lunch Program Participation by Local Regular and Alternative Schools in the
NCES Common Core of Data and in the Status Norms Candidate Pools (Across Reading, Language
Usage, and Mathematics) by School Locale Classification
Schools Represented in Status NormsSample
Schools Represented in NCES CommonCore of Data*
Localeclassification Schools reporting Average percentage of
studentsSchools
reportingAverage percentage
of students
Unknown 0 0.0 92 81.5
Large City >=250,000 341 64.2 10,601 66.9
Midsize < 250,000principal city of ametropolitan core
965 47.1 11,081 53.5
Urban fringe of alarge city 1,478 30.5 18,351 36.0
Urban fringe of amidsize city 688 38.4 9,166 37.7
Large town 86 49.1 916 52.1
Small town 772 44.4 7,353 50.1
Rural, outside of ametropolitan andmicropolitan cores
1,028 41.4 14,871 48.6
Rural, inside ametropolitan core 1,029 32.4 11,592 36.7
All locales 6,387 84,023
* Source: National Center for Education Statistics Common Core of Data - Public School Universe Dataset for 2005-2006.
Geographic characteristics
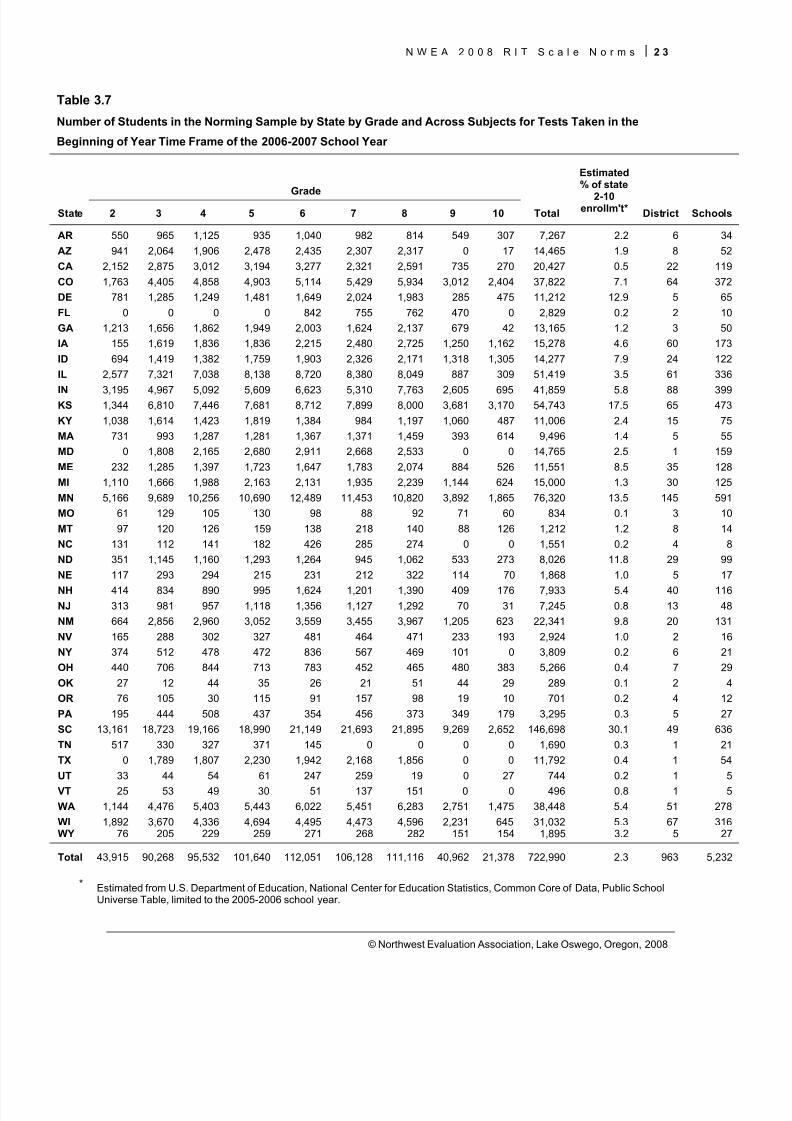
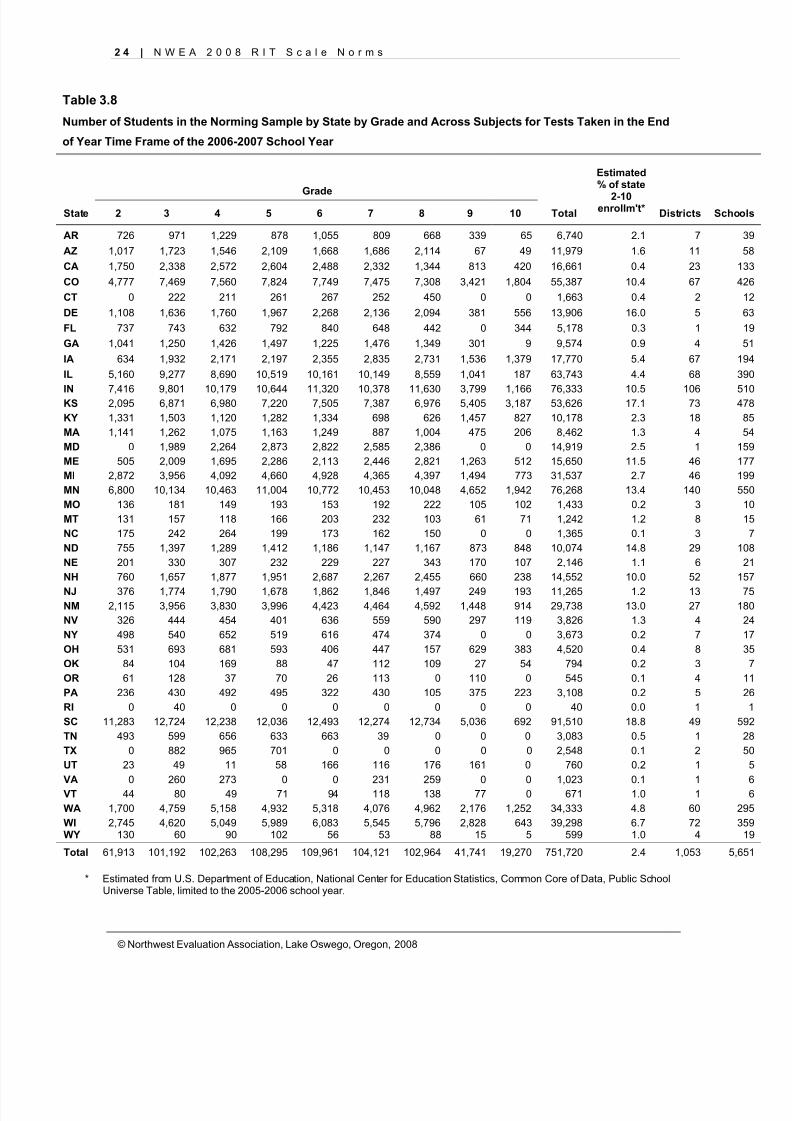
Breakdowns of the states represented in the status norms are presented in Tables 3.7 and 3.8, for
tests taken at the beginning and at the end of the 2006-2007 school year, respectively. A total of
1,123 school districts are represented in these two tables. Western states (west of and including
Montana, Wyoming, Colorado and New Mexico) are the home for 22% of these districts. Roughly
34% are in eastern states (east of and including Michigan, Indiana, Kentucky, Tennessee and
Mississippi). The remaining 44% are in the 13 states that are in the mid-section of the country.
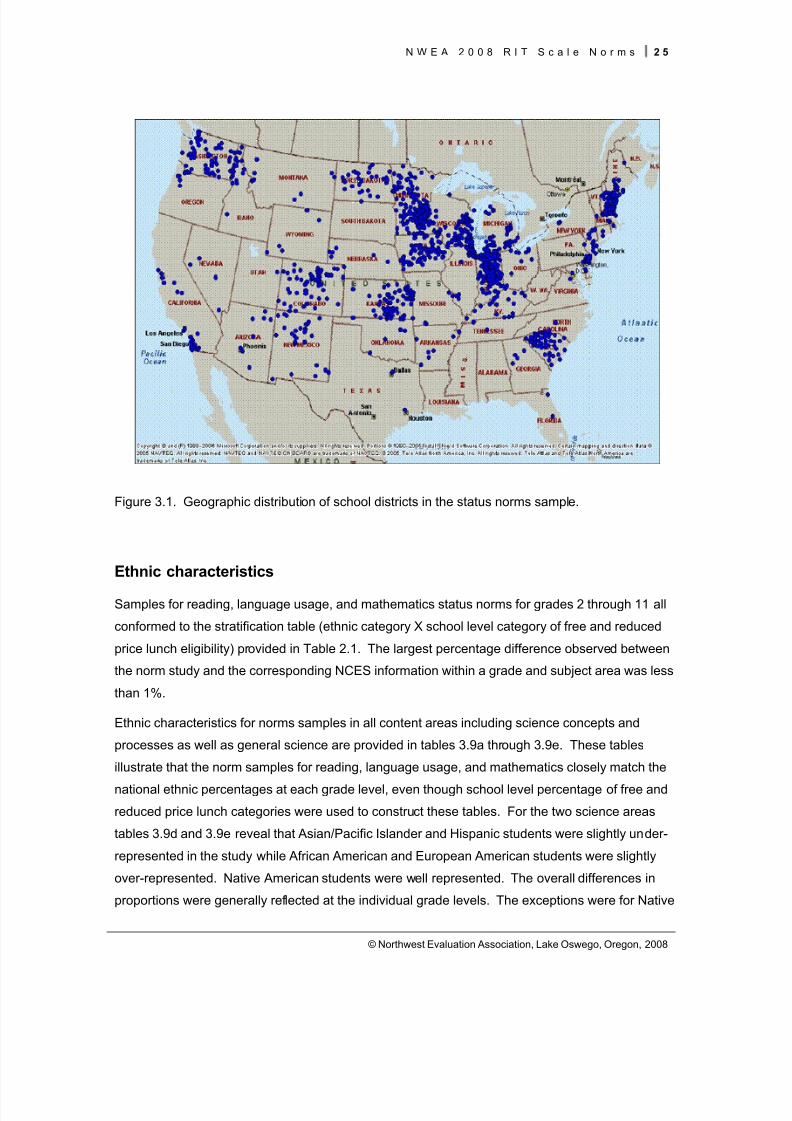
Figure 3.1 illustrates the geographical distribution of these districts.
8/7/2019 NWEA Complete Norms2008
http://slidepdf.com/reader/full/nwea-complete-norms2008 33/170
N W E A 2 0 0 8 R I T S c a l e N o r m s 2 3
© Northwest Evaluation Association, Lake Oswego, Oregon, 2008
Table 3.7
Number of Students in the Norming Sample by State by Grade and Across Subjects for Tests Taken in the
Beginning of Year Time Frame of the 2006-2007 School Year
Estimated% of state
2-10enrollm't*
GradeState 2 3 4 5 6 7 8 9 10 Total District Schools
AR 550 965 1,125 935 1,040 982 814 549 307 7,267 2.2 6 34AZ 941 2,064 1,906 2,478 2,435 2,307 2,317 0 17 14,465 1.9 8 52CA 2,152 2,875 3,012 3,194 3,277 2,321 2,591 735 270 20,427 0.5 22 119CO 1,763 4,405 4,858 4,903 5,114 5,429 5,934 3,012 2,404 37,822 7.1 64 372DE 781 1,285 1,249 1,481 1,649 2,024 1,983 285 475 11,212 12.9 5 65FL 0 0 0 0 842 755 762 470 0 2,829 0.2 2 10GA 1,213 1,656 1,862 1,949 2,003 1,624 2,137 679 42 13,165 1.2 3 50IA 155 1,619 1,836 1,836 2,215 2,480 2,725 1,250 1,162 15,278 4.6 60 173ID 694 1,419 1,382 1,759 1,903 2,326 2,171 1,318 1,305 14,277 7.9 24 122IL 2,577 7,321 7,038 8,138 8,720 8,380 8,049 887 309 51,419 3.5 61 336
IN 3,195 4,967 5,092 5,609 6,623 5,310 7,763 2,605 695 41,859 5.8 88 399KS 1,344 6,810 7,446 7,681 8,712 7,899 8,000 3,681 3,170 54,743 17.5 65 473KY 1,038 1,614 1,423 1,819 1,384 984 1,197 1,060 487 11,006 2.4 15 75MA 731 993 1,287 1,281 1,367 1,371 1,459 393 614 9,496 1.4 5 55MD 0 1,808 2,165 2,680 2,911 2,668 2,533 0 0 14,765 2.5 1 159ME 232 1,285 1,397 1,723 1,647 1,783 2,074 884 526 11,551 8.5 35 128MI 1,110 1,666 1,988 2,163 2,131 1,935 2,239 1,144 624 15,000 1.3 30 125MN 5,166 9,689 10,256 10,690 12,489 11,453 10,820 3,892 1,865 76,320 13.5 145 591MO 61 129 105 130 98 88 92 71 60 834 0.1 3 10MT 97 120 126 159 138 218 140 88 126 1,212 1.2 8 14NC 131 112 141 182 426 285 274 0 0 1,551 0.2 4 8ND 351 1,145 1,160 1,293 1,264 945 1,062 533 273 8,026 11.8 29 99NE 117 293 294 215 231 212 322 114 70 1,868 1.0 5 17
NH 414 834 890 995 1,624 1,201 1,390 409 176 7,933 5.4 40 116NJ 313 981 957 1,118 1,356 1,127 1,292 70 31 7,245 0.8 13 48NM 664 2,856 2,960 3,052 3,559 3,455 3,967 1,205 623 22,341 9.8 20 131NV 165 288 302 327 481 464 471 233 193 2,924 1.0 2 16NY 374 512 478 472 836 567 469 101 0 3,809 0.2 6 21OH 440 706 844 713 783 452 465 480 383 5,266 0.4 7 29OK 27 12 44 35 26 21 51 44 29 289 0.1 2 4OR 76 105 30 115 91 157 98 19 10 701 0.2 4 12PA 195 444 508 437 354 456 373 349 179 3,295 0.3 5 27SC 13,161 18,723 19,166 18,990 21,149 21,693 21,895 9,269 2,652 146,698 30.1 49 636TN 517 330 327 371 145 0 0 0 0 1,690 0.3 1 21TX 0 1,789 1,807 2,230 1,942 2,168 1,856 0 0 11,792 0.4 1 54UT 33 44 54 61 247 259 19 0 27 744 0.2 1 5VT 25 53 49 30 51 137 151 0 0 496 0.8 1 5WA 1,144 4,476 5,403 5,443 6,022 5,451 6,283 2,751 1,475 38,448 5.4 51 278WI 1,892 3,670 4,336 4,694 4,495 4,473 4,596 2,231 645 31,032 5.3 67 316WY 76 205 229 259 271 268 282 151 154 1,895 3.2 5 27
Total 43,915 90,268 95,532 101,640 112,051 106,128 111,116 40,962 21,378 722,990 2.3 963 5,232
* Estimated from U.S. Department of Education, National Center for Education Statistics, Common Core of Data, Public SchoolUniverse Table, limited to the 2005-2006 school year.
8/7/2019 NWEA Complete Norms2008
http://slidepdf.com/reader/full/nwea-complete-norms2008 34/170
8/7/2019 NWEA Complete Norms2008
http://slidepdf.com/reader/full/nwea-complete-norms2008 35/170
N W E A 2 0 0 8 R I T S c a l e N o r m s 2 5
© Northwest Evaluation Association, Lake Oswego, Oregon, 2008
Figure 3.1. Geographic distribution of school districts in the status norms sample.
Ethnic characteristics
Samples for reading, language usage, and mathematics status norms for grades 2 through 11 all
conformed to the stratification table (ethnic category X school level category of free and reduced
price lunch eligibility) provided in Table 2.1. The largest percentage difference observed between
the norm study and the corresponding NCES information within a grade and subject area was less
than 1%.
Ethnic characteristics for norms samples in all content areas including science concepts and
processes as well as general science are provided in tables 3.9a through 3.9e. These tables
illustrate that the norm samples for reading, language usage, and mathematics closely match the
national ethnic percentages at each grade level, even though school level percentage of free and
reduced price lunch categories were used to construct these tables. For the two science areas
tables 3.9d and 3.9e reveal that Asian/Pacific Islander and Hispanic students were slightly under-
represented in the study while African American and European American students were slightly
over-represented. Native American students were well represented. The overall differences in
proportions were generally reflected at the individual grade levels. The exceptions were for Native
8/7/2019 NWEA Complete Norms2008
http://slidepdf.com/reader/full/nwea-complete-norms2008 36/170
8/7/2019 NWEA Complete Norms2008
http://slidepdf.com/reader/full/nwea-complete-norms2008 37/170
N W E A 2 0 0 8 R I T S c a l e N o r m s 2 7
© Northwest Evaluation Association, Lake Oswego, Oregon, 2008
Table 3.9c
Sample Size (N)*, Sample Percentage of Ethnic Group Representation for MATHEMATICS and National
School Age Percentages of Ethnic Group Representation by Grade Level
Grade
Ethnic Group 2 3 4 5 6 7 8 9 10 11
NativeAmerican/AlaskanNative
N 1,255 2,439 2,500 2,734 2,986 2,725 2,886 1,012 445 71Sample % 1.2 1.2 1.2 1.2 1.2 1.2 1.2 1.2 1.2 1.1
National % 1.2 1.2 1.2 1.2 1.2 1.3 1.3 1.3 1.3 1.2
Asian/PacificIslander
N 4,857 9,723 9,903 10,668 11,180 9,823 10,299 3,483 1,736 303Sample % 4.6 4.7 4.7 4.6 4.5 4.4 4.4 4.2 4.6 4.9
National % 4.6 4.7 4.7 4.6 4.5 4.4 4.4 4.3 4.6 4.9
AfricanAmerican
N 18,258 35,863 35,915 40,008 44,151 40,264 41,379 15,328 6,332 1,040Sample % 17.3 17.3 17.1 17.3 17.8 18.0 17.6 18.7 16.8 16.7
National % 16.9 16.9 16.7 17.0 17.5 17.7 17.3 18.6 16.7 15.3
HispanicN 22,981 44,315 43,753 47,269 49,256 43,206 43,757 15,859 6,655 967
Sample % 21.7 21.3 20.8 20.5 19.9 19.3 18.7 19.3 17.7 15.5National % 22.8 22.4 21.8 21.5 20.7 20.3 19.5 20.0 18.5 16.9
EuropeanAmerican
N 58,488 115,281 118,532 130,202 140,228 127,273 136,140 46,392 22,488 3,840Sample % 55.3 55.5 56.3 56.4 56.6 57.0 58.1 56.5 59.7 61.7
National % 54.5 54.8 55.6 55.7 56.0 56.4 57.5 55.8 58.9 61.6* Based on beginning-of-year and end-of-year samples only.
Table 3.9d
Sample Size (N)*, Sample Percentage of Ethnic Group Representation for GENERAL SCIENCE and
National School Age Percentages of Ethnic Group Representation by Grade Level
Grade
Ethnic Group 2 3 4 5 6 7 8 9 10
NativeAmerican/AlaskanNative
N 92 402 450 512 542 615 930 212 93Sample % 0.9 1.2 1.2 1.2 1.2 1.1 1.3 1.3 1.2
National % 1.2 1.2 1.2 1.2 1.2 1.3 1.3 1.3 1.3
Asian/PacificIslander
N 266 1,317 1,454 1,589 1,546 1,879 1,821 312 234Sample % 2.6 3.9 3.9 3.7 3.5 3.5 2.6 2.0 3.1
National % 4.6 4.7 4.7 4.6 4.5 4.4 4.4 4.3 4.6
African
American
N 1,859 5,921 6,448 7,501 8,026 10,157 12,917 2,453 1,206Sample % 18.4 17.4 17.2 17.5 18.0 18.9 18.3 15.4 15.9
National % 16.9 16.9 16.7 17.0 17.5 17.7 17.3 18.6 16.7
HispanicN 1,952 7,298 7,854 8,843 8,953 8,990 10,924 3,190 1,382
Sample % 19.3 21.5 21.0 20.6 20.1 16.7 15.5 20.1 18.2National % 22.8 22.4 21.8 21.5 20.7 20.3 19.5 20.0 18.5
EuropeanAmerican
N 5,958 19,034 21,276 24,409 25,489 32,115 43,837 9,717 4,671Sample % 58.8 56.0 56.8 57.0 57.2 59.7 62.2 61.2 61.6
National % 54.5 54.8 55.6 55.7 56.0 56.4 57.5 55.8 58.9
* Based on fall and spring samples
8/7/2019 NWEA Complete Norms2008
http://slidepdf.com/reader/full/nwea-complete-norms2008 38/170
2 8 | N W E A 2 0 0 8 R I T S c a l e N o r m s
© Northwest Evaluation Association, Lake Oswego, Oregon, 2008
Table 3.9e
Sample Size (N)*, Sample Percentage of Ethnic Group Representation for SCIENCE CONCEPTS and
PROCESSES and National School Age Percentages of Ethnic Group Representation by Grade Level
Grade
Ethnic Group 2 3 4 5 6 7 8 9 10
NativeAmerican/AlaskanNative
N 101 526 606 531 550 645 917 269 93Sample % 0.9 1.2 1.2 1.2 1.2 1.1 1.3 1.4 1.2
National % 1.2 1.2 1.2 1.2 1.2 1.3 1.3 1.3 1.3
Asian/PacificIslander
N 292 1,627 1,843 1,642 1,565 1,968 1,852 328 302Sample % 2.7 3.8 3.8 3.7 3.5 3.5 2.6 1.7 3.9
National % 4.6 4.7 4.7 4.6 4.5 4.4 4.4 4.3 4.6
African
American
N 1,964 7,726 8,707 7,771 8,113 10,578 12,786 2,708 1,289Sample % 18.1 17.9 17.8 17.5 18.0 18.8 18.2 13.7 16.5
National % 16.9 16.9 16.7 17.0 17.5 17.7 17.3 18.6 16.7
HispanicN 2,223 8,464 9,035 9,135 9,051 9,549 11,293 4,083 1,398
Sample % 20.5 19.6 18.5 20.6 20.1 17.0 16.1 20.7 17.9National % 22.8 22.4 21.8 21.5 20.7 20.3 19.5 20.0 18.5
EuropeanAmerican
N 6,287 24,835 28,737 25,289 25,768 33,436 43,247 12,364 4,733Sample % 57.9 57.5 58.7 57.0 57.2 59.5 61.7 62.6 60.6
National % 54.5 54.8 55.6 55.7 56.0 56.4 57.5 55.8 58.9* Based on fall and spring samples
8/7/2019 NWEA Complete Norms2008
http://slidepdf.com/reader/full/nwea-complete-norms2008 39/170
N W E A 2 0 0 8 R I T S c a l e N o r m s 2 9
© Northwest Evaluation Association, Lake Oswego, Oregon, 2008
CHAPTER 4
Grade Level Growth and Status Norms
Over the past several years, student achievement has been increasingly viewed from two relevant
and complimentary perspectives: achievement status and achievement growth. When both are
considered in concert, important insight into understanding a student’s achievement can be gained.
Knowing a student’s achievement status at a particular point in time is, at best, interesting. Viewing
that same status estimate as one of several obtained over multiple time points (i.e. growth) adds, at
least, a sense of progress. Similarly, the trajectory of a student’s status estimates from over
multiple time points can be captivating, but without using one of the estimates as a reference for
the trajectory, little more than directional meaning is provided. In each case, additional references
are needed to make sense of the data. Details of the knowledge and skills associated with an
achievement estimate from MAP, such as those provided by DesCartes (NWEA, 2005), can
provide important points of references for instructional purposes. In addition, normative information
can provide references to which individual and group achievement estimates can be compared for
decision making or understanding. Normative references to student performance within grade
levels are the focus of this chapter.
Status norms. In the context of a grade level, status norms allow us to answer some basic and
commonly asked questions. These include:
• How does the reading performance of our 7 th grade students compare to the performanceof 7 th grade students from across the country who took the same test at approximately thesame time?
• Is the average performance of this group in the upper quartile of students in the samegrade across the country?
• Is this student’s performance relative to the norming sample consistent across domains?
Discussions of performance standards can involve status norms to determine their likely impact or
their observed impact when incorporated into an accountability system – the difference between
desired performance (a standard) and observed performance (a norm). Typical questions that
status norms can help to answer include:
• If a performance standard is set at a RIT = X and our students’ performance is consistentwith the norming sample, what percentage of our students is likely to not meet thestandard?
8/7/2019 NWEA Complete Norms2008
http://slidepdf.com/reader/full/nwea-complete-norms2008 40/170
3 0 | N W E A 2 0 0 8 R I T S c a l e N o r m s
© Northwest Evaluation Association, Lake Oswego, Oregon, 2008
• How does the difficulty of the grade 3 performance standards compare to the difficulty of the grade 5 performance standards? Are performance standards consistently difficultmoving from grade to grade?
• How far is this score from a particular performance standard?
Growth norms. When successive status estimates from the same student are treated as a unit
and aggregated across students sharing a common characteristic (e.g. the same grade level),
norms of the rate of movement (i.e., growth) can be calculated. Questions that can be addressed
by growth norms are numerous and include, among others:
• If this group of students progresses like similar students in the norming sample, what is itsmean achievement level likely to be in 32 instructional weeks? In 74 instructional weeks?
• Are all students in this class progressing at a rate similar to students in the norm samplewho began instruction at about the same instructional level?
• How much growth is reasonable to expect from students in a particular grade level over two years of instruction?
• Has the rate of growth for this cohort of students changed in a pattern that is consistentwith the rates from the norming samples?
Growth in relation to performance standards allows insight into the standards themselves as well
as the movement of students in relation to the standards. When the standards are defined on or
transformed onto a RIT scale, many growth and standards related questions can be addressed.
For example:
• Given the current performance levels of our grade 4 students, what percentage of them arelikely to meet the grade 6 performance standard?
• How do the two-year projected performance levels of our students relate to expectedperformance levels? Do the relationships differ by grade level? By content area?
• For students not expected to grow enough to meet a particular performance standard, howmany more weeks of instruction would be required to bring them to the level of theperformance standard?
• When performance standards between contiguous grades are not consistently difficult,how will the growth expectations for lower performing students need to change if performance expectations are to be met?
Grades 2 through 11 – Standard MAP
Reading, language usage, and mathematics. The procedures for determining grade level
growth and status norms were described in Chapter 2. Results from those procedures for students
in grades 2 through 11 who took reading, language usage, and mathematics appear in Tables 4.1
through 4.3, respectively. Each of these tables is presented as three sub-tables, a through c.
8/7/2019 NWEA Complete Norms2008
http://slidepdf.com/reader/full/nwea-complete-norms2008 41/170
N W E A 2 0 0 8 R I T S c a l e N o r m s 3 1
© Northwest Evaluation Association, Lake Oswego, Oregon, 2008
The ‘a’ sub-tables contain the grade level growth means for four instructional periods: a) beginning
of the year to middle of the year, b) beginning of the year to end of the year, c) beginning of the
year to beginning of the following year, and d) end of the year to end of the next year. The lengths
of periods were based on a traditional U.S. school year of 180 days. It should be noted that the
values appearing in the standard deviation (SD) columns in these tables represent the variance of
the individual student growth trajectories . This represents a change from the 2005 norming study
where the standard deviations were representing the variance of the change scores. When
compared to the corresponding values from the 2005 norming study, those from the current study
are typically 30% to 60% higher.
Grade level status norms appear in the ‘b’ sub-tables. Norms were computed for the beginning of
the year ( ≈ 1-7 instructional weeks), the middle of the year ( ≈ 15-21 instructional weeks), and ( ≈ 28-
34 instructional weeks). The data in these tables represent the performance of students in the
random samples that were stratified as described in Chapter 2.
The ‘c’ sub-tables provide indices of the impact of the sample stratification procedures relative to
the sample creation procedures used in the 2005 study. Differences are presented for the grade
level means, medians, and numbers of students between the data in the ‘a’ sub-tables and their
corresponding values from samples of students if the sample creation procedures from the 2005
norming study had been followed. Negative values in these tables indicate that the value from the
2008 study was that amount lower than if the sample creation procedure from the 2005 study had
been used.
Upper level mathematics (Algebra 1, Geometry, and Algebra 2) results are included in Tables 4.4a
and 4.4b. The records selected for these tables were not subjected to the same stratification
procedures used for Tables 4.1 through 4.3. Tables 4.4a and 4.4b differ only with respect to when
in the school year tests were taken. Table 4.4a restricted the test events to those from tests taken
at the end of the school year and in the time frame used to define the end-of-year period ( ≈ 28-34
instructional weeks). Test events summarized in Table 4.4b were allowed to take place any time
during the school year. Table 4.4b likely includes test events that were administered as a “pretest”
prior to formal instruction in the test content. While this practice is discouraged, it does happen.
The 2005 norming study did not include a specific procedure to minimize the impact of “pretests”
on the norms. This is the most likely explanation for the slightly higher norms observed in this
study (Table 4.4a) compared to the 2005 upper level mathematics norms.
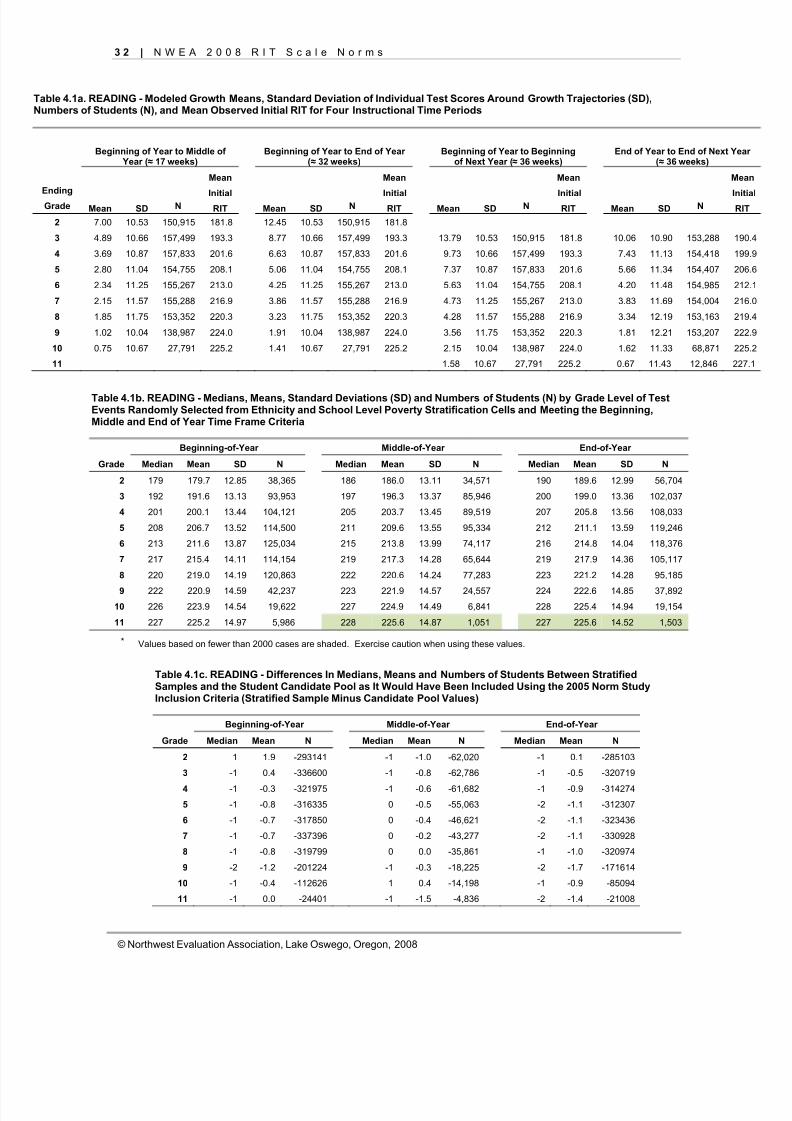
8/7/2019 NWEA Complete Norms2008
http://slidepdf.com/reader/full/nwea-complete-norms2008 42/170
3 2 | N W E A 2 0 0 8 R I T S c a l e N o r m s
© Northwest Evaluation Association, Lake Oswego, Oregon, 2008
Table 4.1a. READING - Modeled Growth Means, Standard Deviation of Individual Test Scores Around Growth Trajectories (SD),Numbers of Students (N), and Mean Observed Initial RIT for Four Instructional Time Periods
Beginning of Year to Middle of Year ( ≈ 17 weeks)
Beginning of Year to End of Year (≈ 32 weeks)
Beginning of Year to Beginningof Next Year ( ≈ 36 weeks)
End of Year to End of Next Year (≈ 36 weeks)
Mean Mean Mean MeanEnding
Initial Initial Initial InitialGrade Mean SD N RIT Mean SD N RIT Mean SD N RIT Mean SD N R
2 7.00 10.53 150,915 181.8 12.45 10.53 150,915 181.8
3 4.89 10.66 157,499 193.3 8.77 10.66 157,499 193.3 13.79 10.53 150,915 181.8 10.06 10.90 153,288 190.4
4 3.69 10.87 157,833 201.6 6.63 10.87 157,833 201.6 9.73 10.66 157,499 193.3 7.43 11.13 154,418 199.9
5 2.80 11.04 154,755 208.1 5.06 11.04 154,755 208.1 7.37 10.87 157,833 201.6 5.66 11.34 154,407 206.6
6 2.34 11.25 155,267 213.0 4.25 11.25 155,267 213.0 5.63 11.04 154,755 208.1 4.20 11.48 154,985 212.1
7 2.15 11.57 155,288 216.9 3.86 11.57 155,288 216.9 4.73 11.25 155,267 213.0 3.83 11.69 154,004 216.0
8 1.85 11.75 153,352 220.3 3.23 11.75 153,352 220.3 4.28 11.57 155,288 216.9 3.34 12.19 153,163 219.4
9 1.02 10.04 138,987 224.0 1.91 10.04 138,987 224.0 3.56 11.75 153,352 220.3 1.81 12.21 153,207 222.9
10 0.75 10.67 27,791 225.2 1.41 10.67 27,791 225.2 2.15 10.04 138,987 224.0 1.62 11.33 68,871 225.2
11 1.58 10.67 27,791 225.2 0.67 11.43 12,846 227.1
Table 4.1b. READING - Medians, Means, Standard Deviations (SD) and Numbers of Students (N) by Grade Level of TestEvents Randomly Selected from Ethnicity and School Level Poverty Stratification Cells and Meeting the Beginning,Middle and End of Year Time Frame Criteria
Beginning-of-Year Middle-of-Year End-of-Year
Grade Median Mean SD N Median Mean SD N Median Mean SD N
2 179 179.7 12.85 38,365 186 186.0 13.11 34,571 190 189.6 12.99 56,704
3 192 191.6 13.13 93,953 197 196.3 13.37 85,946 200 199.0 13.36 102,037
4 201 200.1 13.44 104,121 205 203.7 13.45 89,519 207 205.8 13.56 108,033
5 208 206.7 13.52 114,500 211 209.6 13.55 95,334 212 211.1 13.59 119,246
6 213 211.6 13.87 125,034 215 213.8 13.99 74,117 216 214.8 14.04 118,376
7 217 215.4 14.11 114,154 219 217.3 14.28 65,644 219 217.9 14.36 105,117
8 220 219.0 14.19 120,863 222 220.6 14.24 77,283 223 221.2 14.28 95,185
9 222 220.9 14.59 42,237 223 221.9 14.57 24,557 224 222.6 14.85 37,892
10 226 223.9 14.54 19,622 227 224.9 14.49 6,841 228 225.4 14.94 19,154
11 227 225.2 14.97 5,986 228 225.6 14.87 1,051 227 225.6 14.52 1,503
* Values based on fewer than 2000 cases are shaded. Exercise caution when using these values.
Table 4.1c. READING - Differences In Medians, Means and Numbers of Students Between StratifiedSamples and the Student Candidate Pool as It Would Have Been Included Using the 2005 Norm StudyInclusion Criteria (Stratified Sample Minus Candidate Pool Values)
Beginning-of-Year Middle-of-Year End-of-Year
Grade Median Mean N Median Mean N Median Mean N
2 1 1.9 -293141 -1 -1.0 -62,020 -1 0.1 -285103
3 -1 0.4 -336600 -1 -0.8 -62,786 -1 -0.5 -320719
4 -1 -0.3 -321975 -1 -0.6 -61,682 -1 -0.9 -314274
5 -1 -0.8 -316335 0 -0.5 -55,063 -2 -1.1 -312307
6 -1 -0.7 -317850 0 -0.4 -46,621 -2 -1.1 -323436
7 -1 -0.7 -337396 0 -0.2 -43,277 -2 -1.1 -330928
8 -1 -0.8 -319799 0 0.0 -35,861 -1 -1.0 -320974
9 -2 -1.2 -201224 -1 -0.3 -18,225 -2 -1.7 -171614
10 -1 -0.4 -112626 1 0.4 -14,198 -1 -0.9 -85094
11 -1 0.0 -24401 -1 -1.5 -4,836 -2 -1.4 -21008
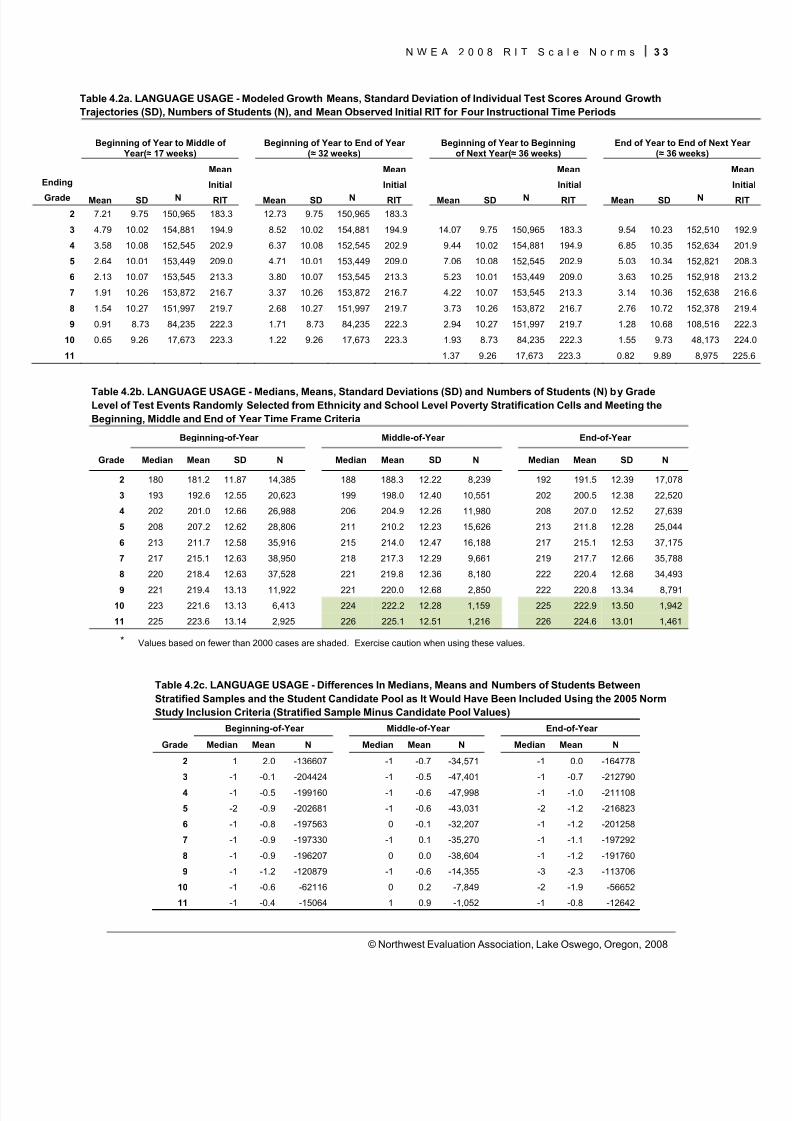
8/7/2019 NWEA Complete Norms2008
http://slidepdf.com/reader/full/nwea-complete-norms2008 43/170
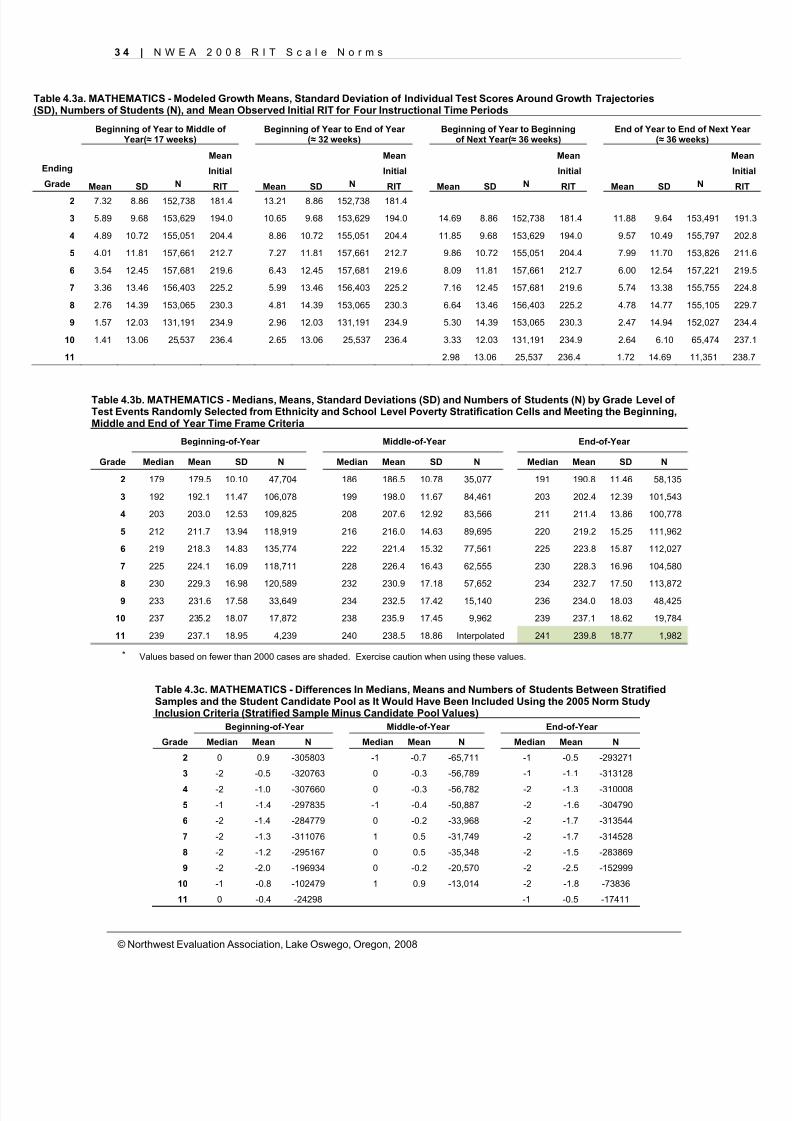
8/7/2019 NWEA Complete Norms2008
http://slidepdf.com/reader/full/nwea-complete-norms2008 44/170
3 4 | N W E A 2 0 0 8 R I T S c a l e N o r m s
© Northwest Evaluation Association, Lake Oswego, Oregon, 2008
Table 4.3a. MATHEMATICS - Modeled Growth Means, Standard Deviation of Individual Test Scores Around Growth Trajectories(SD), Numbers of Students (N), and Mean Observed Initial RIT for Four Instructional Time Periods
Beginning of Year to Middle of Year( ≈ 17 weeks)
Beginning of Year to End of Year (≈ 32 weeks)
Beginning of Year to Beginningof Next Year( ≈ 36 weeks)
End of Year to End of Next Year (≈ 36 weeks)
Mean Mean Mean MeanEnding Initial Initial Initial InitialGrade Mean SD N RIT Mean SD N RIT Mean SD N RIT Mean SD N R
2 7.32 8.86 152,738 181.4 13.21 8.86 152,738 181.4
3 5.89 9.68 153,629 194.0 10.65 9.68 153,629 194.0 14.69 8.86 152,738 181.4 11.88 9.64 153,491 191.3
4 4.89 10.72 155,051 204.4 8.86 10.72 155,051 204.4 11.85 9.68 153,629 194.0 9.57 10.49 155,797 202.8
5 4.01 11.81 157,661 212.7 7.27 11.81 157,661 212.7 9.86 10.72 155,051 204.4 7.99 11.70 153,826 211.6
6 3.54 12.45 157,681 219.6 6.43 12.45 157,681 219.6 8.09 11.81 157,661 212.7 6.00 12.54 157,221 219.5
7 3.36 13.46 156,403 225.2 5.99 13.46 156,403 225.2 7.16 12.45 157,681 219.6 5.74 13.38 155,755 224.8
8 2.76 14.39 153,065 230.3 4.81 14.39 153,065 230.3 6.64 13.46 156,403 225.2 4.78 14.77 155,105 229.7
9 1.57 12.03 131,191 234.9 2.96 12.03 131,191 234.9 5.30 14.39 153,065 230.3 2.47 14.94 152,027 234.4
10 1.41 13.06 25,537 236.4 2.65 13.06 25,537 236.4 3.33 12.03 131,191 234.9 2.64 6.10 65,474 237.1
11 2.98 13.06 25,537 236.4 1.72 14.69 11,351 238.7
Table 4.3b. MATHEMATICS - Medians, Means, Standard Deviations (SD) and Numbers of Students (N) by Grade Level of Test Events Randomly Selected from Ethnicity and School Level Poverty Stratification Cells and Meeting the Beginning,Middle and End of Year Time Frame Criteria
Beginning-of-Year Middle-of-Year End-of-Year
Grade Median Mean SD N Median Mean SD N Median Mean SD N
2 179 179.5 10.10 47,704 186 186.5 10.78 35,077 191 190.8 11.46 58,135
3 192 192.1 11.47 106,078 199 198.0 11.67 84,461 203 202.4 12.39 101,543
4 203 203.0 12.53 109,825 208 207.6 12.92 83,566 211 211.4 13.86 100,778
5 212 211.7 13.94 118,919 216 216.0 14.63 89,695 220 219.2 15.25 111,962
6 219 218.3 14.83 135,774 222 221.4 15.32 77,561 225 223.8 15.87 112,027
7 225 224.1 16.09 118,711 228 226.4 16.43 62,555 230 228.3 16.96 104,580
8 230 229.3 16.98 120,589 232 230.9 17.18 57,652 234 232.7 17.50 113,872
9 233 231.6 17.58 33,649 234 232.5 17.42 15,140 236 234.0 18.03 48,425
10 237 235.2 18.07 17,872 238 235.9 17.45 9,962 239 237.1 18.62 19,784
11 239 237.1 18.95 4,239 240 238.5 18.86 Interpolated 241 239.8 18.77 1,982
* Values based on fewer than 2000 cases are shaded. Exercise caution when using these values.
Table 4.3c. MATHEMATICS - Differences In Medians, Means and Numbers of Students Between StratifiedSamples and the Student Candidate Pool as It Would Have Been Included Using the 2005 Norm StudyInclusion Criteria (Stratified Sample Minus Candidate Pool Values)
Beginning-of-Year Middle-of-Year End-of-Year
Grade Median Mean N Median Mean N Median Mean N
2 0 0.9 -305803 -1 -0.7 -65,711 -1 -0.5 -293271
3 -2 -0.5 -320763 0 -0.3 -56,789 -1 -1.1 -313128
4 -2 -1.0 -307660 0 -0.3 -56,782 -2 -1.3 -310008
5 -1 -1.4 -297835 -1 -0.4 -50,887 -2 -1.6 -304790
6 -2 -1.4 -284779 0 -0.2 -33,968 -2 -1.7 -313544
7 -2 -1.3 -311076 1 0.5 -31,749 -2 -1.7 -314528
8 -2 -1.2 -295167 0 0.5 -35,348 -2 -1.5 -283869
9 -2 -2.0 -196934 0 -0.2 -20,570 -2 -2.5 -152999
10 -1 -0.8 -102479 1 0.9 -13,014 -2 -1.8 -73836
11 0 -0.4 -24298 -1 -0.5 -17411
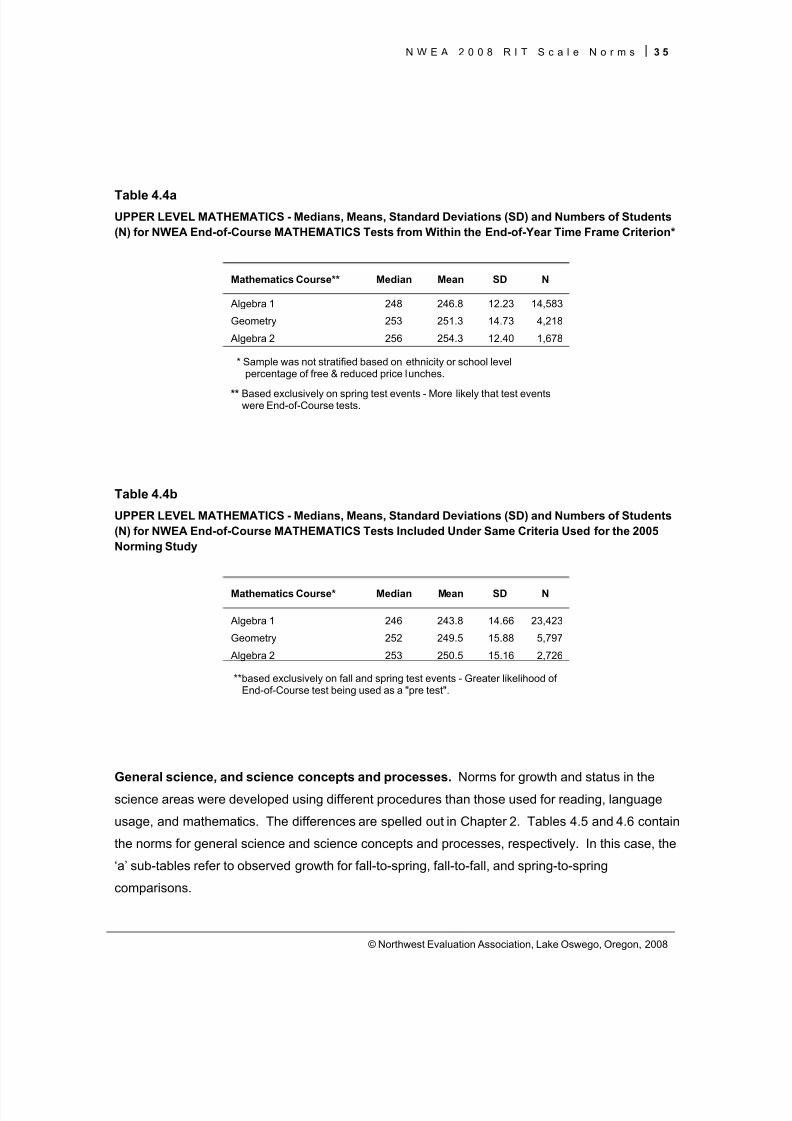
8/7/2019 NWEA Complete Norms2008
http://slidepdf.com/reader/full/nwea-complete-norms2008 45/170
N W E A 2 0 0 8 R I T S c a l e N o r m s 3 5
© Northwest Evaluation Association, Lake Oswego, Oregon, 2008
Table 4.4aUPPER LEVEL MATHEMATICS - Medians, Means, Standard Deviations (SD) and Numbers of Students(N) for NWEA End-of-Course MATHEMATICS Tests from Within the End-of-Year Time Frame Criterion*
Mathematics Course** Median Mean SD N
Algebra 1 248 246.8 12.23 14,583
Geometry 253 251.3 14.73 4,218
Algebra 2 256 254.3 12.40 1,678
* Sample was not stratified based on ethnicity or school levelpercentage of free & reduced price lunches.
**Based exclusively on spring test events - More likely that test eventswere End-of-Course tests.
Table 4.4b
UPPER LEVEL MATHEMATICS - Medians, Means, Standard Deviations (SD) and Numbers of Students(N) for NWEA End-of-Course MATHEMATICS Tests Included Under Same Criteria Used for the 2005Norming Study
Mathematics Course* Median Mean SD N
Algebra 1 246 243.8 14.66 23,423
Geometry 252 249.5 15.88 5,797
Algebra 2 253 250.5 15.16 2,726
**based exclusively on fall and spring test events - Greater likelihood of End-of-Course test being used as a "pre test".
General science, and science concepts and processes. Norms for growth and status in the
science areas were developed using different procedures than those used for reading, language
usage, and mathematics. The differences are spelled out in Chapter 2. Tables 4.5 and 4.6 contain
the norms for general science and science concepts and processes, respectively. In this case, the
‘a’ sub-tables refer to observed growth for fall-to-spring, fall-to-fall, and spring-to-spring
comparisons.
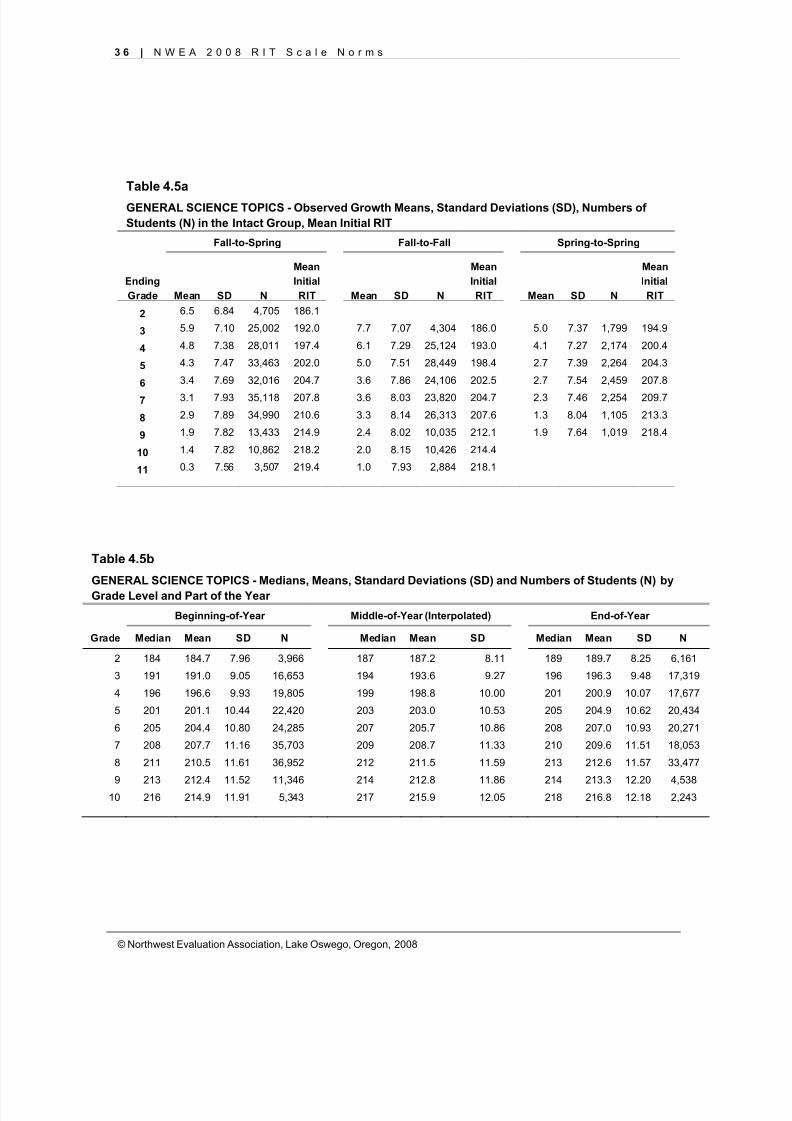
8/7/2019 NWEA Complete Norms2008
http://slidepdf.com/reader/full/nwea-complete-norms2008 46/170
3 6 | N W E A 2 0 0 8 R I T S c a l e N o r m s
© Northwest Evaluation Association, Lake Oswego, Oregon, 2008
Table 4.5a
GENERAL SCIENCE TOPICS - Observed Growth Means, Standard Deviations (SD), Numbers of Students (N) in the Intact Group, Mean Initial RIT
Fall-to-Spring Fall-to-Fall Spring-to-Spring
Mean Mean MeanEnding Initial Initial InitialGrade Mean SD N RIT Mean SD N RIT Mean SD N RIT
2 6.5 6.84 4,705 186.1
3 5.9 7.10 25,002 192.0 7.7 7.07 4,304 186.0 5.0 7.37 1,799 194.9
4 4.8 7.38 28,011 197.4 6.1 7.29 25,124 193.0 4.1 7.27 2,174 200.4
5 4.3 7.47 33,463 202.0 5.0 7.51 28,449 198.4 2.7 7.39 2,264 204.3
6 3.4 7.69 32,016 204.7 3.6 7.86 24,106 202.5 2.7 7.54 2,459 207.8
7 3.1 7.93 35,118 207.8 3.6 8.03 23,820 204.7 2.3 7.46 2,254 209.7
8 2.9 7.89 34,990 210.6 3.3 8.14 26,313 207.6 1.3 8.04 1,105 213.3
9 1.9 7.82 13,433 214.9 2.4 8.02 10,035 212.1 1.9 7.64 1,019 218.4
10 1.4 7.82 10,862 218.2 2.0 8.15 10,426 214.4
11 0.3 7.56 3,507 219.4 1.0 7.93 2,884 218.1
Table 4.5b
GENERAL SCIENCE TOPICS - Medians, Means, Standard Deviations (SD) and Numbers of Students (N) byGrade Level and Part of the Year
Beginning-of-Year Middle-of-Year (Interpolated) End-of-Year
Grade Median Mean SD N Median Mean SD Median Mean SD N
2 184 184.7 7.96 3,966 187 187.2 8.11 189 189.7 8.25 6,161
3 191 191.0 9.05 16,653 194 193.6 9.27 196 196.3 9.48 17,319
4 196 196.6 9.93 19,805 199 198.8 10.00 201 200.9 10.07 17,677
5 201 201.1 10.44 22,420 203 203.0 10.53 205 204.9 10.62 20,434
6 205 204.4 10.80 24,285 207 205.7 10.86 208 207.0 10.93 20,271
7 208 207.7 11.16 35,703 209 208.7 11.33 210 209.6 11.51 18,053
8 211 210.5 11.61 36,952 212 211.5 11.59 213 212.6 11.57 33,477
9 213 212.4 11.52 11,346 214 212.8 11.86 214 213.3 12.20 4,538
10 216 214.9 11.91 5,343 217 215.9 12.05 218 216.8 12.18 2,243
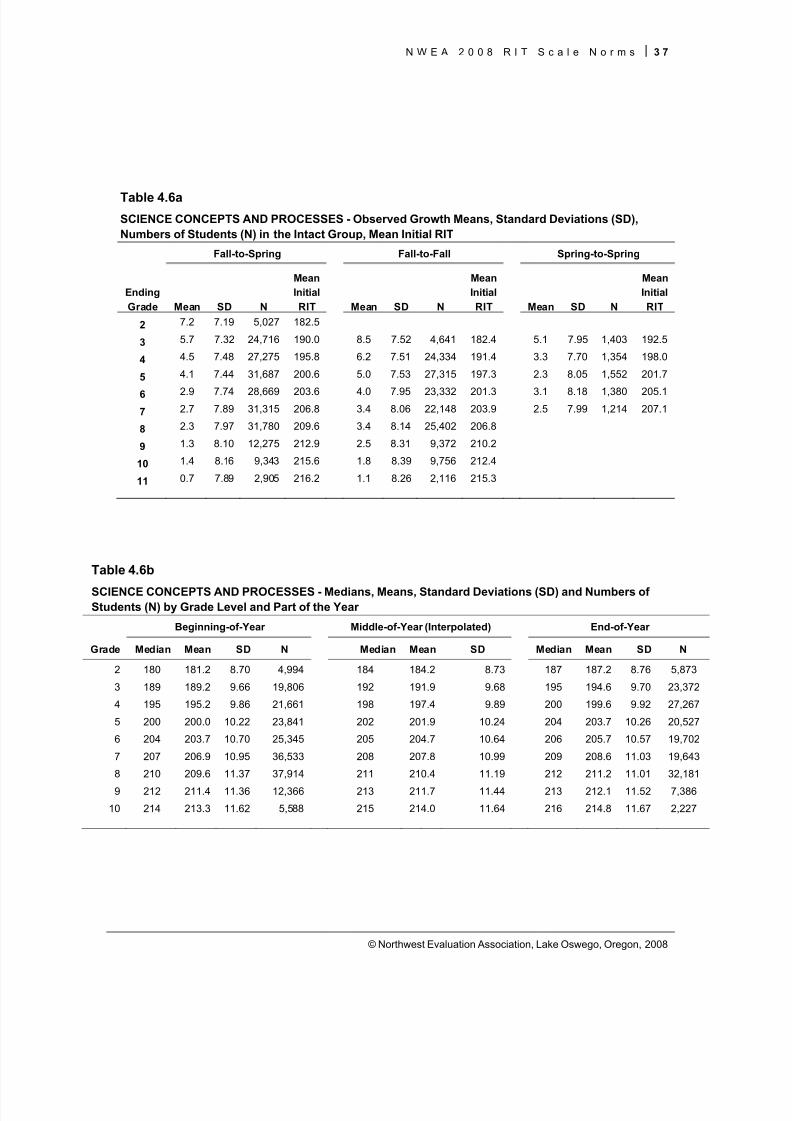
8/7/2019 NWEA Complete Norms2008
http://slidepdf.com/reader/full/nwea-complete-norms2008 47/170
N W E A 2 0 0 8 R I T S c a l e N o r m s 3 7
© Northwest Evaluation Association, Lake Oswego, Oregon, 2008
Table 4.6aSCIENCE CONCEPTS AND PROCESSES - Observed Growth Means, Standard Deviations (SD),Numbers of Students (N) in the Intact Group, Mean Initial RIT
Fall-to-Spring Fall-to-Fall Spring-to-Spring
Mean Mean MeanEnding Initial Initial InitialGrade Mean SD N RIT Mean SD N RIT Mean SD N RIT
2 7.2 7.19 5,027 182.5
3 5.7 7.32 24,716 190.0 8.5 7.52 4,641 182.4 5.1 7.95 1,403 192.5
4 4.5 7.48 27,275 195.8 6.2 7.51 24,334 191.4 3.3 7.70 1,354 198.0
5 4.1 7.44 31,687 200.6 5.0 7.53 27,315 197.3 2.3 8.05 1,552 201.7
6 2.9 7.74 28,669 203.6 4.0 7.95 23,332 201.3 3.1 8.18 1,380 205.17 2.7 7.89 31,315 206.8 3.4 8.06 22,148 203.9 2.5 7.99 1,214 207.1
8 2.3 7.97 31,780 209.6 3.4 8.14 25,402 206.8
9 1.3 8.10 12,275 212.9 2.5 8.31 9,372 210.2
10 1.4 8.16 9,343 215.6 1.8 8.39 9,756 212.4
11 0.7 7.89 2,905 216.2 1.1 8.26 2,116 215.3
Table 4.6b
SCIENCE CONCEPTS AND PROCESSES - Medians, Means, Standard Deviations (SD) and Numbers of Students (N) by Grade Level and Part of the Year
Beginning-of-Year Middle-of-Year (Interpolated) End-of-Year
Grade Median Mean SD N Median Mean SD Median Mean SD N
2 180 181.2 8.70 4,994 184 184.2 8.73 187 187.2 8.76 5,873
3 189 189.2 9.66 19,806 192 191.9 9.68 195 194.6 9.70 23,372
4 195 195.2 9.86 21,661 198 197.4 9.89 200 199.6 9.92 27,267
5 200 200.0 10.22 23,841 202 201.9 10.24 204 203.7 10.26 20,527
6 204 203.7 10.70 25,345 205 204.7 10.64 206 205.7 10.57 19,702
7 207 206.9 10.95 36,533 208 207.8 10.99 209 208.6 11.03 19,643
8 210 209.6 11.37 37,914 211 210.4 11.19 212 211.2 11.01 32,181
9 212 211.4 11.36 12,366 213 211.7 11.44 213 212.1 11.52 7,386
10 214 213.3 11.62 5,588 215 214.0 11.64 216 214.8 11.67 2,227
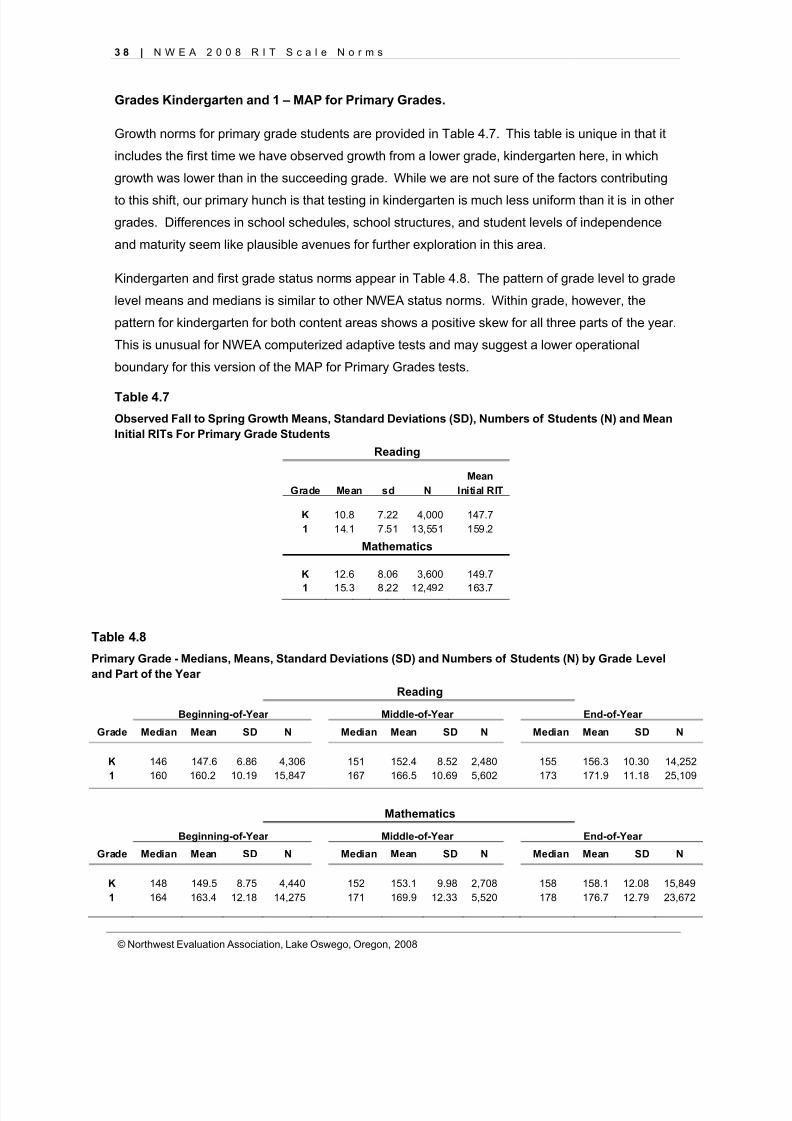
8/7/2019 NWEA Complete Norms2008
http://slidepdf.com/reader/full/nwea-complete-norms2008 48/170
3 8 | N W E A 2 0 0 8 R I T S c a l e N o r m s
© Northwest Evaluation Association, Lake Oswego, Oregon, 2008
Grades Kindergarten and 1 – MAP for Primary Grades.
Growth norms for primary grade students are provided in Table 4.7. This table is unique in that it
includes the first time we have observed growth from a lower grade, kindergarten here, in which
growth was lower than in the succeeding grade. While we are not sure of the factors contributing
to this shift, our primary hunch is that testing in kindergarten is much less uniform than it is in other
grades. Differences in school schedules, school structures, and student levels of independence
and maturity seem like plausible avenues for further exploration in this area.
Kindergarten and first grade status norms appear in Table 4.8. The pattern of grade level to grade
level means and medians is similar to other NWEA status norms. Within grade, however, the
pattern for kindergarten for both content areas shows a positive skew for all three parts of the year.
This is unusual for NWEA computerized adaptive tests and may suggest a lower operational
boundary for this version of the MAP for Primary Grades tests.
Table 4.7
Observed Fall to Spring Growth Means, Standard Deviations (SD), Numbers of Students (N) and MeanInitial RITs For Primary Grade Students
Reading
MeanGrade Mean sd N Initial RIT
K 10.8 7.22 4,000 147.71 14.1 7.51 13,551 159.2
Mathematics
K 12.6 8.06 3,600 149.7
1 15.3 8.22 12,492 163.7
Table 4.8
Primary Grade - Medians, Means, Standard Deviations (SD) and Numbers of Students (N) by Grade Leveland Part of the Year
Reading
Beginning-of-Year Middle-of-Year End-of-Year
Grade Median Mean SD N Median Mean SD N Median Mean SD N
K 146 147.6 6.86 4,306 151 152.4 8.52 2,480 155 156.3 10.30 14,2521 160 160.2 10.19 15,847 167 166.5 10.69 5,602 173 171.9 11.18 25,109
Mathematics
Beginning-of-Year Middle-of-Year End-of-Year
Grade Median Mean SD N Median Mean SD N Median Mean SD N
K 148 149.5 8.75 4,440 152 153.1 9.98 2,708 158 158.1 12.08 15,8491 164 163.4 12.18 14,275 171 169.9 12.33 5,520 178 176.7 12.79 23,672
8/7/2019 NWEA Complete Norms2008
http://slidepdf.com/reader/full/nwea-complete-norms2008 49/170
8/7/2019 NWEA Complete Norms2008
http://slidepdf.com/reader/full/nwea-complete-norms2008 50/170
4 0 | N W E A 2 0 0 8 R I T S c a l e N o r m s
© Northwest Evaluation Association, Lake Oswego, Oregon, 2008
expectation. Norms for subsequent years might be treated additively, differentially weighted, or
treated idiosyncratically based on past performance or substantive theory. Unfortunately, the 2005
RIT point growth norms provide little guidance for choosing from among these alternatives.
To address these limitations for reading, language usage, and mathematics in grades 2 through 10,
we implemented the two level growth models outlined in Chapter 2. As noted, this approach onlyincluded individual test histories with a minimum of three test events. The advantage to this
approach is that growth is modeled as a function of instructional weeks. The instructional-weeks
information present in each student’s test history was used to calculate the mean growth rate for
students starting out at the same RIT level (± 2 RITs). Using this approach, reasonable growth
expectations for students in grades 2 through 8 can be calculated for any number of instructional
weeks that is less than or equal to three full instructional years ( ≈ 108 instructional weeks). For
students in grades 9 and 10, 72 instructional weeks is a more likely maximum period. For the
Tables 5.1a through 5.27b, presented below, mean growth for each RIT value is presented for 17,
32, and 36 instructional weeks from the beginning of the instructional year as well as for 36
instructional weeks from the end of the instructional year to the end of the next instructional year.
RIT point growth norms for general science topics and for science concepts and processes are
presented in Tables 5.28 through 5.45. It is important to note that these norms are based on a
sparser data set than those for reading, language usage, and mathematics. This is due to
differences in testing practices for science between districts, schools, and grade levels. The
structure of the available data did not lend itself to modeling growth as a function of instructional
weeks. For this reason, RIT point growth was calculated as it was in the 2005 norming study – as
the mean difference between tests from two testing seasons when the test scores from the first
testing season were constrained to be equal. The limitation of the data set is obvious in the tables;
only fall-to-spring and fall-to-fall comparisons could be computed.
Finally, the relationship between initial status and growth for early primary grade students is
detailed using the RIT Block Norms procedure developed for the 2002 norms. These norms are
presented in Table 5.46 below.

8/7/2019 NWEA Complete Norms2008
http://slidepdf.com/reader/full/nwea-complete-norms2008 51/170
© Northwest Evaluation Association, Lake Oswego, Oregon, 2008
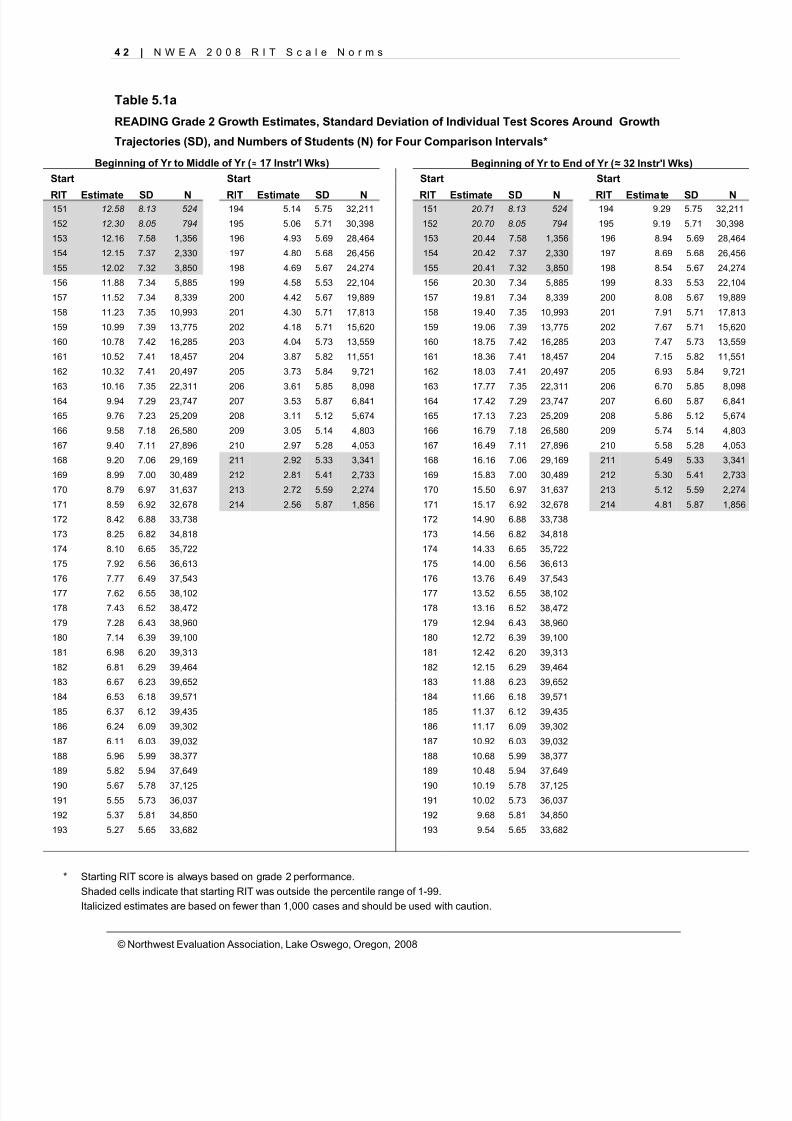
8/7/2019 NWEA Complete Norms2008
http://slidepdf.com/reader/full/nwea-complete-norms2008 52/170
4 2 | N W E A 2 0 0 8 R I T S c a l e N o r m s
© Northwest Evaluation Association, Lake Oswego, Oregon, 2008
Table 5.1a
READING Grade 2 Growth Estimates, Standard Deviation of Individual Test Scores Around Growth
Trajectories (SD), and Numbers of Students (N) for Four Comparison Intervals*
Beginning of Yr to Middle of Yr ( ≈ 17 Instr'l Wks) Beginning of Yr to End of Yr ( ≈ 32 Instr'l Wks)Start Start Start Start
RIT Estimate SD N RIT Estimate SD N RIT Estimate SD N RIT Estimate SD N151 12.58 8.13 524 194 5.14 5.75 32,211 151 20.71 8.13 524 194 9.29 5.75 32,211
152 12.30 8.05 794 195 5.06 5.71 30,398 152 20.70 8.05 794 195 9.19 5.71 30,398
153 12.16 7.58 1,356 196 4.93 5.69 28,464 153 20.44 7.58 1,356 196 8.94 5.69 28,464
154 12.15 7.37 2,330 197 4.80 5.68 26,456 154 20.42 7.37 2,330 197 8.69 5.68 26,456
155 12.02 7.32 3,850 198 4.69 5.67 24,274 155 20.41 7.32 3,850 198 8.54 5.67 24,274
156 11.88 7.34 5,885 199 4.58 5.53 22,104 156 20.30 7.34 5,885 199 8.33 5.53 22,104
157 11.52 7.34 8,339 200 4.42 5.67 19,889 157 19.81 7.34 8,339 200 8.08 5.67 19,889
158 11.23 7.35 10,993 201 4.30 5.71 17,813 158 19.40 7.35 10,993 201 7.91 5.71 17,813
159 10.99 7.39 13,775 202 4.18 5.71 15,620 159 19.06 7.39 13,775 202 7.67 5.71 15,620
160 10.78 7.42 16,285 203 4.04 5.73 13,559 160 18.75 7.42 16,285 203 7.47 5.73 13,559
161 10.52 7.41 18,457 204 3.87 5.82 11,551 161 18.36 7.41 18,457 204 7.15 5.82 11,551
162 10.32 7.41 20,497 205 3.73 5.84 9,721 162 18.03 7.41 20,497 205 6.93 5.84 9,721
163 10.16 7.35 22,311 206 3.61 5.85 8,098 163 17.77 7.35 22,311 206 6.70 5.85 8,098
164 9.94 7.29 23,747 207 3.53 5.87 6,841 164 17.42 7.29 23,747 207 6.60 5.87 6,841
165 9.76 7.23 25,209 208 3.11 5.12 5,674 165 17.13 7.23 25,209 208 5.86 5.12 5,674
166 9.58 7.18 26,580 209 3.05 5.14 4,803 166 16.79 7.18 26,580 209 5.74 5.14 4,803
167 9.40 7.11 27,896 210 2.97 5.28 4,053 167 16.49 7.11 27,896 210 5.58 5.28 4,053
168 9.20 7.06 29,169 211 2.92 5.33 3,341 168 16.16 7.06 29,169 211 5.49 5.33 3,341
169 8.99 7.00 30,489 212 2.81 5.41 2,733 169 15.83 7.00 30,489 212 5.30 5.41 2,733
170 8.79 6.97 31,637 213 2.72 5.59 2,274 170 15.50 6.97 31,637 213 5.12 5.59 2,274
171 8.59 6.92 32,678 214 2.56 5.87 1,856 171 15.17 6.92 32,678 214 4.81 5.87 1,856
172 8.42 6.88 33,738 172 14.90 6.88 33,738
173 8.25 6.82 34,818 173 14.56 6.82 34,818
174 8.10 6.65 35,722 174 14.33 6.65 35,722
175 7.92 6.56 36,613 175 14.00 6.56 36,613
176 7.77 6.49 37,543 176 13.76 6.49 37,543
177 7.62 6.55 38,102 177 13.52 6.55 38,102
178 7.43 6.52 38,472 178 13.16 6.52 38,472
179 7.28 6.43 38,960 179 12.94 6.43 38,960
180 7.14 6.39 39,100 180 12.72 6.39 39,100
181 6.98 6.20 39,313 181 12.42 6.20 39,313
182 6.81 6.29 39,464 182 12.15 6.29 39,464
183 6.67 6.23 39,652 183 11.88 6.23 39,652
184 6.53 6.18 39,571 184 11.66 6.18 39,571
185 6.37 6.12 39,435 185 11.37 6.12 39,435
186 6.24 6.09 39,302 186 11.17 6.09 39,302
187 6.11 6.03 39,032 187 10.92 6.03 39,032
188 5.96 5.99 38,377 188 10.68 5.99 38,377
189 5.82 5.94 37,649 189 10.48 5.94 37,649
190 5.67 5.78 37,125 190 10.19 5.78 37,125191 5.55 5.73 36,037 191 10.02 5.73 36,037
192 5.37 5.81 34,850 192 9.68 5.81 34,850
193 5.27 5.65 33,682 193 9.54 5.65 33,682
* Starting RIT score is always based on grade 2 performance.Shaded cells indicate that starting RIT was outside the percentile range of 1-99.Italicized estimates are based on fewer than 1,000 cases and should be used with caution.
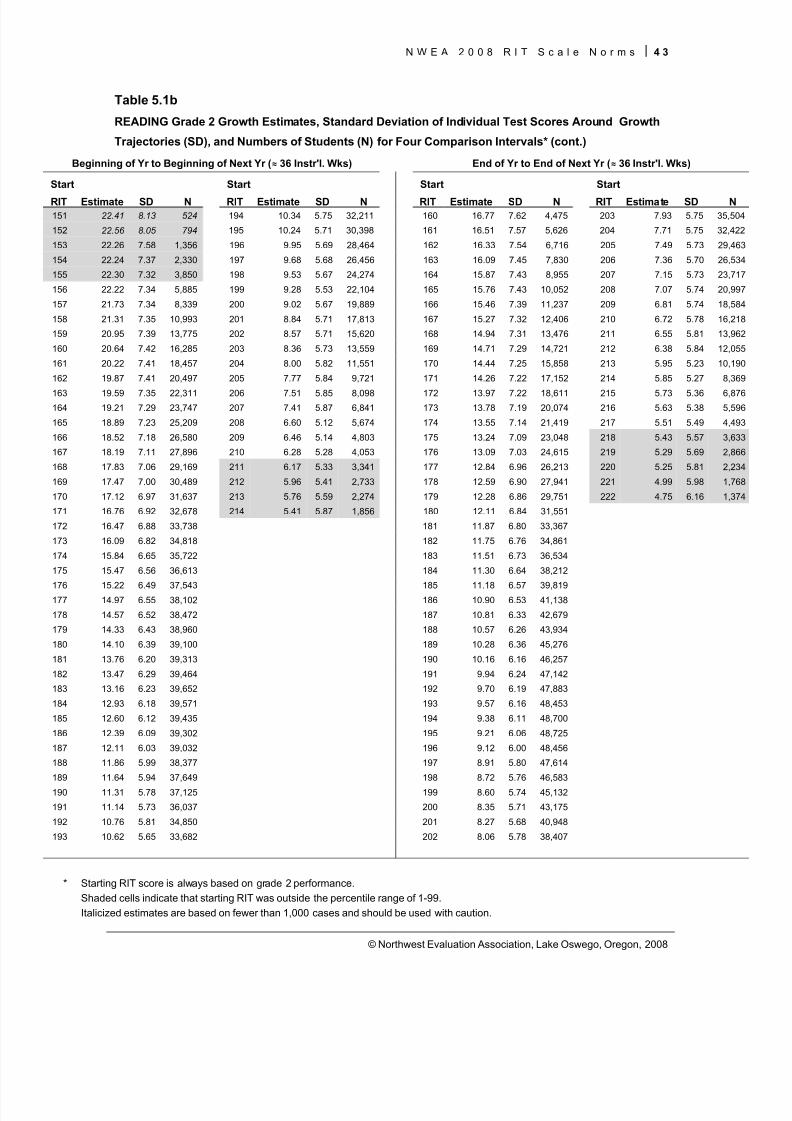
8/7/2019 NWEA Complete Norms2008
http://slidepdf.com/reader/full/nwea-complete-norms2008 53/170
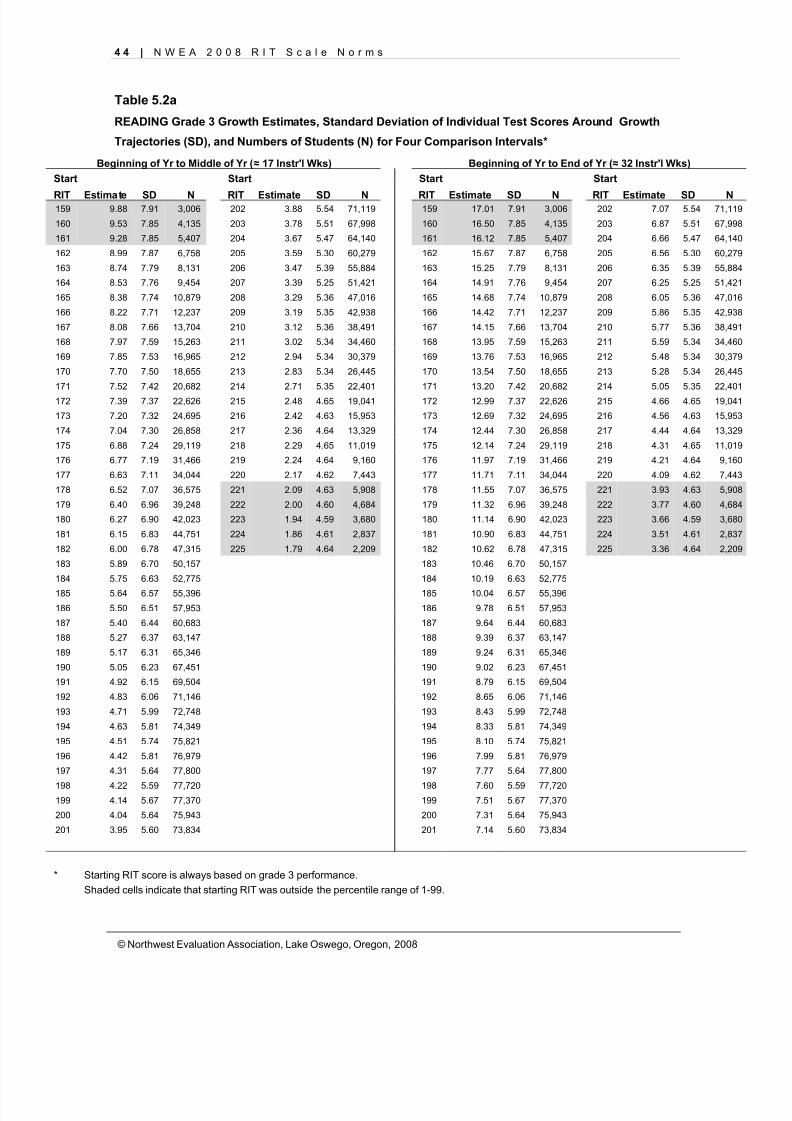
8/7/2019 NWEA Complete Norms2008
http://slidepdf.com/reader/full/nwea-complete-norms2008 54/170
4 4 | N W E A 2 0 0 8 R I T S c a l e N o r m s
© Northwest Evaluation Association, Lake Oswego, Oregon, 2008
Table 5.2a
READING Grade 3 Growth Estimates, Standard Deviation of Individual Test Scores Around Growth
Trajectories (SD), and Numbers of Students (N) for Four Comparison Intervals*
Beginning of Yr to Middle of Yr ( ≈ 17 Instr'l Wks) Beginning of Yr to End of Yr ( ≈ 32 Instr'l Wks)Start Start Start Start
RIT Estimate SD N RIT Estimate SD N RIT Estimate SD N RIT Estimate SD N159 9.88 7.91 3,006 202 3.88 5.54 71,119 159 17.01 7.91 3,006 202 7.07 5.54 71,119
160 9.53 7.85 4,135 203 3.78 5.51 67,998 160 16.50 7.85 4,135 203 6.87 5.51 67,998
161 9.28 7.85 5,407 204 3.67 5.47 64,140 161 16.12 7.85 5,407 204 6.66 5.47 64,140
162 8.99 7.87 6,758 205 3.59 5.30 60,279 162 15.67 7.87 6,758 205 6.56 5.30 60,279
163 8.74 7.79 8,131 206 3.47 5.39 55,884 163 15.25 7.79 8,131 206 6.35 5.39 55,884
164 8.53 7.76 9,454 207 3.39 5.25 51,421 164 14.91 7.76 9,454 207 6.25 5.25 51,421
165 8.38 7.74 10,879 208 3.29 5.36 47,016 165 14.68 7.74 10,879 208 6.05 5.36 47,016
166 8.22 7.71 12,237 209 3.19 5.35 42,938 166 14.42 7.71 12,237 209 5.86 5.35 42,938
167 8.08 7.66 13,704 210 3.12 5.36 38,491 167 14.15 7.66 13,704 210 5.77 5.36 38,491
168 7.97 7.59 15,263 211 3.02 5.34 34,460 168 13.95 7.59 15,263 211 5.59 5.34 34,460
169 7.85 7.53 16,965 212 2.94 5.34 30,379 169 13.76 7.53 16,965 212 5.48 5.34 30,379
170 7.70 7.50 18,655 213 2.83 5.34 26,445 170 13.54 7.50 18,655 213 5.28 5.34 26,445
171 7.52 7.42 20,682 214 2.71 5.35 22,401 171 13.20 7.42 20,682 214 5.05 5.35 22,401
172 7.39 7.37 22,626 215 2.48 4.65 19,041 172 12.99 7.37 22,626 215 4.66 4.65 19,041
173 7.20 7.32 24,695 216 2.42 4.63 15,953 173 12.69 7.32 24,695 216 4.56 4.63 15,953
174 7.04 7.30 26,858 217 2.36 4.64 13,329 174 12.44 7.30 26,858 217 4.44 4.64 13,329
175 6.88 7.24 29,119 218 2.29 4.65 11,019 175 12.14 7.24 29,119 218 4.31 4.65 11,019
176 6.77 7.19 31,466 219 2.24 4.64 9,160 176 11.97 7.19 31,466 219 4.21 4.64 9,160
177 6.63 7.11 34,044 220 2.17 4.62 7,443 177 11.71 7.11 34,044 220 4.09 4.62 7,443
178 6.52 7.07 36,575 221 2.09 4.63 5,908 178 11.55 7.07 36,575 221 3.93 4.63 5,908
179 6.40 6.96 39,248 222 2.00 4.60 4,684 179 11.32 6.96 39,248 222 3.77 4.60 4,684
180 6.27 6.90 42,023 223 1.94 4.59 3,680 180 11.14 6.90 42,023 223 3.66 4.59 3,680
181 6.15 6.83 44,751 224 1.86 4.61 2,837 181 10.90 6.83 44,751 224 3.51 4.61 2,837
182 6.00 6.78 47,315 225 1.79 4.64 2,209 182 10.62 6.78 47,315 225 3.36 4.64 2,209
183 5.89 6.70 50,157 183 10.46 6.70 50,157
184 5.75 6.63 52,775 184 10.19 6.63 52,775
185 5.64 6.57 55,396 185 10.04 6.57 55,396
186 5.50 6.51 57,953 186 9.78 6.51 57,953
187 5.40 6.44 60,683 187 9.64 6.44 60,683
188 5.27 6.37 63,147 188 9.39 6.37 63,147
189 5.17 6.31 65,346 189 9.24 6.31 65,346
190 5.05 6.23 67,451 190 9.02 6.23 67,451
191 4.92 6.15 69,504 191 8.79 6.15 69,504
192 4.83 6.06 71,146 192 8.65 6.06 71,146
193 4.71 5.99 72,748 193 8.43 5.99 72,748
194 4.63 5.81 74,349 194 8.33 5.81 74,349
195 4.51 5.74 75,821 195 8.10 5.74 75,821
196 4.42 5.81 76,979 196 7.99 5.81 76,979
197 4.31 5.64 77,800 197 7.77 5.64 77,800
198 4.22 5.59 77,720 198 7.60 5.59 77,720199 4.14 5.67 77,370 199 7.51 5.67 77,370
200 4.04 5.64 75,943 200 7.31 5.64 75,943
201 3.95 5.60 73,834 201 7.14 5.60 73,834
* Starting RIT score is always based on grade 3 performance.Shaded cells indicate that starting RIT was outside the percentile range of 1-99.
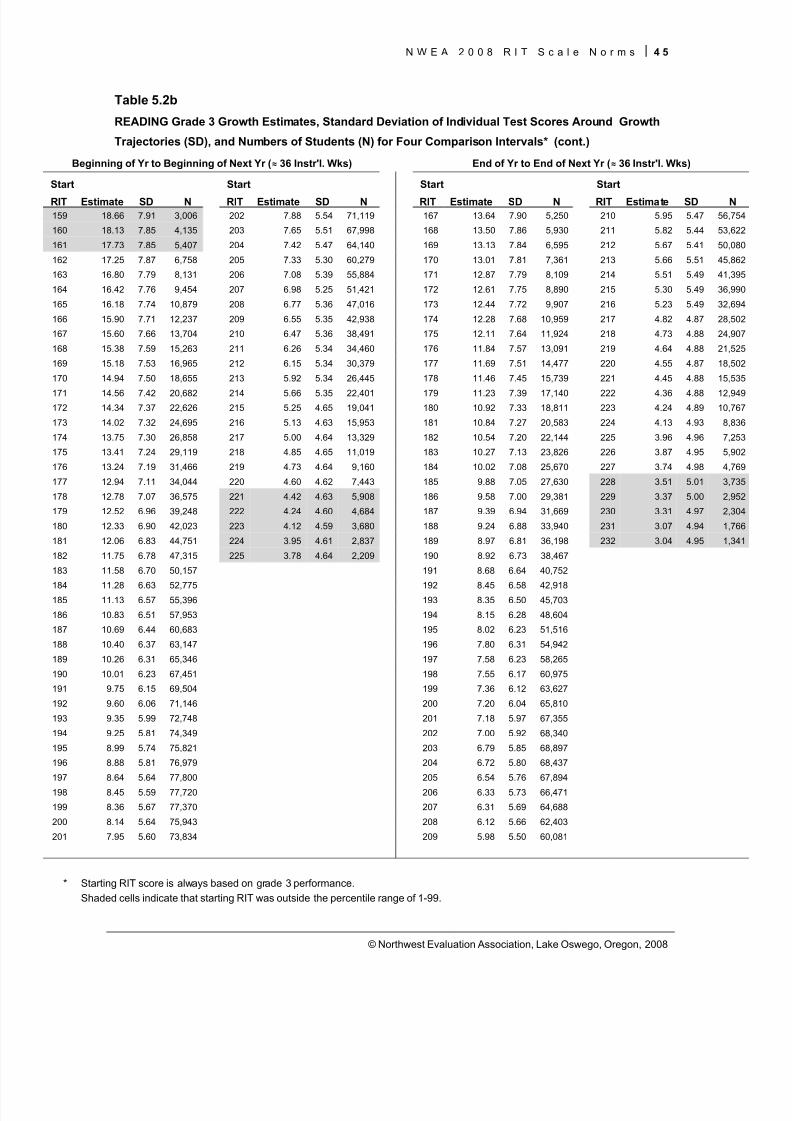
8/7/2019 NWEA Complete Norms2008
http://slidepdf.com/reader/full/nwea-complete-norms2008 55/170
N W E A 2 0 0 8 R I T S c a l e N o r m s 4 5
© Northwest Evaluation Association, Lake Oswego, Oregon, 2008
Table 5.2b
READING Grade 3 Growth Estimates, Standard Deviation of Individual Test Scores Around Growth
Trajectories (SD), and Numbers of Students (N) for Four Comparison Intervals* (cont.)
Beginning of Yr to Beginning of Next Yr ( ≈ 36 Instr'l. Wks) End of Yr to End of Next Yr ( ≈ 36 Instr'l. Wks)
Start Start Start Start
RIT Estimate SD N RIT Estimate SD N RIT Estimate SD N RIT Estimate SD N159 18.66 7.91 3,006 202 7.88 5.54 71,119 167 13.64 7.90 5,250 210 5.95 5.47 56,754
160 18.13 7.85 4,135 203 7.65 5.51 67,998 168 13.50 7.86 5,930 211 5.82 5.44 53,622
161 17.73 7.85 5,407 204 7.42 5.47 64,140 169 13.13 7.84 6,595 212 5.67 5.41 50,080
162 17.25 7.87 6,758 205 7.33 5.30 60,279 170 13.01 7.81 7,361 213 5.66 5.51 45,862
163 16.80 7.79 8,131 206 7.08 5.39 55,884 171 12.87 7.79 8,109 214 5.51 5.49 41,395
164 16.42 7.76 9,454 207 6.98 5.25 51,421 172 12.61 7.75 8,890 215 5.30 5.49 36,990
165 16.18 7.74 10,879 208 6.77 5.36 47,016 173 12.44 7.72 9,907 216 5.23 5.49 32,694
166 15.90 7.71 12,237 209 6.55 5.35 42,938 174 12.28 7.68 10,959 217 4.82 4.87 28,502
167 15.60 7.66 13,704 210 6.47 5.36 38,491 175 12.11 7.64 11,924 218 4.73 4.88 24,907
168 15.38 7.59 15,263 211 6.26 5.34 34,460 176 11.84 7.57 13,091 219 4.64 4.88 21,525
169 15.18 7.53 16,965 212 6.15 5.34 30,379 177 11.69 7.51 14,477 220 4.55 4.87 18,502
170 14.94 7.50 18,655 213 5.92 5.34 26,445 178 11.46 7.45 15,739 221 4.45 4.88 15,535
171 14.56 7.42 20,682 214 5.66 5.35 22,401 179 11.23 7.39 17,140 222 4.36 4.88 12,949172 14.34 7.37 22,626 215 5.25 4.65 19,041 180 10.92 7.33 18,811 223 4.24 4.89 10,767
173 14.02 7.32 24,695 216 5.13 4.63 15,953 181 10.84 7.27 20,583 224 4.13 4.93 8,836
174 13.75 7.30 26,858 217 5.00 4.64 13,329 182 10.54 7.20 22,144 225 3.96 4.96 7,253
175 13.41 7.24 29,119 218 4.85 4.65 11,019 183 10.27 7.13 23,826 226 3.87 4.95 5,902
176 13.24 7.19 31,466 219 4.73 4.64 9,160 184 10.02 7.08 25,670 227 3.74 4.98 4,769
177 12.94 7.11 34,044 220 4.60 4.62 7,443 185 9.88 7.05 27,630 228 3.51 5.01 3,735
178 12.78 7.07 36,575 221 4.42 4.63 5,908 186 9.58 7.00 29,381 229 3.37 5.00 2,952
179 12.52 6.96 39,248 222 4.24 4.60 4,684 187 9.39 6.94 31,669 230 3.31 4.97 2,304
180 12.33 6.90 42,023 223 4.12 4.59 3,680 188 9.24 6.88 33,940 231 3.07 4.94 1,766
181 12.06 6.83 44,751 224 3.95 4.61 2,837 189 8.97 6.81 36,198 232 3.04 4.95 1,341
182 11.75 6.78 47,315 225 3.78 4.64 2,209 190 8.92 6.73 38,467
183 11.58 6.70 50,157 191 8.68 6.64 40,752
184 11.28 6.63 52,775 192 8.45 6.58 42,918185 11.13 6.57 55,396 193 8.35 6.50 45,703
186 10.83 6.51 57,953 194 8.15 6.28 48,604
187 10.69 6.44 60,683 195 8.02 6.23 51,516
188 10.40 6.37 63,147 196 7.80 6.31 54,942
189 10.26 6.31 65,346 197 7.58 6.23 58,265
190 10.01 6.23 67,451 198 7.55 6.17 60,975
191 9.75 6.15 69,504 199 7.36 6.12 63,627
192 9.60 6.06 71,146 200 7.20 6.04 65,810
193 9.35 5.99 72,748 201 7.18 5.97 67,355
194 9.25 5.81 74,349 202 7.00 5.92 68,340
195 8.99 5.74 75,821 203 6.79 5.85 68,897
196 8.88 5.81 76,979 204 6.72 5.80 68,437
197 8.64 5.64 77,800 205 6.54 5.76 67,894
198 8.45 5.59 77,720 206 6.33 5.73 66,471
199 8.36 5.67 77,370 207 6.31 5.69 64,688
200 8.14 5.64 75,943 208 6.12 5.66 62,403
201 7.95 5.60 73,834 209 5.98 5.50 60,081
* Starting RIT score is always based on grade 3 performance.Shaded cells indicate that starting RIT was outside the percentile range of 1-99.
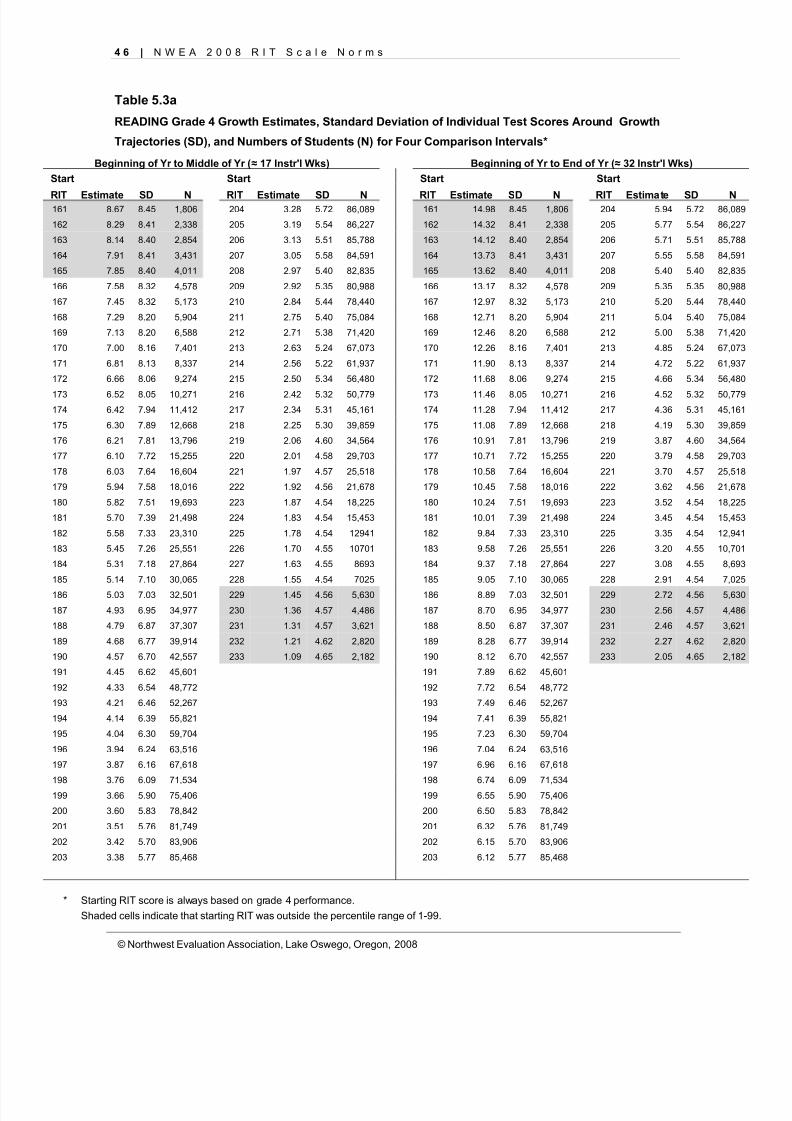
8/7/2019 NWEA Complete Norms2008
http://slidepdf.com/reader/full/nwea-complete-norms2008 56/170
4 6 | N W E A 2 0 0 8 R I T S c a l e N o r m s
© Northwest Evaluation Association, Lake Oswego, Oregon, 2008
Table 5.3a
READING Grade 4 Growth Estimates, Standard Deviation of Individual Test Scores Around Growth
Trajectories (SD), and Numbers of Students (N) for Four Comparison Intervals*
Beginning of Yr to Middle of Yr ( ≈ 17 Instr'l Wks) Beginning of Yr to End of Yr ( ≈ 32 Instr'l Wks)Start Start Start Start
RIT Estimate SD N RIT Estimate SD N RIT Estimate SD N RIT Estimate SD N161 8.67 8.45 1,806 204 3.28 5.72 86,089 161 14.98 8.45 1,806 204 5.94 5.72 86,089
162 8.29 8.41 2,338 205 3.19 5.54 86,227 162 14.32 8.41 2,338 205 5.77 5.54 86,227
163 8.14 8.40 2,854 206 3.13 5.51 85,788 163 14.12 8.40 2,854 206 5.71 5.51 85,788
164 7.91 8.41 3,431 207 3.05 5.58 84,591 164 13.73 8.41 3,431 207 5.55 5.58 84,591
165 7.85 8.40 4,011 208 2.97 5.40 82,835 165 13.62 8.40 4,011 208 5.40 5.40 82,835
166 7.58 8.32 4,578 209 2.92 5.35 80,988 166 13.17 8.32 4,578 209 5.35 5.35 80,988
167 7.45 8.32 5,173 210 2.84 5.44 78,440 167 12.97 8.32 5,173 210 5.20 5.44 78,440
168 7.29 8.20 5,904 211 2.75 5.40 75,084 168 12.71 8.20 5,904 211 5.04 5.40 75,084
169 7.13 8.20 6,588 212 2.71 5.38 71,420 169 12.46 8.20 6,588 212 5.00 5.38 71,420
170 7.00 8.16 7,401 213 2.63 5.24 67,073 170 12.26 8.16 7,401 213 4.85 5.24 67,073
171 6.81 8.13 8,337 214 2.56 5.22 61,937 171 11.90 8.13 8,337 214 4.72 5.22 61,937
172 6.66 8.06 9,274 215 2.50 5.34 56,480 172 11.68 8.06 9,274 215 4.66 5.34 56,480
173 6.52 8.05 10,271 216 2.42 5.32 50,779 173 11.46 8.05 10,271 216 4.52 5.32 50,779174 6.42 7.94 11,412 217 2.34 5.31 45,161 174 11.28 7.94 11,412 217 4.36 5.31 45,161
175 6.30 7.89 12,668 218 2.25 5.30 39,859 175 11.08 7.89 12,668 218 4.19 5.30 39,859
176 6.21 7.81 13,796 219 2.06 4.60 34,564 176 10.91 7.81 13,796 219 3.87 4.60 34,564
177 6.10 7.72 15,255 220 2.01 4.58 29,703 177 10.71 7.72 15,255 220 3.79 4.58 29,703
178 6.03 7.64 16,604 221 1.97 4.57 25,518 178 10.58 7.64 16,604 221 3.70 4.57 25,518
179 5.94 7.58 18,016 222 1.92 4.56 21,678 179 10.45 7.58 18,016 222 3.62 4.56 21,678
180 5.82 7.51 19,693 223 1.87 4.54 18,225 180 10.24 7.51 19,693 223 3.52 4.54 18,225
181 5.70 7.39 21,498 224 1.83 4.54 15,453 181 10.01 7.39 21,498 224 3.45 4.54 15,453
182 5.58 7.33 23,310 225 1.78 4.54 12941 182 9.84 7.33 23,310 225 3.35 4.54 12,941
183 5.45 7.26 25,551 226 1.70 4.55 10701 183 9.58 7.26 25,551 226 3.20 4.55 10,701
184 5.31 7.18 27,864 227 1.63 4.55 8693 184 9.37 7.18 27,864 227 3.08 4.55 8,693
185 5.14 7.10 30,065 228 1.55 4.54 7025 185 9.05 7.10 30,065 228 2.91 4.54 7,025
186 5.03 7.03 32,501 229 1.45 4.56 5,630 186 8.89 7.03 32,501 229 2.72 4.56 5,630
187 4.93 6.95 34,977 230 1.36 4.57 4,486 187 8.70 6.95 34,977 230 2.56 4.57 4,486
188 4.79 6.87 37,307 231 1.31 4.57 3,621 188 8.50 6.87 37,307 231 2.46 4.57 3,621
189 4.68 6.77 39,914 232 1.21 4.62 2,820 189 8.28 6.77 39,914 232 2.27 4.62 2,820
190 4.57 6.70 42,557 233 1.09 4.65 2,182 190 8.12 6.70 42,557 233 2.05 4.65 2,182
191 4.45 6.62 45,601 191 7.89 6.62 45,601
192 4.33 6.54 48,772 192 7.72 6.54 48,772
193 4.21 6.46 52,267 193 7.49 6.46 52,267
194 4.14 6.39 55,821 194 7.41 6.39 55,821
195 4.04 6.30 59,704 195 7.23 6.30 59,704
196 3.94 6.24 63,516 196 7.04 6.24 63,516
197 3.87 6.16 67,618 197 6.96 6.16 67,618
198 3.76 6.09 71,534 198 6.74 6.09 71,534
199 3.66 5.90 75,406 199 6.55 5.90 75,406
200 3.60 5.83 78,842 200 6.50 5.83 78,842
201 3.51 5.76 81,749 201 6.32 5.76 81,749
202 3.42 5.70 83,906 202 6.15 5.70 83,906
203 3.38 5.77 85,468 203 6.12 5.77 85,468
* Starting RIT score is always based on grade 4 performance.Shaded cells indicate that starting RIT was outside the percentile range of 1-99.
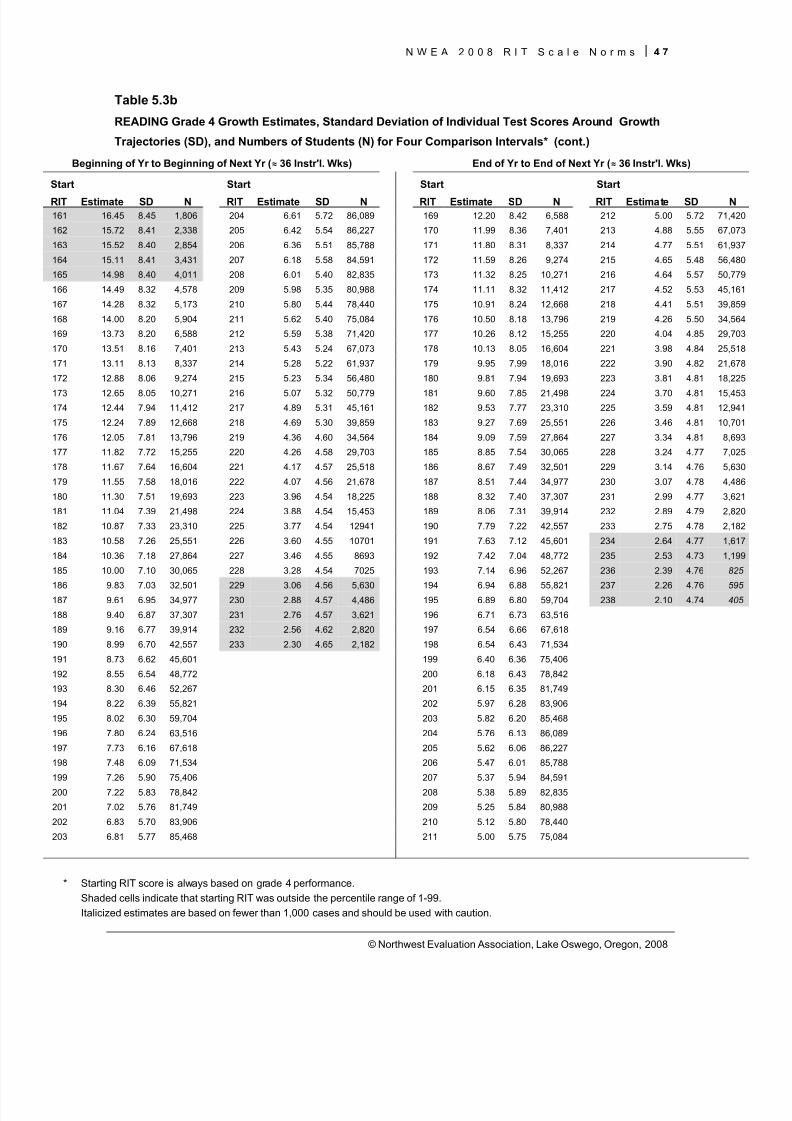
8/7/2019 NWEA Complete Norms2008
http://slidepdf.com/reader/full/nwea-complete-norms2008 57/170
N W E A 2 0 0 8 R I T S c a l e N o r m s 4 7
© Northwest Evaluation Association, Lake Oswego, Oregon, 2008
Table 5.3b
READING Grade 4 Growth Estimates, Standard Deviation of Individual Test Scores Around Growth
Trajectories (SD), and Numbers of Students (N) for Four Comparison Intervals* (cont.)
Beginning of Yr to Beginning of Next Yr ( ≈ 36 Instr'l. Wks) End of Yr to End of Next Yr ( ≈ 36 Instr'l. Wks)
Start Start Start Start
RIT Estimate SD N RIT Estimate SD N RIT Estimate SD N RIT Estimate SD N161 16.45 8.45 1,806 204 6.61 5.72 86,089 169 12.20 8.42 6,588 212 5.00 5.72 71,420
162 15.72 8.41 2,338 205 6.42 5.54 86,227 170 11.99 8.36 7,401 213 4.88 5.55 67,073
163 15.52 8.40 2,854 206 6.36 5.51 85,788 171 11.80 8.31 8,337 214 4.77 5.51 61,937
164 15.11 8.41 3,431 207 6.18 5.58 84,591 172 11.59 8.26 9,274 215 4.65 5.48 56,480
165 14.98 8.40 4,011 208 6.01 5.40 82,835 173 11.32 8.25 10,271 216 4.64 5.57 50,779
166 14.49 8.32 4,578 209 5.98 5.35 80,988 174 11.11 8.32 11,412 217 4.52 5.53 45,161
167 14.28 8.32 5,173 210 5.80 5.44 78,440 175 10.91 8.24 12,668 218 4.41 5.51 39,859
168 14.00 8.20 5,904 211 5.62 5.40 75,084 176 10.50 8.18 13,796 219 4.26 5.50 34,564
169 13.73 8.20 6,588 212 5.59 5.38 71,420 177 10.26 8.12 15,255 220 4.04 4.85 29,703
170 13.51 8.16 7,401 213 5.43 5.24 67,073 178 10.13 8.05 16,604 221 3.98 4.84 25,518
171 13.11 8.13 8,337 214 5.28 5.22 61,937 179 9.95 7.99 18,016 222 3.90 4.82 21,678
172 12.88 8.06 9,274 215 5.23 5.34 56,480 180 9.81 7.94 19,693 223 3.81 4.81 18,225
173 12.65 8.05 10,271 216 5.07 5.32 50,779 181 9.60 7.85 21,498 224 3.70 4.81 15,453174 12.44 7.94 11,412 217 4.89 5.31 45,161 182 9.53 7.77 23,310 225 3.59 4.81 12,941
175 12.24 7.89 12,668 218 4.69 5.30 39,859 183 9.27 7.69 25,551 226 3.46 4.81 10,701
176 12.05 7.81 13,796 219 4.36 4.60 34,564 184 9.09 7.59 27,864 227 3.34 4.81 8,693
177 11.82 7.72 15,255 220 4.26 4.58 29,703 185 8.85 7.54 30,065 228 3.24 4.77 7,025
178 11.67 7.64 16,604 221 4.17 4.57 25,518 186 8.67 7.49 32,501 229 3.14 4.76 5,630
179 11.55 7.58 18,016 222 4.07 4.56 21,678 187 8.51 7.44 34,977 230 3.07 4.78 4,486
180 11.30 7.51 19,693 223 3.96 4.54 18,225 188 8.32 7.40 37,307 231 2.99 4.77 3,621
181 11.04 7.39 21,498 224 3.88 4.54 15,453 189 8.06 7.31 39,914 232 2.89 4.79 2,820
182 10.87 7.33 23,310 225 3.77 4.54 12941 190 7.79 7.22 42,557 233 2.75 4.78 2,182
183 10.58 7.26 25,551 226 3.60 4.55 10701 191 7.63 7.12 45,601 234 2.64 4.77 1,617
184 10.36 7.18 27,864 227 3.46 4.55 8693 192 7.42 7.04 48,772 235 2.53 4.73 1,199
185 10.00 7.10 30,065 228 3.28 4.54 7025 193 7.14 6.96 52,267 236 2.39 4.76 825
186 9.83 7.03 32,501 229 3.06 4.56 5,630 194 6.94 6.88 55,821 237 2.26 4.76 595187 9.61 6.95 34,977 230 2.88 4.57 4,486 195 6.89 6.80 59,704 238 2.10 4.74 405
188 9.40 6.87 37,307 231 2.76 4.57 3,621 196 6.71 6.73 63,516
189 9.16 6.77 39,914 232 2.56 4.62 2,820 197 6.54 6.66 67,618
190 8.99 6.70 42,557 233 2.30 4.65 2,182 198 6.54 6.43 71,534
191 8.73 6.62 45,601 199 6.40 6.36 75,406
192 8.55 6.54 48,772 200 6.18 6.43 78,842
193 8.30 6.46 52,267 201 6.15 6.35 81,749
194 8.22 6.39 55,821 202 5.97 6.28 83,906
195 8.02 6.30 59,704 203 5.82 6.20 85,468
196 7.80 6.24 63,516 204 5.76 6.13 86,089
197 7.73 6.16 67,618 205 5.62 6.06 86,227
198 7.48 6.09 71,534 206 5.47 6.01 85,788
199 7.26 5.90 75,406 207 5.37 5.94 84,591
200 7.22 5.83 78,842 208 5.38 5.89 82,835
201 7.02 5.76 81,749 209 5.25 5.84 80,988
202 6.83 5.70 83,906 210 5.12 5.80 78,440
203 6.81 5.77 85,468 211 5.00 5.75 75,084
* Starting RIT score is always based on grade 4 performance.Shaded cells indicate that starting RIT was outside the percentile range of 1-99.Italicized estimates are based on fewer than 1,000 cases and should be used with caution.
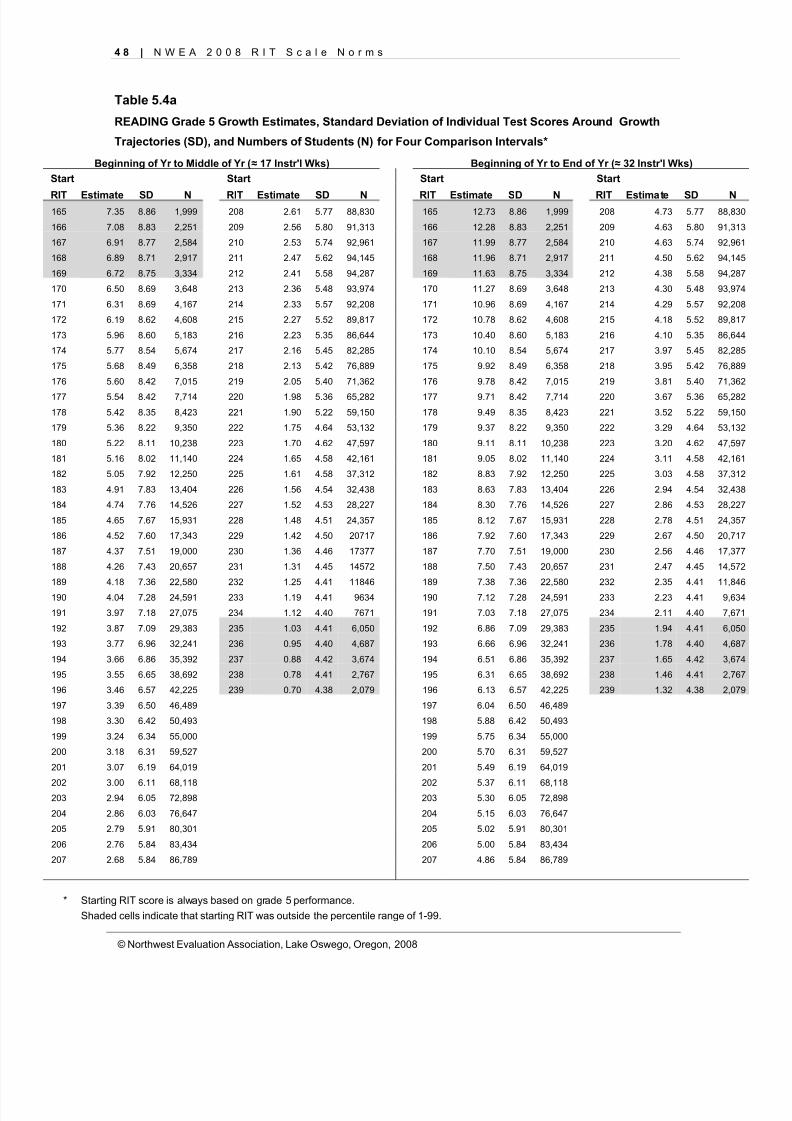
8/7/2019 NWEA Complete Norms2008
http://slidepdf.com/reader/full/nwea-complete-norms2008 58/170
4 8 | N W E A 2 0 0 8 R I T S c a l e N o r m s
© Northwest Evaluation Association, Lake Oswego, Oregon, 2008
Table 5.4a
READING Grade 5 Growth Estimates, Standard Deviation of Individual Test Scores Around Growth
Trajectories (SD), and Numbers of Students (N) for Four Comparison Intervals*
Beginning of Yr to Middle of Yr ( ≈ 17 Instr'l Wks) Beginning of Yr to End of Yr ( ≈ 32 Instr'l Wks)Start Start Start Start
RIT Estimate SD N RIT Estimate SD N RIT Estimate SD N RIT Estimate SD N165 7.35 8.86 1,999 208 2.61 5.77 88,830 165 12.73 8.86 1,999 208 4.73 5.77 88,830
166 7.08 8.83 2,251 209 2.56 5.80 91,313 166 12.28 8.83 2,251 209 4.63 5.80 91,313
167 6.91 8.77 2,584 210 2.53 5.74 92,961 167 11.99 8.77 2,584 210 4.63 5.74 92,961
168 6.89 8.71 2,917 211 2.47 5.62 94,145 168 11.96 8.71 2,917 211 4.50 5.62 94,145
169 6.72 8.75 3,334 212 2.41 5.58 94,287 169 11.63 8.75 3,334 212 4.38 5.58 94,287
170 6.50 8.69 3,648 213 2.36 5.48 93,974 170 11.27 8.69 3,648 213 4.30 5.48 93,974
171 6.31 8.69 4,167 214 2.33 5.57 92,208 171 10.96 8.69 4,167 214 4.29 5.57 92,208
172 6.19 8.62 4,608 215 2.27 5.52 89,817 172 10.78 8.62 4,608 215 4.18 5.52 89,817
173 5.96 8.60 5,183 216 2.23 5.35 86,644 173 10.40 8.60 5,183 216 4.10 5.35 86,644
174 5.77 8.54 5,674 217 2.16 5.45 82,285 174 10.10 8.54 5,674 217 3.97 5.45 82,285
175 5.68 8.49 6,358 218 2.13 5.42 76,889 175 9.92 8.49 6,358 218 3.95 5.42 76,889
176 5.60 8.42 7,015 219 2.05 5.40 71,362 176 9.78 8.42 7,015 219 3.81 5.40 71,362
177 5.54 8.42 7,714 220 1.98 5.36 65,282 177 9.71 8.42 7,714 220 3.67 5.36 65,282
178 5.42 8.35 8,423 221 1.90 5.22 59,150 178 9.49 8.35 8,423 221 3.52 5.22 59,150
179 5.36 8.22 9,350 222 1.75 4.64 53,132 179 9.37 8.22 9,350 222 3.29 4.64 53,132
180 5.22 8.11 10,238 223 1.70 4.62 47,597 180 9.11 8.11 10,238 223 3.20 4.62 47,597
181 5.16 8.02 11,140 224 1.65 4.58 42,161 181 9.05 8.02 11,140 224 3.11 4.58 42,161
182 5.05 7.92 12,250 225 1.61 4.58 37,312 182 8.83 7.92 12,250 225 3.03 4.58 37,312
183 4.91 7.83 13,404 226 1.56 4.54 32,438 183 8.63 7.83 13,404 226 2.94 4.54 32,438
184 4.74 7.76 14,526 227 1.52 4.53 28,227 184 8.30 7.76 14,526 227 2.86 4.53 28,227
185 4.65 7.67 15,931 228 1.48 4.51 24,357 185 8.12 7.67 15,931 228 2.78 4.51 24,357
186 4.52 7.60 17,343 229 1.42 4.50 20717 186 7.92 7.60 17,343 229 2.67 4.50 20,717
187 4.37 7.51 19,000 230 1.36 4.46 17377 187 7.70 7.51 19,000 230 2.56 4.46 17,377
188 4.26 7.43 20,657 231 1.31 4.45 14572 188 7.50 7.43 20,657 231 2.47 4.45 14,572
189 4.18 7.36 22,580 232 1.25 4.41 11846 189 7.38 7.36 22,580 232 2.35 4.41 11,846
190 4.04 7.28 24,591 233 1.19 4.41 9634 190 7.12 7.28 24,591 233 2.23 4.41 9,634
191 3.97 7.18 27,075 234 1.12 4.40 7671 191 7.03 7.18 27,075 234 2.11 4.40 7,671
192 3.87 7.09 29,383 235 1.03 4.41 6,050 192 6.86 7.09 29,383 235 1.94 4.41 6,050
193 3.77 6.96 32,241 236 0.95 4.40 4,687 193 6.66 6.96 32,241 236 1.78 4.40 4,687
194 3.66 6.86 35,392 237 0.88 4.42 3,674 194 6.51 6.86 35,392 237 1.65 4.42 3,674
195 3.55 6.65 38,692 238 0.78 4.41 2,767 195 6.31 6.65 38,692 238 1.46 4.41 2,767
196 3.46 6.57 42,225 239 0.70 4.38 2,079 196 6.13 6.57 42,225 239 1.32 4.38 2,079
197 3.39 6.50 46,489 197 6.04 6.50 46,489
198 3.30 6.42 50,493 198 5.88 6.42 50,493
199 3.24 6.34 55,000 199 5.75 6.34 55,000
200 3.18 6.31 59,527 200 5.70 6.31 59,527
201 3.07 6.19 64,019 201 5.49 6.19 64,019
202 3.00 6.11 68,118 202 5.37 6.11 68,118203 2.94 6.05 72,898 203 5.30 6.05 72,898
204 2.86 6.03 76,647 204 5.15 6.03 76,647
205 2.79 5.91 80,301 205 5.02 5.91 80,301
206 2.76 5.84 83,434 206 5.00 5.84 83,434
207 2.68 5.84 86,789 207 4.86 5.84 86,789
* Starting RIT score is always based on grade 5 performance.Shaded cells indicate that starting RIT was outside the percentile range of 1-99.
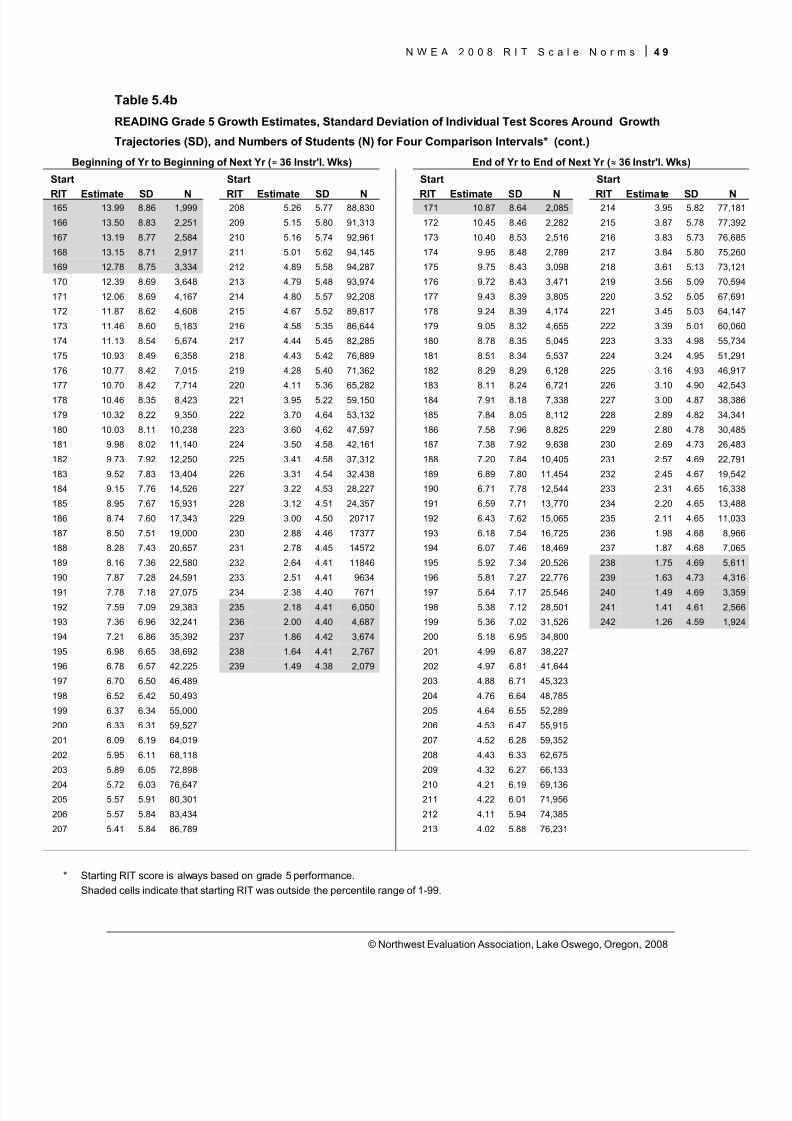
8/7/2019 NWEA Complete Norms2008
http://slidepdf.com/reader/full/nwea-complete-norms2008 59/170
N W E A 2 0 0 8 R I T S c a l e N o r m s 4 9
© Northwest Evaluation Association, Lake Oswego, Oregon, 2008
Table 5.4b
READING Grade 5 Growth Estimates, Standard Deviation of Individual Test Scores Around Growth
Trajectories (SD), and Numbers of Students (N) for Four Comparison Intervals* (cont.)
Beginning of Yr to Beginning of Next Yr ( ≈ 36 Instr'l. Wks) End of Yr to End of Next Yr ( ≈ 36 Instr'l. Wks)
Start Start Start Start
RIT Estimate SD N RIT Estimate SD N RIT Estimate SD N RIT Estimate SD N165 13.99 8.86 1,999 208 5.26 5.77 88,830 171 10.87 8.64 2,085 214 3.95 5.82 77,181
166 13.50 8.83 2,251 209 5.15 5.80 91,313 172 10.45 8.46 2,282 215 3.87 5.78 77,392
167 13.19 8.77 2,584 210 5.16 5.74 92,961 173 10.40 8.53 2,516 216 3.83 5.73 76,685
168 13.15 8.71 2,917 211 5.01 5.62 94,145 174 9.95 8.48 2,789 217 3.84 5.80 75,260
169 12.78 8.75 3,334 212 4.89 5.58 94,287 175 9.75 8.43 3,098 218 3.61 5.13 73,121
170 12.39 8.69 3,648 213 4.79 5.48 93,974 176 9.72 8.43 3,471 219 3.56 5.09 70,594
171 12.06 8.69 4,167 214 4.80 5.57 92,208 177 9.43 8.39 3,805 220 3.52 5.05 67,691
172 11.87 8.62 4,608 215 4.67 5.52 89,817 178 9.24 8.39 4,174 221 3.45 5.03 64,147
173 11.46 8.60 5,183 216 4.58 5.35 86,644 179 9.05 8.32 4,655 222 3.39 5.01 60,060
174 11.13 8.54 5,674 217 4.44 5.45 82,285 180 8.78 8.35 5,045 223 3.33 4.98 55,734
175 10.93 8.49 6,358 218 4.43 5.42 76,889 181 8.51 8.34 5,537 224 3.24 4.95 51,291
176 10.77 8.42 7,015 219 4.28 5.40 71,362 182 8.29 8.29 6,128 225 3.16 4.93 46,917
177 10.70 8.42 7,714 220 4.11 5.36 65,282 183 8.11 8.24 6,721 226 3.10 4.90 42,543
178 10.46 8.35 8,423 221 3.95 5.22 59,150 184 7.91 8.18 7,338 227 3.00 4.87 38,386
179 10.32 8.22 9,350 222 3.70 4.64 53,132 185 7.84 8.05 8,112 228 2.89 4.82 34,341
180 10.03 8.11 10,238 223 3.60 4.62 47,597 186 7.58 7.96 8,825 229 2.80 4.78 30,485
181 9.98 8.02 11,140 224 3.50 4.58 42,161 187 7.38 7.92 9,638 230 2.69 4.73 26,483
182 9.73 7.92 12,250 225 3.41 4.58 37,312 188 7.20 7.84 10,405 231 2.57 4.69 22,791
183 9.52 7.83 13,404 226 3.31 4.54 32,438 189 6.89 7.80 11,454 232 2.45 4.67 19,542
184 9.15 7.76 14,526 227 3.22 4.53 28,227 190 6.71 7.78 12,544 233 2.31 4.65 16,338
185 8.95 7.67 15,931 228 3.12 4.51 24,357 191 6.59 7.71 13,770 234 2.20 4.65 13,488
186 8.74 7.60 17,343 229 3.00 4.50 20717 192 6.43 7.62 15,065 235 2.11 4.65 11,033
187 8.50 7.51 19,000 230 2.88 4.46 17377 193 6.18 7.54 16,725 236 1.98 4.68 8,966
188 8.28 7.43 20,657 231 2.78 4.45 14572 194 6.07 7.46 18,469 237 1.87 4.68 7,065
189 8.16 7.36 22,580 232 2.64 4.41 11846 195 5.92 7.34 20,526 238 1.75 4.69 5,611
190 7.87 7.28 24,591 233 2.51 4.41 9634 196 5.81 7.27 22,776 239 1.63 4.73 4,316
191 7.78 7.18 27,075 234 2.38 4.40 7671 197 5.64 7.17 25,546 240 1.49 4.69 3,359
192 7.59 7.09 29,383 235 2.18 4.41 6,050 198 5.38 7.12 28,501 241 1.41 4.61 2,566
193 7.36 6.96 32,241 236 2.00 4.40 4,687 199 5.36 7.02 31,526 242 1.26 4.59 1,924
194 7.21 6.86 35,392 237 1.86 4.42 3,674 200 5.18 6.95 34,800
195 6.98 6.65 38,692 238 1.64 4.41 2,767 201 4.99 6.87 38,227
196 6.78 6.57 42,225 239 1.49 4.38 2,079 202 4.97 6.81 41,644
197 6.70 6.50 46,489 203 4.88 6.71 45,323
198 6.52 6.42 50,493 204 4.76 6.64 48,785
199 6.37 6.34 55,000 205 4.64 6.55 52,289
200 6.33 6.31 59,527 206 4.53 6.47 55,915
201 6.09 6.19 64,019 207 4.52 6.28 59,352
202 5.95 6.11 68,118 208 4.43 6.33 62,675
203 5.89 6.05 72,898 209 4.32 6.27 66,133
204 5.72 6.03 76,647 210 4.21 6.19 69,136205 5.57 5.91 80,301 211 4.22 6.01 71,956
206 5.57 5.84 83,434 212 4.11 5.94 74,385
207 5.41 5.84 86,789 213 4.02 5.88 76,231
* Starting RIT score is always based on grade 5 performance.Shaded cells indicate that starting RIT was outside the percentile range of 1-99.
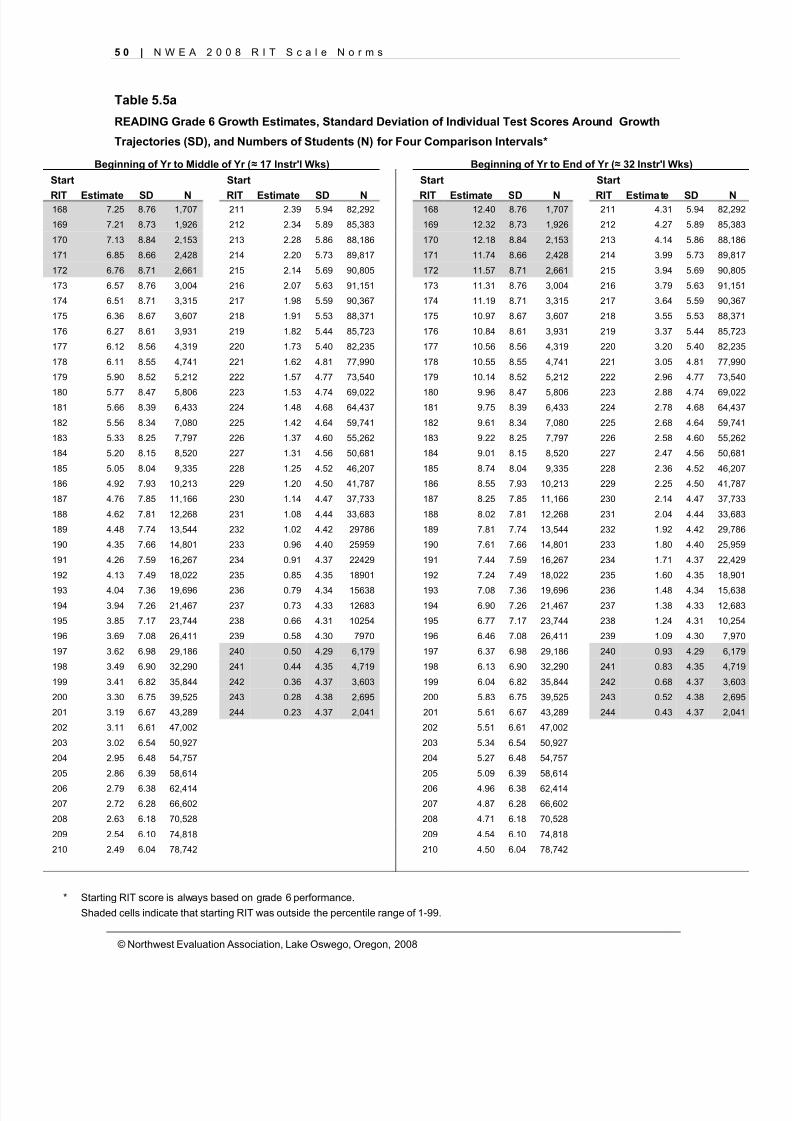
8/7/2019 NWEA Complete Norms2008
http://slidepdf.com/reader/full/nwea-complete-norms2008 60/170
5 0 | N W E A 2 0 0 8 R I T S c a l e N o r m s
© Northwest Evaluation Association, Lake Oswego, Oregon, 2008
Table 5.5a
READING Grade 6 Growth Estimates, Standard Deviation of Individual Test Scores Around Growth
Trajectories (SD), and Numbers of Students (N) for Four Comparison Intervals*
Beginning of Yr to Middle of Yr ( ≈ 17 Instr'l Wks) Beginning of Yr to End of Yr ( ≈ 32 Instr'l Wks)
Start Start Start Start
RIT Estimate SD N RIT Estimate SD N RIT Estimate SD N RIT Estimate SD N168 7.25 8.76 1,707 211 2.39 5.94 82,292 168 12.40 8.76 1,707 211 4.31 5.94 82,292
169 7.21 8.73 1,926 212 2.34 5.89 85,383 169 12.32 8.73 1,926 212 4.27 5.89 85,383
170 7.13 8.84 2,153 213 2.28 5.86 88,186 170 12.18 8.84 2,153 213 4.14 5.86 88,186
171 6.85 8.66 2,428 214 2.20 5.73 89,817 171 11.74 8.66 2,428 214 3.99 5.73 89,817
172 6.76 8.71 2,661 215 2.14 5.69 90,805 172 11.57 8.71 2,661 215 3.94 5.69 90,805
173 6.57 8.76 3,004 216 2.07 5.63 91,151 173 11.31 8.76 3,004 216 3.79 5.63 91,151
174 6.51 8.71 3,315 217 1.98 5.59 90,367 174 11.19 8.71 3,315 217 3.64 5.59 90,367
175 6.36 8.67 3,607 218 1.91 5.53 88,371 175 10.97 8.67 3,607 218 3.55 5.53 88,371
176 6.27 8.61 3,931 219 1.82 5.44 85,723 176 10.84 8.61 3,931 219 3.37 5.44 85,723
177 6.12 8.56 4,319 220 1.73 5.40 82,235 177 10.56 8.56 4,319 220 3.20 5.40 82,235
178 6.11 8.55 4,741 221 1.62 4.81 77,990 178 10.55 8.55 4,741 221 3.05 4.81 77,990
179 5.90 8.52 5,212 222 1.57 4.77 73,540 179 10.14 8.52 5,212 222 2.96 4.77 73,540
180 5.77 8.47 5,806 223 1.53 4.74 69,022 180 9.96 8.47 5,806 223 2.88 4.74 69,022181 5.66 8.39 6,433 224 1.48 4.68 64,437 181 9.75 8.39 6,433 224 2.78 4.68 64,437
182 5.56 8.34 7,080 225 1.42 4.64 59,741 182 9.61 8.34 7,080 225 2.68 4.64 59,741
183 5.33 8.25 7,797 226 1.37 4.60 55,262 183 9.22 8.25 7,797 226 2.58 4.60 55,262
184 5.20 8.15 8,520 227 1.31 4.56 50,681 184 9.01 8.15 8,520 227 2.47 4.56 50,681
185 5.05 8.04 9,335 228 1.25 4.52 46,207 185 8.74 8.04 9,335 228 2.36 4.52 46,207
186 4.92 7.93 10,213 229 1.20 4.50 41,787 186 8.55 7.93 10,213 229 2.25 4.50 41,787
187 4.76 7.85 11,166 230 1.14 4.47 37,733 187 8.25 7.85 11,166 230 2.14 4.47 37,733
188 4.62 7.81 12,268 231 1.08 4.44 33,683 188 8.02 7.81 12,268 231 2.04 4.44 33,683
189 4.48 7.74 13,544 232 1.02 4.42 29786 189 7.81 7.74 13,544 232 1.92 4.42 29,786
190 4.35 7.66 14,801 233 0.96 4.40 25959 190 7.61 7.66 14,801 233 1.80 4.40 25,959
191 4.26 7.59 16,267 234 0.91 4.37 22429 191 7.44 7.59 16,267 234 1.71 4.37 22,429
192 4.13 7.49 18,022 235 0.85 4.35 18901 192 7.24 7.49 18,022 235 1.60 4.35 18,901
193 4.04 7.36 19,696 236 0.79 4.34 15638 193 7.08 7.36 19,696 236 1.48 4.34 15,638194 3.94 7.26 21,467 237 0.73 4.33 12683 194 6.90 7.26 21,467 237 1.38 4.33 12,683
195 3.85 7.17 23,744 238 0.66 4.31 10254 195 6.77 7.17 23,744 238 1.24 4.31 10,254
196 3.69 7.08 26,411 239 0.58 4.30 7970 196 6.46 7.08 26,411 239 1.09 4.30 7,970
197 3.62 6.98 29,186 240 0.50 4.29 6,179 197 6.37 6.98 29,186 240 0.93 4.29 6,179
198 3.49 6.90 32,290 241 0.44 4.35 4,719 198 6.13 6.90 32,290 241 0.83 4.35 4,719
199 3.41 6.82 35,844 242 0.36 4.37 3,603 199 6.04 6.82 35,844 242 0.68 4.37 3,603
200 3.30 6.75 39,525 243 0.28 4.38 2,695 200 5.83 6.75 39,525 243 0.52 4.38 2,695
201 3.19 6.67 43,289 244 0.23 4.37 2,041 201 5.61 6.67 43,289 244 0.43 4.37 2,041
202 3.11 6.61 47,002 202 5.51 6.61 47,002
203 3.02 6.54 50,927 203 5.34 6.54 50,927
204 2.95 6.48 54,757 204 5.27 6.48 54,757
205 2.86 6.39 58,614 205 5.09 6.39 58,614
206 2.79 6.38 62,414 206 4.96 6.38 62,414
207 2.72 6.28 66,602 207 4.87 6.28 66,602
208 2.63 6.18 70,528 208 4.71 6.18 70,528
209 2.54 6.10 74,818 209 4.54 6.10 74,818
210 2.49 6.04 78,742 210 4.50 6.04 78,742
* Starting RIT score is always based on grade 6 performance.Shaded cells indicate that starting RIT was outside the percentile range of 1-99.
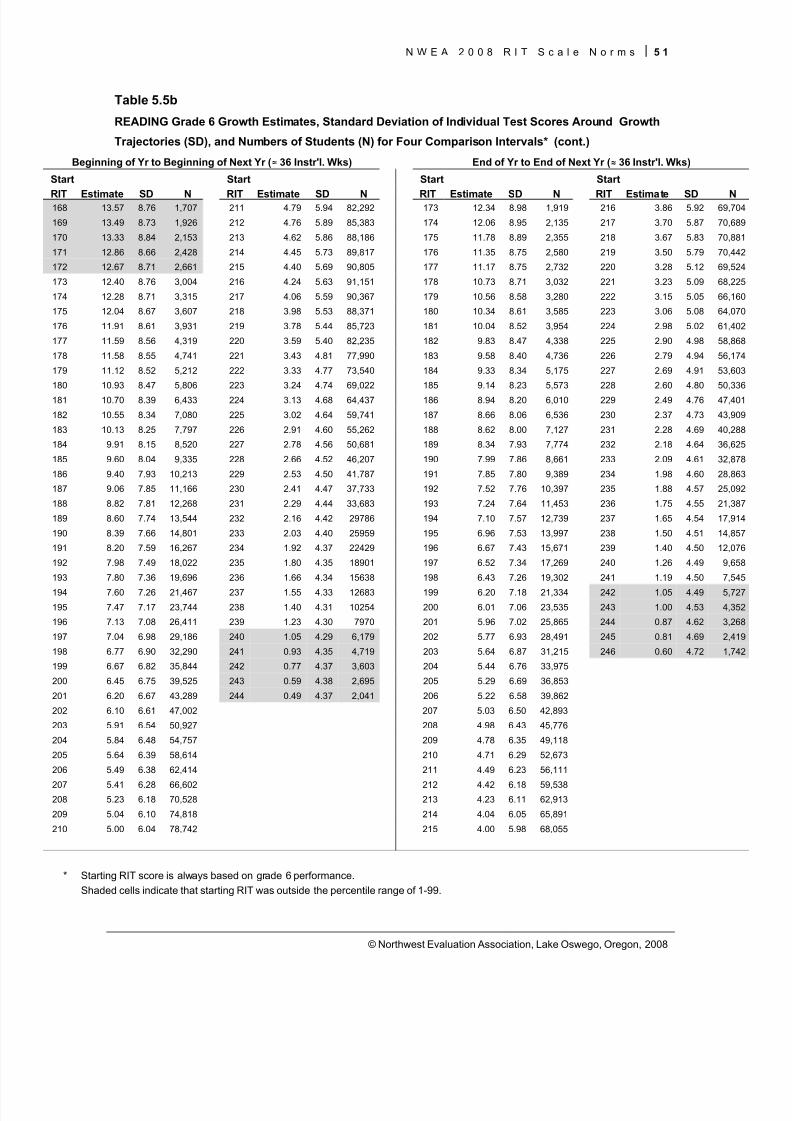
8/7/2019 NWEA Complete Norms2008
http://slidepdf.com/reader/full/nwea-complete-norms2008 61/170
N W E A 2 0 0 8 R I T S c a l e N o r m s 5 1
© Northwest Evaluation Association, Lake Oswego, Oregon, 2008
Table 5.5b
READING Grade 6 Growth Estimates, Standard Deviation of Individual Test Scores Around Growth
Trajectories (SD), and Numbers of Students (N) for Four Comparison Intervals* (cont.)
Beginning of Yr to Beginning of Next Yr ( ≈ 36 Instr'l. Wks) End of Yr to End of Next Yr ( ≈ 36 Instr'l. Wks)
Start Start Start Start
RIT Estimate SD N RIT Estimate SD N RIT Estimate SD N RIT Estimate SD N168 13.57 8.76 1,707 211 4.79 5.94 82,292 173 12.34 8.98 1,919 216 3.86 5.92 69,704
169 13.49 8.73 1,926 212 4.76 5.89 85,383 174 12.06 8.95 2,135 217 3.70 5.87 70,689
170 13.33 8.84 2,153 213 4.62 5.86 88,186 175 11.78 8.89 2,355 218 3.67 5.83 70,881
171 12.86 8.66 2,428 214 4.45 5.73 89,817 176 11.35 8.75 2,580 219 3.50 5.79 70,442
172 12.67 8.71 2,661 215 4.40 5.69 90,805 177 11.17 8.75 2,732 220 3.28 5.12 69,524
173 12.40 8.76 3,004 216 4.24 5.63 91,151 178 10.73 8.71 3,032 221 3.23 5.09 68,225
174 12.28 8.71 3,315 217 4.06 5.59 90,367 179 10.56 8.58 3,280 222 3.15 5.05 66,160
175 12.04 8.67 3,607 218 3.98 5.53 88,371 180 10.34 8.61 3,585 223 3.06 5.08 64,070
176 11.91 8.61 3,931 219 3.78 5.44 85,723 181 10.04 8.52 3,954 224 2.98 5.02 61,402
177 11.59 8.56 4,319 220 3.59 5.40 82,235 182 9.83 8.47 4,338 225 2.90 4.98 58,868
178 11.58 8.55 4,741 221 3.43 4.81 77,990 183 9.58 8.40 4,736 226 2.79 4.94 56,174
179 11.12 8.52 5,212 222 3.33 4.77 73,540 184 9.33 8.34 5,175 227 2.69 4.91 53,603
180 10.93 8.47 5,806 223 3.24 4.74 69,022 185 9.14 8.23 5,573 228 2.60 4.80 50,336
181 10.70 8.39 6,433 224 3.13 4.68 64,437 186 8.94 8.20 6,010 229 2.49 4.76 47,401
182 10.55 8.34 7,080 225 3.02 4.64 59,741 187 8.66 8.06 6,536 230 2.37 4.73 43,909
183 10.13 8.25 7,797 226 2.91 4.60 55,262 188 8.62 8.00 7,127 231 2.28 4.69 40,288
184 9.91 8.15 8,520 227 2.78 4.56 50,681 189 8.34 7.93 7,774 232 2.18 4.64 36,625
185 9.60 8.04 9,335 228 2.66 4.52 46,207 190 7.99 7.86 8,661 233 2.09 4.61 32,878
186 9.40 7.93 10,213 229 2.53 4.50 41,787 191 7.85 7.80 9,389 234 1.98 4.60 28,863
187 9.06 7.85 11,166 230 2.41 4.47 37,733 192 7.52 7.76 10,397 235 1.88 4.57 25,092
188 8.82 7.81 12,268 231 2.29 4.44 33,683 193 7.24 7.64 11,453 236 1.75 4.55 21,387
189 8.60 7.74 13,544 232 2.16 4.42 29786 194 7.10 7.57 12,739 237 1.65 4.54 17,914
190 8.39 7.66 14,801 233 2.03 4.40 25959 195 6.96 7.53 13,997 238 1.50 4.51 14,857
191 8.20 7.59 16,267 234 1.92 4.37 22429 196 6.67 7.43 15,671 239 1.40 4.50 12,076
192 7.98 7.49 18,022 235 1.80 4.35 18901 197 6.52 7.34 17,269 240 1.26 4.49 9,658
193 7.80 7.36 19,696 236 1.66 4.34 15638 198 6.43 7.26 19,302 241 1.19 4.50 7,545
194 7.60 7.26 21,467 237 1.55 4.33 12683 199 6.20 7.18 21,334 242 1.05 4.49 5,727
195 7.47 7.17 23,744 238 1.40 4.31 10254 200 6.01 7.06 23,535 243 1.00 4.53 4,352
196 7.13 7.08 26,411 239 1.23 4.30 7970 201 5.96 7.02 25,865 244 0.87 4.62 3,268
197 7.04 6.98 29,186 240 1.05 4.29 6,179 202 5.77 6.93 28,491 245 0.81 4.69 2,419
198 6.77 6.90 32,290 241 0.93 4.35 4,719 203 5.64 6.87 31,215 246 0.60 4.72 1,742
199 6.67 6.82 35,844 242 0.77 4.37 3,603 204 5.44 6.76 33,975
200 6.45 6.75 39,525 243 0.59 4.38 2,695 205 5.29 6.69 36,853
201 6.20 6.67 43,289 244 0.49 4.37 2,041 206 5.22 6.58 39,862
202 6.10 6.61 47,002 207 5.03 6.50 42,893
203 5.91 6.54 50,927 208 4.98 6.43 45,776
204 5.84 6.48 54,757 209 4.78 6.35 49,118
205 5.64 6.39 58,614 210 4.71 6.29 52,673
206 5.49 6.38 62,414 211 4.49 6.23 56,111
207 5.41 6.28 66,602 212 4.42 6.18 59,538208 5.23 6.18 70,528 213 4.23 6.11 62,913
209 5.04 6.10 74,818 214 4.04 6.05 65,891
210 5.00 6.04 78,742 215 4.00 5.98 68,055
* Starting RIT score is always based on grade 6 performance.Shaded cells indicate that starting RIT was outside the percentile range of 1-99.
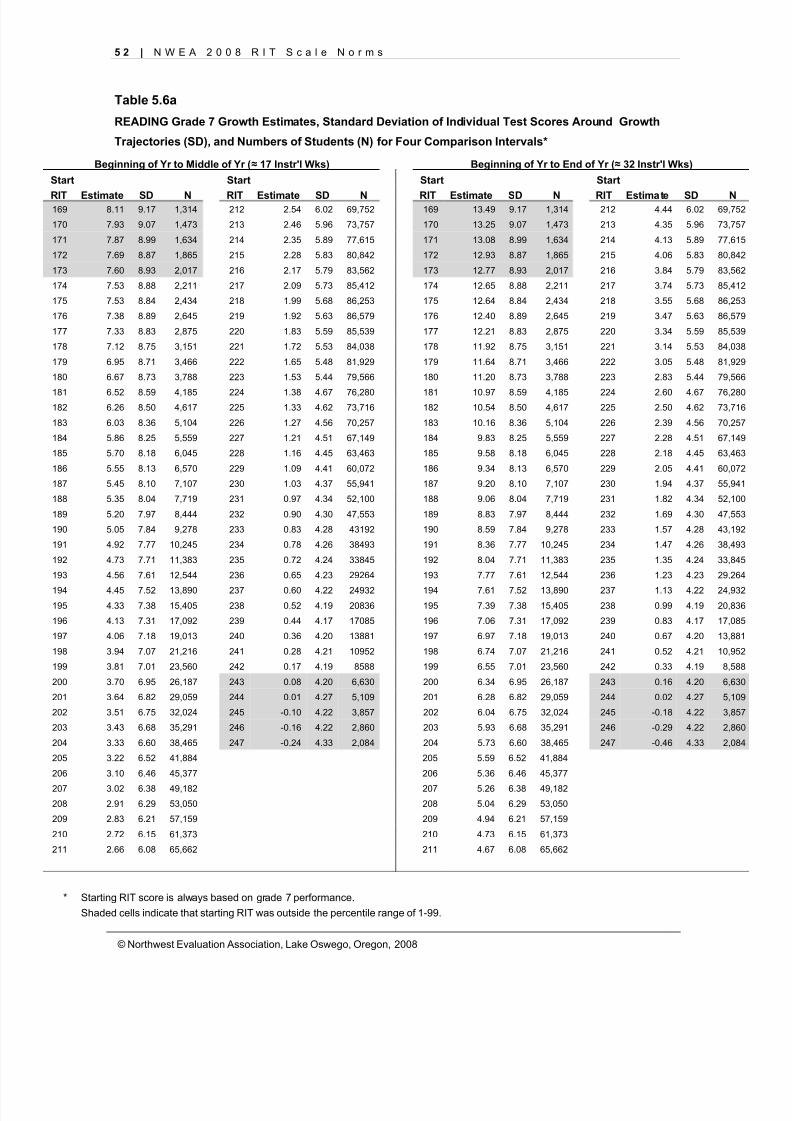
8/7/2019 NWEA Complete Norms2008
http://slidepdf.com/reader/full/nwea-complete-norms2008 62/170
5 2 | N W E A 2 0 0 8 R I T S c a l e N o r m s
© Northwest Evaluation Association, Lake Oswego, Oregon, 2008
Table 5.6a
READING Grade 7 Growth Estimates, Standard Deviation of Individual Test Scores Around Growth
Trajectories (SD), and Numbers of Students (N) for Four Comparison Intervals*
Beginning of Yr to Middle of Yr ( ≈ 17 Instr'l Wks) Beginning of Yr to End of Yr ( ≈ 32 Instr'l Wks)
Start Start Start Start
RIT Estimate SD N RIT Estimate SD N RIT Estimate SD N RIT Estimate SD N169 8.11 9.17 1,314 212 2.54 6.02 69,752 169 13.49 9.17 1,314 212 4.44 6.02 69,752
170 7.93 9.07 1,473 213 2.46 5.96 73,757 170 13.25 9.07 1,473 213 4.35 5.96 73,757
171 7.87 8.99 1,634 214 2.35 5.89 77,615 171 13.08 8.99 1,634 214 4.13 5.89 77,615
172 7.69 8.87 1,865 215 2.28 5.83 80,842 172 12.93 8.87 1,865 215 4.06 5.83 80,842
173 7.60 8.93 2,017 216 2.17 5.79 83,562 173 12.77 8.93 2,017 216 3.84 5.79 83,562
174 7.53 8.88 2,211 217 2.09 5.73 85,412 174 12.65 8.88 2,211 217 3.74 5.73 85,412
175 7.53 8.84 2,434 218 1.99 5.68 86,253 175 12.64 8.84 2,434 218 3.55 5.68 86,253
176 7.38 8.89 2,645 219 1.92 5.63 86,579 176 12.40 8.89 2,645 219 3.47 5.63 86,579
177 7.33 8.83 2,875 220 1.83 5.59 85,539 177 12.21 8.83 2,875 220 3.34 5.59 85,539
178 7.12 8.75 3,151 221 1.72 5.53 84,038 178 11.92 8.75 3,151 221 3.14 5.53 84,038
179 6.95 8.71 3,466 222 1.65 5.48 81,929 179 11.64 8.71 3,466 222 3.05 5.48 81,929
180 6.67 8.73 3,788 223 1.53 5.44 79,566 180 11.20 8.73 3,788 223 2.83 5.44 79,566
181 6.52 8.59 4,185 224 1.38 4.67 76,280 181 10.97 8.59 4,185 224 2.60 4.67 76,280182 6.26 8.50 4,617 225 1.33 4.62 73,716 182 10.54 8.50 4,617 225 2.50 4.62 73,716
183 6.03 8.36 5,104 226 1.27 4.56 70,257 183 10.16 8.36 5,104 226 2.39 4.56 70,257
184 5.86 8.25 5,559 227 1.21 4.51 67,149 184 9.83 8.25 5,559 227 2.28 4.51 67,149
185 5.70 8.18 6,045 228 1.16 4.45 63,463 185 9.58 8.18 6,045 228 2.18 4.45 63,463
186 5.55 8.13 6,570 229 1.09 4.41 60,072 186 9.34 8.13 6,570 229 2.05 4.41 60,072
187 5.45 8.10 7,107 230 1.03 4.37 55,941 187 9.20 8.10 7,107 230 1.94 4.37 55,941
188 5.35 8.04 7,719 231 0.97 4.34 52,100 188 9.06 8.04 7,719 231 1.82 4.34 52,100
189 5.20 7.97 8,444 232 0.90 4.30 47,553 189 8.83 7.97 8,444 232 1.69 4.30 47,553
190 5.05 7.84 9,278 233 0.83 4.28 43192 190 8.59 7.84 9,278 233 1.57 4.28 43,192
191 4.92 7.77 10,245 234 0.78 4.26 38493 191 8.36 7.77 10,245 234 1.47 4.26 38,493
192 4.73 7.71 11,383 235 0.72 4.24 33845 192 8.04 7.71 11,383 235 1.35 4.24 33,845
193 4.56 7.61 12,544 236 0.65 4.23 29264 193 7.77 7.61 12,544 236 1.23 4.23 29,264
194 4.45 7.52 13,890 237 0.60 4.22 24932 194 7.61 7.52 13,890 237 1.13 4.22 24,932195 4.33 7.38 15,405 238 0.52 4.19 20836 195 7.39 7.38 15,405 238 0.99 4.19 20,836
196 4.13 7.31 17,092 239 0.44 4.17 17085 196 7.06 7.31 17,092 239 0.83 4.17 17,085
197 4.06 7.18 19,013 240 0.36 4.20 13881 197 6.97 7.18 19,013 240 0.67 4.20 13,881
198 3.94 7.07 21,216 241 0.28 4.21 10952 198 6.74 7.07 21,216 241 0.52 4.21 10,952
199 3.81 7.01 23,560 242 0.17 4.19 8588 199 6.55 7.01 23,560 242 0.33 4.19 8,588
200 3.70 6.95 26,187 243 0.08 4.20 6,630 200 6.34 6.95 26,187 243 0.16 4.20 6,630
201 3.64 6.82 29,059 244 0.01 4.27 5,109 201 6.28 6.82 29,059 244 0.02 4.27 5,109
202 3.51 6.75 32,024 245 -0.10 4.22 3,857 202 6.04 6.75 32,024 245 -0.18 4.22 3,857
203 3.43 6.68 35,291 246 -0.16 4.22 2,860 203 5.93 6.68 35,291 246 -0.29 4.22 2,860
204 3.33 6.60 38,465 247 -0.24 4.33 2,084 204 5.73 6.60 38,465 247 -0.46 4.33 2,084
205 3.22 6.52 41,884 205 5.59 6.52 41,884
206 3.10 6.46 45,377 206 5.36 6.46 45,377
207 3.02 6.38 49,182 207 5.26 6.38 49,182
208 2.91 6.29 53,050 208 5.04 6.29 53,050
209 2.83 6.21 57,159 209 4.94 6.21 57,159
210 2.72 6.15 61,373 210 4.73 6.15 61,373
211 2.66 6.08 65,662 211 4.67 6.08 65,662
* Starting RIT score is always based on grade 7 performance.Shaded cells indicate that starting RIT was outside the percentile range of 1-99.
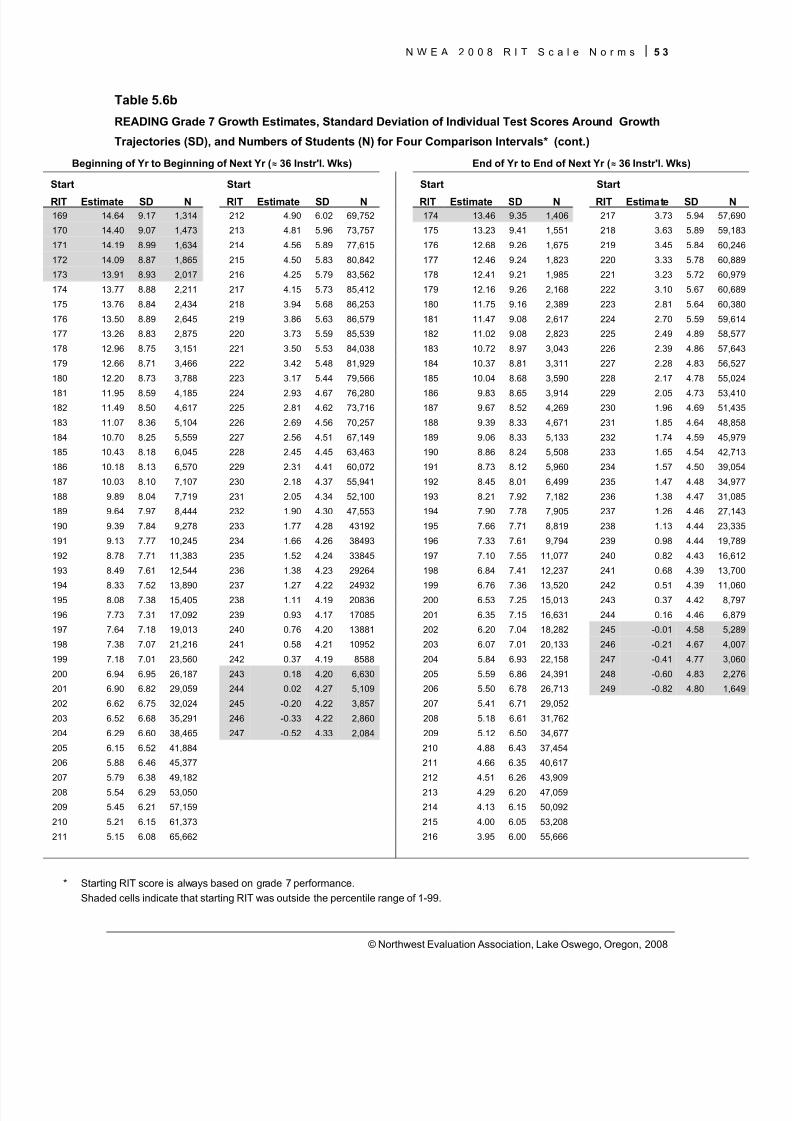
8/7/2019 NWEA Complete Norms2008
http://slidepdf.com/reader/full/nwea-complete-norms2008 63/170
N W E A 2 0 0 8 R I T S c a l e N o r m s 5 3
© Northwest Evaluation Association, Lake Oswego, Oregon, 2008
Table 5.6b
READING Grade 7 Growth Estimates, Standard Deviation of Individual Test Scores Around Growth
Trajectories (SD), and Numbers of Students (N) for Four Comparison Intervals* (cont.)
Beginning of Yr to Beginning of Next Yr ( ≈ 36 Instr'l. Wks) End of Yr to End of Next Yr ( ≈ 36 Instr'l. Wks)
Start Start Start Start
RIT Estimate SD N RIT Estimate SD N RIT Estimate SD N RIT Estimate SD N169 14.64 9.17 1,314 212 4.90 6.02 69,752 174 13.46 9.35 1,406 217 3.73 5.94 57,690
170 14.40 9.07 1,473 213 4.81 5.96 73,757 175 13.23 9.41 1,551 218 3.63 5.89 59,183
171 14.19 8.99 1,634 214 4.56 5.89 77,615 176 12.68 9.26 1,675 219 3.45 5.84 60,246
172 14.09 8.87 1,865 215 4.50 5.83 80,842 177 12.46 9.24 1,823 220 3.33 5.78 60,889
173 13.91 8.93 2,017 216 4.25 5.79 83,562 178 12.41 9.21 1,985 221 3.23 5.72 60,979
174 13.77 8.88 2,211 217 4.15 5.73 85,412 179 12.16 9.26 2,168 222 3.10 5.67 60,689
175 13.76 8.84 2,434 218 3.94 5.68 86,253 180 11.75 9.16 2,389 223 2.81 5.64 60,380
176 13.50 8.89 2,645 219 3.86 5.63 86,579 181 11.47 9.08 2,617 224 2.70 5.59 59,614
177 13.26 8.83 2,875 220 3.73 5.59 85,539 182 11.02 9.08 2,823 225 2.49 4.89 58,577
178 12.96 8.75 3,151 221 3.50 5.53 84,038 183 10.72 8.97 3,043 226 2.39 4.86 57,643
179 12.66 8.71 3,466 222 3.42 5.48 81,929 184 10.37 8.81 3,311 227 2.28 4.83 56,527
180 12.20 8.73 3,788 223 3.17 5.44 79,566 185 10.04 8.68 3,590 228 2.17 4.78 55,024
181 11.95 8.59 4,185 224 2.93 4.67 76,280 186 9.83 8.65 3,914 229 2.05 4.73 53,410182 11.49 8.50 4,617 225 2.81 4.62 73,716 187 9.67 8.52 4,269 230 1.96 4.69 51,435
183 11.07 8.36 5,104 226 2.69 4.56 70,257 188 9.39 8.33 4,671 231 1.85 4.64 48,858
184 10.70 8.25 5,559 227 2.56 4.51 67,149 189 9.06 8.33 5,133 232 1.74 4.59 45,979
185 10.43 8.18 6,045 228 2.45 4.45 63,463 190 8.86 8.24 5,508 233 1.65 4.54 42,713
186 10.18 8.13 6,570 229 2.31 4.41 60,072 191 8.73 8.12 5,960 234 1.57 4.50 39,054
187 10.03 8.10 7,107 230 2.18 4.37 55,941 192 8.45 8.01 6,499 235 1.47 4.48 34,977
188 9.89 8.04 7,719 231 2.05 4.34 52,100 193 8.21 7.92 7,182 236 1.38 4.47 31,085
189 9.64 7.97 8,444 232 1.90 4.30 47,553 194 7.90 7.78 7,905 237 1.26 4.46 27,143
190 9.39 7.84 9,278 233 1.77 4.28 43192 195 7.66 7.71 8,819 238 1.13 4.44 23,335
191 9.13 7.77 10,245 234 1.66 4.26 38493 196 7.33 7.61 9,794 239 0.98 4.44 19,789
192 8.78 7.71 11,383 235 1.52 4.24 33845 197 7.10 7.55 11,077 240 0.82 4.43 16,612
193 8.49 7.61 12,544 236 1.38 4.23 29264 198 6.84 7.41 12,237 241 0.68 4.39 13,700
194 8.33 7.52 13,890 237 1.27 4.22 24932 199 6.76 7.36 13,520 242 0.51 4.39 11,060195 8.08 7.38 15,405 238 1.11 4.19 20836 200 6.53 7.25 15,013 243 0.37 4.42 8,797
196 7.73 7.31 17,092 239 0.93 4.17 17085 201 6.35 7.15 16,631 244 0.16 4.46 6,879
197 7.64 7.18 19,013 240 0.76 4.20 13881 202 6.20 7.04 18,282 245 -0.01 4.58 5,289
198 7.38 7.07 21,216 241 0.58 4.21 10952 203 6.07 7.01 20,133 246 -0.21 4.67 4,007
199 7.18 7.01 23,560 242 0.37 4.19 8588 204 5.84 6.93 22,158 247 -0.41 4.77 3,060
200 6.94 6.95 26,187 243 0.18 4.20 6,630 205 5.59 6.86 24,391 248 -0.60 4.83 2,276
201 6.90 6.82 29,059 244 0.02 4.27 5,109 206 5.50 6.78 26,713 249 -0.82 4.80 1,649
202 6.62 6.75 32,024 245 -0.20 4.22 3,857 207 5.41 6.71 29,052
203 6.52 6.68 35,291 246 -0.33 4.22 2,860 208 5.18 6.61 31,762
204 6.29 6.60 38,465 247 -0.52 4.33 2,084 209 5.12 6.50 34,677
205 6.15 6.52 41,884 210 4.88 6.43 37,454
206 5.88 6.46 45,377 211 4.66 6.35 40,617
207 5.79 6.38 49,182 212 4.51 6.26 43,909
208 5.54 6.29 53,050 213 4.29 6.20 47,059
209 5.45 6.21 57,159 214 4.13 6.15 50,092
210 5.21 6.15 61,373 215 4.00 6.05 53,208
211 5.15 6.08 65,662 216 3.95 6.00 55,666
* Starting RIT score is always based on grade 7 performance.Shaded cells indicate that starting RIT was outside the percentile range of 1-99.
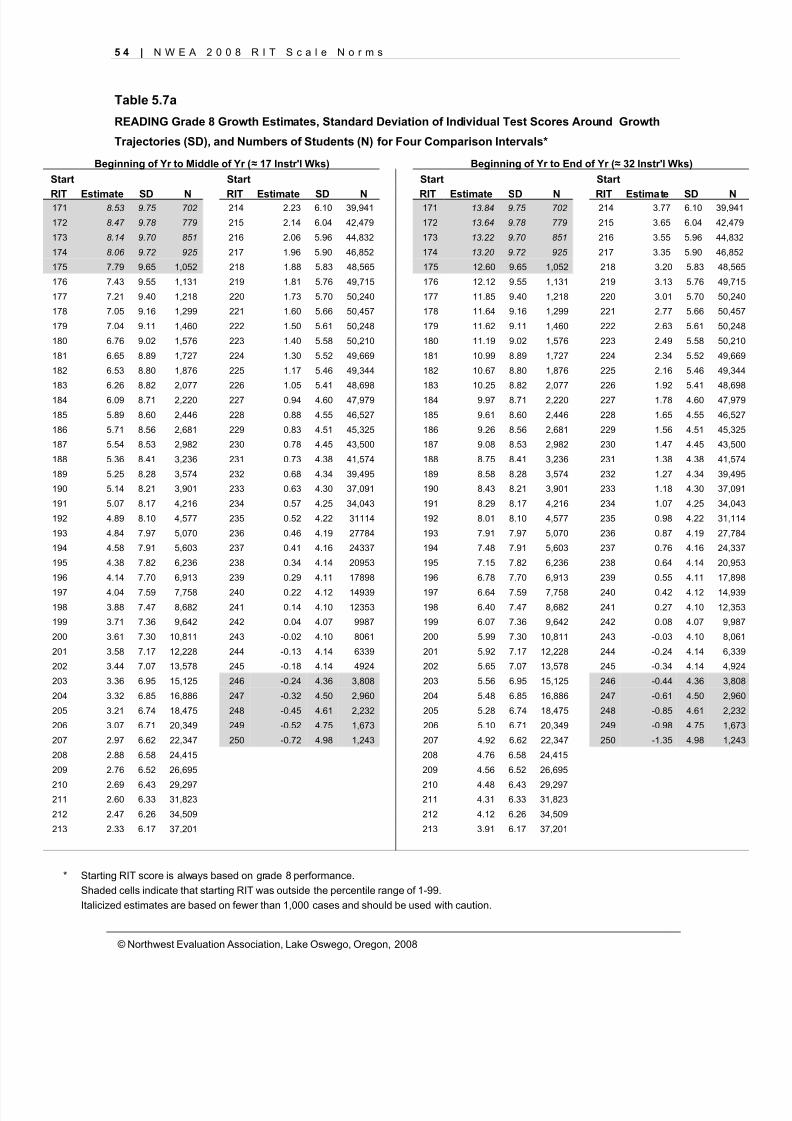
8/7/2019 NWEA Complete Norms2008
http://slidepdf.com/reader/full/nwea-complete-norms2008 64/170
5 4 | N W E A 2 0 0 8 R I T S c a l e N o r m s
© Northwest Evaluation Association, Lake Oswego, Oregon, 2008
Table 5.7a
READING Grade 8 Growth Estimates, Standard Deviation of Individual Test Scores Around Growth
Trajectories (SD), and Numbers of Students (N) for Four Comparison Intervals*
Beginning of Yr to Middle of Yr ( ≈ 17 Instr'l Wks) Beginning of Yr to End of Yr ( ≈ 32 Instr'l Wks)Start Start Start Start
RIT Estimate SD N RIT Estimate SD N RIT Estimate SD N RIT Estimate SD N171 8.53 9.75 702 214 2.23 6.10 39,941 171 13.84 9.75 702 214 3.77 6.10 39,941
172 8.47 9.78 779 215 2.14 6.04 42,479 172 13.64 9.78 779 215 3.65 6.04 42,479
173 8.14 9.70 851 216 2.06 5.96 44,832 173 13.22 9.70 851 216 3.55 5.96 44,832
174 8.06 9.72 925 217 1.96 5.90 46,852 174 13.20 9.72 925 217 3.35 5.90 46,852
175 7.79 9.65 1,052 218 1.88 5.83 48,565 175 12.60 9.65 1,052 218 3.20 5.83 48,565
176 7.43 9.55 1,131 219 1.81 5.76 49,715 176 12.12 9.55 1,131 219 3.13 5.76 49,715
177 7.21 9.40 1,218 220 1.73 5.70 50,240 177 11.85 9.40 1,218 220 3.01 5.70 50,240
178 7.05 9.16 1,299 221 1.60 5.66 50,457 178 11.64 9.16 1,299 221 2.77 5.66 50,457
179 7.04 9.11 1,460 222 1.50 5.61 50,248 179 11.62 9.11 1,460 222 2.63 5.61 50,248
180 6.76 9.02 1,576 223 1.40 5.58 50,210 180 11.19 9.02 1,576 223 2.49 5.58 50,210
181 6.65 8.89 1,727 224 1.30 5.52 49,669 181 10.99 8.89 1,727 224 2.34 5.52 49,669
182 6.53 8.80 1,876 225 1.17 5.46 49,344 182 10.67 8.80 1,876 225 2.16 5.46 49,344
183 6.26 8.82 2,077 226 1.05 5.41 48,698 183 10.25 8.82 2,077 226 1.92 5.41 48,698
184 6.09 8.71 2,220 227 0.94 4.60 47,979 184 9.97 8.71 2,220 227 1.78 4.60 47,979
185 5.89 8.60 2,446 228 0.88 4.55 46,527 185 9.61 8.60 2,446 228 1.65 4.55 46,527
186 5.71 8.56 2,681 229 0.83 4.51 45,325 186 9.26 8.56 2,681 229 1.56 4.51 45,325
187 5.54 8.53 2,982 230 0.78 4.45 43,500 187 9.08 8.53 2,982 230 1.47 4.45 43,500
188 5.36 8.41 3,236 231 0.73 4.38 41,574 188 8.75 8.41 3,236 231 1.38 4.38 41,574
189 5.25 8.28 3,574 232 0.68 4.34 39,495 189 8.58 8.28 3,574 232 1.27 4.34 39,495
190 5.14 8.21 3,901 233 0.63 4.30 37,091 190 8.43 8.21 3,901 233 1.18 4.30 37,091
191 5.07 8.17 4,216 234 0.57 4.25 34,043 191 8.29 8.17 4,216 234 1.07 4.25 34,043
192 4.89 8.10 4,577 235 0.52 4.22 31114 192 8.01 8.10 4,577 235 0.98 4.22 31,114
193 4.84 7.97 5,070 236 0.46 4.19 27784 193 7.91 7.97 5,070 236 0.87 4.19 27,784
194 4.58 7.91 5,603 237 0.41 4.16 24337 194 7.48 7.91 5,603 237 0.76 4.16 24,337
195 4.38 7.82 6,236 238 0.34 4.14 20953 195 7.15 7.82 6,236 238 0.64 4.14 20,953
196 4.14 7.70 6,913 239 0.29 4.11 17898 196 6.78 7.70 6,913 239 0.55 4.11 17,898
197 4.04 7.59 7,758 240 0.22 4.12 14939 197 6.64 7.59 7,758 240 0.42 4.12 14,939
198 3.88 7.47 8,682 241 0.14 4.10 12353 198 6.40 7.47 8,682 241 0.27 4.10 12,353
199 3.71 7.36 9,642 242 0.04 4.07 9987 199 6.07 7.36 9,642 242 0.08 4.07 9,987
200 3.61 7.30 10,811 243 -0.02 4.10 8061 200 5.99 7.30 10,811 243 -0.03 4.10 8,061
201 3.58 7.17 12,228 244 -0.13 4.14 6339 201 5.92 7.17 12,228 244 -0.24 4.14 6,339
202 3.44 7.07 13,578 245 -0.18 4.14 4924 202 5.65 7.07 13,578 245 -0.34 4.14 4,924
203 3.36 6.95 15,125 246 -0.24 4.36 3,808 203 5.56 6.95 15,125 246 -0.44 4.36 3,808
204 3.32 6.85 16,886 247 -0.32 4.50 2,960 204 5.48 6.85 16,886 247 -0.61 4.50 2,960
205 3.21 6.74 18,475 248 -0.45 4.61 2,232 205 5.28 6.74 18,475 248 -0.85 4.61 2,232
206 3.07 6.71 20,349 249 -0.52 4.75 1,673 206 5.10 6.71 20,349 249 -0.98 4.75 1,673
207 2.97 6.62 22,347 250 -0.72 4.98 1,243 207 4.92 6.62 22,347 250 -1.35 4.98 1,243
208 2.88 6.58 24,415 208 4.76 6.58 24,415
209 2.76 6.52 26,695 209 4.56 6.52 26,695
210 2.69 6.43 29,297 210 4.48 6.43 29,297211 2.60 6.33 31,823 211 4.31 6.33 31,823
212 2.47 6.26 34,509 212 4.12 6.26 34,509
213 2.33 6.17 37,201 213 3.91 6.17 37,201
* Starting RIT score is always based on grade 8 performance.Shaded cells indicate that starting RIT was outside the percentile range of 1-99.Italicized estimates are based on fewer than 1,000 cases and should be used with caution.
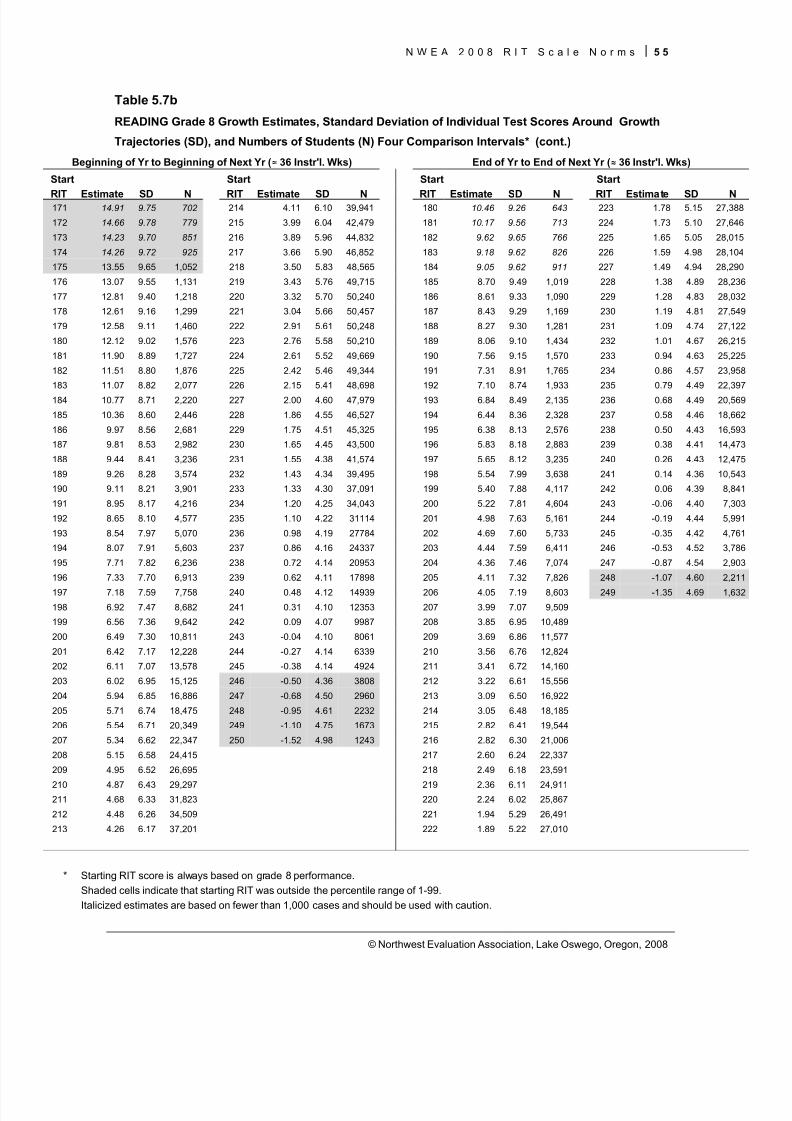
8/7/2019 NWEA Complete Norms2008
http://slidepdf.com/reader/full/nwea-complete-norms2008 65/170
N W E A 2 0 0 8 R I T S c a l e N o r m s 5 5
© Northwest Evaluation Association, Lake Oswego, Oregon, 2008
Table 5.7b
READING Grade 8 Growth Estimates, Standard Deviation of Individual Test Scores Around Growth
Trajectories (SD), and Numbers of Students (N) Four Comparison Intervals* (cont.)
Beginning of Yr to Beginning of Next Yr ( ≈ 36 Instr'l. Wks) End of Yr to End of Next Yr ( ≈ 36 Instr'l. Wks)
Start Start Start Start
RIT Estimate SD N RIT Estimate SD N RIT Estimate SD N RIT Estimate SD N171 14.91 9.75 702 214 4.11 6.10 39,941 180 10.46 9.26 643 223 1.78 5.15 27,388
172 14.66 9.78 779 215 3.99 6.04 42,479 181 10.17 9.56 713 224 1.73 5.10 27,646
173 14.23 9.70 851 216 3.89 5.96 44,832 182 9.62 9.65 766 225 1.65 5.05 28,015
174 14.26 9.72 925 217 3.66 5.90 46,852 183 9.18 9.62 826 226 1.59 4.98 28,104
175 13.55 9.65 1,052 218 3.50 5.83 48,565 184 9.05 9.62 911 227 1.49 4.94 28,290
176 13.07 9.55 1,131 219 3.43 5.76 49,715 185 8.70 9.49 1,019 228 1.38 4.89 28,236
177 12.81 9.40 1,218 220 3.32 5.70 50,240 186 8.61 9.33 1,090 229 1.28 4.83 28,032
178 12.61 9.16 1,299 221 3.04 5.66 50,457 187 8.43 9.29 1,169 230 1.19 4.81 27,549
179 12.58 9.11 1,460 222 2.91 5.61 50,248 188 8.27 9.30 1,281 231 1.09 4.74 27,122
180 12.12 9.02 1,576 223 2.76 5.58 50,210 189 8.06 9.10 1,434 232 1.01 4.67 26,215
181 11.90 8.89 1,727 224 2.61 5.52 49,669 190 7.56 9.15 1,570 233 0.94 4.63 25,225
182 11.51 8.80 1,876 225 2.42 5.46 49,344 191 7.31 8.91 1,765 234 0.86 4.57 23,958
183 11.07 8.82 2,077 226 2.15 5.41 48,698 192 7.10 8.74 1,933 235 0.79 4.49 22,397
184 10.77 8.71 2,220 227 2.00 4.60 47,979 193 6.84 8.49 2,135 236 0.68 4.49 20,569
185 10.36 8.60 2,446 228 1.86 4.55 46,527 194 6.44 8.36 2,328 237 0.58 4.46 18,662
186 9.97 8.56 2,681 229 1.75 4.51 45,325 195 6.38 8.13 2,576 238 0.50 4.43 16,593
187 9.81 8.53 2,982 230 1.65 4.45 43,500 196 5.83 8.18 2,883 239 0.38 4.41 14,473
188 9.44 8.41 3,236 231 1.55 4.38 41,574 197 5.65 8.12 3,235 240 0.26 4.43 12,475
189 9.26 8.28 3,574 232 1.43 4.34 39,495 198 5.54 7.99 3,638 241 0.14 4.36 10,543
190 9.11 8.21 3,901 233 1.33 4.30 37,091 199 5.40 7.88 4,117 242 0.06 4.39 8,841
191 8.95 8.17 4,216 234 1.20 4.25 34,043 200 5.22 7.81 4,604 243 -0.06 4.40 7,303
192 8.65 8.10 4,577 235 1.10 4.22 31114 201 4.98 7.63 5,161 244 -0.19 4.44 5,991
193 8.54 7.97 5,070 236 0.98 4.19 27784 202 4.69 7.60 5,733 245 -0.35 4.42 4,761
194 8.07 7.91 5,603 237 0.86 4.16 24337 203 4.44 7.59 6,411 246 -0.53 4.52 3,786
195 7.71 7.82 6,236 238 0.72 4.14 20953 204 4.36 7.46 7,074 247 -0.87 4.54 2,903
196 7.33 7.70 6,913 239 0.62 4.11 17898 205 4.11 7.32 7,826 248 -1.07 4.60 2,211
197 7.18 7.59 7,758 240 0.48 4.12 14939 206 4.05 7.19 8,603 249 -1.35 4.69 1,632
198 6.92 7.47 8,682 241 0.31 4.10 12353 207 3.99 7.07 9,509
199 6.56 7.36 9,642 242 0.09 4.07 9987 208 3.85 6.95 10,489
200 6.49 7.30 10,811 243 -0.04 4.10 8061 209 3.69 6.86 11,577
201 6.42 7.17 12,228 244 -0.27 4.14 6339 210 3.56 6.76 12,824
202 6.11 7.07 13,578 245 -0.38 4.14 4924 211 3.41 6.72 14,160
203 6.02 6.95 15,125 246 -0.50 4.36 3808 212 3.22 6.61 15,556
204 5.94 6.85 16,886 247 -0.68 4.50 2960 213 3.09 6.50 16,922
205 5.71 6.74 18,475 248 -0.95 4.61 2232 214 3.05 6.48 18,185
206 5.54 6.71 20,349 249 -1.10 4.75 1673 215 2.82 6.41 19,544
207 5.34 6.62 22,347 250 -1.52 4.98 1243 216 2.82 6.30 21,006
208 5.15 6.58 24,415 217 2.60 6.24 22,337
209 4.95 6.52 26,695 218 2.49 6.18 23,591
210 4.87 6.43 29,297 219 2.36 6.11 24,911211 4.68 6.33 31,823 220 2.24 6.02 25,867
212 4.48 6.26 34,509 221 1.94 5.29 26,491
213 4.26 6.17 37,201 222 1.89 5.22 27,010
* Starting RIT score is always based on grade 8 performance.Shaded cells indicate that starting RIT was outside the percentile range of 1-99.Italicized estimates are based on fewer than 1,000 cases and should be used with caution.
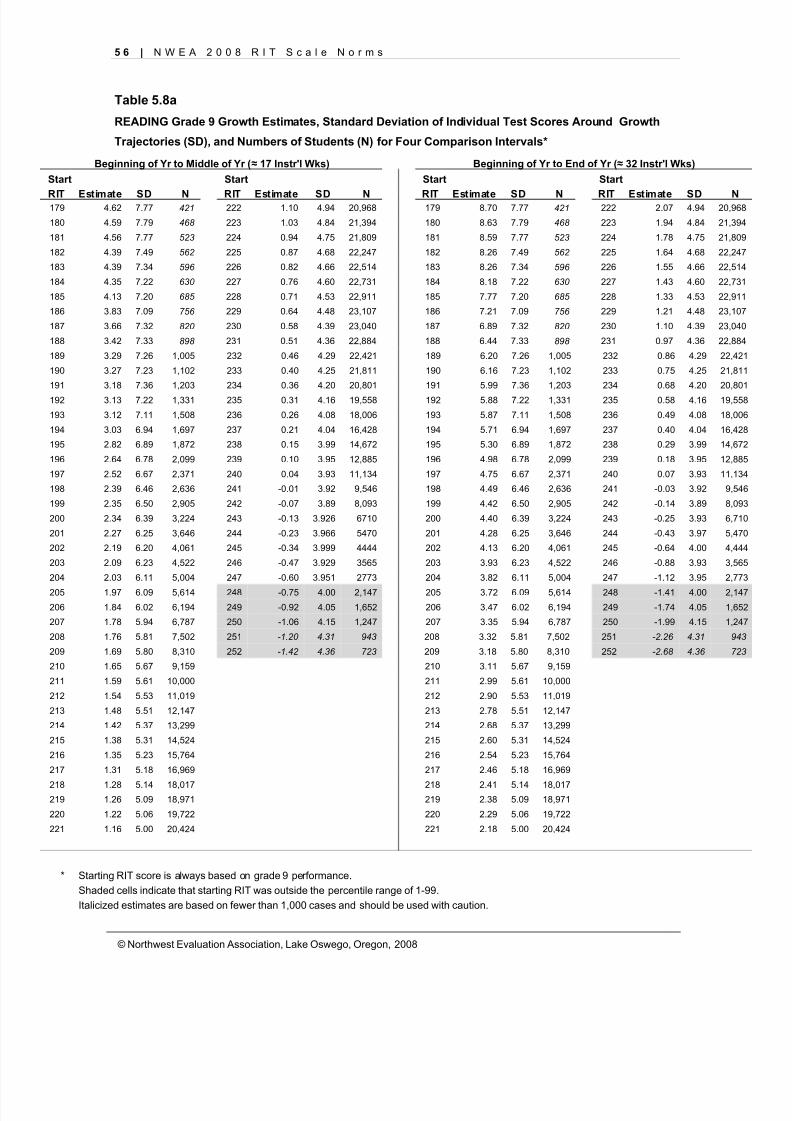
8/7/2019 NWEA Complete Norms2008
http://slidepdf.com/reader/full/nwea-complete-norms2008 66/170
5 6 | N W E A 2 0 0 8 R I T S c a l e N o r m s
© Northwest Evaluation Association, Lake Oswego, Oregon, 2008
Table 5.8a
READING Grade 9 Growth Estimates, Standard Deviation of Individual Test Scores Around Growth
Trajectories (SD), and Numbers of Students (N) for Four Comparison Intervals*
Beginning of Yr to Middle of Yr ( ≈ 17 Instr'l Wks) Beginning of Yr to End of Yr ( ≈ 32 Instr'l Wks)Start Start Start Start
RIT Estimate SD N RIT Estimate SD N RIT Estimate SD N RIT Estimate SD N179 4.62 7.77 421 222 1.10 4.94 20,968 179 8.70 7.77 421 222 2.07 4.94 20,968
180 4.59 7.79 468 223 1.03 4.84 21,394 180 8.63 7.79 468 223 1.94 4.84 21,394
181 4.56 7.77 523 224 0.94 4.75 21,809 181 8.59 7.77 523 224 1.78 4.75 21,809
182 4.39 7.49 562 225 0.87 4.68 22,247 182 8.26 7.49 562 225 1.64 4.68 22,247
183 4.39 7.34 596 226 0.82 4.66 22,514 183 8.26 7.34 596 226 1.55 4.66 22,514
184 4.35 7.22 630 227 0.76 4.60 22,731 184 8.18 7.22 630 227 1.43 4.60 22,731
185 4.13 7.20 685 228 0.71 4.53 22,911 185 7.77 7.20 685 228 1.33 4.53 22,911
186 3.83 7.09 756 229 0.64 4.48 23,107 186 7.21 7.09 756 229 1.21 4.48 23,107
187 3.66 7.32 820 230 0.58 4.39 23,040 187 6.89 7.32 820 230 1.10 4.39 23,040
188 3.42 7.33 898 231 0.51 4.36 22,884 188 6.44 7.33 898 231 0.97 4.36 22,884
189 3.29 7.26 1,005 232 0.46 4.29 22,421 189 6.20 7.26 1,005 232 0.86 4.29 22,421
190 3.27 7.23 1,102 233 0.40 4.25 21,811 190 6.16 7.23 1,102 233 0.75 4.25 21,811
191 3.18 7.36 1,203 234 0.36 4.20 20,801 191 5.99 7.36 1,203 234 0.68 4.20 20,801
192 3.13 7.22 1,331 235 0.31 4.16 19,558 192 5.88 7.22 1,331 235 0.58 4.16 19,558
193 3.12 7.11 1,508 236 0.26 4.08 18,006 193 5.87 7.11 1,508 236 0.49 4.08 18,006
194 3.03 6.94 1,697 237 0.21 4.04 16,428 194 5.71 6.94 1,697 237 0.40 4.04 16,428
195 2.82 6.89 1,872 238 0.15 3.99 14,672 195 5.30 6.89 1,872 238 0.29 3.99 14,672
196 2.64 6.78 2,099 239 0.10 3.95 12,885 196 4.98 6.78 2,099 239 0.18 3.95 12,885
197 2.52 6.67 2,371 240 0.04 3.93 11,134 197 4.75 6.67 2,371 240 0.07 3.93 11,134
198 2.39 6.46 2,636 241 -0.01 3.92 9,546 198 4.49 6.46 2,636 241 -0.03 3.92 9,546
199 2.35 6.50 2,905 242 -0.07 3.89 8,093 199 4.42 6.50 2,905 242 -0.14 3.89 8,093
200 2.34 6.39 3,224 243 -0.13 3.926 6710 200 4.40 6.39 3,224 243 -0.25 3.93 6,710
201 2.27 6.25 3,646 244 -0.23 3.966 5470 201 4.28 6.25 3,646 244 -0.43 3.97 5,470
202 2.19 6.20 4,061 245 -0.34 3.999 4444 202 4.13 6.20 4,061 245 -0.64 4.00 4,444
203 2.09 6.23 4,522 246 -0.47 3.929 3565 203 3.93 6.23 4,522 246 -0.88 3.93 3,565
204 2.03 6.11 5,004 247 -0.60 3.951 2773 204 3.82 6.11 5,004 247 -1.12 3.95 2,773
205 1.97 6.09 5,614 248 -0.75 4.00 2,147 205 3.72 6.09 5,614 248 -1.41 4.00 2,147
206 1.84 6.02 6,194 249 -0.92 4.05 1,652 206 3.47 6.02 6,194 249 -1.74 4.05 1,652
207 1.78 5.94 6,787 250 -1.06 4.15 1,247 207 3.35 5.94 6,787 250 -1.99 4.15 1,247
208 1.76 5.81 7,502 251 -1.20 4.31 943 208 3.32 5.81 7,502 251 -2.26 4.31 943
209 1.69 5.80 8,310 252 -1.42 4.36 723 209 3.18 5.80 8,310 252 -2.68 4.36 723
210 1.65 5.67 9,159 210 3.11 5.67 9,159
211 1.59 5.61 10,000 211 2.99 5.61 10,000
212 1.54 5.53 11,019 212 2.90 5.53 11,019
213 1.48 5.51 12,147 213 2.78 5.51 12,147
214 1.42 5.37 13,299 214 2.68 5.37 13,299
215 1.38 5.31 14,524 215 2.60 5.31 14,524
216 1.35 5.23 15,764 216 2.54 5.23 15,764
217 1.31 5.18 16,969 217 2.46 5.18 16,969
218 1.28 5.14 18,017 218 2.41 5.14 18,017219 1.26 5.09 18,971 219 2.38 5.09 18,971
220 1.22 5.06 19,722 220 2.29 5.06 19,722
221 1.16 5.00 20,424 221 2.18 5.00 20,424
* Starting RIT score is always based on grade 9 performance.Shaded cells indicate that starting RIT was outside the percentile range of 1-99.Italicized estimates are based on fewer than 1,000 cases and should be used with caution.
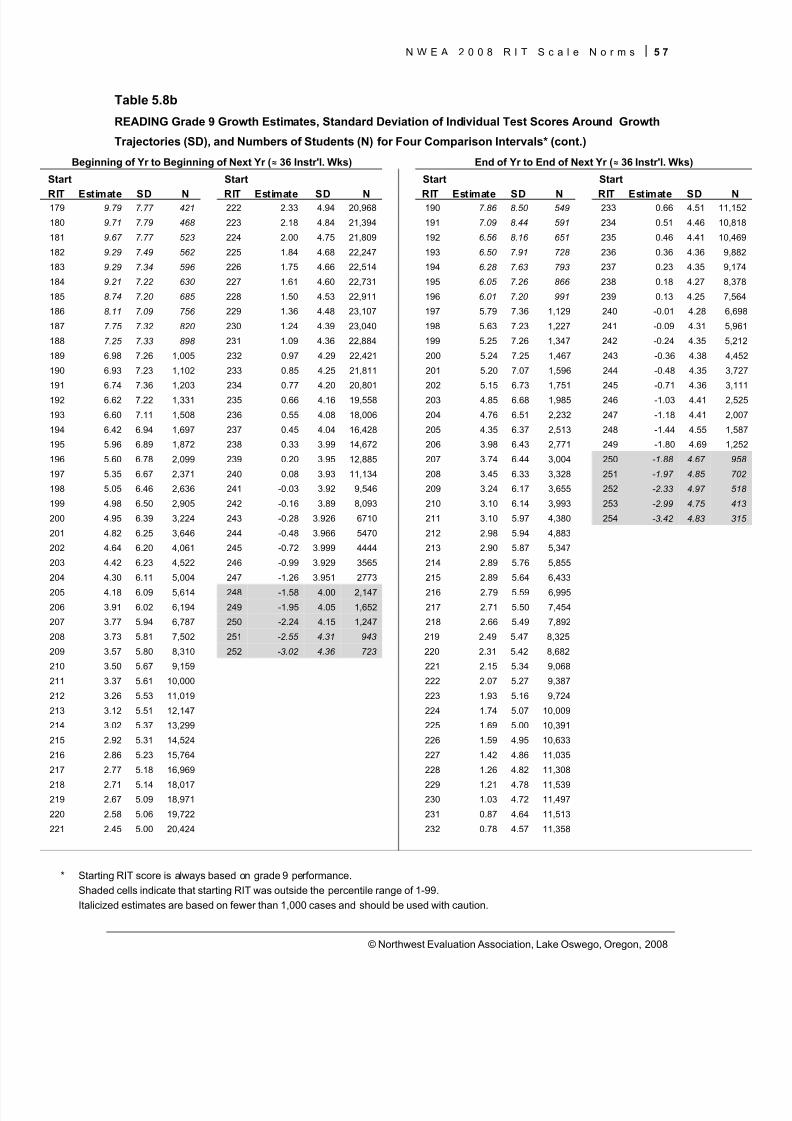
8/7/2019 NWEA Complete Norms2008
http://slidepdf.com/reader/full/nwea-complete-norms2008 67/170
N W E A 2 0 0 8 R I T S c a l e N o r m s 5 7
© Northwest Evaluation Association, Lake Oswego, Oregon, 2008
Table 5.8b
READING Grade 9 Growth Estimates, Standard Deviation of Individual Test Scores Around Growth
Trajectories (SD), and Numbers of Students (N) for Four Comparison Intervals* (cont.)
Beginning of Yr to Beginning of Next Yr ( ≈ 36 Instr'l. Wks) End of Yr to End of Next Yr ( ≈ 36 Instr'l. Wks)
Start Start Start Start
RIT Estimate SD N RIT Estimate SD N RIT Estimate SD N RIT Estimate SD N179 9.79 7.77 421 222 2.33 4.94 20,968 190 7.86 8.50 549 233 0.66 4.51 11,152
180 9.71 7.79 468 223 2.18 4.84 21,394 191 7.09 8.44 591 234 0.51 4.46 10,818
181 9.67 7.77 523 224 2.00 4.75 21,809 192 6.56 8.16 651 235 0.46 4.41 10,469
182 9.29 7.49 562 225 1.84 4.68 22,247 193 6.50 7.91 728 236 0.36 4.36 9,882
183 9.29 7.34 596 226 1.75 4.66 22,514 194 6.28 7.63 793 237 0.23 4.35 9,174
184 9.21 7.22 630 227 1.61 4.60 22,731 195 6.05 7.26 866 238 0.18 4.27 8,378
185 8.74 7.20 685 228 1.50 4.53 22,911 196 6.01 7.20 991 239 0.13 4.25 7,564
186 8.11 7.09 756 229 1.36 4.48 23,107 197 5.79 7.36 1,129 240 -0.01 4.28 6,698
187 7.75 7.32 820 230 1.24 4.39 23,040 198 5.63 7.23 1,227 241 -0.09 4.31 5,961
188 7.25 7.33 898 231 1.09 4.36 22,884 199 5.25 7.26 1,347 242 -0.24 4.35 5,212
189 6.98 7.26 1,005 232 0.97 4.29 22,421 200 5.24 7.25 1,467 243 -0.36 4.38 4,452
190 6.93 7.23 1,102 233 0.85 4.25 21,811 201 5.20 7.07 1,596 244 -0.48 4.35 3,727
191 6.74 7.36 1,203 234 0.77 4.20 20,801 202 5.15 6.73 1,751 245 -0.71 4.36 3,111
192 6.62 7.22 1,331 235 0.66 4.16 19,558 203 4.85 6.68 1,985 246 -1.03 4.41 2,525
193 6.60 7.11 1,508 236 0.55 4.08 18,006 204 4.76 6.51 2,232 247 -1.18 4.41 2,007
194 6.42 6.94 1,697 237 0.45 4.04 16,428 205 4.35 6.37 2,513 248 -1.44 4.55 1,587
195 5.96 6.89 1,872 238 0.33 3.99 14,672 206 3.98 6.43 2,771 249 -1.80 4.69 1,252
196 5.60 6.78 2,099 239 0.20 3.95 12,885 207 3.74 6.44 3,004 250 -1.88 4.67 958
197 5.35 6.67 2,371 240 0.08 3.93 11,134 208 3.45 6.33 3,328 251 -1.97 4.85 702
198 5.05 6.46 2,636 241 -0.03 3.92 9,546 209 3.24 6.17 3,655 252 -2.33 4.97 518
199 4.98 6.50 2,905 242 -0.16 3.89 8,093 210 3.10 6.14 3,993 253 -2.99 4.75 413
200 4.95 6.39 3,224 243 -0.28 3.926 6710 211 3.10 5.97 4,380 254 -3.42 4.83 315
201 4.82 6.25 3,646 244 -0.48 3.966 5470 212 2.98 5.94 4,883
202 4.64 6.20 4,061 245 -0.72 3.999 4444 213 2.90 5.87 5,347
203 4.42 6.23 4,522 246 -0.99 3.929 3565 214 2.89 5.76 5,855
204 4.30 6.11 5,004 247 -1.26 3.951 2773 215 2.89 5.64 6,433
205 4.18 6.09 5,614 248 -1.58 4.00 2,147 216 2.79 5.59 6,995
206 3.91 6.02 6,194 249 -1.95 4.05 1,652 217 2.71 5.50 7,454
207 3.77 5.94 6,787 250 -2.24 4.15 1,247 218 2.66 5.49 7,892
208 3.73 5.81 7,502 251 -2.55 4.31 943 219 2.49 5.47 8,325
209 3.57 5.80 8,310 252 -3.02 4.36 723 220 2.31 5.42 8,682
210 3.50 5.67 9,159 221 2.15 5.34 9,068
211 3.37 5.61 10,000 222 2.07 5.27 9,387
212 3.26 5.53 11,019 223 1.93 5.16 9,724
213 3.12 5.51 12,147 224 1.74 5.07 10,009
214 3.02 5.37 13,299 225 1.69 5.00 10,391
215 2.92 5.31 14,524 226 1.59 4.95 10,633
216 2.86 5.23 15,764 227 1.42 4.86 11,035
217 2.77 5.18 16,969 228 1.26 4.82 11,308
218 2.71 5.14 18,017 229 1.21 4.78 11,539219 2.67 5.09 18,971 230 1.03 4.72 11,497
220 2.58 5.06 19,722 231 0.87 4.64 11,513
221 2.45 5.00 20,424 232 0.78 4.57 11,358
* Starting RIT score is always based on grade 9 performance.Shaded cells indicate that starting RIT was outside the percentile range of 1-99.Italicized estimates are based on fewer than 1,000 cases and should be used with caution.
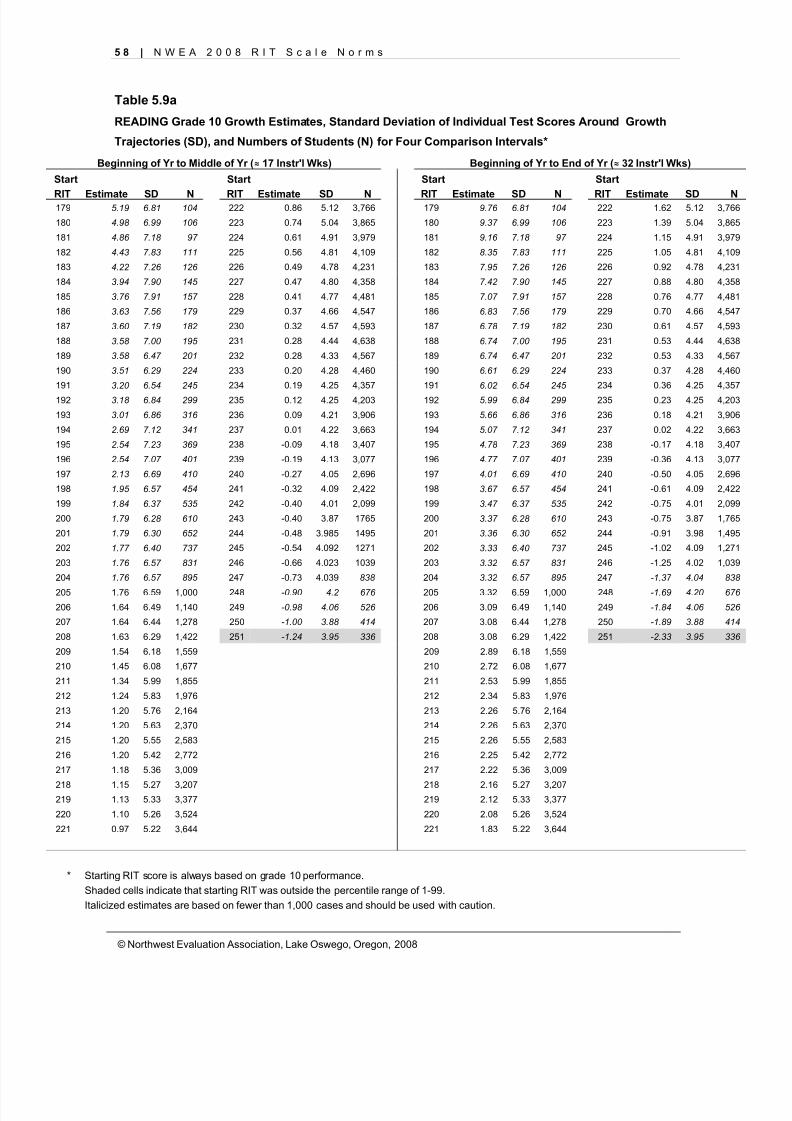
8/7/2019 NWEA Complete Norms2008
http://slidepdf.com/reader/full/nwea-complete-norms2008 68/170
5 8 | N W E A 2 0 0 8 R I T S c a l e N o r m s
© Northwest Evaluation Association, Lake Oswego, Oregon, 2008
Table 5.9a
READING Grade 10 Growth Estimates, Standard Deviation of Individual Test Scores Around Growth
Trajectories (SD), and Numbers of Students (N) for Four Comparison Intervals*
Beginning of Yr to Middle of Yr ( ≈ 17 Instr'l Wks) Beginning of Yr to End of Yr ( ≈ 32 Instr'l Wks)
Start Start Start Start
RIT Estimate SD N RIT Estimate SD N RIT Estimate SD N RIT Estimate SD N179 5.19 6.81 104 222 0.86 5.12 3,766 179 9.76 6.81 104 222 1.62 5.12 3,766
180 4.98 6.99 106 223 0.74 5.04 3,865 180 9.37 6.99 106 223 1.39 5.04 3,865
181 4.86 7.18 97 224 0.61 4.91 3,979 181 9.16 7.18 97 224 1.15 4.91 3,979
182 4.43 7.83 111 225 0.56 4.81 4,109 182 8.35 7.83 111 225 1.05 4.81 4,109
183 4.22 7.26 126 226 0.49 4.78 4,231 183 7.95 7.26 126 226 0.92 4.78 4,231
184 3.94 7.90 145 227 0.47 4.80 4,358 184 7.42 7.90 145 227 0.88 4.80 4,358
185 3.76 7.91 157 228 0.41 4.77 4,481 185 7.07 7.91 157 228 0.76 4.77 4,481
186 3.63 7.56 179 229 0.37 4.66 4,547 186 6.83 7.56 179 229 0.70 4.66 4,547
187 3.60 7.19 182 230 0.32 4.57 4,593 187 6.78 7.19 182 230 0.61 4.57 4,593
188 3.58 7.00 195 231 0.28 4.44 4,638 188 6.74 7.00 195 231 0.53 4.44 4,638
189 3.58 6.47 201 232 0.28 4.33 4,567 189 6.74 6.47 201 232 0.53 4.33 4,567
190 3.51 6.29 224 233 0.20 4.28 4,460 190 6.61 6.29 224 233 0.37 4.28 4,460
191 3.20 6.54 245 234 0.19 4.25 4,357 191 6.02 6.54 245 234 0.36 4.25 4,357
192 3.18 6.84 299 235 0.12 4.25 4,203 192 5.99 6.84 299 235 0.23 4.25 4,203
193 3.01 6.86 316 236 0.09 4.21 3,906 193 5.66 6.86 316 236 0.18 4.21 3,906
194 2.69 7.12 341 237 0.01 4.22 3,663 194 5.07 7.12 341 237 0.02 4.22 3,663
195 2.54 7.23 369 238 -0.09 4.18 3,407 195 4.78 7.23 369 238 -0.17 4.18 3,407
196 2.54 7.07 401 239 -0.19 4.13 3,077 196 4.77 7.07 401 239 -0.36 4.13 3,077
197 2.13 6.69 410 240 -0.27 4.05 2,696 197 4.01 6.69 410 240 -0.50 4.05 2,696
198 1.95 6.57 454 241 -0.32 4.09 2,422 198 3.67 6.57 454 241 -0.61 4.09 2,422
199 1.84 6.37 535 242 -0.40 4.01 2,099 199 3.47 6.37 535 242 -0.75 4.01 2,099
200 1.79 6.28 610 243 -0.40 3.87 1765 200 3.37 6.28 610 243 -0.75 3.87 1,765
201 1.79 6.30 652 244 -0.48 3.985 1495 201 3.36 6.30 652 244 -0.91 3.98 1,495
202 1.77 6.40 737 245 -0.54 4.092 1271 202 3.33 6.40 737 245 -1.02 4.09 1,271
203 1.76 6.57 831 246 -0.66 4.023 1039 203 3.32 6.57 831 246 -1.25 4.02 1,039
204 1.76 6.57 895 247 -0.73 4.039 838 204 3.32 6.57 895 247 -1.37 4.04 838
205 1.76 6.59 1,000 248 -0.90 4.2 676 205 3.32 6.59 1,000 248 -1.69 4.20 676
206 1.64 6.49 1,140 249 -0.98 4.06 526 206 3.09 6.49 1,140 249 -1.84 4.06 526
207 1.64 6.44 1,278 250 -1.00 3.88 414 207 3.08 6.44 1,278 250 -1.89 3.88 414
208 1.63 6.29 1,422 251 -1.24 3.95 336 208 3.08 6.29 1,422 251 -2.33 3.95 336
209 1.54 6.18 1,559 209 2.89 6.18 1,559
210 1.45 6.08 1,677 210 2.72 6.08 1,677
211 1.34 5.99 1,855 211 2.53 5.99 1,855
212 1.24 5.83 1,976 212 2.34 5.83 1,976
213 1.20 5.76 2,164 213 2.26 5.76 2,164
214 1.20 5.63 2,370 214 2.26 5.63 2,370
215 1.20 5.55 2,583 215 2.26 5.55 2,583
216 1.20 5.42 2,772 216 2.25 5.42 2,772
217 1.18 5.36 3,009 217 2.22 5.36 3,009
218 1.15 5.27 3,207 218 2.16 5.27 3,207219 1.13 5.33 3,377 219 2.12 5.33 3,377
220 1.10 5.26 3,524 220 2.08 5.26 3,524
221 0.97 5.22 3,644 221 1.83 5.22 3,644
* Starting RIT score is always based on grade 10 performance.Shaded cells indicate that starting RIT was outside the percentile range of 1-99.Italicized estimates are based on fewer than 1,000 cases and should be used with caution.
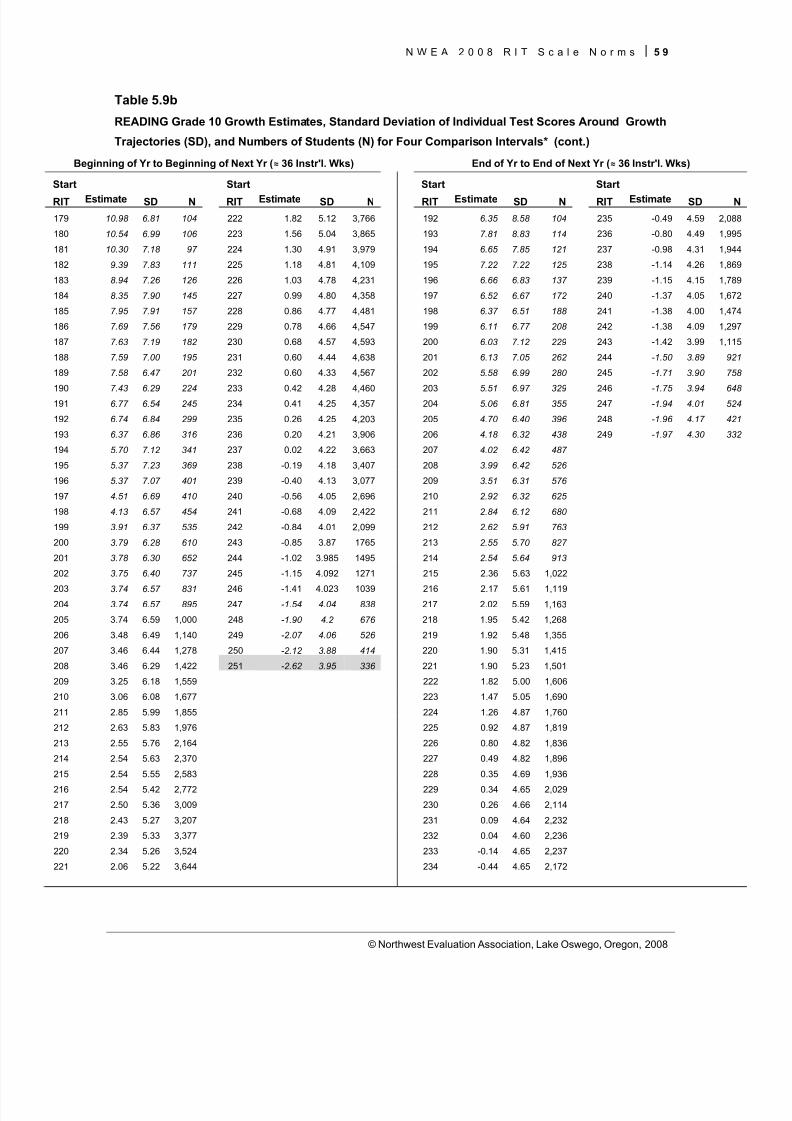
8/7/2019 NWEA Complete Norms2008
http://slidepdf.com/reader/full/nwea-complete-norms2008 69/170
N W E A 2 0 0 8 R I T S c a l e N o r m s 5 9
© Northwest Evaluation Association, Lake Oswego, Oregon, 2008
Table 5.9b
READING Grade 10 Growth Estimates, Standard Deviation of Individual Test Scores Around Growth
Trajectories (SD), and Numbers of Students (N) for Four Comparison Intervals* (cont.)
Beginning of Yr to Beginning of Next Yr ( ≈ 36 Instr'l. Wks) End of Yr to End of Next Yr ( ≈ 36 Instr'l. Wks)
Start Start Start Start
RIT Estimate SD N RIT Estimate SD N RIT Estimate SD N RIT Estimate SD N
179 10.98 6.81 104 222 1.82 5.12 3,766 192 6.35 8.58 104 235 -0.49 4.59 2,088
180 10.54 6.99 106 223 1.56 5.04 3,865 193 7.81 8.83 114 236 -0.80 4.49 1,995
181 10.30 7.18 97 224 1.30 4.91 3,979 194 6.65 7.85 121 237 -0.98 4.31 1,944
182 9.39 7.83 111 225 1.18 4.81 4,109 195 7.22 7.22 125 238 -1.14 4.26 1,869
183 8.94 7.26 126 226 1.03 4.78 4,231 196 6.66 6.83 137 239 -1.15 4.15 1,789
184 8.35 7.90 145 227 0.99 4.80 4,358 197 6.52 6.67 172 240 -1.37 4.05 1,672
185 7.95 7.91 157 228 0.86 4.77 4,481 198 6.37 6.51 188 241 -1.38 4.00 1,474
186 7.69 7.56 179 229 0.78 4.66 4,547 199 6.11 6.77 208 242 -1.38 4.09 1,297
187 7.63 7.19 182 230 0.68 4.57 4,593 200 6.03 7.12 229 243 -1.42 3.99 1,115
188 7.59 7.00 195 231 0.60 4.44 4,638 201 6.13 7.05 262 244 -1.50 3.89 921
189 7.58 6.47 201 232 0.60 4.33 4,567 202 5.58 6.99 280 245 -1.71 3.90 758
190 7.43 6.29 224 233 0.42 4.28 4,460 203 5.51 6.97 329 246 -1.75 3.94 648 191 6.77 6.54 245 234 0.41 4.25 4,357 204 5.06 6.81 355 247 -1.94 4.01 524
192 6.74 6.84 299 235 0.26 4.25 4,203 205 4.70 6.40 396 248 -1.96 4.17 421
193 6.37 6.86 316 236 0.20 4.21 3,906 206 4.18 6.32 438 249 -1.97 4.30 332
194 5.70 7.12 341 237 0.02 4.22 3,663 207 4.02 6.42 487
195 5.37 7.23 369 238 -0.19 4.18 3,407 208 3.99 6.42 526
196 5.37 7.07 401 239 -0.40 4.13 3,077 209 3.51 6.31 576
197 4.51 6.69 410 240 -0.56 4.05 2,696 210 2.92 6.32 625
198 4.13 6.57 454 241 -0.68 4.09 2,422 211 2.84 6.12 680
199 3.91 6.37 535 242 -0.84 4.01 2,099 212 2.62 5.91 763
200 3.79 6.28 610 243 -0.85 3.87 1765 213 2.55 5.70 827
201 3.78 6.30 652 244 -1.02 3.985 1495 214 2.54 5.64 913
202 3.75 6.40 737 245 -1.15 4.092 1271 215 2.36 5.63 1,022
203 3.74 6.57 831 246 -1.41 4.023 1039 216 2.17 5.61 1,119204 3.74 6.57 895 247 -1.54 4.04 838 217 2.02 5.59 1,163
205 3.74 6.59 1,000 248 -1.90 4.2 676 218 1.95 5.42 1,268
206 3.48 6.49 1,140 249 -2.07 4.06 526 219 1.92 5.48 1,355
207 3.46 6.44 1,278 250 -2.12 3.88 414 220 1.90 5.31 1,415
208 3.46 6.29 1,422 251 -2.62 3.95 336 221 1.90 5.23 1,501
209 3.25 6.18 1,559 222 1.82 5.00 1,606
210 3.06 6.08 1,677 223 1.47 5.05 1,690
211 2.85 5.99 1,855 224 1.26 4.87 1,760
212 2.63 5.83 1,976 225 0.92 4.87 1,819
213 2.55 5.76 2,164 226 0.80 4.82 1,836
214 2.54 5.63 2,370 227 0.49 4.82 1,896
215 2.54 5.55 2,583 228 0.35 4.69 1,936
216 2.54 5.42 2,772 229 0.34 4.65 2,029
217 2.50 5.36 3,009 230 0.26 4.66 2,114
218 2.43 5.27 3,207 231 0.09 4.64 2,232
219 2.39 5.33 3,377 232 0.04 4.60 2,236
220 2.34 5.26 3,524 233 -0.14 4.65 2,237
221 2.06 5.22 3,644 234 -0.44 4.65 2,172
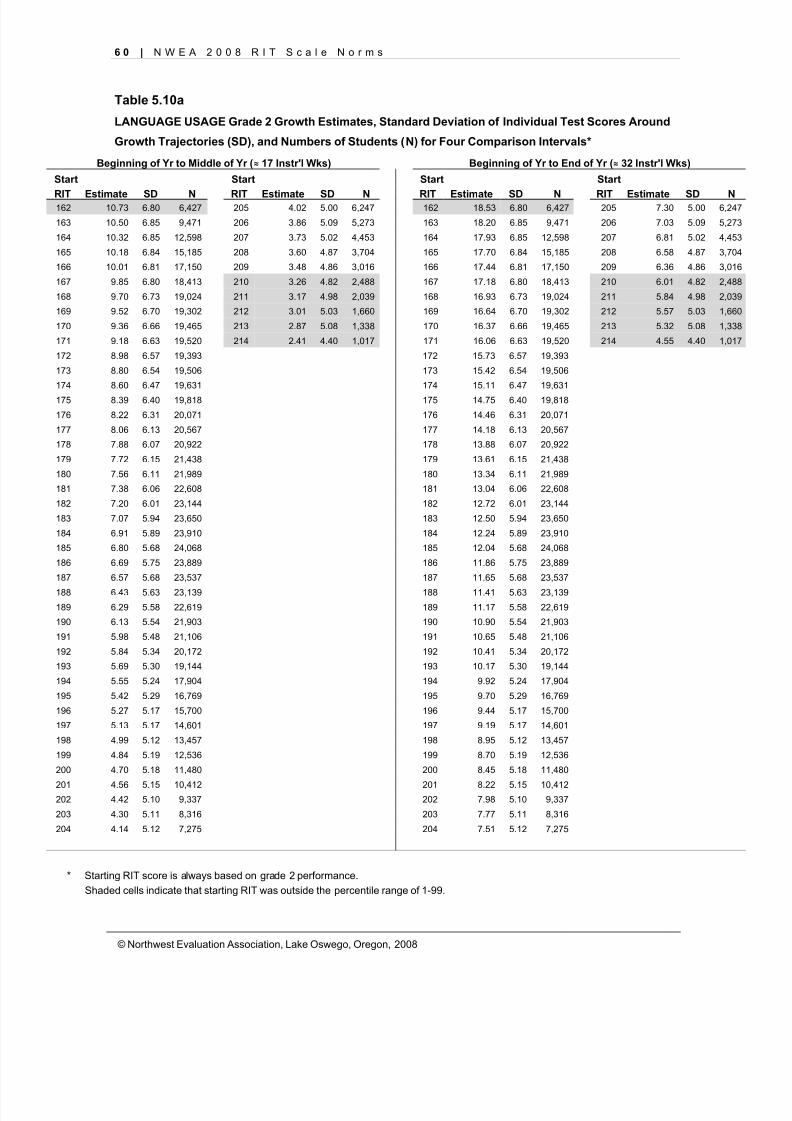
8/7/2019 NWEA Complete Norms2008
http://slidepdf.com/reader/full/nwea-complete-norms2008 70/170
6 0 | N W E A 2 0 0 8 R I T S c a l e N o r m s
© Northwest Evaluation Association, Lake Oswego, Oregon, 2008
Table 5.10a
LANGUAGE USAGE Grade 2 Growth Estimates, Standard Deviation of Individual Test Scores Around
Growth Trajectories (SD), and Numbers of Students (N) for Four Comparison Intervals*
Beginning of Yr to Middle of Yr ( ≈ 17 Instr'l Wks) Beginning of Yr to End of Yr ( ≈ 32 Instr'l Wks)
Start Start Start Start
RIT Estimate SD N RIT Estimate SD N RIT Estimate SD N RIT Estimate SD N162 10.73 6.80 6,427 205 4.02 5.00 6,247 162 18.53 6.80 6,427 205 7.30 5.00 6,247
163 10.50 6.85 9,471 206 3.86 5.09 5,273 163 18.20 6.85 9,471 206 7.03 5.09 5,273
164 10.32 6.85 12,598 207 3.73 5.02 4,453 164 17.93 6.85 12,598 207 6.81 5.02 4,453
165 10.18 6.84 15,185 208 3.60 4.87 3,704 165 17.70 6.84 15,185 208 6.58 4.87 3,704
166 10.01 6.81 17,150 209 3.48 4.86 3,016 166 17.44 6.81 17,150 209 6.36 4.86 3,016
167 9.85 6.80 18,413 210 3.26 4.82 2,488 167 17.18 6.80 18,413 210 6.01 4.82 2,488
168 9.70 6.73 19,024 211 3.17 4.98 2,039 168 16.93 6.73 19,024 211 5.84 4.98 2,039
169 9.52 6.70 19,302 212 3.01 5.03 1,660 169 16.64 6.70 19,302 212 5.57 5.03 1,660
170 9.36 6.66 19,465 213 2.87 5.08 1,338 170 16.37 6.66 19,465 213 5.32 5.08 1,338
171 9.18 6.63 19,520 214 2.41 4.40 1,017 171 16.06 6.63 19,520 214 4.55 4.40 1,017
172 8.98 6.57 19,393 172 15.73 6.57 19,393
173 8.80 6.54 19,506 173 15.42 6.54 19,506
174 8.60 6.47 19,631 174 15.11 6.47 19,631
175 8.39 6.40 19,818 175 14.75 6.40 19,818
176 8.22 6.31 20,071 176 14.46 6.31 20,071
177 8.06 6.13 20,567 177 14.18 6.13 20,567
178 7.88 6.07 20,922 178 13.88 6.07 20,922
179 7.72 6.15 21,438 179 13.61 6.15 21,438
180 7.56 6.11 21,989 180 13.34 6.11 21,989
181 7.38 6.06 22,608 181 13.04 6.06 22,608
182 7.20 6.01 23,144 182 12.72 6.01 23,144
183 7.07 5.94 23,650 183 12.50 5.94 23,650
184 6.91 5.89 23,910 184 12.24 5.89 23,910
185 6.80 5.68 24,068 185 12.04 5.68 24,068
186 6.69 5.75 23,889 186 11.86 5.75 23,889
187 6.57 5.68 23,537 187 11.65 5.68 23,537
188 6.43 5.63 23,139 188 11.41 5.63 23,139
189 6.29 5.58 22,619 189 11.17 5.58 22,619
190 6.13 5.54 21,903 190 10.90 5.54 21,903
191 5.98 5.48 21,106 191 10.65 5.48 21,106
192 5.84 5.34 20,172 192 10.41 5.34 20,172
193 5.69 5.30 19,144 193 10.17 5.30 19,144
194 5.55 5.24 17,904 194 9.92 5.24 17,904
195 5.42 5.29 16,769 195 9.70 5.29 16,769
196 5.27 5.17 15,700 196 9.44 5.17 15,700
197 5.13 5.17 14,601 197 9.19 5.17 14,601
198 4.99 5.12 13,457 198 8.95 5.12 13,457
199 4.84 5.19 12,536 199 8.70 5.19 12,536
200 4.70 5.18 11,480 200 8.45 5.18 11,480
201 4.56 5.15 10,412 201 8.22 5.15 10,412202 4.42 5.10 9,337 202 7.98 5.10 9,337
203 4.30 5.11 8,316 203 7.77 5.11 8,316
204 4.14 5.12 7,275 204 7.51 5.12 7,275
* Starting RIT score is always based on grade 2 performance.Shaded cells indicate that starting RIT was outside the percentile range of 1-99.
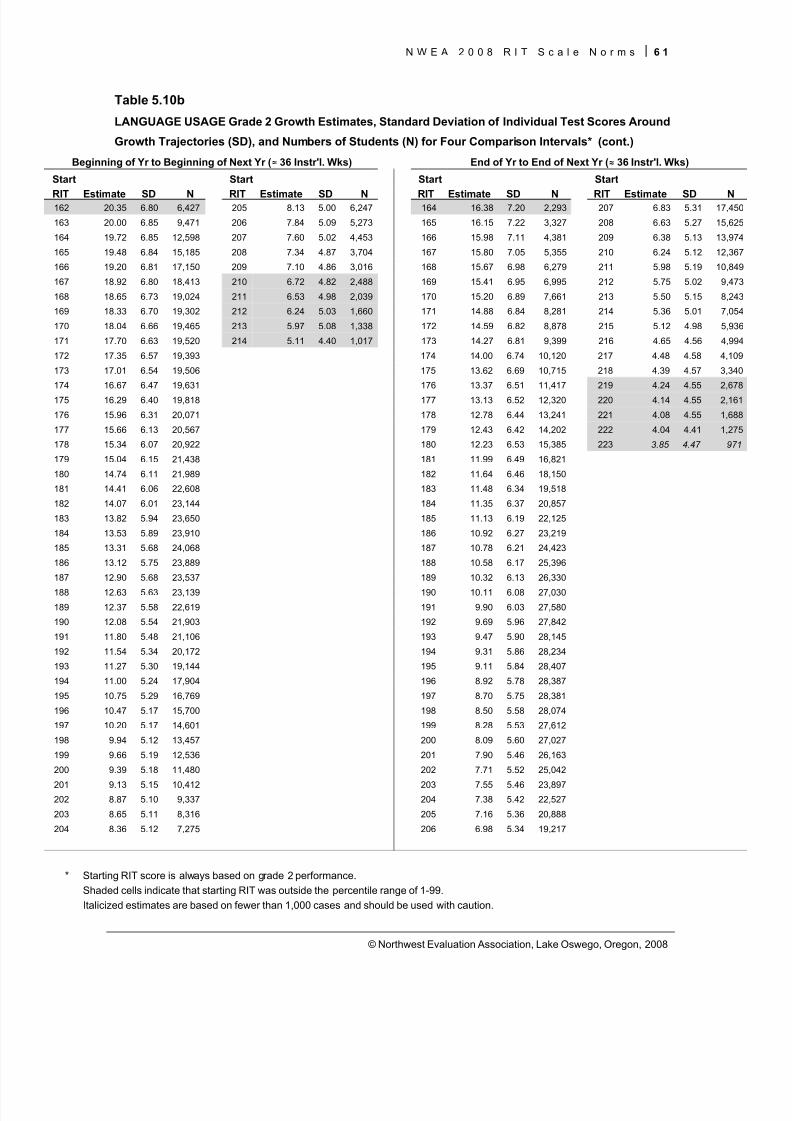
8/7/2019 NWEA Complete Norms2008
http://slidepdf.com/reader/full/nwea-complete-norms2008 71/170
N W E A 2 0 0 8 R I T S c a l e N o r m s 6 1
© Northwest Evaluation Association, Lake Oswego, Oregon, 2008
Table 5.10b
LANGUAGE USAGE Grade 2 Growth Estimates, Standard Deviation of Individual Test Scores Around
Growth Trajectories (SD), and Numbers of Students (N) for Four Comparison Intervals* (cont.)
Beginning of Yr to Beginning of Next Yr ( ≈ 36 Instr'l. Wks) End of Yr to End of Next Yr ( ≈ 36 Instr'l. Wks)
Start Start Start Start
RIT Estimate SD N RIT Estimate SD N RIT Estimate SD N RIT Estimate SD N162 20.35 6.80 6,427 205 8.13 5.00 6,247 164 16.38 7.20 2,293 207 6.83 5.31 17,450
163 20.00 6.85 9,471 206 7.84 5.09 5,273 165 16.15 7.22 3,327 208 6.63 5.27 15,625
164 19.72 6.85 12,598 207 7.60 5.02 4,453 166 15.98 7.11 4,381 209 6.38 5.13 13,974
165 19.48 6.84 15,185 208 7.34 4.87 3,704 167 15.80 7.05 5,355 210 6.24 5.12 12,367
166 19.20 6.81 17,150 209 7.10 4.86 3,016 168 15.67 6.98 6,279 211 5.98 5.19 10,849
167 18.92 6.80 18,413 210 6.72 4.82 2,488 169 15.41 6.95 6,995 212 5.75 5.02 9,473
168 18.65 6.73 19,024 211 6.53 4.98 2,039 170 15.20 6.89 7,661 213 5.50 5.15 8,243
169 18.33 6.70 19,302 212 6.24 5.03 1,660 171 14.88 6.84 8,281 214 5.36 5.01 7,054
170 18.04 6.66 19,465 213 5.97 5.08 1,338 172 14.59 6.82 8,878 215 5.12 4.98 5,936
171 17.70 6.63 19,520 214 5.11 4.40 1,017 173 14.27 6.81 9,399 216 4.65 4.56 4,994
172 17.35 6.57 19,393 174 14.00 6.74 10,120 217 4.48 4.58 4,109
173 17.01 6.54 19,506 175 13.62 6.69 10,715 218 4.39 4.57 3,340
174 16.67 6.47 19,631 176 13.37 6.51 11,417 219 4.24 4.55 2,678
175 16.29 6.40 19,818 177 13.13 6.52 12,320 220 4.14 4.55 2,161
176 15.96 6.31 20,071 178 12.78 6.44 13,241 221 4.08 4.55 1,688
177 15.66 6.13 20,567 179 12.43 6.42 14,202 222 4.04 4.41 1,275
178 15.34 6.07 20,922 180 12.23 6.53 15,385 223 3.85 4.47 971
179 15.04 6.15 21,438 181 11.99 6.49 16,821
180 14.74 6.11 21,989 182 11.64 6.46 18,150
181 14.41 6.06 22,608 183 11.48 6.34 19,518
182 14.07 6.01 23,144 184 11.35 6.37 20,857
183 13.82 5.94 23,650 185 11.13 6.19 22,125
184 13.53 5.89 23,910 186 10.92 6.27 23,219
185 13.31 5.68 24,068 187 10.78 6.21 24,423
186 13.12 5.75 23,889 188 10.58 6.17 25,396
187 12.90 5.68 23,537 189 10.32 6.13 26,330
188 12.63 5.63 23,139 190 10.11 6.08 27,030
189 12.37 5.58 22,619 191 9.90 6.03 27,580
190 12.08 5.54 21,903 192 9.69 5.96 27,842
191 11.80 5.48 21,106 193 9.47 5.90 28,145
192 11.54 5.34 20,172 194 9.31 5.86 28,234
193 11.27 5.30 19,144 195 9.11 5.84 28,407
194 11.00 5.24 17,904 196 8.92 5.78 28,387
195 10.75 5.29 16,769 197 8.70 5.75 28,381
196 10.47 5.17 15,700 198 8.50 5.58 28,074
197 10.20 5.17 14,601 199 8.28 5.53 27,612
198 9.94 5.12 13,457 200 8.09 5.60 27,027
199 9.66 5.19 12,536 201 7.90 5.46 26,163
200 9.39 5.18 11,480 202 7.71 5.52 25,042
201 9.13 5.15 10,412 203 7.55 5.46 23,897202 8.87 5.10 9,337 204 7.38 5.42 22,527
203 8.65 5.11 8,316 205 7.16 5.36 20,888
204 8.36 5.12 7,275 206 6.98 5.34 19,217
* Starting RIT score is always based on grade 2 performance.Shaded cells indicate that starting RIT was outside the percentile range of 1-99.Italicized estimates are based on fewer than 1,000 cases and should be used with caution.
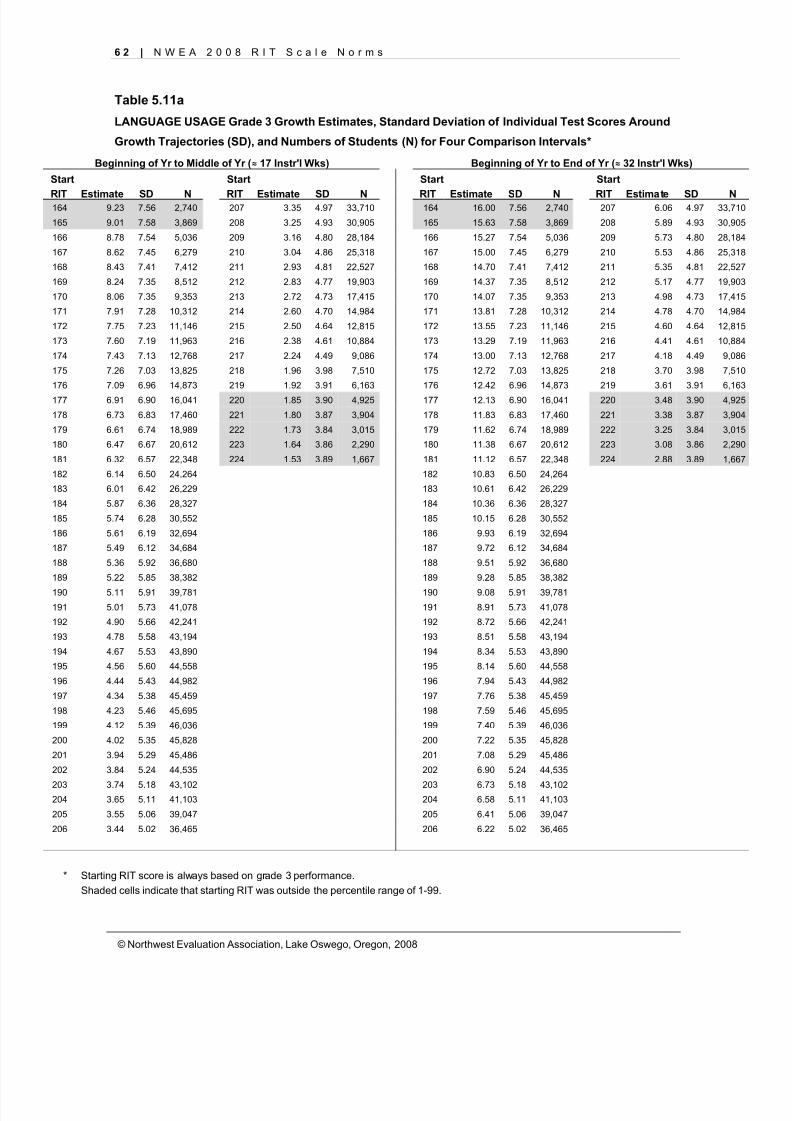
8/7/2019 NWEA Complete Norms2008
http://slidepdf.com/reader/full/nwea-complete-norms2008 72/170
6 2 | N W E A 2 0 0 8 R I T S c a l e N o r m s
© Northwest Evaluation Association, Lake Oswego, Oregon, 2008
Table 5.11a
LANGUAGE USAGE Grade 3 Growth Estimates, Standard Deviation of Individual Test Scores Around
Growth Trajectories (SD), and Numbers of Students (N) for Four Comparison Intervals*
Beginning of Yr to Middle of Yr ( ≈ 17 Instr'l Wks) Beginning of Yr to End of Yr ( ≈ 32 Instr'l Wks)
Start Start Start Start
RIT Estimate SD N RIT Estimate SD N RIT Estimate SD N RIT Estimate SD N164 9.23 7.56 2,740 207 3.35 4.97 33,710 164 16.00 7.56 2,740 207 6.06 4.97 33,710
165 9.01 7.58 3,869 208 3.25 4.93 30,905 165 15.63 7.58 3,869 208 5.89 4.93 30,905
166 8.78 7.54 5,036 209 3.16 4.80 28,184 166 15.27 7.54 5,036 209 5.73 4.80 28,184
167 8.62 7.45 6,279 210 3.04 4.86 25,318 167 15.00 7.45 6,279 210 5.53 4.86 25,318
168 8.43 7.41 7,412 211 2.93 4.81 22,527 168 14.70 7.41 7,412 211 5.35 4.81 22,527
169 8.24 7.35 8,512 212 2.83 4.77 19,903 169 14.37 7.35 8,512 212 5.17 4.77 19,903
170 8.06 7.35 9,353 213 2.72 4.73 17,415 170 14.07 7.35 9,353 213 4.98 4.73 17,415
171 7.91 7.28 10,312 214 2.60 4.70 14,984 171 13.81 7.28 10,312 214 4.78 4.70 14,984
172 7.75 7.23 11,146 215 2.50 4.64 12,815 172 13.55 7.23 11,146 215 4.60 4.64 12,815
173 7.60 7.19 11,963 216 2.38 4.61 10,884 173 13.29 7.19 11,963 216 4.41 4.61 10,884
174 7.43 7.13 12,768 217 2.24 4.49 9,086 174 13.00 7.13 12,768 217 4.18 4.49 9,086
175 7.26 7.03 13,825 218 1.96 3.98 7,510 175 12.72 7.03 13,825 218 3.70 3.98 7,510
176 7.09 6.96 14,873 219 1.92 3.91 6,163 176 12.42 6.96 14,873 219 3.61 3.91 6,163
177 6.91 6.90 16,041 220 1.85 3.90 4,925 177 12.13 6.90 16,041 220 3.48 3.90 4,925
178 6.73 6.83 17,460 221 1.80 3.87 3,904 178 11.83 6.83 17,460 221 3.38 3.87 3,904
179 6.61 6.74 18,989 222 1.73 3.84 3,015 179 11.62 6.74 18,989 222 3.25 3.84 3,015
180 6.47 6.67 20,612 223 1.64 3.86 2,290 180 11.38 6.67 20,612 223 3.08 3.86 2,290
181 6.32 6.57 22,348 224 1.53 3.89 1,667 181 11.12 6.57 22,348 224 2.88 3.89 1,667
182 6.14 6.50 24,264 182 10.83 6.50 24,264
183 6.01 6.42 26,229 183 10.61 6.42 26,229
184 5.87 6.36 28,327 184 10.36 6.36 28,327
185 5.74 6.28 30,552 185 10.15 6.28 30,552
186 5.61 6.19 32,694 186 9.93 6.19 32,694
187 5.49 6.12 34,684 187 9.72 6.12 34,684
188 5.36 5.92 36,680 188 9.51 5.92 36,680
189 5.22 5.85 38,382 189 9.28 5.85 38,382
190 5.11 5.91 39,781 190 9.08 5.91 39,781
191 5.01 5.73 41,078 191 8.91 5.73 41,078
192 4.90 5.66 42,241 192 8.72 5.66 42,241
193 4.78 5.58 43,194 193 8.51 5.58 43,194
194 4.67 5.53 43,890 194 8.34 5.53 43,890
195 4.56 5.60 44,558 195 8.14 5.60 44,558
196 4.44 5.43 44,982 196 7.94 5.43 44,982
197 4.34 5.38 45,459 197 7.76 5.38 45,459
198 4.23 5.46 45,695 198 7.59 5.46 45,695
199 4.12 5.39 46,036 199 7.40 5.39 46,036
200 4.02 5.35 45,828 200 7.22 5.35 45,828
201 3.94 5.29 45,486 201 7.08 5.29 45,486
202 3.84 5.24 44,535 202 6.90 5.24 44,535
203 3.74 5.18 43,102 203 6.73 5.18 43,102204 3.65 5.11 41,103 204 6.58 5.11 41,103
205 3.55 5.06 39,047 205 6.41 5.06 39,047
206 3.44 5.02 36,465 206 6.22 5.02 36,465
* Starting RIT score is always based on grade 3 performance.Shaded cells indicate that starting RIT was outside the percentile range of 1-99.
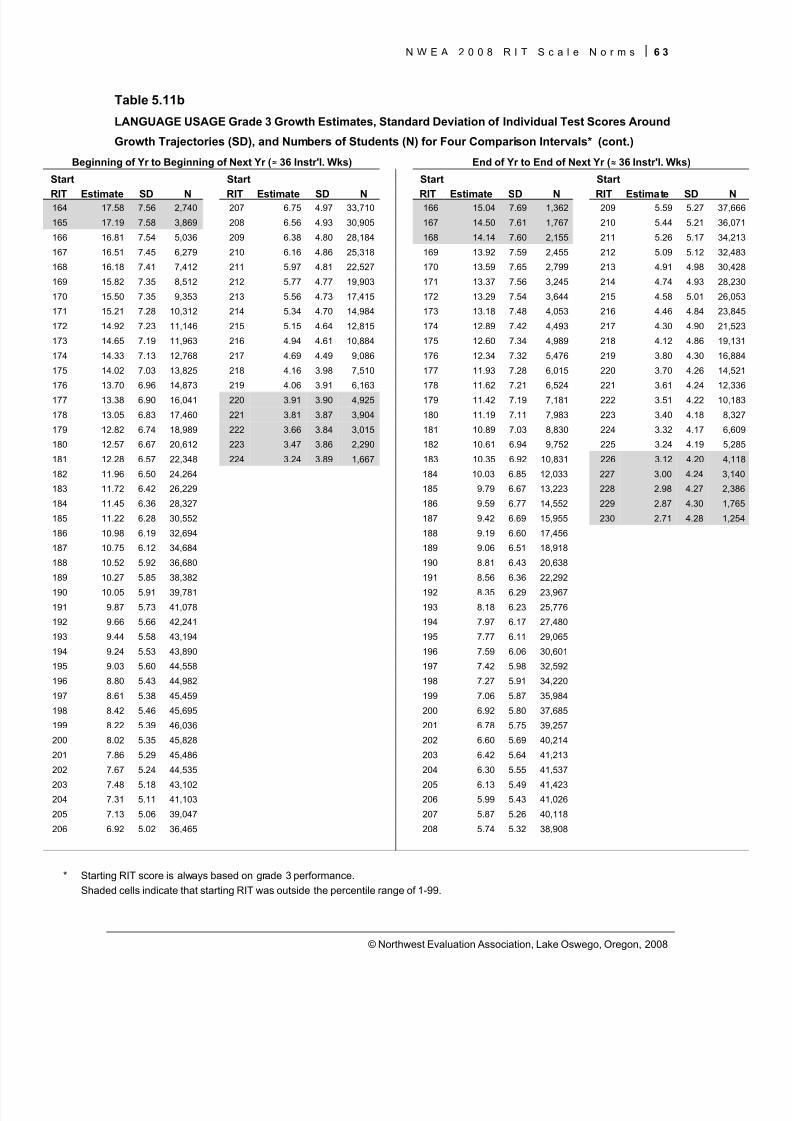
8/7/2019 NWEA Complete Norms2008
http://slidepdf.com/reader/full/nwea-complete-norms2008 73/170
N W E A 2 0 0 8 R I T S c a l e N o r m s 6 3
© Northwest Evaluation Association, Lake Oswego, Oregon, 2008
Table 5.11b
LANGUAGE USAGE Grade 3 Growth Estimates, Standard Deviation of Individual Test Scores Around
Growth Trajectories (SD), and Numbers of Students (N) for Four Comparison Intervals* (cont.)
Beginning of Yr to Beginning of Next Yr ( ≈ 36 Instr'l. Wks) End of Yr to End of Next Yr ( ≈ 36 Instr'l. Wks)
Start Start Start Start
RIT Estimate SD N RIT Estimate SD N RIT Estimate SD N RIT Estimate SD N164 17.58 7.56 2,740 207 6.75 4.97 33,710 166 15.04 7.69 1,362 209 5.59 5.27 37,666
165 17.19 7.58 3,869 208 6.56 4.93 30,905 167 14.50 7.61 1,767 210 5.44 5.21 36,071
166 16.81 7.54 5,036 209 6.38 4.80 28,184 168 14.14 7.60 2,155 211 5.26 5.17 34,213
167 16.51 7.45 6,279 210 6.16 4.86 25,318 169 13.92 7.59 2,455 212 5.09 5.12 32,483
168 16.18 7.41 7,412 211 5.97 4.81 22,527 170 13.59 7.65 2,799 213 4.91 4.98 30,428
169 15.82 7.35 8,512 212 5.77 4.77 19,903 171 13.37 7.56 3,245 214 4.74 4.93 28,230
170 15.50 7.35 9,353 213 5.56 4.73 17,415 172 13.29 7.54 3,644 215 4.58 5.01 26,053
171 15.21 7.28 10,312 214 5.34 4.70 14,984 173 13.18 7.48 4,053 216 4.46 4.84 23,845
172 14.92 7.23 11,146 215 5.15 4.64 12,815 174 12.89 7.42 4,493 217 4.30 4.90 21,523
173 14.65 7.19 11,963 216 4.94 4.61 10,884 175 12.60 7.34 4,989 218 4.12 4.86 19,131
174 14.33 7.13 12,768 217 4.69 4.49 9,086 176 12.34 7.32 5,476 219 3.80 4.30 16,884
175 14.02 7.03 13,825 218 4.16 3.98 7,510 177 11.93 7.28 6,015 220 3.70 4.26 14,521
176 13.70 6.96 14,873 219 4.06 3.91 6,163 178 11.62 7.21 6,524 221 3.61 4.24 12,336
177 13.38 6.90 16,041 220 3.91 3.90 4,925 179 11.42 7.19 7,181 222 3.51 4.22 10,183
178 13.05 6.83 17,460 221 3.81 3.87 3,904 180 11.19 7.11 7,983 223 3.40 4.18 8,327
179 12.82 6.74 18,989 222 3.66 3.84 3,015 181 10.89 7.03 8,830 224 3.32 4.17 6,609
180 12.57 6.67 20,612 223 3.47 3.86 2,290 182 10.61 6.94 9,752 225 3.24 4.19 5,285
181 12.28 6.57 22,348 224 3.24 3.89 1,667 183 10.35 6.92 10,831 226 3.12 4.20 4,118
182 11.96 6.50 24,264 184 10.03 6.85 12,033 227 3.00 4.24 3,140
183 11.72 6.42 26,229 185 9.79 6.67 13,223 228 2.98 4.27 2,386
184 11.45 6.36 28,327 186 9.59 6.77 14,552 229 2.87 4.30 1,765
185 11.22 6.28 30,552 187 9.42 6.69 15,955 230 2.71 4.28 1,254
186 10.98 6.19 32,694 188 9.19 6.60 17,456
187 10.75 6.12 34,684 189 9.06 6.51 18,918
188 10.52 5.92 36,680 190 8.81 6.43 20,638
189 10.27 5.85 38,382 191 8.56 6.36 22,292
190 10.05 5.91 39,781 192 8.35 6.29 23,967
191 9.87 5.73 41,078 193 8.18 6.23 25,776
192 9.66 5.66 42,241 194 7.97 6.17 27,480
193 9.44 5.58 43,194 195 7.77 6.11 29,065
194 9.24 5.53 43,890 196 7.59 6.06 30,601
195 9.03 5.60 44,558 197 7.42 5.98 32,592
196 8.80 5.43 44,982 198 7.27 5.91 34,220
197 8.61 5.38 45,459 199 7.06 5.87 35,984
198 8.42 5.46 45,695 200 6.92 5.80 37,685
199 8.22 5.39 46,036 201 6.78 5.75 39,257
200 8.02 5.35 45,828 202 6.60 5.69 40,214
201 7.86 5.29 45,486 203 6.42 5.64 41,213
202 7.67 5.24 44,535 204 6.30 5.55 41,537
203 7.48 5.18 43,102 205 6.13 5.49 41,423204 7.31 5.11 41,103 206 5.99 5.43 41,026
205 7.13 5.06 39,047 207 5.87 5.26 40,118
206 6.92 5.02 36,465 208 5.74 5.32 38,908
* Starting RIT score is always based on grade 3 performance.Shaded cells indicate that starting RIT was outside the percentile range of 1-99.
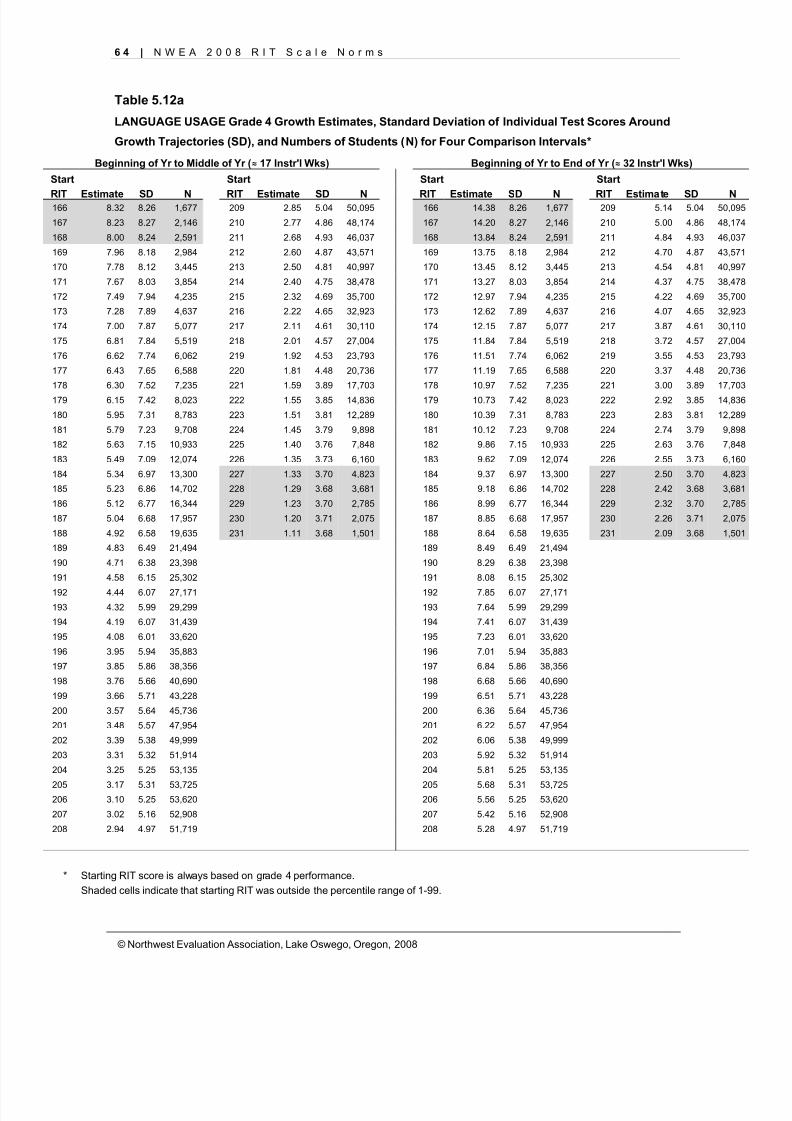
8/7/2019 NWEA Complete Norms2008
http://slidepdf.com/reader/full/nwea-complete-norms2008 74/170
6 4 | N W E A 2 0 0 8 R I T S c a l e N o r m s
© Northwest Evaluation Association, Lake Oswego, Oregon, 2008
Table 5.12a
LANGUAGE USAGE Grade 4 Growth Estimates, Standard Deviation of Individual Test Scores Around
Growth Trajectories (SD), and Numbers of Students (N) for Four Comparison Intervals*
Beginning of Yr to Middle of Yr ( ≈ 17 Instr'l Wks) Beginning of Yr to End of Yr ( ≈ 32 Instr'l Wks)
Start Start Start Start
RIT Estimate SD N RIT Estimate SD N RIT Estimate SD N RIT Estimate SD N166 8.32 8.26 1,677 209 2.85 5.04 50,095 166 14.38 8.26 1,677 209 5.14 5.04 50,095
167 8.23 8.27 2,146 210 2.77 4.86 48,174 167 14.20 8.27 2,146 210 5.00 4.86 48,174
168 8.00 8.24 2,591 211 2.68 4.93 46,037 168 13.84 8.24 2,591 211 4.84 4.93 46,037
169 7.96 8.18 2,984 212 2.60 4.87 43,571 169 13.75 8.18 2,984 212 4.70 4.87 43,571
170 7.78 8.12 3,445 213 2.50 4.81 40,997 170 13.45 8.12 3,445 213 4.54 4.81 40,997
171 7.67 8.03 3,854 214 2.40 4.75 38,478 171 13.27 8.03 3,854 214 4.37 4.75 38,478
172 7.49 7.94 4,235 215 2.32 4.69 35,700 172 12.97 7.94 4,235 215 4.22 4.69 35,700
173 7.28 7.89 4,637 216 2.22 4.65 32,923 173 12.62 7.89 4,637 216 4.07 4.65 32,923
174 7.00 7.87 5,077 217 2.11 4.61 30,110 174 12.15 7.87 5,077 217 3.87 4.61 30,110
175 6.81 7.84 5,519 218 2.01 4.57 27,004 175 11.84 7.84 5,519 218 3.72 4.57 27,004
176 6.62 7.74 6,062 219 1.92 4.53 23,793 176 11.51 7.74 6,062 219 3.55 4.53 23,793
177 6.43 7.65 6,588 220 1.81 4.48 20,736 177 11.19 7.65 6,588 220 3.37 4.48 20,736
178 6.30 7.52 7,235 221 1.59 3.89 17,703 178 10.97 7.52 7,235 221 3.00 3.89 17,703
179 6.15 7.42 8,023 222 1.55 3.85 14,836 179 10.73 7.42 8,023 222 2.92 3.85 14,836
180 5.95 7.31 8,783 223 1.51 3.81 12,289 180 10.39 7.31 8,783 223 2.83 3.81 12,289
181 5.79 7.23 9,708 224 1.45 3.79 9,898 181 10.12 7.23 9,708 224 2.74 3.79 9,898
182 5.63 7.15 10,933 225 1.40 3.76 7,848 182 9.86 7.15 10,933 225 2.63 3.76 7,848
183 5.49 7.09 12,074 226 1.35 3.73 6,160 183 9.62 7.09 12,074 226 2.55 3.73 6,160
184 5.34 6.97 13,300 227 1.33 3.70 4,823 184 9.37 6.97 13,300 227 2.50 3.70 4,823
185 5.23 6.86 14,702 228 1.29 3.68 3,681 185 9.18 6.86 14,702 228 2.42 3.68 3,681
186 5.12 6.77 16,344 229 1.23 3.70 2,785 186 8.99 6.77 16,344 229 2.32 3.70 2,785
187 5.04 6.68 17,957 230 1.20 3.71 2,075 187 8.85 6.68 17,957 230 2.26 3.71 2,075
188 4.92 6.58 19,635 231 1.11 3.68 1,501 188 8.64 6.58 19,635 231 2.09 3.68 1,501
189 4.83 6.49 21,494 189 8.49 6.49 21,494
190 4.71 6.38 23,398 190 8.29 6.38 23,398
191 4.58 6.15 25,302 191 8.08 6.15 25,302
192 4.44 6.07 27,171 192 7.85 6.07 27,171
193 4.32 5.99 29,299 193 7.64 5.99 29,299
194 4.19 6.07 31,439 194 7.41 6.07 31,439
195 4.08 6.01 33,620 195 7.23 6.01 33,620
196 3.95 5.94 35,883 196 7.01 5.94 35,883
197 3.85 5.86 38,356 197 6.84 5.86 38,356
198 3.76 5.66 40,690 198 6.68 5.66 40,690
199 3.66 5.71 43,228 199 6.51 5.71 43,228
200 3.57 5.64 45,736 200 6.36 5.64 45,736
201 3.48 5.57 47,954 201 6.22 5.57 47,954
202 3.39 5.38 49,999 202 6.06 5.38 49,999
203 3.31 5.32 51,914 203 5.92 5.32 51,914
204 3.25 5.25 53,135 204 5.81 5.25 53,135
205 3.17 5.31 53,725 205 5.68 5.31 53,725206 3.10 5.25 53,620 206 5.56 5.25 53,620
207 3.02 5.16 52,908 207 5.42 5.16 52,908
208 2.94 4.97 51,719 208 5.28 4.97 51,719
* Starting RIT score is always based on grade 4 performance.Shaded cells indicate that starting RIT was outside the percentile range of 1-99.
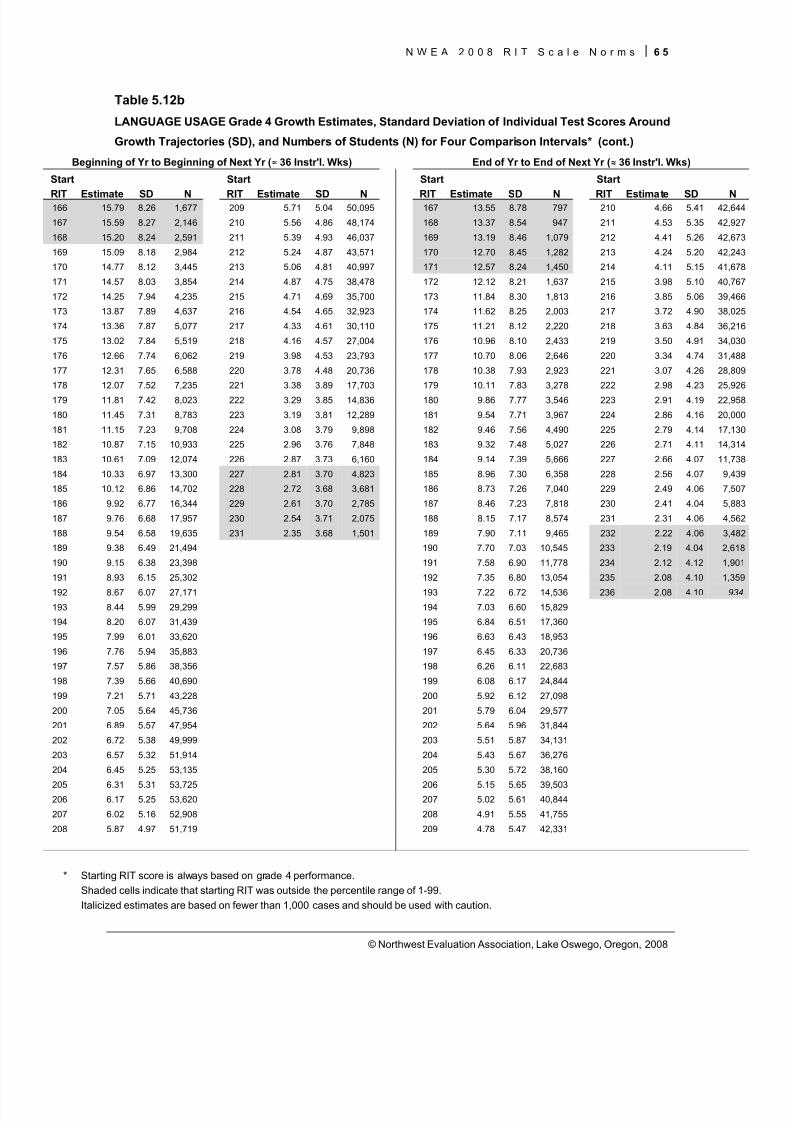
8/7/2019 NWEA Complete Norms2008
http://slidepdf.com/reader/full/nwea-complete-norms2008 75/170
N W E A 2 0 0 8 R I T S c a l e N o r m s 6 5
© Northwest Evaluation Association, Lake Oswego, Oregon, 2008
Table 5.12b
LANGUAGE USAGE Grade 4 Growth Estimates, Standard Deviation of Individual Test Scores Around
Growth Trajectories (SD), and Numbers of Students (N) for Four Comparison Intervals* (cont.)
Beginning of Yr to Beginning of Next Yr ( ≈ 36 Instr'l. Wks) End of Yr to End of Next Yr ( ≈ 36 Instr'l. Wks)
Start Start Start Start
RIT Estimate SD N RIT Estimate SD N RIT Estimate SD N RIT Estimate SD N166 15.79 8.26 1,677 209 5.71 5.04 50,095 167 13.55 8.78 797 210 4.66 5.41 42,644
167 15.59 8.27 2,146 210 5.56 4.86 48,174 168 13.37 8.54 947 211 4.53 5.35 42,927
168 15.20 8.24 2,591 211 5.39 4.93 46,037 169 13.19 8.46 1,079 212 4.41 5.26 42,673
169 15.09 8.18 2,984 212 5.24 4.87 43,571 170 12.70 8.45 1,282 213 4.24 5.20 42,243
170 14.77 8.12 3,445 213 5.06 4.81 40,997 171 12.57 8.24 1,450 214 4.11 5.15 41,678
171 14.57 8.03 3,854 214 4.87 4.75 38,478 172 12.12 8.21 1,637 215 3.98 5.10 40,767
172 14.25 7.94 4,235 215 4.71 4.69 35,700 173 11.84 8.30 1,813 216 3.85 5.06 39,466
173 13.87 7.89 4,637 216 4.54 4.65 32,923 174 11.62 8.25 2,003 217 3.72 4.90 38,025
174 13.36 7.87 5,077 217 4.33 4.61 30,110 175 11.21 8.12 2,220 218 3.63 4.84 36,216
175 13.02 7.84 5,519 218 4.16 4.57 27,004 176 10.96 8.10 2,433 219 3.50 4.91 34,030
176 12.66 7.74 6,062 219 3.98 4.53 23,793 177 10.70 8.06 2,646 220 3.34 4.74 31,488
177 12.31 7.65 6,588 220 3.78 4.48 20,736 178 10.38 7.93 2,923 221 3.07 4.26 28,809
178 12.07 7.52 7,235 221 3.38 3.89 17,703 179 10.11 7.83 3,278 222 2.98 4.23 25,926
179 11.81 7.42 8,023 222 3.29 3.85 14,836 180 9.86 7.77 3,546 223 2.91 4.19 22,958
180 11.45 7.31 8,783 223 3.19 3.81 12,289 181 9.54 7.71 3,967 224 2.86 4.16 20,000
181 11.15 7.23 9,708 224 3.08 3.79 9,898 182 9.46 7.56 4,490 225 2.79 4.14 17,130
182 10.87 7.15 10,933 225 2.96 3.76 7,848 183 9.32 7.48 5,027 226 2.71 4.11 14,314
183 10.61 7.09 12,074 226 2.87 3.73 6,160 184 9.14 7.39 5,666 227 2.66 4.07 11,738
184 10.33 6.97 13,300 227 2.81 3.70 4,823 185 8.96 7.30 6,358 228 2.56 4.07 9,439
185 10.12 6.86 14,702 228 2.72 3.68 3,681 186 8.73 7.26 7,040 229 2.49 4.06 7,507
186 9.92 6.77 16,344 229 2.61 3.70 2,785 187 8.46 7.23 7,818 230 2.41 4.04 5,883
187 9.76 6.68 17,957 230 2.54 3.71 2,075 188 8.15 7.17 8,574 231 2.31 4.06 4,562
188 9.54 6.58 19,635 231 2.35 3.68 1,501 189 7.90 7.11 9,465 232 2.22 4.06 3,482
189 9.38 6.49 21,494 190 7.70 7.03 10,545 233 2.19 4.04 2,618
190 9.15 6.38 23,398 191 7.58 6.90 11,778 234 2.12 4.12 1,901
191 8.93 6.15 25,302 192 7.35 6.80 13,054 235 2.08 4.10 1,359
192 8.67 6.07 27,171 193 7.22 6.72 14,536 236 2.08 4.10 934
193 8.44 5.99 29,299 194 7.03 6.60 15,829
194 8.20 6.07 31,439 195 6.84 6.51 17,360
195 7.99 6.01 33,620 196 6.63 6.43 18,953
196 7.76 5.94 35,883 197 6.45 6.33 20,736
197 7.57 5.86 38,356 198 6.26 6.11 22,683
198 7.39 5.66 40,690 199 6.08 6.17 24,844
199 7.21 5.71 43,228 200 5.92 6.12 27,098
200 7.05 5.64 45,736 201 5.79 6.04 29,577
201 6.89 5.57 47,954 202 5.64 5.96 31,844
202 6.72 5.38 49,999 203 5.51 5.87 34,131
203 6.57 5.32 51,914 204 5.43 5.67 36,276
204 6.45 5.25 53,135 205 5.30 5.72 38,160
205 6.31 5.31 53,725 206 5.15 5.65 39,503206 6.17 5.25 53,620 207 5.02 5.61 40,844
207 6.02 5.16 52,908 208 4.91 5.55 41,755
208 5.87 4.97 51,719 209 4.78 5.47 42,331
* Starting RIT score is always based on grade 4 performance.Shaded cells indicate that starting RIT was outside the percentile range of 1-99.Italicized estimates are based on fewer than 1,000 cases and should be used with caution.
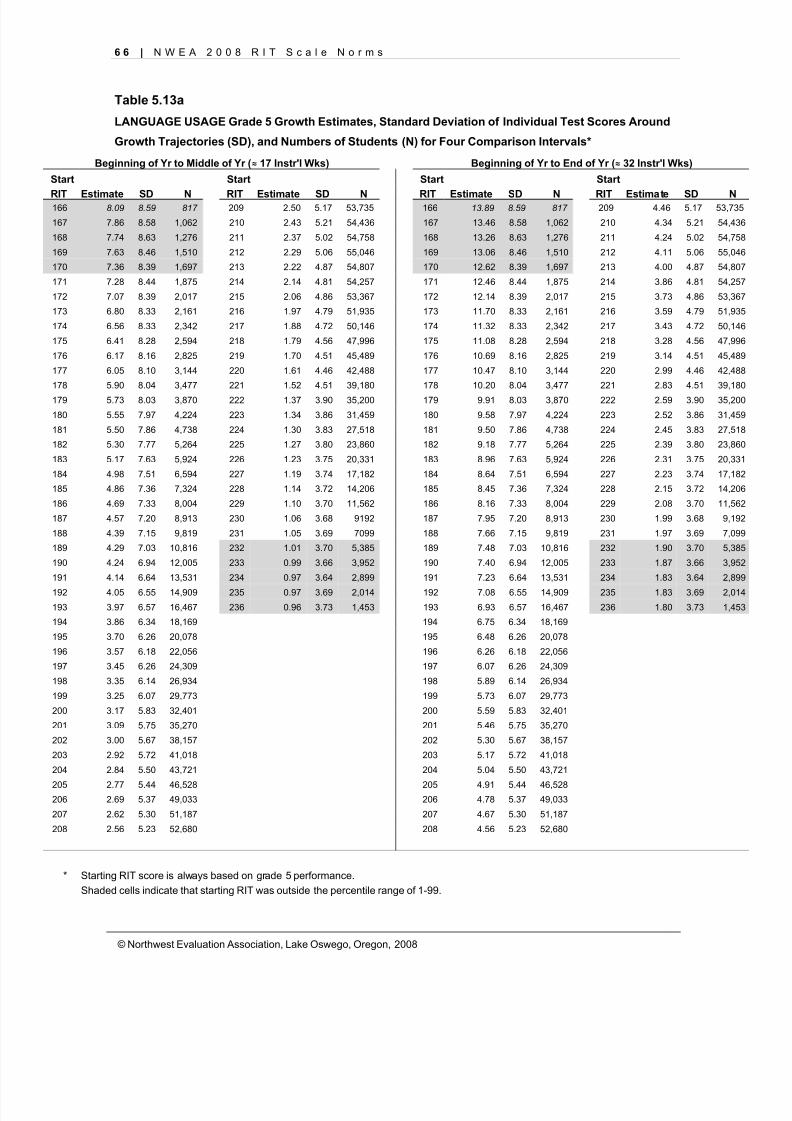
8/7/2019 NWEA Complete Norms2008
http://slidepdf.com/reader/full/nwea-complete-norms2008 76/170
6 6 | N W E A 2 0 0 8 R I T S c a l e N o r m s
© Northwest Evaluation Association, Lake Oswego, Oregon, 2008
Table 5.13a
LANGUAGE USAGE Grade 5 Growth Estimates, Standard Deviation of Individual Test Scores Around
Growth Trajectories (SD), and Numbers of Students (N) for Four Comparison Intervals*
Beginning of Yr to Middle of Yr ( ≈ 17 Instr'l Wks) Beginning of Yr to End of Yr ( ≈ 32 Instr'l Wks)
Start Start Start Start
RIT Estimate SD N RIT Estimate SD N RIT Estimate SD N RIT Estimate SD N166 8.09 8.59 817 209 2.50 5.17 53,735 166 13.89 8.59 817 209 4.46 5.17 53,735
167 7.86 8.58 1,062 210 2.43 5.21 54,436 167 13.46 8.58 1,062 210 4.34 5.21 54,436
168 7.74 8.63 1,276 211 2.37 5.02 54,758 168 13.26 8.63 1,276 211 4.24 5.02 54,758
169 7.63 8.46 1,510 212 2.29 5.06 55,046 169 13.06 8.46 1,510 212 4.11 5.06 55,046
170 7.36 8.39 1,697 213 2.22 4.87 54,807 170 12.62 8.39 1,697 213 4.00 4.87 54,807
171 7.28 8.44 1,875 214 2.14 4.81 54,257 171 12.46 8.44 1,875 214 3.86 4.81 54,257
172 7.07 8.39 2,017 215 2.06 4.86 53,367 172 12.14 8.39 2,017 215 3.73 4.86 53,367
173 6.80 8.33 2,161 216 1.97 4.79 51,935 173 11.70 8.33 2,161 216 3.59 4.79 51,935
174 6.56 8.33 2,342 217 1.88 4.72 50,146 174 11.32 8.33 2,342 217 3.43 4.72 50,146
175 6.41 8.28 2,594 218 1.79 4.56 47,996 175 11.08 8.28 2,594 218 3.28 4.56 47,996
176 6.17 8.16 2,825 219 1.70 4.51 45,489 176 10.69 8.16 2,825 219 3.14 4.51 45,489
177 6.05 8.10 3,144 220 1.61 4.46 42,488 177 10.47 8.10 3,144 220 2.99 4.46 42,488
178 5.90 8.04 3,477 221 1.52 4.51 39,180 178 10.20 8.04 3,477 221 2.83 4.51 39,180
179 5.73 8.03 3,870 222 1.37 3.90 35,200 179 9.91 8.03 3,870 222 2.59 3.90 35,200
180 5.55 7.97 4,224 223 1.34 3.86 31,459 180 9.58 7.97 4,224 223 2.52 3.86 31,459
181 5.50 7.86 4,738 224 1.30 3.83 27,518 181 9.50 7.86 4,738 224 2.45 3.83 27,518
182 5.30 7.77 5,264 225 1.27 3.80 23,860 182 9.18 7.77 5,264 225 2.39 3.80 23,860
183 5.17 7.63 5,924 226 1.23 3.75 20,331 183 8.96 7.63 5,924 226 2.31 3.75 20,331
184 4.98 7.51 6,594 227 1.19 3.74 17,182 184 8.64 7.51 6,594 227 2.23 3.74 17,182
185 4.86 7.36 7,324 228 1.14 3.72 14,206 185 8.45 7.36 7,324 228 2.15 3.72 14,206
186 4.69 7.33 8,004 229 1.10 3.70 11,562 186 8.16 7.33 8,004 229 2.08 3.70 11,562
187 4.57 7.20 8,913 230 1.06 3.68 9192 187 7.95 7.20 8,913 230 1.99 3.68 9,192
188 4.39 7.15 9,819 231 1.05 3.69 7099 188 7.66 7.15 9,819 231 1.97 3.69 7,099
189 4.29 7.03 10,816 232 1.01 3.70 5,385 189 7.48 7.03 10,816 232 1.90 3.70 5,385
190 4.24 6.94 12,005 233 0.99 3.66 3,952 190 7.40 6.94 12,005 233 1.87 3.66 3,952
191 4.14 6.64 13,531 234 0.97 3.64 2,899 191 7.23 6.64 13,531 234 1.83 3.64 2,899
192 4.05 6.55 14,909 235 0.97 3.69 2,014 192 7.08 6.55 14,909 235 1.83 3.69 2,014
193 3.97 6.57 16,467 236 0.96 3.73 1,453 193 6.93 6.57 16,467 236 1.80 3.73 1,453
194 3.86 6.34 18,169 194 6.75 6.34 18,169
195 3.70 6.26 20,078 195 6.48 6.26 20,078
196 3.57 6.18 22,056 196 6.26 6.18 22,056
197 3.45 6.26 24,309 197 6.07 6.26 24,309
198 3.35 6.14 26,934 198 5.89 6.14 26,934
199 3.25 6.07 29,773 199 5.73 6.07 29,773
200 3.17 5.83 32,401 200 5.59 5.83 32,401
201 3.09 5.75 35,270 201 5.46 5.75 35,270
202 3.00 5.67 38,157 202 5.30 5.67 38,157
203 2.92 5.72 41,018 203 5.17 5.72 41,018
204 2.84 5.50 43,721 204 5.04 5.50 43,721
205 2.77 5.44 46,528 205 4.91 5.44 46,528206 2.69 5.37 49,033 206 4.78 5.37 49,033
207 2.62 5.30 51,187 207 4.67 5.30 51,187
208 2.56 5.23 52,680 208 4.56 5.23 52,680
* Starting RIT score is always based on grade 5 performance.Shaded cells indicate that starting RIT was outside the percentile range of 1-99.
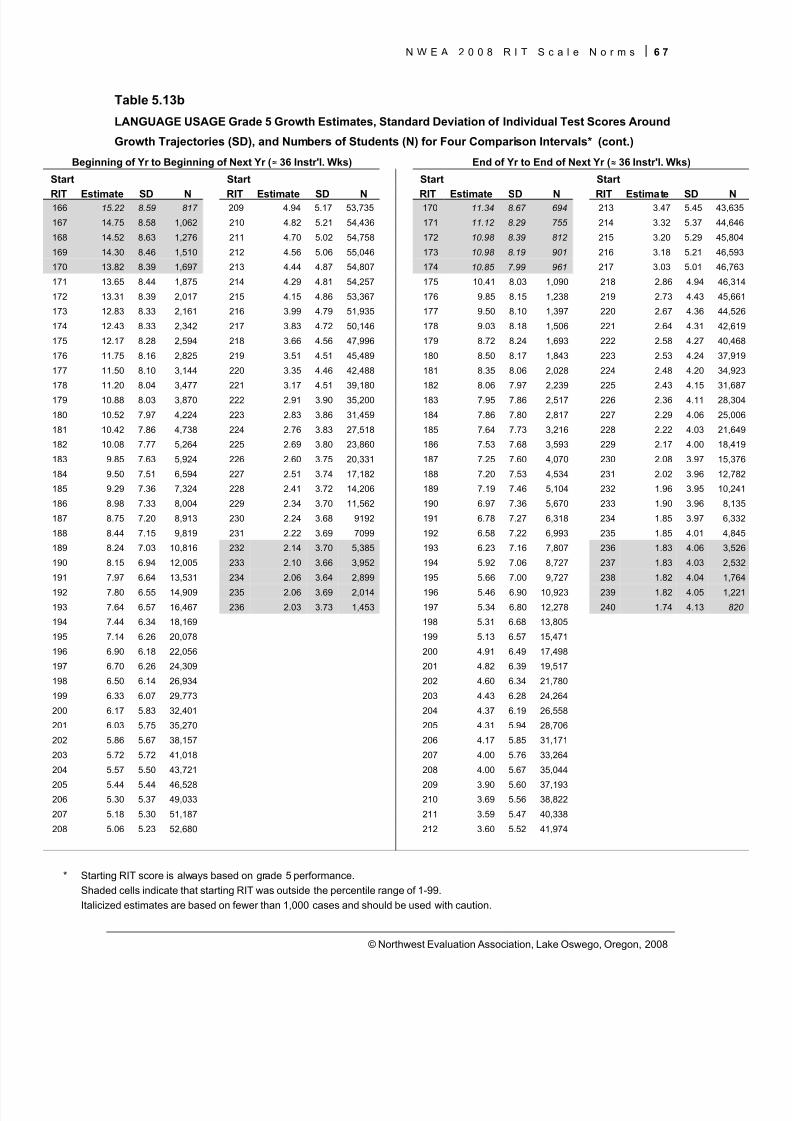
8/7/2019 NWEA Complete Norms2008
http://slidepdf.com/reader/full/nwea-complete-norms2008 77/170
N W E A 2 0 0 8 R I T S c a l e N o r m s 6 7
© Northwest Evaluation Association, Lake Oswego, Oregon, 2008
Table 5.13b
LANGUAGE USAGE Grade 5 Growth Estimates, Standard Deviation of Individual Test Scores Around
Growth Trajectories (SD), and Numbers of Students (N) for Four Comparison Intervals* (cont.)
Beginning of Yr to Beginning of Next Yr ( ≈ 36 Instr'l. Wks) End of Yr to End of Next Yr ( ≈ 36 Instr'l. Wks)
Start Start Start Start
RIT Estimate SD N RIT Estimate SD N RIT Estimate SD N RIT Estimate SD N166 15.22 8.59 817 209 4.94 5.17 53,735 170 11.34 8.67 694 213 3.47 5.45 43,635
167 14.75 8.58 1,062 210 4.82 5.21 54,436 171 11.12 8.29 755 214 3.32 5.37 44,646
168 14.52 8.63 1,276 211 4.70 5.02 54,758 172 10.98 8.39 812 215 3.20 5.29 45,804
169 14.30 8.46 1,510 212 4.56 5.06 55,046 173 10.98 8.19 901 216 3.18 5.21 46,593
170 13.82 8.39 1,697 213 4.44 4.87 54,807 174 10.85 7.99 961 217 3.03 5.01 46,763
171 13.65 8.44 1,875 214 4.29 4.81 54,257 175 10.41 8.03 1,090 218 2.86 4.94 46,314
172 13.31 8.39 2,017 215 4.15 4.86 53,367 176 9.85 8.15 1,238 219 2.73 4.43 45,661
173 12.83 8.33 2,161 216 3.99 4.79 51,935 177 9.50 8.10 1,397 220 2.67 4.36 44,526
174 12.43 8.33 2,342 217 3.83 4.72 50,146 178 9.03 8.18 1,506 221 2.64 4.31 42,619
175 12.17 8.28 2,594 218 3.66 4.56 47,996 179 8.72 8.24 1,693 222 2.58 4.27 40,468
176 11.75 8.16 2,825 219 3.51 4.51 45,489 180 8.50 8.17 1,843 223 2.53 4.24 37,919
177 11.50 8.10 3,144 220 3.35 4.46 42,488 181 8.35 8.06 2,028 224 2.48 4.20 34,923
178 11.20 8.04 3,477 221 3.17 4.51 39,180 182 8.06 7.97 2,239 225 2.43 4.15 31,687
179 10.88 8.03 3,870 222 2.91 3.90 35,200 183 7.95 7.86 2,517 226 2.36 4.11 28,304
180 10.52 7.97 4,224 223 2.83 3.86 31,459 184 7.86 7.80 2,817 227 2.29 4.06 25,006
181 10.42 7.86 4,738 224 2.76 3.83 27,518 185 7.64 7.73 3,216 228 2.22 4.03 21,649
182 10.08 7.77 5,264 225 2.69 3.80 23,860 186 7.53 7.68 3,593 229 2.17 4.00 18,419
183 9.85 7.63 5,924 226 2.60 3.75 20,331 187 7.25 7.60 4,070 230 2.08 3.97 15,376
184 9.50 7.51 6,594 227 2.51 3.74 17,182 188 7.20 7.53 4,534 231 2.02 3.96 12,782
185 9.29 7.36 7,324 228 2.41 3.72 14,206 189 7.19 7.46 5,104 232 1.96 3.95 10,241
186 8.98 7.33 8,004 229 2.34 3.70 11,562 190 6.97 7.36 5,670 233 1.90 3.96 8,135
187 8.75 7.20 8,913 230 2.24 3.68 9192 191 6.78 7.27 6,318 234 1.85 3.97 6,332
188 8.44 7.15 9,819 231 2.22 3.69 7099 192 6.58 7.22 6,993 235 1.85 4.01 4,845
189 8.24 7.03 10,816 232 2.14 3.70 5,385 193 6.23 7.16 7,807 236 1.83 4.06 3,526
190 8.15 6.94 12,005 233 2.10 3.66 3,952 194 5.92 7.06 8,727 237 1.83 4.03 2,532
191 7.97 6.64 13,531 234 2.06 3.64 2,899 195 5.66 7.00 9,727 238 1.82 4.04 1,764
192 7.80 6.55 14,909 235 2.06 3.69 2,014 196 5.46 6.90 10,923 239 1.82 4.05 1,221
193 7.64 6.57 16,467 236 2.03 3.73 1,453 197 5.34 6.80 12,278 240 1.74 4.13 820
194 7.44 6.34 18,169 198 5.31 6.68 13,805
195 7.14 6.26 20,078 199 5.13 6.57 15,471
196 6.90 6.18 22,056 200 4.91 6.49 17,498
197 6.70 6.26 24,309 201 4.82 6.39 19,517
198 6.50 6.14 26,934 202 4.60 6.34 21,780
199 6.33 6.07 29,773 203 4.43 6.28 24,264
200 6.17 5.83 32,401 204 4.37 6.19 26,558
201 6.03 5.75 35,270 205 4.31 5.94 28,706
202 5.86 5.67 38,157 206 4.17 5.85 31,171
203 5.72 5.72 41,018 207 4.00 5.76 33,264
204 5.57 5.50 43,721 208 4.00 5.67 35,044
205 5.44 5.44 46,528 209 3.90 5.60 37,193206 5.30 5.37 49,033 210 3.69 5.56 38,822
207 5.18 5.30 51,187 211 3.59 5.47 40,338
208 5.06 5.23 52,680 212 3.60 5.52 41,974
* Starting RIT score is always based on grade 5 performance.Shaded cells indicate that starting RIT was outside the percentile range of 1-99.Italicized estimates are based on fewer than 1,000 cases and should be used with caution.

8/7/2019 NWEA Complete Norms2008
http://slidepdf.com/reader/full/nwea-complete-norms2008 78/170
6 8 | N W E A 2 0 0 8 R I T S c a l e N o r m s
© Northwest Evaluation Association, Lake Oswego, Oregon, 2008
Table 5.14a
LANGUAGE USAGE Grade 6 Growth Estimates, Standard Deviation of Individual Test Scores Around
Growth Trajectories (SD), and Numbers of Students (N) for Four Comparison Intervals*
Beginning of Yr to Middle of Yr ( ≈ 17 Instr'l Wks) Beginning of Yr to End of Yr ( ≈ 32 Instr'l Wks)
Start Start Start Start
RIT Estimate SD N RIT Estimate SD N RIT Estimate SD N RIT Estimate SD N169 7.70 8.60 877 212 2.05 5.17 50,762 169 13.16 8.60 877 212 3.66 5.17 50,762
170 7.52 8.58 1,003 213 1.97 5.11 52,603 170 12.80 8.58 1,003 213 3.53 5.11 52,603
171 7.28 8.43 1,129 214 1.90 5.10 53,653 171 12.37 8.43 1,129 214 3.41 5.10 53,653
172 7.27 8.38 1,215 215 1.82 4.97 54,970 172 12.31 8.38 1,215 215 3.28 4.97 54,970
173 7.24 8.49 1,347 216 1.75 4.99 55,660 173 12.28 8.49 1,347 216 3.16 4.99 55,660
174 7.02 8.51 1,471 217 1.68 4.84 56,098 174 11.92 8.51 1,471 217 3.05 4.84 56,098
175 6.80 8.51 1,580 218 1.60 4.77 55,830 175 11.57 8.51 1,580 218 2.92 4.77 55,830
176 6.70 8.46 1,657 219 1.52 4.71 55,426 176 11.39 8.46 1,657 219 2.79 4.71 55,426
177 6.62 8.31 1,820 220 1.45 4.71 54,063 177 11.27 8.31 1,820 220 2.67 4.71 54,063
178 6.32 8.24 1,949 221 1.37 4.56 52,020 178 10.76 8.24 1,949 221 2.54 4.56 52,020
179 5.97 8.16 2,169 222 1.22 3.99 49,564 179 10.19 8.16 2,169 222 2.30 3.99 49,564
180 5.71 8.07 2,448 223 1.19 3.94 46,784 180 9.78 8.07 2,448 223 2.23 3.94 46,784
181 5.61 7.98 2,796 224 1.16 3.89 43,228 181 9.59 7.98 2,796 224 2.18 3.89 43,228
182 5.37 7.95 3,112 225 1.13 3.85 39,687 182 9.20 7.95 3,112 225 2.12 3.85 39,687
183 5.23 7.84 3,506 226 1.09 3.82 35,867 183 8.97 7.84 3,506 226 2.06 3.82 35,867
184 5.13 7.72 3,831 227 1.07 3.79 31,826 184 8.81 7.72 3,831 227 2.01 3.79 31,826
185 4.94 7.69 4,228 228 1.02 3.75 27,583 185 8.51 7.69 4,228 228 1.93 3.75 27,583
186 4.72 7.70 4,633 229 0.99 3.73 23,887 186 8.16 7.70 4,633 229 1.87 3.73 23,887
187 4.60 7.57 5,216 230 0.96 3.70 20,193 187 7.95 7.57 5,216 230 1.80 3.70 20,193
188 4.46 7.48 5,799 231 0.93 3.68 16,784 188 7.71 7.48 5,799 231 1.75 3.68 16,784
189 4.30 7.42 6,512 232 0.89 3.66 13,663 189 7.45 7.42 6,512 232 1.68 3.66 13,663
190 4.19 7.31 7,269 233 0.87 3.65 10931 190 7.26 7.31 7,269 233 1.63 3.65 10,931
191 4.11 7.15 8,032 234 0.82 3.68 8467 191 7.11 7.15 8,032 234 1.55 3.68 8,467
192 4.01 7.07 8,820 235 0.81 3.68 6334 192 6.96 7.07 8,820 235 1.52 3.68 6,334
193 3.88 6.96 9,715 236 0.77 3.72 4,633 193 6.73 6.96 9,715 236 1.45 3.72 4,633
194 3.77 6.82 10,752 237 0.75 3.75 3,261 194 6.54 6.82 10,752 237 1.41 3.75 3,261
195 3.64 6.69 11,858 238 0.74 3.78 2,282 195 6.32 6.69 11,858 238 1.40 3.78 2,282
196 3.50 6.60 13,262 239 0.73 3.83 1,567 196 6.09 6.60 13,262 239 1.38 3.83 1,567
197 3.36 6.49 14,740 240 0.67 3.82 1,062 197 5.85 6.49 14,740 240 1.26 3.82 1,062
198 3.24 6.39 16,492 198 5.64 6.39 16,492
199 3.12 6.32 18,515 199 5.45 6.32 18,515
200 3.01 6.21 20,639 200 5.27 6.21 20,639
201 2.90 6.05 23,094 201 5.09 6.05 23,094
202 2.78 6.07 25,781 202 4.90 6.07 25,781
203 2.70 5.91 28,710 203 4.76 5.91 28,710
204 2.65 5.82 31,557 204 4.66 5.82 31,557
205 2.56 5.74 34,510 205 4.52 5.74 34,510
206 2.49 5.73 37,226 206 4.39 5.73 37,226
207 2.42 5.58 39,864 207 4.28 5.58 39,864
208 2.35 5.49 42,214 208 4.16 5.49 42,214209 2.26 5.42 44,619 209 4.02 5.42 44,619
210 2.19 5.34 46,650 210 3.90 5.34 46,650
211 2.13 5.27 48,884 211 3.79 5.27 48,884
* Starting RIT score is always based on grade 6 performance.Shaded cells indicate that starting RIT was outside the percentile range of 1-99.Italicized estimates are based on fewer than 1,000 cases and should be used with caution.
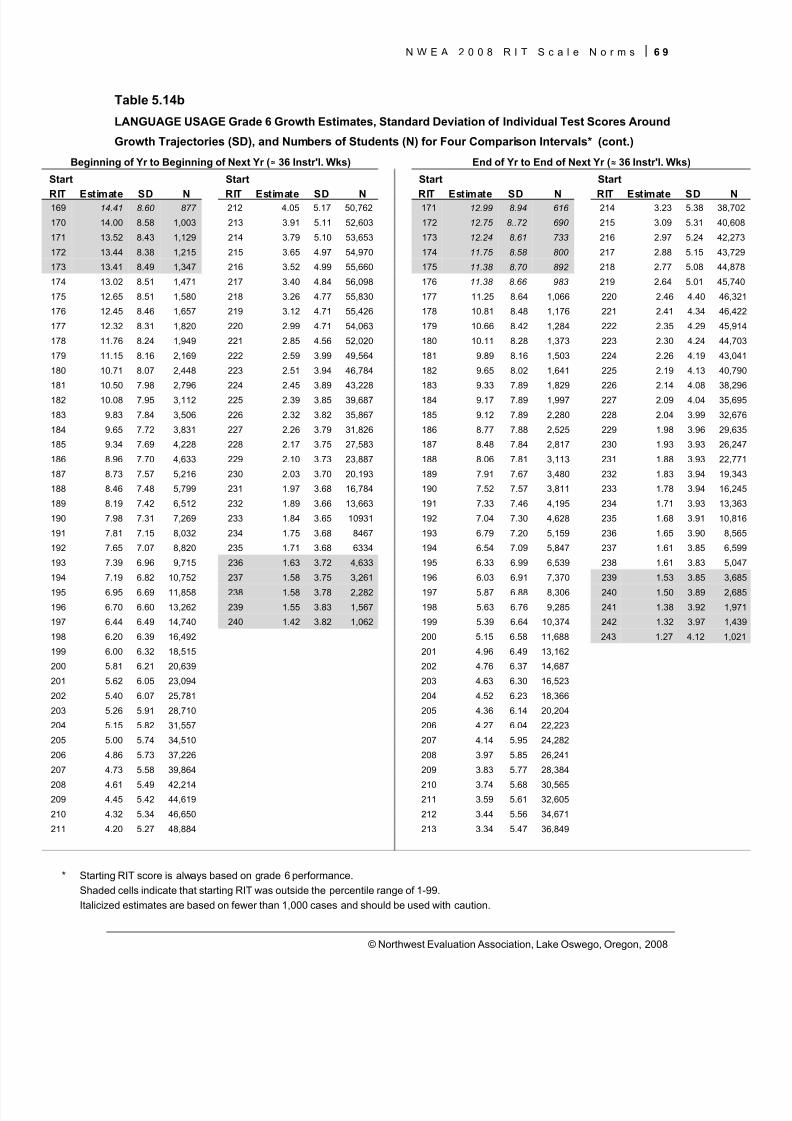
8/7/2019 NWEA Complete Norms2008
http://slidepdf.com/reader/full/nwea-complete-norms2008 79/170
N W E A 2 0 0 8 R I T S c a l e N o r m s 6 9
© Northwest Evaluation Association, Lake Oswego, Oregon, 2008
Table 5.14b
LANGUAGE USAGE Grade 6 Growth Estimates, Standard Deviation of Individual Test Scores Around
Growth Trajectories (SD), and Numbers of Students (N) for Four Comparison Intervals* (cont.)
Beginning of Yr to Beginning of Next Yr ( ≈ 36 Instr'l. Wks) End of Yr to End of Next Yr ( ≈ 36 Instr'l. Wks)
Start Start Start Start
RIT Estimate SD N RIT Estimate SD N RIT Estimate SD N RIT Estimate SD N169 14.41 8.60 877 212 4.05 5.17 50,762 171 12.99 8.94 616 214 3.23 5.38 38,702
170 14.00 8.58 1,003 213 3.91 5.11 52,603 172 12.75 8..72 690 215 3.09 5.31 40,608
171 13.52 8.43 1,129 214 3.79 5.10 53,653 173 12.24 8.61 733 216 2.97 5.24 42,273
172 13.44 8.38 1,215 215 3.65 4.97 54,970 174 11.75 8.58 800 217 2.88 5.15 43,729
173 13.41 8.49 1,347 216 3.52 4.99 55,660 175 11.38 8.70 892 218 2.77 5.08 44,878
174 13.02 8.51 1,471 217 3.40 4.84 56,098 176 11.38 8.66 983 219 2.64 5.01 45,740
175 12.65 8.51 1,580 218 3.26 4.77 55,830 177 11.25 8.64 1,066 220 2.46 4.40 46,321
176 12.45 8.46 1,657 219 3.12 4.71 55,426 178 10.81 8.48 1,176 221 2.41 4.34 46,422
177 12.32 8.31 1,820 220 2.99 4.71 54,063 179 10.66 8.42 1,284 222 2.35 4.29 45,914
178 11.76 8.24 1,949 221 2.85 4.56 52,020 180 10.11 8.28 1,373 223 2.30 4.24 44,703
179 11.15 8.16 2,169 222 2.59 3.99 49,564 181 9.89 8.16 1,503 224 2.26 4.19 43,041
180 10.71 8.07 2,448 223 2.51 3.94 46,784 182 9.65 8.02 1,641 225 2.19 4.13 40,790
181 10.50 7.98 2,796 224 2.45 3.89 43,228 183 9.33 7.89 1,829 226 2.14 4.08 38,296
182 10.08 7.95 3,112 225 2.39 3.85 39,687 184 9.17 7.89 1,997 227 2.09 4.04 35,695
183 9.83 7.84 3,506 226 2.32 3.82 35,867 185 9.12 7.89 2,280 228 2.04 3.99 32,676
184 9.65 7.72 3,831 227 2.26 3.79 31,826 186 8.77 7.88 2,525 229 1.98 3.96 29,635
185 9.34 7.69 4,228 228 2.17 3.75 27,583 187 8.48 7.84 2,817 230 1.93 3.93 26,247
186 8.96 7.70 4,633 229 2.10 3.73 23,887 188 8.06 7.81 3,113 231 1.88 3.93 22,771
187 8.73 7.57 5,216 230 2.03 3.70 20,193 189 7.91 7.67 3,480 232 1.83 3.94 19,343
188 8.46 7.48 5,799 231 1.97 3.68 16,784 190 7.52 7.57 3,811 233 1.78 3.94 16,245
189 8.19 7.42 6,512 232 1.89 3.66 13,663 191 7.33 7.46 4,195 234 1.71 3.93 13,363
190 7.98 7.31 7,269 233 1.84 3.65 10931 192 7.04 7.30 4,628 235 1.68 3.91 10,816
191 7.81 7.15 8,032 234 1.75 3.68 8467 193 6.79 7.20 5,159 236 1.65 3.90 8,565
192 7.65 7.07 8,820 235 1.71 3.68 6334 194 6.54 7.09 5,847 237 1.61 3.85 6,599
193 7.39 6.96 9,715 236 1.63 3.72 4,633 195 6.33 6.99 6,539 238 1.61 3.83 5,047
194 7.19 6.82 10,752 237 1.58 3.75 3,261 196 6.03 6.91 7,370 239 1.53 3.85 3,685
195 6.95 6.69 11,858 238 1.58 3.78 2,282 197 5.87 6.88 8,306 240 1.50 3.89 2,685
196 6.70 6.60 13,262 239 1.55 3.83 1,567 198 5.63 6.76 9,285 241 1.38 3.92 1,971
197 6.44 6.49 14,740 240 1.42 3.82 1,062 199 5.39 6.64 10,374 242 1.32 3.97 1,439
198 6.20 6.39 16,492 200 5.15 6.58 11,688 243 1.27 4.12 1,021
199 6.00 6.32 18,515 201 4.96 6.49 13,162
200 5.81 6.21 20,639 202 4.76 6.37 14,687
201 5.62 6.05 23,094 203 4.63 6.30 16,523
202 5.40 6.07 25,781 204 4.52 6.23 18,366
203 5.26 5.91 28,710 205 4.36 6.14 20,204
204 5.15 5.82 31,557 206 4.27 6.04 22,223
205 5.00 5.74 34,510 207 4.14 5.95 24,282
206 4.86 5.73 37,226 208 3.97 5.85 26,241
207 4.73 5.58 39,864 209 3.83 5.77 28,384
208 4.61 5.49 42,214 210 3.74 5.68 30,565209 4.45 5.42 44,619 211 3.59 5.61 32,605
210 4.32 5.34 46,650 212 3.44 5.56 34,671
211 4.20 5.27 48,884 213 3.34 5.47 36,849
* Starting RIT score is always based on grade 6 performance.Shaded cells indicate that starting RIT was outside the percentile range of 1-99.Italicized estimates are based on fewer than 1,000 cases and should be used with caution.
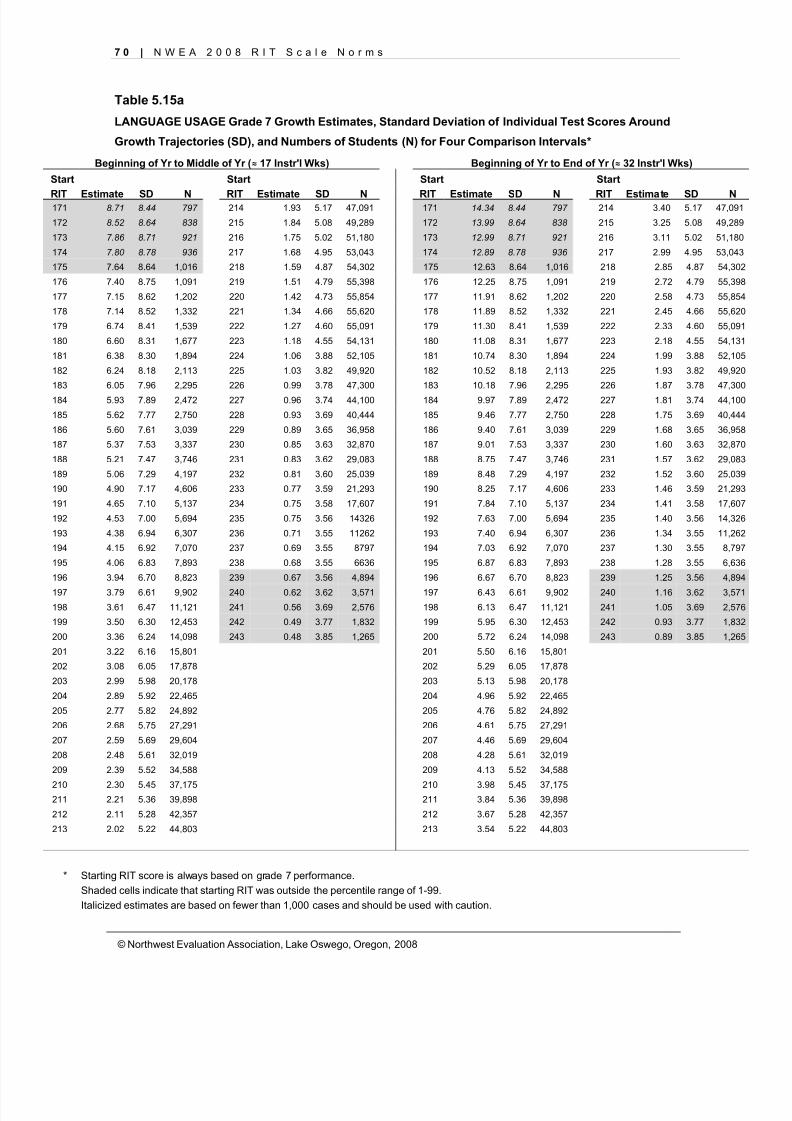
8/7/2019 NWEA Complete Norms2008
http://slidepdf.com/reader/full/nwea-complete-norms2008 80/170
7 0 | N W E A 2 0 0 8 R I T S c a l e N o r m s
© Northwest Evaluation Association, Lake Oswego, Oregon, 2008
Table 5.15a
LANGUAGE USAGE Grade 7 Growth Estimates, Standard Deviation of Individual Test Scores Around
Growth Trajectories (SD), and Numbers of Students (N) for Four Comparison Intervals*
Beginning of Yr to Middle of Yr ( ≈ 17 Instr'l Wks) Beginning of Yr to End of Yr ( ≈ 32 Instr'l Wks)
Start Start Start Start
RIT Estimate SD N RIT Estimate SD N RIT Estimate SD N RIT Estimate SD N171 8.71 8.44 797 214 1.93 5.17 47,091 171 14.34 8.44 797 214 3.40 5.17 47,091
172 8.52 8.64 838 215 1.84 5.08 49,289 172 13.99 8.64 838 215 3.25 5.08 49,289
173 7.86 8.71 921 216 1.75 5.02 51,180 173 12.99 8.71 921 216 3.11 5.02 51,180
174 7.80 8.78 936 217 1.68 4.95 53,043 174 12.89 8.78 936 217 2.99 4.95 53,043
175 7.64 8.64 1,016 218 1.59 4.87 54,302 175 12.63 8.64 1,016 218 2.85 4.87 54,302
176 7.40 8.75 1,091 219 1.51 4.79 55,398 176 12.25 8.75 1,091 219 2.72 4.79 55,398
177 7.15 8.62 1,202 220 1.42 4.73 55,854 177 11.91 8.62 1,202 220 2.58 4.73 55,854
178 7.14 8.52 1,332 221 1.34 4.66 55,620 178 11.89 8.52 1,332 221 2.45 4.66 55,620
179 6.74 8.41 1,539 222 1.27 4.60 55,091 179 11.30 8.41 1,539 222 2.33 4.60 55,091
180 6.60 8.31 1,677 223 1.18 4.55 54,131 180 11.08 8.31 1,677 223 2.18 4.55 54,131
181 6.38 8.30 1,894 224 1.06 3.88 52,105 181 10.74 8.30 1,894 224 1.99 3.88 52,105
182 6.24 8.18 2,113 225 1.03 3.82 49,920 182 10.52 8.18 2,113 225 1.93 3.82 49,920
183 6.05 7.96 2,295 226 0.99 3.78 47,300 183 10.18 7.96 2,295 226 1.87 3.78 47,300
184 5.93 7.89 2,472 227 0.96 3.74 44,100 184 9.97 7.89 2,472 227 1.81 3.74 44,100
185 5.62 7.77 2,750 228 0.93 3.69 40,444 185 9.46 7.77 2,750 228 1.75 3.69 40,444
186 5.60 7.61 3,039 229 0.89 3.65 36,958 186 9.40 7.61 3,039 229 1.68 3.65 36,958
187 5.37 7.53 3,337 230 0.85 3.63 32,870 187 9.01 7.53 3,337 230 1.60 3.63 32,870
188 5.21 7.47 3,746 231 0.83 3.62 29,083 188 8.75 7.47 3,746 231 1.57 3.62 29,083
189 5.06 7.29 4,197 232 0.81 3.60 25,039 189 8.48 7.29 4,197 232 1.52 3.60 25,039
190 4.90 7.17 4,606 233 0.77 3.59 21,293 190 8.25 7.17 4,606 233 1.46 3.59 21,293
191 4.65 7.10 5,137 234 0.75 3.58 17,607 191 7.84 7.10 5,137 234 1.41 3.58 17,607
192 4.53 7.00 5,694 235 0.75 3.56 14326 192 7.63 7.00 5,694 235 1.40 3.56 14,326
193 4.38 6.94 6,307 236 0.71 3.55 11262 193 7.40 6.94 6,307 236 1.34 3.55 11,262
194 4.15 6.92 7,070 237 0.69 3.55 8797 194 7.03 6.92 7,070 237 1.30 3.55 8,797
195 4.06 6.83 7,893 238 0.68 3.55 6636 195 6.87 6.83 7,893 238 1.28 3.55 6,636
196 3.94 6.70 8,823 239 0.67 3.56 4,894 196 6.67 6.70 8,823 239 1.25 3.56 4,894
197 3.79 6.61 9,902 240 0.62 3.62 3,571 197 6.43 6.61 9,902 240 1.16 3.62 3,571
198 3.61 6.47 11,121 241 0.56 3.69 2,576 198 6.13 6.47 11,121 241 1.05 3.69 2,576
199 3.50 6.30 12,453 242 0.49 3.77 1,832 199 5.95 6.30 12,453 242 0.93 3.77 1,832
200 3.36 6.24 14,098 243 0.48 3.85 1,265 200 5.72 6.24 14,098 243 0.89 3.85 1,265
201 3.22 6.16 15,801 201 5.50 6.16 15,801
202 3.08 6.05 17,878 202 5.29 6.05 17,878
203 2.99 5.98 20,178 203 5.13 5.98 20,178
204 2.89 5.92 22,465 204 4.96 5.92 22,465
205 2.77 5.82 24,892 205 4.76 5.82 24,892
206 2.68 5.75 27,291 206 4.61 5.75 27,291
207 2.59 5.69 29,604 207 4.46 5.69 29,604
208 2.48 5.61 32,019 208 4.28 5.61 32,019
209 2.39 5.52 34,588 209 4.13 5.52 34,588
210 2.30 5.45 37,175 210 3.98 5.45 37,175211 2.21 5.36 39,898 211 3.84 5.36 39,898
212 2.11 5.28 42,357 212 3.67 5.28 42,357
213 2.02 5.22 44,803 213 3.54 5.22 44,803
* Starting RIT score is always based on grade 7 performance.Shaded cells indicate that starting RIT was outside the percentile range of 1-99.Italicized estimates are based on fewer than 1,000 cases and should be used with caution.
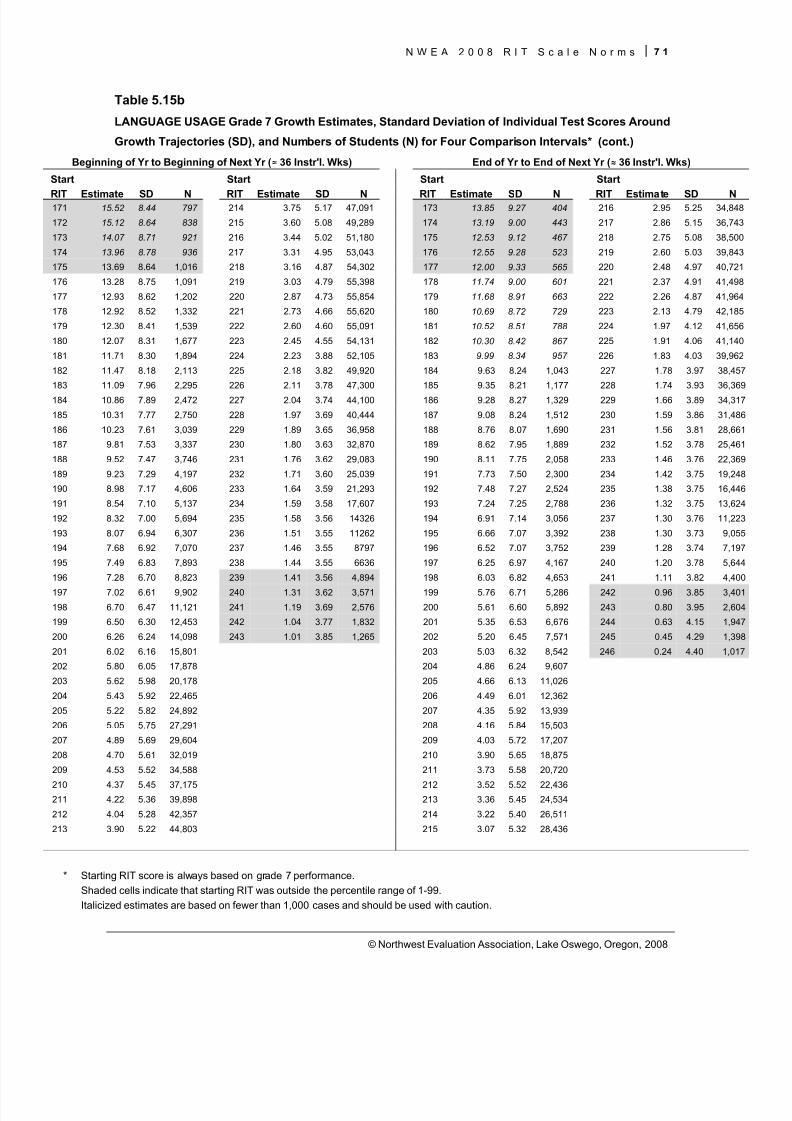
8/7/2019 NWEA Complete Norms2008
http://slidepdf.com/reader/full/nwea-complete-norms2008 81/170

8/7/2019 NWEA Complete Norms2008
http://slidepdf.com/reader/full/nwea-complete-norms2008 82/170
7 2 | N W E A 2 0 0 8 R I T S c a l e N o r m s
© Northwest Evaluation Association, Lake Oswego, Oregon, 2008
Table 5.16a
LANGUAGE USAGE Grade 8 Growth Estimates, Standard Deviation of Individual Test Scores Around
Growth Trajectories (SD), and Numbers of Students (N) for Four Comparison Intervals*
Beginning of Yr to Middle of Yr ( ≈ 17 Instr'l Wks) Beginning of Yr to End of Yr ( ≈ 32 Instr'l Wks)
Start Start Start Start
RIT Estimate SD N RIT Estimate SD N RIT Estimate SD N RIT Estimate SD N174 9.06 9.11 413 217 1.53 5.01 29,925 174 14.47 9.11 413 217 2.60 5.01 29,925
175 8.21 9.02 445 218 1.46 4.96 31,335 175 13.21 9.02 445 218 2.49 4.96 31,335
176 7.96 8.83 456 219 1.38 4.90 32,549 176 12.86 8.83 456 219 2.37 4.90 32,549
177 7.30 8.96 503 220 1.28 4.84 33,458 177 11.87 8.96 503 220 2.22 4.84 33,458
178 7.12 8.76 549 221 1.17 4.77 34,242 178 11.62 8.76 549 221 2.06 4.77 34,242
179 7.02 8.40 594 222 1.10 4.68 34,671 179 11.38 8.40 594 222 1.96 4.68 34,671
180 6.95 8.36 616 223 1.02 4.61 34,983 180 11.29 8.36 616 223 1.82 4.61 34,983
181 6.77 8.21 698 224 0.93 4.54 34,762 181 10.96 8.21 698 224 1.68 4.54 34,762
182 6.80 8.28 777 225 0.87 4.48 34,161 182 10.93 8.28 777 225 1.59 4.48 34,161
183 6.39 8.42 835 226 0.77 3.79 33,152 183 10.27 8.42 835 226 1.44 3.79 33,152
184 6.18 8.35 948 227 0.74 3.74 32,102 184 9.88 8.35 948 227 1.40 3.74 32,102
185 5.82 8.16 1,081 228 0.72 3.69 30,485 185 9.31 8.16 1,081 228 1.36 3.69 30,485
186 5.65 8.13 1,200 229 0.70 3.66 28,726 186 9.00 8.13 1,200 229 1.32 3.66 28,726
187 5.18 7.96 1,358 230 0.67 3.62 26,525 187 8.30 7.96 1,358 230 1.25 3.62 26,525
188 5.10 7.82 1,529 231 0.65 3.60 24,194 188 8.19 7.82 1,529 231 1.22 3.60 24,194
189 4.91 7.77 1,681 232 0.62 3.57 21,645 189 7.93 7.77 1,681 232 1.16 3.57 21,645
190 4.84 7.63 1,846 233 0.60 3.55 19,032 190 7.83 7.63 1,846 233 1.12 3.55 19,032
191 4.61 7.49 2,071 234 0.57 3.55 16,337 191 7.53 7.49 2,071 234 1.08 3.55 16,337
192 4.51 7.50 2,258 235 0.57 3.55 13,931 192 7.36 7.50 2,258 235 1.08 3.55 13,931
193 4.35 7.34 2,496 236 0.56 3.56 11,504 193 7.10 7.34 2,496 236 1.05 3.56 11,504
194 4.14 7.28 2,725 237 0.56 3.57 9,344 194 6.76 7.28 2,725 237 1.05 3.57 9,344
195 3.97 7.19 3,113 238 0.54 3.62 7510 195 6.46 7.19 3,113 238 1.03 3.62 7,510
196 3.77 7.08 3,495 239 0.53 3.62 5975 196 6.15 7.08 3,495 239 1.00 3.62 5,975
197 3.62 6.98 3,890 240 0.50 3.64 4649 197 5.89 6.98 3,890 240 0.95 3.64 4,649
198 3.43 6.90 4,434 241 0.46 3.63 3632 198 5.58 6.90 4,434 241 0.86 3.63 3,632
199 3.32 6.69 5,120 242 0.39 3.73 2731 199 5.40 6.69 5,120 242 0.74 3.73 2,731
200 3.17 6.57 5,743 243 0.31 3.81 2,058 200 5.16 6.57 5,743 243 0.59 3.81 2,058
201 3.05 6.45 6,640 244 0.23 3.87 1,522 201 4.97 6.45 6,640 244 0.44 3.87 1,522
202 2.92 6.33 7,645 245 0.22 3.92 1,129 202 4.78 6.33 7,645 245 0.42 3.92 1,129
203 2.82 6.23 8,669 246 0.15 4.10 817 203 4.62 6.23 8,669 246 0.28 4.10 817
204 2.73 6.14 9,770 247 0.06 3.94 601 204 4.47 6.14 9,770 247 0.11 3.94 601
205 2.60 6.01 11,112 205 4.27 6.01 11,112
206 2.52 5.94 12,249 206 4.14 5.94 12,249
207 2.46 5.85 13,559 207 4.04 5.85 13,559
208 2.35 5.77 14,876 208 3.86 5.77 14,876
209 2.21 5.71 16,499 209 3.65 5.71 16,499
210 2.12 5.65 18,077 210 3.51 5.65 18,077
211 2.02 5.53 19,819 211 3.36 5.53 19,819
212 1.92 5.48 21,482 212 3.19 5.48 21,482
213 1.84 5.37 23,227 213 3.08 5.37 23,227214 1.79 5.26 24,869 214 3.00 5.26 24,869
215 1.71 5.16 26,648 215 2.88 5.16 26,648
216 1.63 5.10 28,349 216 2.75 5.10 28,349
* Starting RIT score is always based on grade 8 performance.Shaded cells indicate that starting RIT was outside the percentile range of 1-99.Italicized estimates are based on fewer than 1,000 cases and should be used with caution.
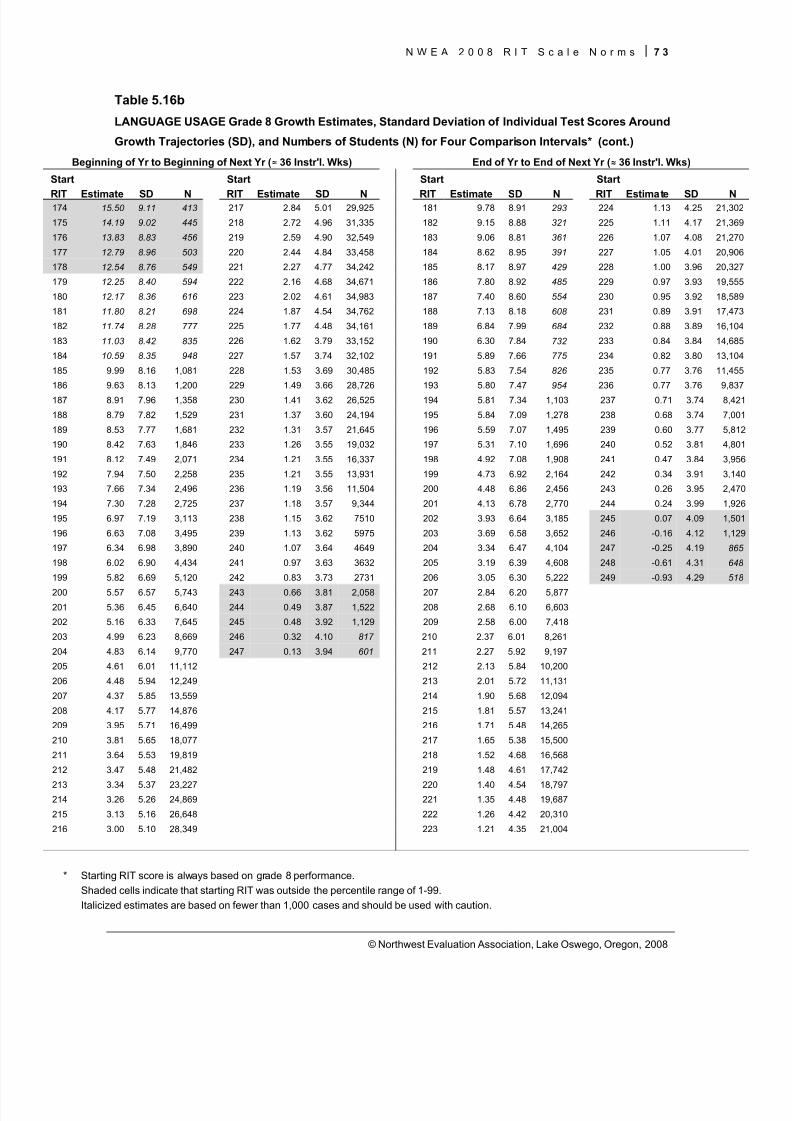
8/7/2019 NWEA Complete Norms2008
http://slidepdf.com/reader/full/nwea-complete-norms2008 83/170
N W E A 2 0 0 8 R I T S c a l e N o r m s 7 3
© Northwest Evaluation Association, Lake Oswego, Oregon, 2008
Table 5.16b
LANGUAGE USAGE Grade 8 Growth Estimates, Standard Deviation of Individual Test Scores Around
Growth Trajectories (SD), and Numbers of Students (N) for Four Comparison Intervals* (cont.)
Beginning of Yr to Beginning of Next Yr ( ≈ 36 Instr'l. Wks) End of Yr to End of Next Yr ( ≈ 36 Instr'l. Wks)
Start Start Start Start
RIT Estimate SD N RIT Estimate SD N RIT Estimate SD N RIT Estimate SD N174 15.50 9.11 413 217 2.84 5.01 29,925 181 9.78 8.91 293 224 1.13 4.25 21,302
175 14.19 9.02 445 218 2.72 4.96 31,335 182 9.15 8.88 321 225 1.11 4.17 21,369
176 13.83 8.83 456 219 2.59 4.90 32,549 183 9.06 8.81 361 226 1.07 4.08 21,270
177 12.79 8.96 503 220 2.44 4.84 33,458 184 8.62 8.95 391 227 1.05 4.01 20,906
178 12.54 8.76 549 221 2.27 4.77 34,242 185 8.17 8.97 429 228 1.00 3.96 20,327
179 12.25 8.40 594 222 2.16 4.68 34,671 186 7.80 8.92 485 229 0.97 3.93 19,555
180 12.17 8.36 616 223 2.02 4.61 34,983 187 7.40 8.60 554 230 0.95 3.92 18,589
181 11.80 8.21 698 224 1.87 4.54 34,762 188 7.13 8.18 608 231 0.89 3.91 17,473
182 11.74 8.28 777 225 1.77 4.48 34,161 189 6.84 7.99 684 232 0.88 3.89 16,104
183 11.03 8.42 835 226 1.62 3.79 33,152 190 6.30 7.84 732 233 0.84 3.84 14,685
184 10.59 8.35 948 227 1.57 3.74 32,102 191 5.89 7.66 775 234 0.82 3.80 13,104
185 9.99 8.16 1,081 228 1.53 3.69 30,485 192 5.83 7.54 826 235 0.77 3.76 11,455
186 9.63 8.13 1,200 229 1.49 3.66 28,726 193 5.80 7.47 954 236 0.77 3.76 9,837
187 8.91 7.96 1,358 230 1.41 3.62 26,525 194 5.81 7.34 1,103 237 0.71 3.74 8,421
188 8.79 7.82 1,529 231 1.37 3.60 24,194 195 5.84 7.09 1,278 238 0.68 3.74 7,001
189 8.53 7.77 1,681 232 1.31 3.57 21,645 196 5.59 7.07 1,495 239 0.60 3.77 5,812
190 8.42 7.63 1,846 233 1.26 3.55 19,032 197 5.31 7.10 1,696 240 0.52 3.81 4,801
191 8.12 7.49 2,071 234 1.21 3.55 16,337 198 4.92 7.08 1,908 241 0.47 3.84 3,956
192 7.94 7.50 2,258 235 1.21 3.55 13,931 199 4.73 6.92 2,164 242 0.34 3.91 3,140
193 7.66 7.34 2,496 236 1.19 3.56 11,504 200 4.48 6.86 2,456 243 0.26 3.95 2,470
194 7.30 7.28 2,725 237 1.18 3.57 9,344 201 4.13 6.78 2,770 244 0.24 3.99 1,926
195 6.97 7.19 3,113 238 1.15 3.62 7510 202 3.93 6.64 3,185 245 0.07 4.09 1,501
196 6.63 7.08 3,495 239 1.13 3.62 5975 203 3.69 6.58 3,652 246 -0.16 4.12 1,129
197 6.34 6.98 3,890 240 1.07 3.64 4649 204 3.34 6.47 4,104 247 -0.25 4.19 865
198 6.02 6.90 4,434 241 0.97 3.63 3632 205 3.19 6.39 4,608 248 -0.61 4.31 648
199 5.82 6.69 5,120 242 0.83 3.73 2731 206 3.05 6.30 5,222 249 -0.93 4.29 518
200 5.57 6.57 5,743 243 0.66 3.81 2,058 207 2.84 6.20 5,877
201 5.36 6.45 6,640 244 0.49 3.87 1,522 208 2.68 6.10 6,603
202 5.16 6.33 7,645 245 0.48 3.92 1,129 209 2.58 6.00 7,418
203 4.99 6.23 8,669 246 0.32 4.10 817 210 2.37 6.01 8,261
204 4.83 6.14 9,770 247 0.13 3.94 601 211 2.27 5.92 9,197
205 4.61 6.01 11,112 212 2.13 5.84 10,200
206 4.48 5.94 12,249 213 2.01 5.72 11,131
207 4.37 5.85 13,559 214 1.90 5.68 12,094
208 4.17 5.77 14,876 215 1.81 5.57 13,241
209 3.95 5.71 16,499 216 1.71 5.48 14,265
210 3.81 5.65 18,077 217 1.65 5.38 15,500
211 3.64 5.53 19,819 218 1.52 4.68 16,568
212 3.47 5.48 21,482 219 1.48 4.61 17,742
213 3.34 5.37 23,227 220 1.40 4.54 18,797214 3.26 5.26 24,869 221 1.35 4.48 19,687
215 3.13 5.16 26,648 222 1.26 4.42 20,310
216 3.00 5.10 28,349 223 1.21 4.35 21,004
* Starting RIT score is always based on grade 8 performance.Shaded cells indicate that starting RIT was outside the percentile range of 1-99.Italicized estimates are based on fewer than 1,000 cases and should be used with caution.
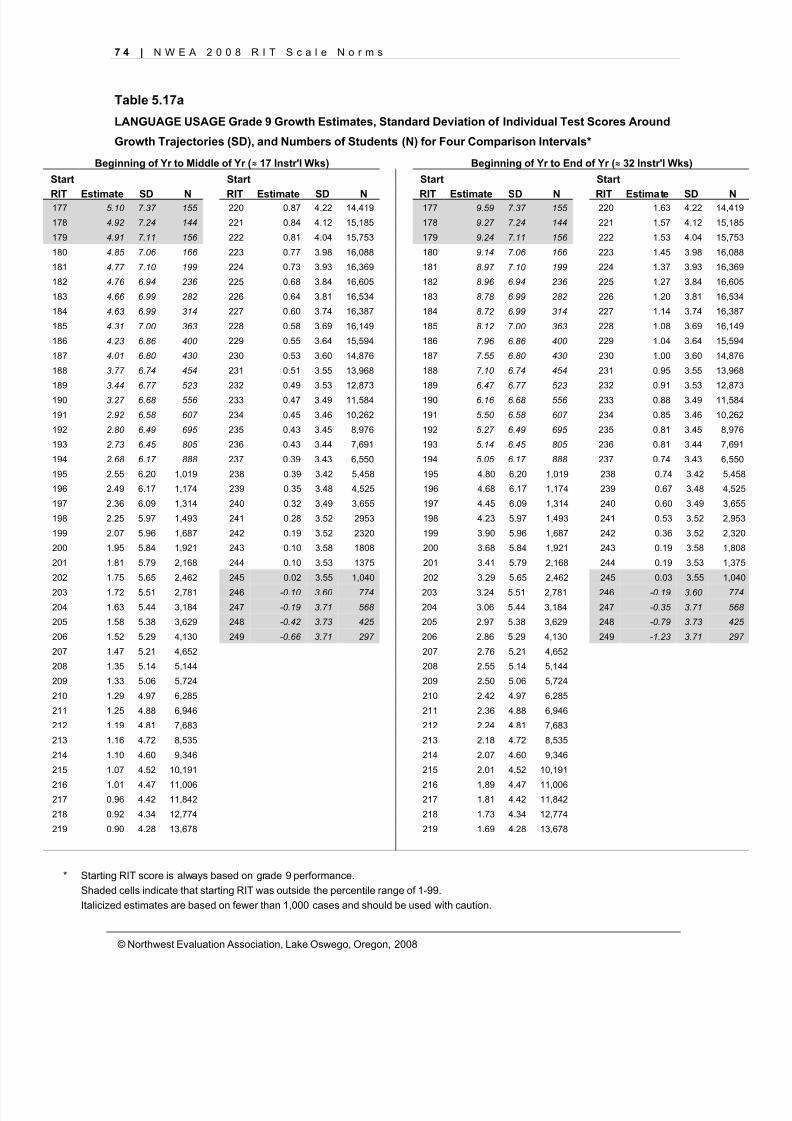
8/7/2019 NWEA Complete Norms2008
http://slidepdf.com/reader/full/nwea-complete-norms2008 84/170
7 4 | N W E A 2 0 0 8 R I T S c a l e N o r m s
© Northwest Evaluation Association, Lake Oswego, Oregon, 2008
Table 5.17a
LANGUAGE USAGE Grade 9 Growth Estimates, Standard Deviation of Individual Test Scores Around
Growth Trajectories (SD), and Numbers of Students (N) for Four Comparison Intervals*
Beginning of Yr to Middle of Yr ( ≈ 17 Instr'l Wks) Beginning of Yr to End of Yr ( ≈ 32 Instr'l Wks)
Start Start Start Start
RIT Estimate SD N RIT Estimate SD N RIT Estimate SD N RIT Estimate SD N177 5.10 7.37 155 220 0.87 4.22 14,419 177 9.59 7.37 155 220 1.63 4.22 14,419
178 4.92 7.24 144 221 0.84 4.12 15,185 178 9.27 7.24 144 221 1.57 4.12 15,185
179 4.91 7.11 156 222 0.81 4.04 15,753 179 9.24 7.11 156 222 1.53 4.04 15,753
180 4.85 7.06 166 223 0.77 3.98 16,088 180 9.14 7.06 166 223 1.45 3.98 16,088
181 4.77 7.10 199 224 0.73 3.93 16,369 181 8.97 7.10 199 224 1.37 3.93 16,369
182 4.76 6.94 236 225 0.68 3.84 16,605 182 8.96 6.94 236 225 1.27 3.84 16,605
183 4.66 6.99 282 226 0.64 3.81 16,534 183 8.78 6.99 282 226 1.20 3.81 16,534
184 4.63 6.99 314 227 0.60 3.74 16,387 184 8.72 6.99 314 227 1.14 3.74 16,387
185 4.31 7.00 363 228 0.58 3.69 16,149 185 8.12 7.00 363 228 1.08 3.69 16,149
186 4.23 6.86 400 229 0.55 3.64 15,594 186 7.96 6.86 400 229 1.04 3.64 15,594
187 4.01 6.80 430 230 0.53 3.60 14,876 187 7.55 6.80 430 230 1.00 3.60 14,876
188 3.77 6.74 454 231 0.51 3.55 13,968 188 7.10 6.74 454 231 0.95 3.55 13,968
189 3.44 6.77 523 232 0.49 3.53 12,873 189 6.47 6.77 523 232 0.91 3.53 12,873
190 3.27 6.68 556 233 0.47 3.49 11,584 190 6.16 6.68 556 233 0.88 3.49 11,584
191 2.92 6.58 607 234 0.45 3.46 10,262 191 5.50 6.58 607 234 0.85 3.46 10,262
192 2.80 6.49 695 235 0.43 3.45 8,976 192 5.27 6.49 695 235 0.81 3.45 8,976
193 2.73 6.45 805 236 0.43 3.44 7,691 193 5.14 6.45 805 236 0.81 3.44 7,691
194 2.68 6.17 888 237 0.39 3.43 6,550 194 5.05 6.17 888 237 0.74 3.43 6,550
195 2.55 6.20 1,019 238 0.39 3.42 5,458 195 4.80 6.20 1,019 238 0.74 3.42 5,458
196 2.49 6.17 1,174 239 0.35 3.48 4,525 196 4.68 6.17 1,174 239 0.67 3.48 4,525
197 2.36 6.09 1,314 240 0.32 3.49 3,655 197 4.45 6.09 1,314 240 0.60 3.49 3,655
198 2.25 5.97 1,493 241 0.28 3.52 2953 198 4.23 5.97 1,493 241 0.53 3.52 2,953
199 2.07 5.96 1,687 242 0.19 3.52 2320 199 3.90 5.96 1,687 242 0.36 3.52 2,320
200 1.95 5.84 1,921 243 0.10 3.58 1808 200 3.68 5.84 1,921 243 0.19 3.58 1,808
201 1.81 5.79 2,168 244 0.10 3.53 1375 201 3.41 5.79 2,168 244 0.19 3.53 1,375
202 1.75 5.65 2,462 245 0.02 3.55 1,040 202 3.29 5.65 2,462 245 0.03 3.55 1,040
203 1.72 5.51 2,781 246 -0.10 3.60 774 203 3.24 5.51 2,781 246 -0.19 3.60 774
204 1.63 5.44 3,184 247 -0.19 3.71 568 204 3.06 5.44 3,184 247 -0.35 3.71 568
205 1.58 5.38 3,629 248 -0.42 3.73 425 205 2.97 5.38 3,629 248 -0.79 3.73 425
206 1.52 5.29 4,130 249 -0.66 3.71 297 206 2.86 5.29 4,130 249 -1.23 3.71 297
207 1.47 5.21 4,652 207 2.76 5.21 4,652
208 1.35 5.14 5,144 208 2.55 5.14 5,144
209 1.33 5.06 5,724 209 2.50 5.06 5,724
210 1.29 4.97 6,285 210 2.42 4.97 6,285
211 1.25 4.88 6,946 211 2.36 4.88 6,946
212 1.19 4.81 7,683 212 2.24 4.81 7,683
213 1.16 4.72 8,535 213 2.18 4.72 8,535
214 1.10 4.60 9,346 214 2.07 4.60 9,346
215 1.07 4.52 10,191 215 2.01 4.52 10,191
216 1.01 4.47 11,006 216 1.89 4.47 11,006217 0.96 4.42 11,842 217 1.81 4.42 11,842
218 0.92 4.34 12,774 218 1.73 4.34 12,774
219 0.90 4.28 13,678 219 1.69 4.28 13,678
* Starting RIT score is always based on grade 9 performance.Shaded cells indicate that starting RIT was outside the percentile range of 1-99.Italicized estimates are based on fewer than 1,000 cases and should be used with caution.
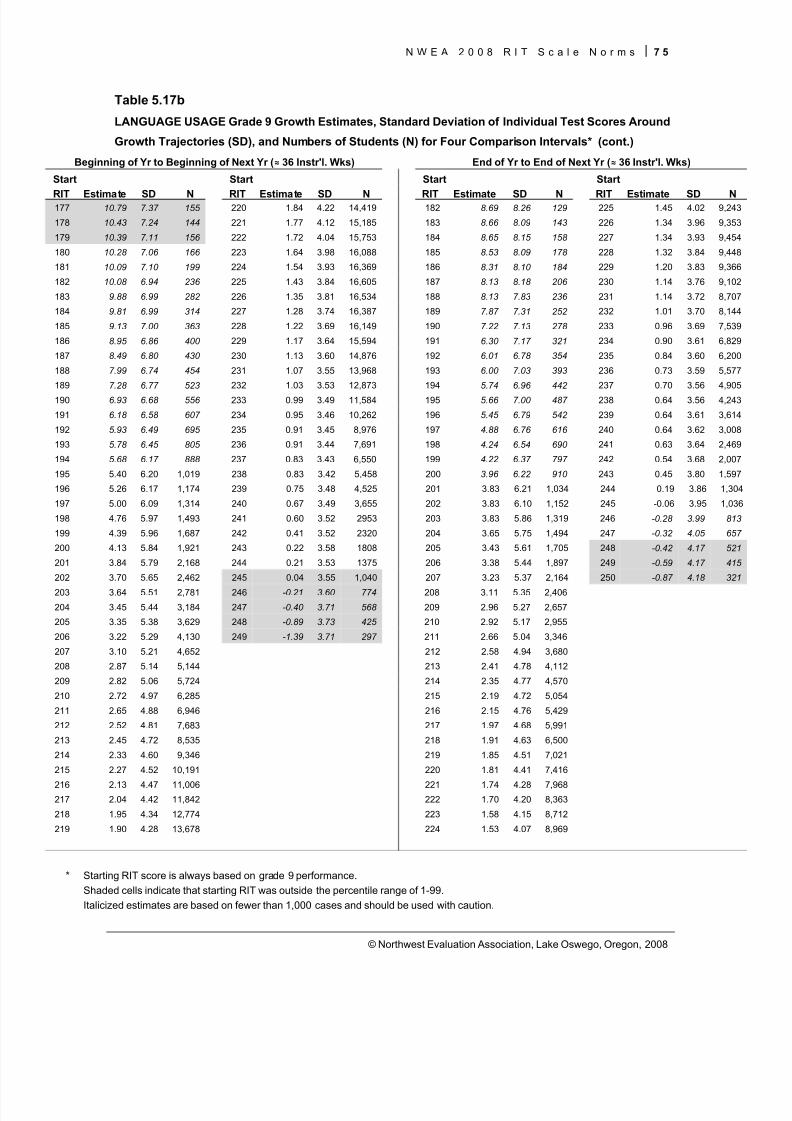
8/7/2019 NWEA Complete Norms2008
http://slidepdf.com/reader/full/nwea-complete-norms2008 85/170
N W E A 2 0 0 8 R I T S c a l e N o r m s 7 5
© Northwest Evaluation Association, Lake Oswego, Oregon, 2008
Table 5.17b
LANGUAGE USAGE Grade 9 Growth Estimates, Standard Deviation of Individual Test Scores Around
Growth Trajectories (SD), and Numbers of Students (N) for Four Comparison Intervals* (cont.)
Beginning of Yr to Beginning of Next Yr ( ≈ 36 Instr'l. Wks) End of Yr to End of Next Yr ( ≈ 36 Instr'l. Wks)
Start Start Start Start
RIT Estimate SD N RIT Estimate SD N RIT Estimate SD N RIT Estimate SD N177 10.79 7.37 155 220 1.84 4.22 14,419 182 8.69 8.26 129 225 1.45 4.02 9,243
178 10.43 7.24 144 221 1.77 4.12 15,185 183 8.66 8.09 143 226 1.34 3.96 9,353
179 10.39 7.11 156 222 1.72 4.04 15,753 184 8.65 8.15 158 227 1.34 3.93 9,454
180 10.28 7.06 166 223 1.64 3.98 16,088 185 8.53 8.09 178 228 1.32 3.84 9,448
181 10.09 7.10 199 224 1.54 3.93 16,369 186 8.31 8.10 184 229 1.20 3.83 9,366
182 10.08 6.94 236 225 1.43 3.84 16,605 187 8.13 8.18 206 230 1.14 3.76 9,102
183 9.88 6.99 282 226 1.35 3.81 16,534 188 8.13 7.83 236 231 1.14 3.72 8,707
184 9.81 6.99 314 227 1.28 3.74 16,387 189 7.87 7.31 252 232 1.01 3.70 8,144
185 9.13 7.00 363 228 1.22 3.69 16,149 190 7.22 7.13 278 233 0.96 3.69 7,539
186 8.95 6.86 400 229 1.17 3.64 15,594 191 6.30 7.17 321 234 0.90 3.61 6,829
187 8.49 6.80 430 230 1.13 3.60 14,876 192 6.01 6.78 354 235 0.84 3.60 6,200
188 7.99 6.74 454 231 1.07 3.55 13,968 193 6.00 7.03 393 236 0.73 3.59 5,577
189 7.28 6.77 523 232 1.03 3.53 12,873 194 5.74 6.96 442 237 0.70 3.56 4,905
190 6.93 6.68 556 233 0.99 3.49 11,584 195 5.66 7.00 487 238 0.64 3.56 4,243
191 6.18 6.58 607 234 0.95 3.46 10,262 196 5.45 6.79 542 239 0.64 3.61 3,614
192 5.93 6.49 695 235 0.91 3.45 8,976 197 4.88 6.76 616 240 0.64 3.62 3,008
193 5.78 6.45 805 236 0.91 3.44 7,691 198 4.24 6.54 690 241 0.63 3.64 2,469
194 5.68 6.17 888 237 0.83 3.43 6,550 199 4.22 6.37 797 242 0.54 3.68 2,007
195 5.40 6.20 1,019 238 0.83 3.42 5,458 200 3.96 6.22 910 243 0.45 3.80 1,597
196 5.26 6.17 1,174 239 0.75 3.48 4,525 201 3.83 6.21 1,034 244 0.19 3.86 1,304
197 5.00 6.09 1,314 240 0.67 3.49 3,655 202 3.83 6.10 1,152 245 -0.06 3.95 1,036
198 4.76 5.97 1,493 241 0.60 3.52 2953 203 3.83 5.86 1,319 246 -0.28 3.99 813
199 4.39 5.96 1,687 242 0.41 3.52 2320 204 3.65 5.75 1,494 247 -0.32 4.05 657
200 4.13 5.84 1,921 243 0.22 3.58 1808 205 3.43 5.61 1,705 248 -0.42 4.17 521
201 3.84 5.79 2,168 244 0.21 3.53 1375 206 3.38 5.44 1,897 249 -0.59 4.17 415
202 3.70 5.65 2,462 245 0.04 3.55 1,040 207 3.23 5.37 2,164 250 -0.87 4.18 321
203 3.64 5.51 2,781 246 -0.21 3.60 774 208 3.11 5.35 2,406
204 3.45 5.44 3,184 247 -0.40 3.71 568 209 2.96 5.27 2,657
205 3.35 5.38 3,629 248 -0.89 3.73 425 210 2.92 5.17 2,955
206 3.22 5.29 4,130 249 -1.39 3.71 297 211 2.66 5.04 3,346
207 3.10 5.21 4,652 212 2.58 4.94 3,680
208 2.87 5.14 5,144 213 2.41 4.78 4,112
209 2.82 5.06 5,724 214 2.35 4.77 4,570
210 2.72 4.97 6,285 215 2.19 4.72 5,054
211 2.65 4.88 6,946 216 2.15 4.76 5,429
212 2.52 4.81 7,683 217 1.97 4.68 5,991
213 2.45 4.72 8,535 218 1.91 4.63 6,500
214 2.33 4.60 9,346 219 1.85 4.51 7,021
215 2.27 4.52 10,191 220 1.81 4.41 7,416
216 2.13 4.47 11,006 221 1.74 4.28 7,968217 2.04 4.42 11,842 222 1.70 4.20 8,363
218 1.95 4.34 12,774 223 1.58 4.15 8,712
219 1.90 4.28 13,678 224 1.53 4.07 8,969
* Starting RIT score is always based on grade 9 performance.Shaded cells indicate that starting RIT was outside the percentile range of 1-99.Italicized estimates are based on fewer than 1,000 cases and should be used with caution.
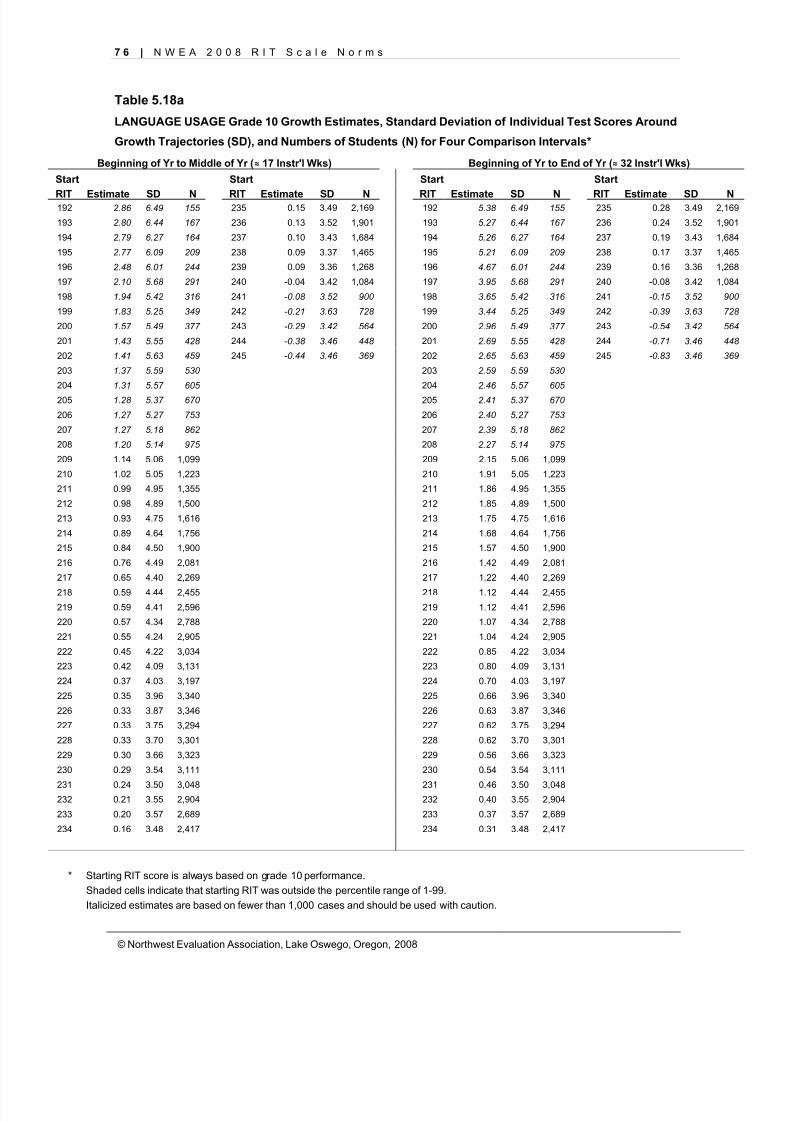
8/7/2019 NWEA Complete Norms2008
http://slidepdf.com/reader/full/nwea-complete-norms2008 86/170
7 6 | N W E A 2 0 0 8 R I T S c a l e N o r m s
© Northwest Evaluation Association, Lake Oswego, Oregon, 2008
Table 5.18a
LANGUAGE USAGE Grade 10 Growth Estimates, Standard Deviation of Individual Test Scores Around
Growth Trajectories (SD), and Numbers of Students (N) for Four Comparison Intervals*
Beginning of Yr to Middle of Yr ( ≈ 17 Instr'l Wks) Beginning of Yr to End of Yr ( ≈ 32 Instr'l Wks)
Start Start Start Start
RIT Estimate SD N RIT Estimate SD N RIT Estimate SD N RIT Estimate SD N192 2.86 6.49 155 235 0.15 3.49 2,169 192 5.38 6.49 155 235 0.28 3.49 2,169
193 2.80 6.44 167 236 0.13 3.52 1,901 193 5.27 6.44 167 236 0.24 3.52 1,901
194 2.79 6.27 164 237 0.10 3.43 1,684 194 5.26 6.27 164 237 0.19 3.43 1,684
195 2.77 6.09 209 238 0.09 3.37 1,465 195 5.21 6.09 209 238 0.17 3.37 1,465
196 2.48 6.01 244 239 0.09 3.36 1,268 196 4.67 6.01 244 239 0.16 3.36 1,268
197 2.10 5.68 291 240 -0.04 3.42 1,084 197 3.95 5.68 291 240 -0.08 3.42 1,084
198 1.94 5.42 316 241 -0.08 3.52 900 198 3.65 5.42 316 241 -0.15 3.52 900
199 1.83 5.25 349 242 -0.21 3.63 728 199 3.44 5.25 349 242 -0.39 3.63 728
200 1.57 5.49 377 243 -0.29 3.42 564 200 2.96 5.49 377 243 -0.54 3.42 564
201 1.43 5.55 428 244 -0.38 3.46 448 201 2.69 5.55 428 244 -0.71 3.46 448
202 1.41 5.63 459 245 -0.44 3.46 369 202 2.65 5.63 459 245 -0.83 3.46 369
203 1.37 5.59 530 203 2.59 5.59 530
204 1.31 5.57 605 204 2.46 5.57 605
205 1.28 5.37 670 205 2.41 5.37 670
206 1.27 5.27 753 206 2.40 5.27 753
207 1.27 5.18 862 207 2.39 5.18 862
208 1.20 5.14 975 208 2.27 5.14 975
209 1.14 5.06 1,099 209 2.15 5.06 1,099
210 1.02 5.05 1,223 210 1.91 5.05 1,223
211 0.99 4.95 1,355 211 1.86 4.95 1,355
212 0.98 4.89 1,500 212 1.85 4.89 1,500
213 0.93 4.75 1,616 213 1.75 4.75 1,616
214 0.89 4.64 1,756 214 1.68 4.64 1,756
215 0.84 4.50 1,900 215 1.57 4.50 1,900
216 0.76 4.49 2,081 216 1.42 4.49 2,081
217 0.65 4.40 2,269 217 1.22 4.40 2,269
218 0.59 4.44 2,455 218 1.12 4.44 2,455
219 0.59 4.41 2,596 219 1.12 4.41 2,596
220 0.57 4.34 2,788 220 1.07 4.34 2,788
221 0.55 4.24 2,905 221 1.04 4.24 2,905
222 0.45 4.22 3,034 222 0.85 4.22 3,034
223 0.42 4.09 3,131 223 0.80 4.09 3,131
224 0.37 4.03 3,197 224 0.70 4.03 3,197
225 0.35 3.96 3,340 225 0.66 3.96 3,340
226 0.33 3.87 3,346 226 0.63 3.87 3,346
227 0.33 3.75 3,294 227 0.62 3.75 3,294
228 0.33 3.70 3,301 228 0.62 3.70 3,301
229 0.30 3.66 3,323 229 0.56 3.66 3,323
230 0.29 3.54 3,111 230 0.54 3.54 3,111
231 0.24 3.50 3,048 231 0.46 3.50 3,048232 0.21 3.55 2,904 232 0.40 3.55 2,904
233 0.20 3.57 2,689 233 0.37 3.57 2,689
234 0.16 3.48 2,417 234 0.31 3.48 2,417
* Starting RIT score is always based on grade 10 performance.Shaded cells indicate that starting RIT was outside the percentile range of 1-99.Italicized estimates are based on fewer than 1,000 cases and should be used with caution.
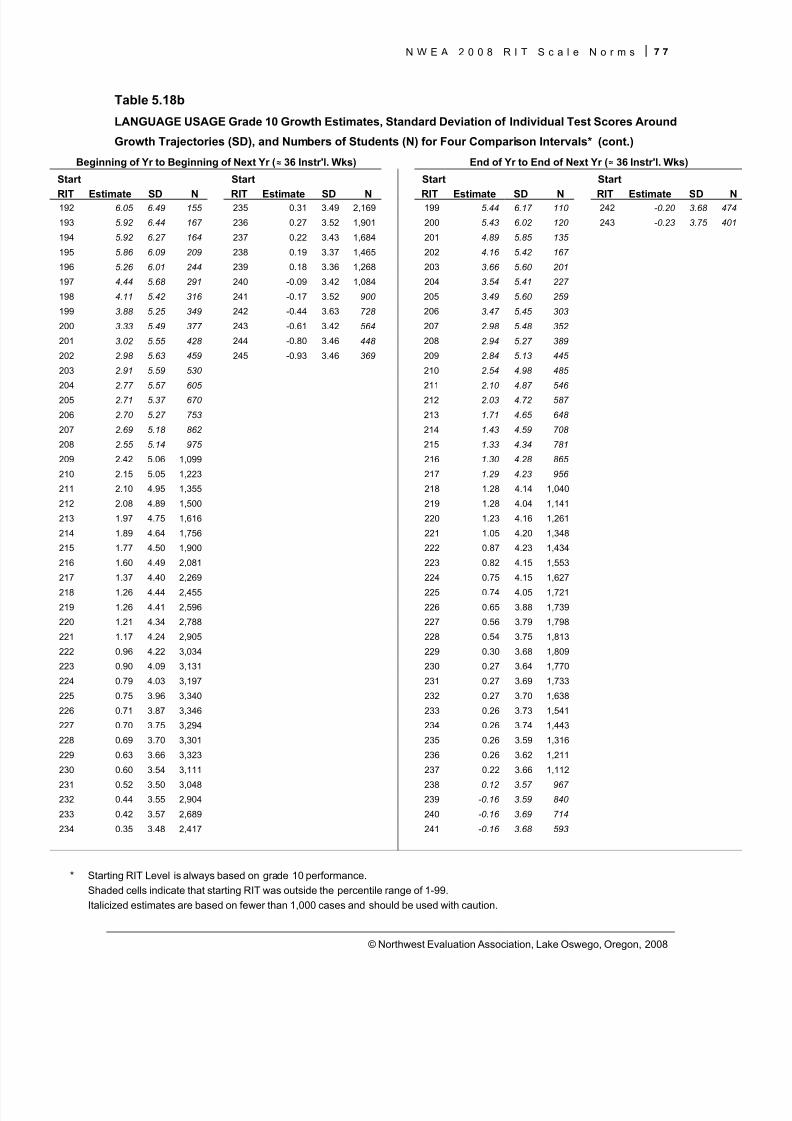
8/7/2019 NWEA Complete Norms2008
http://slidepdf.com/reader/full/nwea-complete-norms2008 87/170
N W E A 2 0 0 8 R I T S c a l e N o r m s 7 7
© Northwest Evaluation Association, Lake Oswego, Oregon, 2008
Table 5.18b
LANGUAGE USAGE Grade 10 Growth Estimates, Standard Deviation of Individual Test Scores Around
Growth Trajectories (SD), and Numbers of Students (N) for Four Comparison Intervals* (cont.)
Beginning of Yr to Beginning of Next Yr ( ≈ 36 Instr'l. Wks) End of Yr to End of Next Yr ( ≈ 36 Instr'l. Wks)
Start Start Start Start
RIT Estimate SD N RIT Estimate SD N RIT Estimate SD N RIT Estimate SD N192 6.05 6.49 155 235 0.31 3.49 2,169 199 5.44 6.17 110 242 -0.20 3.68 474
193 5.92 6.44 167 236 0.27 3.52 1,901 200 5.43 6.02 120 243 -0.23 3.75 401
194 5.92 6.27 164 237 0.22 3.43 1,684 201 4.89 5.85 135
195 5.86 6.09 209 238 0.19 3.37 1,465 202 4.16 5.42 167
196 5.26 6.01 244 239 0.18 3.36 1,268 203 3.66 5.60 201
197 4.44 5.68 291 240 -0.09 3.42 1,084 204 3.54 5.41 227
198 4.11 5.42 316 241 -0.17 3.52 900 205 3.49 5.60 259
199 3.88 5.25 349 242 -0.44 3.63 728 206 3.47 5.45 303
200 3.33 5.49 377 243 -0.61 3.42 564 207 2.98 5.48 352
201 3.02 5.55 428 244 -0.80 3.46 448 208 2.94 5.27 389
202 2.98 5.63 459 245 -0.93 3.46 369 209 2.84 5.13 445
203 2.91 5.59 530 210 2.54 4.98 485
204 2.77 5.57 605 211 2.10 4.87 546
205 2.71 5.37 670 212 2.03 4.72 587
206 2.70 5.27 753 213 1.71 4.65 648
207 2.69 5.18 862 214 1.43 4.59 708
208 2.55 5.14 975 215 1.33 4.34 781
209 2.42 5.06 1,099 216 1.30 4.28 865
210 2.15 5.05 1,223 217 1.29 4.23 956
211 2.10 4.95 1,355 218 1.28 4.14 1,040
212 2.08 4.89 1,500 219 1.28 4.04 1,141
213 1.97 4.75 1,616 220 1.23 4.16 1,261
214 1.89 4.64 1,756 221 1.05 4.20 1,348
215 1.77 4.50 1,900 222 0.87 4.23 1,434
216 1.60 4.49 2,081 223 0.82 4.15 1,553
217 1.37 4.40 2,269 224 0.75 4.15 1,627
218 1.26 4.44 2,455 225 0.74 4.05 1,721
219 1.26 4.41 2,596 226 0.65 3.88 1,739
220 1.21 4.34 2,788 227 0.56 3.79 1,798
221 1.17 4.24 2,905 228 0.54 3.75 1,813
222 0.96 4.22 3,034 229 0.30 3.68 1,809
223 0.90 4.09 3,131 230 0.27 3.64 1,770
224 0.79 4.03 3,197 231 0.27 3.69 1,733
225 0.75 3.96 3,340 232 0.27 3.70 1,638
226 0.71 3.87 3,346 233 0.26 3.73 1,541
227 0.70 3.75 3,294 234 0.26 3.74 1,443
228 0.69 3.70 3,301 235 0.26 3.59 1,316
229 0.63 3.66 3,323 236 0.26 3.62 1,211
230 0.60 3.54 3,111 237 0.22 3.66 1,112
231 0.52 3.50 3,048 238 0.12 3.57 967 232 0.44 3.55 2,904 239 -0.16 3.59 840
233 0.42 3.57 2,689 240 -0.16 3.69 714
234 0.35 3.48 2,417 241 -0.16 3.68 593
* Starting RIT Level is always based on grade 10 performance.Shaded cells indicate that starting RIT was outside the percentile range of 1-99.Italicized estimates are based on fewer than 1,000 cases and should be used with caution.
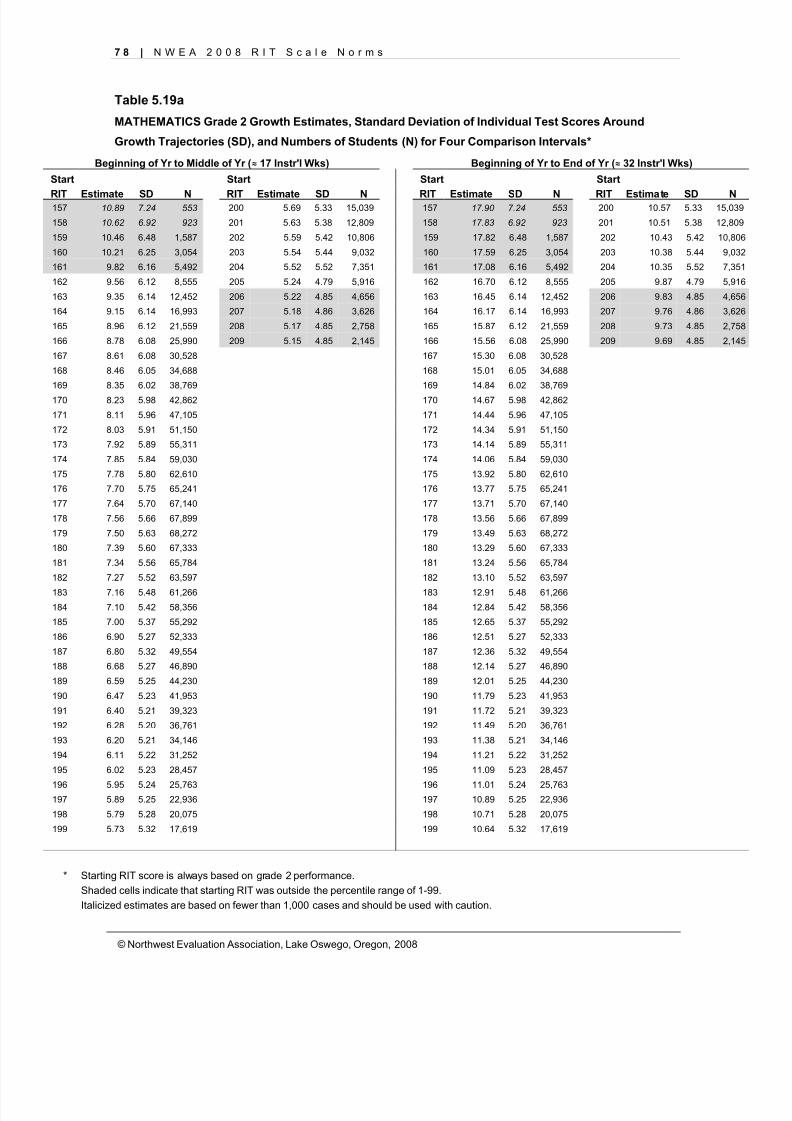
8/7/2019 NWEA Complete Norms2008
http://slidepdf.com/reader/full/nwea-complete-norms2008 88/170
7 8 | N W E A 2 0 0 8 R I T S c a l e N o r m s
© Northwest Evaluation Association, Lake Oswego, Oregon, 2008
Table 5.19a
MATHEMATICS Grade 2 Growth Estimates, Standard Deviation of Individual Test Scores Around
Growth Trajectories (SD), and Numbers of Students (N) for Four Comparison Intervals*
Beginning of Yr to Middle of Yr ( ≈ 17 Instr'l Wks) Beginning of Yr to End of Yr ( ≈ 32 Instr'l Wks)
Start Start Start Start
RIT Estimate SD N RIT Estimate SD N RIT Estimate SD N RIT Estimate SD N157 10.89 7.24 553 200 5.69 5.33 15,039 157 17.90 7.24 553 200 10.57 5.33 15,039
158 10.62 6.92 923 201 5.63 5.38 12,809 158 17.83 6.92 923 201 10.51 5.38 12,809
159 10.46 6.48 1,587 202 5.59 5.42 10,806 159 17.82 6.48 1,587 202 10.43 5.42 10,806
160 10.21 6.25 3,054 203 5.54 5.44 9,032 160 17.59 6.25 3,054 203 10.38 5.44 9,032
161 9.82 6.16 5,492 204 5.52 5.52 7,351 161 17.08 6.16 5,492 204 10.35 5.52 7,351
162 9.56 6.12 8,555 205 5.24 4.79 5,916 162 16.70 6.12 8,555 205 9.87 4.79 5,916
163 9.35 6.14 12,452 206 5.22 4.85 4,656 163 16.45 6.14 12,452 206 9.83 4.85 4,656
164 9.15 6.14 16,993 207 5.18 4.86 3,626 164 16.17 6.14 16,993 207 9.76 4.86 3,626
165 8.96 6.12 21,559 208 5.17 4.85 2,758 165 15.87 6.12 21,559 208 9.73 4.85 2,758
166 8.78 6.08 25,990 209 5.15 4.85 2,145 166 15.56 6.08 25,990 209 9.69 4.85 2,145
167 8.61 6.08 30,528 167 15.30 6.08 30,528
168 8.46 6.05 34,688 168 15.01 6.05 34,688
169 8.35 6.02 38,769 169 14.84 6.02 38,769
170 8.23 5.98 42,862 170 14.67 5.98 42,862
171 8.11 5.96 47,105 171 14.44 5.96 47,105
172 8.03 5.91 51,150 172 14.34 5.91 51,150
173 7.92 5.89 55,311 173 14.14 5.89 55,311
174 7.85 5.84 59,030 174 14.06 5.84 59,030
175 7.78 5.80 62,610 175 13.92 5.80 62,610
176 7.70 5.75 65,241 176 13.77 5.75 65,241
177 7.64 5.70 67,140 177 13.71 5.70 67,140
178 7.56 5.66 67,899 178 13.56 5.66 67,899
179 7.50 5.63 68,272 179 13.49 5.63 68,272
180 7.39 5.60 67,333 180 13.29 5.60 67,333
181 7.34 5.56 65,784 181 13.24 5.56 65,784
182 7.27 5.52 63,597 182 13.10 5.52 63,597
183 7.16 5.48 61,266 183 12.91 5.48 61,266
184 7.10 5.42 58,356 184 12.84 5.42 58,356
185 7.00 5.37 55,292 185 12.65 5.37 55,292
186 6.90 5.27 52,333 186 12.51 5.27 52,333
187 6.80 5.32 49,554 187 12.36 5.32 49,554
188 6.68 5.27 46,890 188 12.14 5.27 46,890
189 6.59 5.25 44,230 189 12.01 5.25 44,230
190 6.47 5.23 41,953 190 11.79 5.23 41,953
191 6.40 5.21 39,323 191 11.72 5.21 39,323
192 6.28 5.20 36,761 192 11.49 5.20 36,761
193 6.20 5.21 34,146 193 11.38 5.21 34,146
194 6.11 5.22 31,252 194 11.21 5.22 31,252
195 6.02 5.23 28,457 195 11.09 5.23 28,457
196 5.95 5.24 25,763 196 11.01 5.24 25,763197 5.89 5.25 22,936 197 10.89 5.25 22,936
198 5.79 5.28 20,075 198 10.71 5.28 20,075
199 5.73 5.32 17,619 199 10.64 5.32 17,619
* Starting RIT score is always based on grade 2 performance.Shaded cells indicate that starting RIT was outside the percentile range of 1-99.Italicized estimates are based on fewer than 1,000 cases and should be used with caution.
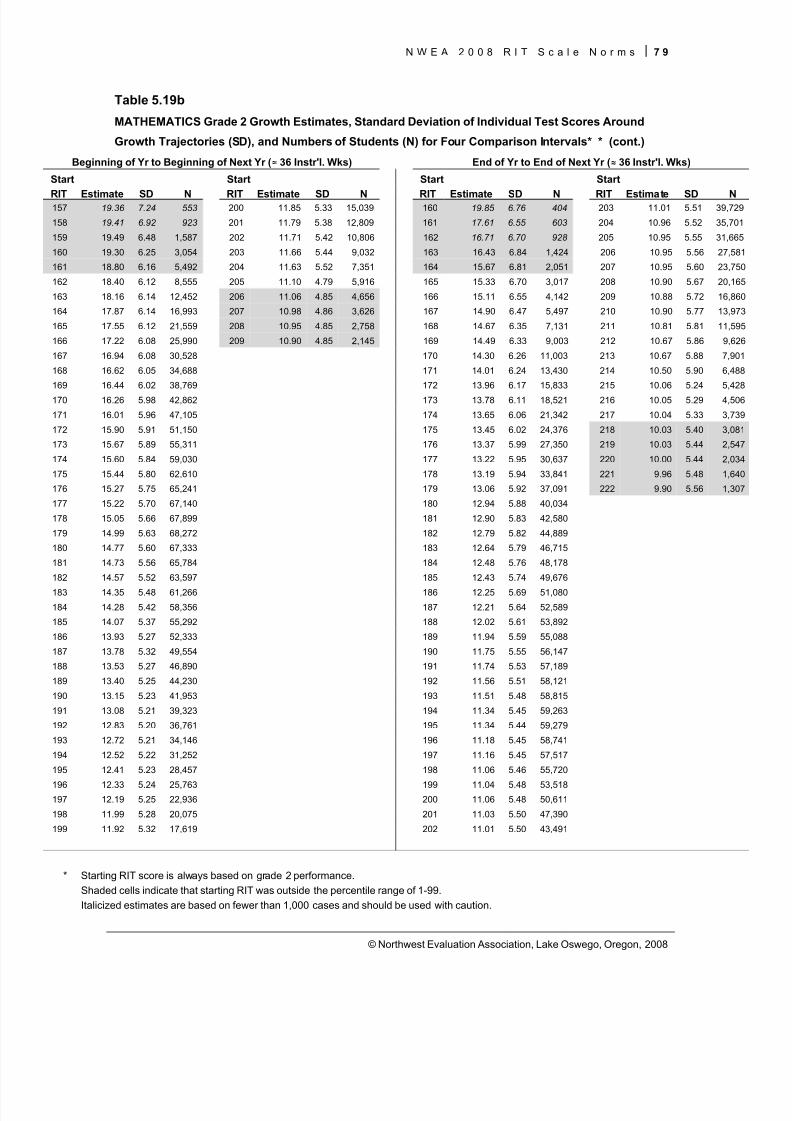
8/7/2019 NWEA Complete Norms2008
http://slidepdf.com/reader/full/nwea-complete-norms2008 89/170
N W E A 2 0 0 8 R I T S c a l e N o r m s 7 9
© Northwest Evaluation Association, Lake Oswego, Oregon, 2008
Table 5.19b
MATHEMATICS Grade 2 Growth Estimates, Standard Deviation of Individual Test Scores Around
Growth Trajectories (SD), and Numbers of Students (N) for Four Comparison Intervals* * (cont.)
Beginning of Yr to Beginning of Next Yr ( ≈ 36 Instr'l. Wks) End of Yr to End of Next Yr ( ≈ 36 Instr'l. Wks)
Start Start Start Start
RIT Estimate SD N RIT Estimate SD N RIT Estimate SD N RIT Estimate SD N157 19.36 7.24 553 200 11.85 5.33 15,039 160 19.85 6.76 404 203 11.01 5.51 39,729
158 19.41 6.92 923 201 11.79 5.38 12,809 161 17.61 6.55 603 204 10.96 5.52 35,701
159 19.49 6.48 1,587 202 11.71 5.42 10,806 162 16.71 6.70 928 205 10.95 5.55 31,665
160 19.30 6.25 3,054 203 11.66 5.44 9,032 163 16.43 6.84 1,424 206 10.95 5.56 27,581
161 18.80 6.16 5,492 204 11.63 5.52 7,351 164 15.67 6.81 2,051 207 10.95 5.60 23,750
162 18.40 6.12 8,555 205 11.10 4.79 5,916 165 15.33 6.70 3,017 208 10.90 5.67 20,165
163 18.16 6.14 12,452 206 11.06 4.85 4,656 166 15.11 6.55 4,142 209 10.88 5.72 16,860
164 17.87 6.14 16,993 207 10.98 4.86 3,626 167 14.90 6.47 5,497 210 10.90 5.77 13,973
165 17.55 6.12 21,559 208 10.95 4.85 2,758 168 14.67 6.35 7,131 211 10.81 5.81 11,595
166 17.22 6.08 25,990 209 10.90 4.85 2,145 169 14.49 6.33 9,003 212 10.67 5.86 9,626
167 16.94 6.08 30,528 170 14.30 6.26 11,003 213 10.67 5.88 7,901
168 16.62 6.05 34,688 171 14.01 6.24 13,430 214 10.50 5.90 6,488
169 16.44 6.02 38,769 172 13.96 6.17 15,833 215 10.06 5.24 5,428
170 16.26 5.98 42,862 173 13.78 6.11 18,521 216 10.05 5.29 4,506
171 16.01 5.96 47,105 174 13.65 6.06 21,342 217 10.04 5.33 3,739
172 15.90 5.91 51,150 175 13.45 6.02 24,376 218 10.03 5.40 3,081
173 15.67 5.89 55,311 176 13.37 5.99 27,350 219 10.03 5.44 2,547
174 15.60 5.84 59,030 177 13.22 5.95 30,637 220 10.00 5.44 2,034
175 15.44 5.80 62,610 178 13.19 5.94 33,841 221 9.96 5.48 1,640
176 15.27 5.75 65,241 179 13.06 5.92 37,091 222 9.90 5.56 1,307
177 15.22 5.70 67,140 180 12.94 5.88 40,034
178 15.05 5.66 67,899 181 12.90 5.83 42,580
179 14.99 5.63 68,272 182 12.79 5.82 44,889
180 14.77 5.60 67,333 183 12.64 5.79 46,715
181 14.73 5.56 65,784 184 12.48 5.76 48,178
182 14.57 5.52 63,597 185 12.43 5.74 49,676
183 14.35 5.48 61,266 186 12.25 5.69 51,080
184 14.28 5.42 58,356 187 12.21 5.64 52,589
185 14.07 5.37 55,292 188 12.02 5.61 53,892
186 13.93 5.27 52,333 189 11.94 5.59 55,088
187 13.78 5.32 49,554 190 11.75 5.55 56,147
188 13.53 5.27 46,890 191 11.74 5.53 57,189
189 13.40 5.25 44,230 192 11.56 5.51 58,121
190 13.15 5.23 41,953 193 11.51 5.48 58,815
191 13.08 5.21 39,323 194 11.34 5.45 59,263
192 12.83 5.20 36,761 195 11.34 5.44 59,279
193 12.72 5.21 34,146 196 11.18 5.45 58,741
194 12.52 5.22 31,252 197 11.16 5.45 57,517
195 12.41 5.23 28,457 198 11.06 5.46 55,720
196 12.33 5.24 25,763 199 11.04 5.48 53,518197 12.19 5.25 22,936 200 11.06 5.48 50,611
198 11.99 5.28 20,075 201 11.03 5.50 47,390
199 11.92 5.32 17,619 202 11.01 5.50 43,491
* Starting RIT score is always based on grade 2 performance.Shaded cells indicate that starting RIT was outside the percentile range of 1-99.Italicized estimates are based on fewer than 1,000 cases and should be used with caution.
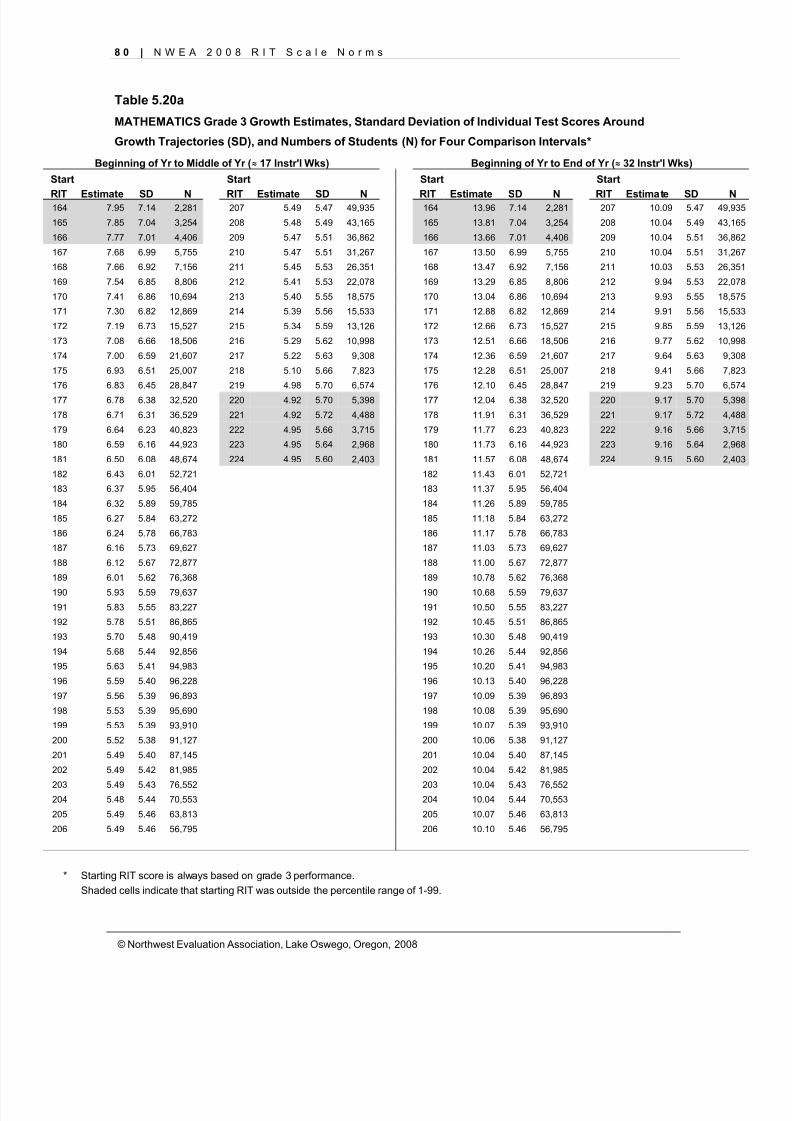
8/7/2019 NWEA Complete Norms2008
http://slidepdf.com/reader/full/nwea-complete-norms2008 90/170
8 0 | N W E A 2 0 0 8 R I T S c a l e N o r m s
© Northwest Evaluation Association, Lake Oswego, Oregon, 2008
Table 5.20a
MATHEMATICS Grade 3 Growth Estimates, Standard Deviation of Individual Test Scores Around
Growth Trajectories (SD), and Numbers of Students (N) for Four Comparison Intervals*
Beginning of Yr to Middle of Yr ( ≈ 17 Instr'l Wks) Beginning of Yr to End of Yr ( ≈ 32 Instr'l Wks)
Start Start Start Start
RIT Estimate SD N RIT Estimate SD N RIT Estimate SD N RIT Estimate SD N164 7.95 7.14 2,281 207 5.49 5.47 49,935 164 13.96 7.14 2,281 207 10.09 5.47 49,935
165 7.85 7.04 3,254 208 5.48 5.49 43,165 165 13.81 7.04 3,254 208 10.04 5.49 43,165
166 7.77 7.01 4,406 209 5.47 5.51 36,862 166 13.66 7.01 4,406 209 10.04 5.51 36,862
167 7.68 6.99 5,755 210 5.47 5.51 31,267 167 13.50 6.99 5,755 210 10.04 5.51 31,267
168 7.66 6.92 7,156 211 5.45 5.53 26,351 168 13.47 6.92 7,156 211 10.03 5.53 26,351
169 7.54 6.85 8,806 212 5.41 5.53 22,078 169 13.29 6.85 8,806 212 9.94 5.53 22,078
170 7.41 6.86 10,694 213 5.40 5.55 18,575 170 13.04 6.86 10,694 213 9.93 5.55 18,575
171 7.30 6.82 12,869 214 5.39 5.56 15,533 171 12.88 6.82 12,869 214 9.91 5.56 15,533
172 7.19 6.73 15,527 215 5.34 5.59 13,126 172 12.66 6.73 15,527 215 9.85 5.59 13,126
173 7.08 6.66 18,506 216 5.29 5.62 10,998 173 12.51 6.66 18,506 216 9.77 5.62 10,998
174 7.00 6.59 21,607 217 5.22 5.63 9,308 174 12.36 6.59 21,607 217 9.64 5.63 9,308
175 6.93 6.51 25,007 218 5.10 5.66 7,823 175 12.28 6.51 25,007 218 9.41 5.66 7,823
176 6.83 6.45 28,847 219 4.98 5.70 6,574 176 12.10 6.45 28,847 219 9.23 5.70 6,574
177 6.78 6.38 32,520 220 4.92 5.70 5,398 177 12.04 6.38 32,520 220 9.17 5.70 5,398
178 6.71 6.31 36,529 221 4.92 5.72 4,488 178 11.91 6.31 36,529 221 9.17 5.72 4,488
179 6.64 6.23 40,823 222 4.95 5.66 3,715 179 11.77 6.23 40,823 222 9.16 5.66 3,715
180 6.59 6.16 44,923 223 4.95 5.64 2,968 180 11.73 6.16 44,923 223 9.16 5.64 2,968
181 6.50 6.08 48,674 224 4.95 5.60 2,403 181 11.57 6.08 48,674 224 9.15 5.60 2,403
182 6.43 6.01 52,721 182 11.43 6.01 52,721
183 6.37 5.95 56,404 183 11.37 5.95 56,404
184 6.32 5.89 59,785 184 11.26 5.89 59,785
185 6.27 5.84 63,272 185 11.18 5.84 63,272
186 6.24 5.78 66,783 186 11.17 5.78 66,783
187 6.16 5.73 69,627 187 11.03 5.73 69,627
188 6.12 5.67 72,877 188 11.00 5.67 72,877
189 6.01 5.62 76,368 189 10.78 5.62 76,368
190 5.93 5.59 79,637 190 10.68 5.59 79,637
191 5.83 5.55 83,227 191 10.50 5.55 83,227
192 5.78 5.51 86,865 192 10.45 5.51 86,865
193 5.70 5.48 90,419 193 10.30 5.48 90,419
194 5.68 5.44 92,856 194 10.26 5.44 92,856
195 5.63 5.41 94,983 195 10.20 5.41 94,983
196 5.59 5.40 96,228 196 10.13 5.40 96,228
197 5.56 5.39 96,893 197 10.09 5.39 96,893
198 5.53 5.39 95,690 198 10.08 5.39 95,690
199 5.53 5.39 93,910 199 10.07 5.39 93,910
200 5.52 5.38 91,127 200 10.06 5.38 91,127
201 5.49 5.40 87,145 201 10.04 5.40 87,145
202 5.49 5.42 81,985 202 10.04 5.42 81,985
203 5.49 5.43 76,552 203 10.04 5.43 76,552204 5.48 5.44 70,553 204 10.04 5.44 70,553
205 5.49 5.46 63,813 205 10.07 5.46 63,813
206 5.49 5.46 56,795 206 10.10 5.46 56,795
* Starting RIT score is always based on grade 3 performance.Shaded cells indicate that starting RIT was outside the percentile range of 1-99.
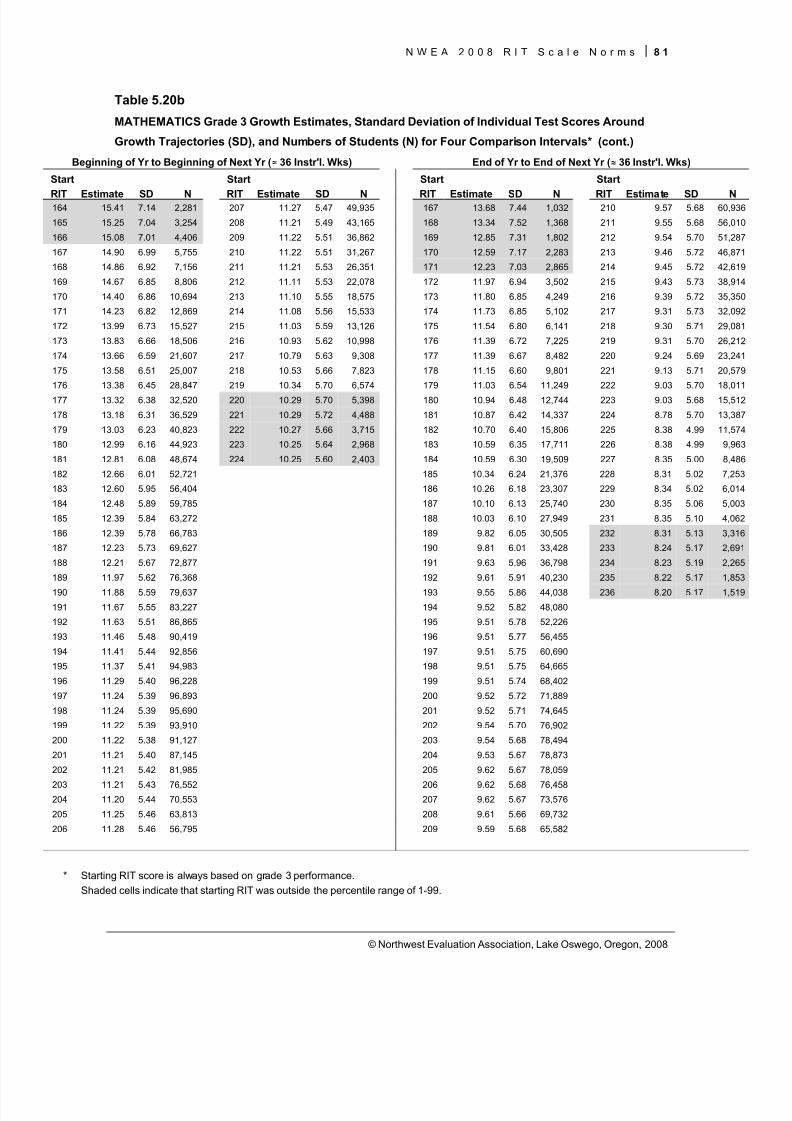
8/7/2019 NWEA Complete Norms2008
http://slidepdf.com/reader/full/nwea-complete-norms2008 91/170
N W E A 2 0 0 8 R I T S c a l e N o r m s 8 1
© Northwest Evaluation Association, Lake Oswego, Oregon, 2008
Table 5.20b
MATHEMATICS Grade 3 Growth Estimates, Standard Deviation of Individual Test Scores Around
Growth Trajectories (SD), and Numbers of Students (N) for Four Comparison Intervals* (cont.)
Beginning of Yr to Beginning of Next Yr ( ≈ 36 Instr'l. Wks) End of Yr to End of Next Yr ( ≈ 36 Instr'l. Wks)
Start Start Start Start
RIT Estimate SD N RIT Estimate SD N RIT Estimate SD N RIT Estimate SD N164 15.41 7.14 2,281 207 11.27 5.47 49,935 167 13.68 7.44 1,032 210 9.57 5.68 60,936
165 15.25 7.04 3,254 208 11.21 5.49 43,165 168 13.34 7.52 1,368 211 9.55 5.68 56,010
166 15.08 7.01 4,406 209 11.22 5.51 36,862 169 12.85 7.31 1,802 212 9.54 5.70 51,287
167 14.90 6.99 5,755 210 11.22 5.51 31,267 170 12.59 7.17 2,283 213 9.46 5.72 46,871
168 14.86 6.92 7,156 211 11.21 5.53 26,351 171 12.23 7.03 2,865 214 9.45 5.72 42,619
169 14.67 6.85 8,806 212 11.11 5.53 22,078 172 11.97 6.94 3,502 215 9.43 5.73 38,914
170 14.40 6.86 10,694 213 11.10 5.55 18,575 173 11.80 6.85 4,249 216 9.39 5.72 35,350
171 14.23 6.82 12,869 214 11.08 5.56 15,533 174 11.73 6.85 5,102 217 9.31 5.73 32,092
172 13.99 6.73 15,527 215 11.03 5.59 13,126 175 11.54 6.80 6,141 218 9.30 5.71 29,081
173 13.83 6.66 18,506 216 10.93 5.62 10,998 176 11.39 6.72 7,225 219 9.31 5.70 26,212
174 13.66 6.59 21,607 217 10.79 5.63 9,308 177 11.39 6.67 8,482 220 9.24 5.69 23,241
175 13.58 6.51 25,007 218 10.53 5.66 7,823 178 11.15 6.60 9,801 221 9.13 5.71 20,579
176 13.38 6.45 28,847 219 10.34 5.70 6,574 179 11.03 6.54 11,249 222 9.03 5.70 18,011
177 13.32 6.38 32,520 220 10.29 5.70 5,398 180 10.94 6.48 12,744 223 9.03 5.68 15,512
178 13.18 6.31 36,529 221 10.29 5.72 4,488 181 10.87 6.42 14,337 224 8.78 5.70 13,387
179 13.03 6.23 40,823 222 10.27 5.66 3,715 182 10.70 6.40 15,806 225 8.38 4.99 11,574
180 12.99 6.16 44,923 223 10.25 5.64 2,968 183 10.59 6.35 17,711 226 8.38 4.99 9,963
181 12.81 6.08 48,674 224 10.25 5.60 2,403 184 10.59 6.30 19,509 227 8.35 5.00 8,486
182 12.66 6.01 52,721 185 10.34 6.24 21,376 228 8.31 5.02 7,253
183 12.60 5.95 56,404 186 10.26 6.18 23,307 229 8.34 5.02 6,014
184 12.48 5.89 59,785 187 10.10 6.13 25,740 230 8.35 5.06 5,003
185 12.39 5.84 63,272 188 10.03 6.10 27,949 231 8.35 5.10 4,062
186 12.39 5.78 66,783 189 9.82 6.05 30,505 232 8.31 5.13 3,316
187 12.23 5.73 69,627 190 9.81 6.01 33,428 233 8.24 5.17 2,691
188 12.21 5.67 72,877 191 9.63 5.96 36,798 234 8.23 5.19 2,265
189 11.97 5.62 76,368 192 9.61 5.91 40,230 235 8.22 5.17 1,853
190 11.88 5.59 79,637 193 9.55 5.86 44,038 236 8.20 5.17 1,519
191 11.67 5.55 83,227 194 9.52 5.82 48,080
192 11.63 5.51 86,865 195 9.51 5.78 52,226
193 11.46 5.48 90,419 196 9.51 5.77 56,455
194 11.41 5.44 92,856 197 9.51 5.75 60,690
195 11.37 5.41 94,983 198 9.51 5.75 64,665
196 11.29 5.40 96,228 199 9.51 5.74 68,402
197 11.24 5.39 96,893 200 9.52 5.72 71,889
198 11.24 5.39 95,690 201 9.52 5.71 74,645
199 11.22 5.39 93,910 202 9.54 5.70 76,902
200 11.22 5.38 91,127 203 9.54 5.68 78,494
201 11.21 5.40 87,145 204 9.53 5.67 78,873
202 11.21 5.42 81,985 205 9.62 5.67 78,059
203 11.21 5.43 76,552 206 9.62 5.68 76,458204 11.20 5.44 70,553 207 9.62 5.67 73,576
205 11.25 5.46 63,813 208 9.61 5.66 69,732
206 11.28 5.46 56,795 209 9.59 5.68 65,582
* Starting RIT score is always based on grade 3 performance.Shaded cells indicate that starting RIT was outside the percentile range of 1-99.

8/7/2019 NWEA Complete Norms2008
http://slidepdf.com/reader/full/nwea-complete-norms2008 92/170
8 2 | N W E A 2 0 0 8 R I T S c a l e N o r m s
© Northwest Evaluation Association, Lake Oswego, Oregon, 2008
Table 5.21a
MATHEMATICS Grade 4 Growth Estimates, Standard Deviation of Individual Test Scores Around
Growth Trajectories (SD), and Numbers of Students (N) for Four Comparison Intervals*
Beginning of Yr to Middle of Yr ( ≈ 17 Instr'l Wks) Beginning of Yr to End of Yr ( ≈ 32 Instr'l Wks)
Start Start Start Start
RIT Estimate SD N RIT Estimate SD N RIT Estimate SD N RIT Estimate SD N168 6.85 7.85 1,649 211 4.98 5.65 78,180 168 11.94 7.85 1,649 211 9.03 5.65 78,180
169 6.78 7.75 2,079 212 4.96 5.64 72,784 169 11.81 7.75 2,079 212 9.01 5.64 72,784
170 6.67 7.67 2,605 213 4.94 5.61 67,655 170 11.60 7.67 2,605 213 8.97 5.61 67,655
171 6.59 7.58 3,205 214 4.92 5.58 62,733 171 11.50 7.58 3,205 214 8.92 5.58 62,733
172 6.38 7.51 3,852 215 4.90 5.55 57,529 172 11.15 7.51 3,852 215 8.88 5.55 57,529
173 6.28 7.49 4,596 216 4.87 5.53 52,666 173 10.97 7.49 4,596 216 8.88 5.53 52,666
174 6.22 7.42 5,470 217 4.82 5.50 48,193 174 10.85 7.42 5,470 217 8.79 5.50 48,193
175 6.11 7.29 6,457 218 4.76 5.47 43,717 175 10.69 7.29 6,457 218 8.67 5.47 43,717
176 6.00 7.24 7,549 219 4.73 5.45 39,455 176 10.48 7.24 7,549 219 8.61 5.45 39,455
177 6.00 7.15 8,851 220 4.69 5.44 35,620 177 10.47 7.15 8,851 220 8.60 5.44 35,620
178 5.90 7.08 10,203 221 4.64 5.41 31,990 178 10.33 7.08 10,203 221 8.50 5.41 31,990
179 5.76 7.02 11,603 222 4.58 5.41 28,331 179 10.12 7.02 11,603 222 8.38 5.41 28,331
180 5.67 6.94 12,951 223 4.53 5.39 25,208 180 10.00 6.94 12,951 223 8.29 5.39 25,208
181 5.58 6.85 14,596 224 4.50 5.37 22,238 181 9.82 6.85 14,596 224 8.28 5.37 22,238
182 5.52 6.75 16,233 225 4.44 5.37 19,332 182 9.77 6.75 16,233 225 8.16 5.37 19,332
183 5.51 6.66 17,942 226 4.35 5.41 16,685 183 9.75 6.66 17,942 226 8.00 5.41 16,685
184 5.40 6.56 19,761 227 4.32 5.42 14,492 184 9.55 6.56 19,761 227 7.94 5.42 14,492
185 5.37 6.49 22,180 228 4.29 5.42 12,275 185 9.52 6.49 22,180 228 7.94 5.42 12,275
186 5.35 6.42 24,392 229 4.26 5.44 10,457 186 9.50 6.42 24,392 229 7.88 5.44 10,457
187 5.29 6.37 26,934 230 4.19 5.43 8,905 187 9.39 6.37 26,934 230 7.75 5.43 8,905
188 5.23 6.32 29,741 231 4.17 5.40 7,515 188 9.31 6.32 29,741 231 7.70 5.40 7,515
189 5.20 6.25 32,812 232 4.09 5.38 6216 189 9.25 6.25 32,812 232 7.60 5.38 6,216
190 5.13 6.16 35,959 233 4.02 5.36 5,125 190 9.13 6.16 35,959 233 7.47 5.36 5,125
191 5.08 6.12 39,902 234 3.80 4.59 4,246 191 9.08 6.12 39,902 234 7.15 4.59 4,246
192 5.07 6.08 44,117 235 3.75 4.62 3,468 192 9.06 6.08 44,117 235 7.06 4.62 3,468
193 4.98 6.03 48,686 236 3.71 4.66 2,833 193 8.93 6.03 48,686 236 6.99 4.66 2,833
194 4.91 5.99 53,681 237 3.68 4.66 2,272 194 8.81 5.99 53,681 237 6.92 4.66 2,272
195 4.89 5.95 59,091 195 8.76 5.95 59,091
196 4.87 5.90 64,281 196 8.73 5.90 64,281
197 4.84 5.87 69,920 197 8.71 5.87 69,920
198 4.83 5.85 75,604 198 8.70 5.85 75,604
199 4.84 5.82 80,693 199 8.72 5.82 80,693
200 4.85 5.82 85,506 200 8.74 5.82 85,506
201 4.85 5.81 90,073 201 8.74 5.81 90,073
202 4.87 5.79 93,538 202 8.78 5.79 93,538
203 4.90 5.77 96,325 203 8.84 5.77 96,325
204 4.93 5.76 98,358 204 8.90 5.76 98,358
205 4.94 5.75 99,078 205 8.92 5.75 99,078
206 4.97 5.73 98,257 206 8.97 5.73 98,257
207 4.98 5.71 96,260 207 8.99 5.71 96,260208 5.02 5.70 92,767 208 9.11 5.70 92,767
209 5.00 5.69 88,269 209 9.08 5.69 88,269
210 5.00 5.66 83,389 210 9.07 5.66 83,389
* Starting RIT score is always based on grade 4 performance.Shaded cells indicate that starting RIT was outside the percentile range of 1-99.
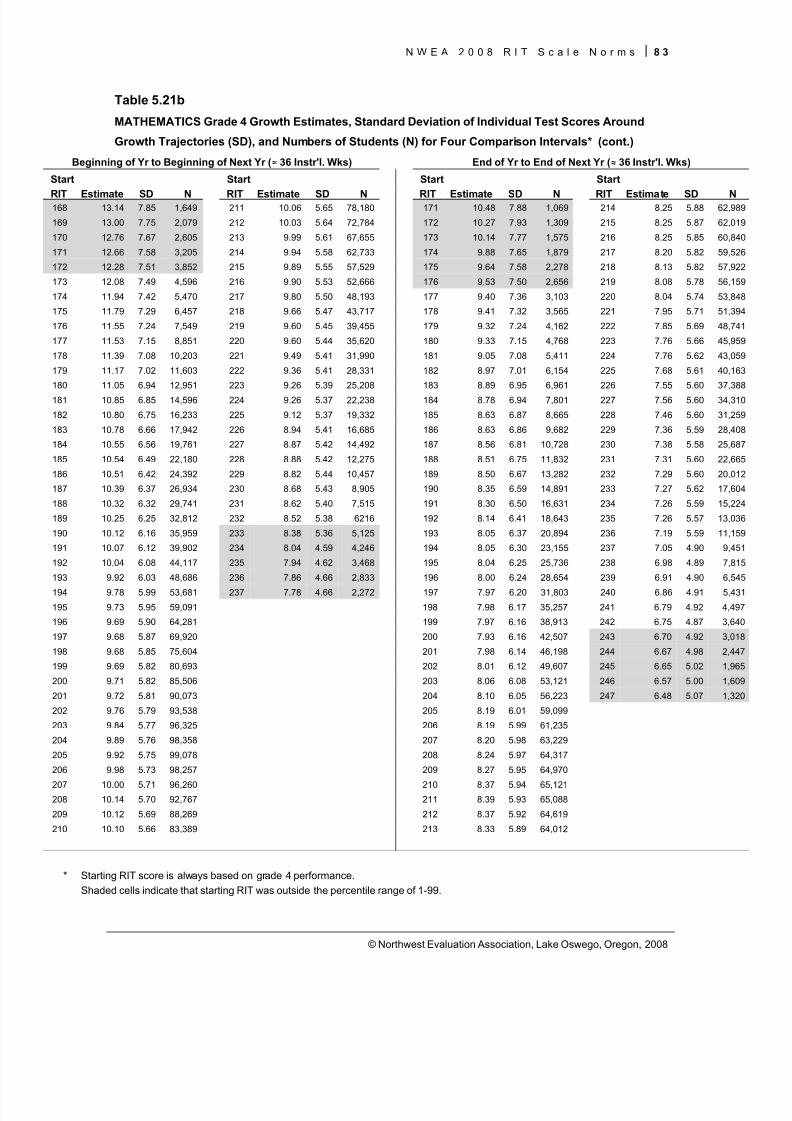
8/7/2019 NWEA Complete Norms2008
http://slidepdf.com/reader/full/nwea-complete-norms2008 93/170
N W E A 2 0 0 8 R I T S c a l e N o r m s 8 3
© Northwest Evaluation Association, Lake Oswego, Oregon, 2008
Table 5.21b
MATHEMATICS Grade 4 Growth Estimates, Standard Deviation of Individual Test Scores Around
Growth Trajectories (SD), and Numbers of Students (N) for Four Comparison Intervals* (cont.)
Beginning of Yr to Beginning of Next Yr ( ≈ 36 Instr'l. Wks) End of Yr to End of Next Yr ( ≈ 36 Instr'l. Wks)
Start Start Start Start
RIT Estimate SD N RIT Estimate SD N RIT Estimate SD N RIT Estimate SD N168 13.14 7.85 1,649 211 10.06 5.65 78,180 171 10.48 7.88 1,069 214 8.25 5.88 62,989
169 13.00 7.75 2,079 212 10.03 5.64 72,784 172 10.27 7.93 1,309 215 8.25 5.87 62,019
170 12.76 7.67 2,605 213 9.99 5.61 67,655 173 10.14 7.77 1,575 216 8.25 5.85 60,840
171 12.66 7.58 3,205 214 9.94 5.58 62,733 174 9.88 7.65 1,879 217 8.20 5.82 59,526
172 12.28 7.51 3,852 215 9.89 5.55 57,529 175 9.64 7.58 2,278 218 8.13 5.82 57,922
173 12.08 7.49 4,596 216 9.90 5.53 52,666 176 9.53 7.50 2,656 219 8.08 5.78 56,159
174 11.94 7.42 5,470 217 9.80 5.50 48,193 177 9.40 7.36 3,103 220 8.04 5.74 53,848
175 11.79 7.29 6,457 218 9.66 5.47 43,717 178 9.41 7.32 3,565 221 7.95 5.71 51,394
176 11.55 7.24 7,549 219 9.60 5.45 39,455 179 9.32 7.24 4,162 222 7.85 5.69 48,741
177 11.53 7.15 8,851 220 9.60 5.44 35,620 180 9.33 7.15 4,768 223 7.76 5.66 45,959
178 11.39 7.08 10,203 221 9.49 5.41 31,990 181 9.05 7.08 5,411 224 7.76 5.62 43,059
179 11.17 7.02 11,603 222 9.36 5.41 28,331 182 8.97 7.01 6,154 225 7.68 5.61 40,163
180 11.05 6.94 12,951 223 9.26 5.39 25,208 183 8.89 6.95 6,961 226 7.55 5.60 37,388
181 10.85 6.85 14,596 224 9.26 5.37 22,238 184 8.78 6.94 7,801 227 7.56 5.60 34,310
182 10.80 6.75 16,233 225 9.12 5.37 19,332 185 8.63 6.87 8,665 228 7.46 5.60 31,259
183 10.78 6.66 17,942 226 8.94 5.41 16,685 186 8.63 6.86 9,682 229 7.36 5.59 28,408
184 10.55 6.56 19,761 227 8.87 5.42 14,492 187 8.56 6.81 10,728 230 7.38 5.58 25,687
185 10.54 6.49 22,180 228 8.88 5.42 12,275 188 8.51 6.75 11,832 231 7.31 5.60 22,665
186 10.51 6.42 24,392 229 8.82 5.44 10,457 189 8.50 6.67 13,282 232 7.29 5.60 20,012
187 10.39 6.37 26,934 230 8.68 5.43 8,905 190 8.35 6.59 14,891 233 7.27 5.62 17,604
188 10.32 6.32 29,741 231 8.62 5.40 7,515 191 8.30 6.50 16,631 234 7.26 5.59 15,224
189 10.25 6.25 32,812 232 8.52 5.38 6216 192 8.14 6.41 18,643 235 7.26 5.57 13,036
190 10.12 6.16 35,959 233 8.38 5.36 5,125 193 8.05 6.37 20,894 236 7.19 5.59 11,159
191 10.07 6.12 39,902 234 8.04 4.59 4,246 194 8.05 6.30 23,155 237 7.05 4.90 9,451
192 10.04 6.08 44,117 235 7.94 4.62 3,468 195 8.04 6.25 25,736 238 6.98 4.89 7,815
193 9.92 6.03 48,686 236 7.86 4.66 2,833 196 8.00 6.24 28,654 239 6.91 4.90 6,545
194 9.78 5.99 53,681 237 7.78 4.66 2,272 197 7.97 6.20 31,803 240 6.86 4.91 5,431
195 9.73 5.95 59,091 198 7.98 6.17 35,257 241 6.79 4.92 4,497
196 9.69 5.90 64,281 199 7.97 6.16 38,913 242 6.75 4.87 3,640
197 9.68 5.87 69,920 200 7.93 6.16 42,507 243 6.70 4.92 3,018
198 9.68 5.85 75,604 201 7.98 6.14 46,198 244 6.67 4.98 2,447
199 9.69 5.82 80,693 202 8.01 6.12 49,607 245 6.65 5.02 1,965
200 9.71 5.82 85,506 203 8.06 6.08 53,121 246 6.57 5.00 1,609
201 9.72 5.81 90,073 204 8.10 6.05 56,223 247 6.48 5.07 1,320
202 9.76 5.79 93,538 205 8.19 6.01 59,099
203 9.84 5.77 96,325 206 8.19 5.99 61,235
204 9.89 5.76 98,358 207 8.20 5.98 63,229
205 9.92 5.75 99,078 208 8.24 5.97 64,317
206 9.98 5.73 98,257 209 8.27 5.95 64,970
207 10.00 5.71 96,260 210 8.37 5.94 65,121208 10.14 5.70 92,767 211 8.39 5.93 65,088
209 10.12 5.69 88,269 212 8.37 5.92 64,619
210 10.10 5.66 83,389 213 8.33 5.89 64,012
* Starting RIT score is always based on grade 4 performance.Shaded cells indicate that starting RIT was outside the percentile range of 1-99.
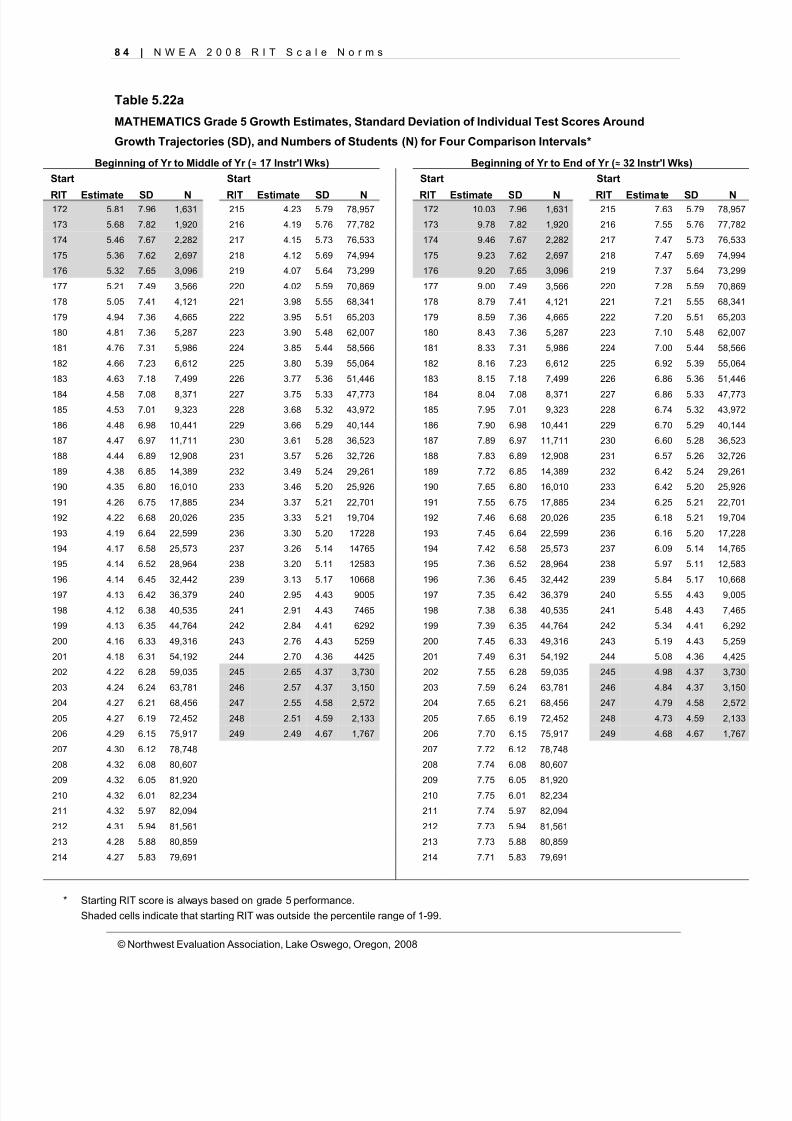
8/7/2019 NWEA Complete Norms2008
http://slidepdf.com/reader/full/nwea-complete-norms2008 94/170
8 4 | N W E A 2 0 0 8 R I T S c a l e N o r m s
© Northwest Evaluation Association, Lake Oswego, Oregon, 2008
Table 5.22a
MATHEMATICS Grade 5 Growth Estimates, Standard Deviation of Individual Test Scores Around
Growth Trajectories (SD), and Numbers of Students (N) for Four Comparison Intervals*
Beginning of Yr to Middle of Yr ( ≈ 17 Instr'l Wks) Beginning of Yr to End of Yr ( ≈ 32 Instr'l Wks)Start Start Start Start
RIT Estimate SD N RIT Estimate SD N RIT Estimate SD N RIT Estimate SD N172 5.81 7.96 1,631 215 4.23 5.79 78,957 172 10.03 7.96 1,631 215 7.63 5.79 78,957
173 5.68 7.82 1,920 216 4.19 5.76 77,782 173 9.78 7.82 1,920 216 7.55 5.76 77,782
174 5.46 7.67 2,282 217 4.15 5.73 76,533 174 9.46 7.67 2,282 217 7.47 5.73 76,533
175 5.36 7.62 2,697 218 4.12 5.69 74,994 175 9.23 7.62 2,697 218 7.47 5.69 74,994
176 5.32 7.65 3,096 219 4.07 5.64 73,299 176 9.20 7.65 3,096 219 7.37 5.64 73,299
177 5.21 7.49 3,566 220 4.02 5.59 70,869 177 9.00 7.49 3,566 220 7.28 5.59 70,869
178 5.05 7.41 4,121 221 3.98 5.55 68,341 178 8.79 7.41 4,121 221 7.21 5.55 68,341
179 4.94 7.36 4,665 222 3.95 5.51 65,203 179 8.59 7.36 4,665 222 7.20 5.51 65,203
180 4.81 7.36 5,287 223 3.90 5.48 62,007 180 8.43 7.36 5,287 223 7.10 5.48 62,007
181 4.76 7.31 5,986 224 3.85 5.44 58,566 181 8.33 7.31 5,986 224 7.00 5.44 58,566
182 4.66 7.23 6,612 225 3.80 5.39 55,064 182 8.16 7.23 6,612 225 6.92 5.39 55,064
183 4.63 7.18 7,499 226 3.77 5.36 51,446 183 8.15 7.18 7,499 226 6.86 5.36 51,446
184 4.58 7.08 8,371 227 3.75 5.33 47,773 184 8.04 7.08 8,371 227 6.86 5.33 47,773185 4.53 7.01 9,323 228 3.68 5.32 43,972 185 7.95 7.01 9,323 228 6.74 5.32 43,972
186 4.48 6.98 10,441 229 3.66 5.29 40,144 186 7.90 6.98 10,441 229 6.70 5.29 40,144
187 4.47 6.97 11,711 230 3.61 5.28 36,523 187 7.89 6.97 11,711 230 6.60 5.28 36,523
188 4.44 6.89 12,908 231 3.57 5.26 32,726 188 7.83 6.89 12,908 231 6.57 5.26 32,726
189 4.38 6.85 14,389 232 3.49 5.24 29,261 189 7.72 6.85 14,389 232 6.42 5.24 29,261
190 4.35 6.80 16,010 233 3.46 5.20 25,926 190 7.65 6.80 16,010 233 6.42 5.20 25,926
191 4.26 6.75 17,885 234 3.37 5.21 22,701 191 7.55 6.75 17,885 234 6.25 5.21 22,701
192 4.22 6.68 20,026 235 3.33 5.21 19,704 192 7.46 6.68 20,026 235 6.18 5.21 19,704
193 4.19 6.64 22,599 236 3.30 5.20 17228 193 7.45 6.64 22,599 236 6.16 5.20 17,228
194 4.17 6.58 25,573 237 3.26 5.14 14765 194 7.42 6.58 25,573 237 6.09 5.14 14,765
195 4.14 6.52 28,964 238 3.20 5.11 12583 195 7.36 6.52 28,964 238 5.97 5.11 12,583
196 4.14 6.45 32,442 239 3.13 5.17 10668 196 7.36 6.45 32,442 239 5.84 5.17 10,668
197 4.13 6.42 36,379 240 2.95 4.43 9005 197 7.35 6.42 36,379 240 5.55 4.43 9,005
198 4.12 6.38 40,535 241 2.91 4.43 7465 198 7.38 6.38 40,535 241 5.48 4.43 7,465
199 4.13 6.35 44,764 242 2.84 4.41 6292 199 7.39 6.35 44,764 242 5.34 4.41 6,292
200 4.16 6.33 49,316 243 2.76 4.43 5259 200 7.45 6.33 49,316 243 5.19 4.43 5,259
201 4.18 6.31 54,192 244 2.70 4.36 4425 201 7.49 6.31 54,192 244 5.08 4.36 4,425
202 4.22 6.28 59,035 245 2.65 4.37 3,730 202 7.55 6.28 59,035 245 4.98 4.37 3,730
203 4.24 6.24 63,781 246 2.57 4.37 3,150 203 7.59 6.24 63,781 246 4.84 4.37 3,150
204 4.27 6.21 68,456 247 2.55 4.58 2,572 204 7.65 6.21 68,456 247 4.79 4.58 2,572
205 4.27 6.19 72,452 248 2.51 4.59 2,133 205 7.65 6.19 72,452 248 4.73 4.59 2,133
206 4.29 6.15 75,917 249 2.49 4.67 1,767 206 7.70 6.15 75,917 249 4.68 4.67 1,767
207 4.30 6.12 78,748 207 7.72 6.12 78,748
208 4.32 6.08 80,607 208 7.74 6.08 80,607
209 4.32 6.05 81,920 209 7.75 6.05 81,920
210 4.32 6.01 82,234 210 7.75 6.01 82,234
211 4.32 5.97 82,094 211 7.74 5.97 82,094
212 4.31 5.94 81,561 212 7.73 5.94 81,561
213 4.28 5.88 80,859 213 7.73 5.88 80,859
214 4.27 5.83 79,691 214 7.71 5.83 79,691
* Starting RIT score is always based on grade 5 performance.Shaded cells indicate that starting RIT was outside the percentile range of 1-99.
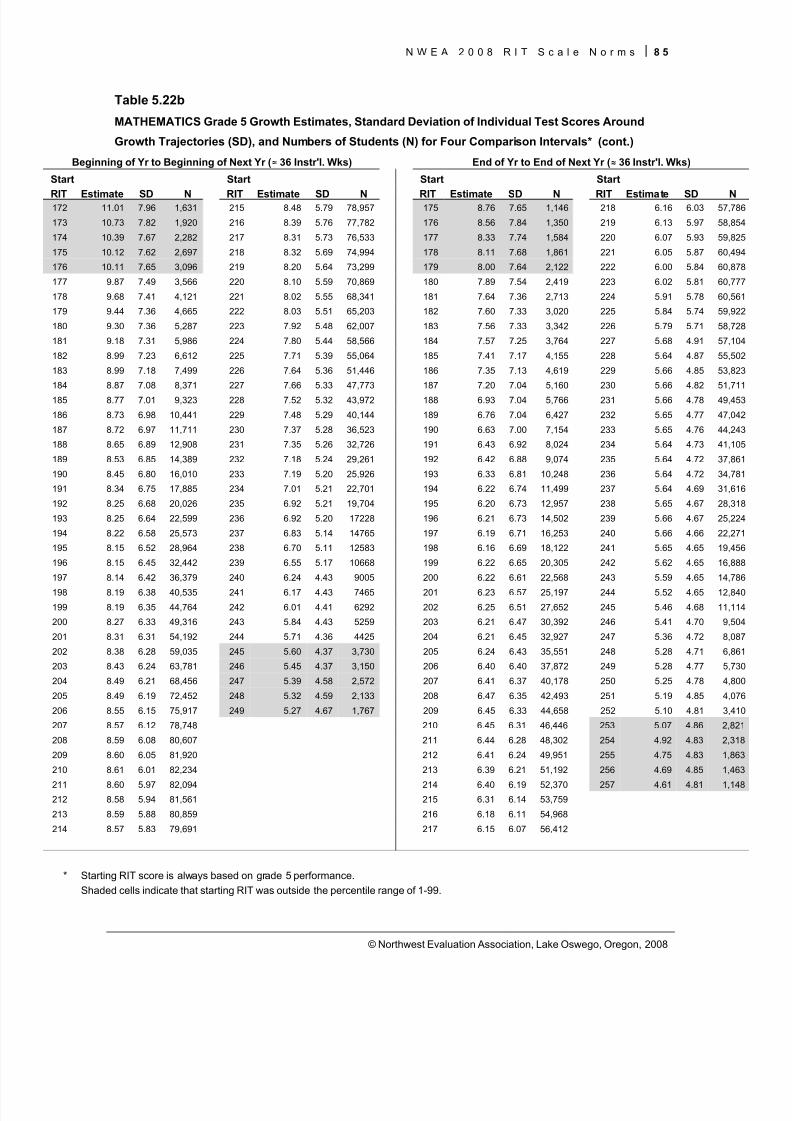
8/7/2019 NWEA Complete Norms2008
http://slidepdf.com/reader/full/nwea-complete-norms2008 95/170
N W E A 2 0 0 8 R I T S c a l e N o r m s 8 5
© Northwest Evaluation Association, Lake Oswego, Oregon, 2008
Table 5.22b
MATHEMATICS Grade 5 Growth Estimates, Standard Deviation of Individual Test Scores Around
Growth Trajectories (SD), and Numbers of Students (N) for Four Comparison Intervals* (cont.)
Beginning of Yr to Beginning of Next Yr ( ≈ 36 Instr'l. Wks) End of Yr to End of Next Yr ( ≈ 36 Instr'l. Wks)
Start Start Start Start
RIT Estimate SD N RIT Estimate SD N RIT Estimate SD N RIT Estimate SD N172 11.01 7.96 1,631 215 8.48 5.79 78,957 175 8.76 7.65 1,146 218 6.16 6.03 57,786
173 10.73 7.82 1,920 216 8.39 5.76 77,782 176 8.56 7.84 1,350 219 6.13 5.97 58,854
174 10.39 7.67 2,282 217 8.31 5.73 76,533 177 8.33 7.74 1,584 220 6.07 5.93 59,825
175 10.12 7.62 2,697 218 8.32 5.69 74,994 178 8.11 7.68 1,861 221 6.05 5.87 60,494
176 10.11 7.65 3,096 219 8.20 5.64 73,299 179 8.00 7.64 2,122 222 6.00 5.84 60,878
177 9.87 7.49 3,566 220 8.10 5.59 70,869 180 7.89 7.54 2,419 223 6.02 5.81 60,777
178 9.68 7.41 4,121 221 8.02 5.55 68,341 181 7.64 7.36 2,713 224 5.91 5.78 60,561
179 9.44 7.36 4,665 222 8.03 5.51 65,203 182 7.60 7.33 3,020 225 5.84 5.74 59,922
180 9.30 7.36 5,287 223 7.92 5.48 62,007 183 7.56 7.33 3,342 226 5.79 5.71 58,728
181 9.18 7.31 5,986 224 7.80 5.44 58,566 184 7.57 7.25 3,764 227 5.68 4.91 57,104
182 8.99 7.23 6,612 225 7.71 5.39 55,064 185 7.41 7.17 4,155 228 5.64 4.87 55,502
183 8.99 7.18 7,499 226 7.64 5.36 51,446 186 7.35 7.13 4,619 229 5.66 4.85 53,823
184 8.87 7.08 8,371 227 7.66 5.33 47,773 187 7.20 7.04 5,160 230 5.66 4.82 51,711
185 8.77 7.01 9,323 228 7.52 5.32 43,972 188 6.93 7.04 5,766 231 5.66 4.78 49,453
186 8.73 6.98 10,441 229 7.48 5.29 40,144 189 6.76 7.04 6,427 232 5.65 4.77 47,042
187 8.72 6.97 11,711 230 7.37 5.28 36,523 190 6.63 7.00 7,154 233 5.65 4.76 44,243
188 8.65 6.89 12,908 231 7.35 5.26 32,726 191 6.43 6.92 8,024 234 5.64 4.73 41,105
189 8.53 6.85 14,389 232 7.18 5.24 29,261 192 6.42 6.88 9,074 235 5.64 4.72 37,861
190 8.45 6.80 16,010 233 7.19 5.20 25,926 193 6.33 6.81 10,248 236 5.64 4.72 34,781
191 8.34 6.75 17,885 234 7.01 5.21 22,701 194 6.22 6.74 11,499 237 5.64 4.69 31,616
192 8.25 6.68 20,026 235 6.92 5.21 19,704 195 6.20 6.73 12,957 238 5.65 4.67 28,318
193 8.25 6.64 22,599 236 6.92 5.20 17228 196 6.21 6.73 14,502 239 5.66 4.67 25,224
194 8.22 6.58 25,573 237 6.83 5.14 14765 197 6.19 6.71 16,253 240 5.66 4.66 22,271
195 8.15 6.52 28,964 238 6.70 5.11 12583 198 6.16 6.69 18,122 241 5.65 4.65 19,456
196 8.15 6.45 32,442 239 6.55 5.17 10668 199 6.22 6.65 20,305 242 5.62 4.65 16,888
197 8.14 6.42 36,379 240 6.24 4.43 9005 200 6.22 6.61 22,568 243 5.59 4.65 14,786
198 8.19 6.38 40,535 241 6.17 4.43 7465 201 6.23 6.57 25,197 244 5.52 4.65 12,840
199 8.19 6.35 44,764 242 6.01 4.41 6292 202 6.25 6.51 27,652 245 5.46 4.68 11,114
200 8.27 6.33 49,316 243 5.84 4.43 5259 203 6.21 6.47 30,392 246 5.41 4.70 9,504
201 8.31 6.31 54,192 244 5.71 4.36 4425 204 6.21 6.45 32,927 247 5.36 4.72 8,087
202 8.38 6.28 59,035 245 5.60 4.37 3,730 205 6.24 6.43 35,551 248 5.28 4.71 6,861
203 8.43 6.24 63,781 246 5.45 4.37 3,150 206 6.40 6.40 37,872 249 5.28 4.77 5,730
204 8.49 6.21 68,456 247 5.39 4.58 2,572 207 6.41 6.37 40,178 250 5.25 4.78 4,800
205 8.49 6.19 72,452 248 5.32 4.59 2,133 208 6.47 6.35 42,493 251 5.19 4.85 4,076
206 8.55 6.15 75,917 249 5.27 4.67 1,767 209 6.45 6.33 44,658 252 5.10 4.81 3,410
207 8.57 6.12 78,748 210 6.45 6.31 46,446 253 5.07 4.86 2,821
208 8.59 6.08 80,607 211 6.44 6.28 48,302 254 4.92 4.83 2,318
209 8.60 6.05 81,920 212 6.41 6.24 49,951 255 4.75 4.83 1,863
210 8.61 6.01 82,234 213 6.39 6.21 51,192 256 4.69 4.85 1,463
211 8.60 5.97 82,094 214 6.40 6.19 52,370 257 4.61 4.81 1,148212 8.58 5.94 81,561 215 6.31 6.14 53,759
213 8.59 5.88 80,859 216 6.18 6.11 54,968
214 8.57 5.83 79,691 217 6.15 6.07 56,412
* Starting RIT score is always based on grade 5 performance.Shaded cells indicate that starting RIT was outside the percentile range of 1-99.

8/7/2019 NWEA Complete Norms2008
http://slidepdf.com/reader/full/nwea-complete-norms2008 96/170
8 6 | N W E A 2 0 0 8 R I T S c a l e N o r m s
© Northwest Evaluation Association, Lake Oswego, Oregon, 2008
Table 5.23a
MATHEMATICS Grade 6 Growth Estimates, Standard Deviation of Individual Test Scores Around
Growth Trajectories (SD), and Numbers of Students (N) for Four Comparison Intervals*
Beginning of Yr to Middle of Yr ( ≈ 17 Instr'l Wks) Beginning of Yr to End of Yr ( ≈ 32 Instr'l Wks)
Start Start Start Start
RIT Estimate SD N RIT Estimate SD N RIT Estimate SD N RIT Estimate SD N174 5.64 7.90 1,292 217 3.74 5.94 72,805 174 9.56 7.90 1,292 217 6.71 5.94 72,805
175 5.59 7.93 1,475 218 3.71 5.90 74,654 175 9.47 7.93 1,475 218 6.64 5.90 74,654
176 5.48 7.87 1,721 219 3.68 5.84 76,373 176 9.31 7.87 1,721 219 6.59 5.84 76,373
177 5.37 7.71 2,018 220 3.66 5.78 77,388 177 9.15 7.71 2,018 220 6.59 5.78 77,388
178 5.30 7.55 2,314 221 3.65 5.74 78,118 178 9.11 7.55 2,314 221 6.59 5.74 78,118
179 5.17 7.42 2,645 222 3.63 5.63 78,419 179 8.88 7.42 2,645 222 6.54 5.63 78,419
180 5.07 7.34 3,036 223 3.60 5.57 78,329 180 8.73 7.34 3,036 223 6.50 5.57 78,329
181 4.87 7.23 3,444 224 3.59 5.51 77,245 181 8.39 7.23 3,444 224 6.48 5.51 77,245
182 4.72 7.25 3,881 225 3.56 5.51 76,064 182 8.17 7.25 3,881 225 6.47 5.51 76,064
183 4.63 7.30 4,335 226 3.55 5.44 74,262 183 8.00 7.30 4,335 226 6.44 5.44 74,262
184 4.57 7.22 4,835 227 3.51 5.42 71,813 184 7.94 7.22 4,835 227 6.37 5.42 71,813
185 4.55 7.19 5,389 228 3.46 5.39 69,191 185 7.94 7.19 5,389 228 6.27 5.39 69,191
186 4.55 7.08 6,005 229 3.44 5.36 66,991 186 7.93 7.08 6,005 229 6.23 5.36 66,991
187 4.50 7.04 6,668 230 3.41 5.25 64,160 187 7.85 7.04 6,668 230 6.23 5.25 64,160
188 4.38 6.93 7,451 231 3.38 5.23 61,251 188 7.62 6.93 7,451 231 6.17 5.23 61,251
189 4.37 6.89 8,251 232 3.33 5.19 58,116 189 7.59 6.89 8,251 232 6.08 5.19 58,116
190 4.31 6.84 9,251 233 3.31 5.15 54,469 190 7.54 6.84 9,251 233 6.04 5.15 54,469
191 4.21 6.82 10,404 234 3.27 5.13 50,759 191 7.34 6.82 10,404 234 6.01 5.13 50,759
192 4.14 6.78 11,635 235 3.20 5.12 46,897 192 7.26 6.78 11,635 235 5.88 5.12 46,897
193 4.11 6.77 12,982 236 3.16 5.09 42,730 193 7.22 6.77 12,982 236 5.80 5.09 42,730
194 4.04 6.75 14,587 237 3.12 5.05 38,877 194 7.12 6.75 14,587 237 5.79 5.05 38,877
195 3.98 6.69 16,308 238 3.08 5.02 35353 195 7.02 6.69 16,308 238 5.70 5.02 35,353
196 3.96 6.67 18,058 239 3.01 5.01 31466 196 6.98 6.67 18,058 239 5.56 5.01 31,466
197 3.96 6.64 20,038 240 2.95 4.96 27855 197 6.98 6.64 20,038 240 5.51 4.96 27,855
198 3.96 6.63 22,365 241 2.87 4.94 24682 198 6.98 6.63 22,365 241 5.36 4.94 24,682
199 3.94 6.70 24,785 242 2.71 4.17 21583 199 6.97 6.70 24,785 242 5.11 4.17 21,583
200 3.94 6.67 27,155 243 2.70 4.13 18674 200 6.96 6.67 27,155 243 5.09 4.13 18,674
201 3.92 6.61 29,949 244 2.69 4.13 16180 201 6.93 6.61 29,949 244 5.06 4.13 16,180
202 3.91 6.58 32,710 245 2.67 4.12 13931 202 6.92 6.58 32,710 245 5.02 4.12 13,931
203 3.89 6.54 35,484 246 2.66 4.10 11835 203 6.89 6.54 35,484 246 5.01 4.10 11,835
204 3.89 6.43 38,595 247 2.63 4.14 10089 204 6.90 6.43 38,595 247 4.95 4.14 10,089
205 3.88 6.38 41,587 248 2.59 4.15 8549 205 6.88 6.38 41,587 248 4.88 4.15 8,549
206 3.91 6.34 44,416 249 2.56 4.14 7130 206 6.93 6.34 44,416 249 4.81 4.14 7,130
207 3.91 6.29 47,584 250 2.52 4.22 6000 207 6.97 6.29 47,584 250 4.75 4.22 6,000
208 3.88 6.26 50,288 251 2.50 4.29 5,076 208 6.92 6.26 50,288 251 4.70 4.29 5,076
209 3.85 6.23 52,797 252 2.49 4.28 4,146 209 6.87 6.23 52,797 252 4.68 4.28 4,146
210 3.84 6.21 55,392 253 2.49 4.31 3,422 210 6.85 6.21 55,392 253 4.68 4.31 3,422
211 3.82 6.18 57,907 254 2.47 4.34 2,777 211 6.81 6.18 57,907 254 4.65 4.34 2,777
212 3.80 6.13 60,175 255 2.44 4.26 2,240 212 6.77 6.13 60,175 255 4.59 4.26 2,240
213 3.82 6.07 62,870 213 6.86 6.07 62,870214 3.81 6.03 65,260 214 6.84 6.03 65,260
215 3.78 5.98 67,922 215 6.77 5.98 67,922
216 3.77 5.94 70,424 216 6.75 5.94 70,424
* Starting RIT score is always based on grade 6 performance.Shaded cells indicate that starting RIT was outside the percentile range of 1-99.
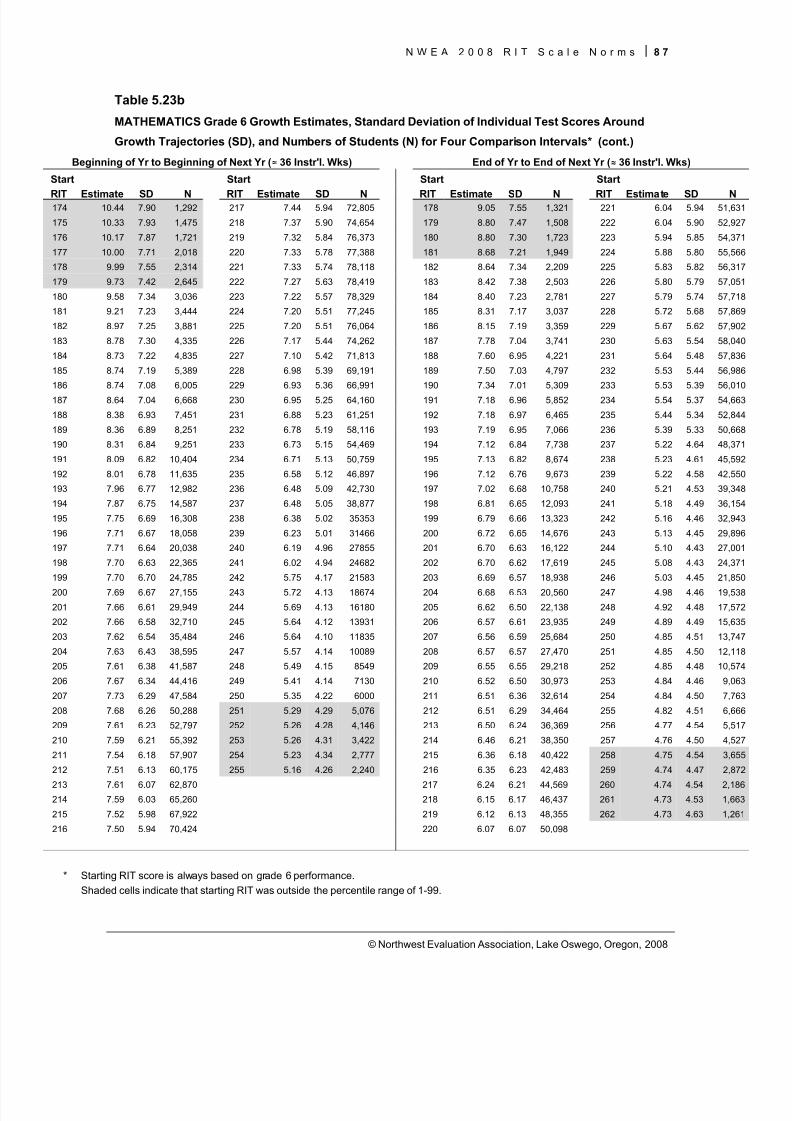
8/7/2019 NWEA Complete Norms2008
http://slidepdf.com/reader/full/nwea-complete-norms2008 97/170
N W E A 2 0 0 8 R I T S c a l e N o r m s 8 7
© Northwest Evaluation Association, Lake Oswego, Oregon, 2008
Table 5.23b
MATHEMATICS Grade 6 Growth Estimates, Standard Deviation of Individual Test Scores Around
Growth Trajectories (SD), and Numbers of Students (N) for Four Comparison Intervals* (cont.)
Beginning of Yr to Beginning of Next Yr ( ≈ 36 Instr'l. Wks) End of Yr to End of Next Yr ( ≈ 36 Instr'l. Wks)
Start Start Start Start
RIT Estimate SD N RIT Estimate SD N RIT Estimate SD N RIT Estimate SD N174 10.44 7.90 1,292 217 7.44 5.94 72,805 178 9.05 7.55 1,321 221 6.04 5.94 51,631
175 10.33 7.93 1,475 218 7.37 5.90 74,654 179 8.80 7.47 1,508 222 6.04 5.90 52,927
176 10.17 7.87 1,721 219 7.32 5.84 76,373 180 8.80 7.30 1,723 223 5.94 5.85 54,371
177 10.00 7.71 2,018 220 7.33 5.78 77,388 181 8.68 7.21 1,949 224 5.88 5.80 55,566
178 9.99 7.55 2,314 221 7.33 5.74 78,118 182 8.64 7.34 2,209 225 5.83 5.82 56,317
179 9.73 7.42 2,645 222 7.27 5.63 78,419 183 8.42 7.38 2,503 226 5.80 5.79 57,051
180 9.58 7.34 3,036 223 7.22 5.57 78,329 184 8.40 7.23 2,781 227 5.79 5.74 57,718
181 9.21 7.23 3,444 224 7.20 5.51 77,245 185 8.31 7.17 3,037 228 5.72 5.68 57,869
182 8.97 7.25 3,881 225 7.20 5.51 76,064 186 8.15 7.19 3,359 229 5.67 5.62 57,902
183 8.78 7.30 4,335 226 7.17 5.44 74,262 187 7.78 7.04 3,741 230 5.63 5.54 58,040
184 8.73 7.22 4,835 227 7.10 5.42 71,813 188 7.60 6.95 4,221 231 5.64 5.48 57,836
185 8.74 7.19 5,389 228 6.98 5.39 69,191 189 7.50 7.03 4,797 232 5.53 5.44 56,986
186 8.74 7.08 6,005 229 6.93 5.36 66,991 190 7.34 7.01 5,309 233 5.53 5.39 56,010
187 8.64 7.04 6,668 230 6.95 5.25 64,160 191 7.18 6.96 5,852 234 5.54 5.37 54,663
188 8.38 6.93 7,451 231 6.88 5.23 61,251 192 7.18 6.97 6,465 235 5.44 5.34 52,844
189 8.36 6.89 8,251 232 6.78 5.19 58,116 193 7.19 6.95 7,066 236 5.39 5.33 50,668
190 8.31 6.84 9,251 233 6.73 5.15 54,469 194 7.12 6.84 7,738 237 5.22 4.64 48,371
191 8.09 6.82 10,404 234 6.71 5.13 50,759 195 7.13 6.82 8,674 238 5.23 4.61 45,592
192 8.01 6.78 11,635 235 6.58 5.12 46,897 196 7.12 6.76 9,673 239 5.22 4.58 42,550
193 7.96 6.77 12,982 236 6.48 5.09 42,730 197 7.02 6.68 10,758 240 5.21 4.53 39,348
194 7.87 6.75 14,587 237 6.48 5.05 38,877 198 6.81 6.65 12,093 241 5.18 4.49 36,154
195 7.75 6.69 16,308 238 6.38 5.02 35353 199 6.79 6.66 13,323 242 5.16 4.46 32,943
196 7.71 6.67 18,058 239 6.23 5.01 31466 200 6.72 6.65 14,676 243 5.13 4.45 29,896
197 7.71 6.64 20,038 240 6.19 4.96 27855 201 6.70 6.63 16,122 244 5.10 4.43 27,001
198 7.70 6.63 22,365 241 6.02 4.94 24682 202 6.70 6.62 17,619 245 5.08 4.43 24,371
199 7.70 6.70 24,785 242 5.75 4.17 21583 203 6.69 6.57 18,938 246 5.03 4.45 21,850
200 7.69 6.67 27,155 243 5.72 4.13 18674 204 6.68 6.53 20,560 247 4.98 4.46 19,538
201 7.66 6.61 29,949 244 5.69 4.13 16180 205 6.62 6.50 22,138 248 4.92 4.48 17,572
202 7.66 6.58 32,710 245 5.64 4.12 13931 206 6.57 6.61 23,935 249 4.89 4.49 15,635
203 7.62 6.54 35,484 246 5.64 4.10 11835 207 6.56 6.59 25,684 250 4.85 4.51 13,747
204 7.63 6.43 38,595 247 5.57 4.14 10089 208 6.57 6.57 27,470 251 4.85 4.50 12,118
205 7.61 6.38 41,587 248 5.49 4.15 8549 209 6.55 6.55 29,218 252 4.85 4.48 10,574
206 7.67 6.34 44,416 249 5.41 4.14 7130 210 6.52 6.50 30,973 253 4.84 4.46 9,063
207 7.73 6.29 47,584 250 5.35 4.22 6000 211 6.51 6.36 32,614 254 4.84 4.50 7,763
208 7.68 6.26 50,288 251 5.29 4.29 5,076 212 6.51 6.29 34,464 255 4.82 4.51 6,666
209 7.61 6.23 52,797 252 5.26 4.28 4,146 213 6.50 6.24 36,369 256 4.77 4.54 5,517
210 7.59 6.21 55,392 253 5.26 4.31 3,422 214 6.46 6.21 38,350 257 4.76 4.50 4,527
211 7.54 6.18 57,907 254 5.23 4.34 2,777 215 6.36 6.18 40,422 258 4.75 4.54 3,655
212 7.51 6.13 60,175 255 5.16 4.26 2,240 216 6.35 6.23 42,483 259 4.74 4.47 2,872
213 7.61 6.07 62,870 217 6.24 6.21 44,569 260 4.74 4.54 2,186214 7.59 6.03 65,260 218 6.15 6.17 46,437 261 4.73 4.53 1,663
215 7.52 5.98 67,922 219 6.12 6.13 48,355 262 4.73 4.63 1,261
216 7.50 5.94 70,424 220 6.07 6.07 50,098
* Starting RIT score is always based on grade 6 performance.Shaded cells indicate that starting RIT was outside the percentile range of 1-99.
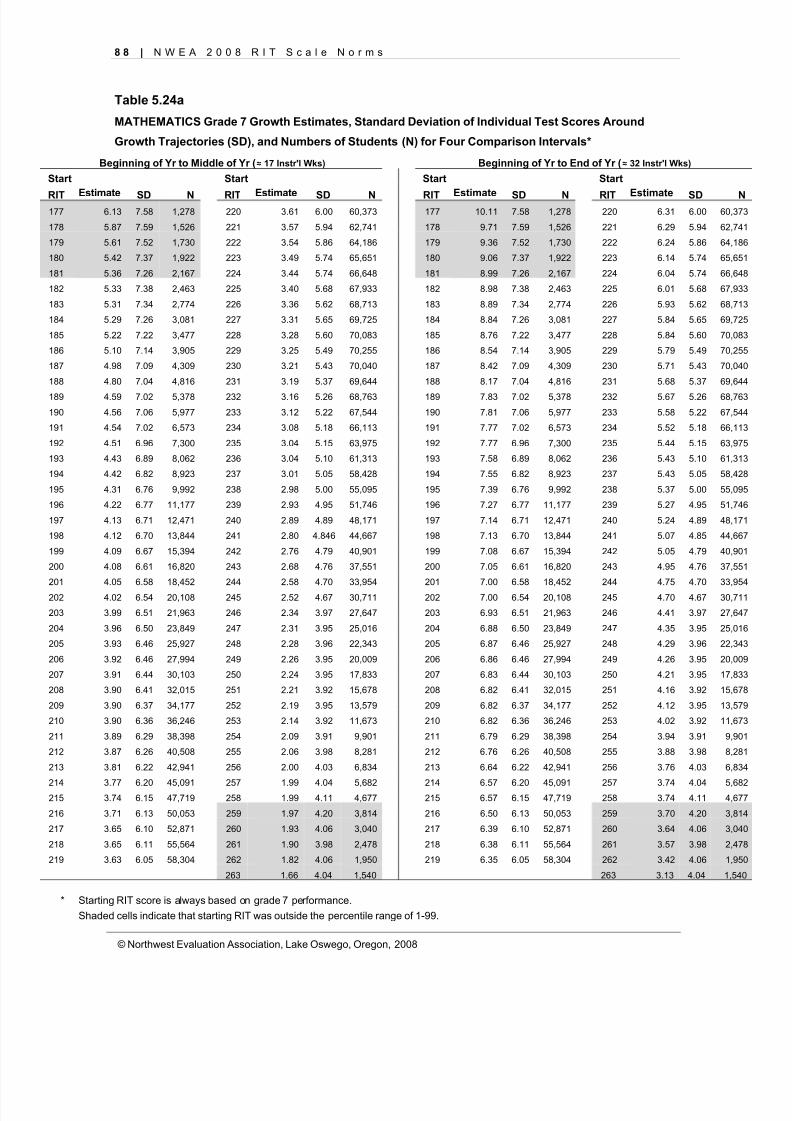
8/7/2019 NWEA Complete Norms2008
http://slidepdf.com/reader/full/nwea-complete-norms2008 98/170
8 8 | N W E A 2 0 0 8 R I T S c a l e N o r m s
© Northwest Evaluation Association, Lake Oswego, Oregon, 2008
Table 5.24a
MATHEMATICS Grade 7 Growth Estimates, Standard Deviation of Individual Test Scores Around
Growth Trajectories (SD), and Numbers of Students (N) for Four Comparison Intervals*
Beginning of Yr to Middle of Yr ( ≈ 17 Instr'l Wks) Beginning of Yr to End of Yr ( ≈ 32 Instr'l Wks) Start Start Start Start
RIT Estimate SD N RIT Estimate SD N RIT Estimate SD N RIT Estimate SD N177 6.13 7.58 1,278 220 3.61 6.00 60,373 177 10.11 7.58 1,278 220 6.31 6.00 60,373
178 5.87 7.59 1,526 221 3.57 5.94 62,741 178 9.71 7.59 1,526 221 6.29 5.94 62,741
179 5.61 7.52 1,730 222 3.54 5.86 64,186 179 9.36 7.52 1,730 222 6.24 5.86 64,186
180 5.42 7.37 1,922 223 3.49 5.74 65,651 180 9.06 7.37 1,922 223 6.14 5.74 65,651
181 5.36 7.26 2,167 224 3.44 5.74 66,648 181 8.99 7.26 2,167 224 6.04 5.74 66,648
182 5.33 7.38 2,463 225 3.40 5.68 67,933 182 8.98 7.38 2,463 225 6.01 5.68 67,933
183 5.31 7.34 2,774 226 3.36 5.62 68,713 183 8.89 7.34 2,774 226 5.93 5.62 68,713
184 5.29 7.26 3,081 227 3.31 5.65 69,725 184 8.84 7.26 3,081 227 5.84 5.65 69,725
185 5.22 7.22 3,477 228 3.28 5.60 70,083 185 8.76 7.22 3,477 228 5.84 5.60 70,083
186 5.10 7.14 3,905 229 3.25 5.49 70,255 186 8.54 7.14 3,905 229 5.79 5.49 70,255
187 4.98 7.09 4,309 230 3.21 5.43 70,040 187 8.42 7.09 4,309 230 5.71 5.43 70,040
188 4.80 7.04 4,816 231 3.19 5.37 69,644 188 8.17 7.04 4,816 231 5.68 5.37 69,644
189 4.59 7.02 5,378 232 3.16 5.26 68,763 189 7.83 7.02 5,378 232 5.67 5.26 68,763
190 4.56 7.06 5,977 233 3.12 5.22 67,544 190 7.81 7.06 5,977 233 5.58 5.22 67,544
191 4.54 7.02 6,573 234 3.08 5.18 66,113 191 7.77 7.02 6,573 234 5.52 5.18 66,113
192 4.51 6.96 7,300 235 3.04 5.15 63,975 192 7.77 6.96 7,300 235 5.44 5.15 63,975
193 4.43 6.89 8,062 236 3.04 5.10 61,313 193 7.58 6.89 8,062 236 5.43 5.10 61,313
194 4.42 6.82 8,923 237 3.01 5.05 58,428 194 7.55 6.82 8,923 237 5.43 5.05 58,428
195 4.31 6.76 9,992 238 2.98 5.00 55,095 195 7.39 6.76 9,992 238 5.37 5.00 55,095
196 4.22 6.77 11,177 239 2.93 4.95 51,746 196 7.27 6.77 11,177 239 5.27 4.95 51,746
197 4.13 6.71 12,471 240 2.89 4.89 48,171 197 7.14 6.71 12,471 240 5.24 4.89 48,171
198 4.12 6.70 13,844 241 2.80 4.846 44,667 198 7.13 6.70 13,844 241 5.07 4.85 44,667
199 4.09 6.67 15,394 242 2.76 4.79 40,901 199 7.08 6.67 15,394 242 5.05 4.79 40,901
200 4.08 6.61 16,820 243 2.68 4.76 37,551 200 7.05 6.61 16,820 243 4.95 4.76 37,551
201 4.05 6.58 18,452 244 2.58 4.70 33,954 201 7.00 6.58 18,452 244 4.75 4.70 33,954
202 4.02 6.54 20,108 245 2.52 4.67 30,711 202 7.00 6.54 20,108 245 4.70 4.67 30,711
203 3.99 6.51 21,963 246 2.34 3.97 27,647 203 6.93 6.51 21,963 246 4.41 3.97 27,647
204 3.96 6.50 23,849 247 2.31 3.95 25,016 204 6.88 6.50 23,849 247 4.35 3.95 25,016
205 3.93 6.46 25,927 248 2.28 3.96 22,343 205 6.87 6.46 25,927 248 4.29 3.96 22,343
206 3.92 6.46 27,994 249 2.26 3.95 20,009 206 6.86 6.46 27,994 249 4.26 3.95 20,009
207 3.91 6.44 30,103 250 2.24 3.95 17,833 207 6.83 6.44 30,103 250 4.21 3.95 17,833
208 3.90 6.41 32,015 251 2.21 3.92 15,678 208 6.82 6.41 32,015 251 4.16 3.92 15,678
209 3.90 6.37 34,177 252 2.19 3.95 13,579 209 6.82 6.37 34,177 252 4.12 3.95 13,579
210 3.90 6.36 36,246 253 2.14 3.92 11,673 210 6.82 6.36 36,246 253 4.02 3.92 11,673
211 3.89 6.29 38,398 254 2.09 3.91 9,901 211 6.79 6.29 38,398 254 3.94 3.91 9,901
212 3.87 6.26 40,508 255 2.06 3.98 8,281 212 6.76 6.26 40,508 255 3.88 3.98 8,281
213 3.81 6.22 42,941 256 2.00 4.03 6,834 213 6.64 6.22 42,941 256 3.76 4.03 6,834
214 3.77 6.20 45,091 257 1.99 4.04 5,682 214 6.57 6.20 45,091 257 3.74 4.04 5,682215 3.74 6.15 47,719 258 1.99 4.11 4,677 215 6.57 6.15 47,719 258 3.74 4.11 4,677
216 3.71 6.13 50,053 259 1.97 4.20 3,814 216 6.50 6.13 50,053 259 3.70 4.20 3,814
217 3.65 6.10 52,871 260 1.93 4.06 3,040 217 6.39 6.10 52,871 260 3.64 4.06 3,040
218 3.65 6.11 55,564 261 1.90 3.98 2,478 218 6.38 6.11 55,564 261 3.57 3.98 2,478
219 3.63 6.05 58,304 262 1.82 4.06 1,950 219 6.35 6.05 58,304 262 3.42 4.06 1,950
263 1.66 4.04 1,540 263 3.13 4.04 1,540
* Starting RIT score is always based on grade 7 performance.Shaded cells indicate that starting RIT was outside the percentile range of 1-99.
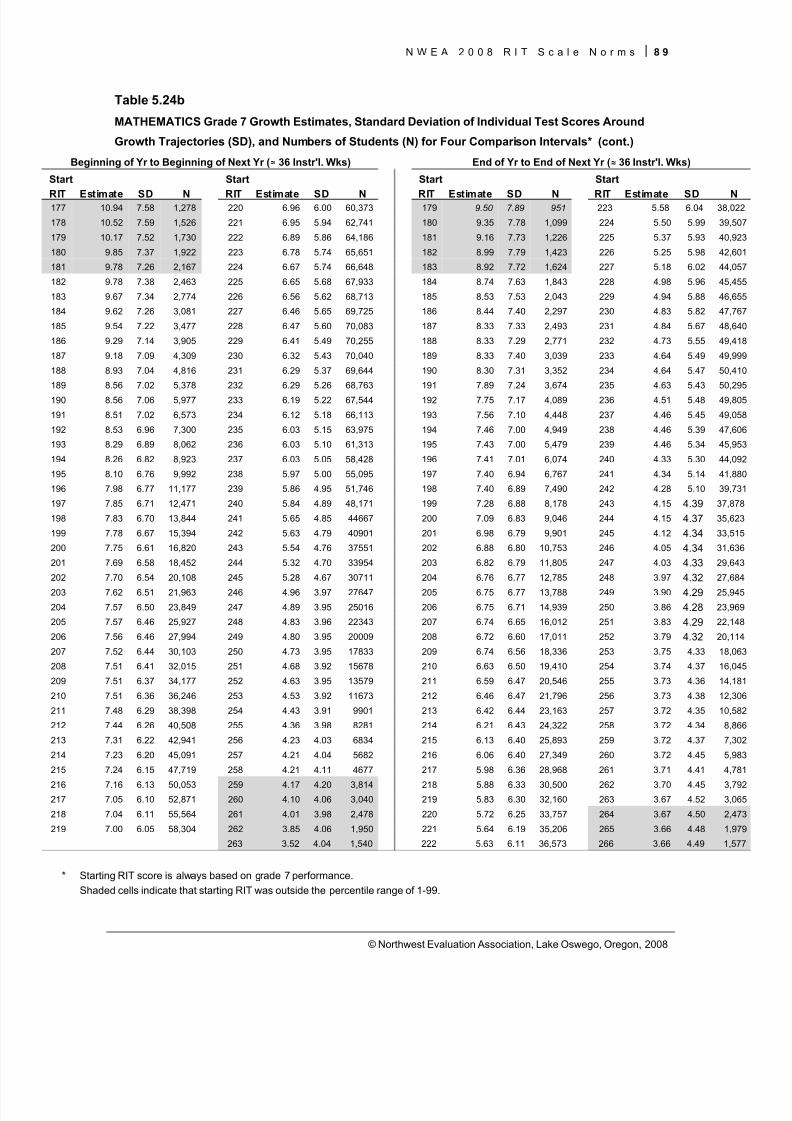
8/7/2019 NWEA Complete Norms2008
http://slidepdf.com/reader/full/nwea-complete-norms2008 99/170
N W E A 2 0 0 8 R I T S c a l e N o r m s 8 9
© Northwest Evaluation Association, Lake Oswego, Oregon, 2008
Table 5.24b
MATHEMATICS Grade 7 Growth Estimates, Standard Deviation of Individual Test Scores Around
Growth Trajectories (SD), and Numbers of Students (N) for Four Comparison Intervals* (cont.)
Beginning of Yr to Beginning of Next Yr ( ≈ 36 Instr'l. Wks) End of Yr to End of Next Yr ( ≈ 36 Instr'l. Wks)
Start Start Start Start
RIT Estimate SD N RIT Estimate SD N RIT Estimate SD N RIT Estimate SD N177 10.94 7.58 1,278 220 6.96 6.00 60,373 179 9.50 7.89 951 223 5.58 6.04 38,022
178 10.52 7.59 1,526 221 6.95 5.94 62,741 180 9.35 7.78 1,099 224 5.50 5.99 39,507
179 10.17 7.52 1,730 222 6.89 5.86 64,186 181 9.16 7.73 1,226 225 5.37 5.93 40,923
180 9.85 7.37 1,922 223 6.78 5.74 65,651 182 8.99 7.79 1,423 226 5.25 5.98 42,601
181 9.78 7.26 2,167 224 6.67 5.74 66,648 183 8.92 7.72 1,624 227 5.18 6.02 44,057
182 9.78 7.38 2,463 225 6.65 5.68 67,933 184 8.74 7.63 1,843 228 4.98 5.96 45,455
183 9.67 7.34 2,774 226 6.56 5.62 68,713 185 8.53 7.53 2,043 229 4.94 5.88 46,655
184 9.62 7.26 3,081 227 6.46 5.65 69,725 186 8.44 7.40 2,297 230 4.83 5.82 47,767
185 9.54 7.22 3,477 228 6.47 5.60 70,083 187 8.33 7.33 2,493 231 4.84 5.67 48,640
186 9.29 7.14 3,905 229 6.41 5.49 70,255 188 8.33 7.29 2,771 232 4.73 5.55 49,418
187 9.18 7.09 4,309 230 6.32 5.43 70,040 189 8.33 7.40 3,039 233 4.64 5.49 49,999
188 8.93 7.04 4,816 231 6.29 5.37 69,644 190 8.30 7.31 3,352 234 4.64 5.47 50,410
189 8.56 7.02 5,378 232 6.29 5.26 68,763 191 7.89 7.24 3,674 235 4.63 5.43 50,295
190 8.56 7.06 5,977 233 6.19 5.22 67,544 192 7.75 7.17 4,089 236 4.51 5.48 49,805
191 8.51 7.02 6,573 234 6.12 5.18 66,113 193 7.56 7.10 4,448 237 4.46 5.45 49,058
192 8.53 6.96 7,300 235 6.03 5.15 63,975 194 7.46 7.00 4,949 238 4.46 5.39 47,606
193 8.29 6.89 8,062 236 6.03 5.10 61,313 195 7.43 7.00 5,479 239 4.46 5.34 45,953
194 8.26 6.82 8,923 237 6.03 5.05 58,428 196 7.41 7.01 6,074 240 4.33 5.30 44,092
195 8.10 6.76 9,992 238 5.97 5.00 55,095 197 7.40 6.94 6,767 241 4.34 5.14 41,880
196 7.98 6.77 11,177 239 5.86 4.95 51,746 198 7.40 6.89 7,490 242 4.28 5.10 39,731
197 7.85 6.71 12,471 240 5.84 4.89 48,171 199 7.28 6.88 8,178 243 4.15 4.39 37,878
198 7.83 6.70 13,844 241 5.65 4.85 44667 200 7.09 6.83 9,046 244 4.15 4.37 35,623
199 7.78 6.67 15,394 242 5.63 4.79 40901 201 6.98 6.79 9,901 245 4.12 4.34 33,515
200 7.75 6.61 16,820 243 5.54 4.76 37551 202 6.88 6.80 10,753 246 4.05 4.34 31,636
201 7.69 6.58 18,452 244 5.32 4.70 33954 203 6.82 6.79 11,805 247 4.03 4.33 29,643
202 7.70 6.54 20,108 245 5.28 4.67 30711 204 6.76 6.77 12,785 248 3.97 4.32 27,684
203 7.62 6.51 21,963 246 4.96 3.97 27647 205 6.75 6.77 13,788 249 3.90 4.29 25,945
204 7.57 6.50 23,849 247 4.89 3.95 25016 206 6.75 6.71 14,939 250 3.86 4.28 23,969
205 7.57 6.46 25,927 248 4.83 3.96 22343 207 6.74 6.65 16,012 251 3.83 4.29 22,148
206 7.56 6.46 27,994 249 4.80 3.95 20009 208 6.72 6.60 17,011 252 3.79 4.32 20,114
207 7.52 6.44 30,103 250 4.73 3.95 17833 209 6.74 6.56 18,336 253 3.75 4.33 18,063
208 7.51 6.41 32,015 251 4.68 3.92 15678 210 6.63 6.50 19,410 254 3.74 4.37 16,045
209 7.51 6.37 34,177 252 4.63 3.95 13579 211 6.59 6.47 20,546 255 3.73 4.36 14,181
210 7.51 6.36 36,246 253 4.53 3.92 11673 212 6.46 6.47 21,796 256 3.73 4.38 12,306
211 7.48 6.29 38,398 254 4.43 3.91 9901 213 6.42 6.44 23,163 257 3.72 4.35 10,582
212 7.44 6.26 40,508 255 4.36 3.98 8281 214 6.21 6.43 24,322 258 3.72 4.34 8,866
213 7.31 6.22 42,941 256 4.23 4.03 6834 215 6.13 6.40 25,893 259 3.72 4.37 7,302
214 7.23 6.20 45,091 257 4.21 4.04 5682 216 6.06 6.40 27,349 260 3.72 4.45 5,983
215 7.24 6.15 47,719 258 4.21 4.11 4677 217 5.98 6.36 28,968 261 3.71 4.41 4,781
216 7.16 6.13 50,053 259 4.17 4.20 3,814 218 5.88 6.33 30,500 262 3.70 4.45 3,792217 7.05 6.10 52,871 260 4.10 4.06 3,040 219 5.83 6.30 32,160 263 3.67 4.52 3,065
218 7.04 6.11 55,564 261 4.01 3.98 2,478 220 5.72 6.25 33,757 264 3.67 4.50 2,473
219 7.00 6.05 58,304 262 3.85 4.06 1,950 221 5.64 6.19 35,206 265 3.66 4.48 1,979
263 3.52 4.04 1,540 222 5.63 6.11 36,573 266 3.66 4.49 1,577
* Starting RIT score is always based on grade 7 performance.Shaded cells indicate that starting RIT was outside the percentile range of 1-99.
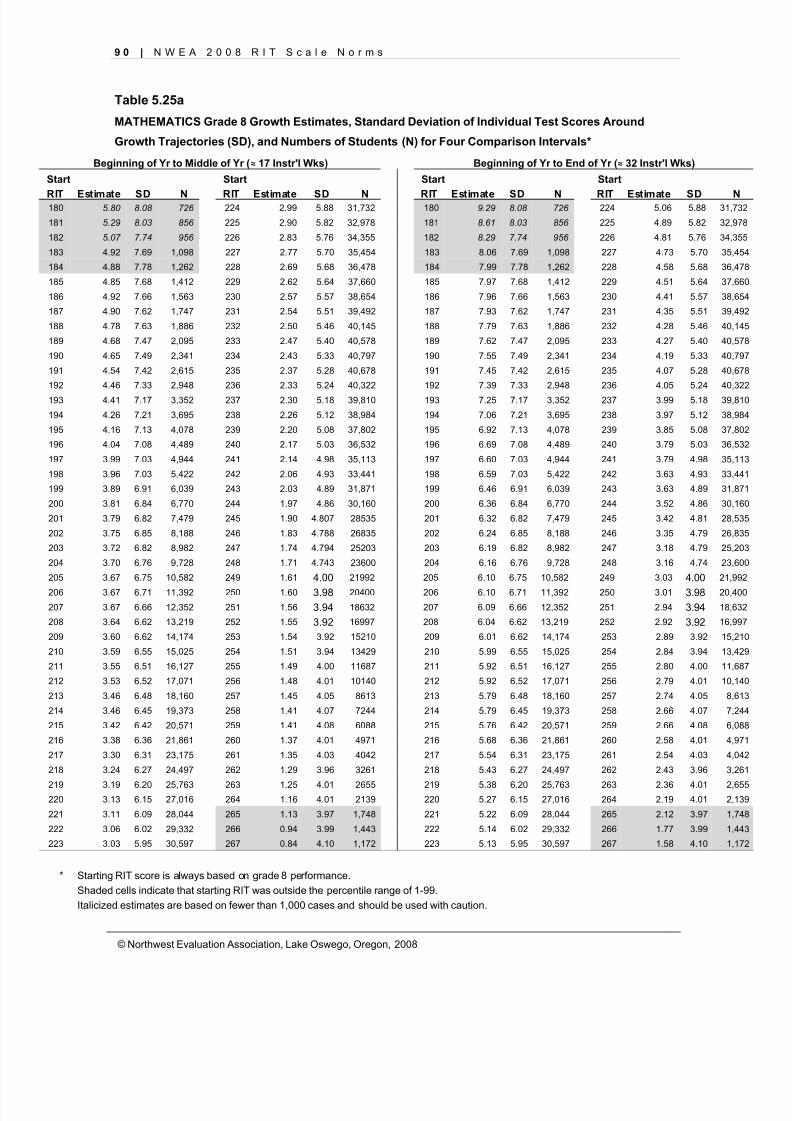
8/7/2019 NWEA Complete Norms2008
http://slidepdf.com/reader/full/nwea-complete-norms2008 100/170
9 0 | N W E A 2 0 0 8 R I T S c a l e N o r m s
© Northwest Evaluation Association, Lake Oswego, Oregon, 2008
Table 5.25a
MATHEMATICS Grade 8 Growth Estimates, Standard Deviation of Individual Test Scores Around
Growth Trajectories (SD), and Numbers of Students (N) for Four Comparison Intervals*
Beginning of Yr to Middle of Yr ( ≈ 17 Instr'l Wks) Beginning of Yr to End of Yr ( ≈ 32 Instr'l Wks)
Start Start Start Start
RIT Estimate SD N RIT Estimate SD N RIT Estimate SD N RIT Estimate SD N180 5.80 8.08 726 224 2.99 5.88 31,732 180 9.29 8.08 726 224 5.06 5.88 31,732
181 5.29 8.03 856 225 2.90 5.82 32,978 181 8.61 8.03 856 225 4.89 5.82 32,978
182 5.07 7.74 956 226 2.83 5.76 34,355 182 8.29 7.74 956 226 4.81 5.76 34,355
183 4.92 7.69 1,098 227 2.77 5.70 35,454 183 8.06 7.69 1,098 227 4.73 5.70 35,454
184 4.88 7.78 1,262 228 2.69 5.68 36,478 184 7.99 7.78 1,262 228 4.58 5.68 36,478
185 4.85 7.68 1,412 229 2.62 5.64 37,660 185 7.97 7.68 1,412 229 4.51 5.64 37,660
186 4.92 7.66 1,563 230 2.57 5.57 38,654 186 7.96 7.66 1,563 230 4.41 5.57 38,654
187 4.90 7.62 1,747 231 2.54 5.51 39,492 187 7.93 7.62 1,747 231 4.35 5.51 39,492
188 4.78 7.63 1,886 232 2.50 5.46 40,145 188 7.79 7.63 1,886 232 4.28 5.46 40,145
189 4.68 7.47 2,095 233 2.47 5.40 40,578 189 7.62 7.47 2,095 233 4.27 5.40 40,578
190 4.65 7.49 2,341 234 2.43 5.33 40,797 190 7.55 7.49 2,341 234 4.19 5.33 40,797
191 4.54 7.42 2,615 235 2.37 5.28 40,678 191 7.45 7.42 2,615 235 4.07 5.28 40,678
192 4.46 7.33 2,948 236 2.33 5.24 40,322 192 7.39 7.33 2,948 236 4.05 5.24 40,322
193 4.41 7.17 3,352 237 2.30 5.18 39,810 193 7.25 7.17 3,352 237 3.99 5.18 39,810
194 4.26 7.21 3,695 238 2.26 5.12 38,984 194 7.06 7.21 3,695 238 3.97 5.12 38,984
195 4.16 7.13 4,078 239 2.20 5.08 37,802 195 6.92 7.13 4,078 239 3.85 5.08 37,802
196 4.04 7.08 4,489 240 2.17 5.03 36,532 196 6.69 7.08 4,489 240 3.79 5.03 36,532
197 3.99 7.03 4,944 241 2.14 4.98 35,113 197 6.60 7.03 4,944 241 3.79 4.98 35,113
198 3.96 7.03 5,422 242 2.06 4.93 33,441 198 6.59 7.03 5,422 242 3.63 4.93 33,441
199 3.89 6.91 6,039 243 2.03 4.89 31,871 199 6.46 6.91 6,039 243 3.63 4.89 31,871
200 3.81 6.84 6,770 244 1.97 4.86 30,160 200 6.36 6.84 6,770 244 3.52 4.86 30,160
201 3.79 6.82 7,479 245 1.90 4.807 28535 201 6.32 6.82 7,479 245 3.42 4.81 28,535
202 3.75 6.85 8,188 246 1.83 4.788 26835 202 6.24 6.85 8,188 246 3.35 4.79 26,835
203 3.72 6.82 8,982 247 1.74 4.794 25203 203 6.19 6.82 8,982 247 3.18 4.79 25,203
204 3.70 6.76 9,728 248 1.71 4.743 23600 204 6.16 6.76 9,728 248 3.16 4.74 23,600
205 3.67 6.75 10,582 249 1.61 4.00 21992 205 6.10 6.75 10,582 249 3.03 4.00 21,992
206 3.67 6.71 11,392 250 1.60 3.98 20400 206 6.10 6.71 11,392 250 3.01 3.98 20,400
207 3.67 6.66 12,352 251 1.56 3.94 18632 207 6.09 6.66 12,352 251 2.94 3.94 18,632
208 3.64 6.62 13,219 252 1.55 3.92 16997 208 6.04 6.62 13,219 252 2.92 3.92 16,997
209 3.60 6.62 14,174 253 1.54 3.92 15210 209 6.01 6.62 14,174 253 2.89 3.92 15,210
210 3.59 6.55 15,025 254 1.51 3.94 13429 210 5.99 6.55 15,025 254 2.84 3.94 13,429
211 3.55 6.51 16,127 255 1.49 4.00 11687 211 5.92 6.51 16,127 255 2.80 4.00 11,687
212 3.53 6.52 17,071 256 1.48 4.01 10140 212 5.92 6.52 17,071 256 2.79 4.01 10,140
213 3.46 6.48 18,160 257 1.45 4.05 8613 213 5.79 6.48 18,160 257 2.74 4.05 8,613
214 3.46 6.45 19,373 258 1.41 4.07 7244 214 5.79 6.45 19,373 258 2.66 4.07 7,244
215 3.42 6.42 20,571 259 1.41 4.08 6088 215 5.76 6.42 20,571 259 2.66 4.08 6,088
216 3.38 6.36 21,861 260 1.37 4.01 4971 216 5.68 6.36 21,861 260 2.58 4.01 4,971
217 3.30 6.31 23,175 261 1.35 4.03 4042 217 5.54 6.31 23,175 261 2.54 4.03 4,042
218 3.24 6.27 24,497 262 1.29 3.96 3261 218 5.43 6.27 24,497 262 2.43 3.96 3,261
219 3.19 6.20 25,763 263 1.25 4.01 2655 219 5.38 6.20 25,763 263 2.36 4.01 2,655220 3.13 6.15 27,016 264 1.16 4.01 2139 220 5.27 6.15 27,016 264 2.19 4.01 2,139
221 3.11 6.09 28,044 265 1.13 3.97 1,748 221 5.22 6.09 28,044 265 2.12 3.97 1,748
222 3.06 6.02 29,332 266 0.94 3.99 1,443 222 5.14 6.02 29,332 266 1.77 3.99 1,443
223 3.03 5.95 30,597 267 0.84 4.10 1,172 223 5.13 5.95 30,597 267 1.58 4.10 1,172
* Starting RIT score is always based on grade 8 performance.Shaded cells indicate that starting RIT was outside the percentile range of 1-99.Italicized estimates are based on fewer than 1,000 cases and should be used with caution.
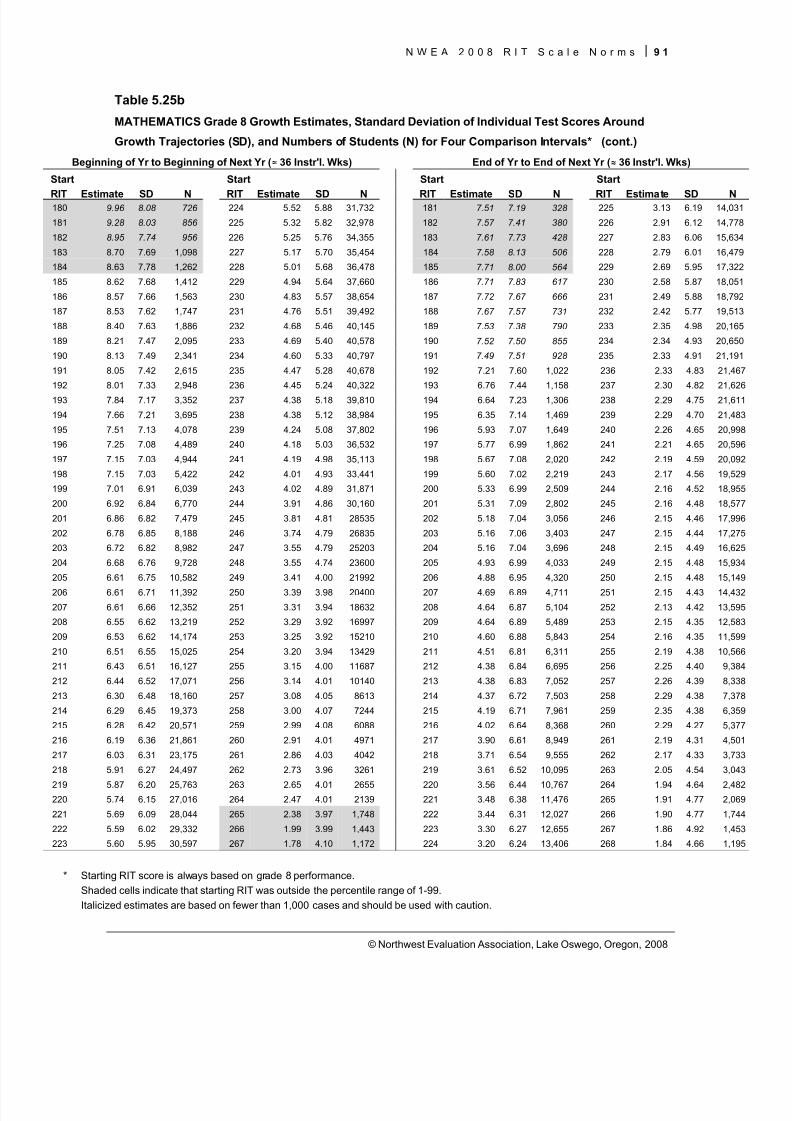
8/7/2019 NWEA Complete Norms2008
http://slidepdf.com/reader/full/nwea-complete-norms2008 101/170
N W E A 2 0 0 8 R I T S c a l e N o r m s 9 1
© Northwest Evaluation Association, Lake Oswego, Oregon, 2008
Table 5.25b
MATHEMATICS Grade 8 Growth Estimates, Standard Deviation of Individual Test Scores Around
Growth Trajectories (SD), and Numbers of Students (N) for Four Comparison Intervals* (cont.)
Beginning of Yr to Beginning of Next Yr ( ≈ 36 Instr'l. Wks) End of Yr to End of Next Yr ( ≈ 36 Instr'l. Wks)
Start Start Start Start
RIT Estimate SD N RIT Estimate SD N RIT Estimate SD N RIT Estimate SD N180 9.96 8.08 726 224 5.52 5.88 31,732 181 7.51 7.19 328 225 3.13 6.19 14,031
181 9.28 8.03 856 225 5.32 5.82 32,978 182 7.57 7.41 380 226 2.91 6.12 14,778
182 8.95 7.74 956 226 5.25 5.76 34,355 183 7.61 7.73 428 227 2.83 6.06 15,634
183 8.70 7.69 1,098 227 5.17 5.70 35,454 184 7.58 8.13 506 228 2.79 6.01 16,479
184 8.63 7.78 1,262 228 5.01 5.68 36,478 185 7.71 8.00 564 229 2.69 5.95 17,322
185 8.62 7.68 1,412 229 4.94 5.64 37,660 186 7.71 7.83 617 230 2.58 5.87 18,051
186 8.57 7.66 1,563 230 4.83 5.57 38,654 187 7.72 7.67 666 231 2.49 5.88 18,792
187 8.53 7.62 1,747 231 4.76 5.51 39,492 188 7.67 7.57 731 232 2.42 5.77 19,513
188 8.40 7.63 1,886 232 4.68 5.46 40,145 189 7.53 7.38 790 233 2.35 4.98 20,165
189 8.21 7.47 2,095 233 4.69 5.40 40,578 190 7.52 7.50 855 234 2.34 4.93 20,650
190 8.13 7.49 2,341 234 4.60 5.33 40,797 191 7.49 7.51 928 235 2.33 4.91 21,191
191 8.05 7.42 2,615 235 4.47 5.28 40,678 192 7.21 7.60 1,022 236 2.33 4.83 21,467
192 8.01 7.33 2,948 236 4.45 5.24 40,322 193 6.76 7.44 1,158 237 2.30 4.82 21,626
193 7.84 7.17 3,352 237 4.38 5.18 39,810 194 6.64 7.23 1,306 238 2.29 4.75 21,611
194 7.66 7.21 3,695 238 4.38 5.12 38,984 195 6.35 7.14 1,469 239 2.29 4.70 21,483
195 7.51 7.13 4,078 239 4.24 5.08 37,802 196 5.93 7.07 1,649 240 2.26 4.65 20,998
196 7.25 7.08 4,489 240 4.18 5.03 36,532 197 5.77 6.99 1,862 241 2.21 4.65 20,596
197 7.15 7.03 4,944 241 4.19 4.98 35,113 198 5.67 7.08 2,020 242 2.19 4.59 20,092
198 7.15 7.03 5,422 242 4.01 4.93 33,441 199 5.60 7.02 2,219 243 2.17 4.56 19,529
199 7.01 6.91 6,039 243 4.02 4.89 31,871 200 5.33 6.99 2,509 244 2.16 4.52 18,955
200 6.92 6.84 6,770 244 3.91 4.86 30,160 201 5.31 7.09 2,802 245 2.16 4.48 18,577
201 6.86 6.82 7,479 245 3.81 4.81 28535 202 5.18 7.04 3,056 246 2.15 4.46 17,996
202 6.78 6.85 8,188 246 3.74 4.79 26835 203 5.16 7.06 3,403 247 2.15 4.44 17,275
203 6.72 6.82 8,982 247 3.55 4.79 25203 204 5.16 7.04 3,696 248 2.15 4.49 16,625
204 6.68 6.76 9,728 248 3.55 4.74 23600 205 4.93 6.99 4,033 249 2.15 4.48 15,934
205 6.61 6.75 10,582 249 3.41 4.00 21992 206 4.88 6.95 4,320 250 2.15 4.48 15,149
206 6.61 6.71 11,392 250 3.39 3.98 20400 207 4.69 6.89 4,711 251 2.15 4.43 14,432
207 6.61 6.66 12,352 251 3.31 3.94 18632 208 4.64 6.87 5,104 252 2.13 4.42 13,595
208 6.55 6.62 13,219 252 3.29 3.92 16997 209 4.64 6.89 5,489 253 2.15 4.35 12,583
209 6.53 6.62 14,174 253 3.25 3.92 15210 210 4.60 6.88 5,843 254 2.16 4.35 11,599
210 6.51 6.55 15,025 254 3.20 3.94 13429 211 4.51 6.81 6,311 255 2.19 4.38 10,566
211 6.43 6.51 16,127 255 3.15 4.00 11687 212 4.38 6.84 6,695 256 2.25 4.40 9,384
212 6.44 6.52 17,071 256 3.14 4.01 10140 213 4.38 6.83 7,052 257 2.26 4.39 8,338
213 6.30 6.48 18,160 257 3.08 4.05 8613 214 4.37 6.72 7,503 258 2.29 4.38 7,378
214 6.29 6.45 19,373 258 3.00 4.07 7244 215 4.19 6.71 7,961 259 2.35 4.38 6,359
215 6.28 6.42 20,571 259 2.99 4.08 6088 216 4.02 6.64 8,368 260 2.29 4.27 5,377
216 6.19 6.36 21,861 260 2.91 4.01 4971 217 3.90 6.61 8,949 261 2.19 4.31 4,501
217 6.03 6.31 23,175 261 2.86 4.03 4042 218 3.71 6.54 9,555 262 2.17 4.33 3,733
218 5.91 6.27 24,497 262 2.73 3.96 3261 219 3.61 6.52 10,095 263 2.05 4.54 3,043
219 5.87 6.20 25,763 263 2.65 4.01 2655 220 3.56 6.44 10,767 264 1.94 4.64 2,482220 5.74 6.15 27,016 264 2.47 4.01 2139 221 3.48 6.38 11,476 265 1.91 4.77 2,069
221 5.69 6.09 28,044 265 2.38 3.97 1,748 222 3.44 6.31 12,027 266 1.90 4.77 1,744
222 5.59 6.02 29,332 266 1.99 3.99 1,443 223 3.30 6.27 12,655 267 1.86 4.92 1,453
223 5.60 5.95 30,597 267 1.78 4.10 1,172 224 3.20 6.24 13,406 268 1.84 4.66 1,195
* Starting RIT score is always based on grade 8 performance.Shaded cells indicate that starting RIT was outside the percentile range of 1-99.Italicized estimates are based on fewer than 1,000 cases and should be used with caution.
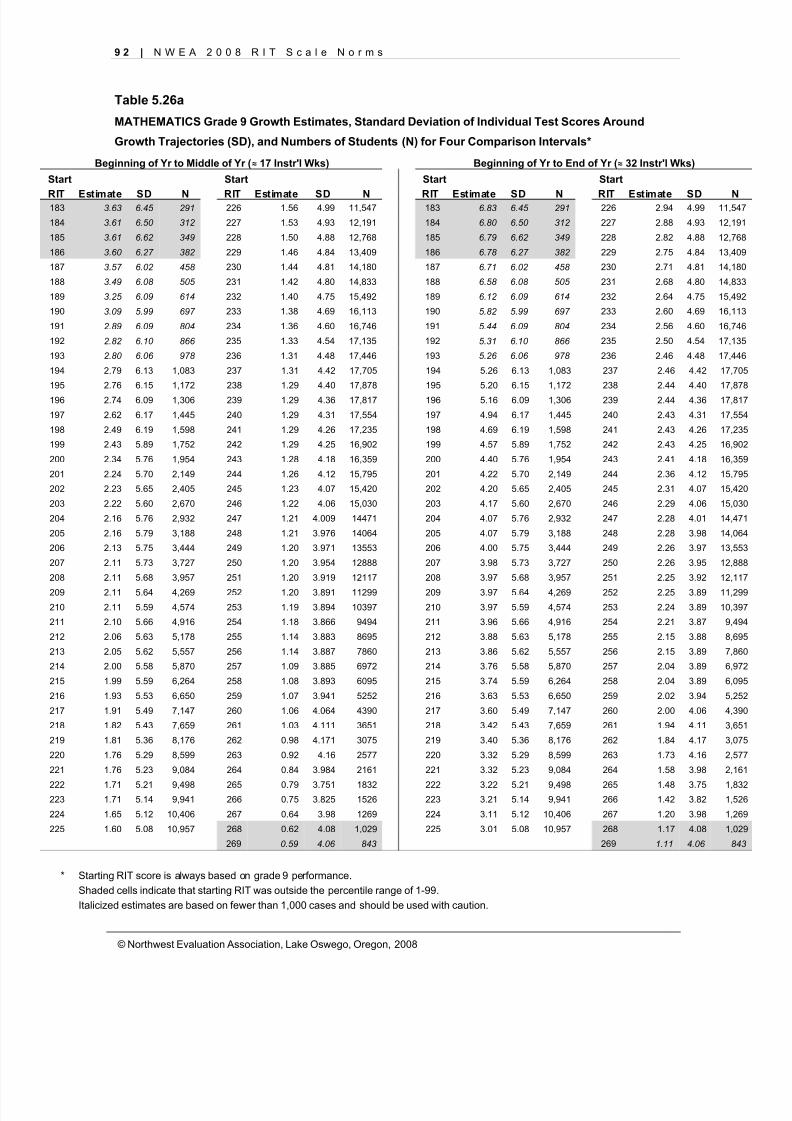
8/7/2019 NWEA Complete Norms2008
http://slidepdf.com/reader/full/nwea-complete-norms2008 102/170
9 2 | N W E A 2 0 0 8 R I T S c a l e N o r m s
© Northwest Evaluation Association, Lake Oswego, Oregon, 2008
Table 5.26a
MATHEMATICS Grade 9 Growth Estimates, Standard Deviation of Individual Test Scores Around
Growth Trajectories (SD), and Numbers of Students (N) for Four Comparison Intervals*
Beginning of Yr to Middle of Yr ( ≈ 17 Instr'l Wks) Beginning of Yr to End of Yr ( ≈ 32 Instr'l Wks)
Start Start Start Start
RIT Estimate SD N RIT Estimate SD N RIT Estimate SD N RIT Estimate SD N183 3.63 6.45 291 226 1.56 4.99 11,547 183 6.83 6.45 291 226 2.94 4.99 11,547
184 3.61 6.50 312 227 1.53 4.93 12,191 184 6.80 6.50 312 227 2.88 4.93 12,191
185 3.61 6.62 349 228 1.50 4.88 12,768 185 6.79 6.62 349 228 2.82 4.88 12,768
186 3.60 6.27 382 229 1.46 4.84 13,409 186 6.78 6.27 382 229 2.75 4.84 13,409
187 3.57 6.02 458 230 1.44 4.81 14,180 187 6.71 6.02 458 230 2.71 4.81 14,180
188 3.49 6.08 505 231 1.42 4.80 14,833 188 6.58 6.08 505 231 2.68 4.80 14,833
189 3.25 6.09 614 232 1.40 4.75 15,492 189 6.12 6.09 614 232 2.64 4.75 15,492
190 3.09 5.99 697 233 1.38 4.69 16,113 190 5.82 5.99 697 233 2.60 4.69 16,113
191 2.89 6.09 804 234 1.36 4.60 16,746 191 5.44 6.09 804 234 2.56 4.60 16,746
192 2.82 6.10 866 235 1.33 4.54 17,135 192 5.31 6.10 866 235 2.50 4.54 17,135
193 2.80 6.06 978 236 1.31 4.48 17,446 193 5.26 6.06 978 236 2.46 4.48 17,446
194 2.79 6.13 1,083 237 1.31 4.42 17,705 194 5.26 6.13 1,083 237 2.46 4.42 17,705
195 2.76 6.15 1,172 238 1.29 4.40 17,878 195 5.20 6.15 1,172 238 2.44 4.40 17,878
196 2.74 6.09 1,306 239 1.29 4.36 17,817 196 5.16 6.09 1,306 239 2.44 4.36 17,817
197 2.62 6.17 1,445 240 1.29 4.31 17,554 197 4.94 6.17 1,445 240 2.43 4.31 17,554
198 2.49 6.19 1,598 241 1.29 4.26 17,235 198 4.69 6.19 1,598 241 2.43 4.26 17,235
199 2.43 5.89 1,752 242 1.29 4.25 16,902 199 4.57 5.89 1,752 242 2.43 4.25 16,902
200 2.34 5.76 1,954 243 1.28 4.18 16,359 200 4.40 5.76 1,954 243 2.41 4.18 16,359
201 2.24 5.70 2,149 244 1.26 4.12 15,795 201 4.22 5.70 2,149 244 2.36 4.12 15,795
202 2.23 5.65 2,405 245 1.23 4.07 15,420 202 4.20 5.65 2,405 245 2.31 4.07 15,420
203 2.22 5.60 2,670 246 1.22 4.06 15,030 203 4.17 5.60 2,670 246 2.29 4.06 15,030
204 2.16 5.76 2,932 247 1.21 4.009 14471 204 4.07 5.76 2,932 247 2.28 4.01 14,471
205 2.16 5.79 3,188 248 1.21 3.976 14064 205 4.07 5.79 3,188 248 2.28 3.98 14,064
206 2.13 5.75 3,444 249 1.20 3.971 13553 206 4.00 5.75 3,444 249 2.26 3.97 13,553
207 2.11 5.73 3,727 250 1.20 3.954 12888 207 3.98 5.73 3,727 250 2.26 3.95 12,888
208 2.11 5.68 3,957 251 1.20 3.919 12117 208 3.97 5.68 3,957 251 2.25 3.92 12,117
209 2.11 5.64 4,269 252 1.20 3.891 11299 209 3.97 5.64 4,269 252 2.25 3.89 11,299
210 2.11 5.59 4,574 253 1.19 3.894 10397 210 3.97 5.59 4,574 253 2.24 3.89 10,397
211 2.10 5.66 4,916 254 1.18 3.866 9494 211 3.96 5.66 4,916 254 2.21 3.87 9,494
212 2.06 5.63 5,178 255 1.14 3.883 8695 212 3.88 5.63 5,178 255 2.15 3.88 8,695
213 2.05 5.62 5,557 256 1.14 3.887 7860 213 3.86 5.62 5,557 256 2.15 3.89 7,860
214 2.00 5.58 5,870 257 1.09 3.885 6972 214 3.76 5.58 5,870 257 2.04 3.89 6,972
215 1.99 5.59 6,264 258 1.08 3.893 6095 215 3.74 5.59 6,264 258 2.04 3.89 6,095
216 1.93 5.53 6,650 259 1.07 3.941 5252 216 3.63 5.53 6,650 259 2.02 3.94 5,252
217 1.91 5.49 7,147 260 1.06 4.064 4390 217 3.60 5.49 7,147 260 2.00 4.06 4,390
218 1.82 5.43 7,659 261 1.03 4.111 3651 218 3.42 5.43 7,659 261 1.94 4.11 3,651
219 1.81 5.36 8,176 262 0.98 4.171 3075 219 3.40 5.36 8,176 262 1.84 4.17 3,075
220 1.76 5.29 8,599 263 0.92 4.16 2577 220 3.32 5.29 8,599 263 1.73 4.16 2,577
221 1.76 5.23 9,084 264 0.84 3.984 2161 221 3.32 5.23 9,084 264 1.58 3.98 2,161
222 1.71 5.21 9,498 265 0.79 3.751 1832 222 3.22 5.21 9,498 265 1.48 3.75 1,832223 1.71 5.14 9,941 266 0.75 3.825 1526 223 3.21 5.14 9,941 266 1.42 3.82 1,526
224 1.65 5.12 10,406 267 0.64 3.98 1269 224 3.11 5.12 10,406 267 1.20 3.98 1,269
225 1.60 5.08 10,957 268 0.62 4.08 1,029 225 3.01 5.08 10,957 268 1.17 4.08 1,029
269 0.59 4.06 843 269 1.11 4.06 843
* Starting RIT score is always based on grade 9 performance.Shaded cells indicate that starting RIT was outside the percentile range of 1-99.Italicized estimates are based on fewer than 1,000 cases and should be used with caution.
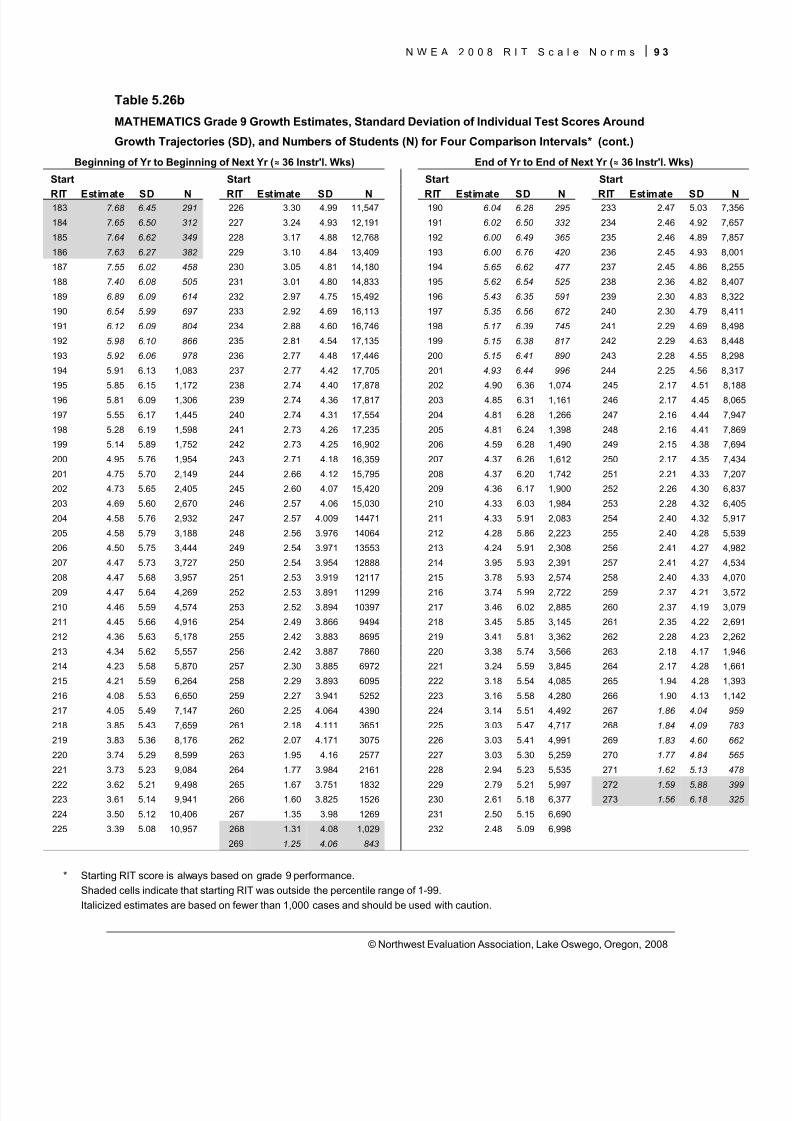
8/7/2019 NWEA Complete Norms2008
http://slidepdf.com/reader/full/nwea-complete-norms2008 103/170
N W E A 2 0 0 8 R I T S c a l e N o r m s 9 3
© Northwest Evaluation Association, Lake Oswego, Oregon, 2008
Table 5.26b
MATHEMATICS Grade 9 Growth Estimates, Standard Deviation of Individual Test Scores Around
Growth Trajectories (SD), and Numbers of Students (N) for Four Comparison Intervals* (cont.)
Beginning of Yr to Beginning of Next Yr ( ≈ 36 Instr'l. Wks) End of Yr to End of Next Yr ( ≈ 36 Instr'l. Wks)
Start Start Start Start
RIT Estimate SD N RIT Estimate SD N RIT Estimate SD N RIT Estimate SD N183 7.68 6.45 291 226 3.30 4.99 11,547 190 6.04 6.28 295 233 2.47 5.03 7,356
184 7.65 6.50 312 227 3.24 4.93 12,191 191 6.02 6.50 332 234 2.46 4.92 7,657
185 7.64 6.62 349 228 3.17 4.88 12,768 192 6.00 6.49 365 235 2.46 4.89 7,857
186 7.63 6.27 382 229 3.10 4.84 13,409 193 6.00 6.76 420 236 2.45 4.93 8,001
187 7.55 6.02 458 230 3.05 4.81 14,180 194 5.65 6.62 477 237 2.45 4.86 8,255
188 7.40 6.08 505 231 3.01 4.80 14,833 195 5.62 6.54 525 238 2.36 4.82 8,407
189 6.89 6.09 614 232 2.97 4.75 15,492 196 5.43 6.35 591 239 2.30 4.83 8,322
190 6.54 5.99 697 233 2.92 4.69 16,113 197 5.35 6.56 672 240 2.30 4.79 8,411
191 6.12 6.09 804 234 2.88 4.60 16,746 198 5.17 6.39 745 241 2.29 4.69 8,498
192 5.98 6.10 866 235 2.81 4.54 17,135 199 5.15 6.38 817 242 2.29 4.63 8,448
193 5.92 6.06 978 236 2.77 4.48 17,446 200 5.15 6.41 890 243 2.28 4.55 8,298
194 5.91 6.13 1,083 237 2.77 4.42 17,705 201 4.93 6.44 996 244 2.25 4.56 8,317
195 5.85 6.15 1,172 238 2.74 4.40 17,878 202 4.90 6.36 1,074 245 2.17 4.51 8,188
196 5.81 6.09 1,306 239 2.74 4.36 17,817 203 4.85 6.31 1,161 246 2.17 4.45 8,065
197 5.55 6.17 1,445 240 2.74 4.31 17,554 204 4.81 6.28 1,266 247 2.16 4.44 7,947
198 5.28 6.19 1,598 241 2.73 4.26 17,235 205 4.81 6.24 1,398 248 2.16 4.41 7,869
199 5.14 5.89 1,752 242 2.73 4.25 16,902 206 4.59 6.28 1,490 249 2.15 4.38 7,694
200 4.95 5.76 1,954 243 2.71 4.18 16,359 207 4.37 6.26 1,612 250 2.17 4.35 7,434
201 4.75 5.70 2,149 244 2.66 4.12 15,795 208 4.37 6.20 1,742 251 2.21 4.33 7,207
202 4.73 5.65 2,405 245 2.60 4.07 15,420 209 4.36 6.17 1,900 252 2.26 4.30 6,837
203 4.69 5.60 2,670 246 2.57 4.06 15,030 210 4.33 6.03 1,984 253 2.28 4.32 6,405
204 4.58 5.76 2,932 247 2.57 4.009 14471 211 4.33 5.91 2,083 254 2.40 4.32 5,917
205 4.58 5.79 3,188 248 2.56 3.976 14064 212 4.28 5.86 2,223 255 2.40 4.28 5,539
206 4.50 5.75 3,444 249 2.54 3.971 13553 213 4.24 5.91 2,308 256 2.41 4.27 4,982
207 4.47 5.73 3,727 250 2.54 3.954 12888 214 3.95 5.93 2,391 257 2.41 4.27 4,534
208 4.47 5.68 3,957 251 2.53 3.919 12117 215 3.78 5.93 2,574 258 2.40 4.33 4,070
209 4.47 5.64 4,269 252 2.53 3.891 11299 216 3.74 5.99 2,722 259 2.37 4.21 3,572
210 4.46 5.59 4,574 253 2.52 3.894 10397 217 3.46 6.02 2,885 260 2.37 4.19 3,079
211 4.45 5.66 4,916 254 2.49 3.866 9494 218 3.45 5.85 3,145 261 2.35 4.22 2,691
212 4.36 5.63 5,178 255 2.42 3.883 8695 219 3.41 5.81 3,362 262 2.28 4.23 2,262
213 4.34 5.62 5,557 256 2.42 3.887 7860 220 3.38 5.74 3,566 263 2.18 4.17 1,946
214 4.23 5.58 5,870 257 2.30 3.885 6972 221 3.24 5.59 3,845 264 2.17 4.28 1,661
215 4.21 5.59 6,264 258 2.29 3.893 6095 222 3.18 5.54 4,085 265 1.94 4.28 1,393
216 4.08 5.53 6,650 259 2.27 3.941 5252 223 3.16 5.58 4,280 266 1.90 4.13 1,142
217 4.05 5.49 7,147 260 2.25 4.064 4390 224 3.14 5.51 4,492 267 1.86 4.04 959
218 3.85 5.43 7,659 261 2.18 4.111 3651 225 3.03 5.47 4,717 268 1.84 4.09 783
219 3.83 5.36 8,176 262 2.07 4.171 3075 226 3.03 5.41 4,991 269 1.83 4.60 662
220 3.74 5.29 8,599 263 1.95 4.16 2577 227 3.03 5.30 5,259 270 1.77 4.84 565
221 3.73 5.23 9,084 264 1.77 3.984 2161 228 2.94 5.23 5,535 271 1.62 5.13 478
222 3.62 5.21 9,498 265 1.67 3.751 1832 229 2.79 5.21 5,997 272 1.59 5.88 399223 3.61 5.14 9,941 266 1.60 3.825 1526 230 2.61 5.18 6,377 273 1.56 6.18 325
224 3.50 5.12 10,406 267 1.35 3.98 1269 231 2.50 5.15 6,690
225 3.39 5.08 10,957 268 1.31 4.08 1,029 232 2.48 5.09 6,998
269 1.25 4.06 843
* Starting RIT score is always based on grade 9 performance.Shaded cells indicate that starting RIT was outside the percentile range of 1-99.Italicized estimates are based on fewer than 1,000 cases and should be used with caution.
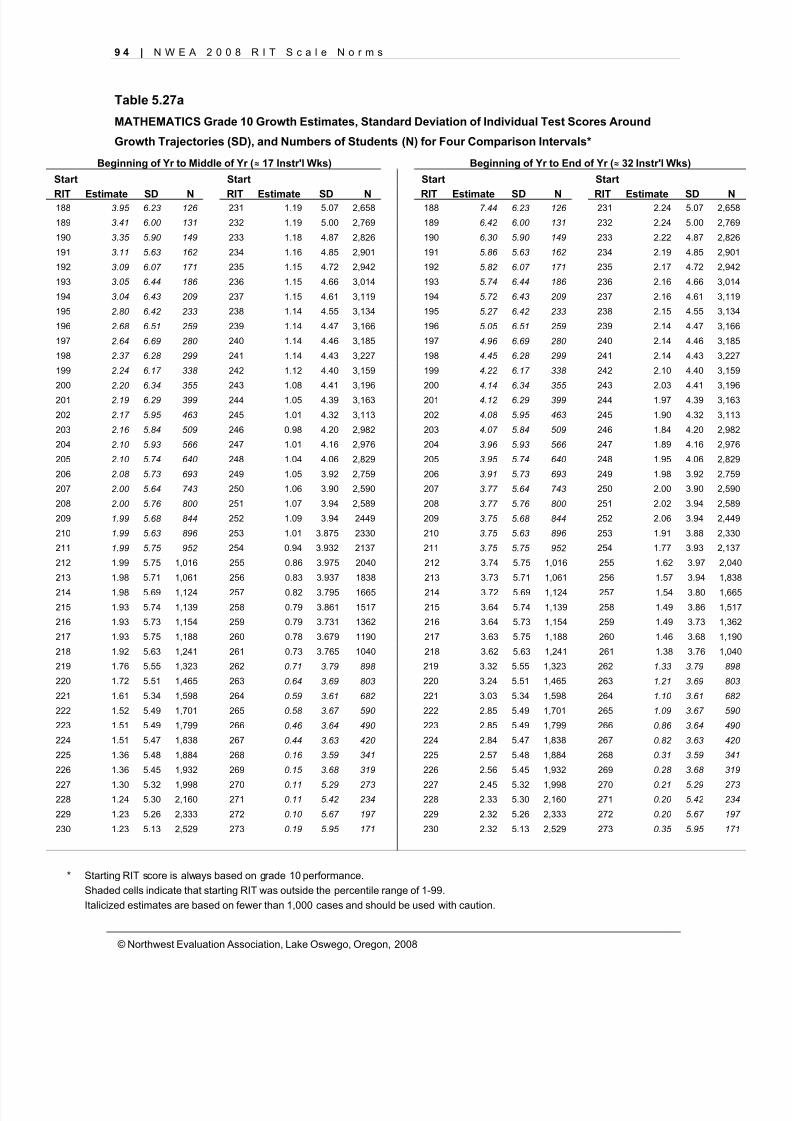
8/7/2019 NWEA Complete Norms2008
http://slidepdf.com/reader/full/nwea-complete-norms2008 104/170
9 4 | N W E A 2 0 0 8 R I T S c a l e N o r m s
© Northwest Evaluation Association, Lake Oswego, Oregon, 2008
Table 5.27a
MATHEMATICS Grade 10 Growth Estimates, Standard Deviation of Individual Test Scores Around
Growth Trajectories (SD), and Numbers of Students (N) for Four Comparison Intervals*
Beginning of Yr to Middle of Yr ( ≈ 17 Instr'l Wks) Beginning of Yr to End of Yr ( ≈ 32 Instr'l Wks)
Start Start Start Start
RIT Estimate SD N RIT Estimate SD N RIT Estimate SD N RIT Estimate SD N188 3.95 6.23 126 231 1.19 5.07 2,658 188 7.44 6.23 126 231 2.24 5.07 2,658
189 3.41 6.00 131 232 1.19 5.00 2,769 189 6.42 6.00 131 232 2.24 5.00 2,769
190 3.35 5.90 149 233 1.18 4.87 2,826 190 6.30 5.90 149 233 2.22 4.87 2,826
191 3.11 5.63 162 234 1.16 4.85 2,901 191 5.86 5.63 162 234 2.19 4.85 2,901
192 3.09 6.07 171 235 1.15 4.72 2,942 192 5.82 6.07 171 235 2.17 4.72 2,942
193 3.05 6.44 186 236 1.15 4.66 3,014 193 5.74 6.44 186 236 2.16 4.66 3,014
194 3.04 6.43 209 237 1.15 4.61 3,119 194 5.72 6.43 209 237 2.16 4.61 3,119
195 2.80 6.42 233 238 1.14 4.55 3,134 195 5.27 6.42 233 238 2.15 4.55 3,134
196 2.68 6.51 259 239 1.14 4.47 3,166 196 5.05 6.51 259 239 2.14 4.47 3,166
197 2.64 6.69 280 240 1.14 4.46 3,185 197 4.96 6.69 280 240 2.14 4.46 3,185
198 2.37 6.28 299 241 1.14 4.43 3,227 198 4.45 6.28 299 241 2.14 4.43 3,227
199 2.24 6.17 338 242 1.12 4.40 3,159 199 4.22 6.17 338 242 2.10 4.40 3,159
200 2.20 6.34 355 243 1.08 4.41 3,196 200 4.14 6.34 355 243 2.03 4.41 3,196
201 2.19 6.29 399 244 1.05 4.39 3,163 201 4.12 6.29 399 244 1.97 4.39 3,163
202 2.17 5.95 463 245 1.01 4.32 3,113 202 4.08 5.95 463 245 1.90 4.32 3,113
203 2.16 5.84 509 246 0.98 4.20 2,982 203 4.07 5.84 509 246 1.84 4.20 2,982
204 2.10 5.93 566 247 1.01 4.16 2,976 204 3.96 5.93 566 247 1.89 4.16 2,976
205 2.10 5.74 640 248 1.04 4.06 2,829 205 3.95 5.74 640 248 1.95 4.06 2,829
206 2.08 5.73 693 249 1.05 3.92 2,759 206 3.91 5.73 693 249 1.98 3.92 2,759
207 2.00 5.64 743 250 1.06 3.90 2,590 207 3.77 5.64 743 250 2.00 3.90 2,590
208 2.00 5.76 800 251 1.07 3.94 2,589 208 3.77 5.76 800 251 2.02 3.94 2,589
209 1.99 5.68 844 252 1.09 3.94 2449 209 3.75 5.68 844 252 2.06 3.94 2,449
210 1.99 5.63 896 253 1.01 3.875 2330 210 3.75 5.63 896 253 1.91 3.88 2,330
211 1.99 5.75 952 254 0.94 3.932 2137 211 3.75 5.75 952 254 1.77 3.93 2,137
212 1.99 5.75 1,016 255 0.86 3.975 2040 212 3.74 5.75 1,016 255 1.62 3.97 2,040
213 1.98 5.71 1,061 256 0.83 3.937 1838 213 3.73 5.71 1,061 256 1.57 3.94 1,838
214 1.98 5.69 1,124 257 0.82 3.795 1665 214 3.72 5.69 1,124 257 1.54 3.80 1,665
215 1.93 5.74 1,139 258 0.79 3.861 1517 215 3.64 5.74 1,139 258 1.49 3.86 1,517
216 1.93 5.73 1,154 259 0.79 3.731 1362 216 3.64 5.73 1,154 259 1.49 3.73 1,362
217 1.93 5.75 1,188 260 0.78 3.679 1190 217 3.63 5.75 1,188 260 1.46 3.68 1,190
218 1.92 5.63 1,241 261 0.73 3.765 1040 218 3.62 5.63 1,241 261 1.38 3.76 1,040
219 1.76 5.55 1,323 262 0.71 3.79 898 219 3.32 5.55 1,323 262 1.33 3.79 898
220 1.72 5.51 1,465 263 0.64 3.69 803 220 3.24 5.51 1,465 263 1.21 3.69 803
221 1.61 5.34 1,598 264 0.59 3.61 682 221 3.03 5.34 1,598 264 1.10 3.61 682
222 1.52 5.49 1,701 265 0.58 3.67 590 222 2.85 5.49 1,701 265 1.09 3.67 590
223 1.51 5.49 1,799 266 0.46 3.64 490 223 2.85 5.49 1,799 266 0.86 3.64 490
224 1.51 5.47 1,838 267 0.44 3.63 420 224 2.84 5.47 1,838 267 0.82 3.63 420
225 1.36 5.48 1,884 268 0.16 3.59 341 225 2.57 5.48 1,884 268 0.31 3.59 341
226 1.36 5.45 1,932 269 0.15 3.68 319 226 2.56 5.45 1,932 269 0.28 3.68 319
227 1.30 5.32 1,998 270 0.11 5.29 273 227 2.45 5.32 1,998 270 0.21 5.29 273228 1.24 5.30 2,160 271 0.11 5.42 234 228 2.33 5.30 2,160 271 0.20 5.42 234
229 1.23 5.26 2,333 272 0.10 5.67 197 229 2.32 5.26 2,333 272 0.20 5.67 197
230 1.23 5.13 2,529 273 0.19 5.95 171 230 2.32 5.13 2,529 273 0.35 5.95 171
* Starting RIT score is always based on grade 10 performance.Shaded cells indicate that starting RIT was outside the percentile range of 1-99.Italicized estimates are based on fewer than 1,000 cases and should be used with caution.
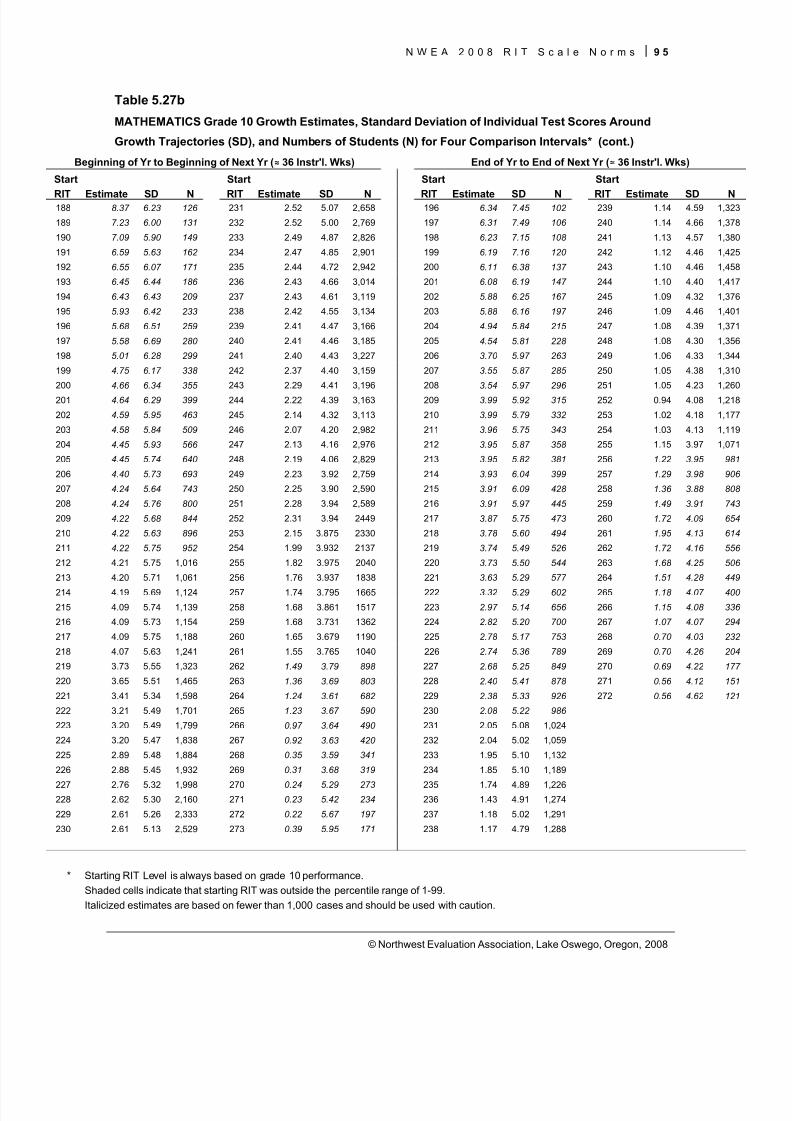
8/7/2019 NWEA Complete Norms2008
http://slidepdf.com/reader/full/nwea-complete-norms2008 105/170
N W E A 2 0 0 8 R I T S c a l e N o r m s 9 5
© Northwest Evaluation Association, Lake Oswego, Oregon, 2008
Table 5.27b
MATHEMATICS Grade 10 Growth Estimates, Standard Deviation of Individual Test Scores Around
Growth Trajectories (SD), and Numbers of Students (N) for Four Comparison Intervals* (cont.)
Beginning of Yr to Beginning of Next Yr ( ≈ 36 Instr'l. Wks) End of Yr to End of Next Yr ( ≈ 36 Instr'l. Wks)
Start Start Start Start
RIT Estimate SD N RIT Estimate SD N RIT Estimate SD N RIT Estimate SD N188 8.37 6.23 126 231 2.52 5.07 2,658 196 6.34 7.45 102 239 1.14 4.59 1,323
189 7.23 6.00 131 232 2.52 5.00 2,769 197 6.31 7.49 106 240 1.14 4.66 1,378
190 7.09 5.90 149 233 2.49 4.87 2,826 198 6.23 7.15 108 241 1.13 4.57 1,380
191 6.59 5.63 162 234 2.47 4.85 2,901 199 6.19 7.16 120 242 1.12 4.46 1,425
192 6.55 6.07 171 235 2.44 4.72 2,942 200 6.11 6.38 137 243 1.10 4.46 1,458
193 6.45 6.44 186 236 2.43 4.66 3,014 201 6.08 6.19 147 244 1.10 4.40 1,417
194 6.43 6.43 209 237 2.43 4.61 3,119 202 5.88 6.25 167 245 1.09 4.32 1,376
195 5.93 6.42 233 238 2.42 4.55 3,134 203 5.88 6.16 197 246 1.09 4.46 1,401
196 5.68 6.51 259 239 2.41 4.47 3,166 204 4.94 5.84 215 247 1.08 4.39 1,371
197 5.58 6.69 280 240 2.41 4.46 3,185 205 4.54 5.81 228 248 1.08 4.30 1,356
198 5.01 6.28 299 241 2.40 4.43 3,227 206 3.70 5.97 263 249 1.06 4.33 1,344
199 4.75 6.17 338 242 2.37 4.40 3,159 207 3.55 5.87 285 250 1.05 4.38 1,310
200 4.66 6.34 355 243 2.29 4.41 3,196 208 3.54 5.97 296 251 1.05 4.23 1,260
201 4.64 6.29 399 244 2.22 4.39 3,163 209 3.99 5.92 315 252 0.94 4.08 1,218
202 4.59 5.95 463 245 2.14 4.32 3,113 210 3.99 5.79 332 253 1.02 4.18 1,177
203 4.58 5.84 509 246 2.07 4.20 2,982 211 3.96 5.75 343 254 1.03 4.13 1,119
204 4.45 5.93 566 247 2.13 4.16 2,976 212 3.95 5.87 358 255 1.15 3.97 1,071
205 4.45 5.74 640 248 2.19 4.06 2,829 213 3.95 5.82 381 256 1.22 3.95 981
206 4.40 5.73 693 249 2.23 3.92 2,759 214 3.93 6.04 399 257 1.29 3.98 906
207 4.24 5.64 743 250 2.25 3.90 2,590 215 3.91 6.09 428 258 1.36 3.88 808
208 4.24 5.76 800 251 2.28 3.94 2,589 216 3.91 5.97 445 259 1.49 3.91 743
209 4.22 5.68 844 252 2.31 3.94 2449 217 3.87 5.75 473 260 1.72 4.09 654
210 4.22 5.63 896 253 2.15 3.875 2330 218 3.78 5.60 494 261 1.95 4.13 614
211 4.22 5.75 952 254 1.99 3.932 2137 219 3.74 5.49 526 262 1.72 4.16 556
212 4.21 5.75 1,016 255 1.82 3.975 2040 220 3.73 5.50 544 263 1.68 4.25 506
213 4.20 5.71 1,061 256 1.76 3.937 1838 221 3.63 5.29 577 264 1.51 4.28 449
214 4.19 5.69 1,124 257 1.74 3.795 1665 222 3.32 5.29 602 265 1.18 4.07 400
215 4.09 5.74 1,139 258 1.68 3.861 1517 223 2.97 5.14 656 266 1.15 4.08 336
216 4.09 5.73 1,154 259 1.68 3.731 1362 224 2.82 5.20 700 267 1.07 4.07 294
217 4.09 5.75 1,188 260 1.65 3.679 1190 225 2.78 5.17 753 268 0.70 4.03 232
218 4.07 5.63 1,241 261 1.55 3.765 1040 226 2.74 5.36 789 269 0.70 4.26 204
219 3.73 5.55 1,323 262 1.49 3.79 898 227 2.68 5.25 849 270 0.69 4.22 177
220 3.65 5.51 1,465 263 1.36 3.69 803 228 2.40 5.41 878 271 0.56 4.12 151
221 3.41 5.34 1,598 264 1.24 3.61 682 229 2.38 5.33 926 272 0.56 4.62 121
222 3.21 5.49 1,701 265 1.23 3.67 590 230 2.08 5.22 986
223 3.20 5.49 1,799 266 0.97 3.64 490 231 2.05 5.08 1,024
224 3.20 5.47 1,838 267 0.92 3.63 420 232 2.04 5.02 1,059
225 2.89 5.48 1,884 268 0.35 3.59 341 233 1.95 5.10 1,132
226 2.88 5.45 1,932 269 0.31 3.68 319 234 1.85 5.10 1,189
227 2.76 5.32 1,998 270 0.24 5.29 273 235 1.74 4.89 1,226228 2.62 5.30 2,160 271 0.23 5.42 234 236 1.43 4.91 1,274
229 2.61 5.26 2,333 272 0.22 5.67 197 237 1.18 5.02 1,291
230 2.61 5.13 2,529 273 0.39 5.95 171 238 1.17 4.79 1,288
* Starting RIT Level is always based on grade 10 performance.Shaded cells indicate that starting RIT was outside the percentile range of 1-99.Italicized estimates are based on fewer than 1,000 cases and should be used with caution.
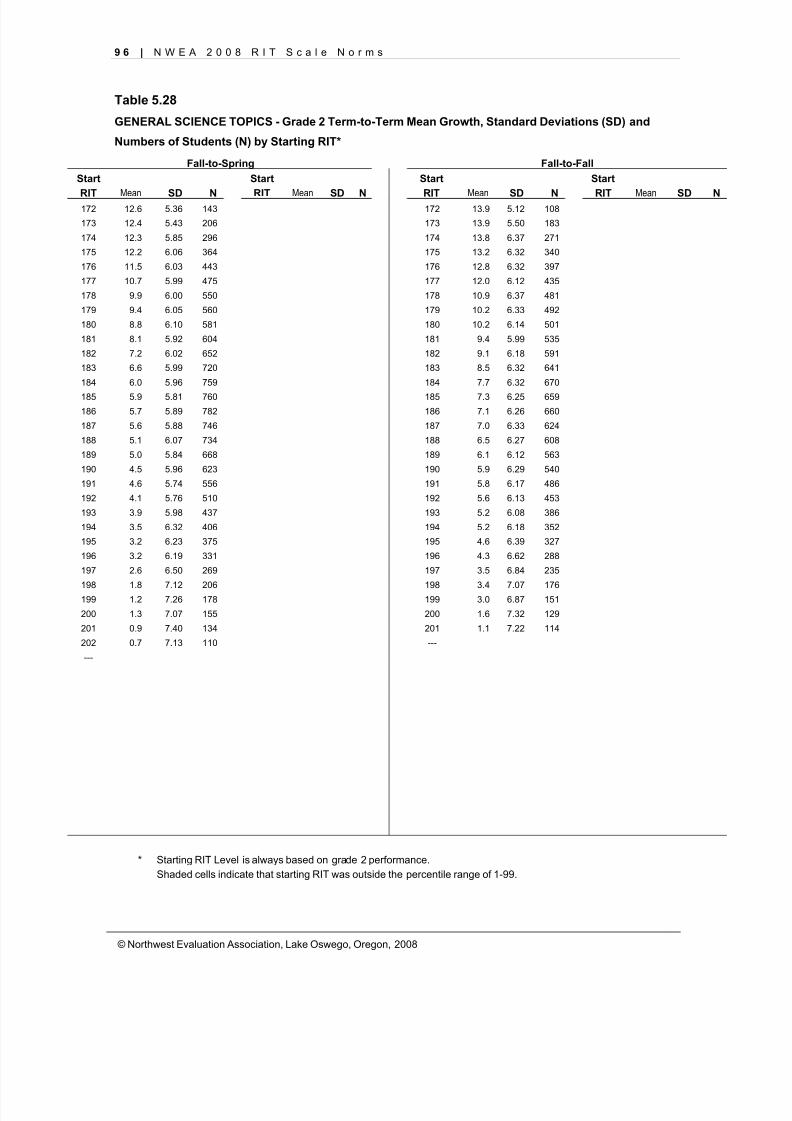
8/7/2019 NWEA Complete Norms2008
http://slidepdf.com/reader/full/nwea-complete-norms2008 106/170
9 6 | N W E A 2 0 0 8 R I T S c a l e N o r m s
© Northwest Evaluation Association, Lake Oswego, Oregon, 2008
Table 5.28
GENERAL SCIENCE TOPICS - Grade 2 Term-to-Term Mean Growth, Standard Deviations (SD) and
Numbers of Students (N) by Starting RIT*
Fall-to-Spring Fall-to-FallStart Start Start Start
RIT Mean SD N RIT Mean SD N RIT Mean SD N RIT Mean SD N172 12.6 5.36 143 172 13.9 5.12 108
173 12.4 5.43 206 173 13.9 5.50 183
174 12.3 5.85 296 174 13.8 6.37 271
175 12.2 6.06 364 175 13.2 6.32 340
176 11.5 6.03 443 176 12.8 6.32 397
177 10.7 5.99 475 177 12.0 6.12 435
178 9.9 6.00 550 178 10.9 6.37 481
179 9.4 6.05 560 179 10.2 6.33 492
180 8.8 6.10 581 180 10.2 6.14 501
181 8.1 5.92 604 181 9.4 5.99 535
182 7.2 6.02 652 182 9.1 6.18 591
183 6.6 5.99 720 183 8.5 6.32 641
184 6.0 5.96 759 184 7.7 6.32 670
185 5.9 5.81 760 185 7.3 6.25 659
186 5.7 5.89 782 186 7.1 6.26 660
187 5.6 5.88 746 187 7.0 6.33 624
188 5.1 6.07 734 188 6.5 6.27 608
189 5.0 5.84 668 189 6.1 6.12 563
190 4.5 5.96 623 190 5.9 6.29 540
191 4.6 5.74 556 191 5.8 6.17 486
192 4.1 5.76 510 192 5.6 6.13 453
193 3.9 5.98 437 193 5.2 6.08 386
194 3.5 6.32 406 194 5.2 6.18 352
195 3.2 6.23 375 195 4.6 6.39 327
196 3.2 6.19 331 196 4.3 6.62 288
197 2.6 6.50 269 197 3.5 6.84 235
198 1.8 7.12 206 198 3.4 7.07 176199 1.2 7.26 178 199 3.0 6.87 151
200 1.3 7.07 155 200 1.6 7.32 129
201 0.9 7.40 134 201 1.1 7.22 114
202 0.7 7.13 110 ---
---
* Starting RIT Level is always based on grade 2 performance.Shaded cells indicate that starting RIT was outside the percentile range of 1-99.
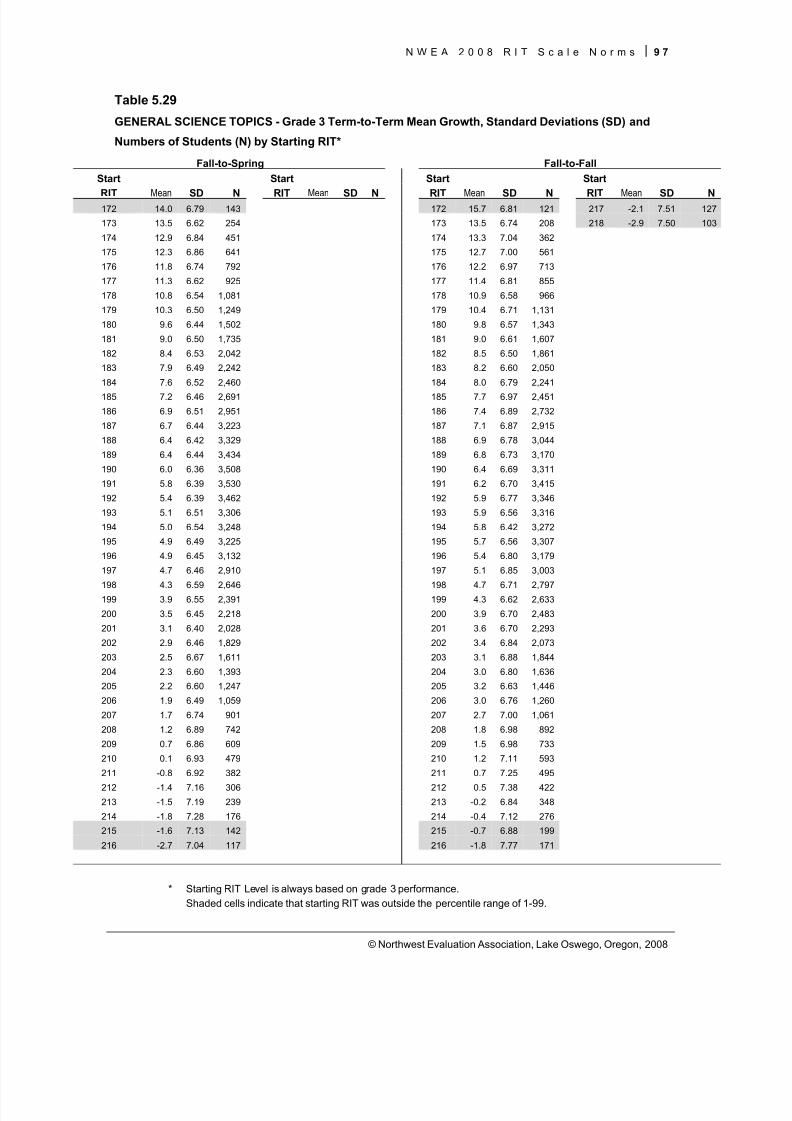
8/7/2019 NWEA Complete Norms2008
http://slidepdf.com/reader/full/nwea-complete-norms2008 107/170
N W E A 2 0 0 8 R I T S c a l e N o r m s 9 7
© Northwest Evaluation Association, Lake Oswego, Oregon, 2008
Table 5.29
GENERAL SCIENCE TOPICS - Grade 3 Term-to-Term Mean Growth, Standard Deviations (SD) and
Numbers of Students (N) by Starting RIT*
Fall-to-Spring Fall-to-FallStart Start Start Start
RIT Mean SD N RIT Mean SD N RIT Mean SD N RIT Mean SD N172 14.0 6.79 143 172 15.7 6.81 121 217 -2.1 7.51 127
173 13.5 6.62 254 173 13.5 6.74 208 218 -2.9 7.50 103
174 12.9 6.84 451 174 13.3 7.04 362
175 12.3 6.86 641 175 12.7 7.00 561
176 11.8 6.74 792 176 12.2 6.97 713
177 11.3 6.62 925 177 11.4 6.81 855
178 10.8 6.54 1,081 178 10.9 6.58 966
179 10.3 6.50 1,249 179 10.4 6.71 1,131
180 9.6 6.44 1,502 180 9.8 6.57 1,343
181 9.0 6.50 1,735 181 9.0 6.61 1,607
182 8.4 6.53 2,042 182 8.5 6.50 1,861
183 7.9 6.49 2,242 183 8.2 6.60 2,050
184 7.6 6.52 2,460 184 8.0 6.79 2,241
185 7.2 6.46 2,691 185 7.7 6.97 2,451
186 6.9 6.51 2,951 186 7.4 6.89 2,732
187 6.7 6.44 3,223 187 7.1 6.87 2,915
188 6.4 6.42 3,329 188 6.9 6.78 3,044
189 6.4 6.44 3,434 189 6.8 6.73 3,170
190 6.0 6.36 3,508 190 6.4 6.69 3,311
191 5.8 6.39 3,530 191 6.2 6.70 3,415
192 5.4 6.39 3,462 192 5.9 6.77 3,346
193 5.1 6.51 3,306 193 5.9 6.56 3,316
194 5.0 6.54 3,248 194 5.8 6.42 3,272
195 4.9 6.49 3,225 195 5.7 6.56 3,307
196 4.9 6.45 3,132 196 5.4 6.80 3,179
197 4.7 6.46 2,910 197 5.1 6.85 3,003
198 4.3 6.59 2,646 198 4.7 6.71 2,797199 3.9 6.55 2,391 199 4.3 6.62 2,633
200 3.5 6.45 2,218 200 3.9 6.70 2,483
201 3.1 6.40 2,028 201 3.6 6.70 2,293
202 2.9 6.46 1,829 202 3.4 6.84 2,073
203 2.5 6.67 1,611 203 3.1 6.88 1,844
204 2.3 6.60 1,393 204 3.0 6.80 1,636
205 2.2 6.60 1,247 205 3.2 6.63 1,446
206 1.9 6.49 1,059 206 3.0 6.76 1,260
207 1.7 6.74 901 207 2.7 7.00 1,061
208 1.2 6.89 742 208 1.8 6.98 892
209 0.7 6.86 609 209 1.5 6.98 733
210 0.1 6.93 479 210 1.2 7.11 593
211 -0.8 6.92 382 211 0.7 7.25 495
212 -1.4 7.16 306 212 0.5 7.38 422213 -1.5 7.19 239 213 -0.2 6.84 348
214 -1.8 7.28 176 214 -0.4 7.12 276
215 -1.6 7.13 142 215 -0.7 6.88 199
216 -2.7 7.04 117 216 -1.8 7.77 171
* Starting RIT Level is always based on grade 3 performance.Shaded cells indicate that starting RIT was outside the percentile range of 1-99.
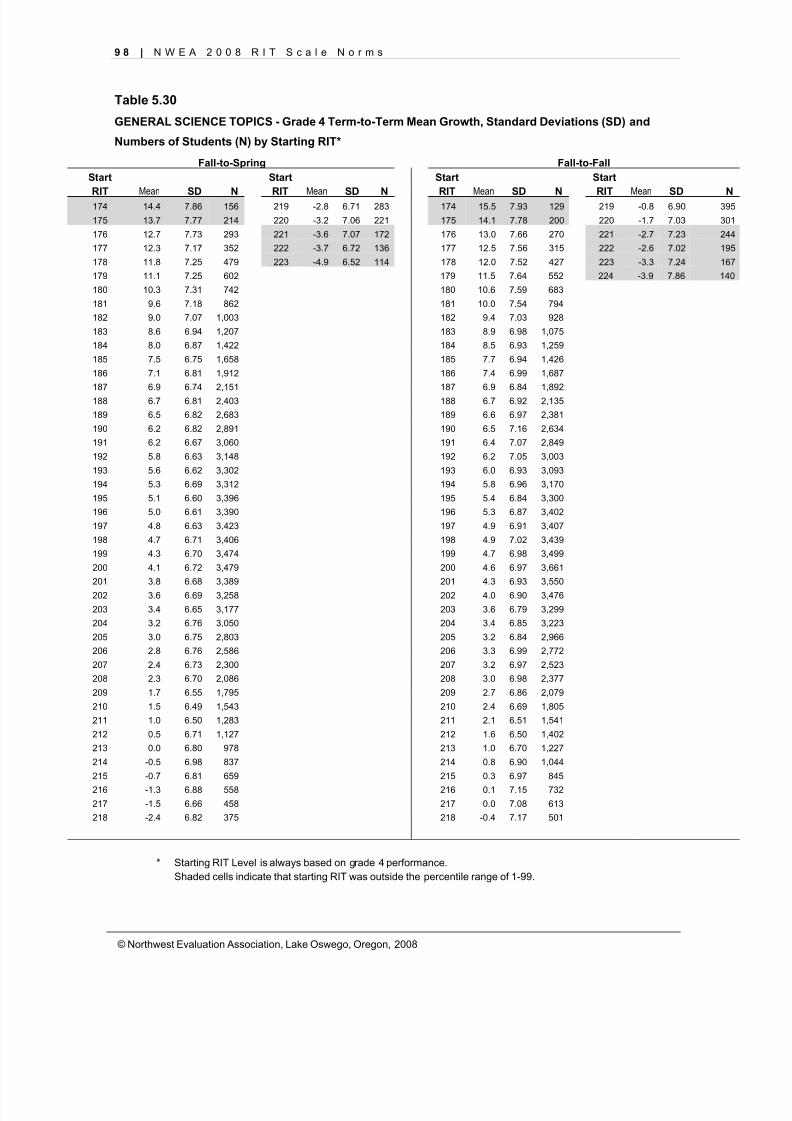
8/7/2019 NWEA Complete Norms2008
http://slidepdf.com/reader/full/nwea-complete-norms2008 108/170
9 8 | N W E A 2 0 0 8 R I T S c a l e N o r m s
© Northwest Evaluation Association, Lake Oswego, Oregon, 2008
Table 5.30
GENERAL SCIENCE TOPICS - Grade 4 Term-to-Term Mean Growth, Standard Deviations (SD) and
Numbers of Students (N) by Starting RIT*
Fall-to-Spring Fall-to-FallStart Start Start Start
RITMean
SD N RITMean
SD N RITMean
SD N RITMean
SD N174 14.4 7.86 156 219 -2.8 6.71 283 174 15.5 7.93 129 219 -0.8 6.90 395
175 13.7 7.77 214 220 -3.2 7.06 221 175 14.1 7.78 200 220 -1.7 7.03 301
176 12.7 7.73 293 221 -3.6 7.07 172 176 13.0 7.66 270 221 -2.7 7.23 244
177 12.3 7.17 352 222 -3.7 6.72 136 177 12.5 7.56 315 222 -2.6 7.02 195
178 11.8 7.25 479 223 -4.9 6.52 114 178 12.0 7.52 427 223 -3.3 7.24 167
179 11.1 7.25 602 179 11.5 7.64 552 224 -3.9 7.86 140
180 10.3 7.31 742 180 10.6 7.59 683
181 9.6 7.18 862 181 10.0 7.54 794
182 9.0 7.07 1,003 182 9.4 7.03 928
183 8.6 6.94 1,207 183 8.9 6.98 1,075
184 8.0 6.87 1,422 184 8.5 6.93 1,259
185 7.5 6.75 1,658 185 7.7 6.94 1,426
186 7.1 6.81 1,912 186 7.4 6.99 1,687
187 6.9 6.74 2,151 187 6.9 6.84 1,892
188 6.7 6.81 2,403 188 6.7 6.92 2,135
189 6.5 6.82 2,683 189 6.6 6.97 2,381
190 6.2 6.82 2,891 190 6.5 7.16 2,634
191 6.2 6.67 3,060 191 6.4 7.07 2,849
192 5.8 6.63 3,148 192 6.2 7.05 3,003
193 5.6 6.62 3,302 193 6.0 6.93 3,093
194 5.3 6.69 3,312 194 5.8 6.96 3,170
195 5.1 6.60 3,396 195 5.4 6.84 3,300
196 5.0 6.61 3,390 196 5.3 6.87 3,402
197 4.8 6.63 3,423 197 4.9 6.91 3,407
198 4.7 6.71 3,406 198 4.9 7.02 3,439
199 4.3 6.70 3,474 199 4.7 6.98 3,499
200 4.1 6.72 3,479 200 4.6 6.97 3,661
201 3.8 6.68 3,389 201 4.3 6.93 3,550
202 3.6 6.69 3,258 202 4.0 6.90 3,476
203 3.4 6.65 3,177 203 3.6 6.79 3,299
204 3.2 6.76 3,050 204 3.4 6.85 3,223
205 3.0 6.75 2,803 205 3.2 6.84 2,966
206 2.8 6.76 2,586 206 3.3 6.99 2,772
207 2.4 6.73 2,300 207 3.2 6.97 2,523
208 2.3 6.70 2,086 208 3.0 6.98 2,377
209 1.7 6.55 1,795 209 2.7 6.86 2,079
210 1.5 6.49 1,543 210 2.4 6.69 1,805
211 1.0 6.50 1,283 211 2.1 6.51 1,541
212 0.5 6.71 1,127 212 1.6 6.50 1,402
213 0.0 6.80 978 213 1.0 6.70 1,227
214 -0.5 6.98 837 214 0.8 6.90 1,044
215 -0.7 6.81 659 215 0.3 6.97 845
216 -1.3 6.88 558 216 0.1 7.15 732
217 -1.5 6.66 458 217 0.0 7.08 613
218 -2.4 6.82 375 218 -0.4 7.17 501
* Starting RIT Level is always based on grade 4 performance.Shaded cells indicate that starting RIT was outside the percentile range of 1-99.
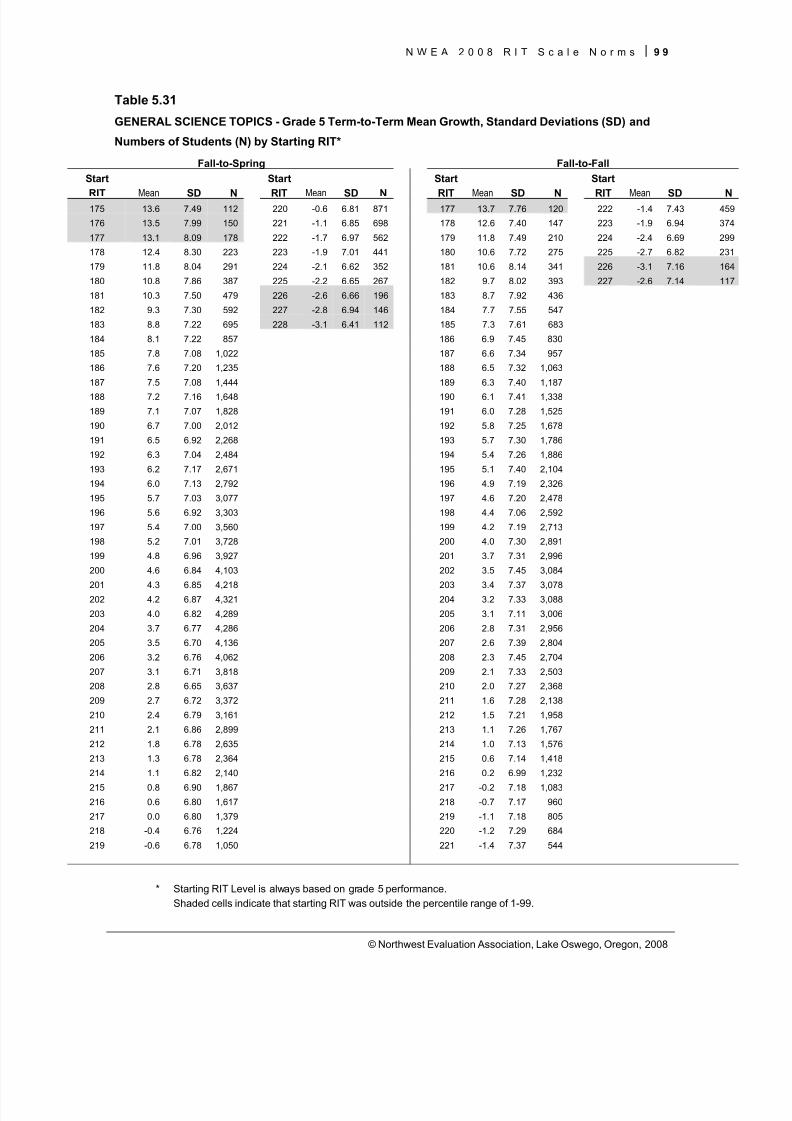
8/7/2019 NWEA Complete Norms2008
http://slidepdf.com/reader/full/nwea-complete-norms2008 109/170
N W E A 2 0 0 8 R I T S c a l e N o r m s 9 9
© Northwest Evaluation Association, Lake Oswego, Oregon, 2008
Table 5.31
GENERAL SCIENCE TOPICS - Grade 5 Term-to-Term Mean Growth, Standard Deviations (SD) and
Numbers of Students (N) by Starting RIT*
Fall-to-Spring Fall-to-FallStart Start Start Start
RIT Mean SD N RIT Mean SD N RIT Mean SD N RIT Mean SD N175 13.6 7.49 112 220 -0.6 6.81 871 177 13.7 7.76 120 222 -1.4 7.43 459
176 13.5 7.99 150 221 -1.1 6.85 698 178 12.6 7.40 147 223 -1.9 6.94 374
177 13.1 8.09 178 222 -1.7 6.97 562 179 11.8 7.49 210 224 -2.4 6.69 299
178 12.4 8.30 223 223 -1.9 7.01 441 180 10.6 7.72 275 225 -2.7 6.82 231
179 11.8 8.04 291 224 -2.1 6.62 352 181 10.6 8.14 341 226 -3.1 7.16 164
180 10.8 7.86 387 225 -2.2 6.65 267 182 9.7 8.02 393 227 -2.6 7.14 117
181 10.3 7.50 479 226 -2.6 6.66 196 183 8.7 7.92 436
182 9.3 7.30 592 227 -2.8 6.94 146 184 7.7 7.55 547
183 8.8 7.22 695 228 -3.1 6.41 112 185 7.3 7.61 683
184 8.1 7.22 857 186 6.9 7.45 830
185 7.8 7.08 1,022 187 6.6 7.34 957
186 7.6 7.20 1,235 188 6.5 7.32 1,063
187 7.5 7.08 1,444 189 6.3 7.40 1,187
188 7.2 7.16 1,648 190 6.1 7.41 1,338
189 7.1 7.07 1,828 191 6.0 7.28 1,525
190 6.7 7.00 2,012 192 5.8 7.25 1,678
191 6.5 6.92 2,268 193 5.7 7.30 1,786
192 6.3 7.04 2,484 194 5.4 7.26 1,886
193 6.2 7.17 2,671 195 5.1 7.40 2,104
194 6.0 7.13 2,792 196 4.9 7.19 2,326
195 5.7 7.03 3,077 197 4.6 7.20 2,478
196 5.6 6.92 3,303 198 4.4 7.06 2,592
197 5.4 7.00 3,560 199 4.2 7.19 2,713
198 5.2 7.01 3,728 200 4.0 7.30 2,891
199 4.8 6.96 3,927 201 3.7 7.31 2,996
200 4.6 6.84 4,103 202 3.5 7.45 3,084
201 4.3 6.85 4,218 203 3.4 7.37 3,078202 4.2 6.87 4,321 204 3.2 7.33 3,088
203 4.0 6.82 4,289 205 3.1 7.11 3,006
204 3.7 6.77 4,286 206 2.8 7.31 2,956
205 3.5 6.70 4,136 207 2.6 7.39 2,804
206 3.2 6.76 4,062 208 2.3 7.45 2,704
207 3.1 6.71 3,818 209 2.1 7.33 2,503
208 2.8 6.65 3,637 210 2.0 7.27 2,368
209 2.7 6.72 3,372 211 1.6 7.28 2,138
210 2.4 6.79 3,161 212 1.5 7.21 1,958
211 2.1 6.86 2,899 213 1.1 7.26 1,767
212 1.8 6.78 2,635 214 1.0 7.13 1,576
213 1.3 6.78 2,364 215 0.6 7.14 1,418
214 1.1 6.82 2,140 216 0.2 6.99 1,232
215 0.8 6.90 1,867 217 -0.2 7.18 1,083216 0.6 6.80 1,617 218 -0.7 7.17 960
217 0.0 6.80 1,379 219 -1.1 7.18 805
218 -0.4 6.76 1,224 220 -1.2 7.29 684
219 -0.6 6.78 1,050 221 -1.4 7.37 544
* Starting RIT Level is always based on grade 5 performance.Shaded cells indicate that starting RIT was outside the percentile range of 1-99.
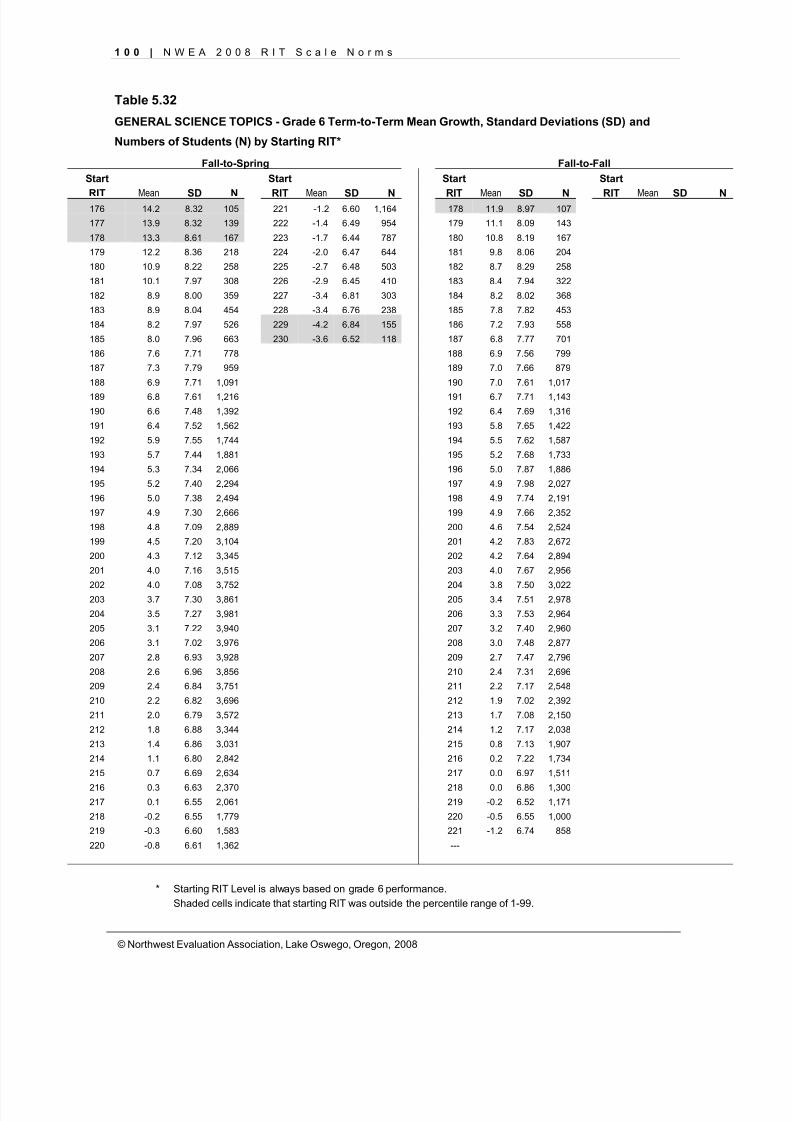
8/7/2019 NWEA Complete Norms2008
http://slidepdf.com/reader/full/nwea-complete-norms2008 110/170
1 0 0 | N W E A 2 0 0 8 R I T S c a l e N o r m s
© Northwest Evaluation Association, Lake Oswego, Oregon, 2008
Table 5.32
GENERAL SCIENCE TOPICS - Grade 6 Term-to-Term Mean Growth, Standard Deviations (SD) and
Numbers of Students (N) by Starting RIT*
Fall-to-Spring Fall-to-FallStart Start Start Start
RIT Mean SD N RIT Mean SD N RIT Mean SD N RIT Mean SD N176 14.2 8.32 105 221 -1.2 6.60 1,164 178 11.9 8.97 107
177 13.9 8.32 139 222 -1.4 6.49 954 179 11.1 8.09 143
178 13.3 8.61 167 223 -1.7 6.44 787 180 10.8 8.19 167
179 12.2 8.36 218 224 -2.0 6.47 644 181 9.8 8.06 204
180 10.9 8.22 258 225 -2.7 6.48 503 182 8.7 8.29 258
181 10.1 7.97 308 226 -2.9 6.45 410 183 8.4 7.94 322
182 8.9 8.00 359 227 -3.4 6.81 303 184 8.2 8.02 368
183 8.9 8.04 454 228 -3.4 6.76 238 185 7.8 7.82 453
184 8.2 7.97 526 229 -4.2 6.84 155 186 7.2 7.93 558
185 8.0 7.96 663 230 -3.6 6.52 118 187 6.8 7.77 701
186 7.6 7.71 778 188 6.9 7.56 799
187 7.3 7.79 959 189 7.0 7.66 879
188 6.9 7.71 1,091 190 7.0 7.61 1,017
189 6.8 7.61 1,216 191 6.7 7.71 1,143
190 6.6 7.48 1,392 192 6.4 7.69 1,316
191 6.4 7.52 1,562 193 5.8 7.65 1,422
192 5.9 7.55 1,744 194 5.5 7.62 1,587
193 5.7 7.44 1,881 195 5.2 7.68 1,733
194 5.3 7.34 2,066 196 5.0 7.87 1,886
195 5.2 7.40 2,294 197 4.9 7.98 2,027
196 5.0 7.38 2,494 198 4.9 7.74 2,191
197 4.9 7.30 2,666 199 4.9 7.66 2,352
198 4.8 7.09 2,889 200 4.6 7.54 2,524
199 4.5 7.20 3,104 201 4.2 7.83 2,672
200 4.3 7.12 3,345 202 4.2 7.64 2,894
201 4.0 7.16 3,515 203 4.0 7.67 2,956
202 4.0 7.08 3,752 204 3.8 7.50 3,022203 3.7 7.30 3,861 205 3.4 7.51 2,978
204 3.5 7.27 3,981 206 3.3 7.53 2,964
205 3.1 7.22 3,940 207 3.2 7.40 2,960
206 3.1 7.02 3,976 208 3.0 7.48 2,877
207 2.8 6.93 3,928 209 2.7 7.47 2,796
208 2.6 6.96 3,856 210 2.4 7.31 2,696
209 2.4 6.84 3,751 211 2.2 7.17 2,548
210 2.2 6.82 3,696 212 1.9 7.02 2,392
211 2.0 6.79 3,572 213 1.7 7.08 2,150
212 1.8 6.88 3,344 214 1.2 7.17 2,038
213 1.4 6.86 3,031 215 0.8 7.13 1,907
214 1.1 6.80 2,842 216 0.2 7.22 1,734
215 0.7 6.69 2,634 217 0.0 6.97 1,511
216 0.3 6.63 2,370 218 0.0 6.86 1,300217 0.1 6.55 2,061 219 -0.2 6.52 1,171
218 -0.2 6.55 1,779 220 -0.5 6.55 1,000
219 -0.3 6.60 1,583 221 -1.2 6.74 858
220 -0.8 6.61 1,362 ---
* Starting RIT Level is always based on grade 6 performance.Shaded cells indicate that starting RIT was outside the percentile range of 1-99.
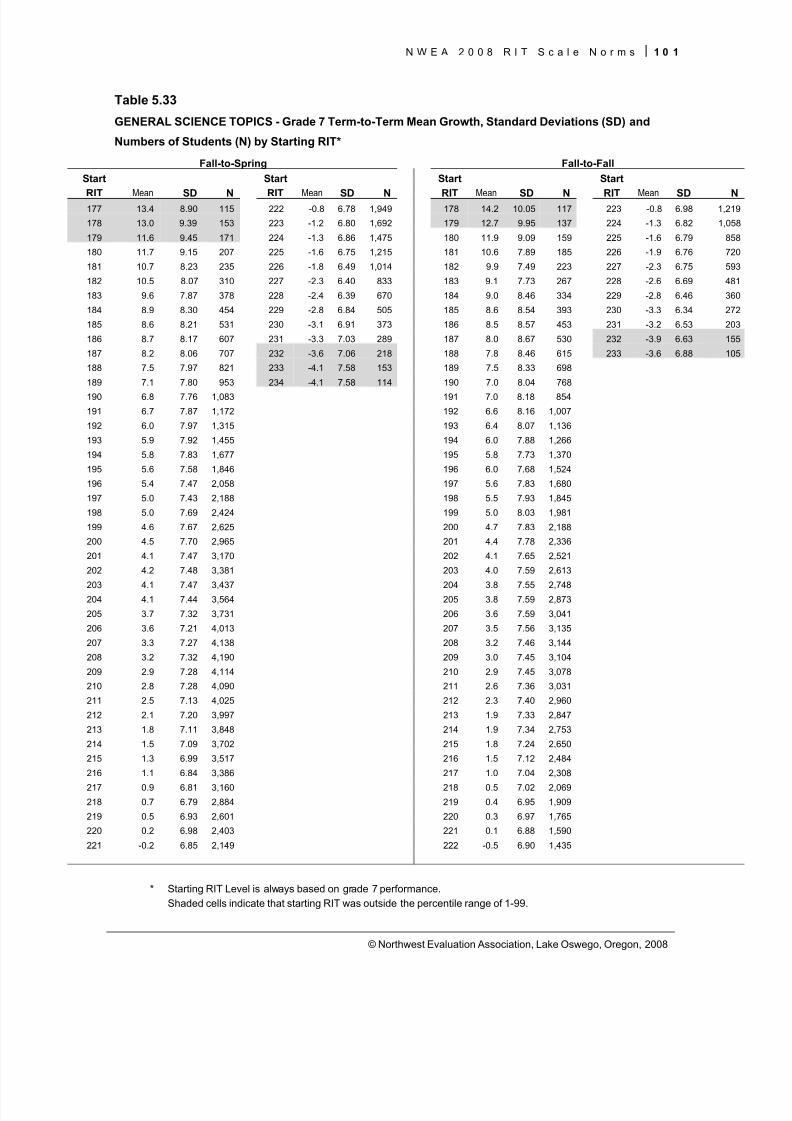
8/7/2019 NWEA Complete Norms2008
http://slidepdf.com/reader/full/nwea-complete-norms2008 111/170
N W E A 2 0 0 8 R I T S c a l e N o r m s 1 0 1
© Northwest Evaluation Association, Lake Oswego, Oregon, 2008
Table 5.33
GENERAL SCIENCE TOPICS - Grade 7 Term-to-Term Mean Growth, Standard Deviations (SD) and
Numbers of Students (N) by Starting RIT*
Fall-to-Spring Fall-to-FallStart Start Start Start
RIT Mean SD N RIT Mean SD N RIT Mean SD N RIT Mean SD N177 13.4 8.90 115 222 -0.8 6.78 1,949 178 14.2 10.05 117 223 -0.8 6.98 1,219
178 13.0 9.39 153 223 -1.2 6.80 1,692 179 12.7 9.95 137 224 -1.3 6.82 1,058
179 11.6 9.45 171 224 -1.3 6.86 1,475 180 11.9 9.09 159 225 -1.6 6.79 858
180 11.7 9.15 207 225 -1.6 6.75 1,215 181 10.6 7.89 185 226 -1.9 6.76 720
181 10.7 8.23 235 226 -1.8 6.49 1,014 182 9.9 7.49 223 227 -2.3 6.75 593
182 10.5 8.07 310 227 -2.3 6.40 833 183 9.1 7.73 267 228 -2.6 6.69 481
183 9.6 7.87 378 228 -2.4 6.39 670 184 9.0 8.46 334 229 -2.8 6.46 360
184 8.9 8.30 454 229 -2.8 6.84 505 185 8.6 8.54 393 230 -3.3 6.34 272
185 8.6 8.21 531 230 -3.1 6.91 373 186 8.5 8.57 453 231 -3.2 6.53 203
186 8.7 8.17 607 231 -3.3 7.03 289 187 8.0 8.67 530 232 -3.9 6.63 155
187 8.2 8.06 707 232 -3.6 7.06 218 188 7.8 8.46 615 233 -3.6 6.88 105
188 7.5 7.97 821 233 -4.1 7.58 153 189 7.5 8.33 698
189 7.1 7.80 953 234 -4.1 7.58 114 190 7.0 8.04 768
190 6.8 7.76 1,083 191 7.0 8.18 854
191 6.7 7.87 1,172 192 6.6 8.16 1,007
192 6.0 7.97 1,315 193 6.4 8.07 1,136
193 5.9 7.92 1,455 194 6.0 7.88 1,266
194 5.8 7.83 1,677 195 5.8 7.73 1,370
195 5.6 7.58 1,846 196 6.0 7.68 1,524
196 5.4 7.47 2,058 197 5.6 7.83 1,680
197 5.0 7.43 2,188 198 5.5 7.93 1,845
198 5.0 7.69 2,424 199 5.0 8.03 1,981
199 4.6 7.67 2,625 200 4.7 7.83 2,188
200 4.5 7.70 2,965 201 4.4 7.78 2,336
201 4.1 7.47 3,170 202 4.1 7.65 2,521
202 4.2 7.48 3,381 203 4.0 7.59 2,613
203 4.1 7.47 3,437 204 3.8 7.55 2,748204 4.1 7.44 3,564 205 3.8 7.59 2,873
205 3.7 7.32 3,731 206 3.6 7.59 3,041
206 3.6 7.21 4,013 207 3.5 7.56 3,135
207 3.3 7.27 4,138 208 3.2 7.46 3,144
208 3.2 7.32 4,190 209 3.0 7.45 3,104
209 2.9 7.28 4,114 210 2.9 7.45 3,078
210 2.8 7.28 4,090 211 2.6 7.36 3,031
211 2.5 7.13 4,025 212 2.3 7.40 2,960
212 2.1 7.20 3,997 213 1.9 7.33 2,847
213 1.8 7.11 3,848 214 1.9 7.34 2,753
214 1.5 7.09 3,702 215 1.8 7.24 2,650
215 1.3 6.99 3,517 216 1.5 7.12 2,484
216 1.1 6.84 3,386 217 1.0 7.04 2,308
217 0.9 6.81 3,160 218 0.5 7.02 2,069218 0.7 6.79 2,884 219 0.4 6.95 1,909
219 0.5 6.93 2,601 220 0.3 6.97 1,765
220 0.2 6.98 2,403 221 0.1 6.88 1,590
221 -0.2 6.85 2,149 222 -0.5 6.90 1,435
* Starting RIT Level is always based on grade 7 performance.Shaded cells indicate that starting RIT was outside the percentile range of 1-99.
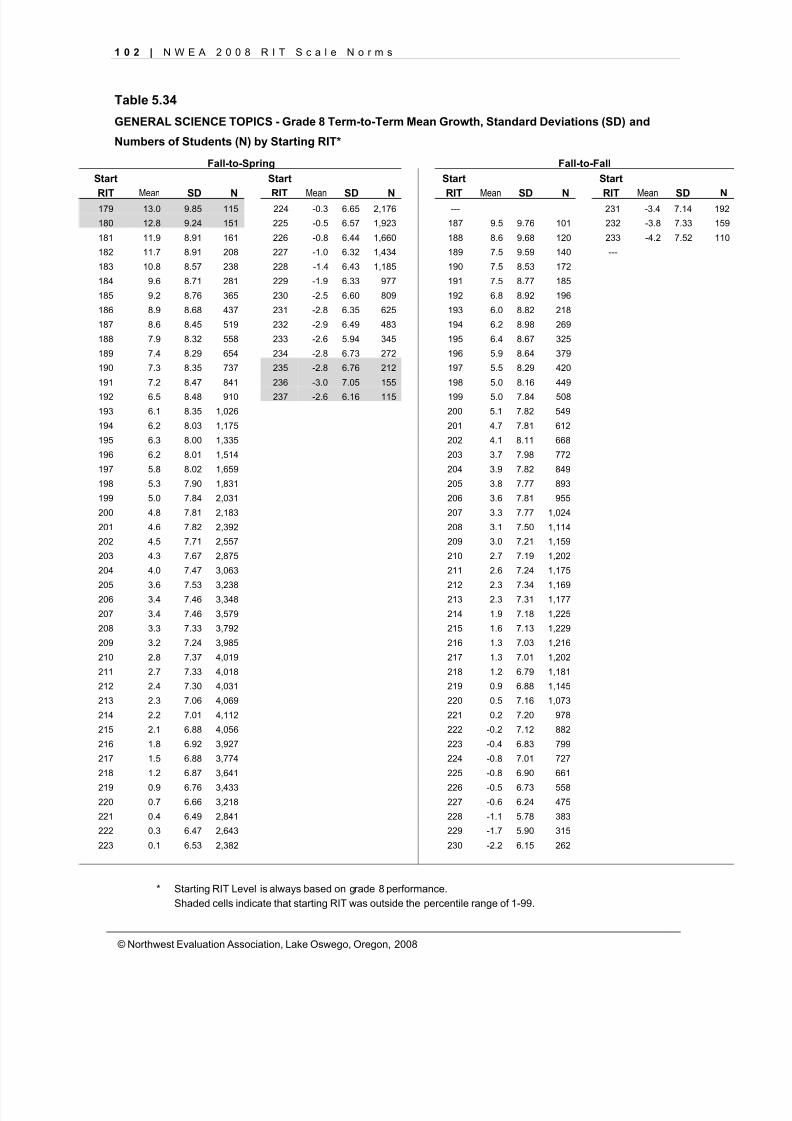
8/7/2019 NWEA Complete Norms2008
http://slidepdf.com/reader/full/nwea-complete-norms2008 112/170
1 0 2 | N W E A 2 0 0 8 R I T S c a l e N o r m s
© Northwest Evaluation Association, Lake Oswego, Oregon, 2008
Table 5.34
GENERAL SCIENCE TOPICS - Grade 8 Term-to-Term Mean Growth, Standard Deviations (SD) and
Numbers of Students (N) by Starting RIT*
Fall-to-Spring Fall-to-FallStart Start Start Start
RIT Mean SD N RIT Mean SD N RIT Mean SD N RIT Mean SD N179 13.0 9.85 115 224 -0.3 6.65 2,176 --- 231 -3.4 7.14 192
180 12.8 9.24 151 225 -0.5 6.57 1,923 187 9.5 9.76 101 232 -3.8 7.33 159
181 11.9 8.91 161 226 -0.8 6.44 1,660 188 8.6 9.68 120 233 -4.2 7.52 110
182 11.7 8.91 208 227 -1.0 6.32 1,434 189 7.5 9.59 140 ---
183 10.8 8.57 238 228 -1.4 6.43 1,185 190 7.5 8.53 172
184 9.6 8.71 281 229 -1.9 6.33 977 191 7.5 8.77 185
185 9.2 8.76 365 230 -2.5 6.60 809 192 6.8 8.92 196
186 8.9 8.68 437 231 -2.8 6.35 625 193 6.0 8.82 218
187 8.6 8.45 519 232 -2.9 6.49 483 194 6.2 8.98 269
188 7.9 8.32 558 233 -2.6 5.94 345 195 6.4 8.67 325
189 7.4 8.29 654 234 -2.8 6.73 272 196 5.9 8.64 379
190 7.3 8.35 737 235 -2.8 6.76 212 197 5.5 8.29 420
191 7.2 8.47 841 236 -3.0 7.05 155 198 5.0 8.16 449
192 6.5 8.48 910 237 -2.6 6.16 115 199 5.0 7.84 508
193 6.1 8.35 1,026 200 5.1 7.82 549
194 6.2 8.03 1,175 201 4.7 7.81 612
195 6.3 8.00 1,335 202 4.1 8.11 668
196 6.2 8.01 1,514 203 3.7 7.98 772
197 5.8 8.02 1,659 204 3.9 7.82 849
198 5.3 7.90 1,831 205 3.8 7.77 893
199 5.0 7.84 2,031 206 3.6 7.81 955
200 4.8 7.81 2,183 207 3.3 7.77 1,024
201 4.6 7.82 2,392 208 3.1 7.50 1,114
202 4.5 7.71 2,557 209 3.0 7.21 1,159
203 4.3 7.67 2,875 210 2.7 7.19 1,202
204 4.0 7.47 3,063 211 2.6 7.24 1,175
205 3.6 7.53 3,238 212 2.3 7.34 1,169206 3.4 7.46 3,348 213 2.3 7.31 1,177
207 3.4 7.46 3,579 214 1.9 7.18 1,225
208 3.3 7.33 3,792 215 1.6 7.13 1,229
209 3.2 7.24 3,985 216 1.3 7.03 1,216
210 2.8 7.37 4,019 217 1.3 7.01 1,202
211 2.7 7.33 4,018 218 1.2 6.79 1,181
212 2.4 7.30 4,031 219 0.9 6.88 1,145
213 2.3 7.06 4,069 220 0.5 7.16 1,073
214 2.2 7.01 4,112 221 0.2 7.20 978
215 2.1 6.88 4,056 222 -0.2 7.12 882
216 1.8 6.92 3,927 223 -0.4 6.83 799
217 1.5 6.88 3,774 224 -0.8 7.01 727
218 1.2 6.87 3,641 225 -0.8 6.90 661
219 0.9 6.76 3,433 226 -0.5 6.73 558220 0.7 6.66 3,218 227 -0.6 6.24 475
221 0.4 6.49 2,841 228 -1.1 5.78 383
222 0.3 6.47 2,643 229 -1.7 5.90 315
223 0.1 6.53 2,382 230 -2.2 6.15 262
* Starting RIT Level is always based on grade 8 performance.Shaded cells indicate that starting RIT was outside the percentile range of 1-99.
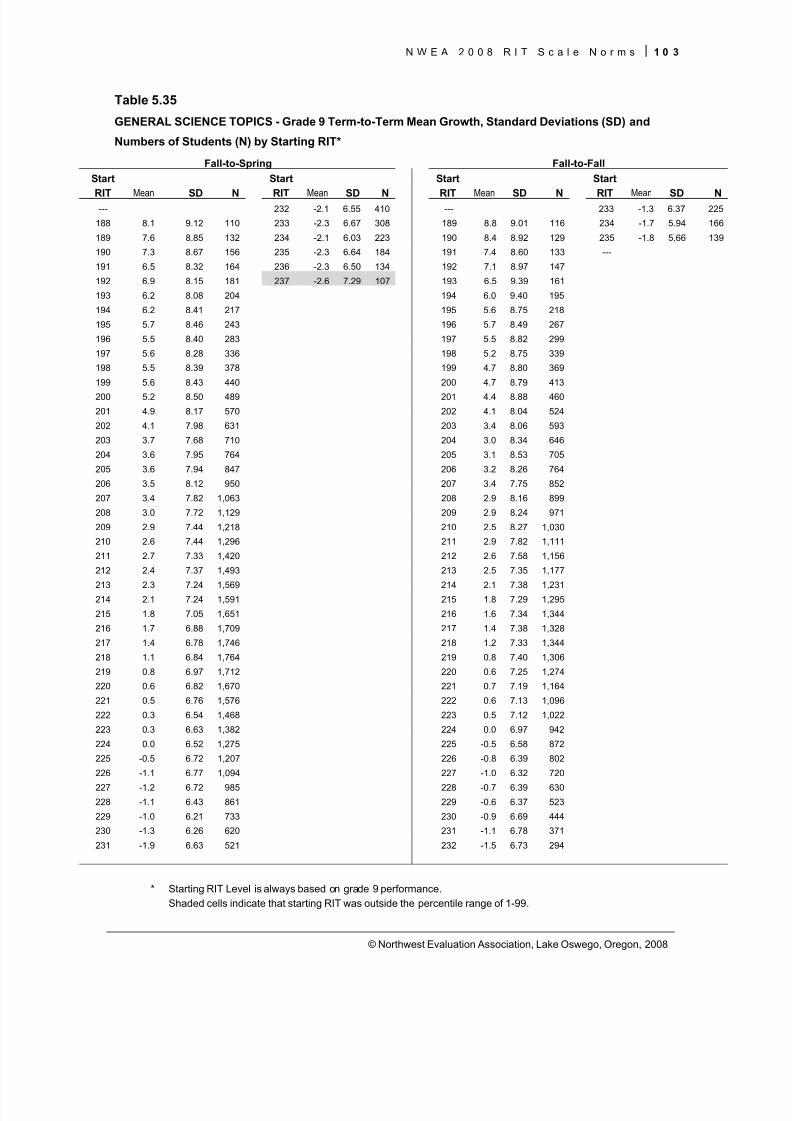
8/7/2019 NWEA Complete Norms2008
http://slidepdf.com/reader/full/nwea-complete-norms2008 113/170
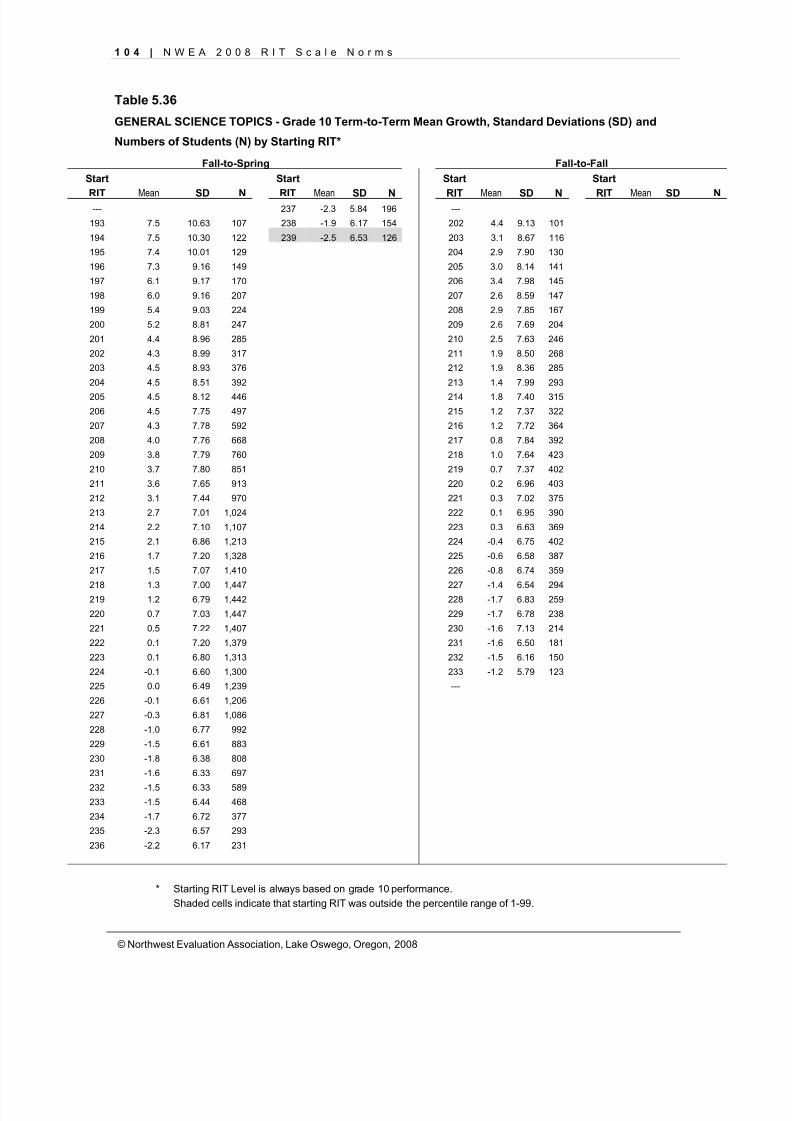
8/7/2019 NWEA Complete Norms2008
http://slidepdf.com/reader/full/nwea-complete-norms2008 114/170
1 0 4 | N W E A 2 0 0 8 R I T S c a l e N o r m s
© Northwest Evaluation Association, Lake Oswego, Oregon, 2008
Table 5.36
GENERAL SCIENCE TOPICS - Grade 10 Term-to-Term Mean Growth, Standard Deviations (SD) and
Numbers of Students (N) by Starting RIT*
Fall-to-Spring Fall-to-FallStart Start Start Start
RIT Mean SD N RIT Mean SD N RIT Mean SD N RIT Mean SD N--- 237 -2.3 5.84 196 ---
193 7.5 10.63 107 238 -1.9 6.17 154 202 4.4 9.13 101
194 7.5 10.30 122 239 -2.5 6.53 126 203 3.1 8.67 116
195 7.4 10.01 129 204 2.9 7.90 130
196 7.3 9.16 149 205 3.0 8.14 141
197 6.1 9.17 170 206 3.4 7.98 145
198 6.0 9.16 207 207 2.6 8.59 147
199 5.4 9.03 224 208 2.9 7.85 167
200 5.2 8.81 247 209 2.6 7.69 204
201 4.4 8.96 285 210 2.5 7.63 246
202 4.3 8.99 317 211 1.9 8.50 268
203 4.5 8.93 376 212 1.9 8.36 285
204 4.5 8.51 392 213 1.4 7.99 293
205 4.5 8.12 446 214 1.8 7.40 315
206 4.5 7.75 497 215 1.2 7.37 322
207 4.3 7.78 592 216 1.2 7.72 364
208 4.0 7.76 668 217 0.8 7.84 392
209 3.8 7.79 760 218 1.0 7.64 423
210 3.7 7.80 851 219 0.7 7.37 402
211 3.6 7.65 913 220 0.2 6.96 403
212 3.1 7.44 970 221 0.3 7.02 375
213 2.7 7.01 1,024 222 0.1 6.95 390
214 2.2 7.10 1,107 223 0.3 6.63 369
215 2.1 6.86 1,213 224 -0.4 6.75 402
216 1.7 7.20 1,328 225 -0.6 6.58 387
217 1.5 7.07 1,410 226 -0.8 6.74 359
218 1.3 7.00 1,447 227 -1.4 6.54 294219 1.2 6.79 1,442 228 -1.7 6.83 259
220 0.7 7.03 1,447 229 -1.7 6.78 238
221 0.5 7.22 1,407 230 -1.6 7.13 214
222 0.1 7.20 1,379 231 -1.6 6.50 181
223 0.1 6.80 1,313 232 -1.5 6.16 150
224 -0.1 6.60 1,300 233 -1.2 5.79 123
225 0.0 6.49 1,239 ---
226 -0.1 6.61 1,206
227 -0.3 6.81 1,086
228 -1.0 6.77 992
229 -1.5 6.61 883
230 -1.8 6.38 808
231 -1.6 6.33 697
232 -1.5 6.33 589233 -1.5 6.44 468
234 -1.7 6.72 377
235 -2.3 6.57 293
236 -2.2 6.17 231
* Starting RIT Level is always based on grade 10 performance.Shaded cells indicate that starting RIT was outside the percentile range of 1-99.
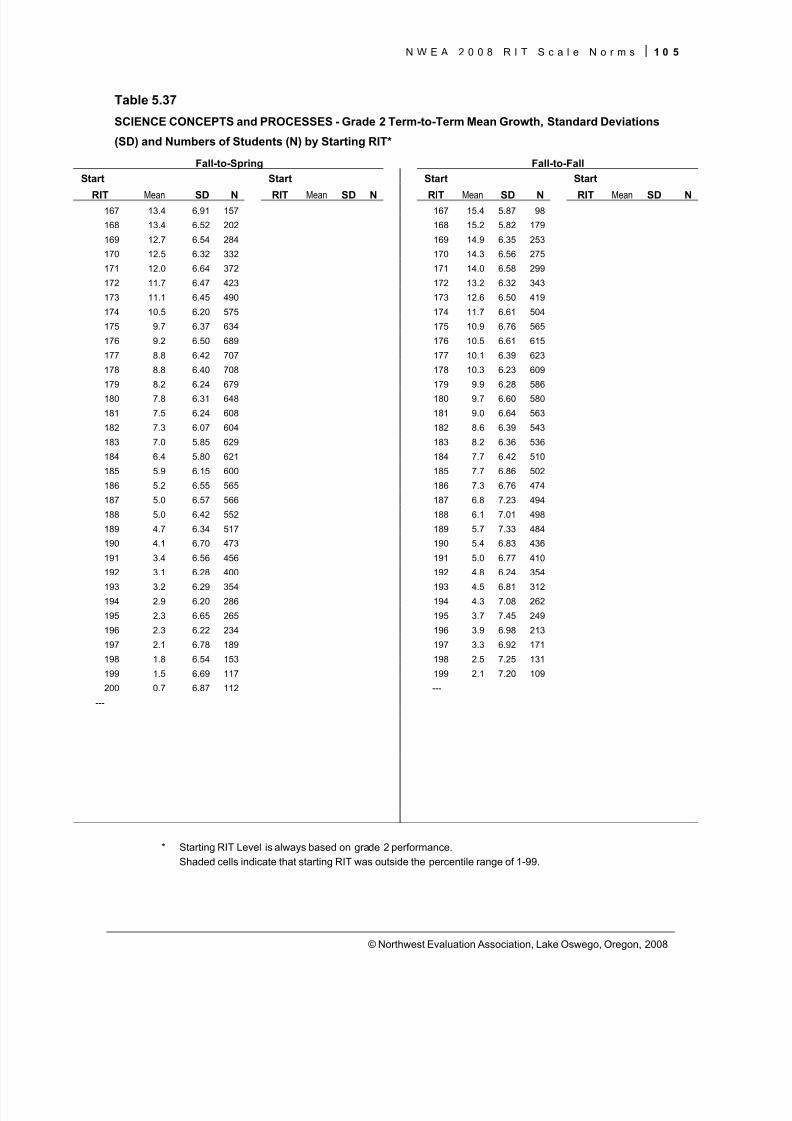
8/7/2019 NWEA Complete Norms2008
http://slidepdf.com/reader/full/nwea-complete-norms2008 115/170
N W E A 2 0 0 8 R I T S c a l e N o r m s 1 0 5
© Northwest Evaluation Association, Lake Oswego, Oregon, 2008
Table 5.37
SCIENCE CONCEPTS and PROCESSES - Grade 2 Term-to-Term Mean Growth, Standard Deviations
(SD) and Numbers of Students (N) by Starting RIT*
Fall-to-Spring Fall-to-FallStart Start Start Start
RIT Mean SD N RIT Mean SD N RIT Mean SD N RIT Mean SD N167 13.4 6.91 157 167 15.4 5.87 98
168 13.4 6.52 202 168 15.2 5.82 179
169 12.7 6.54 284 169 14.9 6.35 253
170 12.5 6.32 332 170 14.3 6.56 275
171 12.0 6.64 372 171 14.0 6.58 299
172 11.7 6.47 423 172 13.2 6.32 343
173 11.1 6.45 490 173 12.6 6.50 419
174 10.5 6.20 575 174 11.7 6.61 504
175 9.7 6.37 634 175 10.9 6.76 565
176 9.2 6.50 689 176 10.5 6.61 615
177 8.8 6.42 707 177 10.1 6.39 623
178 8.8 6.40 708 178 10.3 6.23 609
179 8.2 6.24 679 179 9.9 6.28 586
180 7.8 6.31 648 180 9.7 6.60 580
181 7.5 6.24 608 181 9.0 6.64 563
182 7.3 6.07 604 182 8.6 6.39 543
183 7.0 5.85 629 183 8.2 6.36 536
184 6.4 5.80 621 184 7.7 6.42 510
185 5.9 6.15 600 185 7.7 6.86 502
186 5.2 6.55 565 186 7.3 6.76 474
187 5.0 6.57 566 187 6.8 7.23 494
188 5.0 6.42 552 188 6.1 7.01 498
189 4.7 6.34 517 189 5.7 7.33 484
190 4.1 6.70 473 190 5.4 6.83 436
191 3.4 6.56 456 191 5.0 6.77 410
192 3.1 6.28 400 192 4.8 6.24 354
193 3.2 6.29 354 193 4.5 6.81 312194 2.9 6.20 286 194 4.3 7.08 262
195 2.3 6.65 265 195 3.7 7.45 249
196 2.3 6.22 234 196 3.9 6.98 213
197 2.1 6.78 189 197 3.3 6.92 171
198 1.8 6.54 153 198 2.5 7.25 131
199 1.5 6.69 117 199 2.1 7.20 109
200 0.7 6.87 112 ---
---
* Starting RIT Level is always based on grade 2 performance.Shaded cells indicate that starting RIT was outside the percentile range of 1-99.
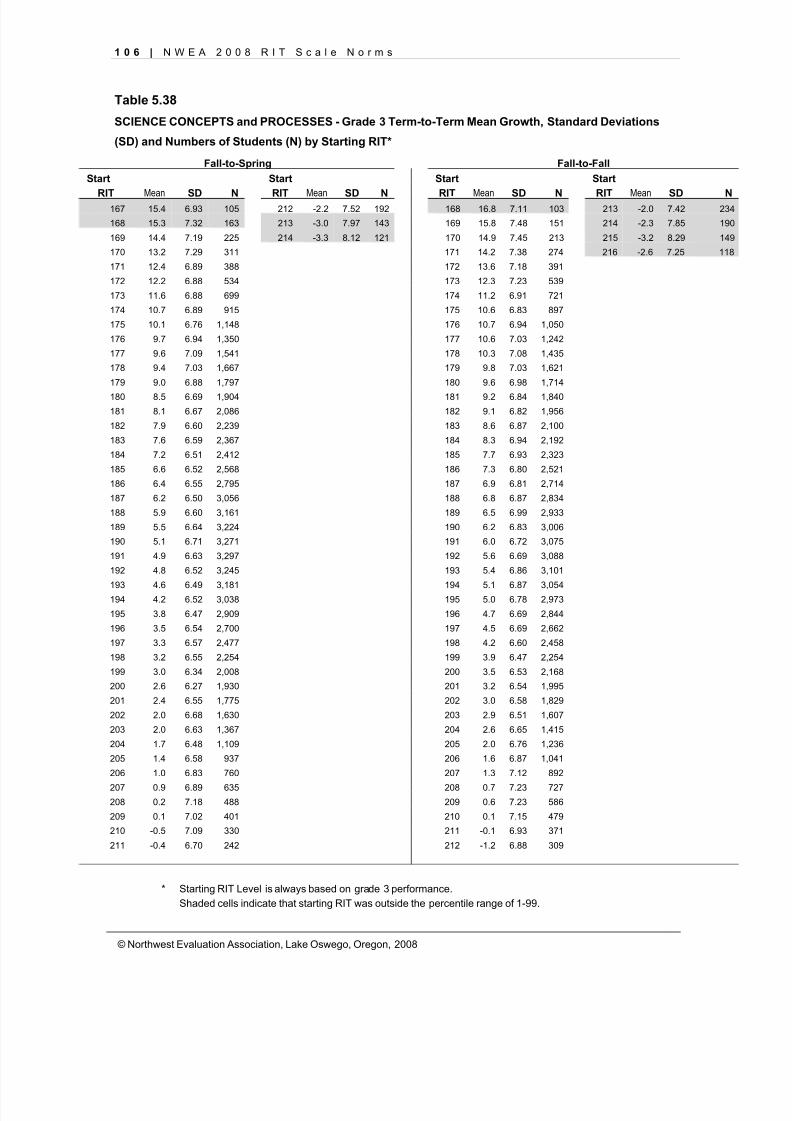
8/7/2019 NWEA Complete Norms2008
http://slidepdf.com/reader/full/nwea-complete-norms2008 116/170
1 0 6 | N W E A 2 0 0 8 R I T S c a l e N o r m s
© Northwest Evaluation Association, Lake Oswego, Oregon, 2008
Table 5.38
SCIENCE CONCEPTS and PROCESSES - Grade 3 Term-to-Term Mean Growth, Standard Deviations
(SD) and Numbers of Students (N) by Starting RIT*
Fall-to-Spring Fall-to-FallStart Start Start Start
RIT Mean SD N RIT Mean SD N RIT Mean SD N RIT Mean SD N167 15.4 6.93 105 212 -2.2 7.52 192 168 16.8 7.11 103 213 -2.0 7.42 234
168 15.3 7.32 163 213 -3.0 7.97 143 169 15.8 7.48 151 214 -2.3 7.85 190
169 14.4 7.19 225 214 -3.3 8.12 121 170 14.9 7.45 213 215 -3.2 8.29 149
170 13.2 7.29 311 171 14.2 7.38 274 216 -2.6 7.25 118
171 12.4 6.89 388 172 13.6 7.18 391
172 12.2 6.88 534 173 12.3 7.23 539
173 11.6 6.88 699 174 11.2 6.91 721
174 10.7 6.89 915 175 10.6 6.83 897
175 10.1 6.76 1,148 176 10.7 6.94 1,050
176 9.7 6.94 1,350 177 10.6 7.03 1,242
177 9.6 7.09 1,541 178 10.3 7.08 1,435
178 9.4 7.03 1,667 179 9.8 7.03 1,621
179 9.0 6.88 1,797 180 9.6 6.98 1,714
180 8.5 6.69 1,904 181 9.2 6.84 1,840
181 8.1 6.67 2,086 182 9.1 6.82 1,956
182 7.9 6.60 2,239 183 8.6 6.87 2,100
183 7.6 6.59 2,367 184 8.3 6.94 2,192
184 7.2 6.51 2,412 185 7.7 6.93 2,323
185 6.6 6.52 2,568 186 7.3 6.80 2,521
186 6.4 6.55 2,795 187 6.9 6.81 2,714
187 6.2 6.50 3,056 188 6.8 6.87 2,834
188 5.9 6.60 3,161 189 6.5 6.99 2,933
189 5.5 6.64 3,224 190 6.2 6.83 3,006
190 5.1 6.71 3,271 191 6.0 6.72 3,075
191 4.9 6.63 3,297 192 5.6 6.69 3,088
192 4.8 6.52 3,245 193 5.4 6.86 3,101
193 4.6 6.49 3,181 194 5.1 6.87 3,054194 4.2 6.52 3,038 195 5.0 6.78 2,973
195 3.8 6.47 2,909 196 4.7 6.69 2,844
196 3.5 6.54 2,700 197 4.5 6.69 2,662
197 3.3 6.57 2,477 198 4.2 6.60 2,458
198 3.2 6.55 2,254 199 3.9 6.47 2,254
199 3.0 6.34 2,008 200 3.5 6.53 2,168
200 2.6 6.27 1,930 201 3.2 6.54 1,995
201 2.4 6.55 1,775 202 3.0 6.58 1,829
202 2.0 6.68 1,630 203 2.9 6.51 1,607
203 2.0 6.63 1,367 204 2.6 6.65 1,415
204 1.7 6.48 1,109 205 2.0 6.76 1,236
205 1.4 6.58 937 206 1.6 6.87 1,041
206 1.0 6.83 760 207 1.3 7.12 892
207 0.9 6.89 635 208 0.7 7.23 727208 0.2 7.18 488 209 0.6 7.23 586
209 0.1 7.02 401 210 0.1 7.15 479
210 -0.5 7.09 330 211 -0.1 6.93 371
211 -0.4 6.70 242 212 -1.2 6.88 309
* Starting RIT Level is always based on grade 3 performance.Shaded cells indicate that starting RIT was outside the percentile range of 1-99.
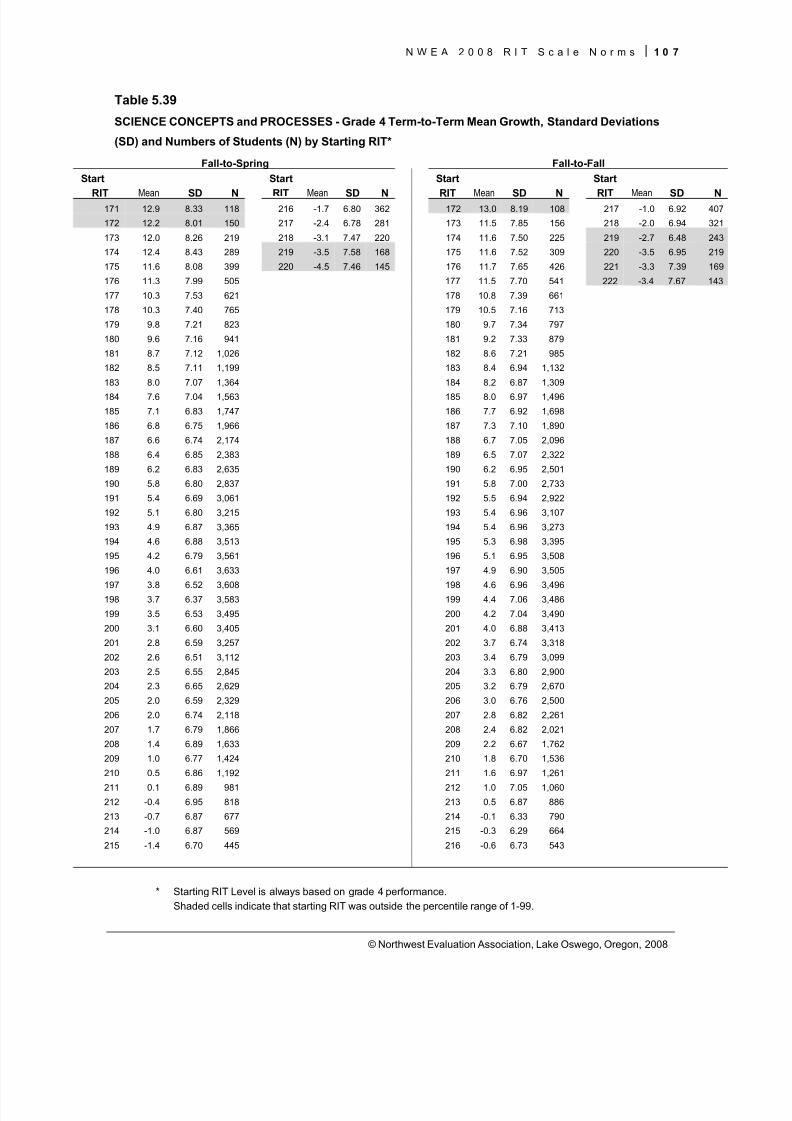
8/7/2019 NWEA Complete Norms2008
http://slidepdf.com/reader/full/nwea-complete-norms2008 117/170
N W E A 2 0 0 8 R I T S c a l e N o r m s 1 0 7
© Northwest Evaluation Association, Lake Oswego, Oregon, 2008
Table 5.39
SCIENCE CONCEPTS and PROCESSES - Grade 4 Term-to-Term Mean Growth, Standard Deviations
(SD) and Numbers of Students (N) by Starting RIT*
Fall-to-Spring Fall-to-FallStart Start Start Start
RIT Mean SD N RIT Mean SD N RIT Mean SD N RIT Mean SD N171 12.9 8.33 118 216 -1.7 6.80 362 172 13.0 8.19 108 217 -1.0 6.92 407
172 12.2 8.01 150 217 -2.4 6.78 281 173 11.5 7.85 156 218 -2.0 6.94 321
173 12.0 8.26 219 218 -3.1 7.47 220 174 11.6 7.50 225 219 -2.7 6.48 243
174 12.4 8.43 289 219 -3.5 7.58 168 175 11.6 7.52 309 220 -3.5 6.95 219
175 11.6 8.08 399 220 -4.5 7.46 145 176 11.7 7.65 426 221 -3.3 7.39 169
176 11.3 7.99 505 177 11.5 7.70 541 222 -3.4 7.67 143
177 10.3 7.53 621 178 10.8 7.39 661
178 10.3 7.40 765 179 10.5 7.16 713
179 9.8 7.21 823 180 9.7 7.34 797
180 9.6 7.16 941 181 9.2 7.33 879
181 8.7 7.12 1,026 182 8.6 7.21 985
182 8.5 7.11 1,199 183 8.4 6.94 1,132
183 8.0 7.07 1,364 184 8.2 6.87 1,309
184 7.6 7.04 1,563 185 8.0 6.97 1,496
185 7.1 6.83 1,747 186 7.7 6.92 1,698
186 6.8 6.75 1,966 187 7.3 7.10 1,890
187 6.6 6.74 2,174 188 6.7 7.05 2,096
188 6.4 6.85 2,383 189 6.5 7.07 2,322
189 6.2 6.83 2,635 190 6.2 6.95 2,501
190 5.8 6.80 2,837 191 5.8 7.00 2,733
191 5.4 6.69 3,061 192 5.5 6.94 2,922
192 5.1 6.80 3,215 193 5.4 6.96 3,107
193 4.9 6.87 3,365 194 5.4 6.96 3,273
194 4.6 6.88 3,513 195 5.3 6.98 3,395
195 4.2 6.79 3,561 196 5.1 6.95 3,508
196 4.0 6.61 3,633 197 4.9 6.90 3,505
197 3.8 6.52 3,608 198 4.6 6.96 3,496198 3.7 6.37 3,583 199 4.4 7.06 3,486
199 3.5 6.53 3,495 200 4.2 7.04 3,490
200 3.1 6.60 3,405 201 4.0 6.88 3,413
201 2.8 6.59 3,257 202 3.7 6.74 3,318
202 2.6 6.51 3,112 203 3.4 6.79 3,099
203 2.5 6.55 2,845 204 3.3 6.80 2,900
204 2.3 6.65 2,629 205 3.2 6.79 2,670
205 2.0 6.59 2,329 206 3.0 6.76 2,500
206 2.0 6.74 2,118 207 2.8 6.82 2,261
207 1.7 6.79 1,866 208 2.4 6.82 2,021
208 1.4 6.89 1,633 209 2.2 6.67 1,762
209 1.0 6.77 1,424 210 1.8 6.70 1,536
210 0.5 6.86 1,192 211 1.6 6.97 1,261
211 0.1 6.89 981 212 1.0 7.05 1,060212 -0.4 6.95 818 213 0.5 6.87 886
213 -0.7 6.87 677 214 -0.1 6.33 790
214 -1.0 6.87 569 215 -0.3 6.29 664
215 -1.4 6.70 445 216 -0.6 6.73 543
* Starting RIT Level is always based on grade 4 performance.Shaded cells indicate that starting RIT was outside the percentile range of 1-99.
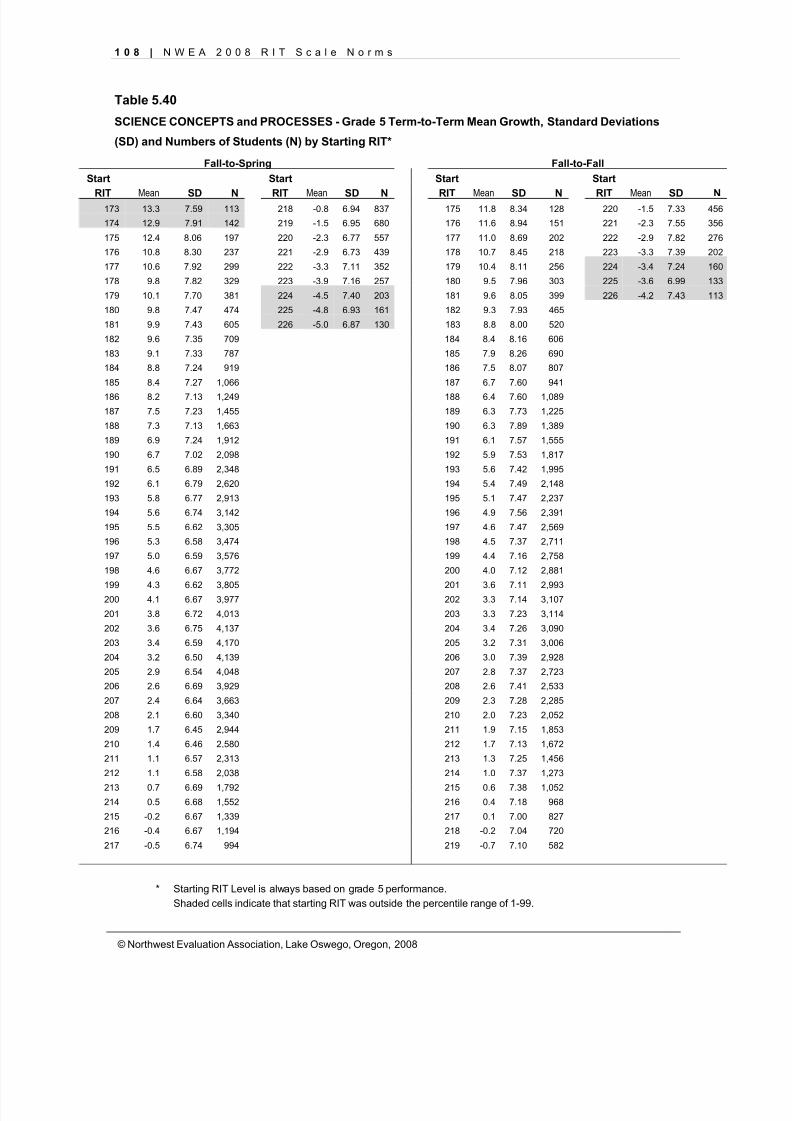
8/7/2019 NWEA Complete Norms2008
http://slidepdf.com/reader/full/nwea-complete-norms2008 118/170
1 0 8 | N W E A 2 0 0 8 R I T S c a l e N o r m s
© Northwest Evaluation Association, Lake Oswego, Oregon, 2008
Table 5.40
SCIENCE CONCEPTS and PROCESSES - Grade 5 Term-to-Term Mean Growth, Standard Deviations
(SD) and Numbers of Students (N) by Starting RIT*
Fall-to-Spring Fall-to-FallStart Start Start Start
RIT Mean SD N RIT Mean SD N RIT Mean SD N RIT Mean SD N173 13.3 7.59 113 218 -0.8 6.94 837 175 11.8 8.34 128 220 -1.5 7.33 456
174 12.9 7.91 142 219 -1.5 6.95 680 176 11.6 8.94 151 221 -2.3 7.55 356
175 12.4 8.06 197 220 -2.3 6.77 557 177 11.0 8.69 202 222 -2.9 7.82 276
176 10.8 8.30 237 221 -2.9 6.73 439 178 10.7 8.45 218 223 -3.3 7.39 202
177 10.6 7.92 299 222 -3.3 7.11 352 179 10.4 8.11 256 224 -3.4 7.24 160
178 9.8 7.82 329 223 -3.9 7.16 257 180 9.5 7.96 303 225 -3.6 6.99 133
179 10.1 7.70 381 224 -4.5 7.40 203 181 9.6 8.05 399 226 -4.2 7.43 113
180 9.8 7.47 474 225 -4.8 6.93 161 182 9.3 7.93 465
181 9.9 7.43 605 226 -5.0 6.87 130 183 8.8 8.00 520
182 9.6 7.35 709 184 8.4 8.16 606
183 9.1 7.33 787 185 7.9 8.26 690
184 8.8 7.24 919 186 7.5 8.07 807
185 8.4 7.27 1,066 187 6.7 7.60 941
186 8.2 7.13 1,249 188 6.4 7.60 1,089
187 7.5 7.23 1,455 189 6.3 7.73 1,225
188 7.3 7.13 1,663 190 6.3 7.89 1,389
189 6.9 7.24 1,912 191 6.1 7.57 1,555
190 6.7 7.02 2,098 192 5.9 7.53 1,817
191 6.5 6.89 2,348 193 5.6 7.42 1,995
192 6.1 6.79 2,620 194 5.4 7.49 2,148
193 5.8 6.77 2,913 195 5.1 7.47 2,237
194 5.6 6.74 3,142 196 4.9 7.56 2,391
195 5.5 6.62 3,305 197 4.6 7.47 2,569
196 5.3 6.58 3,474 198 4.5 7.37 2,711
197 5.0 6.59 3,576 199 4.4 7.16 2,758
198 4.6 6.67 3,772 200 4.0 7.12 2,881
199 4.3 6.62 3,805 201 3.6 7.11 2,993200 4.1 6.67 3,977 202 3.3 7.14 3,107
201 3.8 6.72 4,013 203 3.3 7.23 3,114
202 3.6 6.75 4,137 204 3.4 7.26 3,090
203 3.4 6.59 4,170 205 3.2 7.31 3,006
204 3.2 6.50 4,139 206 3.0 7.39 2,928
205 2.9 6.54 4,048 207 2.8 7.37 2,723
206 2.6 6.69 3,929 208 2.6 7.41 2,533
207 2.4 6.64 3,663 209 2.3 7.28 2,285
208 2.1 6.60 3,340 210 2.0 7.23 2,052
209 1.7 6.45 2,944 211 1.9 7.15 1,853
210 1.4 6.46 2,580 212 1.7 7.13 1,672
211 1.1 6.57 2,313 213 1.3 7.25 1,456
212 1.1 6.58 2,038 214 1.0 7.37 1,273
213 0.7 6.69 1,792 215 0.6 7.38 1,052214 0.5 6.68 1,552 216 0.4 7.18 968
215 -0.2 6.67 1,339 217 0.1 7.00 827
216 -0.4 6.67 1,194 218 -0.2 7.04 720
217 -0.5 6.74 994 219 -0.7 7.10 582
* Starting RIT Level is always based on grade 5 performance.Shaded cells indicate that starting RIT was outside the percentile range of 1-99.
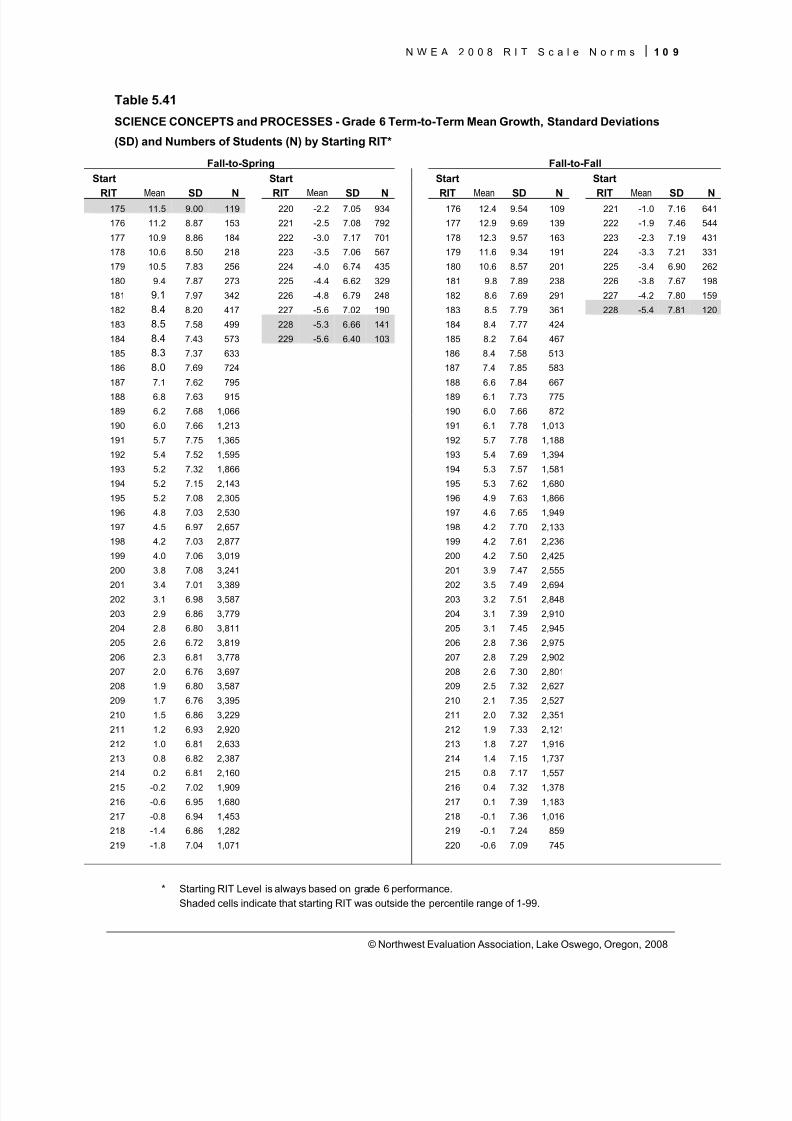
8/7/2019 NWEA Complete Norms2008
http://slidepdf.com/reader/full/nwea-complete-norms2008 119/170
N W E A 2 0 0 8 R I T S c a l e N o r m s 1 0 9
© Northwest Evaluation Association, Lake Oswego, Oregon, 2008
Table 5.41
SCIENCE CONCEPTS and PROCESSES - Grade 6 Term-to-Term Mean Growth, Standard Deviations
(SD) and Numbers of Students (N) by Starting RIT*
Fall-to-Spring Fall-to-FallStart Start Start Start
RIT Mean SD N RIT Mean SD N RIT Mean SD N RIT Mean SD N175 11.5 9.00 119 220 -2.2 7.05 934 176 12.4 9.54 109 221 -1.0 7.16 641
176 11.2 8.87 153 221 -2.5 7.08 792 177 12.9 9.69 139 222 -1.9 7.46 544
177 10.9 8.86 184 222 -3.0 7.17 701 178 12.3 9.57 163 223 -2.3 7.19 431
178 10.6 8.50 218 223 -3.5 7.06 567 179 11.6 9.34 191 224 -3.3 7.21 331
179 10.5 7.83 256 224 -4.0 6.74 435 180 10.6 8.57 201 225 -3.4 6.90 262
180 9.4 7.87 273 225 -4.4 6.62 329 181 9.8 7.89 238 226 -3.8 7.67 198
181 9.1 7.97 342 226 -4.8 6.79 248 182 8.6 7.69 291 227 -4.2 7.80 159
182 8.4 8.20 417 227 -5.6 7.02 190 183 8.5 7.79 361 228 -5.4 7.81 120
183 8.5 7.58 499 228 -5.3 6.66 141 184 8.4 7.77 424
184 8.4 7.43 573 229 -5.6 6.40 103 185 8.2 7.64 467
185 8.3 7.37 633 186 8.4 7.58 513
186 8.0 7.69 724 187 7.4 7.85 583
187 7.1 7.62 795 188 6.6 7.84 667
188 6.8 7.63 915 189 6.1 7.73 775
189 6.2 7.68 1,066 190 6.0 7.66 872
190 6.0 7.66 1,213 191 6.1 7.78 1,013
191 5.7 7.75 1,365 192 5.7 7.78 1,188
192 5.4 7.52 1,595 193 5.4 7.69 1,394
193 5.2 7.32 1,866 194 5.3 7.57 1,581
194 5.2 7.15 2,143 195 5.3 7.62 1,680
195 5.2 7.08 2,305 196 4.9 7.63 1,866
196 4.8 7.03 2,530 197 4.6 7.65 1,949
197 4.5 6.97 2,657 198 4.2 7.70 2,133
198 4.2 7.03 2,877 199 4.2 7.61 2,236
199 4.0 7.06 3,019 200 4.2 7.50 2,425
200 3.8 7.08 3,241 201 3.9 7.47 2,555
201 3.4 7.01 3,389 202 3.5 7.49 2,694202 3.1 6.98 3,587 203 3.2 7.51 2,848
203 2.9 6.86 3,779 204 3.1 7.39 2,910
204 2.8 6.80 3,811 205 3.1 7.45 2,945
205 2.6 6.72 3,819 206 2.8 7.36 2,975
206 2.3 6.81 3,778 207 2.8 7.29 2,902
207 2.0 6.76 3,697 208 2.6 7.30 2,801
208 1.9 6.80 3,587 209 2.5 7.32 2,627
209 1.7 6.76 3,395 210 2.1 7.35 2,527
210 1.5 6.86 3,229 211 2.0 7.32 2,351
211 1.2 6.93 2,920 212 1.9 7.33 2,121
212 1.0 6.81 2,633 213 1.8 7.27 1,916
213 0.8 6.82 2,387 214 1.4 7.15 1,737
214 0.2 6.81 2,160 215 0.8 7.17 1,557
215 -0.2 7.02 1,909 216 0.4 7.32 1,378216 -0.6 6.95 1,680 217 0.1 7.39 1,183
217 -0.8 6.94 1,453 218 -0.1 7.36 1,016
218 -1.4 6.86 1,282 219 -0.1 7.24 859
219 -1.8 7.04 1,071 220 -0.6 7.09 745
* Starting RIT Level is always based on grade 6 performance.Shaded cells indicate that starting RIT was outside the percentile range of 1-99.
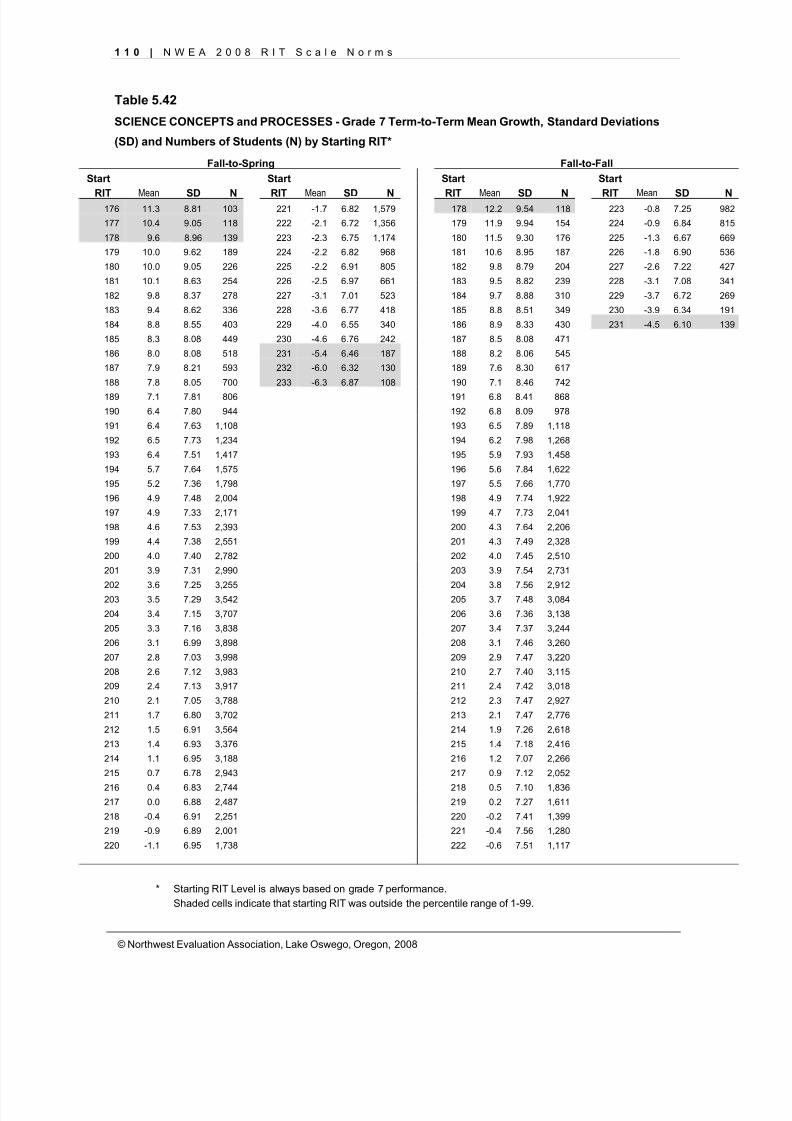
8/7/2019 NWEA Complete Norms2008
http://slidepdf.com/reader/full/nwea-complete-norms2008 120/170
1 1 0 | N W E A 2 0 0 8 R I T S c a l e N o r m s
© Northwest Evaluation Association, Lake Oswego, Oregon, 2008
Table 5.42
SCIENCE CONCEPTS and PROCESSES - Grade 7 Term-to-Term Mean Growth, Standard Deviations
(SD) and Numbers of Students (N) by Starting RIT*
Fall-to-Spring Fall-to-FallStart Start Start Start
RIT Mean SD N RIT Mean SD N RIT Mean SD N RIT Mean SD N176 11.3 8.81 103 221 -1.7 6.82 1,579 178 12.2 9.54 118 223 -0.8 7.25 982
177 10.4 9.05 118 222 -2.1 6.72 1,356 179 11.9 9.94 154 224 -0.9 6.84 815
178 9.6 8.96 139 223 -2.3 6.75 1,174 180 11.5 9.30 176 225 -1.3 6.67 669
179 10.0 9.62 189 224 -2.2 6.82 968 181 10.6 8.95 187 226 -1.8 6.90 536
180 10.0 9.05 226 225 -2.2 6.91 805 182 9.8 8.79 204 227 -2.6 7.22 427
181 10.1 8.63 254 226 -2.5 6.97 661 183 9.5 8.82 239 228 -3.1 7.08 341
182 9.8 8.37 278 227 -3.1 7.01 523 184 9.7 8.88 310 229 -3.7 6.72 269
183 9.4 8.62 336 228 -3.6 6.77 418 185 8.8 8.51 349 230 -3.9 6.34 191
184 8.8 8.55 403 229 -4.0 6.55 340 186 8.9 8.33 430 231 -4.5 6.10 139
185 8.3 8.08 449 230 -4.6 6.76 242 187 8.5 8.08 471
186 8.0 8.08 518 231 -5.4 6.46 187 188 8.2 8.06 545
187 7.9 8.21 593 232 -6.0 6.32 130 189 7.6 8.30 617
188 7.8 8.05 700 233 -6.3 6.87 108 190 7.1 8.46 742
189 7.1 7.81 806 191 6.8 8.41 868
190 6.4 7.80 944 192 6.8 8.09 978
191 6.4 7.63 1,108 193 6.5 7.89 1,118
192 6.5 7.73 1,234 194 6.2 7.98 1,268
193 6.4 7.51 1,417 195 5.9 7.93 1,458
194 5.7 7.64 1,575 196 5.6 7.84 1,622
195 5.2 7.36 1,798 197 5.5 7.66 1,770
196 4.9 7.48 2,004 198 4.9 7.74 1,922
197 4.9 7.33 2,171 199 4.7 7.73 2,041
198 4.6 7.53 2,393 200 4.3 7.64 2,206
199 4.4 7.38 2,551 201 4.3 7.49 2,328
200 4.0 7.40 2,782 202 4.0 7.45 2,510
201 3.9 7.31 2,990 203 3.9 7.54 2,731
202 3.6 7.25 3,255 204 3.8 7.56 2,912203 3.5 7.29 3,542 205 3.7 7.48 3,084
204 3.4 7.15 3,707 206 3.6 7.36 3,138
205 3.3 7.16 3,838 207 3.4 7.37 3,244
206 3.1 6.99 3,898 208 3.1 7.46 3,260
207 2.8 7.03 3,998 209 2.9 7.47 3,220
208 2.6 7.12 3,983 210 2.7 7.40 3,115
209 2.4 7.13 3,917 211 2.4 7.42 3,018
210 2.1 7.05 3,788 212 2.3 7.47 2,927
211 1.7 6.80 3,702 213 2.1 7.47 2,776
212 1.5 6.91 3,564 214 1.9 7.26 2,618
213 1.4 6.93 3,376 215 1.4 7.18 2,416
214 1.1 6.95 3,188 216 1.2 7.07 2,266
215 0.7 6.78 2,943 217 0.9 7.12 2,052
216 0.4 6.83 2,744 218 0.5 7.10 1,836217 0.0 6.88 2,487 219 0.2 7.27 1,611
218 -0.4 6.91 2,251 220 -0.2 7.41 1,399
219 -0.9 6.89 2,001 221 -0.4 7.56 1,280
220 -1.1 6.95 1,738 222 -0.6 7.51 1,117
* Starting RIT Level is always based on grade 7 performance.Shaded cells indicate that starting RIT was outside the percentile range of 1-99.
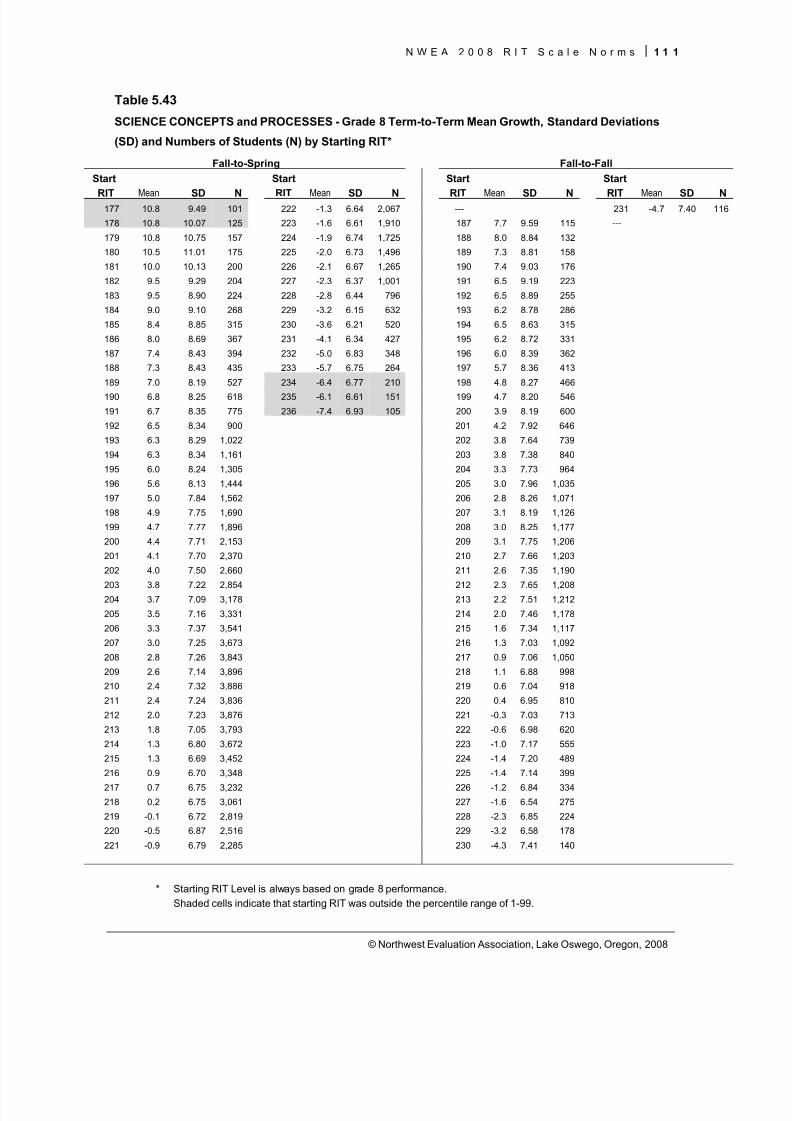
8/7/2019 NWEA Complete Norms2008
http://slidepdf.com/reader/full/nwea-complete-norms2008 121/170
N W E A 2 0 0 8 R I T S c a l e N o r m s 1 1 1
© Northwest Evaluation Association, Lake Oswego, Oregon, 2008
Table 5.43
SCIENCE CONCEPTS and PROCESSES - Grade 8 Term-to-Term Mean Growth, Standard Deviations
(SD) and Numbers of Students (N) by Starting RIT*
Fall-to-Spring Fall-to-FallStart Start Start Start
RIT Mean SD N RIT Mean SD N RIT Mean SD N RIT Mean SD N177 10.8 9.49 101 222 -1.3 6.64 2,067 --- 231 -4.7 7.40 116
178 10.8 10.07 125 223 -1.6 6.61 1,910 187 7.7 9.59 115 ---
179 10.8 10.75 157 224 -1.9 6.74 1,725 188 8.0 8.84 132
180 10.5 11.01 175 225 -2.0 6.73 1,496 189 7.3 8.81 158
181 10.0 10.13 200 226 -2.1 6.67 1,265 190 7.4 9.03 176
182 9.5 9.29 204 227 -2.3 6.37 1,001 191 6.5 9.19 223
183 9.5 8.90 224 228 -2.8 6.44 796 192 6.5 8.89 255
184 9.0 9.10 268 229 -3.2 6.15 632 193 6.2 8.78 286
185 8.4 8.85 315 230 -3.6 6.21 520 194 6.5 8.63 315
186 8.0 8.69 367 231 -4.1 6.34 427 195 6.2 8.72 331
187 7.4 8.43 394 232 -5.0 6.83 348 196 6.0 8.39 362
188 7.3 8.43 435 233 -5.7 6.75 264 197 5.7 8.36 413
189 7.0 8.19 527 234 -6.4 6.77 210 198 4.8 8.27 466
190 6.8 8.25 618 235 -6.1 6.61 151 199 4.7 8.20 546
191 6.7 8.35 775 236 -7.4 6.93 105 200 3.9 8.19 600
192 6.5 8.34 900 201 4.2 7.92 646
193 6.3 8.29 1,022 202 3.8 7.64 739
194 6.3 8.34 1,161 203 3.8 7.38 840
195 6.0 8.24 1,305 204 3.3 7.73 964
196 5.6 8.13 1,444 205 3.0 7.96 1,035
197 5.0 7.84 1,562 206 2.8 8.26 1,071
198 4.9 7.75 1,690 207 3.1 8.19 1,126
199 4.7 7.77 1,896 208 3.0 8.25 1,177
200 4.4 7.71 2,153 209 3.1 7.75 1,206
201 4.1 7.70 2,370 210 2.7 7.66 1,203
202 4.0 7.50 2,660 211 2.6 7.35 1,190
203 3.8 7.22 2,854 212 2.3 7.65 1,208204 3.7 7.09 3,178 213 2.2 7.51 1,212
205 3.5 7.16 3,331 214 2.0 7.46 1,178
206 3.3 7.37 3,541 215 1.6 7.34 1,117
207 3.0 7.25 3,673 216 1.3 7.03 1,092
208 2.8 7.26 3,843 217 0.9 7.06 1,050
209 2.6 7.14 3,896 218 1.1 6.88 998
210 2.4 7.32 3,886 219 0.6 7.04 918
211 2.4 7.24 3,836 220 0.4 6.95 810
212 2.0 7.23 3,876 221 -0.3 7.03 713
213 1.8 7.05 3,793 222 -0.6 6.98 620
214 1.3 6.80 3,672 223 -1.0 7.17 555
215 1.3 6.69 3,452 224 -1.4 7.20 489
216 0.9 6.70 3,348 225 -1.4 7.14 399
217 0.7 6.75 3,232 226 -1.2 6.84 334218 0.2 6.75 3,061 227 -1.6 6.54 275
219 -0.1 6.72 2,819 228 -2.3 6.85 224
220 -0.5 6.87 2,516 229 -3.2 6.58 178
221 -0.9 6.79 2,285 230 -4.3 7.41 140
* Starting RIT Level is always based on grade 8 performance.Shaded cells indicate that starting RIT was outside the percentile range of 1-99.
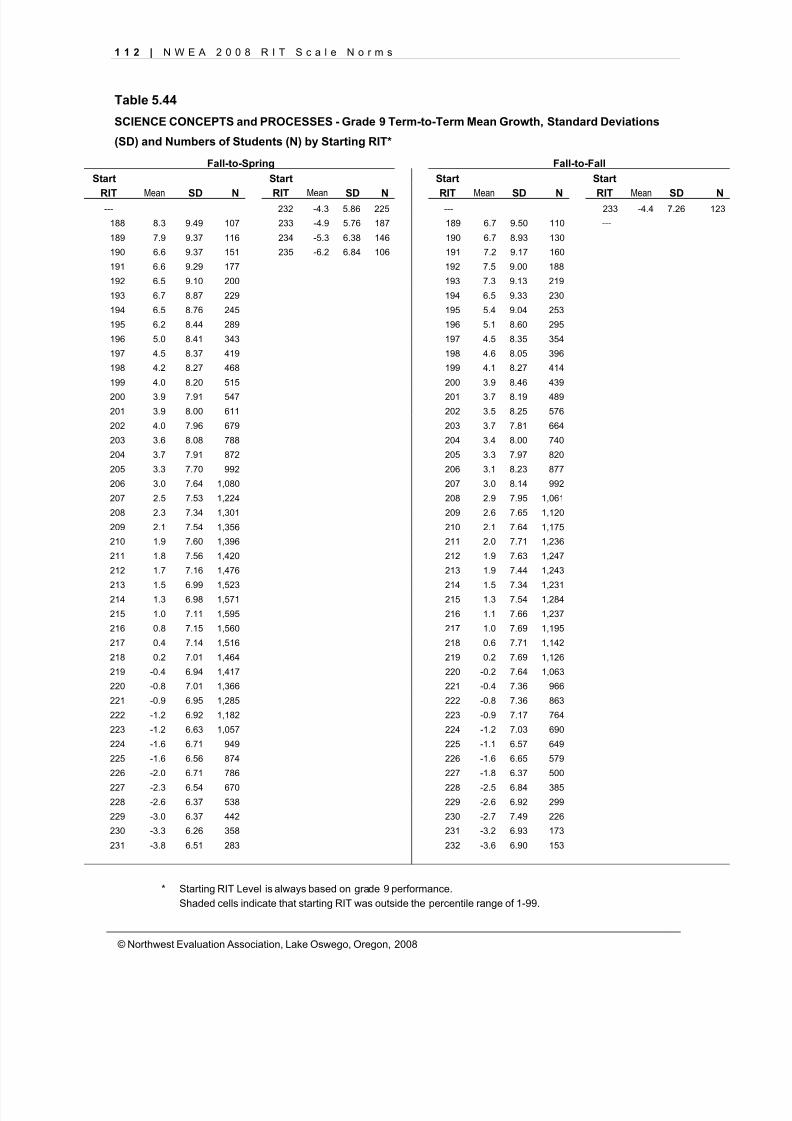
8/7/2019 NWEA Complete Norms2008
http://slidepdf.com/reader/full/nwea-complete-norms2008 122/170
1 1 2 | N W E A 2 0 0 8 R I T S c a l e N o r m s
© Northwest Evaluation Association, Lake Oswego, Oregon, 2008
Table 5.44
SCIENCE CONCEPTS and PROCESSES - Grade 9 Term-to-Term Mean Growth, Standard Deviations
(SD) and Numbers of Students (N) by Starting RIT*
Fall-to-Spring Fall-to-FallStart Start Start Start
RIT Mean SD N RIT Mean SD N RIT Mean SD N RIT Mean SD N--- 232 -4.3 5.86 225 --- 233 -4.4 7.26 123
188 8.3 9.49 107 233 -4.9 5.76 187 189 6.7 9.50 110 ---
189 7.9 9.37 116 234 -5.3 6.38 146 190 6.7 8.93 130
190 6.6 9.37 151 235 -6.2 6.84 106 191 7.2 9.17 160
191 6.6 9.29 177 192 7.5 9.00 188
192 6.5 9.10 200 193 7.3 9.13 219
193 6.7 8.87 229 194 6.5 9.33 230
194 6.5 8.76 245 195 5.4 9.04 253
195 6.2 8.44 289 196 5.1 8.60 295
196 5.0 8.41 343 197 4.5 8.35 354
197 4.5 8.37 419 198 4.6 8.05 396
198 4.2 8.27 468 199 4.1 8.27 414
199 4.0 8.20 515 200 3.9 8.46 439
200 3.9 7.91 547 201 3.7 8.19 489
201 3.9 8.00 611 202 3.5 8.25 576
202 4.0 7.96 679 203 3.7 7.81 664
203 3.6 8.08 788 204 3.4 8.00 740
204 3.7 7.91 872 205 3.3 7.97 820
205 3.3 7.70 992 206 3.1 8.23 877
206 3.0 7.64 1,080 207 3.0 8.14 992
207 2.5 7.53 1,224 208 2.9 7.95 1,061
208 2.3 7.34 1,301 209 2.6 7.65 1,120
209 2.1 7.54 1,356 210 2.1 7.64 1,175
210 1.9 7.60 1,396 211 2.0 7.71 1,236
211 1.8 7.56 1,420 212 1.9 7.63 1,247
212 1.7 7.16 1,476 213 1.9 7.44 1,243
213 1.5 6.99 1,523 214 1.5 7.34 1,231214 1.3 6.98 1,571 215 1.3 7.54 1,284
215 1.0 7.11 1,595 216 1.1 7.66 1,237
216 0.8 7.15 1,560 217 1.0 7.69 1,195
217 0.4 7.14 1,516 218 0.6 7.71 1,142
218 0.2 7.01 1,464 219 0.2 7.69 1,126
219 -0.4 6.94 1,417 220 -0.2 7.64 1,063
220 -0.8 7.01 1,366 221 -0.4 7.36 966
221 -0.9 6.95 1,285 222 -0.8 7.36 863
222 -1.2 6.92 1,182 223 -0.9 7.17 764
223 -1.2 6.63 1,057 224 -1.2 7.03 690
224 -1.6 6.71 949 225 -1.1 6.57 649
225 -1.6 6.56 874 226 -1.6 6.65 579
226 -2.0 6.71 786 227 -1.8 6.37 500
227 -2.3 6.54 670 228 -2.5 6.84 385228 -2.6 6.37 538 229 -2.6 6.92 299
229 -3.0 6.37 442 230 -2.7 7.49 226
230 -3.3 6.26 358 231 -3.2 6.93 173
231 -3.8 6.51 283 232 -3.6 6.90 153
* Starting RIT Level is always based on grade 9 performance.Shaded cells indicate that starting RIT was outside the percentile range of 1-99.
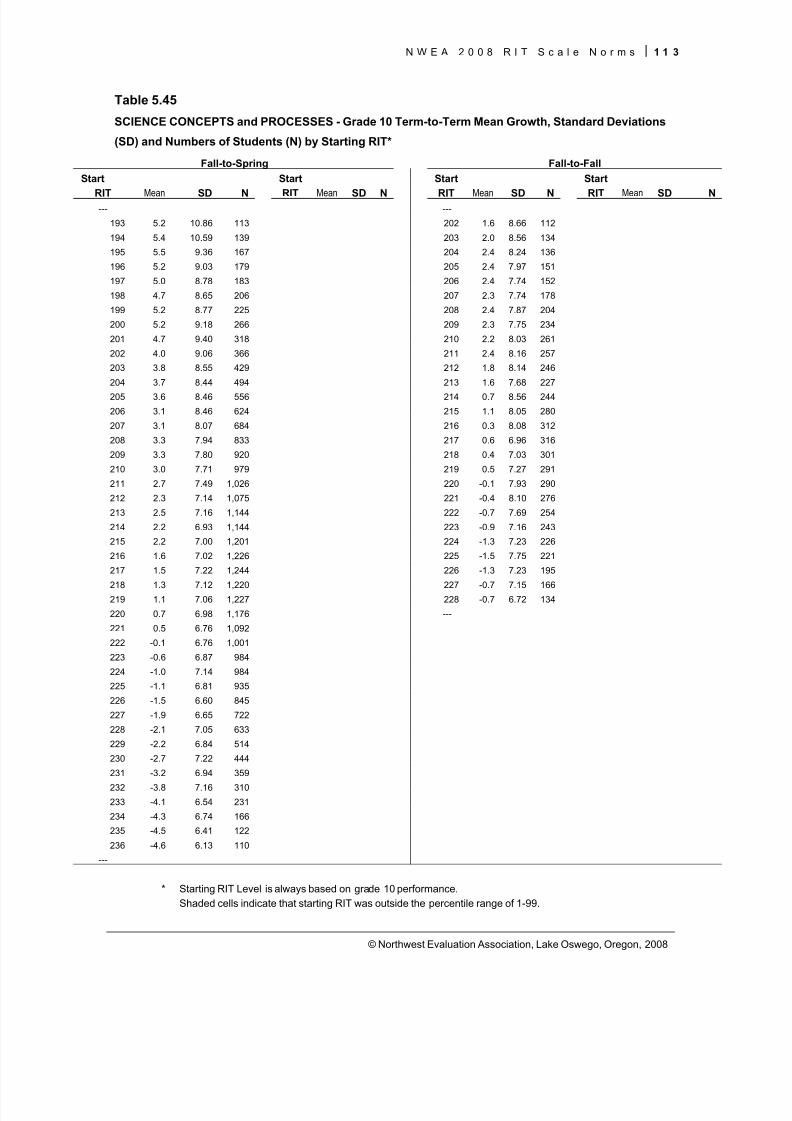
8/7/2019 NWEA Complete Norms2008
http://slidepdf.com/reader/full/nwea-complete-norms2008 123/170
N W E A 2 0 0 8 R I T S c a l e N o r m s 1 1 3
© Northwest Evaluation Association, Lake Oswego, Oregon, 2008
Table 5.45
SCIENCE CONCEPTS and PROCESSES - Grade 10 Term-to-Term Mean Growth, Standard Deviations
(SD) and Numbers of Students (N) by Starting RIT*
Fall-to-Spring Fall-to-FallStart Start Start Start
RIT Mean SD N RIT Mean SD N RIT Mean SD N RIT Mean SD N--- ---
193 5.2 10.86 113 202 1.6 8.66 112
194 5.4 10.59 139 203 2.0 8.56 134
195 5.5 9.36 167 204 2.4 8.24 136
196 5.2 9.03 179 205 2.4 7.97 151
197 5.0 8.78 183 206 2.4 7.74 152
198 4.7 8.65 206 207 2.3 7.74 178
199 5.2 8.77 225 208 2.4 7.87 204
200 5.2 9.18 266 209 2.3 7.75 234
201 4.7 9.40 318 210 2.2 8.03 261
202 4.0 9.06 366 211 2.4 8.16 257
203 3.8 8.55 429 212 1.8 8.14 246
204 3.7 8.44 494 213 1.6 7.68 227
205 3.6 8.46 556 214 0.7 8.56 244
206 3.1 8.46 624 215 1.1 8.05 280
207 3.1 8.07 684 216 0.3 8.08 312
208 3.3 7.94 833 217 0.6 6.96 316
209 3.3 7.80 920 218 0.4 7.03 301
210 3.0 7.71 979 219 0.5 7.27 291
211 2.7 7.49 1,026 220 -0.1 7.93 290
212 2.3 7.14 1,075 221 -0.4 8.10 276
213 2.5 7.16 1,144 222 -0.7 7.69 254
214 2.2 6.93 1,144 223 -0.9 7.16 243
215 2.2 7.00 1,201 224 -1.3 7.23 226
216 1.6 7.02 1,226 225 -1.5 7.75 221
217 1.5 7.22 1,244 226 -1.3 7.23 195
218 1.3 7.12 1,220 227 -0.7 7.15 166219 1.1 7.06 1,227 228 -0.7 6.72 134
220 0.7 6.98 1,176 ---
221 0.5 6.76 1,092
222 -0.1 6.76 1,001
223 -0.6 6.87 984
224 -1.0 7.14 984
225 -1.1 6.81 935
226 -1.5 6.60 845
227 -1.9 6.65 722
228 -2.1 7.05 633
229 -2.2 6.84 514
230 -2.7 7.22 444
231 -3.2 6.94 359
232 -3.8 7.16 310233 -4.1 6.54 231
234 -4.3 6.74 166
235 -4.5 6.41 122
236 -4.6 6.13 110
---
* Starting RIT Level is always based on grade 10 performance.Shaded cells indicate that starting RIT was outside the percentile range of 1-99.

8/7/2019 NWEA Complete Norms2008
http://slidepdf.com/reader/full/nwea-complete-norms2008 124/170
1 1 4 | N W E A 2 0 0 8 R I T S c a l e N o r m s
© Northwest Evaluation Association, Lake Oswego, Oregon, 2008
8/7/2019 NWEA Complete Norms2008
http://slidepdf.com/reader/full/nwea-complete-norms2008 125/170
N W E A 2 0 0 8 R I T S c a l e N o r m s 1 1 5
© Northwest Evaluation Association, Lake Oswego, Oregon, 2008
CHAPTER 6
Achievement Growth: Observed and
Modeled
Sound estimates of achievement growth depend on a few fundamental elements. These include:
• A measurement scale that spans the time period of interest (commonly called a vertical
scale). The five major RIT scales are examples of this element.
• Test content that is at least aligned to the content standards of the declared curriculum, if
not the instructed curriculum
• Tests that minimize the measurement error in each score. Kingsbury and Hauser (2004)
suggest that when the ratio of the standard error of measurement to the standard deviation
does not exceed .3, a reasonable level of precision is present in the measure.
• A standardized method of accounting for time between measurement occasions. Ideally,
the method would establish a unit of time that best balances intuitive interest of consumers
of the data, the amount of change that might be expected within a single unit, and flexibility
of use.
These elements certainly don’t guarantee growth will be estimated well, but in the absence of any
one of them, the quality of estimates will be adversely affected, regardless of the analytic modelused to make them.
As indicated earlier, this study departs from the practice in previous NWEA norm studies of using
simple difference scores as estimates of student growth. Rather growth norms were created by
modeling changes on achievement as a function of time. The impetus for this shift owes nothing to
historic and persistent arguments that difference scores are inherently unreliable and unfair. These
arguments were revealed as longstanding myths by the work of Rogosa (1995) and his colleagues
Rogosa & Willett (1983), Rogosa, Brant, & Zimowski (1982). What did provide impetus for this shift
was foreshadowed in Chapter 5: change over two points in time limits our frame of reference for
using growth estimates in establishing growth expectations for individual students and in evaluating
growth against those expectations.
When student achievement growth is aggregated for a group of students sharing a general proxy
variable for “experience,” such as grade level, it normally shows a positive trend over a single year
and over multiple years. It is very unusual when large samples are involved for a later grade to
show more growth than the grade immediately preceding it. While we understand, intellectually,
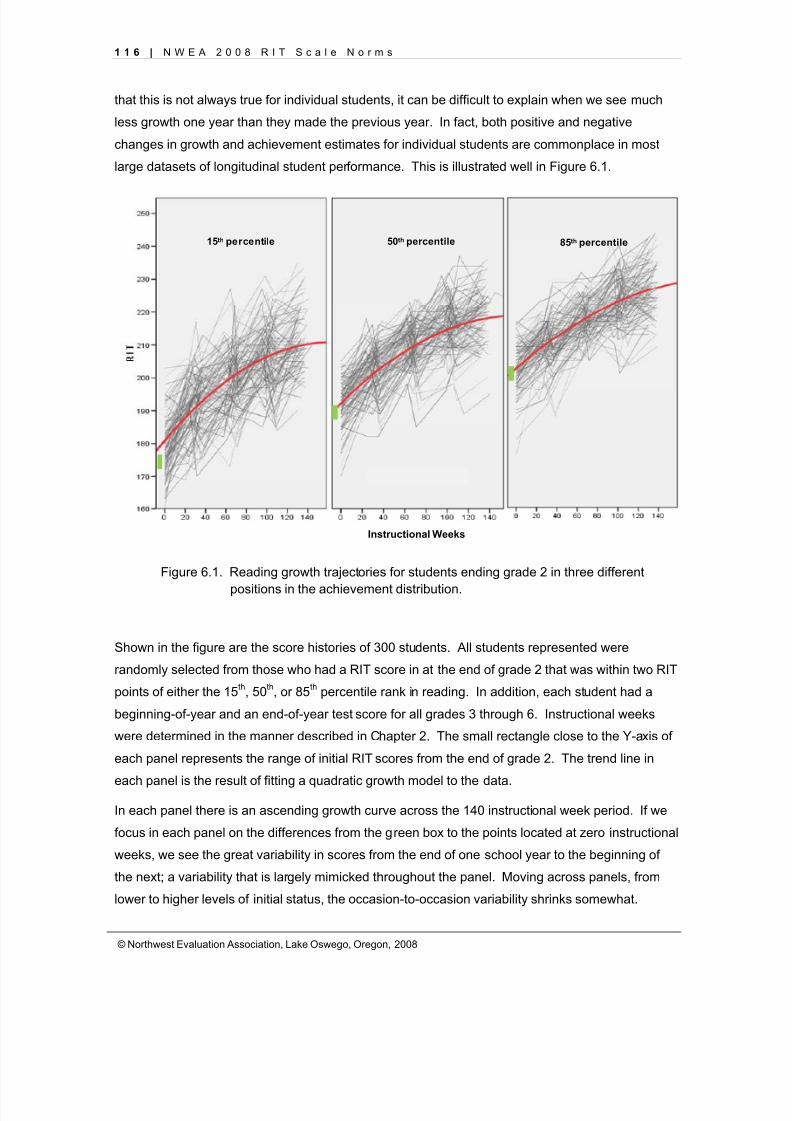
8/7/2019 NWEA Complete Norms2008
http://slidepdf.com/reader/full/nwea-complete-norms2008 126/170
1 1 6 | N W E A 2 0 0 8 R I T S c a l e N o r m s
© Northwest Evaluation Association, Lake Oswego, Oregon, 2008
that this is not always true for individual students, it can be difficult to explain when we see much
less growth one year than they made the previous year. In fact, both positive and negative
changes in growth and achievement estimates for individual students are commonplace in most
large datasets of longitudinal student performance. This is illustrated well in Figure 6.1.
Figure 6.1. Reading growth trajectories for students ending grade 2 in three different
positions in the achievement distribution.
Shown in the figure are the score histories of 300 students. All students represented were
randomly selected from those who had a RIT score in at the end of grade 2 that was within two RIT
points of either the 15 th, 50 th, or 85 th percentile rank in reading. In addition, each student had a
beginning-of-year and an end-of-year test score for all grades 3 through 6. Instructional weeks
were determined in the manner described in Chapter 2. The small rectangle close to the Y-axis of
each panel represents the range of initial RIT scores from the end of grade 2. The trend line in
each panel is the result of fitting a quadratic growth model to the data.In each panel there is an ascending growth curve across the 140 instructional week period. If we
focus in each panel on the differences from the green box to the points located at zero instructional
weeks, we see the great variability in scores from the end of one school year to the beginning of
the next; a variability that is largely mimicked throughout the panel. Moving across panels, from
lower to higher levels of initial status, the occasion-to-occasion variability shrinks somewhat.
15 th percentile 50 th percentile 85 th percentile
Instructional Weeks
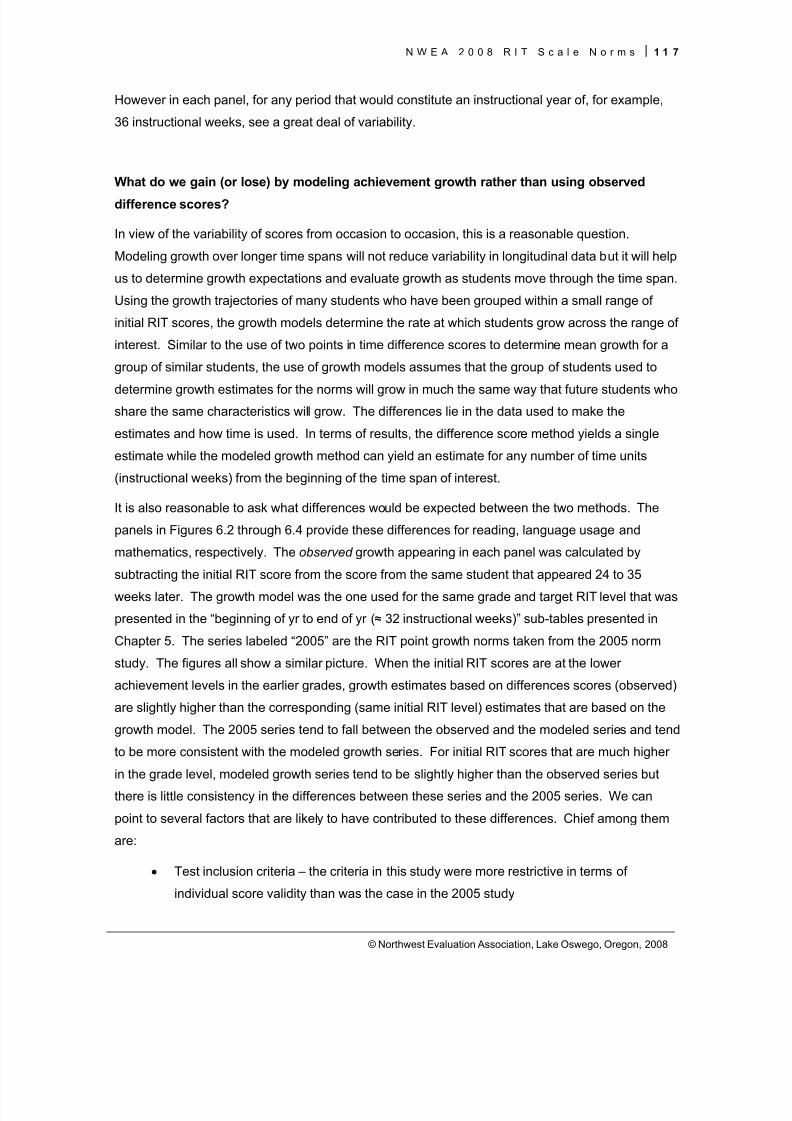
8/7/2019 NWEA Complete Norms2008
http://slidepdf.com/reader/full/nwea-complete-norms2008 127/170
N W E A 2 0 0 8 R I T S c a l e N o r m s 1 1 7
© Northwest Evaluation Association, Lake Oswego, Oregon, 2008
However in each panel, for any period that would constitute an instructional year of, for example,
36 instructional weeks, see a great deal of variability.
What do we gain (or lose) by modeling achievement growth rather than using observed
difference scores?
In view of the variability of scores from occasion to occasion, this is a reasonable question.
Modeling growth over longer time spans will not reduce variability in longitudinal data but it will help
us to determine growth expectations and evaluate growth as students move through the time span.
Using the growth trajectories of many students who have been grouped within a small range of
initial RIT scores, the growth models determine the rate at which students grow across the range of
interest. Similar to the use of two points in time difference scores to determine mean growth for a
group of similar students, the use of growth models assumes that the group of students used to
determine growth estimates for the norms will grow in much the same way that future students whoshare the same characteristics will grow. The differences lie in the data used to make the
estimates and how time is used. In terms of results, the difference score method yields a single
estimate while the modeled growth method can yield an estimate for any number of time units
(instructional weeks) from the beginning of the time span of interest.
It is also reasonable to ask what differences would be expected between the two methods. The
panels in Figures 6.2 through 6.4 provide these differences for reading, language usage and
mathematics, respectively. The observed growth appearing in each panel was calculated by
subtracting the initial RIT score from the score from the same student that appeared 24 to 35
weeks later. The growth model was the one used for the same grade and target RIT level that was
presented in the “beginning of yr to end of yr ( ≈ 32 instructional weeks)” sub-tables presented in
Chapter 5. The series labeled “2005” are the RIT point growth norms taken from the 2005 norm
study. The figures all show a similar picture. When the initial RIT scores are at the lower
achievement levels in the earlier grades, growth estimates based on differences scores (observed)
are slightly higher than the corresponding (same initial RIT level) estimates that are based on the
growth model. The 2005 series tend to fall between the observed and the modeled series and tend
to be more consistent with the modeled growth series. For initial RIT scores that are much higher
in the grade level, modeled growth series tend to be slightly higher than the observed series but
there is little consistency in the differences between these series and the 2005 series. We can
point to several factors that are likely to have contributed to these differences. Chief among them
are:
• Test inclusion criteria – the criteria in this study were more restrictive in terms of
individual score validity than was the case in the 2005 study
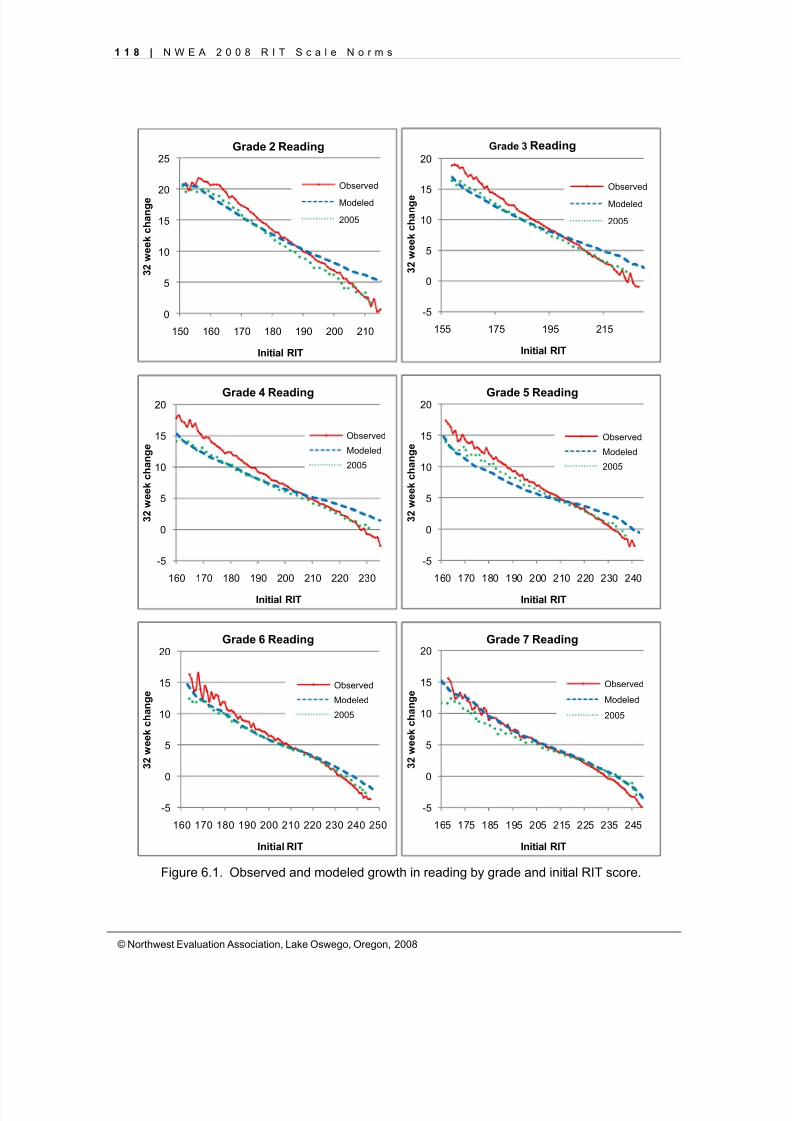
8/7/2019 NWEA Complete Norms2008
http://slidepdf.com/reader/full/nwea-complete-norms2008 128/170
1 1 8 | N W E A 2 0 0 8 R I T S c a l e N o r m s
© Northwest Evaluation Association, Lake Oswego, Oregon, 2008
Figure 6.1. Observed and modeled growth in reading by grade and initial RIT score.
-5
0
5
10
15
20
155 175 195 215
32 week change
Initial RIT
Grade 3 Reading
Observed
Modeled
2005
0
5
10
15
20
25
150 160 170 180 190 200 210
32 week change
Initial RIT
Grade 2 Reading
Observed
Modeled
2005
-5
0
5
10
15
20
160 170 180 190 200 210 220 230
32 week change
Initial RIT
Grade 4 Reading
Observed
Modeled
2005
-5
0
5
10
15
20
160 170 180 190 200 210 220 230 240
32 week change
Initial RIT
Grade 5 Reading
Observed
Modeled
2005
-5
0
5
10
15
20
160 170 180 190 200 210 220 230 240 250
32 week change
Initial RIT
Grade 6 Reading
Observed
Modeled
2005
-5
0
5
10
15
20
165 175 185 195 205 215 225 235 245
32 week change
Initial RIT
Grade 7 Reading
Observed
Modeled
2005
8/7/2019 NWEA Complete Norms2008
http://slidepdf.com/reader/full/nwea-complete-norms2008 129/170
N W E A 2 0 0 8 R I T S c a l e N o r m s 1 1 9
© Northwest Evaluation Association, Lake Oswego, Oregon, 2008
Figure 6.1 (cont.) Observed and modeled growth in reading by grade and initial RIT score.
• Time between test occasions – the time between test occasions used to calculate
difference scores in this study was held to a fairly narrow range (24 to 35 weeks), while
in the 2005 study the actual time between test occasions was left free to vary and was
bound only by occurrence in a term
• Sampling differences – the current study was restricted to school districts with known
calendars; this was not a restriction for the 2005 study
• Modeling growth – when time is included as a continuous factor in a growth model,growth estimates will be based on the relationship between achievement estimates and
time. The further test series extend beyond the initial test, the more likely it is that the
(modeled) growth estimates will differ from (shorter term) observed growth estimates.
Differences are likely to be greatest when the data are initially most variable (lower initial
RIT scores).
-5
0
5
10
15
20
175 185 195 205 215 225 235 245
32 week change
Initial RIT
Grade 8 Reading
Observed
Modeled
2005
-5
0
5
10
15
20
185 195 205 215 225 235 245 255
32 week change
Initial RIT
Grade 9 Reading
Observed
Modeled
2005
-5
0
5
10
15
20
200 210 220 230 240 250
32 week change
Initial RIT
Grade10 Reading
Observed
Modeled
2005
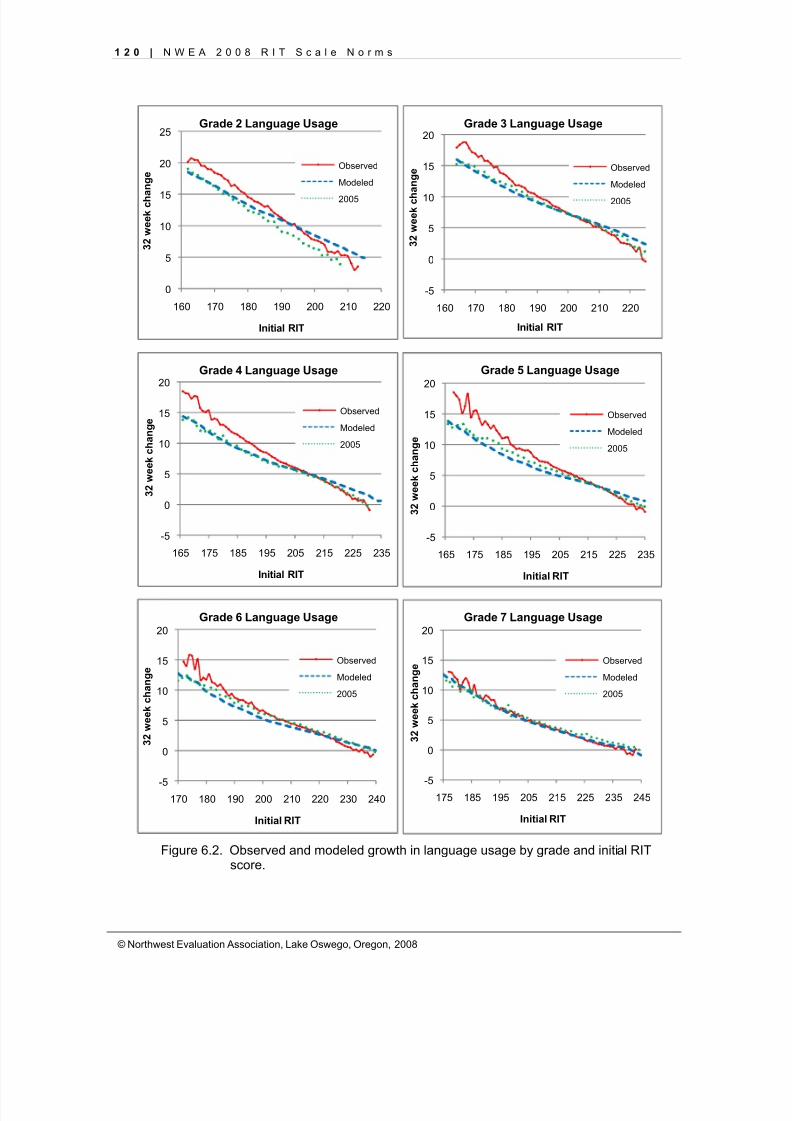
8/7/2019 NWEA Complete Norms2008
http://slidepdf.com/reader/full/nwea-complete-norms2008 130/170
1 2 0 | N W E A 2 0 0 8 R I T S c a l e N o r m s
© Northwest Evaluation Association, Lake Oswego, Oregon, 2008
Figure 6.2. Observed and modeled growth in language usage by grade and initial RITscore.
0
5
10
15
20
25
160 170 180 190 200 210 220
32 week change
Initial RIT
Grade 2 Language Usage
Observed
Modeled
2005
-5
0
5
10
15
20
160 170 180 190 200 210 220
32 week change
Initial RIT
Grade 3 Language Usage
Observed
Modeled
2005
-5
0
5
10
15
20
165 175 185 195 205 215 225 235
32 week change
Initial RIT
Grade 4 Language Usage
Observed
Modeled
2005
-5
0
5
10
15
20
165 175 185 195 205 215 225 235
32 week change
Initial RIT
Grade 5 Language Usage
Observed
Modeled
2005
-5
0
5
10
15
20
170 180 190 200 210 220 230 240
32 week change
Initial RIT
Grade 6 Language Usage
Observed
Modeled
2005
-5
0
5
10
15
20
175 185 195 205 215 225 235 245
32 week change
Initial RIT
Grade 7 Language Usage
Observed
Modeled
2005
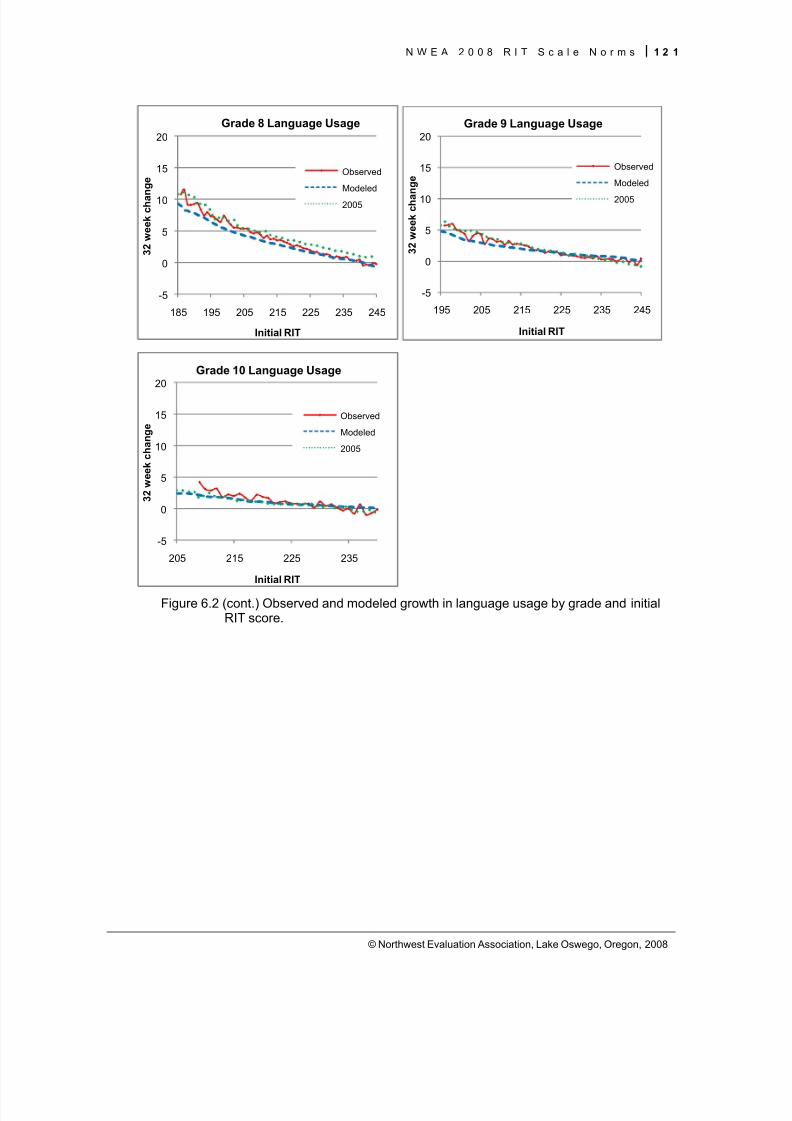
8/7/2019 NWEA Complete Norms2008
http://slidepdf.com/reader/full/nwea-complete-norms2008 131/170
N W E A 2 0 0 8 R I T S c a l e N o r m s 1 2 1
© Northwest Evaluation Association, Lake Oswego, Oregon, 2008
Figure 6.2 (cont.) Observed and modeled growth in language usage by grade and initialRIT score.
-5
0
5
10
15
20
185 195 205 215 225 235 245
32 week change
Initial RIT
Grade 8 Language Usage
Observed
Modeled
2005
-5
0
5
10
15
20
195 205 215 225 235 245
32 week change
Initial RIT
Grade 9 Language Usage
Observed
Modeled
2005
-5
0
5
10
15
20
205 215 225 235
32 week change
Initial RIT
Grade 10 Language Usage
Observed
Modeled
2005
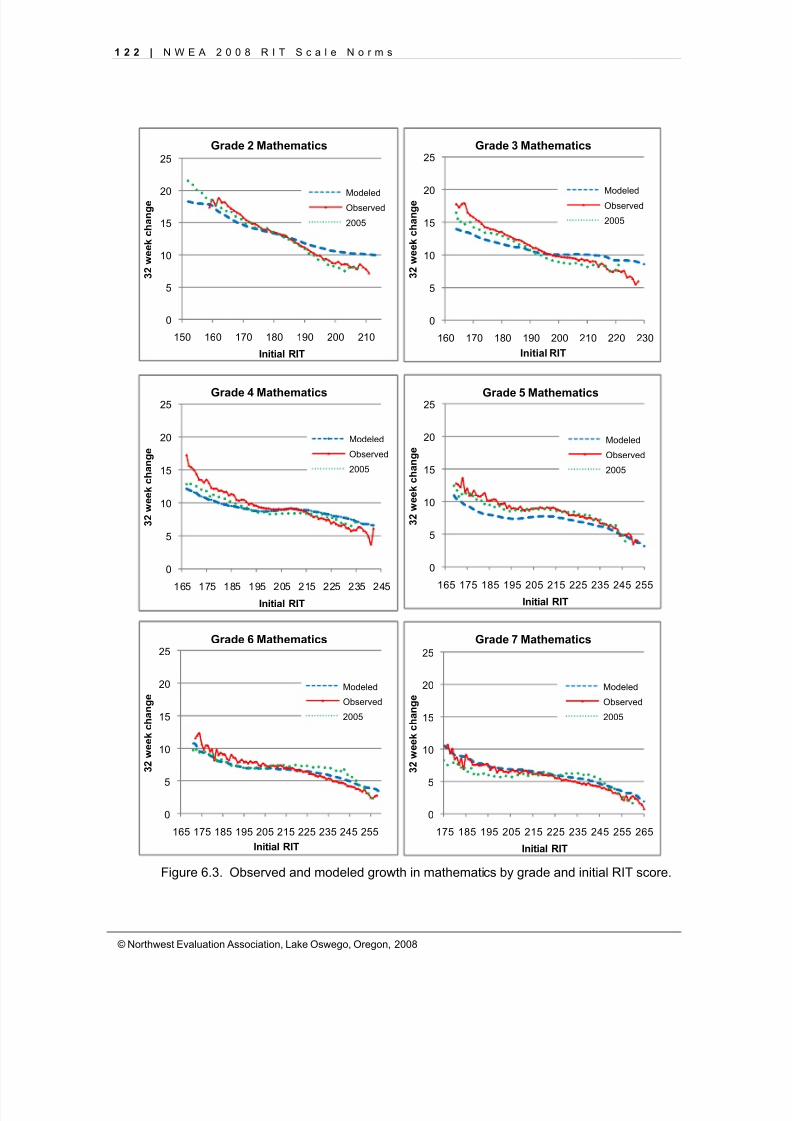
8/7/2019 NWEA Complete Norms2008
http://slidepdf.com/reader/full/nwea-complete-norms2008 132/170
1 2 2 | N W E A 2 0 0 8 R I T S c a l e N o r m s
© Northwest Evaluation Association, Lake Oswego, Oregon, 2008
Figure 6.3. Observed and modeled growth in mathematics by grade and initial RIT score.
0
5
10
15
20
25
150 160 170 180 190 200 210
32 week change
Initial RIT
Grade 2 Mathematics
ModeledObserved
2005
0
5
10
15
20
25
160 170 180 190 200 210 220 230
32 week change
Initial RIT
Grade 3 Mathematics
Modeled
Observed
2005
0
5
10
15
20
25
165 175 185 195 205 215 225 235 245
32 week change
Initial RIT
Grade 4 Mathematics
Modeled
Observed
2005
0
5
10
15
20
25
165 175 185 195 205 215 225 235 245 255
32 week change
Initial RIT
Grade 5 Mathematics
Modeled
Observed
2005
0
5
10
15
20
25
165 175 185 195 205 215 225 235 245 255
32 week change
Initial RIT
Grade 6 Mathematics
Modeled
Observed
2005
0
5
10
15
20
25
175 185 195 205 215 225 235 245 255 265
32 week change
Initial RIT
Grade 7 Mathematics
Modeled
Observed
2005
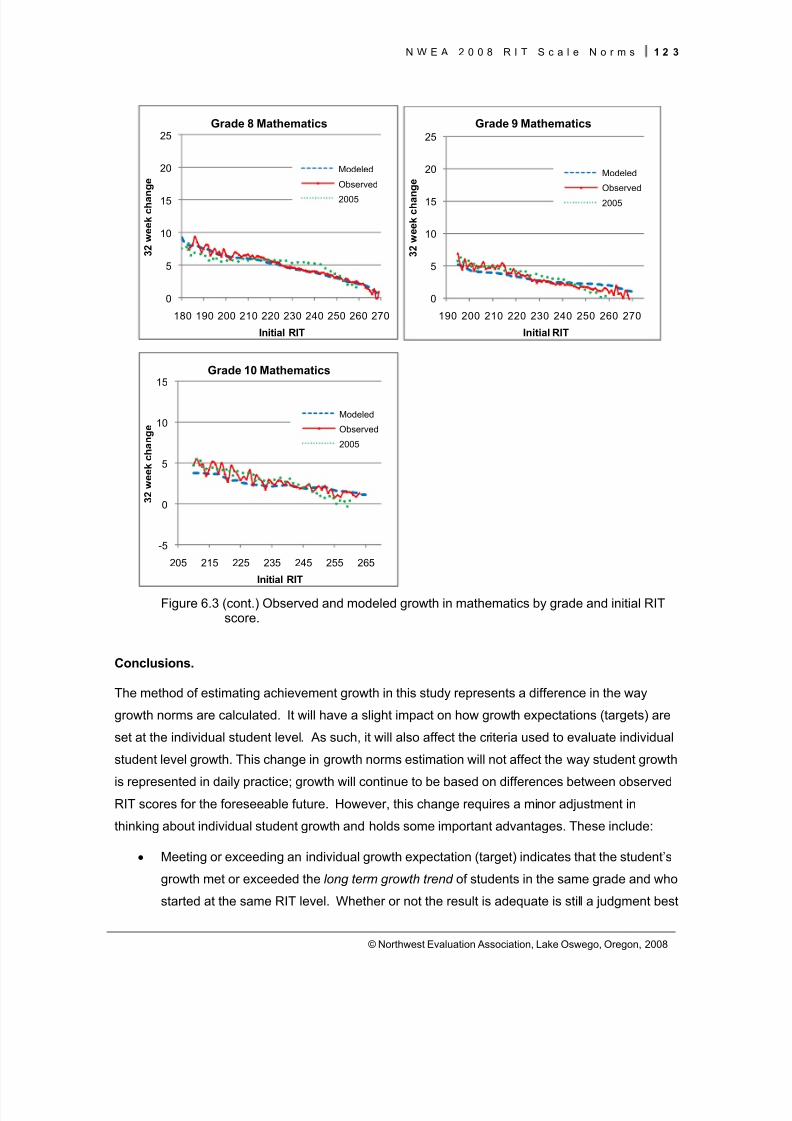
8/7/2019 NWEA Complete Norms2008
http://slidepdf.com/reader/full/nwea-complete-norms2008 133/170
8/7/2019 NWEA Complete Norms2008
http://slidepdf.com/reader/full/nwea-complete-norms2008 134/170
1 2 4 | N W E A 2 0 0 8 R I T S c a l e N o r m s
© Northwest Evaluation Association, Lake Oswego, Oregon, 2008
left to the student and the student’s teacher. Individual, aspirational growth goals are still
encouraged.
• Previous suggestions regarding the plausibility of unexpected growth (NWEA, 2005)
remain unchanged. Further, the suggestion for evaluating odd or unexpected growth using
the standard errors of the RIT scores, , canbenefit by using target values of 4.7 for reading and language usage and 5.0 for
mathematics (Kingsbury & Hauser, 2007; Hauser, Kingsbury & Wise, 2008). Change
errors that exceed these values will generally involve a test event with low individual
validity.
• The set time period over which growth can be estimated is linked only to instructional
weeks. The time periods can be specified for any reasonable time period (e.g.,
instructional weeks ≤ 110 for grades 2 through 8; ≤ 75 for grades 9 and 10).
• The expected growth component of the Hybrid Success Model (Kingsbury & McCall, 2006)
can be set with greater confidence when an achievement status target is two to four yearsin the future.
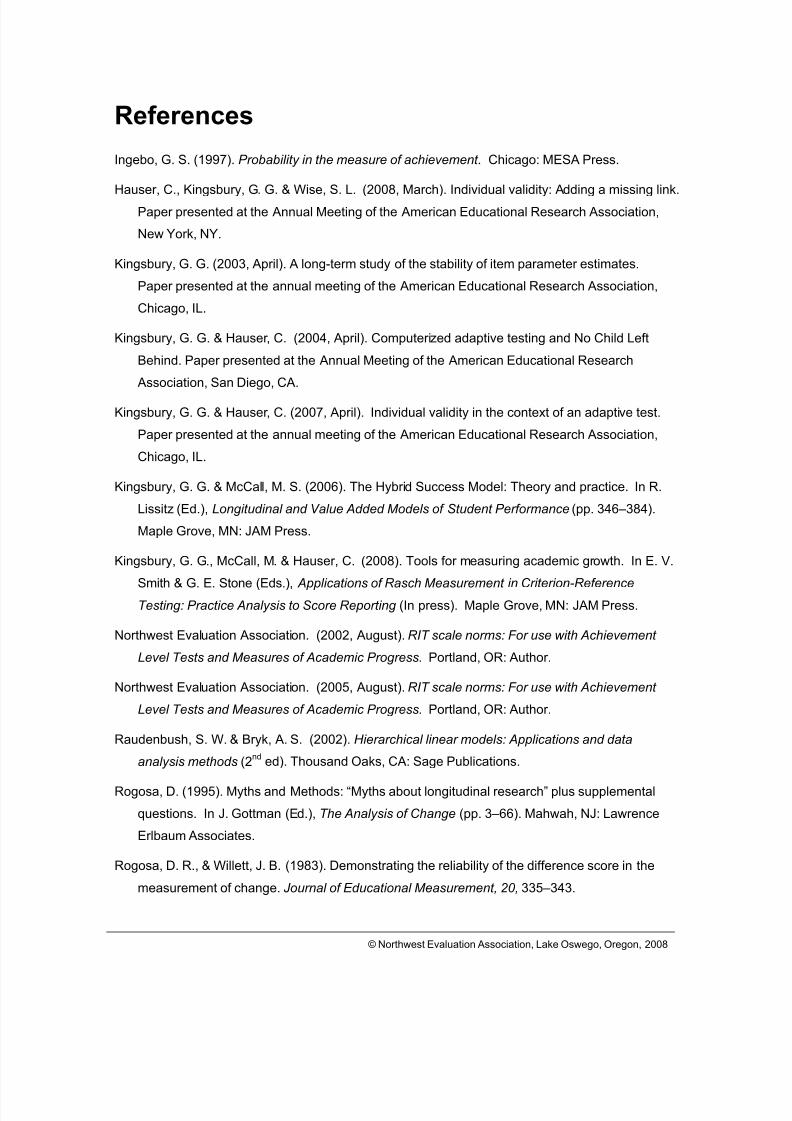
8/7/2019 NWEA Complete Norms2008
http://slidepdf.com/reader/full/nwea-complete-norms2008 135/170
© Northwest Evaluation Association, Lake Oswego, Oregon, 2008
References
Ingebo, G. S. (1997). Probability in the measure of achievement . Chicago: MESA Press.
Hauser, C., Kingsbury, G. G. & Wise, S. L. (2008, March). Individual validity: Adding a missing link.Paper presented at the Annual Meeting of the American Educational Research Association,
New York, NY.
Kingsbury, G. G. (2003, April). A long-term study of the stability of item parameter estimates.
Paper presented at the annual meeting of the American Educational Research Association,
Chicago, IL.
Kingsbury, G. G. & Hauser, C. (2004, April). Computerized adaptive testing and No Child Left
Behind. Paper presented at the Annual Meeting of the American Educational Research
Association, San Diego, CA.
Kingsbury, G. G. & Hauser, C. (2007, April). Individual validity in the context of an adaptive test.
Paper presented at the annual meeting of the American Educational Research Association,
Chicago, IL.
Kingsbury, G. G. & McCall, M. S. (2006). The Hybrid Success Model: Theory and practice. In R.
Lissitz (Ed.), Longitudinal and Value Added Models of Student Performance (pp. 346–384).
Maple Grove, MN: JAM Press.
Kingsbury, G. G., McCall, M. & Hauser, C. (2008). Tools for measuring academic growth. In E. V.
Smith & G. E. Stone (Eds.), Applications of Rasch Measurement in Criterion-ReferenceTesting: Practice Analysis to Score Reporting (In press). Maple Grove, MN: JAM Press.
Northwest Evaluation Association. (2002, August). RIT scale norms: For use with Achievement
Level Tests and Measures of Academic Progress. Portland, OR: Author.
Northwest Evaluation Association. (2005, August). RIT scale norms: For use with Achievement
Level Tests and Measures of Academic Progress. Portland, OR: Author.
Raudenbush, S. W. & Bryk, A. S. (2002). Hierarchical linear models: Applications and data
analysis methods (2 nd ed). Thousand Oaks, CA: Sage Publications.
Rogosa, D. (1995). Myths and Methods: “Myths about longitudinal research” plus supplemental
questions. In J. Gottman (Ed.), The Analysis of Change (pp. 3–66). Mahwah, NJ: Lawrence
Erlbaum Associates.
Rogosa, D. R., & Willett, J. B. (1983). Demonstrating the reliability of the difference score in the
measurement of change. Journal of Educational Measurement, 20, 335–343.
8/7/2019 NWEA Complete Norms2008
http://slidepdf.com/reader/full/nwea-complete-norms2008 136/170
1 2 6 | N W E A 2 0 0 8 R I T S c a l e N o r m s
© Northwest Evaluation Association, Lake Oswego, Oregon, 2008
Ragosa, D., Brandt, D., Zimowski, M. (1982). A growth curve approach to measurement of change.
Psychological Bulletin, 92, 726–748.
Singer, J. D. & Willett, J. B. (2003). Applied longitudinal data analysis: Modeling change and event
occurrence. New York, NY: Oxford University Press.
SPSS for Windows Version 15.0 [Computer software]. (2006). Chicago: SPSS, Inc.
8/7/2019 NWEA Complete Norms2008
http://slidepdf.com/reader/full/nwea-complete-norms2008 137/170
N W E A 2 0 0 8 R I T S c a l e N o r m s 1 2 7
© Northwest Evaluation Association, Lake Oswego, Oregon, 2008
APPENDIX A
RIT Score to Percentile Rank ConversionTables for Reading, Language Usage,
Mathematics, Upper Level Mathematics,
General Science Topics, and Science
Concepts and Processes
Beginning, Middle and End of Instructional Year

8/7/2019 NWEA Complete Norms2008
http://slidepdf.com/reader/full/nwea-complete-norms2008 138/170
1 2 8 | N W E A 2 0 0 8 R I T S c a l e N o r m s
© Northwest Evaluation Association, Lake Oswego, Oregon, 2008
%ile Kdgn Grd 1 Grd 2 Grd 3 Grd 4 Grd 5 Grd 6 Grd 7 Grd 8 Grd 9 Grd 10 Grd 11 %ile1 138 140 156 162 166 170 173 174 176 177 178 181 1
2 138 142 158 164 170 175 178 180 183 184 186 187 23 139 143 158 166 172 178 181 184 187 188 191 191 34 139 144 159 168 174 180 184 187 190 192 193 194 45 139 144 160 169 176 182 186 190 193 194 196 197 56 139 145 160 170 177 184 188 191 195 196 199 199 67 140 146 161 171 179 185 189 193 197 198 201 201 78 140 146 161 172 180 186 191 195 198 199 202 203 89 140 147 162 173 181 187 192 196 200 201 203 204 9
10 140 147 163 174 182 188 193 197 201 202 204 205 1011 140 148 163 175 183 189 194 198 202 203 205 207 1112 141 148 164 175 184 190 195 199 203 204 207 207 1213 141 149 164 176 184 191 196 200 204 205 208 209 1314 141 149 165 177 185 192 197 201 204 206 209 210 1415 141 149 165 177 186 193 198 202 205 207 210 211 15
16 141 150 166 178 186 194 199 202 206 207 210 211 1617 141 150 166 178 187 194 199 203 207 208 211 212 1718 141 150 167 179 188 195 200 204 207 209 212 213 1819 142 151 167 179 188 196 200 204 208 209 213 213 1920 142 151 168 180 189 196 201 205 208 210 213 214 2021 142 151 168 180 189 197 202 205 209 210 214 215 2122 142 152 168 181 190 197 202 206 210 211 214 215 2223 142 152 169 181 190 198 203 206 210 212 215 216 2324 142 152 169 182 191 198 203 207 211 212 215 216 2425 142 153 170 182 191 199 204 207 211 213 216 217 2526 143 153 170 183 192 199 204 208 212 213 216 217 2627 143 153 170 183 192 200 204 208 212 214 217 218 2728 143 154 171 184 193 200 205 209 212 214 217 218 2829 143 154 171 184 193 200 205 209 213 214 218 219 29
30 143 154 172 184 194 201 206 210 213 215 218 219 3031 143 154 172 185 194 201 206 210 214 215 219 220 3132 143 155 172 185 195 202 207 210 214 216 219 220 3233 144 155 173 186 195 202 207 211 214 216 219 221 3334 144 155 173 186 196 202 207 211 215 217 220 221 3435 144 156 174 186 196 203 208 212 215 217 220 222 3536 144 156 174 187 196 203 208 212 216 217 220 222 3637 144 156 174 187 197 204 208 212 216 218 221 222 3738 144 156 175 188 197 204 209 213 216 218 221 223 3839 144 157 175 188 197 204 209 213 217 219 222 223 3940 145 157 176 188 198 205 210 213 217 219 222 224 4041 145 157 176 189 198 205 210 214 217 219 222 224 4142 145 157 176 189 199 205 210 214 218 220 223 224 4243 145 158 177 189 199 206 211 214 218 220 223 225 4344 145 158 177 190 199 206 211 215 218 220 224 225 4445 145 158 177 190 200 206 211 215 219 221 224 225 4546 146 158 178 191 200 207 212 215 219 221 224 226 4647 146 159 178 191 200 207 212 216 219 221 225 226 4748 146 159 179 191 201 207 212 216 220 222 225 226 4849 146 159 179 192 201 208 213 216 220 222 225 227 4950 146 160 179 192 201 208 213 217 220 222 226 227 50
Shaded cells are based on samples that were NOT stratified to reflect the U.S. school age population.
Northwest Evaluation Association
Beginning of School Year READING RIT Score to Percentile Rank Conversion

8/7/2019 NWEA Complete Norms2008
http://slidepdf.com/reader/full/nwea-complete-norms2008 139/170
N W E A 2 0 0 8 R I T S c a l e N o r m s 1 2 9
© Northwest Evaluation Association, Lake Oswego, Oregon, 2008
%ile Kdgn Grd 1 Grd 2 Grd 3 Grd 4 Grd 5 Grd 6 Grd 7 Grd 8 Grd 9 Grd 10 Grd 11 %ile51 146 160 180 192 202 208 213 217 221 223 226 228 51
52 147 160 180 193 202 209 214 217 221 223 226 228 5253 147 160 180 193 202 209 214 218 221 223 227 228 5354 147 161 181 193 203 209 214 218 222 224 227 229 5455 147 161 181 194 203 210 214 218 222 224 228 229 5556 147 161 181 194 203 210 215 219 222 225 228 229 5657 147 161 182 195 204 210 215 219 223 225 228 230 5758 148 162 182 195 204 210 215 219 223 225 229 230 5859 148 162 183 195 204 211 216 220 223 226 229 230 5960 148 162 183 196 204 211 216 220 224 226 229 231 6061 148 163 183 196 205 211 216 220 224 226 229 231 6162 148 163 184 196 205 212 217 221 224 227 230 231 6263 149 163 184 197 205 212 217 221 225 227 230 232 6364 149 163 184 197 206 212 217 221 225 227 231 232 6465 149 164 185 197 206 213 218 222 225 228 231 232 6566 149 164 185 198 206 213 218 222 226 228 231 233 6667 150 164 186 198 207 213 218 222 226 228 232 233 6768 150 165 186 198 207 214 219 223 226 229 232 233 6869 150 165 186 199 208 214 219 223 227 229 232 234 6970 150 165 187 199 208 214 219 223 227 229 233 234 7071 150 166 187 200 208 215 220 224 228 230 233 234 7172 151 166 188 200 209 215 220 224 228 230 233 235 7273 151 166 188 200 209 215 220 224 228 231 233 235 7374 151 167 189 201 209 216 221 225 229 231 234 236 7475 152 167 189 201 210 216 221 225 229 231 234 236 7576 152 167 189 201 210 216 221 226 229 232 235 236 7677 152 168 190 202 210 217 222 226 230 232 235 237 7778 152 168 190 202 211 217 222 226 230 232 235 237 7879 153 168 191 203 211 218 223 227 231 233 236 237 7980 153 169 191 203 212 218 223 227 231 233 236 238 8081 153 169 192 203 212 218 223 228 231 234 236 238 8182 154 170 192 204 212 219 224 228 232 234 237 238 8283 154 170 193 204 213 219 224 229 232 234 237 239 8384 154 171 193 205 213 220 225 229 233 235 238 239 8485 155 171 194 205 214 220 225 230 233 235 238 240 8586 155 172 195 206 214 221 226 230 234 236 238 240 8687 155 172 195 206 215 221 226 231 234 236 239 241 8788 156 173 196 207 215 222 227 231 235 237 239 241 8889 156 173 196 208 216 222 228 232 235 237 240 242 8990 157 174 197 208 217 223 228 232 236 238 241 242 9091 157 175 198 209 217 223 229 233 236 238 241 243 9192 158 176 199 210 218 224 230 234 237 239 242 243 9293 159 177 199 211 219 225 230 234 238 240 242 244 9394 159 177 200 211 219 226 231 235 238 240 243 245 9495 160 178 201 212 220 227 232 236 239 241 244 245 9596 162 180 203 214 222 228 233 237 240 242 245 247 9697 163 181 204 215 223 229 235 238 241 243 246 248 9798 166 183 206 217 225 231 236 240 243 245 248 249 9899 170 185 210 220 228 234 239 242 245 247 250 252 99
Shaded cells are based on samples that were NOT stratified to reflect the U.S. school age population.
Northwest Evaluation Association
Beginning of School Year READING RIT Score to Percentile Rank Conversion
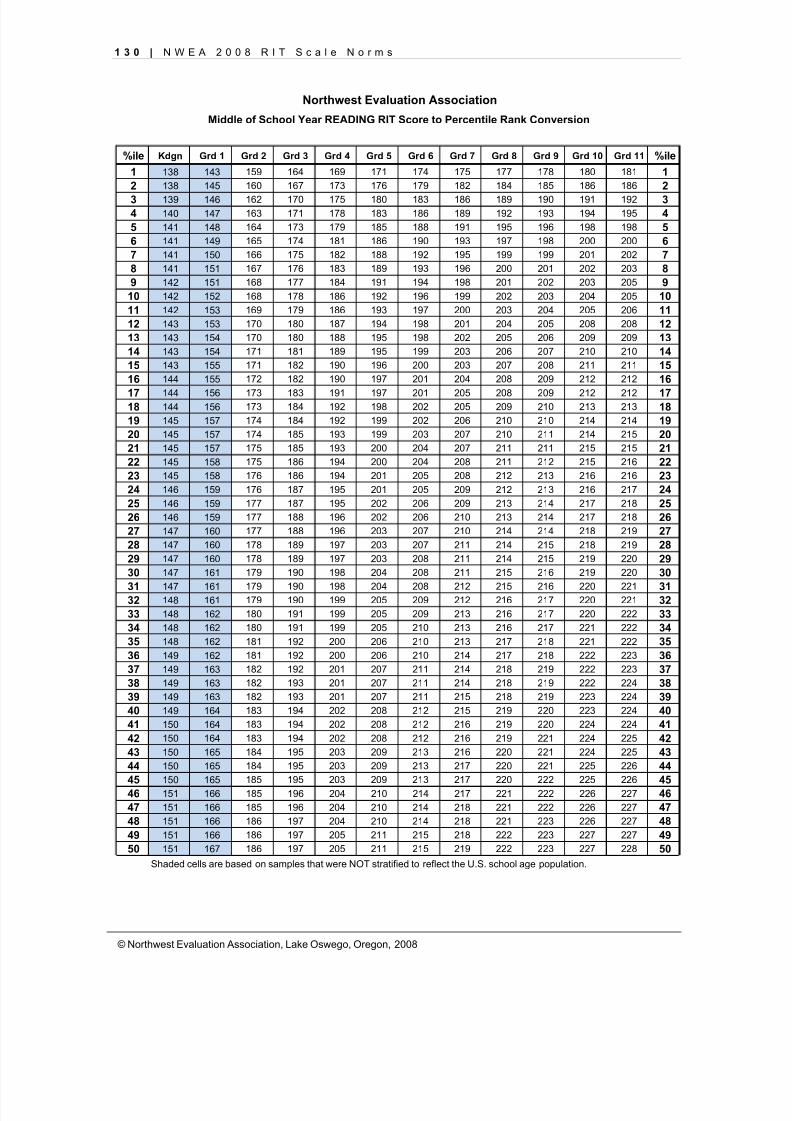
8/7/2019 NWEA Complete Norms2008
http://slidepdf.com/reader/full/nwea-complete-norms2008 140/170
1 3 0 | N W E A 2 0 0 8 R I T S c a l e N o r m s
© Northwest Evaluation Association, Lake Oswego, Oregon, 2008
%ile Kdgn Grd 1 Grd 2 Grd 3 Grd 4 Grd 5 Grd 6 Grd 7 Grd 8 Grd 9 Grd 10 Grd 11 %ile1 138 143 159 164 169 171 174 175 177 178 180 181 12 138 145 160 167 173 176 179 182 184 185 186 186 23 139 146 162 170 175 180 183 186 189 190 191 192 34 140 147 163 171 178 183 186 189 192 193 194 195 45 141 148 164 173 179 185 188 191 195 196 198 198 56 141 149 165 174 181 186 190 193 197 198 200 200 67 141 150 166 175 182 188 192 195 199 199 201 202 78 141 151 167 176 183 189 193 196 200 201 202 203 89 142 151 168 177 184 191 194 198 201 202 203 205 9
10 142 152 168 178 186 192 196 199 202 203 204 205 1011 142 153 169 179 186 193 197 200 203 204 205 206 1112 143 153 170 180 187 194 198 201 204 205 208 208 1213 143 154 170 180 188 195 198 202 205 206 209 209 1314 143 154 171 181 189 195 199 203 206 207 210 210 1415 143 155 171 182 190 196 200 203 207 208 211 211 1516 144 155 172 182 190 197 201 204 208 209 212 212 16
17 144 156 173 183 191 197 201 205 208 209 212 212 1718 144 156 173 184 192 198 202 205 209 210 213 213 1819 145 157 174 184 192 199 202 206 210 210 214 214 1920 145 157 174 185 193 199 203 207 210 211 214 215 2021 145 157 175 185 193 200 204 207 211 211 215 215 2122 145 158 175 186 194 200 204 208 211 212 215 216 2223 145 158 176 186 194 201 205 208 212 213 216 216 2324 146 159 176 187 195 201 205 209 212 213 216 217 2425 146 159 177 187 195 202 206 209 213 214 217 218 2526 146 159 177 188 196 202 206 210 213 214 217 218 2627 147 160 177 188 196 203 207 210 214 214 218 219 2728 147 160 178 189 197 203 207 211 214 215 218 219 2829 147 160 178 189 197 203 208 211 214 215 219 220 2930 147 161 179 190 198 204 208 211 215 216 219 220 30
31 147 161 179 190 198 204 208 212 215 216 220 221 3132 148 161 179 190 199 205 209 212 216 217 220 221 3233 148 162 180 191 199 205 209 213 216 217 220 222 3334 148 162 180 191 199 205 210 213 216 217 221 222 3435 148 162 181 192 200 206 210 213 217 218 221 222 3536 149 162 181 192 200 206 210 214 217 218 222 223 3637 149 163 182 192 201 207 211 214 218 219 222 223 3738 149 163 182 193 201 207 211 214 218 219 222 224 3839 149 163 182 193 201 207 211 215 218 219 223 224 3940 149 164 183 194 202 208 212 215 219 220 223 224 4041 150 164 183 194 202 208 212 216 219 220 224 224 4142 150 164 183 194 202 208 212 216 219 221 224 225 4243 150 165 184 195 203 209 213 216 220 221 224 225 4344 150 165 184 195 203 209 213 217 220 221 225 226 4445 150 165 185 195 203 209 213 217 220 222 225 226 4546 151 166 185 196 204 210 214 217 221 222 226 227 4647 151 166 185 196 204 210 214 218 221 222 226 227 4748 151 166 186 197 204 210 214 218 221 223 226 227 4849 151 166 186 197 205 211 215 218 222 223 227 227 4950 151 167 186 197 205 211 215 219 222 223 227 228 50
Shaded cells are based on samples that were NOT stratified to reflect the U.S. school age population.
Northwest Evaluation Association
Middle of School Year READING RIT Score to Percentile Rank Conversion
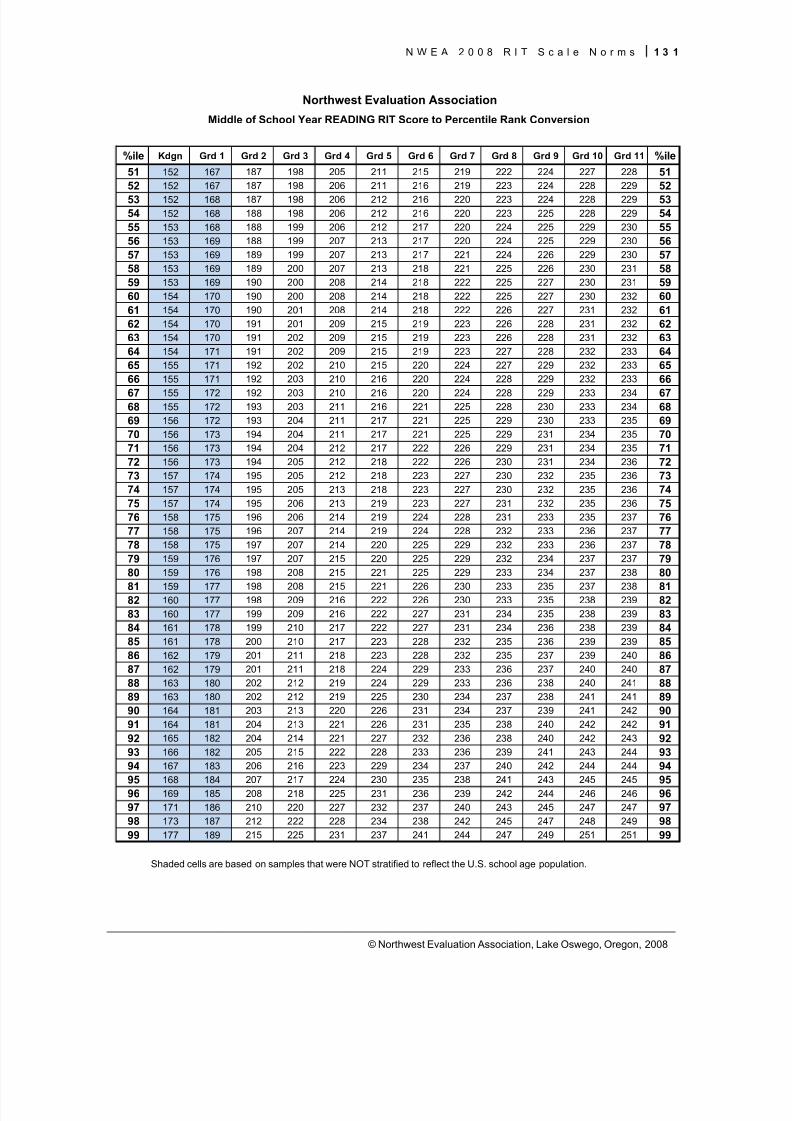
8/7/2019 NWEA Complete Norms2008
http://slidepdf.com/reader/full/nwea-complete-norms2008 141/170
N W E A 2 0 0 8 R I T S c a l e N o r m s 1 3 1
© Northwest Evaluation Association, Lake Oswego, Oregon, 2008
%ile Kdgn Grd 1 Grd 2 Grd 3 Grd 4 Grd 5 Grd 6 Grd 7 Grd 8 Grd 9 Grd 10 Grd 11 %ile51 152 167 187 198 205 211 215 219 222 224 227 228 5152 152 167 187 198 206 211 216 219 223 224 228 229 5253 152 168 187 198 206 212 216 220 223 224 228 229 5354 152 168 188 198 206 212 216 220 223 225 228 229 5455 153 168 188 199 206 212 217 220 224 225 229 230 5556 153 169 188 199 207 213 217 220 224 225 229 230 5657 153 169 189 199 207 213 217 221 224 226 229 230 5758 153 169 189 200 207 213 218 221 225 226 230 231 5859 153 169 190 200 208 214 218 222 225 227 230 231 5960 154 170 190 200 208 214 218 222 225 227 230 232 6061 154 170 190 201 208 214 218 222 226 227 231 232 6162 154 170 191 201 209 215 219 223 226 228 231 232 6263 154 170 191 202 209 215 219 223 226 228 231 232 6364 154 171 191 202 209 215 219 223 227 228 232 233 6465 155 171 192 202 210 215 220 224 227 229 232 233 6566 155 171 192 203 210 216 220 224 228 229 232 233 66
67 155 172 192 203 210 216 220 224 228 229 233 234 6768 155 172 193 203 211 216 221 225 228 230 233 234 6869 156 172 193 204 211 217 221 225 229 230 233 235 6970 156 173 194 204 211 217 221 225 229 231 234 235 7071 156 173 194 204 212 217 222 226 229 231 234 235 7172 156 173 194 205 212 218 222 226 230 231 234 236 7273 157 174 195 205 212 218 223 227 230 232 235 236 7374 157 174 195 205 213 218 223 227 230 232 235 236 7475 157 174 195 206 213 219 223 227 231 232 235 236 7576 158 175 196 206 214 219 224 228 231 233 235 237 7677 158 175 196 207 214 219 224 228 232 233 236 237 7778 158 175 197 207 214 220 225 229 232 233 236 237 7879 159 176 197 207 215 220 225 229 232 234 237 237 7980 159 176 198 208 215 221 225 229 233 234 237 238 80
81 159 177 198 208 215 221 226 230 233 235 237 238 8182 160 177 198 209 216 222 226 230 233 235 238 239 8283 160 177 199 209 216 222 227 231 234 235 238 239 8384 161 178 199 210 217 222 227 231 234 236 238 239 8485 161 178 200 210 217 223 228 232 235 236 239 239 8586 162 179 201 211 218 223 228 232 235 237 239 240 8687 162 179 201 211 218 224 229 233 236 237 240 240 8788 163 180 202 212 219 224 229 233 236 238 240 241 8889 163 180 202 212 219 225 230 234 237 238 241 241 8990 164 181 203 213 220 226 231 234 237 239 241 242 9091 164 181 204 213 221 226 231 235 238 240 242 242 9192 165 182 204 214 221 227 232 236 238 240 242 243 9293 166 182 205 215 222 228 233 236 239 241 243 244 9394 167 183 206 216 223 229 234 237 240 242 244 244 9495 168 184 207 217 224 230 235 238 241 243 245 245 9596 169 185 208 218 225 231 236 239 242 244 246 246 9697 171 186 210 220 227 232 237 240 243 245 247 247 9798 173 187 212 222 228 234 238 242 245 247 248 249 9899 177 189 215 225 231 237 241 244 247 249 251 251 99
Shaded cells are based on samples that were NOT stratified to reflect the U.S. school age population.
Northwest Evaluation Association
Middle of School Year READING RIT Score to Percentile Rank Conversion
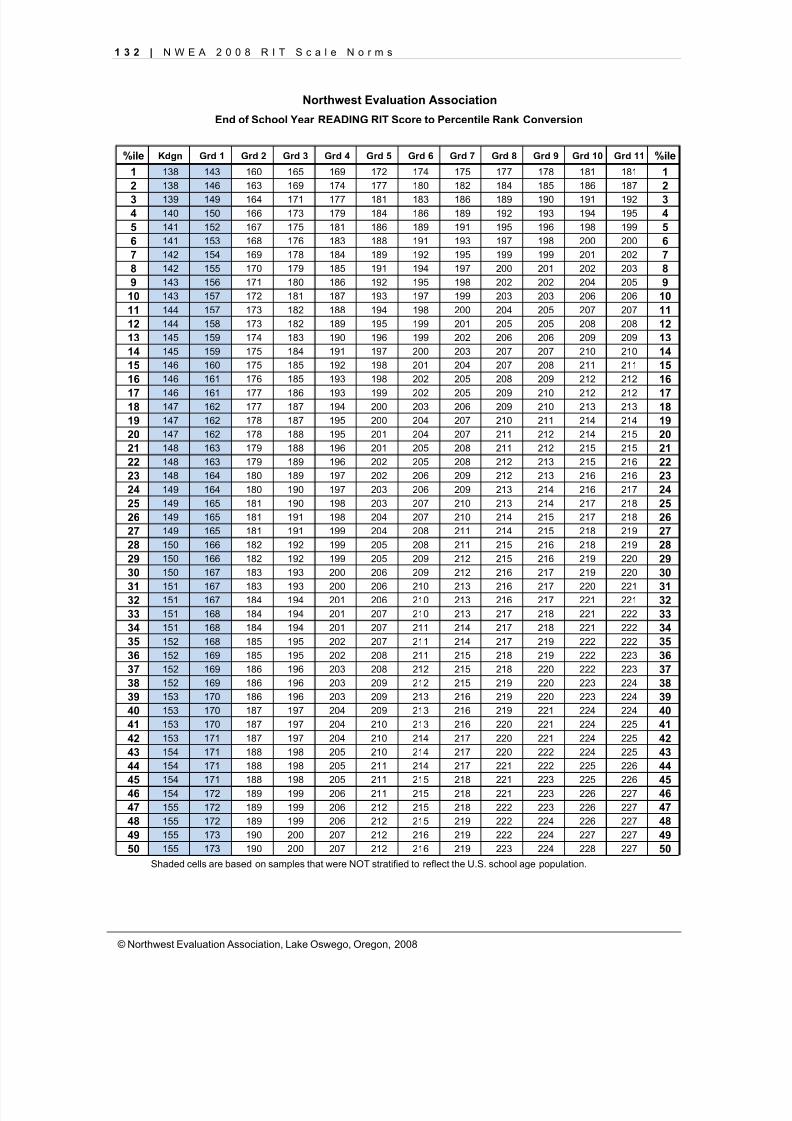
8/7/2019 NWEA Complete Norms2008
http://slidepdf.com/reader/full/nwea-complete-norms2008 142/170
1 3 2 | N W E A 2 0 0 8 R I T S c a l e N o r m s
© Northwest Evaluation Association, Lake Oswego, Oregon, 2008
%ile Kdgn Grd 1 Grd 2 Grd 3 Grd 4 Grd 5 Grd 6 Grd 7 Grd 8 Grd 9 Grd 10 Grd 11 %ile1 138 143 160 165 169 172 174 175 177 178 181 181 12 138 146 163 169 174 177 180 182 184 185 186 187 23 139 149 164 171 177 181 183 186 189 190 191 192 34 140 150 166 173 179 184 186 189 192 193 194 195 45 141 152 167 175 181 186 189 191 195 196 198 199 56 141 153 168 176 183 188 191 193 197 198 200 200 67 142 154 169 178 184 189 192 195 199 199 201 202 78 142 155 170 179 185 191 194 197 200 201 202 203 89 143 156 171 180 186 192 195 198 202 202 204 205 9
10 143 157 172 181 187 193 197 199 203 203 206 206 1011 144 157 173 182 188 194 198 200 204 205 207 207 1112 144 158 173 182 189 195 199 201 205 205 208 208 1213 145 159 174 183 190 196 199 202 206 206 209 209 1314 145 159 175 184 191 197 200 203 207 207 210 210 1415 146 160 175 185 192 198 201 204 207 208 211 211 1516 146 161 176 185 193 198 202 205 208 209 212 212 16
17 146 161 177 186 193 199 202 205 209 210 212 212 1718 147 162 177 187 194 200 203 206 209 210 213 213 1819 147 162 178 187 195 200 204 207 210 211 214 214 1920 147 162 178 188 195 201 204 207 211 212 214 215 2021 148 163 179 188 196 201 205 208 211 212 215 215 2122 148 163 179 189 196 202 205 208 212 213 215 216 2223 148 164 180 189 197 202 206 209 212 213 216 216 2324 149 164 180 190 197 203 206 209 213 214 216 217 2425 149 165 181 190 198 203 207 210 213 214 217 218 2526 149 165 181 191 198 204 207 210 214 215 217 218 2627 149 165 181 191 199 204 208 211 214 215 218 219 2728 150 166 182 192 199 205 208 211 215 216 218 219 2829 150 166 182 192 199 205 209 212 215 216 219 220 2930 150 167 183 193 200 206 209 212 216 217 219 220 30
31 151 167 183 193 200 206 210 213 216 217 220 221 3132 151 167 184 194 201 206 210 213 216 217 221 221 3233 151 168 184 194 201 207 210 213 217 218 221 222 3334 151 168 184 194 201 207 211 214 217 218 221 222 3435 152 168 185 195 202 207 211 214 217 219 222 222 3536 152 169 185 195 202 208 211 215 218 219 222 223 3637 152 169 186 196 203 208 212 215 218 220 222 223 3738 152 169 186 196 203 209 212 215 219 220 223 224 3839 153 170 186 196 203 209 213 216 219 220 223 224 3940 153 170 187 197 204 209 213 216 219 221 224 224 4041 153 170 187 197 204 210 213 216 220 221 224 225 4142 153 171 187 197 204 210 214 217 220 221 224 225 4243 154 171 188 198 205 210 214 217 220 222 224 225 4344 154 171 188 198 205 211 214 217 221 222 225 226 4445 154 171 188 198 205 211 215 218 221 223 225 226 4546 154 172 189 199 206 211 215 218 221 223 226 227 4647 155 172 189 199 206 212 215 218 222 223 226 227 4748 155 172 189 199 206 212 215 219 222 224 226 227 4849 155 173 190 200 207 212 216 219 222 224 227 227 4950 155 173 190 200 207 212 216 219 223 224 228 227 50
Shaded cells are based on samples that were NOT stratified to reflect the U.S. school age population.
Northwest Evaluation Association
End of School Year READING RIT Score to Percentile Rank Conversion
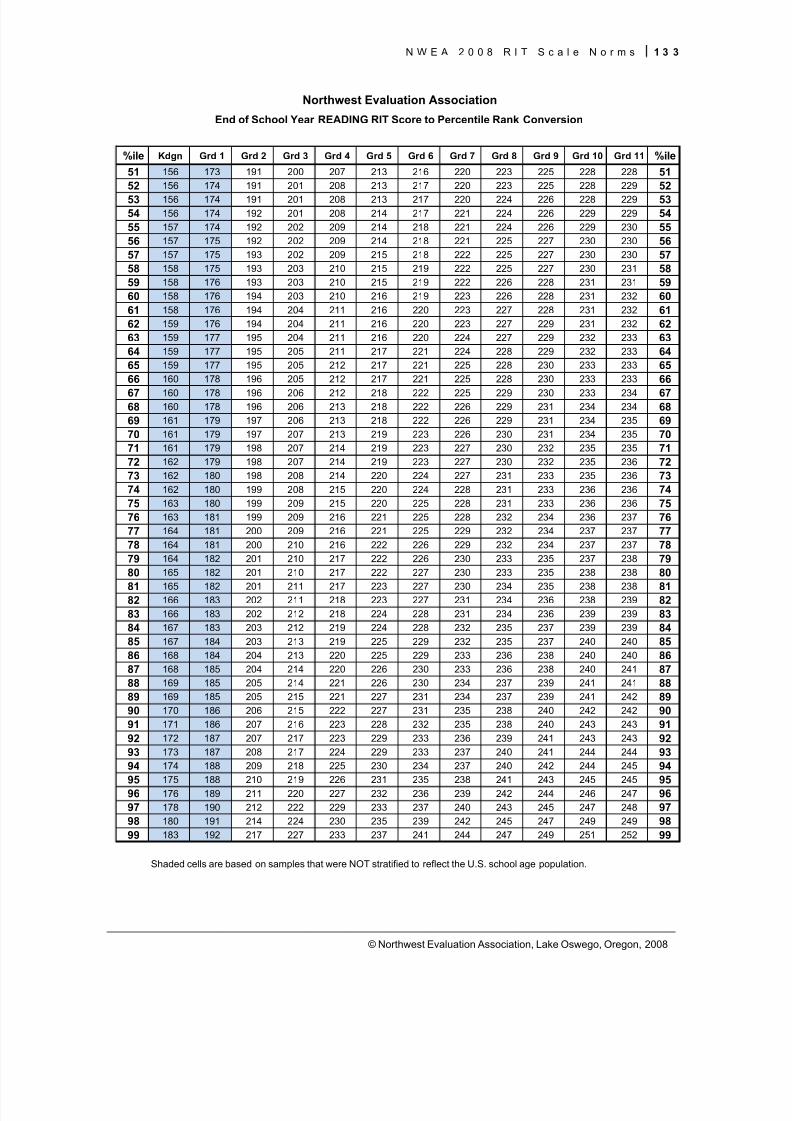
8/7/2019 NWEA Complete Norms2008
http://slidepdf.com/reader/full/nwea-complete-norms2008 143/170
N W E A 2 0 0 8 R I T S c a l e N o r m s 1 3 3
© Northwest Evaluation Association, Lake Oswego, Oregon, 2008
%ile Kdgn Grd 1 Grd 2 Grd 3 Grd 4 Grd 5 Grd 6 Grd 7 Grd 8 Grd 9 Grd 10 Grd 11 %ile51 156 173 191 200 207 213 216 220 223 225 228 228 5152 156 174 191 201 208 213 217 220 223 225 228 229 5253 156 174 191 201 208 213 217 220 224 226 228 229 5354 156 174 192 201 208 214 217 221 224 226 229 229 5455 157 174 192 202 209 214 218 221 224 226 229 230 5556 157 175 192 202 209 214 218 221 225 227 230 230 5657 157 175 193 202 209 215 218 222 225 227 230 230 5758 158 175 193 203 210 215 219 222 225 227 230 231 5859 158 176 193 203 210 215 219 222 226 228 231 231 5960 158 176 194 203 210 216 219 223 226 228 231 232 6061 158 176 194 204 211 216 220 223 227 228 231 232 6162 159 176 194 204 211 216 220 223 227 229 231 232 6263 159 177 195 204 211 216 220 224 227 229 232 233 6364 159 177 195 205 211 217 221 224 228 229 232 233 6465 159 177 195 205 212 217 221 225 228 230 233 233 6566 160 178 196 205 212 217 221 225 228 230 233 233 66
67 160 178 196 206 212 218 222 225 229 230 233 234 6768 160 178 196 206 213 218 222 226 229 231 234 234 6869 161 179 197 206 213 218 222 226 229 231 234 235 6970 161 179 197 207 213 219 223 226 230 231 234 235 7071 161 179 198 207 214 219 223 227 230 232 235 235 7172 162 179 198 207 214 219 223 227 230 232 235 236 7273 162 180 198 208 214 220 224 227 231 233 235 236 7374 162 180 199 208 215 220 224 228 231 233 236 236 7475 163 180 199 209 215 220 225 228 231 233 236 236 7576 163 181 199 209 216 221 225 228 232 234 236 237 7677 164 181 200 209 216 221 225 229 232 234 237 237 7778 164 181 200 210 216 222 226 229 232 234 237 237 7879 164 182 201 210 217 222 226 230 233 235 237 238 7980 165 182 201 210 217 222 227 230 233 235 238 238 80
81 165 182 201 211 217 223 227 230 234 235 238 238 8182 166 183 202 211 218 223 227 231 234 236 238 239 8283 166 183 202 212 218 224 228 231 234 236 239 239 8384 167 183 203 212 219 224 228 232 235 237 239 239 8485 167 184 203 213 219 225 229 232 235 237 240 240 8586 168 184 204 213 220 225 229 233 236 238 240 240 8687 168 185 204 214 220 226 230 233 236 238 240 241 8788 169 185 205 214 221 226 230 234 237 239 241 241 8889 169 185 205 215 221 227 231 234 237 239 241 242 8990 170 186 206 215 222 227 231 235 238 240 242 242 9091 171 186 207 216 223 228 232 235 238 240 243 243 9192 172 187 207 217 223 229 233 236 239 241 243 243 9293 173 187 208 217 224 229 233 237 240 241 244 244 9394 174 188 209 218 225 230 234 237 240 242 244 245 9495 175 188 210 219 226 231 235 238 241 243 245 245 9596 176 189 211 220 227 232 236 239 242 244 246 247 9697 178 190 212 222 229 233 237 240 243 245 247 248 9798 180 191 214 224 230 235 239 242 245 247 249 249 9899 183 192 217 227 233 237 241 244 247 249 251 252 99
Shaded cells are based on samples that were NOT stratified to reflect the U.S. school age population.
Northwest Evaluation Association
End of School Year READING RIT Score to Percentile Rank Conversion
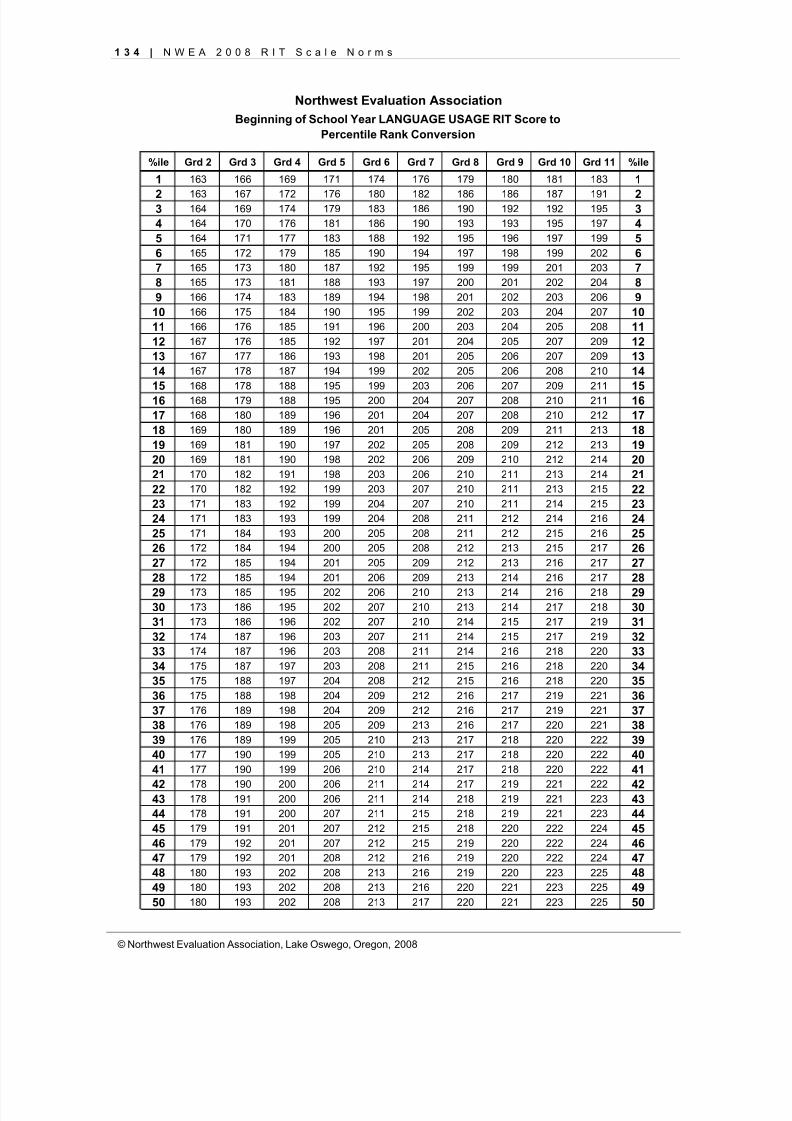
8/7/2019 NWEA Complete Norms2008
http://slidepdf.com/reader/full/nwea-complete-norms2008 144/170
1 3 4 | N W E A 2 0 0 8 R I T S c a l e N o r m s
© Northwest Evaluation Association, Lake Oswego, Oregon, 2008
%ile Grd 2 Grd 3 Grd 4 Grd 5 Grd 6 Grd 7 Grd 8 Grd 9 Grd 10 Grd 11 %ile
1 163 166 169 171 174 176 179 180 181 183 1
2 163 167 172 176 180 182 186 186 187 191 23 164 169 174 179 183 186 190 192 192 195 34 164 170 176 181 186 190 193 193 195 197 45 164 171 177 183 188 192 195 196 197 199 56 165 172 179 185 190 194 197 198 199 202 67 165 173 180 187 192 195 199 199 201 203 78 165 173 181 188 193 197 200 201 202 204 89 166 174 183 189 194 198 201 202 203 206 9
10 166 175 184 190 195 199 202 203 204 207 1011 166 176 185 191 196 200 203 204 205 208 1112 167 176 185 192 197 201 204 205 207 209 1213 167 177 186 193 198 201 205 206 207 209 1314 167 178 187 194 199 202 205 206 208 210 1415 168 178 188 195 199 203 206 207 209 211 1516 168 179 188 195 200 204 207 208 210 211 1617 168 180 189 196 201 204 207 208 210 212 1718 169 180 189 196 201 205 208 209 211 213 1819 169 181 190 197 202 205 208 209 212 213 1920 169 181 190 198 202 206 209 210 212 214 2021 170 182 191 198 203 206 210 211 213 214 2122 170 182 192 199 203 207 210 211 213 215 2223 171 183 192 199 204 207 210 211 214 215 2324 171 183 193 199 204 208 211 212 214 216 2425 171 184 193 200 205 208 211 212 215 216 2526 172 184 194 200 205 208 212 213 215 217 2627 172 185 194 201 205 209 212 213 216 217 2728 172 185 194 201 206 209 213 214 216 217 2829 173 185 195 202 206 210 213 214 216 218 2930 173 186 195 202 207 210 213 214 217 218 3031 173 186 196 202 207 210 214 215 217 219 3132 174 187 196 203 207 211 214 215 217 219 3233 174 187 196 203 208 211 214 216 218 220 3334 175 187 197 203 208 211 215 216 218 220 3435 175 188 197 204 208 212 215 216 218 220 3536 175 188 198 204 209 212 216 217 219 221 3637 176 189 198 204 209 212 216 217 219 221 3738 176 189 198 205 209 213 216 217 220 221 3839 176 189 199 205 210 213 217 218 220 222 3940 177 190 199 205 210 213 217 218 220 222 4041 177 190 199 206 210 214 217 218 220 222 41
42 178 190 200 206 211 214 217 219 221 222 4243 178 191 200 206 211 214 218 219 221 223 4344 178 191 200 207 211 215 218 219 221 223 4445 179 191 201 207 212 215 218 220 222 224 4546 179 192 201 207 212 215 219 220 222 224 4647 179 192 201 208 212 216 219 220 222 224 4748 180 193 202 208 213 216 219 220 223 225 4849 180 193 202 208 213 216 220 221 223 225 4950 180 193 202 208 213 217 220 221 223 225 50
Northwest Evaluation AssociationBeginning of School Year LANGUAGE USAGE RIT Score to
Percentile Rank Conversion
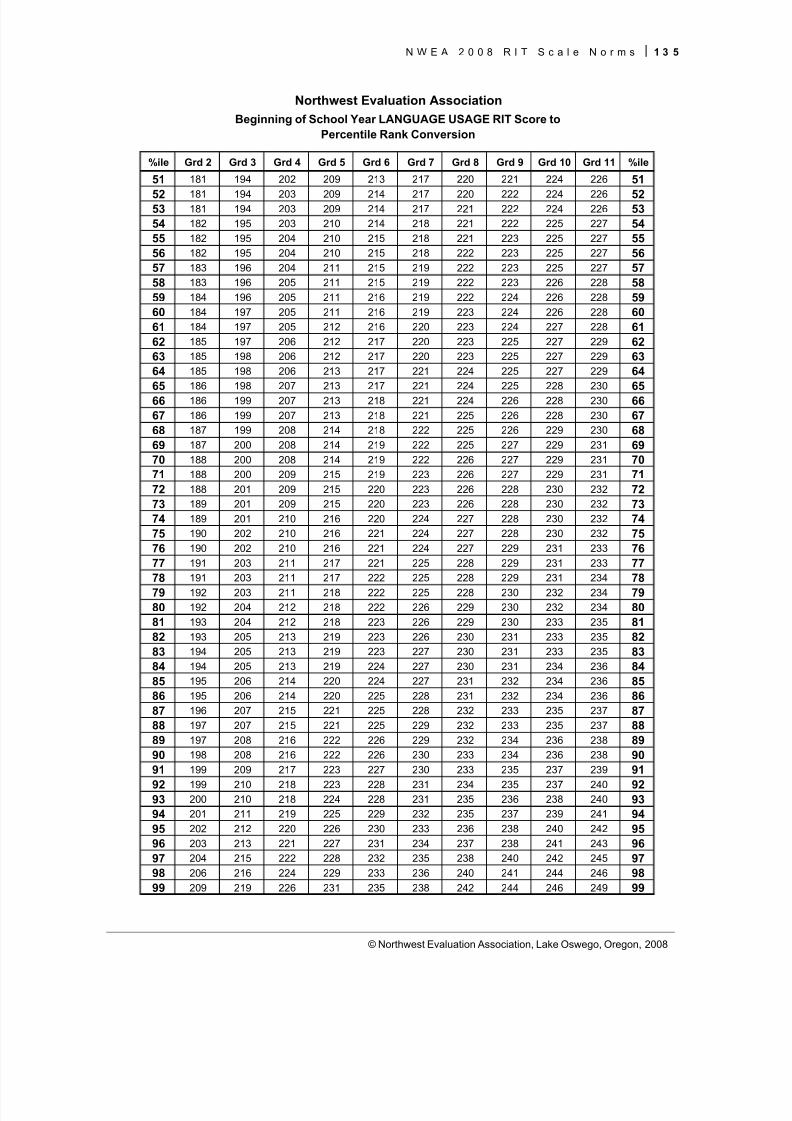
8/7/2019 NWEA Complete Norms2008
http://slidepdf.com/reader/full/nwea-complete-norms2008 145/170
N W E A 2 0 0 8 R I T S c a l e N o r m s 1 3 5
© Northwest Evaluation Association, Lake Oswego, Oregon, 2008
%ile Grd 2 Grd 3 Grd 4 Grd 5 Grd 6 Grd 7 Grd 8 Grd 9 Grd 10 Grd 11 %ile
51 181 194 202 209 213 217 220 221 224 226 51
52 181 194 203 209 214 217 220 222 224 226 5253 181 194 203 209 214 217 221 222 224 226 5354 182 195 203 210 214 218 221 222 225 227 5455 182 195 204 210 215 218 221 223 225 227 5556 182 195 204 210 215 218 222 223 225 227 5657 183 196 204 211 215 219 222 223 225 227 5758 183 196 205 211 215 219 222 223 226 228 5859 184 196 205 211 216 219 222 224 226 228 5960 184 197 205 211 216 219 223 224 226 228 6061 184 197 205 212 216 220 223 224 227 228 6162 185 197 206 212 217 220 223 225 227 229 6263 185 198 206 212 217 220 223 225 227 229 6364 185 198 206 213 217 221 224 225 227 229 6465 186 198 207 213 217 221 224 225 228 230 6566 186 199 207 213 218 221 224 226 228 230 6667 186 199 207 213 218 221 225 226 228 230 6768 187 199 208 214 218 222 225 226 229 230 6869 187 200 208 214 219 222 225 227 229 231 6970 188 200 208 214 219 222 226 227 229 231 7071 188 200 209 215 219 223 226 227 229 231 7172 188 201 209 215 220 223 226 228 230 232 7273 189 201 209 215 220 223 226 228 230 232 7374 189 201 210 216 220 224 227 228 230 232 7475 190 202 210 216 221 224 227 228 230 232 7576 190 202 210 216 221 224 227 229 231 233 7677 191 203 211 217 221 225 228 229 231 233 7778 191 203 211 217 222 225 228 229 231 234 7879 192 203 211 218 222 225 228 230 232 234 7980 192 204 212 218 222 226 229 230 232 234 8081 193 204 212 218 223 226 229 230 233 235 8182 193 205 213 219 223 226 230 231 233 235 8283 194 205 213 219 223 227 230 231 233 235 8384 194 205 213 219 224 227 230 231 234 236 8485 195 206 214 220 224 227 231 232 234 236 8586 195 206 214 220 225 228 231 232 234 236 8687 196 207 215 221 225 228 232 233 235 237 8788 197 207 215 221 225 229 232 233 235 237 8889 197 208 216 222 226 229 232 234 236 238 8990 198 208 216 222 226 230 233 234 236 238 9091 199 209 217 223 227 230 233 235 237 239 91
92 199 210 218 223 228 231 234 235 237 240 9293 200 210 218 224 228 231 235 236 238 240 9394 201 211 219 225 229 232 235 237 239 241 9495 202 212 220 226 230 233 236 238 240 242 9596 203 213 221 227 231 234 237 238 241 243 9697 204 215 222 228 232 235 238 240 242 245 9798 206 216 224 229 233 236 240 241 244 246 9899 209 219 226 231 235 238 242 244 246 249 99
Northwest Evaluation AssociationBeginning of School Year LANGUAGE USAGE RIT Score to
Percentile Rank Conversion
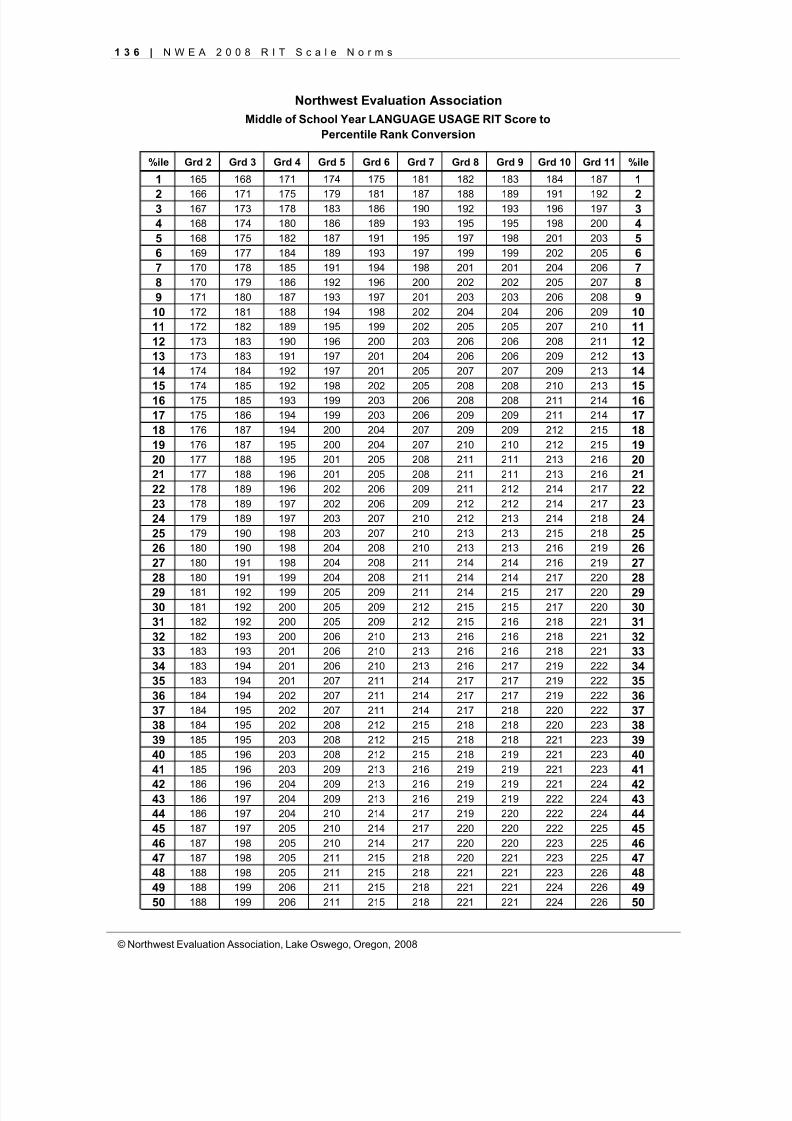
8/7/2019 NWEA Complete Norms2008
http://slidepdf.com/reader/full/nwea-complete-norms2008 146/170
1 3 6 | N W E A 2 0 0 8 R I T S c a l e N o r m s
© Northwest Evaluation Association, Lake Oswego, Oregon, 2008
%ile Grd 2 Grd 3 Grd 4 Grd 5 Grd 6 Grd 7 Grd 8 Grd 9 Grd 10 Grd 11 %ile
1 165 168 171 174 175 181 182 183 184 187 1
2 166 171 175 179 181 187 188 189 191 192 23 167 173 178 183 186 190 192 193 196 197 34 168 174 180 186 189 193 195 195 198 200 45 168 175 182 187 191 195 197 198 201 203 56 169 177 184 189 193 197 199 199 202 205 67 170 178 185 191 194 198 201 201 204 206 78 170 179 186 192 196 200 202 202 205 207 89 171 180 187 193 197 201 203 203 206 208 9
10 172 181 188 194 198 202 204 204 206 209 1011 172 182 189 195 199 202 205 205 207 210 1112 173 183 190 196 200 203 206 206 208 211 1213 173 183 191 197 201 204 206 206 209 212 1314 174 184 192 197 201 205 207 207 209 213 1415 174 185 192 198 202 205 208 208 210 213 1516 175 185 193 199 203 206 208 208 211 214 1617 175 186 194 199 203 206 209 209 211 214 1718 176 187 194 200 204 207 209 209 212 215 1819 176 187 195 200 204 207 210 210 212 215 1920 177 188 195 201 205 208 211 211 213 216 2021 177 188 196 201 205 208 211 211 213 216 2122 178 189 196 202 206 209 211 212 214 217 2223 178 189 197 202 206 209 212 212 214 217 2324 179 189 197 203 207 210 212 213 214 218 2425 179 190 198 203 207 210 213 213 215 218 2526 180 190 198 204 208 210 213 213 216 219 2627 180 191 198 204 208 211 214 214 216 219 2728 180 191 199 204 208 211 214 214 217 220 2829 181 192 199 205 209 211 214 215 217 220 2930 181 192 200 205 209 212 215 215 217 220 3031 182 192 200 205 209 212 215 216 218 221 3132 182 193 200 206 210 213 216 216 218 221 3233 183 193 201 206 210 213 216 216 218 221 3334 183 194 201 206 210 213 216 217 219 222 3435 183 194 201 207 211 214 217 217 219 222 3536 184 194 202 207 211 214 217 217 219 222 3637 184 195 202 207 211 214 217 218 220 222 3738 184 195 202 208 212 215 218 218 220 223 3839 185 195 203 208 212 215 218 218 221 223 3940 185 196 203 208 212 215 218 219 221 223 4041 185 196 203 209 213 216 219 219 221 223 41
42 186 196 204 209 213 216 219 219 221 224 4243 186 197 204 209 213 216 219 219 222 224 4344 186 197 204 210 214 217 219 220 222 224 4445 187 197 205 210 214 217 220 220 222 225 4546 187 198 205 210 214 217 220 220 223 225 4647 187 198 205 211 215 218 220 221 223 225 4748 188 198 205 211 215 218 221 221 223 226 4849 188 199 206 211 215 218 221 221 224 226 4950 188 199 206 211 215 218 221 221 224 226 50
Northwest Evaluation AssociationMiddle of School Year LANGUAGE USAGE RIT Score to
Percentile Rank Conversion
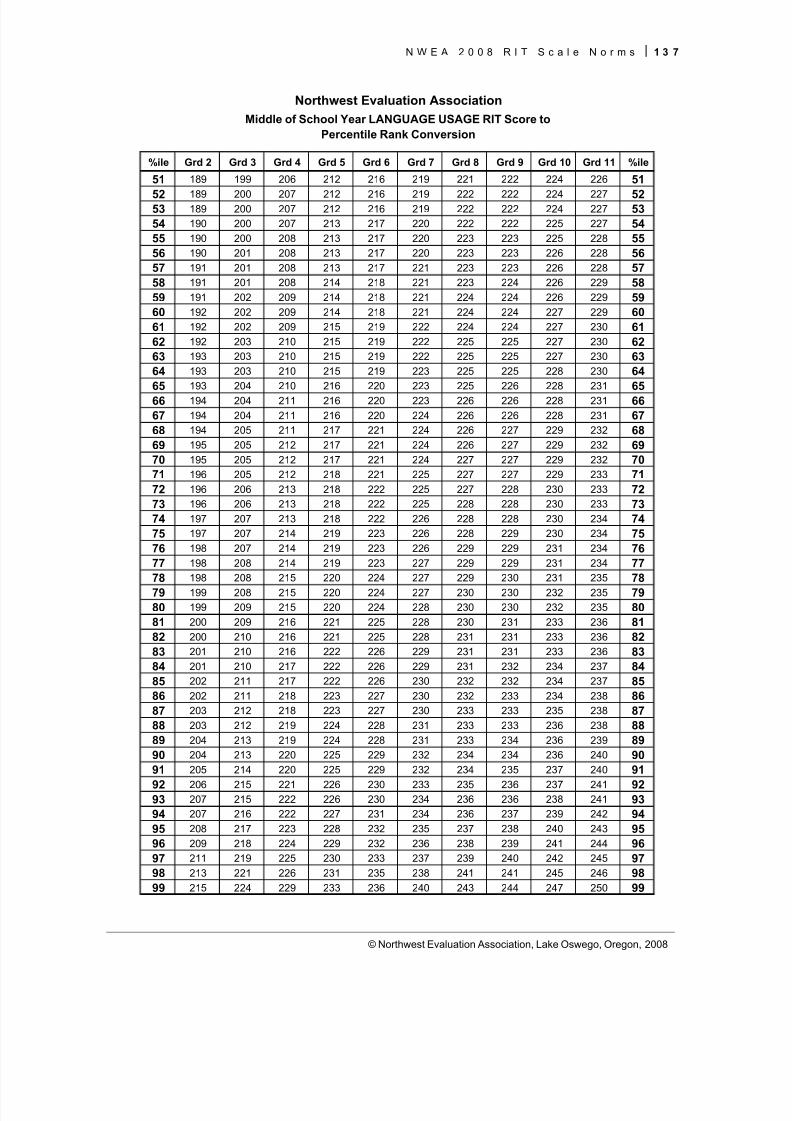
8/7/2019 NWEA Complete Norms2008
http://slidepdf.com/reader/full/nwea-complete-norms2008 147/170
N W E A 2 0 0 8 R I T S c a l e N o r m s 1 3 7
© Northwest Evaluation Association, Lake Oswego, Oregon, 2008
%ile Grd 2 Grd 3 Grd 4 Grd 5 Grd 6 Grd 7 Grd 8 Grd 9 Grd 10 Grd 11 %ile
51 189 199 206 212 216 219 221 222 224 226 51
52 189 200 207 212 216 219 222 222 224 227 5253 189 200 207 212 216 219 222 222 224 227 5354 190 200 207 213 217 220 222 222 225 227 5455 190 200 208 213 217 220 223 223 225 228 5556 190 201 208 213 217 220 223 223 226 228 5657 191 201 208 213 217 221 223 223 226 228 5758 191 201 208 214 218 221 223 224 226 229 5859 191 202 209 214 218 221 224 224 226 229 5960 192 202 209 214 218 221 224 224 227 229 6061 192 202 209 215 219 222 224 224 227 230 6162 192 203 210 215 219 222 225 225 227 230 6263 193 203 210 215 219 222 225 225 227 230 6364 193 203 210 215 219 223 225 225 228 230 6465 193 204 210 216 220 223 225 226 228 231 6566 194 204 211 216 220 223 226 226 228 231 6667 194 204 211 216 220 224 226 226 228 231 6768 194 205 211 217 221 224 226 227 229 232 6869 195 205 212 217 221 224 226 227 229 232 6970 195 205 212 217 221 224 227 227 229 232 7071 196 205 212 218 221 225 227 227 229 233 7172 196 206 213 218 222 225 227 228 230 233 7273 196 206 213 218 222 225 228 228 230 233 7374 197 207 213 218 222 226 228 228 230 234 7475 197 207 214 219 223 226 228 229 230 234 7576 198 207 214 219 223 226 229 229 231 234 7677 198 208 214 219 223 227 229 229 231 234 7778 198 208 215 220 224 227 229 230 231 235 7879 199 208 215 220 224 227 230 230 232 235 7980 199 209 215 220 224 228 230 230 232 235 8081 200 209 216 221 225 228 230 231 233 236 8182 200 210 216 221 225 228 231 231 233 236 8283 201 210 216 222 226 229 231 231 233 236 8384 201 210 217 222 226 229 231 232 234 237 8485 202 211 217 222 226 230 232 232 234 237 8586 202 211 218 223 227 230 232 233 234 238 8687 203 212 218 223 227 230 233 233 235 238 8788 203 212 219 224 228 231 233 233 236 238 8889 204 213 219 224 228 231 233 234 236 239 8990 204 213 220 225 229 232 234 234 236 240 9091 205 214 220 225 229 232 234 235 237 240 91
92 206 215 221 226 230 233 235 236 237 241 9293 207 215 222 226 230 234 236 236 238 241 9394 207 216 222 227 231 234 236 237 239 242 9495 208 217 223 228 232 235 237 238 240 243 9596 209 218 224 229 232 236 238 239 241 244 9697 211 219 225 230 233 237 239 240 242 245 9798 213 221 226 231 235 238 241 241 245 246 9899 215 224 229 233 236 240 243 244 247 250 99
Northwest Evaluation AssociationMiddle of School Year LANGUAGE USAGE RIT Score to
Percentile Rank Conversion
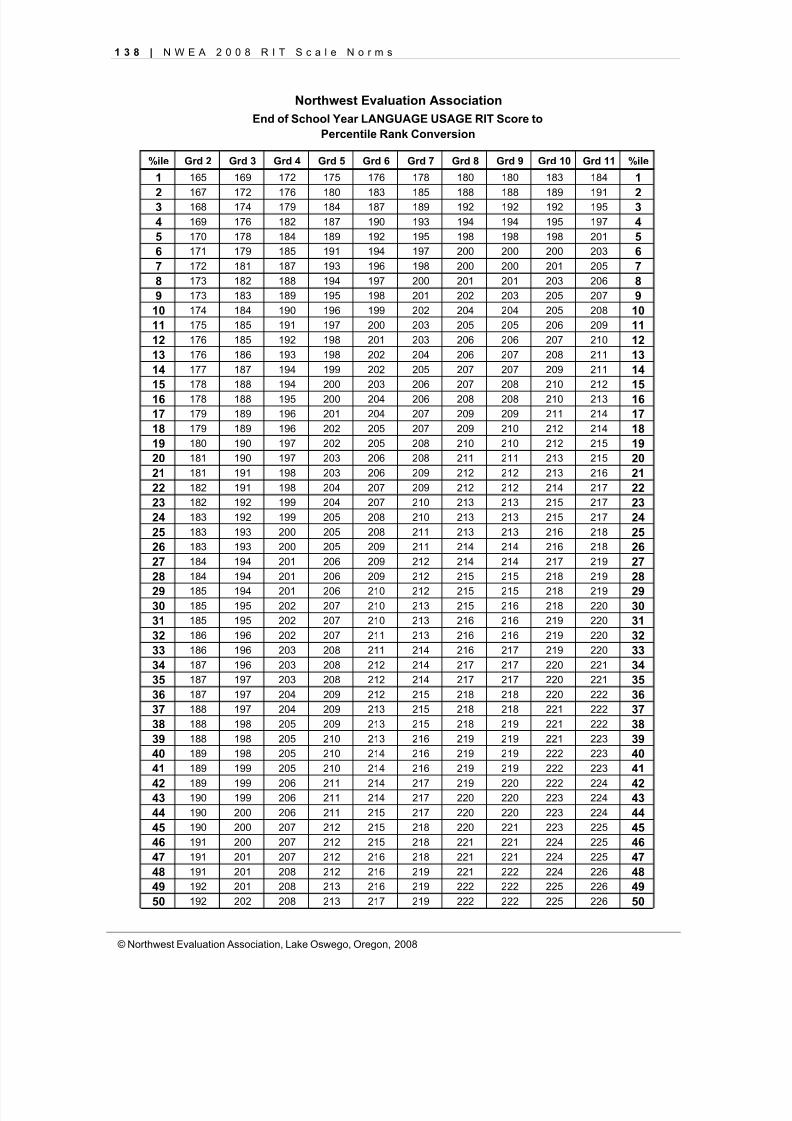
8/7/2019 NWEA Complete Norms2008
http://slidepdf.com/reader/full/nwea-complete-norms2008 148/170
1 3 8 | N W E A 2 0 0 8 R I T S c a l e N o r m s
© Northwest Evaluation Association, Lake Oswego, Oregon, 2008
%ile Grd 2 Grd 3 Grd 4 Grd 5 Grd 6 Grd 7 Grd 8 Grd 9 Grd 10 Grd 11 %ile
1 165 169 172 175 176 178 180 180 183 184 1
2 167 172 176 180 183 185 188 188 189 191 23 168 174 179 184 187 189 192 192 192 195 34 169 176 182 187 190 193 194 194 195 197 45 170 178 184 189 192 195 198 198 198 201 56 171 179 185 191 194 197 200 200 200 203 67 172 181 187 193 196 198 200 200 201 205 78 173 182 188 194 197 200 201 201 203 206 89 173 183 189 195 198 201 202 203 205 207 9
10 174 184 190 196 199 202 204 204 205 208 1011 175 185 191 197 200 203 205 205 206 209 1112 176 185 192 198 201 203 206 206 207 210 1213 176 186 193 198 202 204 206 207 208 211 1314 177 187 194 199 202 205 207 207 209 211 1415 178 188 194 200 203 206 207 208 210 212 1516 178 188 195 200 204 206 208 208 210 213 1617 179 189 196 201 204 207 209 209 211 214 1718 179 189 196 202 205 207 209 210 212 214 1819 180 190 197 202 205 208 210 210 212 215 1920 181 190 197 203 206 208 211 211 213 215 2021 181 191 198 203 206 209 212 212 213 216 2122 182 191 198 204 207 209 212 212 214 217 2223 182 192 199 204 207 210 213 213 215 217 2324 183 192 199 205 208 210 213 213 215 217 2425 183 193 200 205 208 211 213 213 216 218 2526 183 193 200 205 209 211 214 214 216 218 2627 184 194 201 206 209 212 214 214 217 219 2728 184 194 201 206 209 212 215 215 218 219 2829 185 194 201 206 210 212 215 215 218 219 2930 185 195 202 207 210 213 215 216 218 220 3031 185 195 202 207 210 213 216 216 219 220 3132 186 196 202 207 211 213 216 216 219 220 3233 186 196 203 208 211 214 216 217 219 220 3334 187 196 203 208 212 214 217 217 220 221 3435 187 197 203 208 212 214 217 217 220 221 3536 187 197 204 209 212 215 218 218 220 222 3637 188 197 204 209 213 215 218 218 221 222 3738 188 198 205 209 213 215 218 219 221 222 3839 188 198 205 210 213 216 219 219 221 223 3940 189 198 205 210 214 216 219 219 222 223 4041 189 199 205 210 214 216 219 219 222 223 41
42 189 199 206 211 214 217 219 220 222 224 4243 190 199 206 211 214 217 220 220 223 224 4344 190 200 206 211 215 217 220 220 223 224 4445 190 200 207 212 215 218 220 221 223 225 4546 191 200 207 212 215 218 221 221 224 225 4647 191 201 207 212 216 218 221 221 224 225 4748 191 201 208 212 216 219 221 222 224 226 4849 192 201 208 213 216 219 222 222 225 226 4950 192 202 208 213 217 219 222 222 225 226 50
End of School Year LANGUAGE USAGE RIT Score toPercentile Rank Conversion
Northwest Evaluation Association
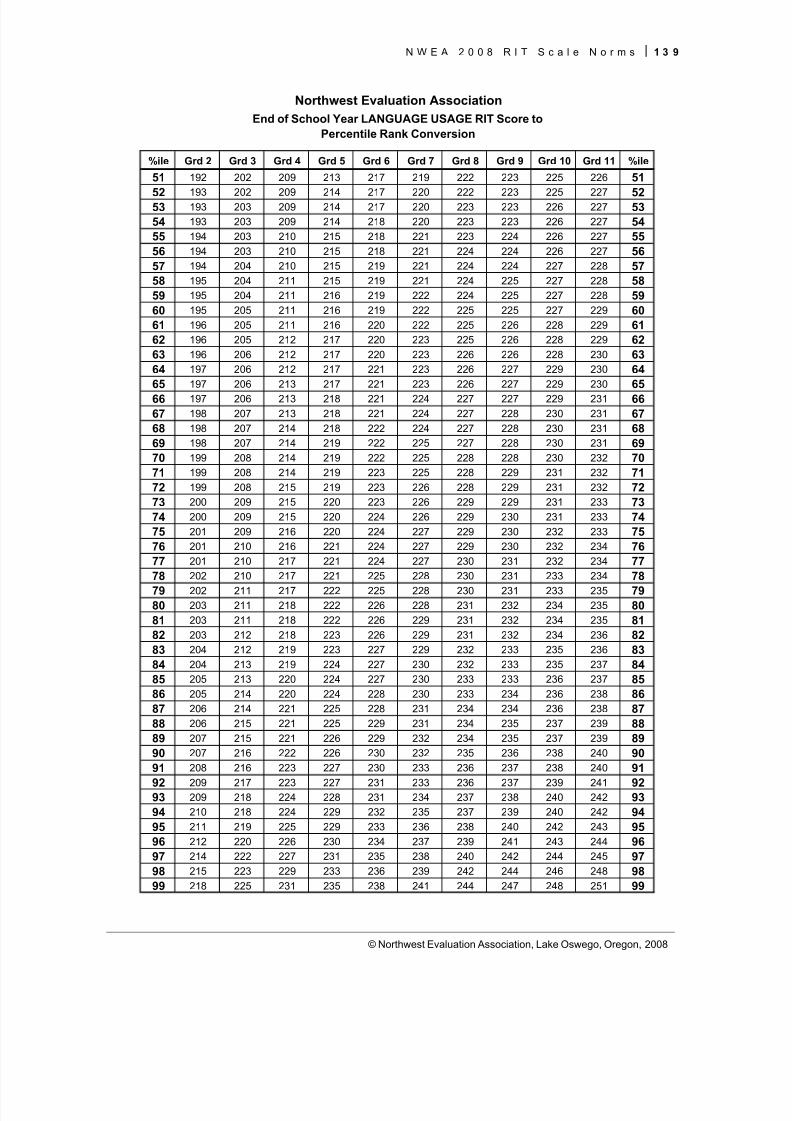
8/7/2019 NWEA Complete Norms2008
http://slidepdf.com/reader/full/nwea-complete-norms2008 149/170
N W E A 2 0 0 8 R I T S c a l e N o r m s 1 3 9
© Northwest Evaluation Association, Lake Oswego, Oregon, 2008
%ile Grd 2 Grd 3 Grd 4 Grd 5 Grd 6 Grd 7 Grd 8 Grd 9 Grd 10 Grd 11 %ile
51 192 202 209 213 217 219 222 223 225 226 51
52 193 202 209 214 217 220 222 223 225 227 5253 193 203 209 214 217 220 223 223 226 227 5354 193 203 209 214 218 220 223 223 226 227 5455 194 203 210 215 218 221 223 224 226 227 5556 194 203 210 215 218 221 224 224 226 227 5657 194 204 210 215 219 221 224 224 227 228 5758 195 204 211 215 219 221 224 225 227 228 5859 195 204 211 216 219 222 224 225 227 228 5960 195 205 211 216 219 222 225 225 227 229 6061 196 205 211 216 220 222 225 226 228 229 6162 196 205 212 217 220 223 225 226 228 229 6263 196 206 212 217 220 223 226 226 228 230 6364 197 206 212 217 221 223 226 227 229 230 6465 197 206 213 217 221 223 226 227 229 230 6566 197 206 213 218 221 224 227 227 229 231 6667 198 207 213 218 221 224 227 228 230 231 6768 198 207 214 218 222 224 227 228 230 231 6869 198 207 214 219 222 225 227 228 230 231 6970 199 208 214 219 222 225 228 228 230 232 7071 199 208 214 219 223 225 228 229 231 232 7172 199 208 215 219 223 226 228 229 231 232 7273 200 209 215 220 223 226 229 229 231 233 7374 200 209 215 220 224 226 229 230 231 233 7475 201 209 216 220 224 227 229 230 232 233 7576 201 210 216 221 224 227 229 230 232 234 7677 201 210 217 221 224 227 230 231 232 234 7778 202 210 217 221 225 228 230 231 233 234 78
79 202 211 217 222 225 228 230 231 233 235 7980 203 211 218 222 226 228 231 232 234 235 8081 203 211 218 222 226 229 231 232 234 235 8182 203 212 218 223 226 229 231 232 234 236 8283 204 212 219 223 227 229 232 233 235 236 8384 204 213 219 224 227 230 232 233 235 237 8485 205 213 220 224 227 230 233 233 236 237 8586 205 214 220 224 228 230 233 234 236 238 8687 206 214 221 225 228 231 234 234 236 238 8788 206 215 221 225 229 231 234 235 237 239 8889 207 215 221 226 229 232 234 235 237 239 8990 207 216 222 226 230 232 235 236 238 240 9091 208 216 223 227 230 233 236 237 238 240 91
92 209 217 223 227 231 233 236 237 239 241 9293 209 218 224 228 231 234 237 238 240 242 9394 210 218 224 229 232 235 237 239 240 242 9495 211 219 225 229 233 236 238 240 242 243 9596 212 220 226 230 234 237 239 241 243 244 9697 214 222 227 231 235 238 240 242 244 245 9798 215 223 229 233 236 239 242 244 246 248 9899 218 225 231 235 238 241 244 247 248 251 99
End of School Year LANGUAGE USAGE RIT Score toPercentile Rank Conversion
Northwest Evaluation Association

8/7/2019 NWEA Complete Norms2008
http://slidepdf.com/reader/full/nwea-complete-norms2008 150/170
1 4 0 | N W E A 2 0 0 8 R I T S c a l e N o r m s
© Northwest Evaluation Association, Lake Oswego, Oregon, 2008
%ile Kdgn Grd 1 Grd 2 Grd 3 Grd 4 Grd 5 Grd 6 Grd 7 Grd 8 Grd 9 Grd 10 Grd 11 %ile
1 136 138 162 167 173 177 180 182 185 186 187 189 12 137 140 163 169 176 181 185 188 191 192 193 194 23 137 141 163 171 178 184 188 192 195 196 197 199 34 138 142 164 172 180 186 191 194 198 199 200 200 45 138 143 164 173 181 188 193 196 200 201 203 203 56 138 144 165 174 183 190 194 198 201 203 205 205 67 139 144 165 175 184 191 196 200 203 204 206 207 78 139 145 166 176 185 192 197 201 204 206 208 208 89 139 146 166 176 186 193 198 202 205 207 209 210 9
10 139 147 167 177 187 194 199 203 207 208 211 211 1011 140 147 167 178 187 195 200 204 208 209 212 213 1112 140 148 168 178 188 196 201 205 209 210 213 214 1213 140 148 168 179 189 197 202 206 210 211 214 215 1314 140 149 168 179 190 197 202 207 210 212 215 216 1415 141 149 169 180 190 198 203 207 211 213 216 217 1516 141 150 169 180 191 198 204 208 212 214 217 218 16
17 141 151 170 181 191 199 204 209 213 215 218 219 1718 141 151 170 181 192 200 205 209 214 216 219 219 1819 141 152 170 182 193 200 206 210 215 216 220 220 1920 142 152 170 182 193 201 206 211 215 217 221 221 2021 142 153 171 182 193 201 207 211 216 218 221 222 2122 142 153 171 183 194 202 207 212 217 219 222 223 2223 142 154 171 183 194 202 208 213 217 219 223 224 2324 143 154 172 184 195 202 208 213 218 220 223 224 2425 143 155 172 184 195 203 209 214 218 220 224 225 2526 143 155 172 184 196 203 209 214 219 221 225 226 2627 143 156 173 185 196 204 210 215 220 222 225 227 2728 143 156 173 185 196 204 210 215 220 222 226 227 2829 144 156 173 185 197 204 211 216 221 223 226 228 2930 144 157 173 186 197 205 211 216 221 223 227 228 30
31 144 157 174 186 197 205 211 217 222 224 227 229 3132 144 158 174 187 198 206 212 217 222 224 228 230 3233 144 158 174 187 198 206 212 218 223 225 229 230 3334 145 158 174 187 198 206 213 218 223 226 229 231 3435 145 159 175 188 199 207 213 219 224 226 230 231 3536 145 159 175 188 199 207 214 219 224 227 230 232 3637 145 159 175 188 199 207 214 220 225 227 231 232 3738 145 160 175 189 200 208 214 220 225 228 231 233 3839 146 160 176 189 200 208 215 220 226 228 232 233 3940 146 160 176 189 200 208 215 221 226 229 232 234 4041 146 161 176 190 201 209 216 221 227 229 233 235 4142 146 161 177 190 201 209 216 222 227 229 233 235 4243 146 162 177 190 201 209 216 222 227 230 233 236 4344 147 162 177 191 202 210 217 223 228 230 234 236 4445 147 162 177 191 202 210 217 223 228 231 234 237 4546 147 163 178 191 202 210 218 223 229 231 235 237 4647 147 163 178 192 203 211 218 224 229 232 235 238 4748 148 163 178 192 203 211 218 224 230 232 236 238 4849 148 164 178 192 203 211 219 225 230 233 236 239 4950 148 164 179 192 203 212 219 225 230 233 237 239 50
Shaded cells are based on samples that were NOT stratified to reflect the U.S. school age population.
Northwest Evaluation Association
Beginning of School Year MATHEMATICS RIT Score to Percentile Rank Conversion

8/7/2019 NWEA Complete Norms2008
http://slidepdf.com/reader/full/nwea-complete-norms2008 151/170
N W E A 2 0 0 8 R I T S c a l e N o r m s 1 4 1
© Northwest Evaluation Association, Lake Oswego, Oregon, 2008
%ile Kdgn Grd 1 Grd 2 Grd 3 Grd 4 Grd 5 Grd 6 Grd 7 Grd 8 Grd 9 Grd 10 Grd 11 %ile
51 148 164 179 193 204 212 219 225 231 233 237 239 5152 148 165 179 193 204 212 220 226 231 234 237 240 5253 149 165 179 193 204 213 220 226 232 234 238 240 5354 149 165 180 194 205 213 220 227 232 235 238 241 5455 149 165 180 194 205 213 221 227 233 235 239 241 5556 149 166 180 194 205 214 221 227 233 236 239 242 5657 150 166 180 195 205 214 222 228 233 236 240 242 5758 150 166 181 195 206 214 222 228 234 237 240 242 5859 150 167 181 195 206 215 222 229 234 237 241 243 5960 150 167 181 195 206 215 223 229 235 237 241 243 6061 151 167 182 196 207 215 223 229 235 238 242 244 6162 151 167 182 196 207 216 223 230 235 238 242 244 6263 151 168 182 196 207 216 224 230 236 239 242 245 6364 151 168 182 197 207 217 224 231 236 239 243 245 6465 152 168 183 197 208 217 224 231 237 240 243 246 6566 152 169 183 197 208 217 225 231 237 240 244 246 66
67 152 169 183 198 208 218 225 232 238 240 244 247 6768 153 169 184 198 209 218 226 232 238 241 245 247 6869 153 170 184 198 209 219 226 233 239 241 245 248 6970 153 170 184 198 209 219 226 233 239 242 246 248 7071 154 170 185 199 210 219 227 234 239 242 246 249 7172 154 171 185 199 210 220 227 234 240 243 246 249 7273 154 171 185 199 210 220 228 234 240 243 247 250 7374 155 171 186 200 211 221 228 235 241 244 247 250 7475 155 172 186 200 211 221 228 235 241 244 248 251 7576 155 172 186 200 211 222 229 236 242 245 248 251 7677 156 173 187 201 212 222 229 236 242 245 249 252 7778 156 173 187 201 212 222 230 237 243 246 249 253 7879 157 173 188 201 213 223 230 237 243 246 250 253 7980 157 174 188 202 213 223 231 238 244 247 250 254 80
81 157 174 189 202 214 224 231 238 244 247 251 254 8182 158 175 189 203 214 224 232 239 245 248 252 255 8283 158 175 190 203 214 225 232 239 245 248 252 255 8384 159 175 190 203 215 226 233 240 246 249 253 256 8485 159 176 191 204 216 226 233 241 247 249 253 257 8586 160 176 191 204 216 227 234 241 247 250 254 257 8687 160 177 192 205 217 227 235 242 248 251 255 258 8788 161 178 192 205 217 228 235 243 249 251 255 258 8889 161 178 193 206 218 229 236 243 249 252 256 259 8990 162 179 193 206 219 229 237 244 250 253 257 260 9091 163 180 194 207 219 230 237 245 251 254 258 261 9192 163 180 195 208 220 231 238 246 252 255 259 262 9293 164 181 196 208 221 232 239 247 253 256 260 263 9394 165 182 197 209 222 233 240 248 254 257 261 264 9495 166 183 198 210 223 234 241 249 255 258 262 265 9596 167 185 199 212 225 236 243 250 256 260 262 267 9697 168 186 200 213 226 238 244 252 258 261 265 268 9798 170 188 202 215 229 240 246 254 260 264 267 270 9899 174 192 205 219 232 244 250 258 264 267 270 273 99
Shaded cells are based on samples that were NOT stratified to reflect the U.S. school age population.
Northwest Evaluation Association
Beginning of School Year MATHEMATICS RIT Score to Percentile Rank Conversion
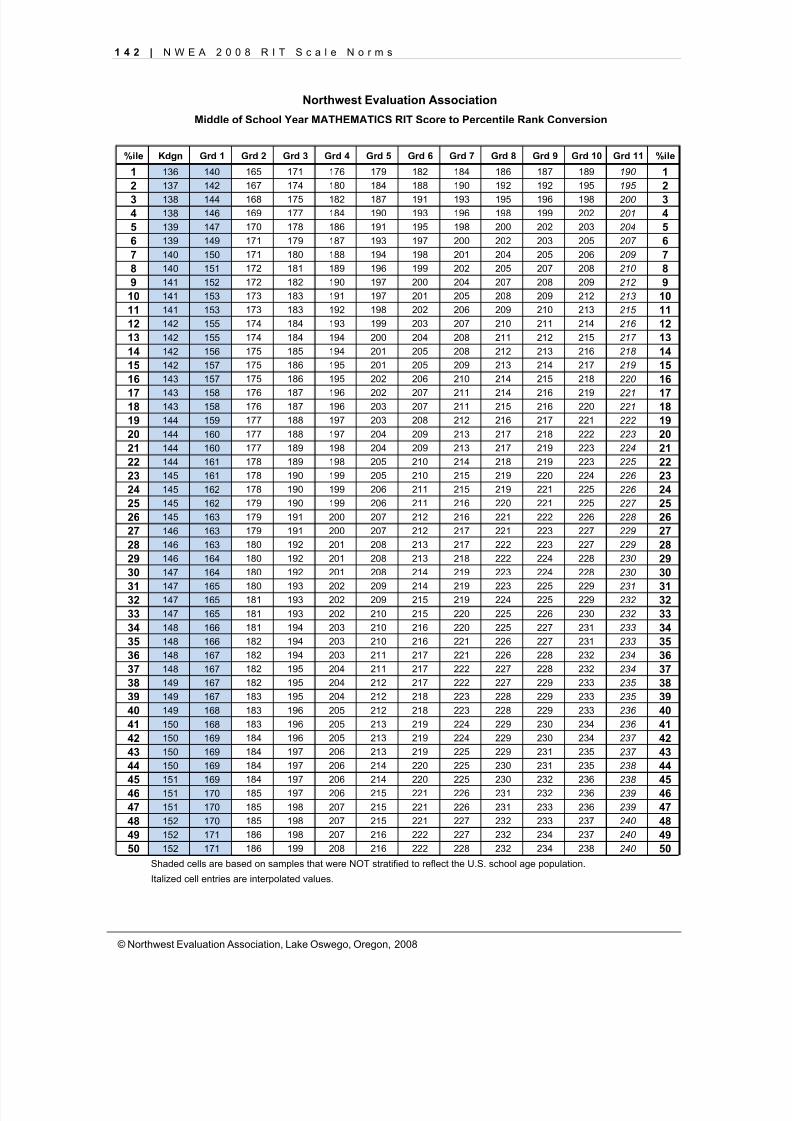
8/7/2019 NWEA Complete Norms2008
http://slidepdf.com/reader/full/nwea-complete-norms2008 152/170
1 4 2 | N W E A 2 0 0 8 R I T S c a l e N o r m s
© Northwest Evaluation Association, Lake Oswego, Oregon, 2008
%ile Kdgn Grd 1 Grd 2 Grd 3 Grd 4 Grd 5 Grd 6 Grd 7 Grd 8 Grd 9 Grd 10 Grd 11 %ile
1 136 140 165 171 176 179 182 184 186 187 189 190 12 137 142 167 174 180 184 188 190 192 192 195 195 23 138 144 168 175 182 187 191 193 195 196 198 200 34 138 146 169 177 184 190 193 196 198 199 202 201 45 139 147 170 178 186 191 195 198 200 202 203 204 56 139 149 171 179 187 193 197 200 202 203 205 207 67 140 150 171 180 188 194 198 201 204 205 206 209 78 140 151 172 181 189 196 199 202 205 207 208 210 89 141 152 172 182 190 197 200 204 207 208 209 212 9
10 141 153 173 183 191 197 201 205 208 209 212 213 1011 141 153 173 183 192 198 202 206 209 210 213 215 1112 142 155 174 184 193 199 203 207 210 211 214 216 1213 142 155 174 184 194 200 204 208 211 212 215 217 1314 142 156 175 185 194 201 205 208 212 213 216 218 1415 142 157 175 186 195 201 205 209 213 214 217 219 1516 143 157 175 186 195 202 206 210 214 215 218 220 16
17 143 158 176 187 196 202 207 211 214 216 219 221 1718 143 158 176 187 196 203 207 211 215 216 220 221 1819 144 159 177 188 197 203 208 212 216 217 221 222 1920 144 160 177 188 197 204 209 213 217 218 222 223 2021 144 160 177 189 198 204 209 213 217 219 223 224 2122 144 161 178 189 198 205 210 214 218 219 223 225 2223 145 161 178 190 199 205 210 215 219 220 224 226 2324 145 162 178 190 199 206 211 215 219 221 225 226 2425 145 162 179 190 199 206 211 216 220 221 225 227 2526 145 163 179 191 200 207 212 216 221 222 226 228 2627 146 163 179 191 200 207 212 217 221 223 227 229 2728 146 163 180 192 201 208 213 217 222 223 227 229 2829 146 164 180 192 201 208 213 218 222 224 228 230 2930 147 164 180 192 201 208 214 219 223 224 228 230 30
31 147 165 180 193 202 209 214 219 223 225 229 231 3132 147 165 181 193 202 209 215 219 224 225 229 232 3233 147 165 181 193 202 210 215 220 225 226 230 232 3334 148 166 181 194 203 210 216 220 225 227 231 233 3435 148 166 182 194 203 210 216 221 226 227 231 233 3536 148 167 182 194 203 211 217 221 226 228 232 234 3637 148 167 182 195 204 211 217 222 227 228 232 234 3738 149 167 182 195 204 212 217 222 227 229 233 235 3839 149 167 183 195 204 212 218 223 228 229 233 235 3940 149 168 183 196 205 212 218 223 228 229 233 236 4041 150 168 183 196 205 213 219 224 229 230 234 236 4142 150 169 184 196 205 213 219 224 229 230 234 237 4243 150 169 184 197 206 213 219 225 229 231 235 237 4344 150 169 184 197 206 214 220 225 230 231 235 238 4445 151 169 184 197 206 214 220 225 230 232 236 238 4546 151 170 185 197 206 215 221 226 231 232 236 239 4647 151 170 185 198 207 215 221 226 231 233 236 239 4748 152 170 185 198 207 215 221 227 232 233 237 240 4849 152 171 186 198 207 216 222 227 232 234 237 240 4950 152 171 186 199 208 216 222 228 232 234 238 240 50
Shaded cells are based on samples that were NOT stratified to reflect the U.S. school age population.
Italized cell entries are interpolated values.
Northwest Evaluation Association
Middle of School Year MATHEMATICS RIT Score to Percentile Rank Conversion
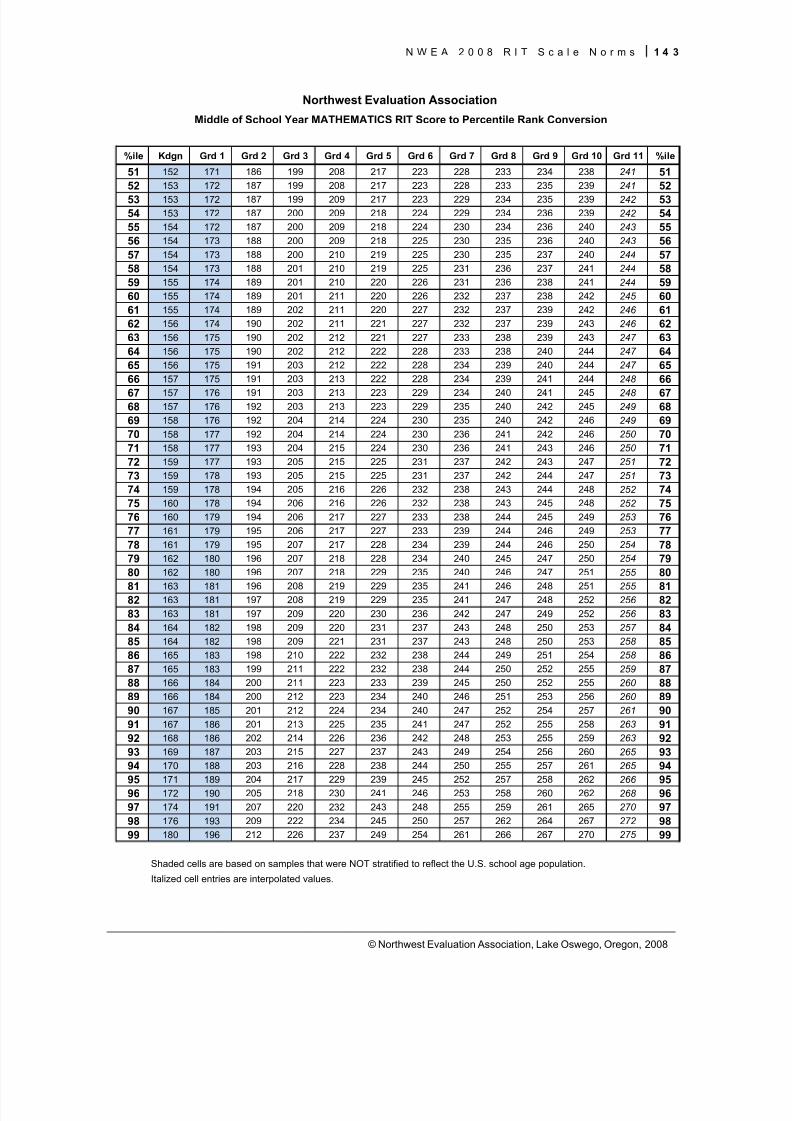
8/7/2019 NWEA Complete Norms2008
http://slidepdf.com/reader/full/nwea-complete-norms2008 153/170
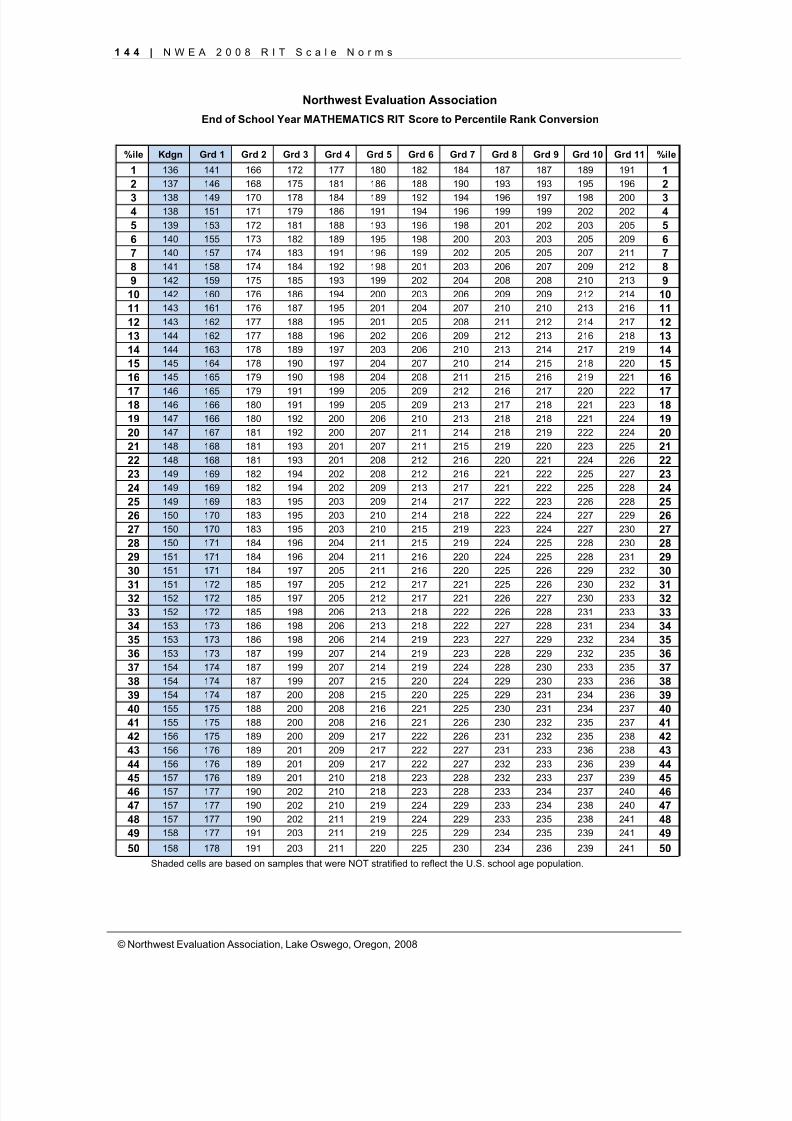
8/7/2019 NWEA Complete Norms2008
http://slidepdf.com/reader/full/nwea-complete-norms2008 154/170
1 4 4 | N W E A 2 0 0 8 R I T S c a l e N o r m s
© Northwest Evaluation Association, Lake Oswego, Oregon, 2008
%ile Kdgn Grd 1 Grd 2 Grd 3 Grd 4 Grd 5 Grd 6 Grd 7 Grd 8 Grd 9 Grd 10 Grd 11 %ile
1 136 141 166 172 177 180 182 184 187 187 189 191 12 137 146 168 175 181 186 188 190 193 193 195 196 2
3 138 149 170 178 184 189 192 194 196 197 198 200 34 138 151 171 179 186 191 194 196 199 199 202 202 45 139 153 172 181 188 193 196 198 201 202 203 205 56 140 155 173 182 189 195 198 200 203 203 205 209 67 140 157 174 183 191 196 199 202 205 205 207 211 78 141 158 174 184 192 198 201 203 206 207 209 212 89 142 159 175 185 193 199 202 204 208 208 210 213 9
10 142 160 176 186 194 200 203 206 209 209 212 214 1011 143 161 176 187 195 201 204 207 210 210 213 216 1112 143 162 177 188 195 201 205 208 211 212 214 217 1213 144 162 177 188 196 202 206 209 212 213 216 218 1314 144 163 178 189 197 203 206 210 213 214 217 219 1415 145 164 178 190 197 204 207 210 214 215 218 220 1516 145 165 179 190 198 204 208 211 215 216 219 221 16
17 146 165 179 191 199 205 209 212 216 217 220 222 1718 146 166 180 191 199 205 209 213 217 218 221 223 1819 147 166 180 192 200 206 210 213 218 218 221 224 1920 147 167 181 192 200 207 211 214 218 219 222 224 2021 148 168 181 193 201 207 211 215 219 220 223 225 2122 148 168 181 193 201 208 212 216 220 221 224 226 2223 149 169 182 194 202 208 212 216 221 222 225 227 2324 149 169 182 194 202 209 213 217 221 222 225 228 2425 149 169 183 195 203 209 214 217 222 223 226 228 2526 150 170 183 195 203 210 214 218 222 224 227 229 2627 150 170 183 195 203 210 215 219 223 224 227 230 2728 150 171 184 196 204 211 215 219 224 225 228 230 2829 151 171 184 196 204 211 216 220 224 225 228 231 2930 151 171 184 197 205 211 216 220 225 226 229 232 30
31 151 172 185 197 205 212 217 221 225 226 230 232 3132 152 172 185 197 205 212 217 221 226 227 230 233 3233 152 172 185 198 206 213 218 222 226 228 231 233 3334 153 173 186 198 206 213 218 222 227 228 231 234 3435 153 173 186 198 206 214 219 223 227 229 232 234 3536 153 173 187 199 207 214 219 223 228 229 232 235 3637 154 174 187 199 207 214 219 224 228 230 233 235 3738 154 174 187 199 207 215 220 224 229 230 233 236 3839 154 174 187 200 208 215 220 225 229 231 234 236 3940 155 175 188 200 208 216 221 225 230 231 234 237 4041 155 175 188 200 208 216 221 226 230 232 235 237 4142 156 175 189 200 209 217 222 226 231 232 235 238 4243 156 176 189 201 209 217 222 227 231 233 236 238 4344 156 176 189 201 209 217 222 227 232 233 236 239 4445 157 176 189 201 210 218 223 228 232 233 237 239 4546 157 177 190 202 210 218 223 228 233 234 237 240 4647 157 177 190 202 210 219 224 229 233 234 238 240 4748 157 177 190 202 211 219 224 229 233 235 238 241 4849 158 177 191 203 211 219 225 229 234 235 239 241 4950 158 178 191 203 211 220 225 230 234 236 239 241 50
Shaded cells are based on samples that were NOT stratified to reflect the U.S. school age population.
Northwest Evaluation Association
End of School Year MATHEMATICS RIT Score to Percentile Rank Conversion
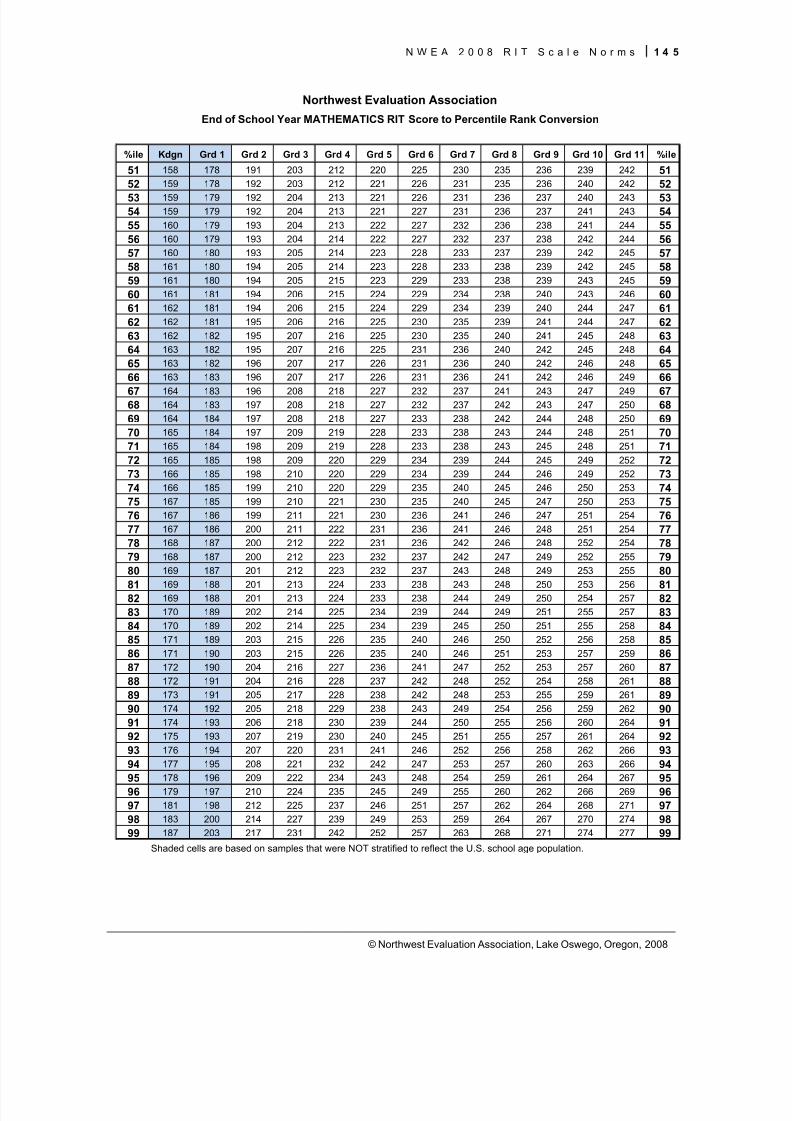
8/7/2019 NWEA Complete Norms2008
http://slidepdf.com/reader/full/nwea-complete-norms2008 155/170
N W E A 2 0 0 8 R I T S c a l e N o r m s 1 4 5
© Northwest Evaluation Association, Lake Oswego, Oregon, 2008
%ile Kdgn Grd 1 Grd 2 Grd 3 Grd 4 Grd 5 Grd 6 Grd 7 Grd 8 Grd 9 Grd 10 Grd 11 %ile
51 158 178 191 203 212 220 225 230 235 236 239 242 5152 159 178 192 203 212 221 226 231 235 236 240 242 52
53 159 179 192 204 213 221 226 231 236 237 240 243 5354 159 179 192 204 213 221 227 231 236 237 241 243 5455 160 179 193 204 213 222 227 232 236 238 241 244 5556 160 179 193 204 214 222 227 232 237 238 242 244 5657 160 180 193 205 214 223 228 233 237 239 242 245 5758 161 180 194 205 214 223 228 233 238 239 242 245 5859 161 180 194 205 215 223 229 233 238 239 243 245 5960 161 181 194 206 215 224 229 234 238 240 243 246 6061 162 181 194 206 215 224 229 234 239 240 244 247 6162 162 181 195 206 216 225 230 235 239 241 244 247 6263 162 182 195 207 216 225 230 235 240 241 245 248 6364 163 182 195 207 216 225 231 236 240 242 245 248 6465 163 182 196 207 217 226 231 236 240 242 246 248 6566 163 183 196 207 217 226 231 236 241 242 246 249 66
67 164 183 196 208 218 227 232 237 241 243 247 249 6768 164 183 197 208 218 227 232 237 242 243 247 250 6869 164 184 197 208 218 227 233 238 242 244 248 250 6970 165 184 197 209 219 228 233 238 243 244 248 251 7071 165 184 198 209 219 228 233 238 243 245 248 251 7172 165 185 198 209 220 229 234 239 244 245 249 252 7273 166 185 198 210 220 229 234 239 244 246 249 252 7374 166 185 199 210 220 229 235 240 245 246 250 253 7475 167 185 199 210 221 230 235 240 245 247 250 253 7576 167 186 199 211 221 230 236 241 246 247 251 254 7677 167 186 200 211 222 231 236 241 246 248 251 254 7778 168 187 200 212 222 231 236 242 246 248 252 254 7879 168 187 200 212 223 232 237 242 247 249 252 255 7980 169 187 201 212 223 232 237 243 248 249 253 255 80
81 169 188 201 213 224 233 238 243 248 250 253 256 8182 169 188 201 213 224 233 238 244 249 250 254 257 8283 170 189 202 214 225 234 239 244 249 251 255 257 8384 170 189 202 214 225 234 239 245 250 251 255 258 8485 171 189 203 215 226 235 240 246 250 252 256 258 8586 171 190 203 215 226 235 240 246 251 253 257 259 8687 172 190 204 216 227 236 241 247 252 253 257 260 8788 172 191 204 216 228 237 242 248 252 254 258 261 8889 173 191 205 217 228 238 242 248 253 255 259 261 8990 174 192 205 218 229 238 243 249 254 256 259 262 9091 174 193 206 218 230 239 244 250 255 256 260 264 9192 175 193 207 219 230 240 245 251 255 257 261 264 9293 176 194 207 220 231 241 246 252 256 258 262 266 9394 177 195 208 221 232 242 247 253 257 260 263 266 9495 178 196 209 222 234 243 248 254 259 261 264 267 9596 179 197 210 224 235 245 249 255 260 262 266 269 9697 181 198 212 225 237 246 251 257 262 264 268 271 9798 183 200 214 227 239 249 253 259 264 267 270 274 9899 187 203 217 231 242 252 257 263 268 271 274 277 99
Shaded cells are based on samples that were NOT stratified to reflect the U.S. school age population.
Northwest Evaluation Association
End of School Year MATHEMATICS RIT Score to Percentile Rank Conversion
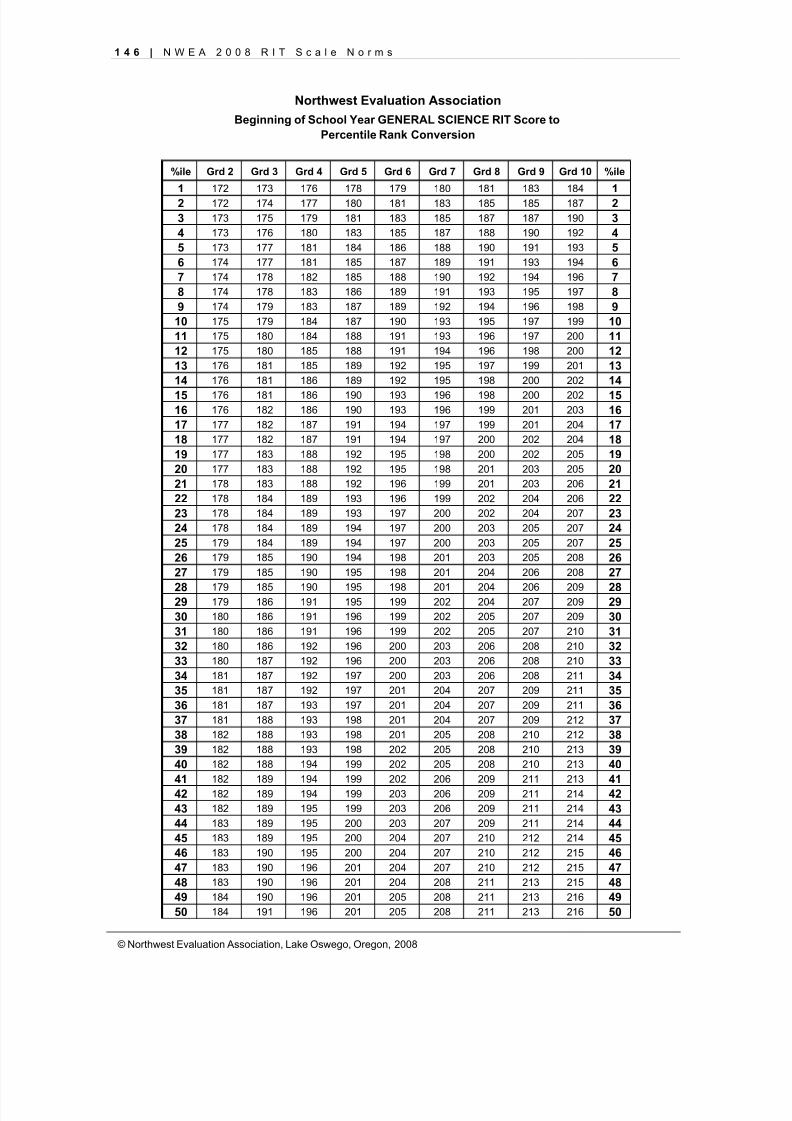
8/7/2019 NWEA Complete Norms2008
http://slidepdf.com/reader/full/nwea-complete-norms2008 156/170
1 4 6 | N W E A 2 0 0 8 R I T S c a l e N o r m s
© Northwest Evaluation Association, Lake Oswego, Oregon, 2008
%ile Grd 2 Grd 3 Grd 4 Grd 5 Grd 6 Grd 7 Grd 8 Grd 9 Grd 10 %ile
1 172 173 176 178 179 180 181 183 184 12 172 174 177 180 181 183 185 185 187 23 173 175 179 181 183 185 187 187 190 34 173 176 180 183 185 187 188 190 192 45 173 177 181 184 186 188 190 191 193 56 174 177 181 185 187 189 191 193 194 67 174 178 182 185 188 190 192 194 196 78 174 178 183 186 189 191 193 195 197 89 174 179 183 187 189 192 194 196 198 9
10 175 179 184 187 190 193 195 197 199 1011 175 180 184 188 191 193 196 197 200 1112 175 180 185 188 191 194 196 198 200 1213 176 181 185 189 192 195 197 199 201 1314 176 181 186 189 192 195 198 200 202 1415 176 181 186 190 193 196 198 200 202 1516 176 182 186 190 193 196 199 201 203 1617 177 182 187 191 194 197 199 201 204 1718 177 182 187 191 194 197 200 202 204 1819 177 183 188 192 195 198 200 202 205 1920 177 183 188 192 195 198 201 203 205 2021 178 183 188 192 196 199 201 203 206 2122 178 184 189 193 196 199 202 204 206 2223 178 184 189 193 197 200 202 204 207 2324 178 184 189 194 197 200 203 205 207 2425 179 184 189 194 197 200 203 205 207 2526 179 185 190 194 198 201 203 205 208 2627 179 185 190 195 198 201 204 206 208 27
28 179 185 190 195 198 201 204 206 209 2829 179 186 191 195 199 202 204 207 209 2930 180 186 191 196 199 202 205 207 209 3031 180 186 191 196 199 202 205 207 210 3132 180 186 192 196 200 203 206 208 210 3233 180 187 192 196 200 203 206 208 210 3334 181 187 192 197 200 203 206 208 211 3435 181 187 192 197 201 204 207 209 211 3536 181 187 193 197 201 204 207 209 211 3637 181 188 193 198 201 204 207 209 212 3738 182 188 193 198 201 205 208 210 212 3839 182 188 193 198 202 205 208 210 213 3940 182 188 194 199 202 205 208 210 213 4041 182 189 194 199 202 206 209 211 213 4142 182 189 194 199 203 206 209 211 214 4243 182 189 195 199 203 206 209 211 214 4344 183 189 195 200 203 207 209 211 214 4445 183 189 195 200 204 207 210 212 214 4546 183 190 195 200 204 207 210 212 215 4647 183 190 196 201 204 207 210 212 215 4748 183 190 196 201 204 208 211 213 215 4849 184 190 196 201 205 208 211 213 216 4950 184 191 196 201 205 208 211 213 216 50
Northwest Evaluation AssociationBeginning of School Year GENERAL SCIENCE RIT Score to
Percentile Rank Conversion
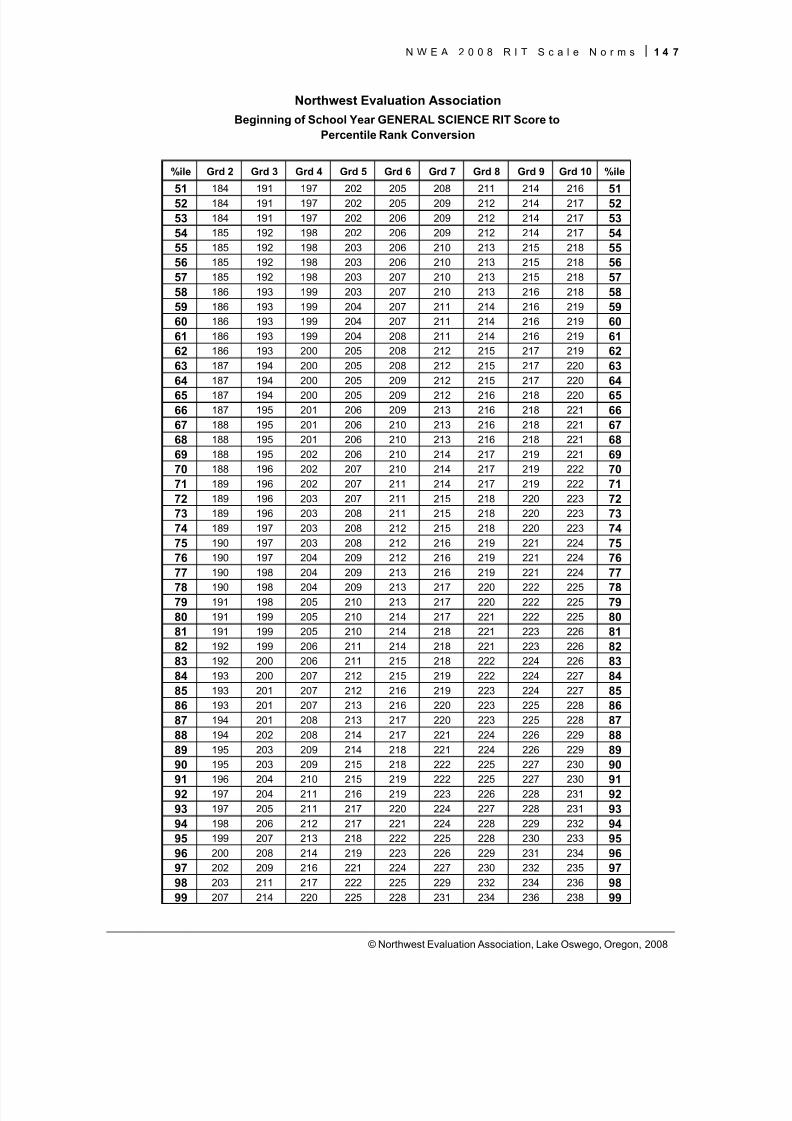
8/7/2019 NWEA Complete Norms2008
http://slidepdf.com/reader/full/nwea-complete-norms2008 157/170
N W E A 2 0 0 8 R I T S c a l e N o r m s 1 4 7
© Northwest Evaluation Association, Lake Oswego, Oregon, 2008
%ile Grd 2 Grd 3 Grd 4 Grd 5 Grd 6 Grd 7 Grd 8 Grd 9 Grd 10 %ile
51 184 191 197 202 205 208 211 214 216 5152 184 191 197 202 205 209 212 214 217 5253 184 191 197 202 206 209 212 214 217 5354 185 192 198 202 206 209 212 214 217 5455 185 192 198 203 206 210 213 215 218 5556 185 192 198 203 206 210 213 215 218 5657 185 192 198 203 207 210 213 215 218 5758 186 193 199 203 207 210 213 216 218 5859 186 193 199 204 207 211 214 216 219 5960 186 193 199 204 207 211 214 216 219 6061 186 193 199 204 208 211 214 216 219 6162 186 193 200 205 208 212 215 217 219 6263 187 194 200 205 208 212 215 217 220 6364 187 194 200 205 209 212 215 217 220 6465 187 194 200 205 209 212 216 218 220 6566 187 195 201 206 209 213 216 218 221 6667 188 195 201 206 210 213 216 218 221 6768 188 195 201 206 210 213 216 218 221 6869 188 195 202 206 210 214 217 219 221 6970 188 196 202 207 210 214 217 219 222 7071 189 196 202 207 211 214 217 219 222 7172 189 196 203 207 211 215 218 220 223 7273 189 196 203 208 211 215 218 220 223 7374 189 197 203 208 212 215 218 220 223 7475 190 197 203 208 212 216 219 221 224 7576 190 197 204 209 212 216 219 221 224 7677 190 198 204 209 213 216 219 221 224 77
78 190 198 204 209 213 217 220 222 225 7879 191 198 205 210 213 217 220 222 225 7980 191 199 205 210 214 217 221 222 225 8081 191 199 205 210 214 218 221 223 226 8182 192 199 206 211 214 218 221 223 226 8283 192 200 206 211 215 218 222 224 226 8384 193 200 207 212 215 219 222 224 227 8485 193 201 207 212 216 219 223 224 227 8586 193 201 207 213 216 220 223 225 228 8687 194 201 208 213 217 220 223 225 228 8788 194 202 208 214 217 221 224 226 229 8889 195 203 209 214 218 221 224 226 229 8990 195 203 209 215 218 222 225 227 230 9091 196 204 210 215 219 222 225 227 230 9192 197 204 211 216 219 223 226 228 231 9293 197 205 211 217 220 224 227 228 231 9394 198 206 212 217 221 224 228 229 232 9495 199 207 213 218 222 225 228 230 233 9596 200 208 214 219 223 226 229 231 234 9697 202 209 216 221 224 227 230 232 235 9798 203 211 217 222 225 229 232 234 236 9899 207 214 220 225 228 231 234 236 238 99
Northwest Evaluation AssociationBeginning of School Year GENERAL SCIENCE RIT Score to
Percentile Rank Conversion
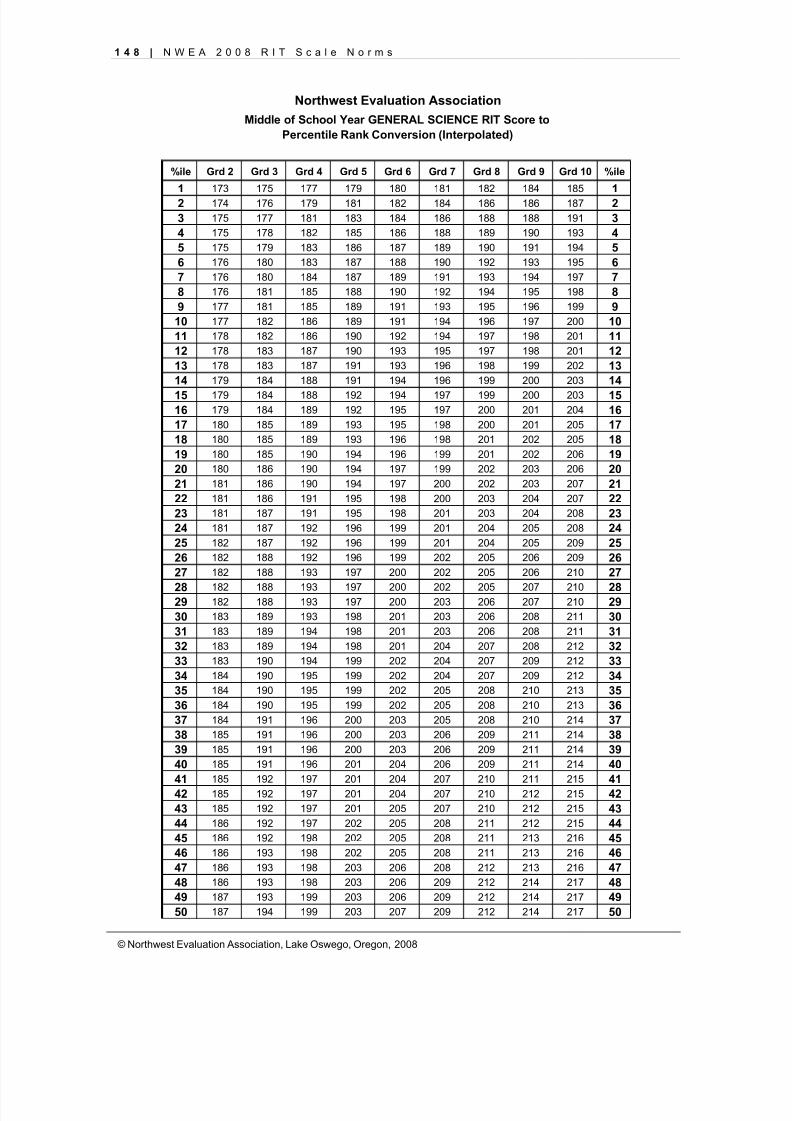
8/7/2019 NWEA Complete Norms2008
http://slidepdf.com/reader/full/nwea-complete-norms2008 158/170
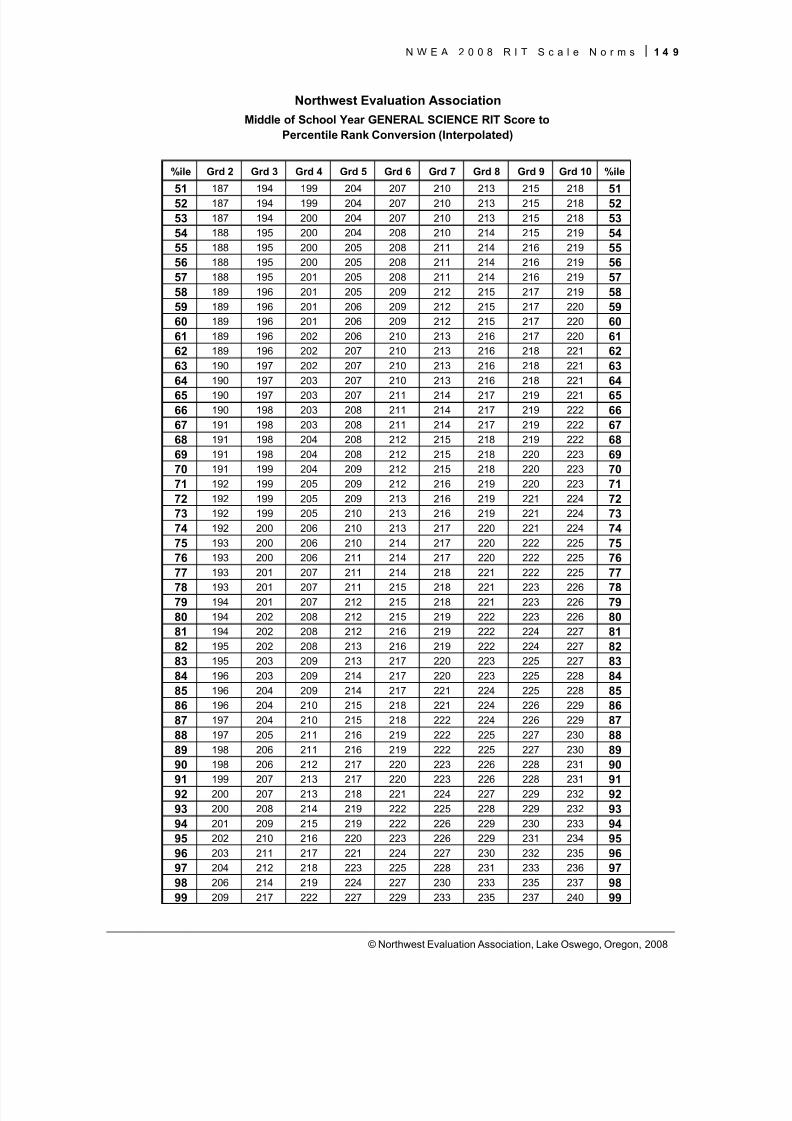
8/7/2019 NWEA Complete Norms2008
http://slidepdf.com/reader/full/nwea-complete-norms2008 159/170
N W E A 2 0 0 8 R I T S c a l e N o r m s 1 4 9
© Northwest Evaluation Association, Lake Oswego, Oregon, 2008
%ile Grd 2 Grd 3 Grd 4 Grd 5 Grd 6 Grd 7 Grd 8 Grd 9 Grd 10 %ile
51 187 194 199 204 207 210 213 215 218 5152 187 194 199 204 207 210 213 215 218 5253 187 194 200 204 207 210 213 215 218 5354 188 195 200 204 208 210 214 215 219 5455 188 195 200 205 208 211 214 216 219 5556 188 195 200 205 208 211 214 216 219 5657 188 195 201 205 208 211 214 216 219 5758 189 196 201 205 209 212 215 217 219 5859 189 196 201 206 209 212 215 217 220 5960 189 196 201 206 209 212 215 217 220 6061 189 196 202 206 210 213 216 217 220 6162 189 196 202 207 210 213 216 218 221 6263 190 197 202 207 210 213 216 218 221 6364 190 197 203 207 210 213 216 218 221 6465 190 197 203 207 211 214 217 219 221 6566 190 198 203 208 211 214 217 219 222 6667 191 198 203 208 211 214 217 219 222 6768 191 198 204 208 212 215 218 219 222 6869 191 198 204 208 212 215 218 220 223 6970 191 199 204 209 212 215 218 220 223 7071 192 199 205 209 212 216 219 220 223 7172 192 199 205 209 213 216 219 221 224 7273 192 199 205 210 213 216 219 221 224 7374 192 200 206 210 213 217 220 221 224 7475 193 200 206 210 214 217 220 222 225 7576 193 200 206 211 214 217 220 222 225 7677 193 201 207 211 214 218 221 222 225 77
78 193 201 207 211 215 218 221 223 226 7879 194 201 207 212 215 218 221 223 226 7980 194 202 208 212 215 219 222 223 226 8081 194 202 208 212 216 219 222 224 227 8182 195 202 208 213 216 219 222 224 227 8283 195 203 209 213 217 220 223 225 227 8384 196 203 209 214 217 220 223 225 228 8485 196 204 209 214 217 221 224 225 228 8586 196 204 210 215 218 221 224 226 229 8687 197 204 210 215 218 222 224 226 229 8788 197 205 211 216 219 222 225 227 230 8889 198 206 211 216 219 222 225 227 230 8990 198 206 212 217 220 223 226 228 231 9091 199 207 213 217 220 223 226 228 231 9192 200 207 213 218 221 224 227 229 232 9293 200 208 214 219 222 225 228 229 232 9394 201 209 215 219 222 226 229 230 233 9495 202 210 216 220 223 226 229 231 234 9596 203 211 217 221 224 227 230 232 235 9697 204 212 218 223 225 228 231 233 236 9798 206 214 219 224 227 230 233 235 237 9899 209 217 222 227 229 233 235 237 240 99
Northwest Evaluation AssociationMiddle of School Year GENERAL SCIENCE RIT Score to
Percentile Rank Conversion (Interpolated)
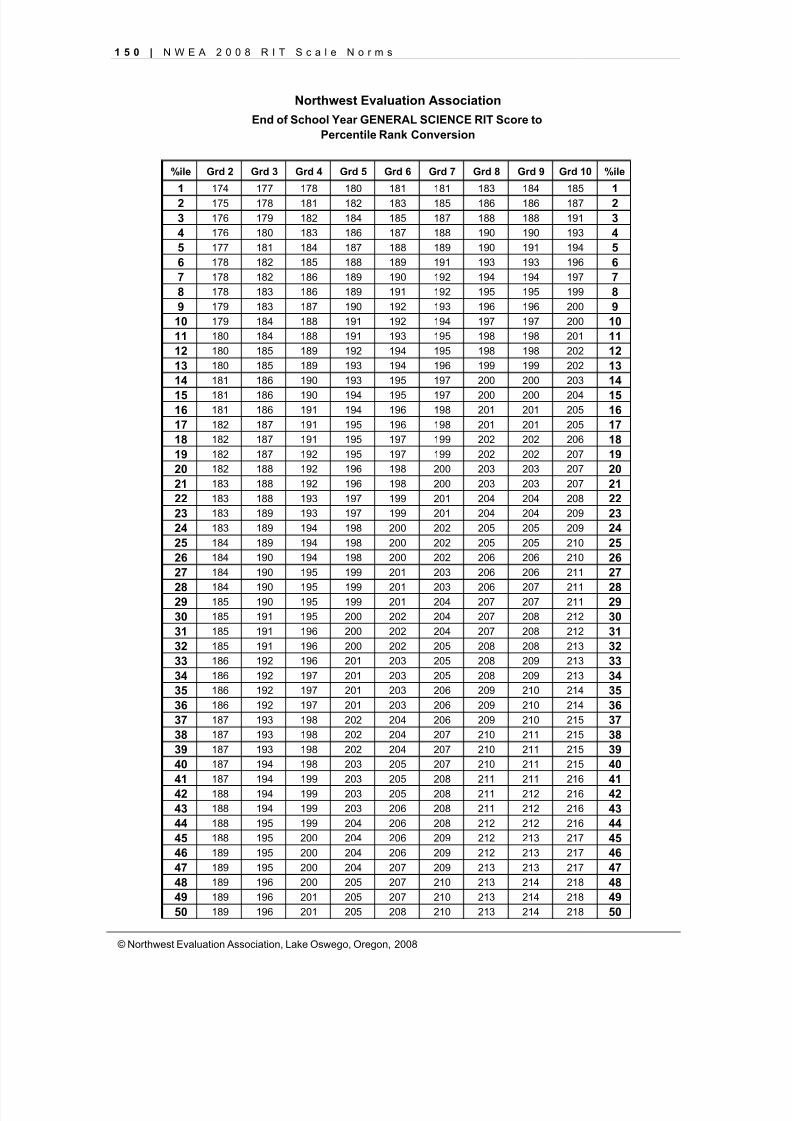
8/7/2019 NWEA Complete Norms2008
http://slidepdf.com/reader/full/nwea-complete-norms2008 160/170
1 5 0 | N W E A 2 0 0 8 R I T S c a l e N o r m s
© Northwest Evaluation Association, Lake Oswego, Oregon, 2008
%ile Grd 2 Grd 3 Grd 4 Grd 5 Grd 6 Grd 7 Grd 8 Grd 9 Grd 10 %ile
1 174 177 178 180 181 181 183 184 185 12 175 178 181 182 183 185 186 186 187 23 176 179 182 184 185 187 188 188 191 34 176 180 183 186 187 188 190 190 193 45 177 181 184 187 188 189 190 191 194 56 178 182 185 188 189 191 193 193 196 67 178 182 186 189 190 192 194 194 197 78 178 183 186 189 191 192 195 195 199 89 179 183 187 190 192 193 196 196 200 9
10 179 184 188 191 192 194 197 197 200 1011 180 184 188 191 193 195 198 198 201 1112 180 185 189 192 194 195 198 198 202 1213 180 185 189 193 194 196 199 199 202 1314 181 186 190 193 195 197 200 200 203 1415 181 186 190 194 195 197 200 200 204 1516 181 186 191 194 196 198 201 201 205 1617 182 187 191 195 196 198 201 201 205 1718 182 187 191 195 197 199 202 202 206 1819 182 187 192 195 197 199 202 202 207 1920 182 188 192 196 198 200 203 203 207 2021 183 188 192 196 198 200 203 203 207 2122 183 188 193 197 199 201 204 204 208 2223 183 189 193 197 199 201 204 204 209 2324 183 189 194 198 200 202 205 205 209 2425 184 189 194 198 200 202 205 205 210 2526 184 190 194 198 200 202 206 206 210 2627 184 190 195 199 201 203 206 206 211 27
28 184 190 195 199 201 203 206 207 211 2829 185 190 195 199 201 204 207 207 211 2930 185 191 195 200 202 204 207 208 212 3031 185 191 196 200 202 204 207 208 212 3132 185 191 196 200 202 205 208 208 213 3233 186 192 196 201 203 205 208 209 213 3334 186 192 197 201 203 205 208 209 213 3435 186 192 197 201 203 206 209 210 214 3536 186 192 197 201 203 206 209 210 214 3637 187 193 198 202 204 206 209 210 215 3738 187 193 198 202 204 207 210 211 215 3839 187 193 198 202 204 207 210 211 215 3940 187 194 198 203 205 207 210 211 215 4041 187 194 199 203 205 208 211 211 216 4142 188 194 199 203 205 208 211 212 216 4243 188 194 199 203 206 208 211 212 216 4344 188 195 199 204 206 208 212 212 216 4445 188 195 200 204 206 209 212 213 217 4546 189 195 200 204 206 209 212 213 217 4647 189 195 200 204 207 209 213 213 217 4748 189 196 200 205 207 210 213 214 218 4849 189 196 201 205 207 210 213 214 218 4950 189 196 201 205 208 210 213 214 218 50
Northwest Evaluation AssociationEnd of School Year GENERAL SCIENCE RIT Score to
Percentile Rank Conversion
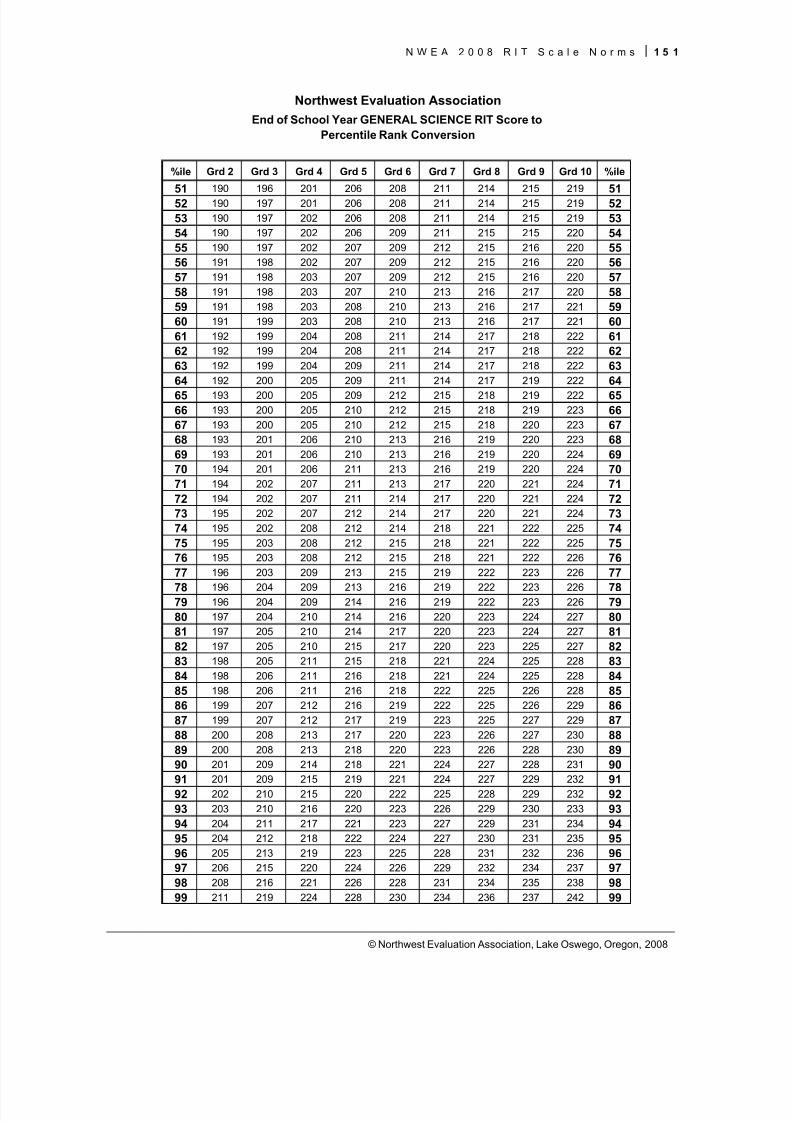
8/7/2019 NWEA Complete Norms2008
http://slidepdf.com/reader/full/nwea-complete-norms2008 161/170
N W E A 2 0 0 8 R I T S c a l e N o r m s 1 5 1
© Northwest Evaluation Association, Lake Oswego, Oregon, 2008
%ile Grd 2 Grd 3 Grd 4 Grd 5 Grd 6 Grd 7 Grd 8 Grd 9 Grd 10 %ile
51 190 196 201 206 208 211 214 215 219 5152 190 197 201 206 208 211 214 215 219 5253 190 197 202 206 208 211 214 215 219 5354 190 197 202 206 209 211 215 215 220 5455 190 197 202 207 209 212 215 216 220 5556 191 198 202 207 209 212 215 216 220 5657 191 198 203 207 209 212 215 216 220 5758 191 198 203 207 210 213 216 217 220 5859 191 198 203 208 210 213 216 217 221 5960 191 199 203 208 210 213 216 217 221 6061 192 199 204 208 211 214 217 218 222 6162 192 199 204 208 211 214 217 218 222 6263 192 199 204 209 211 214 217 218 222 6364 192 200 205 209 211 214 217 219 222 6465 193 200 205 209 212 215 218 219 222 6566 193 200 205 210 212 215 218 219 223 6667 193 200 205 210 212 215 218 220 223 6768 193 201 206 210 213 216 219 220 223 6869 193 201 206 210 213 216 219 220 224 6970 194 201 206 211 213 216 219 220 224 7071 194 202 207 211 213 217 220 221 224 7172 194 202 207 211 214 217 220 221 224 7273 195 202 207 212 214 217 220 221 224 7374 195 202 208 212 214 218 221 222 225 7475 195 203 208 212 215 218 221 222 225 7576 195 203 208 212 215 218 221 222 226 7677 196 203 209 213 215 219 222 223 226 77
78 196 204 209 213 216 219 222 223 226 7879 196 204 209 214 216 219 222 223 226 7980 197 204 210 214 216 220 223 224 227 8081 197 205 210 214 217 220 223 224 227 8182 197 205 210 215 217 220 223 225 227 8283 198 205 211 215 218 221 224 225 228 8384 198 206 211 216 218 221 224 225 228 8485 198 206 211 216 218 222 225 226 228 8586 199 207 212 216 219 222 225 226 229 8687 199 207 212 217 219 223 225 227 229 8788 200 208 213 217 220 223 226 227 230 8889 200 208 213 218 220 223 226 228 230 8990 201 209 214 218 221 224 227 228 231 9091 201 209 215 219 221 224 227 229 232 9192 202 210 215 220 222 225 228 229 232 9293 203 210 216 220 223 226 229 230 233 9394 204 211 217 221 223 227 229 231 234 9495 204 212 218 222 224 227 230 231 235 9596 205 213 219 223 225 228 231 232 236 9697 206 215 220 224 226 229 232 234 237 9798 208 216 221 226 228 231 234 235 238 9899 211 219 224 228 230 234 236 237 242 99
Northwest Evaluation AssociationEnd of School Year GENERAL SCIENCE RIT Score to
Percentile Rank Conversion
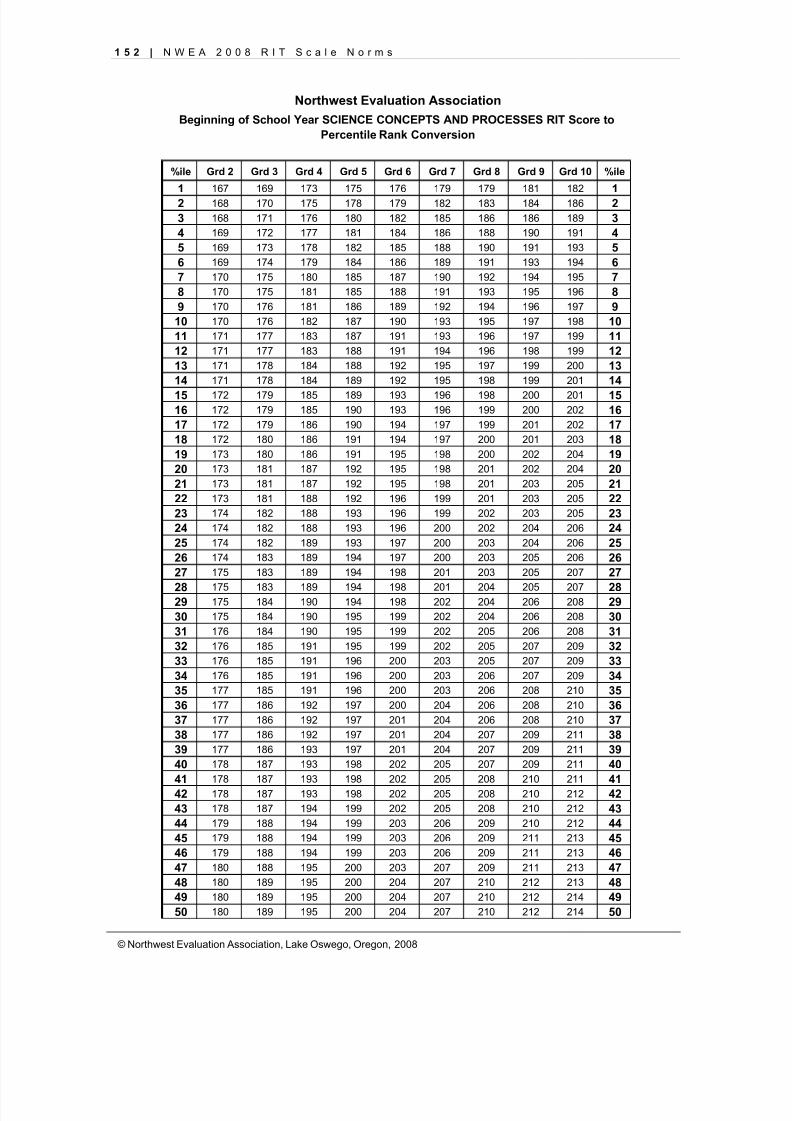
8/7/2019 NWEA Complete Norms2008
http://slidepdf.com/reader/full/nwea-complete-norms2008 162/170
1 5 2 | N W E A 2 0 0 8 R I T S c a l e N o r m s
© Northwest Evaluation Association, Lake Oswego, Oregon, 2008
%ile Grd 2 Grd 3 Grd 4 Grd 5 Grd 6 Grd 7 Grd 8 Grd 9 Grd 10 %ile
1 167 169 173 175 176 179 179 181 182 12 168 170 175 178 179 182 183 184 186 23 168 171 176 180 182 185 186 186 189 34 169 172 177 181 184 186 188 190 191 45 169 173 178 182 185 188 190 191 193 56 169 174 179 184 186 189 191 193 194 67 170 175 180 185 187 190 192 194 195 78 170 175 181 185 188 191 193 195 196 89 170 176 181 186 189 192 194 196 197 9
10 170 176 182 187 190 193 195 197 198 1011 171 177 183 187 191 193 196 197 199 1112 171 177 183 188 191 194 196 198 199 1213 171 178 184 188 192 195 197 199 200 1314 171 178 184 189 192 195 198 199 201 1415 172 179 185 189 193 196 198 200 201 1516 172 179 185 190 193 196 199 200 202 1617 172 179 186 190 194 197 199 201 202 1718 172 180 186 191 194 197 200 201 203 1819 173 180 186 191 195 198 200 202 204 1920 173 181 187 192 195 198 201 202 204 2021 173 181 187 192 195 198 201 203 205 2122 173 181 188 192 196 199 201 203 205 2223 174 182 188 193 196 199 202 203 205 2324 174 182 188 193 196 200 202 204 206 2425 174 182 189 193 197 200 203 204 206 2526 174 183 189 194 197 200 203 205 206 2627 175 183 189 194 198 201 203 205 207 27
28 175 183 189 194 198 201 204 205 207 2829 175 184 190 194 198 202 204 206 208 2930 175 184 190 195 199 202 204 206 208 3031 176 184 190 195 199 202 205 206 208 3132 176 185 191 195 199 202 205 207 209 3233 176 185 191 196 200 203 205 207 209 3334 176 185 191 196 200 203 206 207 209 3435 177 185 191 196 200 203 206 208 210 3536 177 186 192 197 200 204 206 208 210 3637 177 186 192 197 201 204 206 208 210 3738 177 186 192 197 201 204 207 209 211 3839 177 186 193 197 201 204 207 209 211 3940 178 187 193 198 202 205 207 209 211 4041 178 187 193 198 202 205 208 210 211 4142 178 187 193 198 202 205 208 210 212 4243 178 187 194 199 202 205 208 210 212 4344 179 188 194 199 203 206 209 210 212 4445 179 188 194 199 203 206 209 211 213 4546 179 188 194 199 203 206 209 211 213 4647 180 188 195 200 203 207 209 211 213 4748 180 189 195 200 204 207 210 212 213 4849 180 189 195 200 204 207 210 212 214 4950 180 189 195 200 204 207 210 212 214 50
Northwest Evaluation AssociationBeginning of School Year SCIENCE CONCEPTS AND PROCESSES RIT Score to
Percentile Rank Conversion
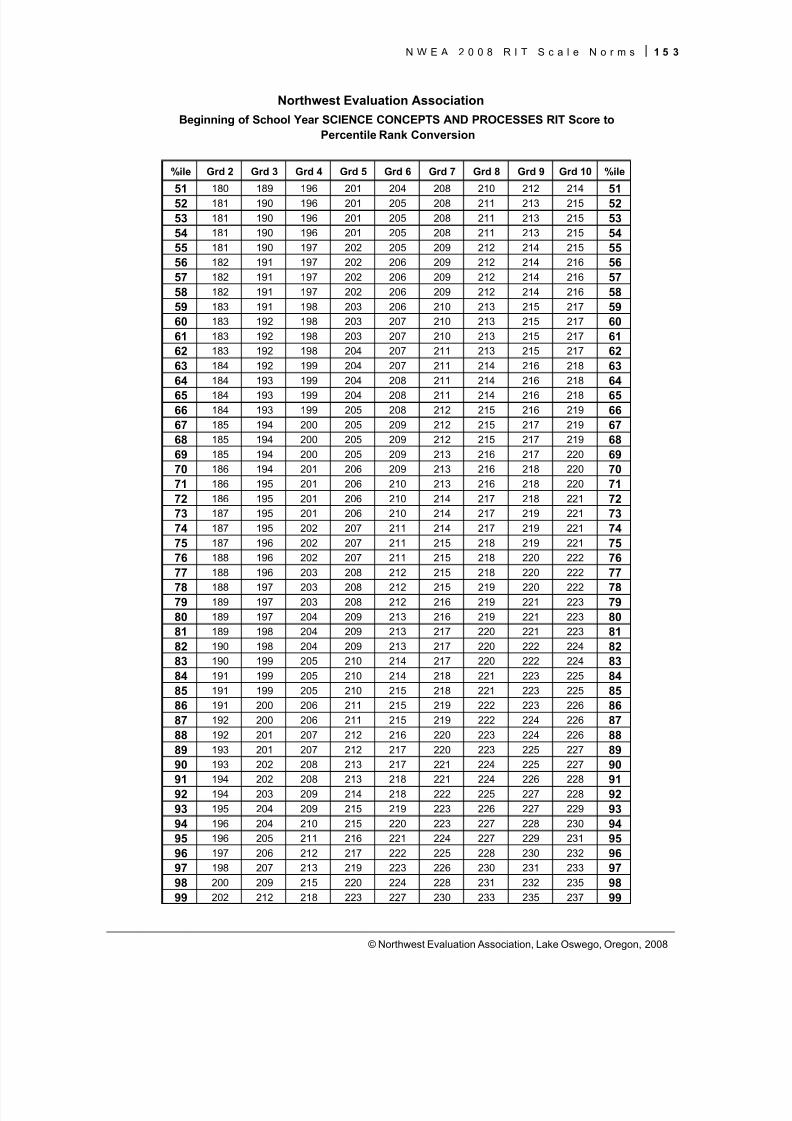
8/7/2019 NWEA Complete Norms2008
http://slidepdf.com/reader/full/nwea-complete-norms2008 163/170
N W E A 2 0 0 8 R I T S c a l e N o r m s 1 5 3
© Northwest Evaluation Association, Lake Oswego, Oregon, 2008
%ile Grd 2 Grd 3 Grd 4 Grd 5 Grd 6 Grd 7 Grd 8 Grd 9 Grd 10 %ile
51 180 189 196 201 204 208 210 212 214 5152 181 190 196 201 205 208 211 213 215 5253 181 190 196 201 205 208 211 213 215 5354 181 190 196 201 205 208 211 213 215 5455 181 190 197 202 205 209 212 214 215 5556 182 191 197 202 206 209 212 214 216 5657 182 191 197 202 206 209 212 214 216 5758 182 191 197 202 206 209 212 214 216 5859 183 191 198 203 206 210 213 215 217 5960 183 192 198 203 207 210 213 215 217 6061 183 192 198 203 207 210 213 215 217 6162 183 192 198 204 207 211 213 215 217 6263 184 192 199 204 207 211 214 216 218 6364 184 193 199 204 208 211 214 216 218 6465 184 193 199 204 208 211 214 216 218 6566 184 193 199 205 208 212 215 216 219 6667 185 194 200 205 209 212 215 217 219 6768 185 194 200 205 209 212 215 217 219 6869 185 194 200 205 209 213 216 217 220 6970 186 194 201 206 209 213 216 218 220 7071 186 195 201 206 210 213 216 218 220 7172 186 195 201 206 210 214 217 218 221 7273 187 195 201 206 210 214 217 219 221 7374 187 195 202 207 211 214 217 219 221 7475 187 196 202 207 211 215 218 219 221 7576 188 196 202 207 211 215 218 220 222 7677 188 196 203 208 212 215 218 220 222 77
78 188 197 203 208 212 215 219 220 222 7879 189 197 203 208 212 216 219 221 223 7980 189 197 204 209 213 216 219 221 223 8081 189 198 204 209 213 217 220 221 223 8182 190 198 204 209 213 217 220 222 224 8283 190 199 205 210 214 217 220 222 224 8384 191 199 205 210 214 218 221 223 225 8485 191 199 205 210 215 218 221 223 225 8586 191 200 206 211 215 219 222 223 226 8687 192 200 206 211 215 219 222 224 226 8788 192 201 207 212 216 220 223 224 226 8889 193 201 207 212 217 220 223 225 227 8990 193 202 208 213 217 221 224 225 227 9091 194 202 208 213 218 221 224 226 228 9192 194 203 209 214 218 222 225 227 228 9293 195 204 209 215 219 223 226 227 229 9394 196 204 210 215 220 223 227 228 230 9495 196 205 211 216 221 224 227 229 231 9596 197 206 212 217 222 225 228 230 232 9697 198 207 213 219 223 226 230 231 233 9798 200 209 215 220 224 228 231 232 235 9899 202 212 218 223 227 230 233 235 237 99
Northwest Evaluation AssociationBeginning of School Year SCIENCE CONCEPTS AND PROCESSES RIT Score to
Percentile Rank Conversion
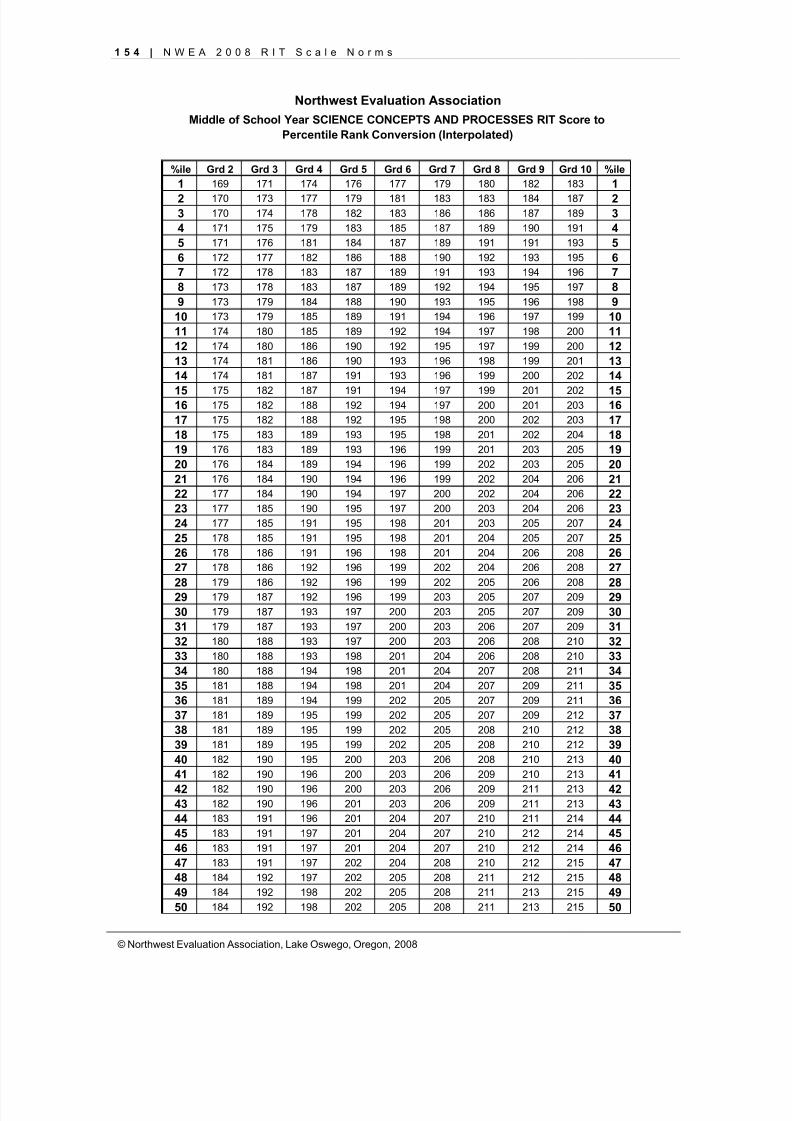
8/7/2019 NWEA Complete Norms2008
http://slidepdf.com/reader/full/nwea-complete-norms2008 164/170
1 5 4 | N W E A 2 0 0 8 R I T S c a l e N o r m s
© Northwest Evaluation Association, Lake Oswego, Oregon, 2008
%ile Grd 2 Grd 3 Grd 4 Grd 5 Grd 6 Grd 7 Grd 8 Grd 9 Grd 10 %ile1 169 171 174 176 177 179 180 182 183 12 170 173 177 179 181 183 183 184 187 23 170 174 178 182 183 186 186 187 189 34 171 175 179 183 185 187 189 190 191 45 171 176 181 184 187 189 191 191 193 56 172 177 182 186 188 190 192 193 195 67 172 178 183 187 189 191 193 194 196 78 173 178 183 187 189 192 194 195 197 89 173 179 184 188 190 193 195 196 198 9
10 173 179 185 189 191 194 196 197 199 1011 174 180 185 189 192 194 197 198 200 1112 174 180 186 190 192 195 197 199 200 1213 174 181 186 190 193 196 198 199 201 1314 174 181 187 191 193 196 199 200 202 14
15 175 182 187 191 194 197 199 201 202 1516 175 182 188 192 194 197 200 201 203 1617 175 182 188 192 195 198 200 202 203 1718 175 183 189 193 195 198 201 202 204 1819 176 183 189 193 196 199 201 203 205 1920 176 184 189 194 196 199 202 203 205 2021 176 184 190 194 196 199 202 204 206 2122 177 184 190 194 197 200 202 204 206 2223 177 185 190 195 197 200 203 204 206 2324 177 185 191 195 198 201 203 205 207 2425 178 185 191 195 198 201 204 205 207 2526 178 186 191 196 198 201 204 206 208 2627 178 186 192 196 199 202 204 206 208 2728 179 186 192 196 199 202 205 206 208 2829 179 187 192 196 199 203 205 207 209 2930 179 187 193 197 200 203 205 207 209 3031 179 187 193 197 200 203 206 207 209 3132 180 188 193 197 200 203 206 208 210 3233 180 188 193 198 201 204 206 208 210 3334 180 188 194 198 201 204 207 208 211 3435 181 188 194 198 201 204 207 209 211 3536 181 189 194 199 202 205 207 209 211 3637 181 189 195 199 202 205 207 209 212 3738 181 189 195 199 202 205 208 210 212 3839 181 189 195 199 202 205 208 210 212 3940 182 190 195 200 203 206 208 210 213 4041 182 190 196 200 203 206 209 210 213 4142 182 190 196 200 203 206 209 211 213 4243 182 190 196 201 203 206 209 211 213 4344 183 191 196 201 204 207 210 211 214 4445 183 191 197 201 204 207 210 212 214 4546 183 191 197 201 204 207 210 212 214 4647 183 191 197 202 204 208 210 212 215 4748 184 192 197 202 205 208 211 212 215 4849 184 192 198 202 205 208 211 213 215 4950 184 192 198 202 205 208 211 213 215 50
Northwest Evaluation AssociationMiddle of School Year SCIENCE CONCEPTS AND PROCESSES RIT Score to
Percentile Rank Conversion (Interpolated)
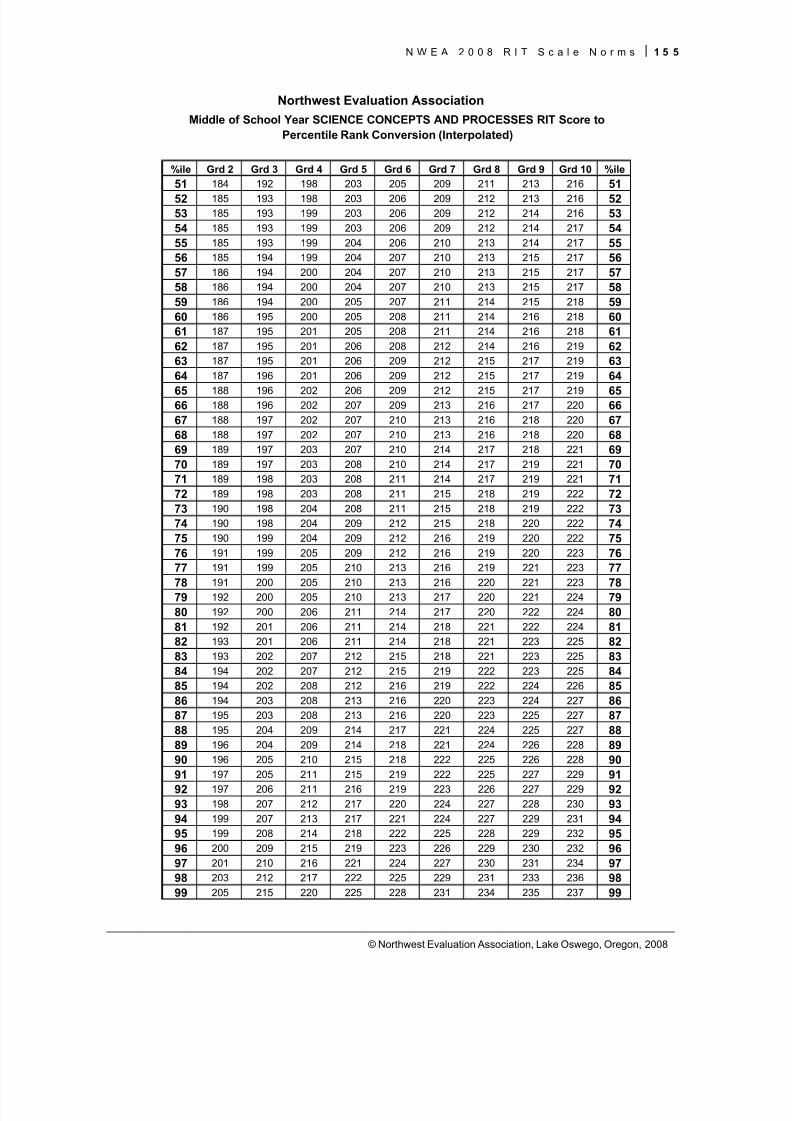
8/7/2019 NWEA Complete Norms2008
http://slidepdf.com/reader/full/nwea-complete-norms2008 165/170
N W E A 2 0 0 8 R I T S c a l e N o r m s 1 5 5
© Northwest Evaluation Association, Lake Oswego, Oregon, 2008
%ile Grd 2 Grd 3 Grd 4 Grd 5 Grd 6 Grd 7 Grd 8 Grd 9 Grd 10 %ile51 184 192 198 203 205 209 211 213 216 5152 185 193 198 203 206 209 212 213 216 5253 185 193 199 203 206 209 212 214 216 5354 185 193 199 203 206 209 212 214 217 5455 185 193 199 204 206 210 213 214 217 5556 185 194 199 204 207 210 213 215 217 5657 186 194 200 204 207 210 213 215 217 5758 186 194 200 204 207 210 213 215 217 5859 186 194 200 205 207 211 214 215 218 5960 186 195 200 205 208 211 214 216 218 6061 187 195 201 205 208 211 214 216 218 6162 187 195 201 206 208 212 214 216 219 6263 187 195 201 206 209 212 215 217 219 6364 187 196 201 206 209 212 215 217 219 64
65 188 196 202 206 209 212 215 217 219 6566 188 196 202 207 209 213 216 217 220 6667 188 197 202 207 210 213 216 218 220 6768 188 197 202 207 210 213 216 218 220 6869 189 197 203 207 210 214 217 218 221 6970 189 197 203 208 210 214 217 219 221 7071 189 198 203 208 211 214 217 219 221 7172 189 198 203 208 211 215 218 219 222 7273 190 198 204 208 211 215 218 219 222 7374 190 198 204 209 212 215 218 220 222 7475 190 199 204 209 212 216 219 220 222 7576 191 199 205 209 212 216 219 220 223 7677 191 199 205 210 213 216 219 221 223 7778 191 200 205 210 213 216 220 221 223 7879 192 200 205 210 213 217 220 221 224 7980 192 200 206 211 214 217 220 222 224 8081 192 201 206 211 214 218 221 222 224 8182 193 201 206 211 214 218 221 223 225 8283 193 202 207 212 215 218 221 223 225 8384 194 202 207 212 215 219 222 223 225 8485 194 202 208 212 216 219 222 224 226 8586 194 203 208 213 216 220 223 224 227 8687 195 203 208 213 216 220 223 225 227 8788 195 204 209 214 217 221 224 225 227 8889 196 204 209 214 218 221 224 226 228 8990 196 205 210 215 218 222 225 226 228 9091 197 205 211 215 219 222 225 227 229 9192 197 206 211 216 219 223 226 227 229 9293 198 207 212 217 220 224 227 228 230 9394 199 207 213 217 221 224 227 229 231 9495 199 208 214 218 222 225 228 229 232 9596 200 209 215 219 223 226 229 230 232 9697 201 210 216 221 224 227 230 231 234 9798 203 212 217 222 225 229 231 233 236 9899 205 215 220 225 228 231 234 235 237 99
Middle of School Year SCIENCE CONCEPTS AND PROCESSES RIT Score toPercentile Rank Conversion (Interpolated)
Northwest Evaluation Association
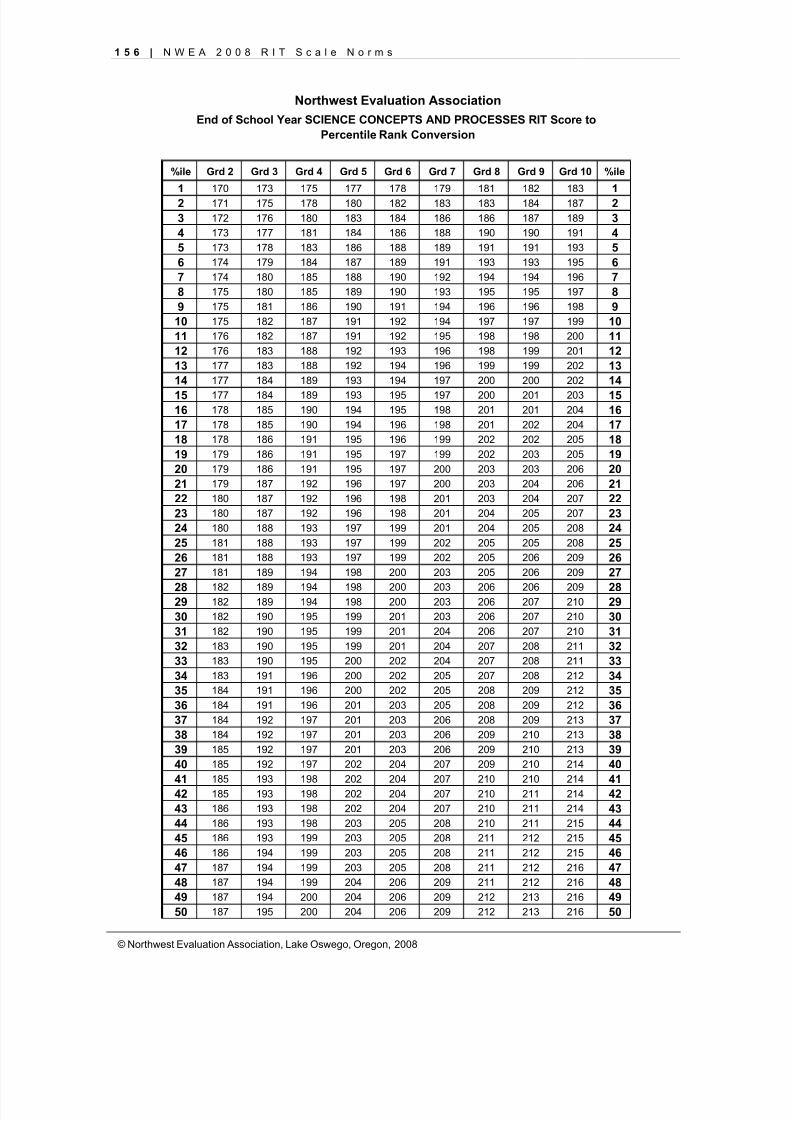
8/7/2019 NWEA Complete Norms2008
http://slidepdf.com/reader/full/nwea-complete-norms2008 166/170
1 5 6 | N W E A 2 0 0 8 R I T S c a l e N o r m s
© Northwest Evaluation Association, Lake Oswego, Oregon, 2008
%ile Grd 2 Grd 3 Grd 4 Grd 5 Grd 6 Grd 7 Grd 8 Grd 9 Grd 10 %ile
1 170 173 175 177 178 179 181 182 183 12 171 175 178 180 182 183 183 184 187 23 172 176 180 183 184 186 186 187 189 34 173 177 181 184 186 188 190 190 191 45 173 178 183 186 188 189 191 191 193 56 174 179 184 187 189 191 193 193 195 67 174 180 185 188 190 192 194 194 196 78 175 180 185 189 190 193 195 195 197 89 175 181 186 190 191 194 196 196 198 9
10 175 182 187 191 192 194 197 197 199 1011 176 182 187 191 192 195 198 198 200 1112 176 183 188 192 193 196 198 199 201 1213 177 183 188 192 194 196 199 199 202 1314 177 184 189 193 194 197 200 200 202 1415 177 184 189 193 195 197 200 201 203 1516 178 185 190 194 195 198 201 201 204 1617 178 185 190 194 196 198 201 202 204 1718 178 186 191 195 196 199 202 202 205 1819 179 186 191 195 197 199 202 203 205 1920 179 186 191 195 197 200 203 203 206 2021 179 187 192 196 197 200 203 204 206 2122 180 187 192 196 198 201 203 204 207 2223 180 187 192 196 198 201 204 205 207 2324 180 188 193 197 199 201 204 205 208 2425 181 188 193 197 199 202 205 205 208 2526 181 188 193 197 199 202 205 206 209 2627 181 189 194 198 200 203 205 206 209 27
28 182 189 194 198 200 203 206 206 209 2829 182 189 194 198 200 203 206 207 210 2930 182 190 195 199 201 203 206 207 210 3031 182 190 195 199 201 204 206 207 210 3132 183 190 195 199 201 204 207 208 211 3233 183 190 195 200 202 204 207 208 211 3334 183 191 196 200 202 205 207 208 212 3435 184 191 196 200 202 205 208 209 212 3536 184 191 196 201 203 205 208 209 212 3637 184 192 197 201 203 206 208 209 213 3738 184 192 197 201 203 206 209 210 213 3839 185 192 197 201 203 206 209 210 213 3940 185 192 197 202 204 207 209 210 214 4041 185 193 198 202 204 207 210 210 214 4142 185 193 198 202 204 207 210 211 214 4243 186 193 198 202 204 207 210 211 214 4344 186 193 198 203 205 208 210 211 215 4445 186 193 199 203 205 208 211 212 215 4546 186 194 199 203 205 208 211 212 215 4647 187 194 199 203 205 208 211 212 216 4748 187 194 199 204 206 209 211 212 216 4849 187 194 200 204 206 209 212 213 216 4950 187 195 200 204 206 209 212 213 216 50
Northwest Evaluation AssociationEnd of School Year SCIENCE CONCEPTS AND PROCESSES RIT Score to
Percentile Rank Conversion
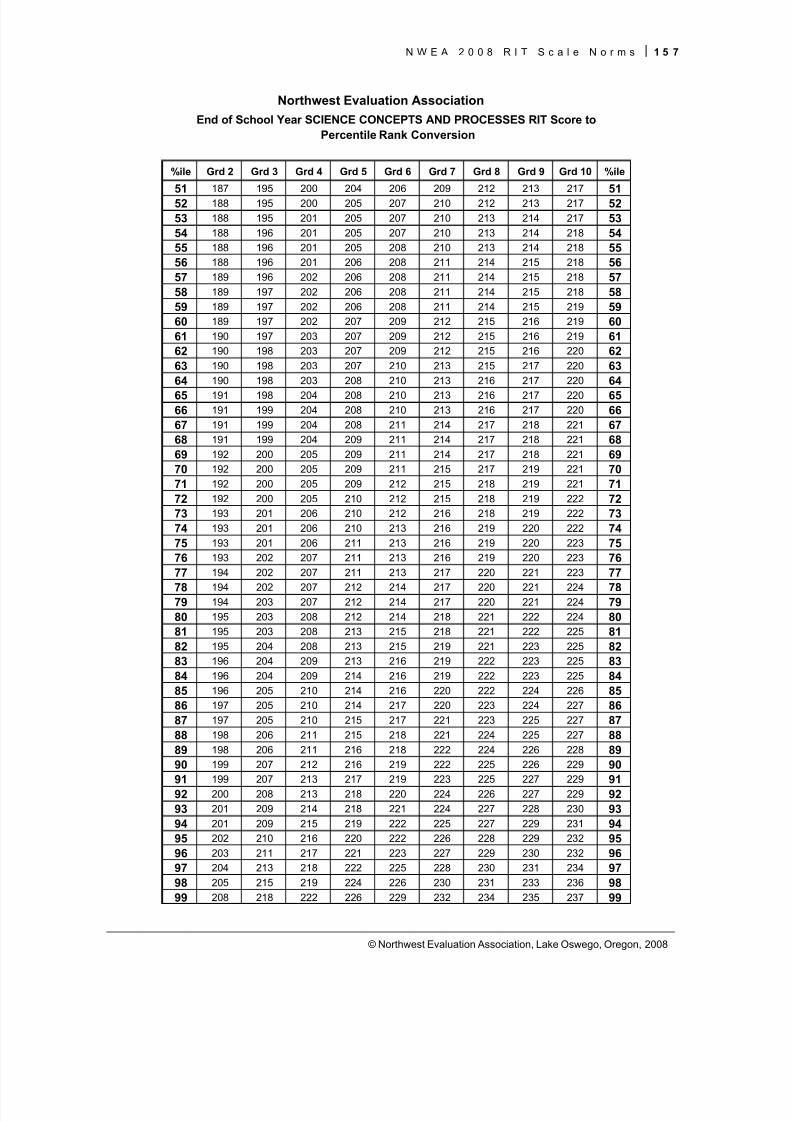
8/7/2019 NWEA Complete Norms2008
http://slidepdf.com/reader/full/nwea-complete-norms2008 167/170
N W E A 2 0 0 8 R I T S c a l e N o r m s 1 5 7
© Northwest Evaluation Association, Lake Oswego, Oregon, 2008
%ile Grd 2 Grd 3 Grd 4 Grd 5 Grd 6 Grd 7 Grd 8 Grd 9 Grd 10 %ile
51 187 195 200 204 206 209 212 213 217 5152 188 195 200 205 207 210 212 213 217 5253 188 195 201 205 207 210 213 214 217 5354 188 196 201 205 207 210 213 214 218 5455 188 196 201 205 208 210 213 214 218 5556 188 196 201 206 208 211 214 215 218 5657 189 196 202 206 208 211 214 215 218 5758 189 197 202 206 208 211 214 215 218 5859 189 197 202 206 208 211 214 215 219 5960 189 197 202 207 209 212 215 216 219 6061 190 197 203 207 209 212 215 216 219 6162 190 198 203 207 209 212 215 216 220 6263 190 198 203 207 210 213 215 217 220 6364 190 198 203 208 210 213 216 217 220 6465 191 198 204 208 210 213 216 217 220 6566 191 199 204 208 210 213 216 217 220 6667 191 199 204 208 211 214 217 218 221 6768 191 199 204 209 211 214 217 218 221 6869 192 200 205 209 211 214 217 218 221 6970 192 200 205 209 211 215 217 219 221 7071 192 200 205 209 212 215 218 219 221 7172 192 200 205 210 212 215 218 219 222 7273 193 201 206 210 212 216 218 219 222 7374 193 201 206 210 213 216 219 220 222 7475 193 201 206 211 213 216 219 220 223 7576 193 202 207 211 213 216 219 220 223 7677 194 202 207 211 213 217 220 221 223 77
78 194 202 207 212 214 217 220 221 224 7879 194 203 207 212 214 217 220 221 224 7980 195 203 208 212 214 218 221 222 224 8081 195 203 208 213 215 218 221 222 225 8182 195 204 208 213 215 219 221 223 225 8283 196 204 209 213 216 219 222 223 225 8384 196 204 209 214 216 219 222 223 225 8485 196 205 210 214 216 220 222 224 226 8586 197 205 210 214 217 220 223 224 227 8687 197 205 210 215 217 221 223 225 227 8788 198 206 211 215 218 221 224 225 227 8889 198 206 211 216 218 222 224 226 228 8990 199 207 212 216 219 222 225 226 229 9091 199 207 213 217 219 223 225 227 229 9192 200 208 213 218 220 224 226 227 229 9293 201 209 214 218 221 224 227 228 230 9394 201 209 215 219 222 225 227 229 231 9495 202 210 216 220 222 226 228 229 232 9596 203 211 217 221 223 227 229 230 232 9697 204 213 218 222 225 228 230 231 234 9798 205 215 219 224 226 230 231 233 236 9899 208 218 222 226 229 232 234 235 237 99
Northwest Evaluation AssociationEnd of School Year SCIENCE CONCEPTS AND PROCESSES RIT Score to
Percentile Rank Conversion
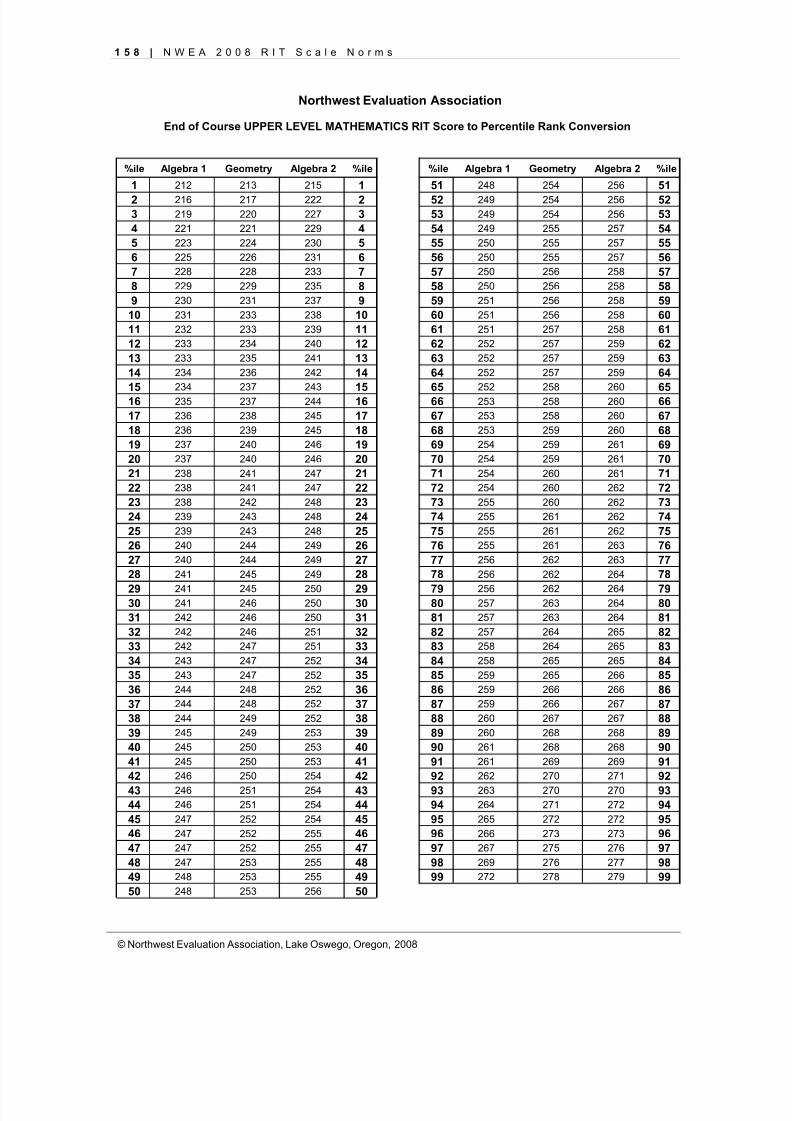
8/7/2019 NWEA Complete Norms2008
http://slidepdf.com/reader/full/nwea-complete-norms2008 168/170
1 5 8 | N W E A 2 0 0 8 R I T S c a l e N o r m s
© Northwest Evaluation Association, Lake Oswego, Oregon, 2008
%ile Algebra 1 Geometry Algebra 2 %ile %ile Algebra 1 Geometry Algebra 2 %ile
1 212 213 215 1 51 248 254 256 512 216 217 222 2 52 249 254 256 523 219 220 227 3 53 249 254 256 534 221 221 229 4 54 249 255 257 545 223 224 230 5 55 250 255 257 556 225 226 231 6 56 250 255 257 567 228 228 233 7 57 250 256 258 578 229 229 235 8 58 250 256 258 589 230 231 237 9 59 251 256 258 59
10 231 233 238 10 60 251 256 258 6011 232 233 239 11 61 251 257 258 6112 233 234 240 12 62 252 257 259 6213 233 235 241 13 63 252 257 259 6314 234 236 242 14 64 252 257 259 64
15234 237 243
15 65252 258 260
6516 235 237 244 16 66 253 258 260 6617 236 238 245 17 67 253 258 260 6718 236 239 245 18 68 253 259 260 6819 237 240 246 19 69 254 259 261 6920 237 240 246 20 70 254 259 261 7021 238 241 247 21 71 254 260 261 7122 238 241 247 22 72 254 260 262 7223 238 242 248 23 73 255 260 262 7324 239 243 248 24 74 255 261 262 7425 239 243 248 25 75 255 261 262 7526 240 244 249 26 76 255 261 263 7627 240 244 249 27 77 256 262 263 7728 241 245 249 28 78 256 262 264 78
29 241 245 250 29 79 256 262 264 7930 241 246 250 30 80 257 263 264 8031 242 246 250 31 81 257 263 264 8132 242 246 251 32 82 257 264 265 8233 242 247 251 33 83 258 264 265 8334 243 247 252 34 84 258 265 265 8435 243 247 252 35 85 259 265 266 8536 244 248 252 36 86 259 266 266 8637 244 248 252 37 87 259 266 267 8738 244 249 252 38 88 260 267 267 8839 245 249 253 39 89 260 268 268 8940 245 250 253 40 90 261 268 268 9041 245 250 253 41 91 261 269 269 9142 246 250 254 42 92 262 270 271 9243 246 251 254 43 93 263 270 270 9344 246 251 254 44 94 264 271 272 9445 247 252 254 45 95 265 272 272 9546 247 252 255 46 96 266 273 273 9647 247 252 255 47 97 267 275 276 9748 247 253 255 48 98 269 276 277 9849 248 253 255 49 99 272 278 279 9950 248 253 256 50
Northwest Evaluation Association
End of Course UPPER LEVEL MATHEMATICS RIT Score to Percentile Rank Conversion
8/7/2019 NWEA Complete Norms2008
http://slidepdf.com/reader/full/nwea-complete-norms2008 169/170
N W E A 2 0 0 8 R I T S c a l e N o r m s 1 5 9
© Northwest Evaluation Association, Lake Oswego, Oregon, 2008
APPENDIX B
Transition from 2005 to 2008 Norms
Norms created at different points in time for any behavior or type of performance are likely to vary.
This will be the case even if all procedures are identical across studies. Much of the variation from
one study to another is simply due to the fact that each study is dependent on the sample of people
it used to develop its norms. The potential sources of sample differences are not hard to identify.
They include factors such as changes in demographic makeup of school districts as well as
changes in teaching methods, testing programs or school effectiveness.
Differences between the 2008 RIT scale norming study results and those of the 2005 study can, of
course, be attributed to the same types of sample differences that we observed for other norming
studies. There is, however, an important difference between this study and the 2005 study that
was not present when moving from the 2002 study to the 2005 study. This difference was the
stratified random sampling that was used for reading, language usage, and mathematics in grades
2 through 11. In the 2005 study, all test events that were valid and met the inclusion criteria
(virtually identical to those detailed in Chapter 2) were included. In the current study, the test
events that met the inclusion criteria were further sampled to match the U.S. school-age population
with respect to ethnicity and school level percentage of students eligible for free and reduced pricelunch. In addition, the current study restricted the inclusion of test events to those that occurred in
the defined time frames for beginning, middle, and end of the year relative to the district calendar
that was in the student’s district. These are fairly dramatic changes in the way the sample for
status norms was determined compared to the procedures used for the 2005 study. In the face of
these differences in procedures, we saw little reason to speculate as to the other sources of
differences in the results. We expected to see differences between the 2008 norms and the 2005
norms that corresponded to these changes.
The differences observed were quite modest. For beginning of year (fall) reading tests across
grades 2-10, the 2008 norms were an average of .9 RITs higher (range .1 – 2.4 RITs) than the fall
2005 norms. For end of year (spring) reading tests, the 2008 norms were an average of .5 RITs
higher (range -.5 – 1.4 RITs). In language usage, the beginning-of-year and end-of-year
differences were of the same general size ( ≈ -.5 RITs) but the 2008 norms were slightly lower than
the 2005 norms. Difference in mathematics status norms followed the pattern for reading but the
average differences did not exceed .3 RITs. The grade level 2008 norms for reading and language
8/7/2019 NWEA Complete Norms2008
http://slidepdf.com/reader/full/nwea-complete-norms2008 170/170
1 6 0 | N W E A 2 0 0 8 R I T S c a l e N o r m s
usage were accompanied by 5% and 3% less variance, respectively, than the corresponding 2005
norms. Variance for mathematics between the two studies remained virtually the same across
grades.
From the standpoint of grade level distributions, the vast majority of differences between RITs at
corresponding percentile ranks (2008 minus 2005) fell between -2 RITs and +2 RITs. Larger differences were noted mostly in the lower quartile of reading and language usage for grades 2
through 4. This was also the case for mathematics but was less pronounced. In all of these
differences within the lower quartile, 2008 RITs were higher for the corresponding percentile rank.
In grades 9 and 10, the 2008 RITs were associated with somewhat lower percentiles than the 2005
RITs. These were typically below the median and ranged from 1 to 2 RITs in reading, from 3 to 5
RITs in language, and from 3 to 4 RITs in mathematics. These differences are provided in a
Microsoft Excel © file (INTERACT Percentiles 2008.xlsx & .xls) that is available from NWEA.
Average beginning-of-year to end-of-year (fall-to-spring), beginning-of-year to beginning-of-the-
next-year (fall-to-fall), and end-of-year to end-of-the-next-year (spring-to-spring) growth differences
were all less than .65 RITs across grades and were most frequently below .25 RITs. Within
individual grade-content area combinations, the largest difference observed was 1.44 RITs for end-
of-grade 8 to end-of-grade 9 mathematics; growth was higher in the 2005 study.