Embed Size (px)
Citation preview

www.SandV.com12 SOUND & VIBRATION/SEPTEMBER 2012
This article discusses how a systematic vehicle test process was used to compare sound data in a simple spreadsheet analytical model to predict the performance of sound packages for a multi-purpose vehicle (MPV). The model was real-time interactive and provided intuitive insight as to how various sound treatments affected the ensemble sound pressure levels at occupant ear loca-tions in the vehicle.
Noise, vibration and harshness (NVH) engineers are often con-fronted with the daunting task of developing an acoustical package for the vehicle that achieves target sound pressure levels (SPL) at key occupant locations for various vehicle operational modes. Many times the need for components in the acoustical attenuation package is challenged, and the sound package engineer is forced to compromise because he is unable to demonstrate the need for the parts or specific part designs.
During the development process, the vehicle sound package engineer often uses an iterative trial-and-error process to determine the merits of each prospective trim/insulation option. In some cases, there may be a prototype vehicle available. If not, a current production vehicle may be selected to emulate the vehicle for which there is no hardware yet available. This is only possible if the powertrain, driveline and body architecture closely matches the vehicle for which the trim/insulation is being developed.
In many cases, there may only be slight differences in the per-formances of each piece of trim and insulation. The reason for this is that the tested part is only a small part of the whole acoustical attenuation package. Much of the acoustical energy from sources outside the cab arrives at the occupant ear through paths that flank the cab interior surface area (CISA) where the trim/insulation is located. This can lead to disappointing and confusing results. However, more definitive data can be obtained by following a systematic experimental process. But this takes hard work, time and persistence.
Systematic Diagnostic TestThe noise sources of the motor vehicle lie outside the cab or
body shell and include powertrain, road/tires and wind noise. These sound sources pass acoustical energy through the body shell, which combine to produce the ensemble level (L), as shown in Figure 2. Mathematically, the ensemble level can be calculated using Equation 1, where pi is the root mean square (RMS) SPL contribution from the ith CISA to the ensemble level, and p0 is the threshold of hearing, or 20 µPa.
Equation 1 can only be used if the contribution for each CISA is known. This can be determined for bare steel by following a systematic test procedure. Wuxi Jixing applied this test process recently while developing an acoustical attenuation package for an MPV. First the interior trim and acoustical insulation in the vehicle was removed so that all that remained was bare sheet metal. Next, a high-performance experimental insulation package was installed. This included as much of the cab interior surfaces as possible (see Figures 3-6).
Tests were conducted with the vehicle on a four-wheel-drive, chassis-roll dynamometer inside a hemi-anechoic vehicle test chamber, see Figure 7. This procedure assured high precision, repeatable test conditions. The dynamometer load was adjusted to match that required for cruising so that the powertrain was work-
ing as though the vehicle was running on a smooth level highway.The microphones were located at occupant ear locations of inter-
est (see Figure 8). Tests were conducted at 50, 80 and 100 kph on smooth dynamometer rolls. These steady-speed tests enabled data to be averaged over 30 seconds, and three trials were conducted at each speed to enhance accuracy. Engine tachometer and vehicle speed were simultaneously recorded along with the SPL data.
First the vehicle was tested with the entire experimental pack-age installed (MaxPack condition). The SPL during this condi-tion measured the background contribution levels (Lb) that were omnipresent sounds the MaxPack was unable to suppress. These background contributions were constant throughout all of the tests. Several times throughout the tests, the MaxPack test condition was repeated to check test consistency (see Figure 9).
Next, a part of the experimental insulation package was removed, like the lower front doors. The SPL produced (Li) for this test con-dition was usually significantly greater than that produced during the MaxPack condition. This made Li and Lb easy to measure and the contribution levels (DLi) easy to calculate:
All of the CISA contribution levels were determined using this process systematically in an iterative fashion to remove individual portions of the experimental package.
Spreadsheet Analytical ModelThe CISA contribution levels were then transferred to a spread-
sheet analytical model. The model also incorporated a data bank of 140 trim/insulators. This data bank included sound insertion loss and sound absorption data for a wide variety of carpet, dash, headliner and trim configurations.
Algorithms of the model were developed that utilized these CISA
NVH Modeling Technique forAutomotive Sound PackagesRichard E. Wentzel and Wei Huang, Wuxi Jixing Acoustic Auto Parts Technologies Co., Ltd., Wuxi, Jiangsu, Peoples Republic of China
Figure 1. Wuxi Jixing NVH lab facilities in China.
Figure 2. Sound sources in a body shell used to produce an ensemble average.
(1)Lp
pi
i
n= Â
Ê
ËÁ
ˆ
¯˜
=10
2
02
1log
(2)DL L Li i b= -

www.SandV.com SOUND & VIBRATION/SEPTEMBER 2012 13
contribution levels to predict ensemble levels at key microphone locations. The algorithms were designed to automate the calcula-tion process and expedite delivery of the results. This made the model nearly real time in nature.
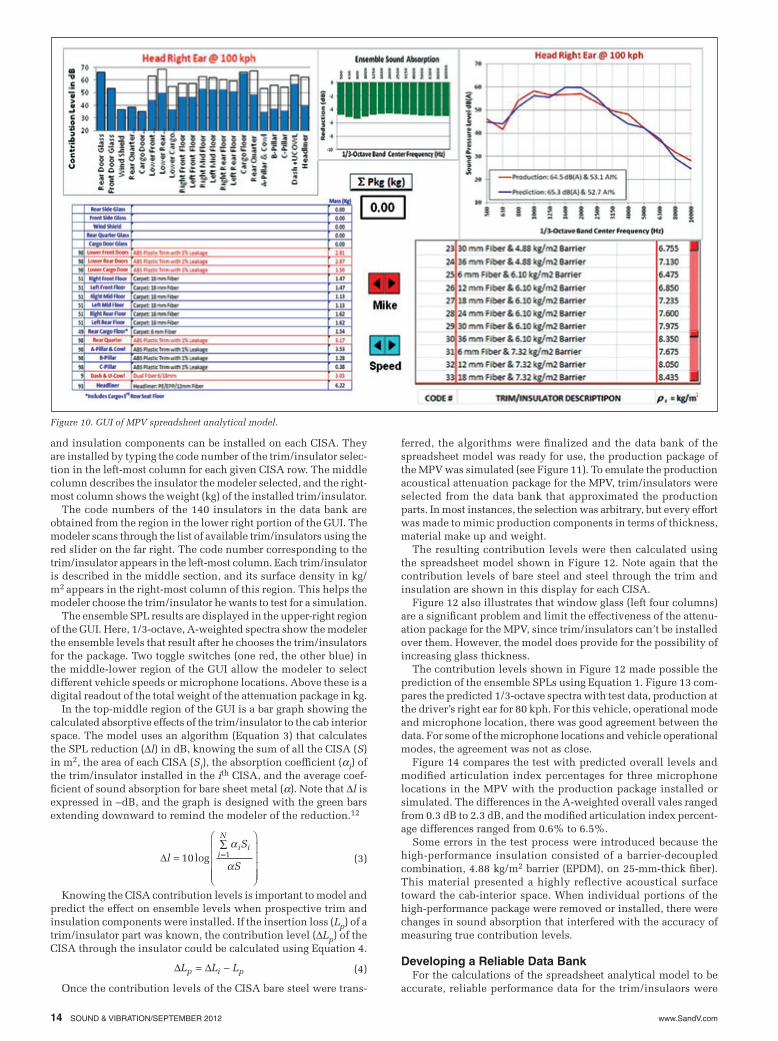
A graphical user interface (GUI) was developed to facilitate the user’s intuitive understanding of how trim and insulation installed on each CISA affected the contribution levels and overall ensemble levels. Figure 10 shows the GUI of the spreadsheet model as seen by the modeler. The upper left bar graph gives the modeler infor-mation about the contribution levels of each CISA. The empty bars show the contributions for bare steel, and the shorter colored regions within those bars show the contribution levels through the
installed trim/insulation. In the lower left region of the GUI is a region where various trim
Figure 3. Dash, instrument panel and front floor.
Figure 4. Lower front door and glass.
Figure 5. Rear quarter.
Figure 6. View through rear hatch.
Figure 7. Wuxi Jixing 4-wheel-drive-chassis dynomometer.
Figure 8. Microphone locations for MPV study.
Figure 9. Repeatability of MaxPack test; driver right ear at 100 kph on smooth dynamometer rolls.
www.SandV.com14 SOUND & VIBRATION/SEPTEMBER 2012
and insulation components can be installed on each CISA. They are installed by typing the code number of the trim/insulator selec-tion in the left-most column for each given CISA row. The middle column describes the insulator the modeler selected, and the right-most column shows the weight (kg) of the installed trim/insulator.
The code numbers of the 140 insulators in the data bank are obtained from the region in the lower right portion of the GUI. The modeler scans through the list of available trim/insulators using the red slider on the far right. The code number corresponding to the trim/insulator appears in the left-most column. Each trim/insulator is described in the middle section, and its surface density in kg/m2 appears in the right-most column of this region. This helps the modeler choose the trim/insulator he wants to test for a simulation.
The ensemble SPL results are displayed in the upper-right region of the GUI. Here, 1/3-octave, A-weighted spectra show the modeler the ensemble levels that result after he chooses the trim/insulators for the package. Two toggle switches (one red, the other blue) in the middle-lower region of the GUI allow the modeler to select different vehicle speeds or microphone locations. Above these is a digital readout of the total weight of the attenuation package in kg.
In the top-middle region of the GUI is a bar graph showing the calculated absorptive effects of the trim/insulator to the cab interior space. The model uses an algorithm (Equation 3) that calculates the SPL reduction (Dl) in dB, knowing the sum of all the CISA (S) in m2, the area of each CISA (Si), the absorption coefficient (ai) of the trim/insulator installed in the ith CISA, and the average coef-ficient of sound absorption for bare sheet metal (a). Note that Dl is expressed in –dB, and the graph is designed with the green bars extending downward to remind the modeler of the reduction.12
Knowing the CISA contribution levels is important to model and predict the effect on ensemble levels when prospective trim and insulation components were installed. If the insertion loss (Lp) of a trim/insulator part was known, the contribution level (DLp) of the CISA through the insulator could be calculated using Equation 4.
Once the contribution levels of the CISA bare steel were trans-
Figure 10. GUI of MPV spreadsheet analytical model.
ferred, the algorithms were finalized and the data bank of the spreadsheet model was ready for use, the production package of the MPV was simulated (see Figure 11). To emulate the production acoustical attenuation package for the MPV, trim/insulators were selected from the data bank that approximated the production parts. In most instances, the selection was arbitrary, but every effort was made to mimic production components in terms of thickness, material make up and weight.
The resulting contribution levels were then calculated using the spreadsheet model shown in Figure 12. Note again that the contribution levels of bare steel and steel through the trim and insulation are shown in this display for each CISA.
Figure 12 also illustrates that window glass (left four columns) are a significant problem and limit the effectiveness of the attenu-ation package for the MPV, since trim/insulators can’t be installed over them. However, the model does provide for the possibility of increasing glass thickness.
The contribution levels shown in Figure 12 made possible the prediction of the ensemble SPLs using Equation 1. Figure 13 com-pares the predicted 1/3-octave spectra with test data, production at the driver’s right ear for 80 kph. For this vehicle, operational mode and microphone location, there was good agreement between the data. For some of the microphone locations and vehicle operational modes, the agreement was not as close.
Figure 14 compares the test with predicted overall levels and modified articulation index percentages for three microphone locations in the MPV with the production package installed or simulated. The differences in the A-weighted overall vales ranged from 0.3 dB to 2.3 dB, and the modified articulation index percent-age differences ranged from 0.6% to 6.5%.
Some errors in the test process were introduced because the high-performance insulation consisted of a barrier-decoupled combination, 4.88 kg/m2 barrier (EPDM), on 25-mm-thick fiber). This material presented a highly reflective acoustical surface toward the cab-interior space. When individual portions of the high-performance package were removed or installed, there were changes in sound absorption that interfered with the accuracy of measuring true contribution levels.
Developing a Reliable Data BankFor the calculations of the spreadsheet analytical model to be
accurate, reliable performance data for the trim/insulaors were
(3)DlS
S
ii
N
i=
ÂÊ
Ë
ÁÁÁÁ
ˆ
¯
˜˜˜˜
=10 1loga
a
(4)D DL L Lp i p= -

www.SandV.com SOUND & VIBRATION/SEPTEMBER 2012 15
Figure 11. MPV production trim/insulation simulation.
Figure 12. MPV CISA contribution levels with production package; driver right ear at 80 kph.
Figure 13. A-weighted 1/3-octave spectra levels, model vs. test; driver right ear at 80 kph.
needed. This was accomplished using laboratory test data and also with commercially available analytical modeling tools (see Figures 15-17). The insertion loss (IL) of each trim/insulator was measured, when possible, by performing a SAE J-1400 sound transmission loss (STL) test. The Wuxi Jixing STL test facility couples a reverberant chamber with a hemi-anechoic test chamber by means of a (1m ¥ 1m) STL test window shown in Figure 15. In some cases, these data were obtained using material modeling software, Figure 16.
Random incidence sound absorption coefficients (a) were also measured using a small reverberant chamber (Figure 17), where 1.2-m2 flat material test samples were tested. This facility produced random-incidence sound absorption coefficients in 1/3-octave bands from 400 Hz to 8 kHz. Flat sample materials consisting of fiber and fiber-barrier constructions used to make carpets, headlin-ers and other soft trim absorbers were tested.
Investigating Packages with the Spreadsheet ModelThe analytical spreadsheet model was used to investigate the
merits of 43 prospective acoustical attenuation packages for the
Figure 14. Comparison of test with model predictions.
Figure 15. Wuxi Jixing’s sound transmission facility.
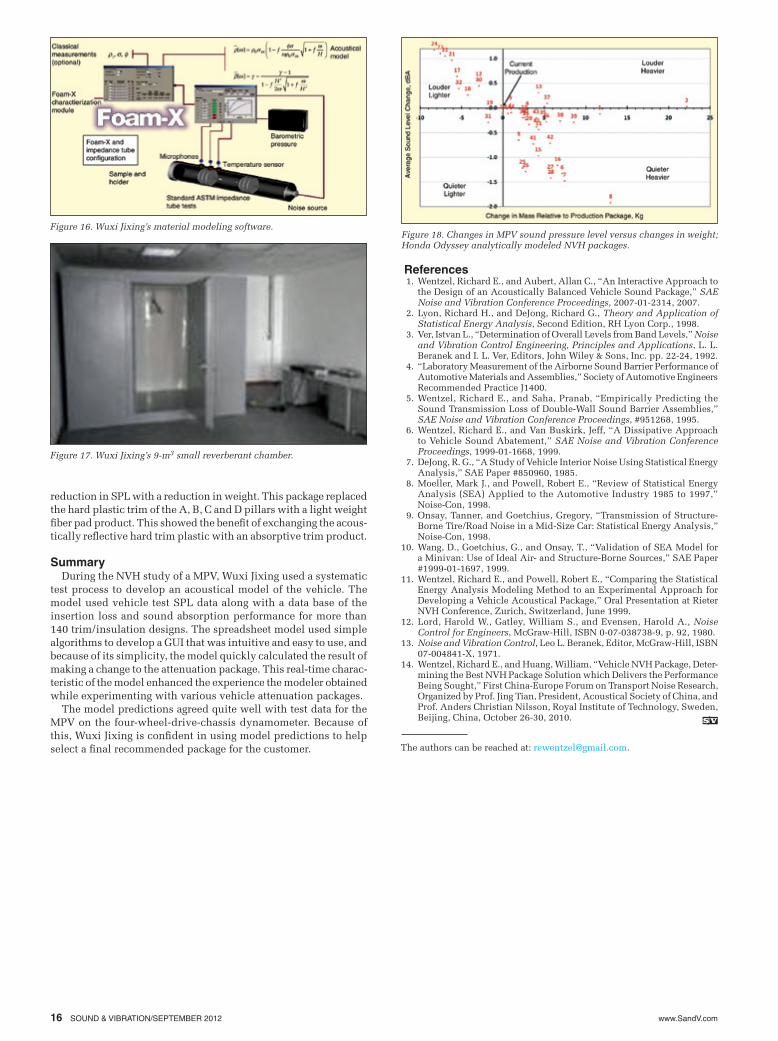
MPV. Figure 18 shows an x-y scatter plot of the overall performance of each acoustical attenuation package. Each data point of the scat-ter plot was located relative to the production attenuation package for the MPV, which was positioned at the origin of the Cartesian graph. The ordinate of the plot shows the changes in A-weighted SPL for the driver’s right ear. All three speeds, 50, 80 100 kph were averaged, as were all of the microphone levels to produce a single overall data point for a given simulation.
Positive changes (above the x axis) indicated levels that were louder than production, and negative changes (below the x axis) indicated SPL reductions relative to production. The abscissa represented changes in weight with positive changes (to the right of the y-axis) indicated weight gains, and negative changes (to the left of the y-axis) indicated reductions in weight compared with the production attenuation package for the MPV.
The first two packages that were modeled (Trial Packages 1 and 2) were near the abscissa but were located to the far right of the chart. These two packages studied the performance of adding a mass-backing to the carpet. The spreadsheet model predicted that the mass-backed carpet added significant mass without an appreciable improvement in performance. This result revealed that mass-backed carpet was not a promising alternative for the MPV.
Trial Packages 6 and 7 increased the loft of the carpet substrate fiber from a nominal thickness of 18 mm to 20 mm and 25 mm. The model predicted that these changes to the carpet would reduce the SPL by as much as 1.5 dB but would also add up to 7 kg.
Trial Package 8 investigated the possibility of using an improved headliner sound absorption and a barrier-decoupled dash insulator. The decrease in SPL approached 2.0 dB, but added almost 12 kg.
Trial Packages 21-24 investigated the merits of removing the floor damping on the MPV. This was simulated incrementally by starting with the front floor pans then removing the mid floor pans, the rear floor and finally the cargo floor pans. The spreadsheet model predicted this would result in weight savings of between 5 to 10 kg but would run the risk of increasing the SPL by over 1 dB.
Trial Package 31 was interesting, because it showed a modest
www.SandV.com16 SOUND & VIBRATION/SEPTEMBER 2012
References 1. Wentzel, Richard E., and Aubert, Allan C., “An Interactive Approach to
the Design of an Acoustically Balanced Vehicle Sound Package,” SAE Noise and Vibration Conference Proceedings, 2007-01-2314, 2007.
2. Lyon, Richard H., and DeJong, Richard G., Theory and Application of Statistical Energy Analysis, Second Edition, RH Lyon Corp., 1998.
3. Ver, Istvan L., “Determination of Overall Levels from Band Levels,” Noise and Vibration Control Engineering, Principles and Applications, L. L. Beranek and I. L. Ver, Editors, John Wiley & Sons, Inc. pp. 22-24, 1992.
4. “Laboratory Measurement of the Airborne Sound Barrier Performance of Automotive Materials and Assemblies,” Society of Automotive Engineers Recommended Practice J1400.
5. Wentzel, Richard E., and Saha, Pranab, “Empirically Predicting the Sound Transmission Loss of Double-Wall Sound Barrier Assemblies,” SAE Noise and Vibration Conference Proceedings, #951268, 1995.
6. Wentzel, Richard E., and Van Buskirk, Jeff, “A Dissipative Approach to Vehicle Sound Abatement,” SAE Noise and Vibration Conference Proceedings, 1999-01-1668, 1999.
7. DeJong, R. G., “A Study of Vehicle Interior Noise Using Statistical Energy Analysis,” SAE Paper #850960, 1985.
8. Moeller, Mark J., and Powell, Robert E., “Review of Statistical Energy Analysis (SEA) Applied to the Automotive Industry 1985 to 1997,” Noise-Con, 1998.
9. Onsay, Tanner, and Goetchius, Gregory, “Transmission of Structure-Borne Tire/Road Noise in a Mid-Size Car: Statistical Energy Analysis,” Noise-Con, 1998.
10. Wang, D., Goetchius, G., and Onsay, T., “Validation of SEA Model for a Minivan: Use of Ideal Air- and Structure-Borne Sources,” SAE Paper #1999-01-1697, 1999.
11. Wentzel, Richard E., and Powell, Robert E., “Comparing the Statistical Energy Analysis Modeling Method to an Experimental Approach for Developing a Vehicle Acoustical Package,” Oral Presentation at Rieter NVH Conference, Zurich, Switzerland, June 1999.
12. Lord, Harold W., Gatley, William S., and Evensen, Harold A., Noise Control for Engineers, McGraw-Hill, ISBN 0-07-038738-9, p. 92, 1980.
13. Noise and Vibration Control, Leo L. Beranek, Editor, McGraw-Hill, ISBN 07-004841-X, 1971.
14. Wentzel, Richard E., and Huang, William, “Vehicle NVH Package, Deter-mining the Best NVH Package Solution which Delivers the Performance Being Sought,” First China-Europe Forum on Transport Noise Research, Organized by Prof. Jing Tian, President, Acoustical Society of China, and Prof. Anders Christian Nilsson, Royal Institute of Technology, Sweden, Beijing, China, October 26-30, 2010.
Figure 17. Wuxi Jixing’s 9-m3 small reverberant chamber.
Figure 18. Changes in MPV sound pressure level versus changes in weight; Honda Odyssey analytically modeled NVH packages.
The authors can be reached at: [email protected].
Figure 16. Wuxi Jixing’s material modeling software.
reduction in SPL with a reduction in weight. This package replaced the hard plastic trim of the A, B, C and D pillars with a light weight fiber pad product. This showed the benefit of exchanging the acous-tically reflective hard trim plastic with an absorptive trim product.
SummaryDuring the NVH study of a MPV, Wuxi Jixing used a systematic
test process to develop an acoustical model of the vehicle. The model used vehicle test SPL data along with a data base of the insertion loss and sound absorption performance for more than 140 trim/insulation designs. The spreadsheet model used simple algorithms to develop a GUI that was intuitive and easy to use, and because of its simplicity, the model quickly calculated the result of making a change to the attenuation package. This real-time charac-teristic of the model enhanced the experience the modeler obtained while experimenting with various vehicle attenuation packages.
The model predictions agreed quite well with test data for the MPV on the four-wheel-drive-chassis dynamometer. Because of this, Wuxi Jixing is confident in using model predictions to help select a final recommended package for the customer.