Embed Size (px)
Citation preview
EDITOR: JAMES B. STACK 2472 Birch Glen ♦ Whitefish, MT 59937 ♦ 1-406-862-7777
COPYRIGHT 2018 INVESTECHwww.investech.com
Technical and Monetary Investment Analysis
205021002150220022502300235024002450250025502600265027002750280028502900
FEBJANDECNOVOCTSEPAUGJULJUNMAYAPRMARFEBJANDECNOVOCTSEP
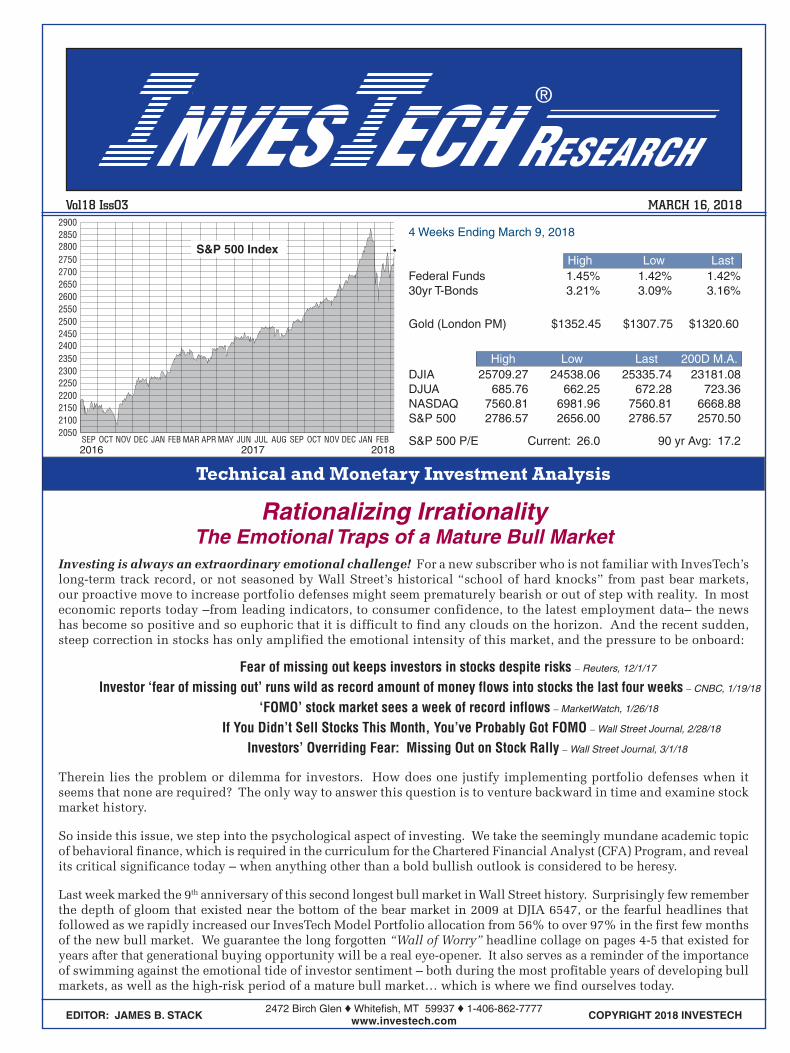
S&P 500 Index
2016 2017 2018
®
RESEARCHECHNVESMARCH 16, 2018Vol18 Iss03
Rationalizing IrrationalityThe Emotional Traps of a Mature Bull Market
Fear of missing out keeps investors in stocks despite risks – Reuters, 12/1/17
‘FOMO’ stock market sees a week of record inflows – MarketWatch, 1/26/18
If You Didn’t Sell Stocks This Month, You’ve Probably Got FOMO – Wall Street Journal, 2/28/18
Investors’ Overriding Fear: Missing Out on Stock Rally – Wall Street Journal, 3/1/18
Investor ‘fear of missing out’ runs wild as record amount of money flows into stocks the last four weeks – CNBC, 1/19/18
4 Weeks Ending March 9, 2018
Federal Funds 1.45% 1.42% 1.42%30yr T-Bonds 3.21% 3.09% 3.16%
Gold (London PM) $1352.45 $1307.75 $1320.60
DJIA 25709.27 24538.06 25335.74 23181.08DJUA 685.76 662.25 672.28 723.36NASDAQ 7560.81 6981.96 7560.81 6668.88S&P 500 2786.57 2656.00 2786.57 2570.50
S&P 500 P/E Current: 26.0 90 yr Avg: 17.2
High Low Last
High Low Last 200D M.A.
Therein lies the problem or dilemma for investors. How does one justify implementing portfolio defenses when it seems that none are required? The only way to answer this question is to venture backward in time and examine stock market history.
So inside this issue, we step into the psychological aspect of investing. We take the seemingly mundane academic topic of behavioral finance, which is required in the curriculum for the Chartered Financial Analyst (CFA) Program, and reveal its critical significance today – when anything other than a bold bullish outlook is considered to be heresy.
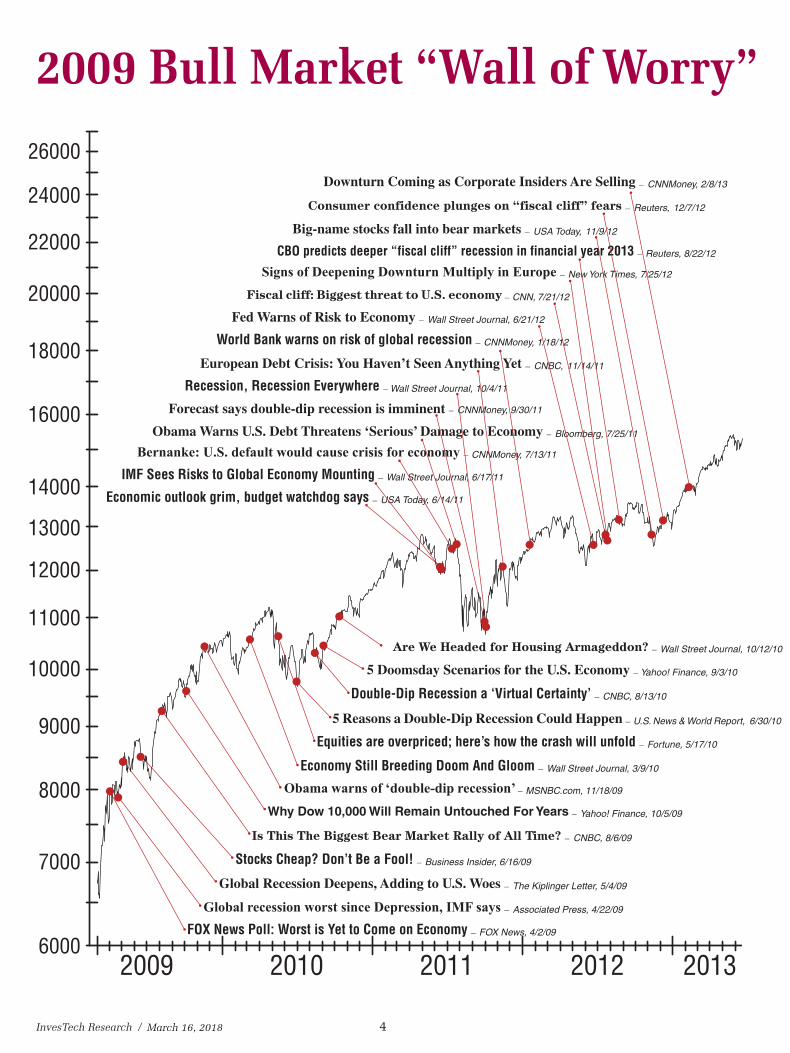
Last week marked the 9th anniversary of this second longest bull market in Wall Street history. Surprisingly few remember the depth of gloom that existed near the bottom of the bear market in 2009 at DJIA 6547, or the fearful headlines that followed as we rapidly increased our InvesTech Model Portfolio allocation from 56% to over 97% in the first few months of the new bull market. We guarantee the long forgotten “Wall of Worry” headline collage on pages 4-5 that existed for years after that generational buying opportunity will be a real eye-opener. It also serves as a reminder of the importance of swimming against the emotional tide of investor sentiment – both during the most profitable years of developing bull markets, as well as the high-risk period of a mature bull market… which is where we find ourselves today.
Investing is always an extraordinary emotional challenge! For a new subscriber who is not familiar with InvesTech’s long-term track record, or not seasoned by Wall Street’s historical “school of hard knocks” from past bear markets, our proactive move to increase portfolio defenses might seem prematurely bearish or out of step with reality. In most economic reports today –from leading indicators, to consumer confidence, to the latest employment data– the news has become so positive and so euphoric that it is difficult to find any clouds on the horizon. And the recent sudden, steep correction in stocks has only amplified the emotional intensity of this market, and the pressure to be onboard:
InvesTech Research / 2
Economists predict continuing economic gloom for U.S. during next 4 years
Chicago Tribune – 1/20/09
Economists React: Worst Conditions for Construction Since 1930s
Wall Street Journal – 1/22/09
Economy’s new plunge is worst in quarter-centuryAssociated Press – 1/30/09
Auto Sales are worst in 26 yearsCNNMoney – 2/3/09
Jan - Feb 2009: The Widespread Gloom of the 2009 Market Bottom
From Oh-No! to FOMO*Behavioral Finance and the Market Cycle
(*Fear of Missing Out)Behavioral finance attempts to understand and explain stock market movements by incorporating investor psychology. This differs from traditional finance, which is grounded in economic theory and assumptions. At its core, traditional finance is based on three key premises:
Investors are risk-averse. This means that when faced with two investments with a similar expected return, investors will consistently prefer the one with lower risk.
Investors are rational. This means that individuals will always try to obtain the highest possible personal economic well-being without regard for anything else.
Markets are fully efficient. This assumes that stock prices continuously incorporate all available and relevant information.
The reality is that as human beings, investors are genetically predisposed to behave irrationally. Rather than make assumptions, behavioral finance focuses on market observations (e.g., bubbles and crashes) and draws conclusions from the data. To better clarify behavioral biases and how they play into the picture, we have broken down the market cycle into four distinct phases: Early-Stage Bull Market, Late-Stage Bull Market, Early-Stage Bear Market, and Late-Stage Bear Market.
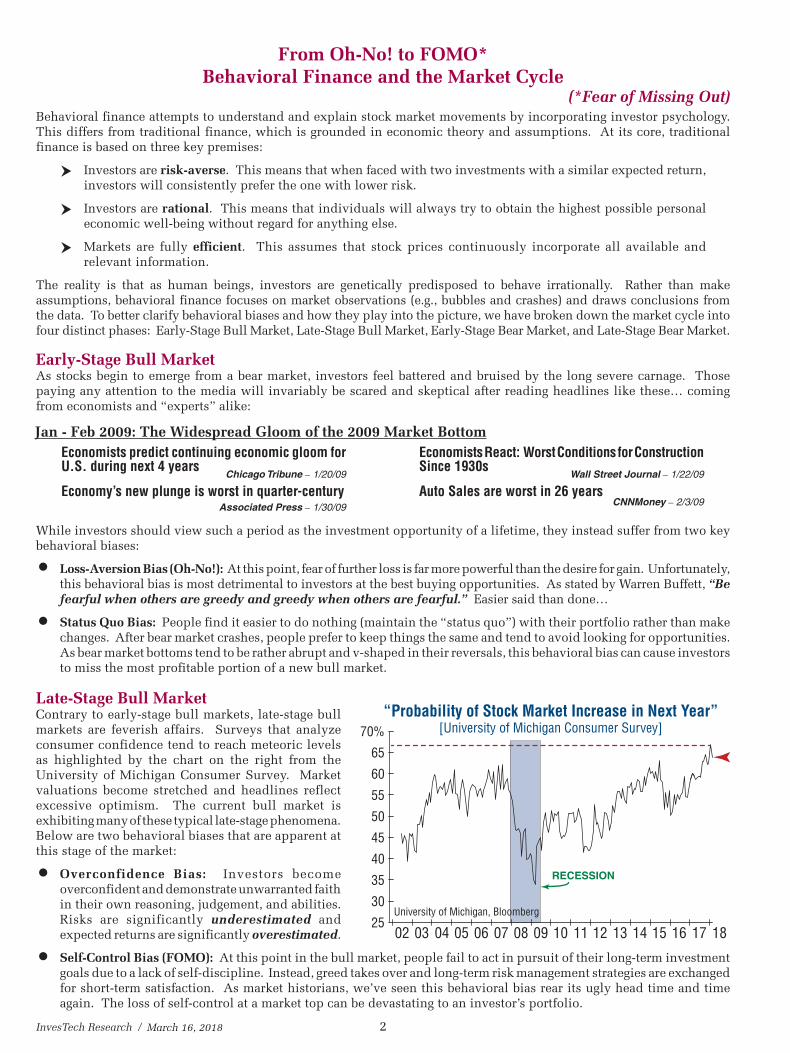
• Self-Control Bias (FOMO): At this point in the bull market, people fail to act in pursuit of their long-term investment goals due to a lack of self-discipline. Instead, greed takes over and long-term risk management strategies are exchanged for short-term satisfaction. As market historians, we’ve seen this behavioral bias rear its ugly head time and time again. The loss of self-control at a market top can be devastating to an investor’s portfolio.
Late-Stage Bull MarketContrary to early-stage bull markets, late-stage bull markets are feverish affairs. Surveys that analyze consumer confidence tend to reach meteoric levels as highlighted by the chart on the right from the University of Michigan Consumer Survey. Market valuations become stretched and headlines reflect excessive optimism. The current bull market is exhibiting many of these typical late-stage phenomena. Below are two behavioral biases that are apparent at this stage of the market:
• Overconfidence Bias: Investors become overconfident and demonstrate unwarranted faith in their own reasoning, judgement, and abilities. Risks are significantly underestimated and expected returns are significantly overestimated.
While investors should view such a period as the investment opportunity of a lifetime, they instead suffer from two key behavioral biases:
• Loss-Aversion Bias (Oh-No!): At this point, fear of further loss is far more powerful than the desire for gain. Unfortunately, this behavioral bias is most detrimental to investors at the best buying opportunities. As stated by Warren Buffett, “Be fearful when others are greedy and greedy when others are fearful.” Easier said than done…
• Status Quo Bias: People find it easier to do nothing (maintain the “status quo”) with their portfolio rather than make changes. After bear market crashes, people prefer to keep things the same and tend to avoid looking for opportunities. As bear market bottoms tend to be rather abrupt and v-shaped in their reversals, this behavioral bias can cause investors to miss the most profitable portion of a new bull market.
Early-Stage Bull MarketAs stocks begin to emerge from a bear market, investors feel battered and bruised by the long severe carnage. Those paying any attention to the media will invariably be scared and skeptical after reading headlines like these… coming from economists and “experts” alike:
March 16, 2018
02 03 04 05 06 07 08 09 10 11 12 13 14 15 16 17 18
70%
65
60
55
50
45
40
35
30
25
“Probability of Stock Market Increase in Next Year”[University of Michigan Consumer Survey]
University of Michigan, Bloomberg
RECESSION
3 / InvesTech Research
# of Days Total LossDate
Bear Markets
09/07/1929 – 06/01/193207/18/1933 – 03/14/193503/06/1937 – 03/31/193811/09/1938 – 04/28/194205/29/1946 – 05/17/194706/15/1948 – 06/13/194908/02/1956 – 10/22/195712/12/1961 – 06/26/196202/09/1966 – 10/07/196611/29/1968 – 05/26/197001/11/1973 – 10/03/197411/28/1980 – 08/12/198208/25/1987 – 12/04/198707/16/1990 – 10/11/199003/24/2000 – 10/09/200210/09/2007 – 03/09/2009
Median: Median since 1960:
998604390
126635336344619624054363062210187
929517
482517
-86.2-33.9-54.5-45.8-28.8-20.6-21.6-28.0-22.2-36.1-48.2-27.1-33.5-19.9-49.1-56.8
-33.7-33.5
39.015.022.617.981.826.229.69.3
14.412.625.218.812.040.223.028.1
22.818.8
2nd Third
21.549.354.543.7-5.445.0-2.010.622.726.115.044.763.322.928.012.2
24.522.9
Final Third
InvesTech Research
Bear Market LossesS&P 500
Portion of Loss During
% %
% %%
1st Third
%
%% %
39.535.722.938.423.628.872.480.162.961.359.836.524.736.949.059.7
39.059.7
%
%%
Just as investor behavior can be irrational during bull markets, bear market cycles may also exemplify unique cognitive biases. Additionally, the elongated time frame of bull market tops creates distinct challenges –and opportunities– for investors as many bull markets tend to end with a whimper rather than with a bang.
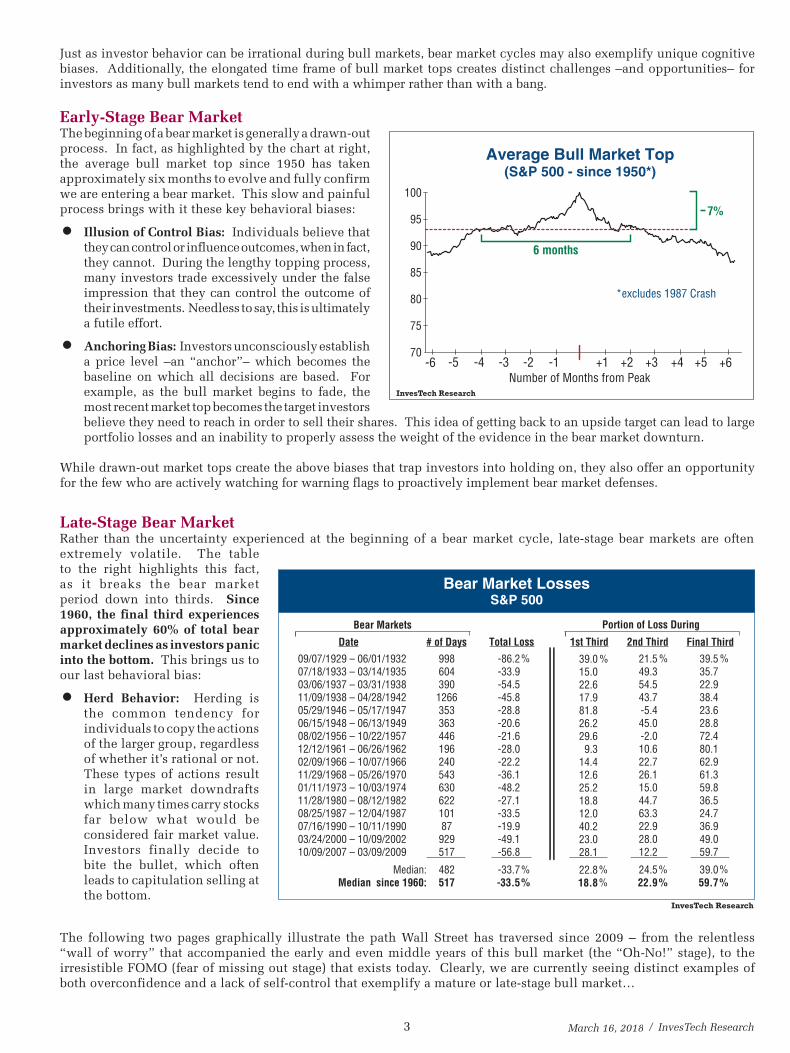
Early-Stage Bear MarketThe beginning of a bear market is generally a drawn-out process. In fact, as highlighted by the chart at right, the average bull market top since 1950 has taken approximately six months to evolve and fully confirm we are entering a bear market. This slow and painful process brings with it these key behavioral biases:
• Illusion of Control Bias: Individuals believe that they can control or influence outcomes, when in fact, they cannot. During the lengthy topping process, many investors trade excessively under the false impression that they can control the outcome of their investments. Needless to say, this is ultimately a futile effort.
• Anchoring Bias: Investors unconsciously establish a price level –an “anchor”– which becomes the baseline on which all decisions are based. For example, as the bull market begins to fade, the most recent market top becomes the target investors believe they need to reach in order to sell their shares. This idea of getting back to an upside target can lead to large portfolio losses and an inability to properly assess the weight of the evidence in the bear market downturn.
While drawn-out market tops create the above biases that trap investors into holding on, they also offer an opportunity for the few who are actively watching for warning flags to proactively implement bear market defenses.
The following two pages graphically illustrate the path Wall Street has traversed since 2009 – from the relentless “wall of worry” that accompanied the early and even middle years of this bull market (the “Oh-No!” stage), to the irresistible FOMO (fear of missing out stage) that exists today. Clearly, we are currently seeing distinct examples of both overconfidence and a lack of self-control that exemplify a mature or late-stage bull market…
Late-Stage Bear MarketRather than the uncertainty experienced at the beginning of a bear market cycle, late-stage bear markets are often extremely volatile. The table to the right highlights this fact, as it breaks the bear market period down into thirds. Since 1960, the final third experiences approximately 60% of total bear market declines as investors panic into the bottom. This brings us to our last behavioral bias:
• Herd Behavior: Herding is the common tendency for individuals to copy the actions of the larger group, regardless of whether it’s rational or not. These types of actions result in large market downdrafts which many times carry stocks far below what would be considered fair market value. Investors finally decide to bite the bullet, which often leads to capitulation selling at the bottom.
March 16, 2018
Average Bull Market Top(S&P 500 - since 1950*)
100
95
90
85
80
75
70+1
7%
6 months
*excludes 1987 Crash
-1-2-3-4-5-6 +2 +3 +4 +5 +6Number of Months from Peak
InvesTech Research
InvesTech Research / 4
CBO predicts deeper “fiscal cliff” recession in financial year 2013 – Reuters, 8/22/12
IMF Sees Risks to Global Economy Mounting – Wall Street Journal, 6/17/11
Double-Dip Recession a ‘Virtual Certainty’ – CNBC, 8/13/10
Stocks Cheap? Don’t Be a Fool! – Business Insider, 6/16/09
World Bank warns on risk of global recession – CNNMoney, 1/18/12
Economic outlook grim, budget watchdog says – USA Today, 6/14/11
Equities are overpriced; here’s how the crash will unfold – Fortune, 5/17/10
FOX News Poll: Worst is Yet to Come on Economy – FOX News, 4/2/09
Signs of Deepening Downturn Multiply in Europe – New York Times, 7/25/12
Bernanke: U.S. default would cause crisis for economy – CNNMoney, 7/13/11
Are We Headed for Housing Armageddon? – Wall Street Journal, 10/12/10
Why Dow 10,000 Will Remain Untouched For Years – Yahoo! Finance, 10/5/09
Obama warns of ‘double-dip recession’ – MSNBC.com, 11/18/09
Fiscal cliff: Biggest threat to U.S. economy – CNN, 7/21/12
Obama Warns U.S. Debt Threatens ‘Serious’ Damage to Economy – Bloomberg, 7/25/11
5 Reasons a Double-Dip Recession Could Happen – U.S. News & World Report, 6/30/10
Global Recession Deepens, Adding to U.S. Woes – The Kiplinger Letter, 5/4/09
Fed Warns of Risk to Economy – Wall Street Journal, 6/21/12
Forecast says double-dip recession is imminent – CNNMoney, 9/30/11
Economy Still Breeding Doom And Gloom – Wall Street Journal, 3/9/10
Global recession worst since Depression, IMF says – Associated Press, 4/22/09
Big-name stocks fall into bear markets – USA Today, 11/9/12
Recession, Recession Everywhere – Wall Street Journal, 10/4/11
5 Doomsday Scenarios for the U.S. Economy – Yahoo! Finance, 9/3/10
Is This The Biggest Bear Market Rally of All Time? – CNBC, 8/6/09
Consumer confidence plunges on “fiscal cliff” fears – Reuters, 12/7/12
European Debt Crisis: You Haven’t Seen Anything Yet – CNBC, 11/14/11
Downturn Coming as Corporate Insiders Are Selling – CNNMoney, 2/8/13
26000
22000
24000
20000
18000
16000
14000
13000
12000
10000
11000
9000
8000
7000
600020132012201120102009
March 16, 2018
2009 Bull Market “Wall of Worry”
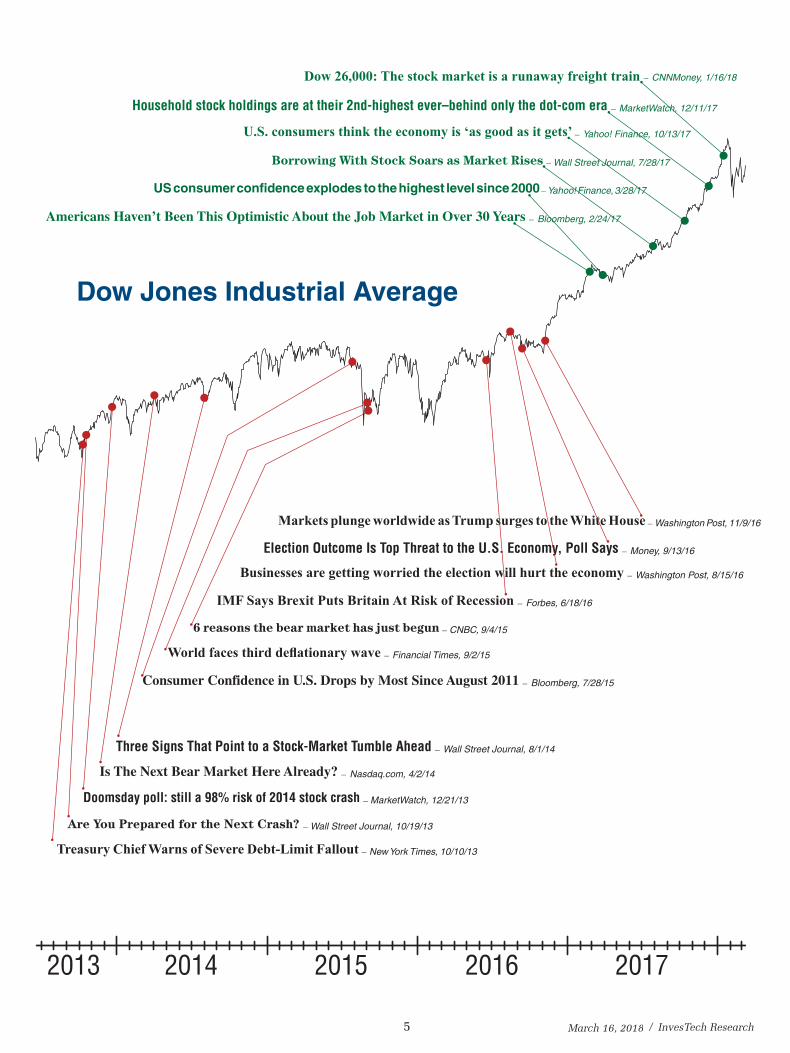
5 / InvesTech Research
Are We Headed for Housing Armageddon? – Wall Street Journal, 10/12/10
Doomsday poll: still a 98% risk of 2014 stock crash – MarketWatch, 12/21/13
Treasury Chief Warns of Severe Debt-Limit Fallout – New York Times, 10/10/13
Three Signs That Point to a Stock-Market Tumble Ahead – Wall Street Journal, 8/1/14
6 reasons the bear market has just begun – CNBC, 9/4/15
Businesses are getting worried the election will hurt the economy – Washington Post, 8/15/16
Borrowing With Stock Soars as Market Rises – Wall Street Journal, 7/28/17
Markets plunge worldwide as Trump surges to the White House – Washington Post, 11/9/16
U.S. consumers think the economy is ‘as good as it gets’ – Yahoo! Finance, 10/13/17
Household stock holdings are at their 2nd-highest ever–behind only the dot-com era – MarketWatch, 12/11/17
Dow 26,000: The stock market is a runaway freight train – CNNMoney, 1/16/18
World faces third deflationary wave – Financial Times, 9/2/15
Election Outcome Is Top Threat to the U.S. Economy, Poll Says – Money, 9/13/16
US consumer confidence explodes to the highest level since 2000 – Yahoo! Finance, 3/28/17
Are You Prepared for the Next Crash? – Wall Street Journal, 10/19/13
Is The Next Bear Market Here Already? – Nasdaq.com, 4/2/14
Consumer Confidence in U.S. Drops by Most Since August 2011 – Bloomberg, 7/28/15
IMF Says Brexit Puts Britain At Risk of Recession – Forbes, 6/18/16
Americans Haven’t Been This Optimistic About the Job Market in Over 30 Years – Bloomberg, 2/24/17
Dow Jones Industrial Average
20172016201520142013
March 16, 2018
2009 Bull Market “Wall of Worry”
InvesTech Research / 6
RELATIVE STRENGTH INDEX(18-month)
Log Scale
InvesTech Research
00 05 10 15 20 25 30 35 40 45 50 55 60 65 70 75 80 85 90 95 00 05 10 15
OVERSOLD
908070605040302010
10000
20000
500030002000
1000600400
200
100
50
3020
10
00 05 10 15 20 25 30 35 40 45 50 55 60 65 70 75 80 85 90 95 00 05 10 15
Tech BubbleNasdaq -77.9%
1929-32 Crash-89.2%
1987 Crash-36.1%
1956Consolidation
-19.4%
DJIA
OVERBOUGHT ?
S&P 500
Bu
ll M
arke
t"l
aun
chin
g p
ads"
-500
-100InvesTech Research
6080
40200
3500
1500
1000
700
400300
100
200
50
70
20002500
falsesignal
falsesignal
DISTRIBUTION (high danger)� 2
� 1SELLING VACUUM
(very bullish)
68 72 76 86 92 98 00 04 06 10 12 14 16 18
NEGATIVE LEADERSHIP COMPOSITE
0
70 78 80 82 84 88Log Scale
66 74 90 94 96 02 08
-34
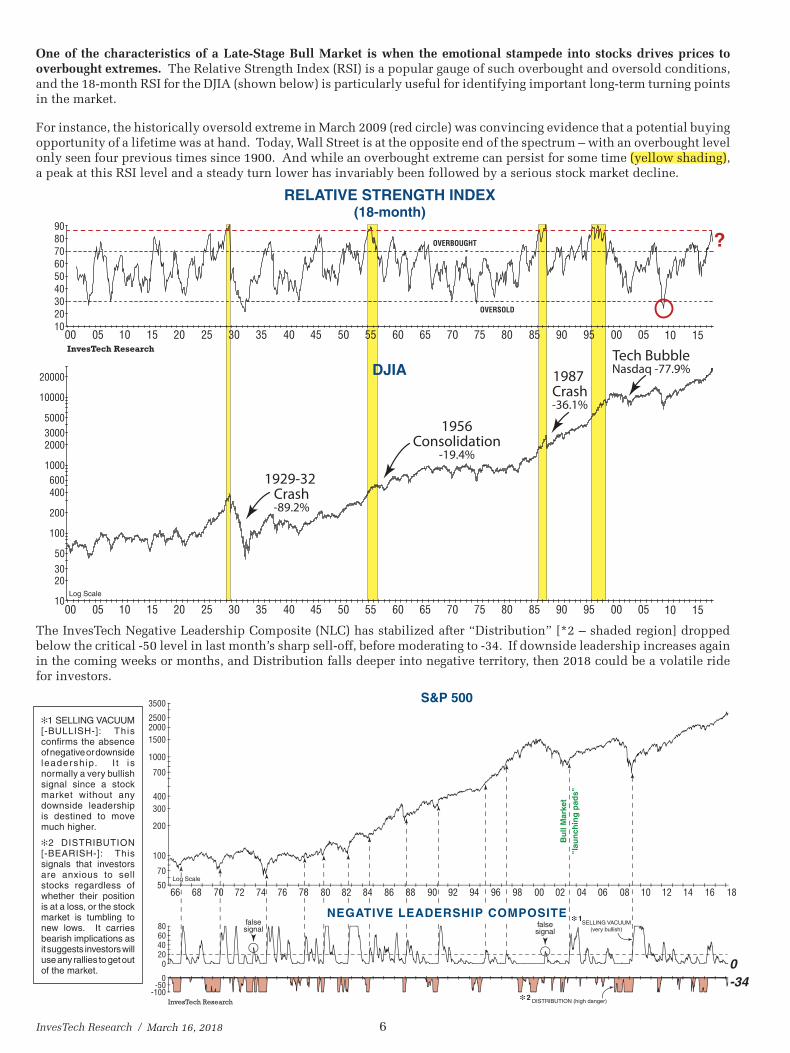
[1 SELLING VACUUM [-BULLISH-]: This confirms the absence of negative or downside leadersh ip. I t i s normally a very bullish signal since a stock market without any downside leadership is destined to move much higher.
[2 DISTRIBUTION [-BEARISH-]: This signals that investors are anxious to sell stocks regardless of whether their position is at a loss, or the stock market is tumbling to new lows. It carries bearish implications as it suggests investors will use any rallies to get out of the market.
The InvesTech Negative Leadership Composite (NLC) has stabilized after “Distribution” [*2 – shaded region] dropped below the critical -50 level in last month’s sharp sell-off, before moderating to -34. If downside leadership increases again in the coming weeks or months, and Distribution falls deeper into negative territory, then 2018 could be a volatile ride for investors.
One of the characteristics of a Late-Stage Bull Market is when the emotional stampede into stocks drives prices to overbought extremes. The Relative Strength Index (RSI) is a popular gauge of such overbought and oversold conditions, and the 18-month RSI for the DJIA (shown below) is particularly useful for identifying important long-term turning points in the market.
For instance, the historically oversold extreme in March 2009 (red circle) was convincing evidence that a potential buying opportunity of a lifetime was at hand. Today, Wall Street is at the opposite end of the spectrum – with an overbought level only seen four previous times since 1900. And while an overbought extreme can persist for some time (yellow shading), a peak at this RSI level and a steady turn lower has invariably been followed by a serious stock market decline.
March 16, 2018
7 / InvesTech Research
7.0%
6.0
5.0
4.0
3.0
2.0
1.0
0
120
110
100
90
80
70
60
10yr T-Bond Yield
U.S. Dollar Index
02 03 0400 01 05 06 07 08 09 10 11 12 13 14 15 16 17 18
02 03 0400 01 05 06 07 08 09 10 11 12 13 14 15 16 17 18
Source: FastTrack
“danger zone”2.82%
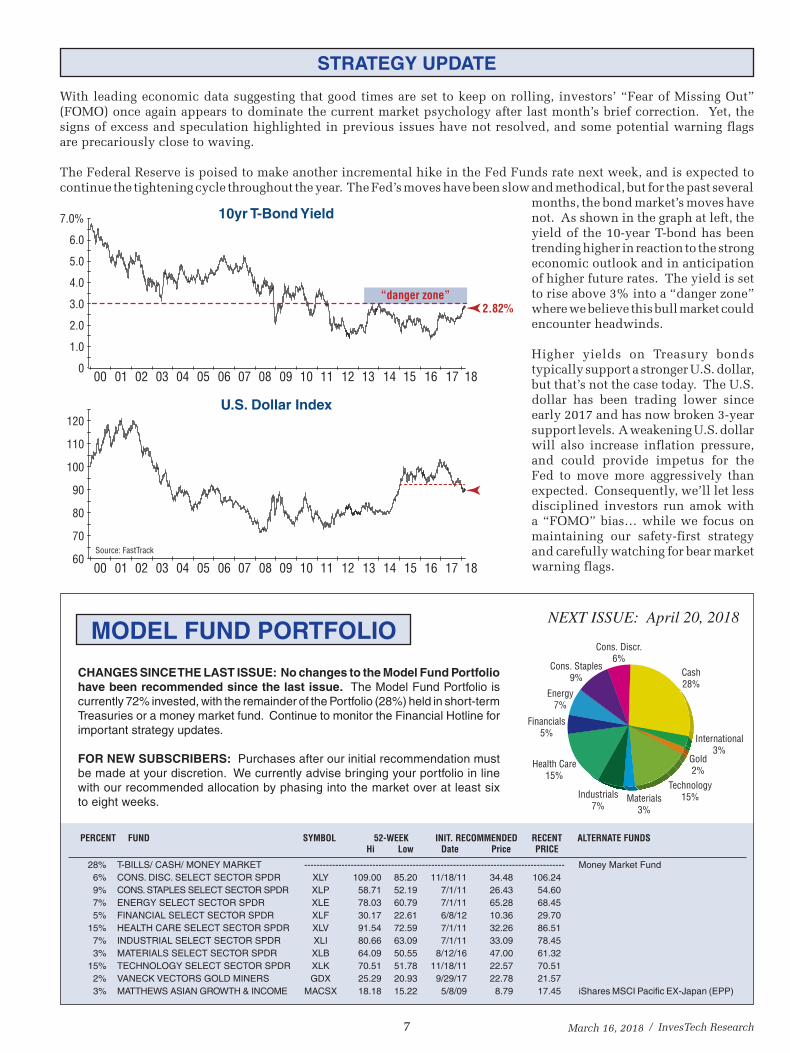
With leading economic data suggesting that good times are set to keep on rolling, investors’ “Fear of Missing Out” (FOMO) once again appears to dominate the current market psychology after last month’s brief correction. Yet, the signs of excess and speculation highlighted in previous issues have not resolved, and some potential warning flags are precariously close to waving.
The Federal Reserve is poised to make another incremental hike in the Fed Funds rate next week, and is expected to continue the tightening cycle throughout the year. The Fed’s moves have been slow and methodical, but for the past several
months, the bond market’s moves have not. As shown in the graph at left, the yield of the 10-year T-bond has been trending higher in reaction to the strong economic outlook and in anticipation of higher future rates. The yield is set to rise above 3% into a “danger zone” where we believe this bull market could encounter headwinds.
Higher yields on Treasury bonds typically support a stronger U.S. dollar, but that’s not the case today. The U.S. dollar has been trading lower since early 2017 and has now broken 3-year support levels. A weakening U.S. dollar will also increase inflation pressure, and could provide impetus for the Fed to move more aggressively than expected. Consequently, we’ll let less disciplined investors run amok with a “FOMO” bias… while we focus on maintaining our safety-first strategy and carefully watching for bear market warning flags.
March 16, 2018
NEXT ISSUE: April 20, 2018MODEL FUND PORTFOLIO
Cons. Discr.6%
Materials3%
Cash28%
Technology15%Industrials
7%
Health Care15%
Financials5%
Energy7%
Cons. Staples9%
International3%
Gold2%
PERCENT FUND SYMBOL 52-WEEK INIT. RECOMMENDED RECENT ALTERNATE FUNDS Hi Low Date Price PRICE 28% T-BILLS/ CASH/ MONEY MARKET ------- ----------------------------------------------------------------------------- Money Market Fund 6% CONS. DISC. SELECT SECTOR SPDR XLY 109.00 85.20 11/18/11 34.48 106.24 9% CONS. STAPLES SELECT SECTOR SPDR XLP 58.71 52.19 7/1/11 26.43 54.60 7% ENERGY SELECT SECTOR SPDR XLE 78.03 60.79 7/1/11 65.28 68.45 5% FINANCIAL SELECT SECTOR SPDR XLF 30.17 22.61 6/8/12 10.36 29.70 15% HEALTH CARE SELECT SECTOR SPDR XLV 91.54 72.59 7/1/11 32.26 86.51 7% INDUSTRIAL SELECT SECTOR SPDR XLI 80.66 63.09 7/1/11 33.09 78.45 3% MATERIALS SELECT SECTOR SPDR XLB 64.09 50.55 8/12/16 47.00 61.32 15% TECHNOLOGY SELECT SECTOR SPDR XLK 70.51 51.78 11/18/11 22.57 70.51 2% VANECK VECTORS GOLD MINERS GDX 25.29 20.93 9/29/17 22.78 21.57 3% MATTHEWS ASIAN GROWTH & INCOME MACSX 18.18 15.22 5/8/09 8.79 17.45 iShares MSCI Pacific EX-Japan (EPP)
CHANGES SINCE THE LAST ISSUE: No changes to the Model Fund Portfolio have been recommended since the last issue. The Model Fund Portfolio is currently 72% invested, with the remainder of the Portfolio (28%) held in short-term Treasuries or a money market fund. Continue to monitor the Financial Hotline for important strategy updates.
FOR NEW SUBSCRIBERS: Purchases after our initial recommendation must be made at your discretion. We currently advise bringing your portfolio in line with our recommended allocation by phasing into the market over at least six to eight weeks.
STRATEGY UPDATE
PERSONAL PERSPECTIVE
3.5%
3.0
2.5
2.0
1.5
1.0
0.5
0
1500200025003500
70
50
100
200
300
700500
1000
MarketPeak
MarketPeak
NewRecord
High
MarketPeak
MarketPeak
MarketPeak
MarketPeak
Log Scale
Margin Debt(% Nominal GDP)
S&P 500
6866 72 76 78 80 84 86 90 94 96 98 04 06 12 1492 02 1070 74 82 88 00 08 16 18
NYSE, FINRA, U.S. Department of Commerce 6866 72 76 78 80 84 86 90 94 96 98 04 06 12 1492 02 1070 74 82 88 00 08 16 18
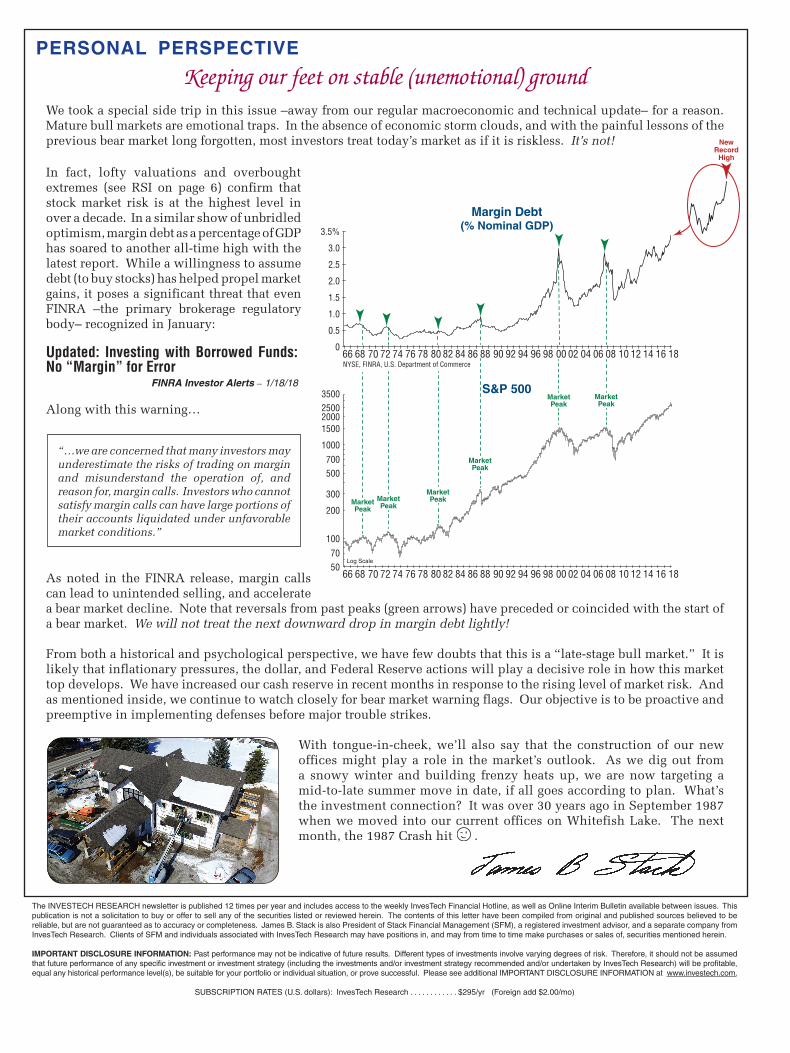
In fact, lofty valuations and overbought extremes (see RSI on page 6) confirm that stock market risk is at the highest level in over a decade. In a similar show of unbridled optimism, margin debt as a percentage of GDP has soared to another all-time high with the latest report. While a willingness to assume debt (to buy stocks) has helped propel market gains, it poses a significant threat that even FINRA –the primary brokerage regulatory body– recognized in January:
Keeping our feet on stable (unemotional) groundWe took a special side trip in this issue –away from our regular macroeconomic and technical update– for a reason. Mature bull markets are emotional traps. In the absence of economic storm clouds, and with the painful lessons of the previous bear market long forgotten, most investors treat today’s market as if it is riskless. It’s not!
“…we are concerned that many investors may underestimate the risks of trading on margin and misunderstand the operation of, and reason for, margin calls. Investors who cannot satisfy margin calls can have large portions of their accounts liquidated under unfavorable market conditions.”
Updated: Investing with Borrowed Funds: No “Margin” for Error
FINRA Investor Alerts – 1/18/18
As noted in the FINRA release, margin calls can lead to unintended selling, and accelerate a bear market decline. Note that reversals from past peaks (green arrows) have preceded or coincided with the start of a bear market. We will not treat the next downward drop in margin debt lightly!
From both a historical and psychological perspective, we have few doubts that this is a “late-stage bull market.” It is likely that inflationary pressures, the dollar, and Federal Reserve actions will play a decisive role in how this market top develops. We have increased our cash reserve in recent months in response to the rising level of market risk. And as mentioned inside, we continue to watch closely for bear market warning flags. Our objective is to be proactive and preemptive in implementing defenses before major trouble strikes.
With tongue-in-cheek, we’ll also say that the construction of our new offices might play a role in the market’s outlook. As we dig out from a snowy winter and building frenzy heats up, we are now targeting a mid-to-late summer move in date, if all goes according to plan. What’s the investment connection? It was over 30 years ago in September 1987 when we moved into our current offices on Whitefish Lake. The next month, the 1987 Crash hit .
Along with this warning…
The INVESTECH RESEARCH newsletter is published 12 times per year and includes access to the weekly InvesTech Financial Hotline, as well as Online Interim Bulletin available between issues. This publication is not a solicitation to buy or offer to sell any of the securities listed or reviewed herein. The contents of this letter have been compiled from original and published sources believed to be reliable, but are not guaranteed as to accuracy or completeness. James B. Stack is also President of Stack Financial Management (SFM), a registered investment advisor, and a separate company from InvesTech Research. Clients of SFM and individuals associated with InvesTech Research may have positions in, and may from time to time make purchases or sales of, securities mentioned herein.
IMPORTANT DISCLOSURE INFORMATION: Past performance may not be indicative of future results. Different types of investments involve varying degrees of risk. Therefore, it should not be assumed that future performance of any specific investment or investment strategy (including the investments and/or investment strategy recommended and/or undertaken by InvesTech Research) will be profitable, equal any historical performance level(s), be suitable for your portfolio or individual situation, or prove successful. Please see additional IMPORTANT DISCLOSURE INFORMATION at www.investech.com.
SUBSCRIPTION RATES (U.S. dollars): InvesTech Research . . . . . . . . . . . . $295/yr (Foreign add $2.00/mo)