Embed Size (px)
Citation preview

NV Energy PresentationKevin Geraghty – SVP, Energy Supply
June 21, 2017

• NV Energy Today• Assets
– Generating Plants– Power Purchase Agreements– Gas Transportation Contracts– Workforce
• Energy Choice Initiative • Appendix
Agenda
2
• Headquartered in Las Vegas, with majoroperations in Reno and Carson City
• 2,461 employees (month-end May 2017)• 1.25 million electric and 163,000 gas customers• Service to 90% of Nevada population, along with
tourist population in excess of 45 million
NV Energy Today
3(1) Net summer peak megawatts owned in operation as of May 31, 2017
• Provides electric services to Las Vegas and surrounding areas
• 910,000 electric customers• 4,639 megawatts of owned
power generation capacity(1)
• Provides electric and gas services to Reno and northern Nevada
• 340,000 electric customers and 162,000 gas customers
• 1,372 megawatts of owned power generation capacity(1)
Nevada Power Company Sierra Pacific Power Company

NV Energy is a summer peaking utility driven by the loads in the Las Vegas and Reno areas
2016 Monthly Retail Customer Demand
4
0
1,000
2,000
3,000
4,000
5,000
6,000
7,000
8,000
9,000
January February March April May June July August September October November December
2016 Monthly Peak Demand, MW
South North
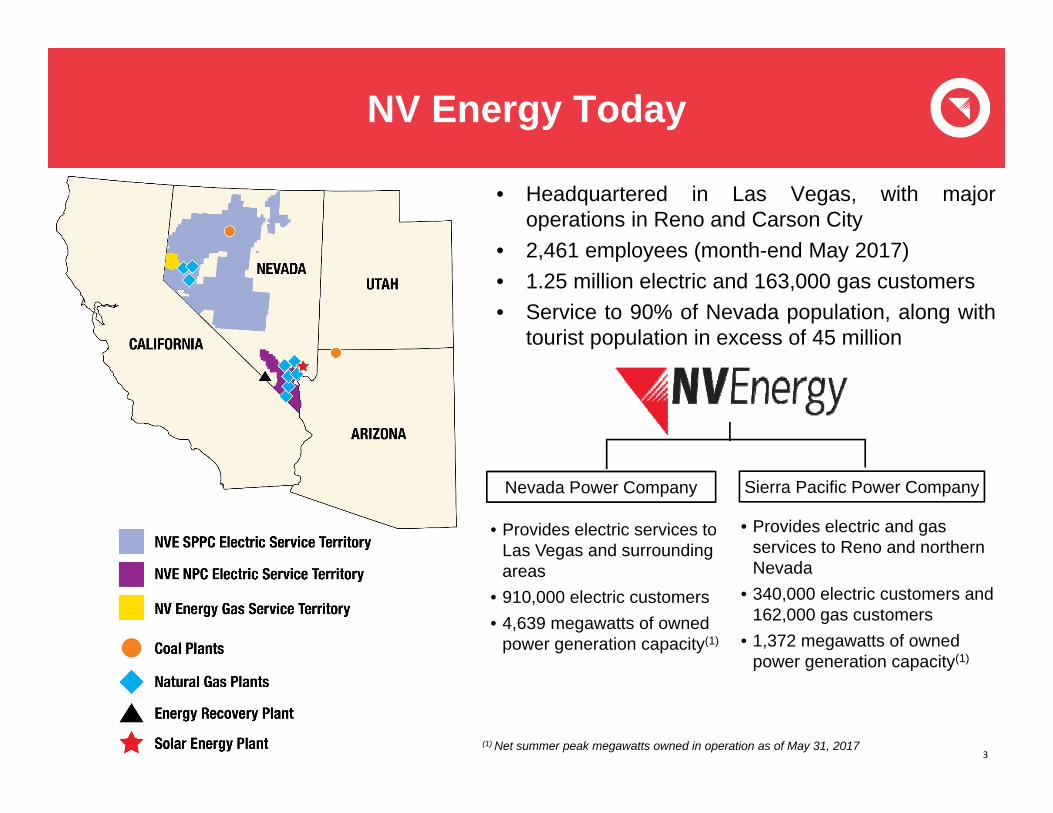
Generation Assets
5
Key:CoalNatural GasRenewable Energy
(All megawatts are summer peak capacity)
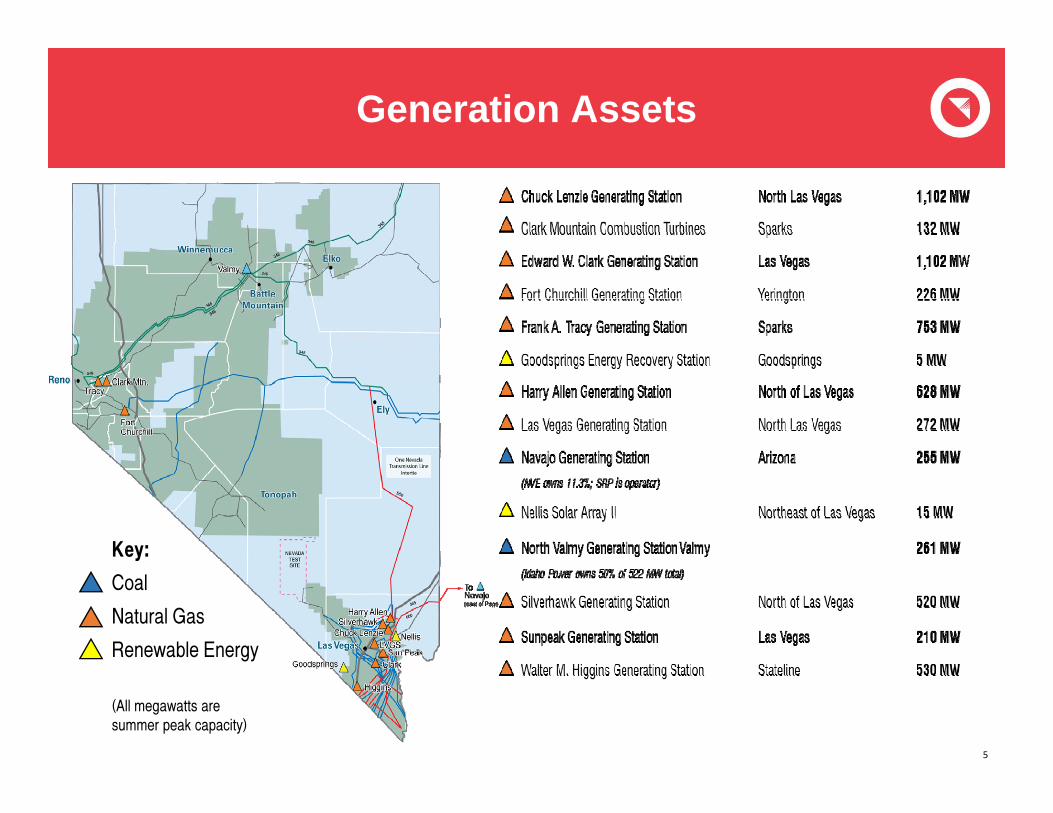
Power Purchase Agreements - North
6
Contract Name Contract Type Capacity (MW) 2017 Rate
Operation Date
Termination Date
Renewable EnergyPPAs (Commercial)BeowaweQF Geothermal 17.7 59.49$ 4/21/2006 12/31/2025Boulder Solar II SolarS 50.0 39.90$ 1/27/2017 12/31/2037
BradyQF Geothermal 24.0 75.86$ 7/30/1992 7/29/2022
BurdetteQF Geothermal 26.0 54.91$ 2/28/2006 12/31/2026
Galena 3QF Geothermal 26.5 63.32$ 2/21/2008 12/31/2028
HomestretchQF Geothermal 5.58 132.01$ 6/1/1987 12/31/2018
Hooper1,QF Hydro 0.75 Varies 6/23/2016 12/31/2040Kingston Hydro 0.175 21.21$ 9/19/2011 12/31/2040Mill Creek Hydro 0.037 21.67$ 9/1/2011 12/31/2040Nevada Solar One (SPPC)QF SolarT 22.1 195.83$ 6/27/2007 12/31/2027
RO Ranch2 Hydro 0 N/A 3/15/2011 12/31/2040
Sierra Pacific Industries2,QF Biomass 0 N/A 11/8/1989 11/7/2019
Soda Lake IQF Geothermal 3.6 58.09$ 12/31/1987 12/31/2018
Soda Lake IIQF Geothermal 19.5 59.84$ 8/4/1991 8/4/2021
Steamboat 1A2,QF Geothermal 0 N/A 12/13/1988 12/13/2018
Steamboat HillsQF Geothermal 14.55 118.59$ 2/23/1988 2/22/2018
Steamboat 2QF Geothermal 13.4 69.34$ 12/13/1992 12/12/2022
Steamboat 3QF Geothermal 13.4 67.76$ 12/19/1992 12/18/2022
TCID New LahontanQF Hydro 4.0 72.42$ 6/12/1989 6/11/2039
TMWA FleishQF Hydro 2.4 71.76$ 5/16/2008 6/1/2028
TMWA VerdiQF Hydro 2.4 71.11$ 5/15/2009 6/1/2029
TMWA WashoeQF Hydro 2.5 71.87$ 7/25/2008 6/1/2028
USG San EmidioQF Geothermal 11.75 93.94$ 5/25/2012 12/31/2037
260.3
Leased UnitsFort Churchill Solar SolarS 19.5 Varies 8/5/2015 8/4/2040
PC Purchase AgreementTMWRF Methane 0.8 5.00$ 9/9/2005 12/12/2024
PPAs (Pre‐Commercial)3
Switch Station 2 (SPPC) SolarS 51.3 38.70$ 9/30/2017 12/31/2037Techren 2 SolarS 200.0 31.15$ 7/1/2019 12/31/2044
251.30
Non‐Renewable Purchase AgreementsNewmont Nevada Energy Investment Coal 179.0 26.88$ 6/1/2008 5/31/2023Liberty (CalPeco) EBSA Diesel 12.0 Varies 1/1/2011 12/29/2020
191.0
Renewable & Non‐Renewable Sales Agreements
Liberty (CalPeco)Full Requirements
(Capacity/Energy/PCs)See Note 4 1/1/2016 4/30/2022
NPC‐SPPC Sale of PCs (Geothermal) 2.3 10/30/2009 12/31/2028Apple NGR (Fort Churchill Solar) NGR Agreement (Sale of PCs) 19.5 8/5/2015 8/4/2040Apple NGR (Boulder Solar II) NGR Agreement (Sale of PCs) 50.0 1/27/2017 12/31/2037
Switch NGR‐SPPC (Switch Station 2)3 NGR Agreement (Sale of PCs) 51.3 9/30/2017 12/31/2037
Apple NGR (Techren 2)3 NGR Agreement (Sale of PCs) 200.0 7/1/2019 12/31/2044Notes:
S=Single Axis Tracking, T=Solar Thermal (Tracking), F=Fixed Tilt
Sierra Pacific Power Company d/b/a NV Energy Long Term Agreements
2. Sierra Pacific Industries, RO Ranch Hydro and the Steamboat 1A facilities are shut down indefinitely (the PPAs are still active).3. Facilities are either under development or construction (the dates shown are expected dates).4. The current monthly contract demand ranges from approximately 70 MW (June) to 140 MW (December).
1. Short Term Agreement rolled over annually through perpetuity per legal.
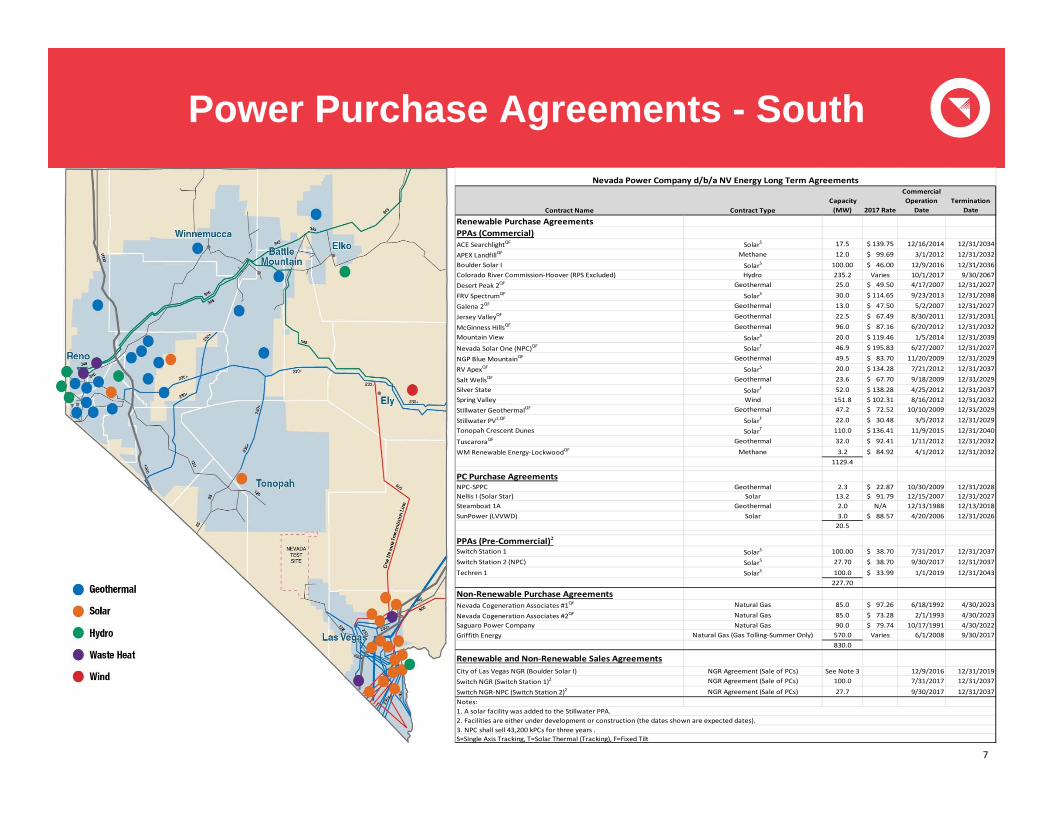
Power Purchase Agreements - South
7
Contract Name Contract Type Capacity (MW) 2017 Rate
Commercial Operation
DateTermination
Date
Renewable Purchase AgreementsPPAs (Commercial)ACE SearchlightQF SolarS 17.5 139.75$ 12/16/2014 12/31/2034
APEX LandfillQF Methane 12.0 99.69$ 3/1/2012 12/31/2032Boulder Solar I SolarS 100.00 46.00$ 12/9/2016 12/31/2036Colorado River Commission‐Hoover (RPS Excluded) Hydro 235.2 Varies 10/1/2017 9/30/2067Desert Peak 2QF Geothermal 25.0 49.50$ 4/17/2007 12/31/2027
FRV SpectrumQF SolarS 30.0 114.65$ 9/23/2013 12/31/2038
Galena 2QF Geothermal 13.0 47.50$ 5/2/2007 12/31/2027
Jersey ValleyQF Geothermal 22.5 67.49$ 8/30/2011 12/31/2031
McGinness HillsQF Geothermal 96.0 87.16$ 6/20/2012 12/31/2032Mountain View SolarS 20.0 119.46$ 1/5/2014 12/31/2039
Nevada Solar One (NPC)QF SolarT 46.9 195.83$ 6/27/2007 12/31/2027
NGP Blue MountainQF Geothermal 49.5 83.70$ 11/20/2009 12/31/2029
RV ApexQF SolarS 20.0 134.28$ 7/21/2012 12/31/2037
Salt WellsQF Geothermal 23.6 67.70$ 9/18/2009 12/31/2029Silver State SolarF 52.0 138.28$ 4/25/2012 12/31/2037Spring Valley Wind 151.8 102.31$ 8/16/2012 12/31/2032Stillwater GeothermalQF Geothermal 47.2 72.52$ 10/10/2009 12/31/2029
Stillwater PV1,QF SolarF 22.0 30.48$ 3/5/2012 12/31/2029Tonopah Crescent Dunes SolarT 110.0 136.41$ 11/9/2015 12/31/2040
TuscaroraQF Geothermal 32.0 92.41$ 1/11/2012 12/31/2032
WM Renewable Energy‐LockwoodQF Methane 3.2 84.92$ 4/1/2012 12/31/20321129.4
PC Purchase AgreementsNPC‐SPPC Geothermal 2.3 22.87$ 10/30/2009 12/31/2028Nellis I (Solar Star) Solar 13.2 91.79$ 12/15/2007 12/31/2027Steamboat 1A Geothermal 2.0 N/A 12/13/1988 12/13/2018SunPower (LVVWD) Solar 3.0 88.57$ 4/20/2006 12/31/2026
20.5
PPAs (Pre‐Commercial)2Switch Station 1 SolarS 100.00 38.70$ 7/31/2017 12/31/2037Switch Station 2 (NPC) SolarS 27.70 38.70$ 9/30/2017 12/31/2037Techren 1 SolarS 100.0 33.99$ 1/1/2019 12/31/2043
227.70
Non‐Renewable Purchase AgreementsNevada Cogeneration Associates #1QF Natural Gas 85.0 97.26$ 6/18/1992 4/30/2023
Nevada Cogeneration Associates #2QF Natural Gas 85.0 73.28$ 2/1/1993 4/30/2023Saguaro Power Company Natural Gas 90.0 79.74$ 10/17/1991 4/30/2022Griffith Energy Natural Gas (Gas Tolling‐Summer Only) 570.0 Varies 6/1/2008 9/30/2017
830.0
Renewable and Non‐Renewable Sales AgreementsCity of Las Vegas NGR (Boulder Solar I) NGR Agreement (Sale of PCs) See Note 3 12/9/2016 12/31/2019Switch NGR (Switch Station 1)2 NGR Agreement (Sale of PCs) 100.0 7/31/2017 12/31/2037
Switch NGR‐NPC (Switch Station 2)2 NGR Agreement (Sale of PCs) 27.7 9/30/2017 12/31/2037Notes:
S=Single Axis Tracking, T=Solar Thermal (Tracking), F=Fixed Tilt
Nevada Power Company d/b/a NV Energy Long Term Agreements
1. A solar facility was added to the Stillwater PPA.2. Facilities are either under development or construction (the dates shown are expected dates).3. NPC shall sell 43,200 kPCs for three years .
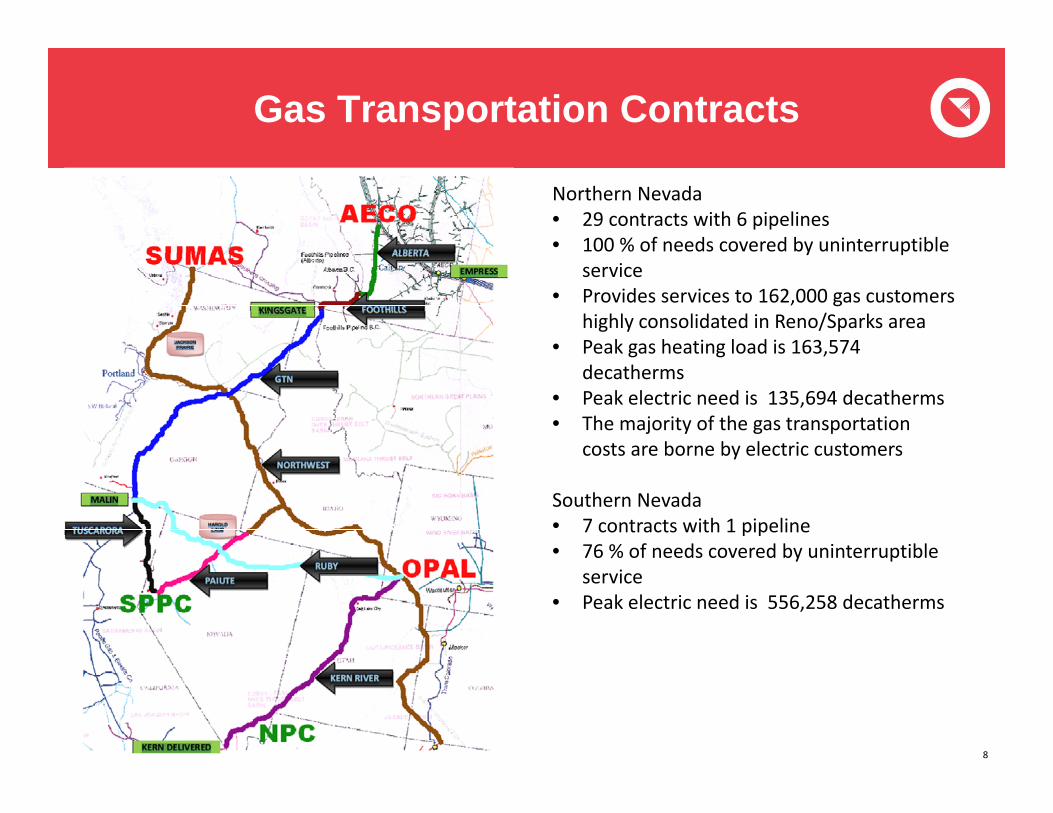
Gas Transportation Contracts
8
Northern Nevada• 29 contracts with 6 pipelines• 100 % of needs covered by uninterruptible
service• Provides services to 162,000 gas customers
highly consolidated in Reno/Sparks area• Peak gas heating load is 163,574
decatherms• Peak electric need is 135,694 decatherms• The majority of the gas transportation
costs are borne by electric customers
Southern Nevada• 7 contracts with 1 pipeline• 76 % of needs covered by uninterruptible
service• Peak electric need is 556,258 decatherms

Workforce
9
• More than 500 colleagues are responsible for meeting the continuous obligation to supply energy to customers
– Power Plant Operations– Engineering– Contract Management– Planning and Forecasting– Market Monitoring and Optimization– Administration
• Many of these colleagues are represented by two International Brotherhood of Electrical Workers labor agreements
– Local 1245 (northern Nevada) contract through September 22, 2022– Local 396 (southern Nevada) contract through June 30, 2021
10
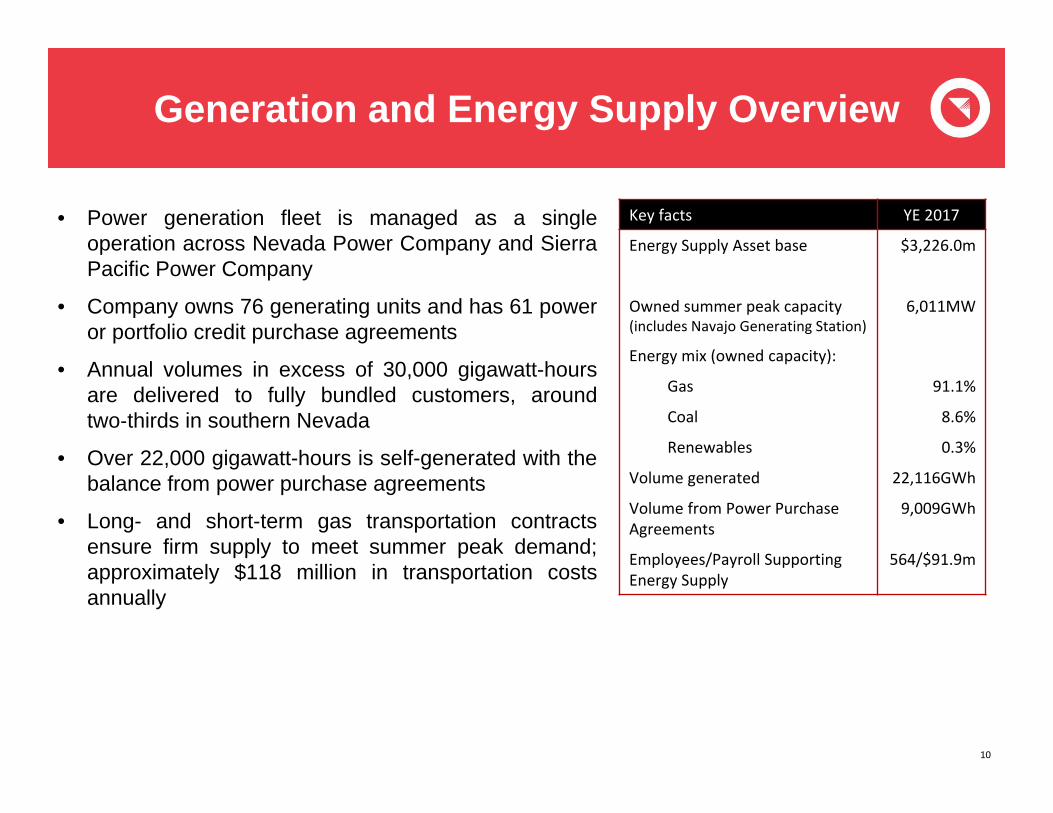
Key facts YE 2017
Energy Supply Asset base $3,226.0m
Owned summer peak capacity (includes Navajo Generating Station)
6,011MW
Energy mix (owned capacity):
Gas 91.1%
Coal 8.6%
Renewables 0.3%
Volume generated 22,116GWh
Volume from Power Purchase Agreements
9,009GWh
Employees/Payroll Supporting Energy Supply
564/$91.9m
Generation and Energy Supply Overview
• Power generation fleet is managed as a singleoperation across Nevada Power Company and SierraPacific Power Company
• Company owns 76 generating units and has 61 poweror portfolio credit purchase agreements
• Annual volumes in excess of 30,000 gigawatt-hoursare delivered to fully bundled customers, aroundtwo‐thirds in southern Nevada
• Over 22,000 gigawatt-hours is self-generated with thebalance from power purchase agreements
• Long- and short-term gas transportation contractsensure firm supply to meet summer peak demand;approximately $118 million in transportation costsannually
Consistent with the Energy Choice Initiative ballot language, the following may be assumed:• Power generation and energy supply will be established as a competitive
service; will require utilities to divest assets related to the supply of electricity– NV Energy, and any affiliates, will be out of the power generation side of the
business in order to prohibit the grant of monopolies for the supply of electricity • Transmission and distribution service will remain a regulated rate of return
service due to the cost of duplicating investments– Consistent with what has been done in other fully competitive retail jurisdictions– Legislature need not provide for transmission and distribution deregulation to
establish the competitive retail market• Default or provider of last resort service will not be provided by regulated
utilities in order to prevent the grant of an exclusive monopoly – NV Energy will not provide default or provider of last resort services
• Jobs for NV Energy colleagues will remain a primary focus of decision makers in the transition
Fundamental Assumptions
11

Simple Framework To A Complex Transition
12
Regulated and efficientcompetitive market
July 2023
Level playing field for all retail providers
Customer protections
MARKET POLICY
564 jobs/$91.9m payroll
$3.2b owned generation assets $4.2b energy contract obligations
(NPV 2020-2046)
NO STRANDED ASSETS Wholesale market structure
Retail market structure
State regulatory functions
Default and provider of last resort services
Transmission and distribution services
Energy policies and programs
COMPLEXITY, RISKS & COST
Resource adequacy
Renewable and economic development
Energy efficiency
ENERGY POLICY
No structural winners and losers
No increase in prices paid over current model
Reliable service
CUSTOMERS
NV EnergyRespects Public Policy
Transition Plan 2018
• Market Structure
• Competitive Services
• Regulatory Framework
• Restructuring and Transition Costs
• Restructuring related transition costs beyond stranded generation and regulatory assets can include
– Establishing provider of last resort or default full service entity– Creating an independent entity and a new Federal Energy Regulatory
Commission approved tariff for transmission system open access and operations
– Creation and operation of a new entity responsible for market operations– Reconfigure customer service and billing architecture – Create a customer choice and switching mechanism among retailers– Manage the customer electronic data interchange that the utility, retailers
and system/market operator will need to access– Workforce and downsizing of assets no longer needed to support utility
• Building leases, vehicles, computer equipment, etc.
13
Potential Transition Costs

• State implementation and oversight costs related to restructuring– Creation and implementation of new regulatory regime tasked with licensing
energy marketers and to set forth rules of data handling and market behavior– Creation and implementation of audit function and enforcement arm for new
regulatory regimes – Administration of social policy programs under new regulatory regime– Additional resources to receive and process customer complaints concerning
new market players – Costs to establish auction or to oversee auction for provider of last resort or
default service – Costs to educate consumers on retail choice and accessing energy supply
options• Potential cost shifts to Sierra Pacific Power gas operations as local
distribution company customers– Retained gas transportation contracts will no longer be shared with electric
customers– Cost efficiencies of shared billing with electric customers may be eliminated– Ability to direct gas during extreme temperature events may have reliability
impacts
Potential Transition Costs
14
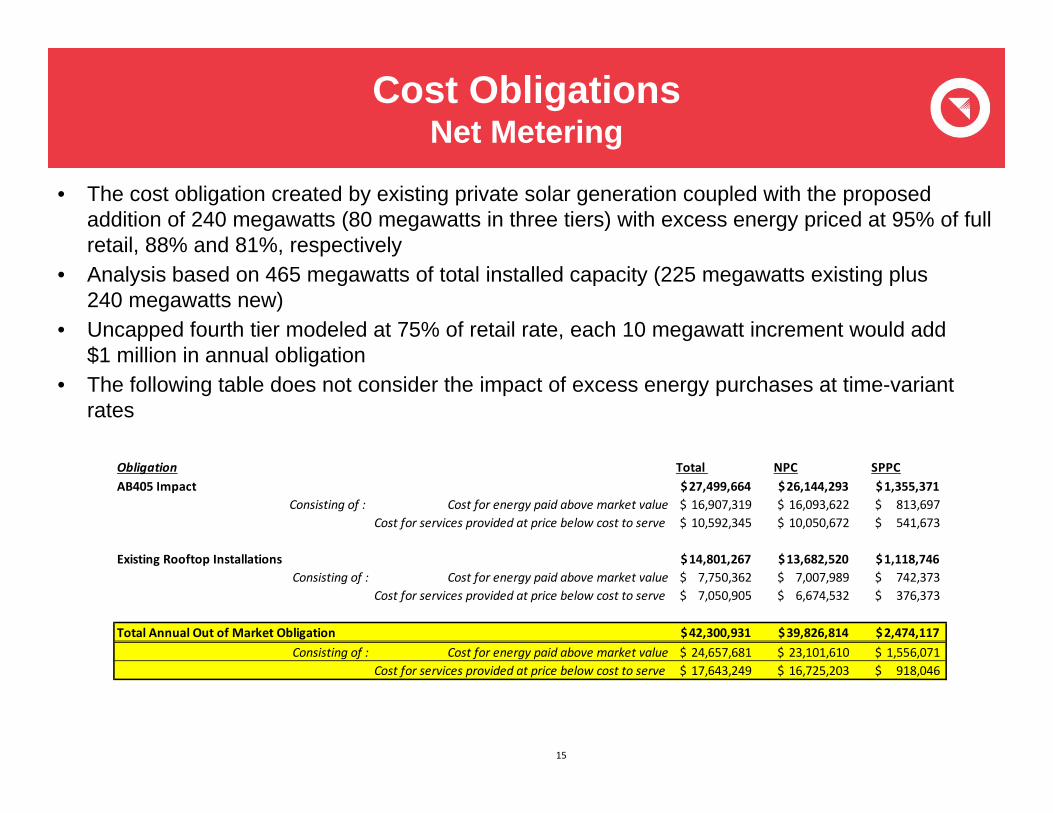
• The cost obligation created by existing private solar generation coupled with the proposed addition of 240 megawatts (80 megawatts in three tiers) with excess energy priced at 95% of full retail, 88% and 81%, respectively
• Analysis based on 465 megawatts of total installed capacity (225 megawatts existing plus 240 megawatts new)
• Uncapped fourth tier modeled at 75% of retail rate, each 10 megawatt increment would add $1 million in annual obligation
• The following table does not consider the impact of excess energy purchases at time-variant rates
Cost ObligationsNet Metering
15
Obligation Total NPC SPPCAB405 Impact 27,499,664$ 26,144,293$ 1,355,371$
Consisting of : Cost for energy paid above market value 16,907,319$ 16,093,622$ 813,697$ Cost for services provided at price below cost to serve 10,592,345$ 10,050,672$ 541,673$
Existing Rooftop Installations 14,801,267$ 13,682,520$ 1,118,746$ Consisting of : Cost for energy paid above market value 7,750,362$ 7,007,989$ 742,373$
Cost for services provided at price below cost to serve 7,050,905$ 6,674,532$ 376,373$
Total Annual Out of Market Obligation 42,300,931$ 39,826,814$ 2,474,117$ Consisting of : Cost for energy paid above market value 24,657,681$ 23,101,610$ 1,556,071$
Cost for services provided at price below cost to serve 17,643,249$ 16,725,203$ 918,046$

Public Policy Costs in Customer Bill
16
1Highlighted public policy costs for a Nevada Power Company average residentialcustomer total $9.45 per month or about 7.2% of the monthly bill. Energy costs tocomply with renewable portfolio credit requirements, which currently total $7.12 permonth, are included in the electric consumption rate
1
• Temp. Green Power Financing ($0.64) – Funds the Temporary RenewableEnergy Development Trust, which was put in place by the Legislature tofacilitate renewable development. Only one project, Nevada Solar One, wasfinanced through the trust
• Renewable Energy Program ($1.01) – Funds the $295 millionRenewableGeneration Program, which was established by the Legislature toprovide cash payment to the owners of private rooftop solar, wind and waterpower systems
• Energy Efficiency Charge ($1.18) – Funds the mandated investment indemand-side management and demand reduction programs
• Local Government Fee ($6.23) – Represents the “taxes” imposed by localgovernments for the right to site utility facilities in public rights of way. Thisvaries by county
• Universal Energy Charge ($0.39) – Funds a low-income assistanceprogram established by the Legislature. The dollars collected are forwardeddirectly to agencies who administer the program and distribute the funds totheir clients
Public Policy Cost Explanations
17
Financial RespectImpact Of Company Operations to Nevada
18
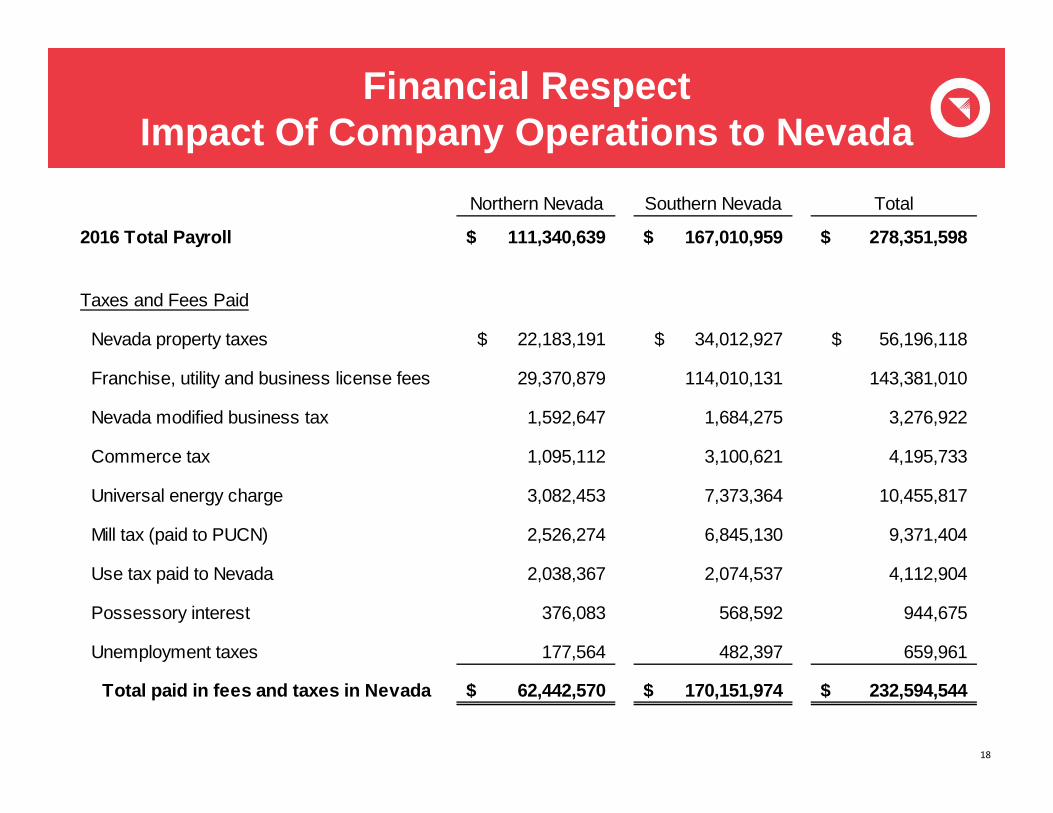
Northern Nevada Southern Nevada Total
2016 Total Payroll 111,340,639$ 167,010,959$ 278,351,598$
Taxes and Fees Paid
Nevada property taxes 22,183,191$ 34,012,927$ 56,196,118$
Franchise, utility and business license fees 29,370,879 114,010,131 143,381,010
Nevada modified business tax 1,592,647 1,684,275 3,276,922
Commerce tax 1,095,112 3,100,621 4,195,733
Universal energy charge 3,082,453 7,373,364 10,455,817
Mill tax (paid to PUCN) 2,526,274 6,845,130 9,371,404
Use tax paid to Nevada 2,038,367 2,074,537 4,112,904
Possessory interest 376,083 568,592 944,675
Unemployment taxes 177,564 482,397 659,961
Total paid in fees and taxes in Nevada 62,442,570$ 170,151,974$ 232,594,544$

Appendix

NV Energy’s Power Generation Fleet

Baseload/Intermediate Combined-Cycle Units
21
Chuck Lenzie• 1,102 megawatts, heat rate – 7,200 British thermal units/kilowatt‐hour • In‐service date March 2006 (purchased October 2004)

Baseload/Intermediate Combined-Cycle Units
22
Silverhawk• 525 megawatts, heat rate – 7,467 British thermal units/kilowatt‐hour• In‐service date May 2004 (Purchased January 2006)
Baseload/Intermediate Combined-Cycle Units
23
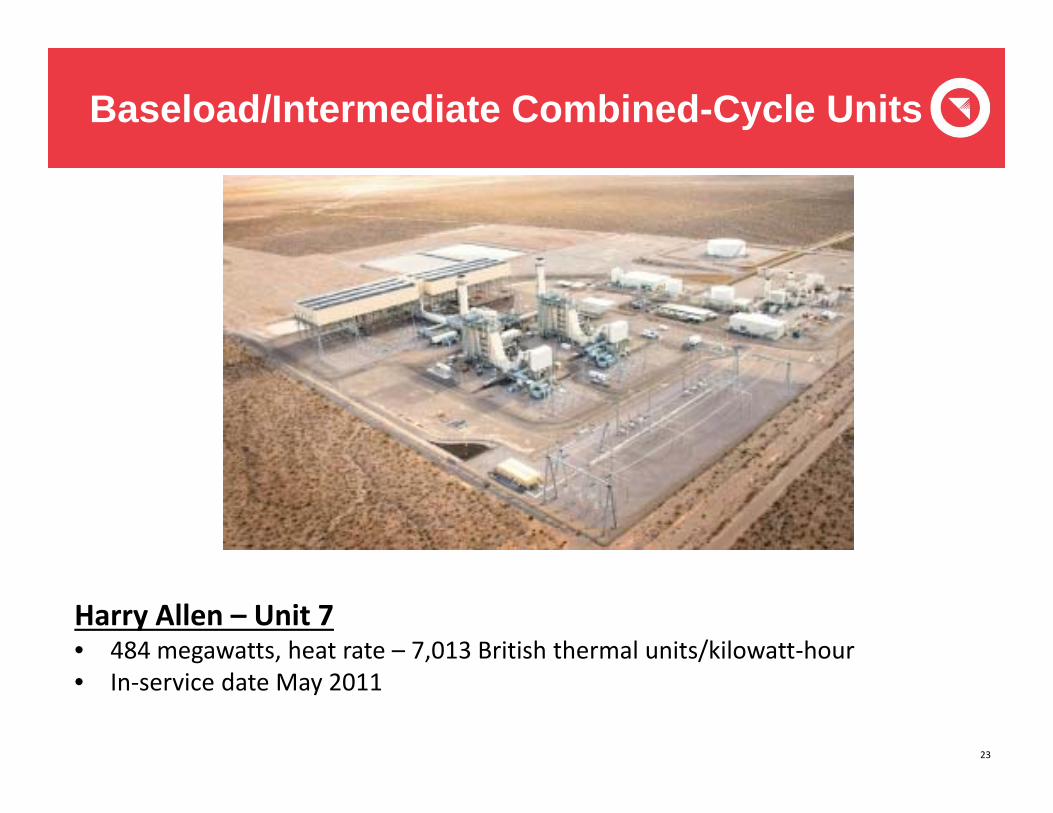
Harry Allen – Unit 7• 484 megawatts, heat rate – 7,013 British thermal units/kilowatt‐hour• In‐service date May 2011
Baseload/Intermediate Combined-Cycle Units
24
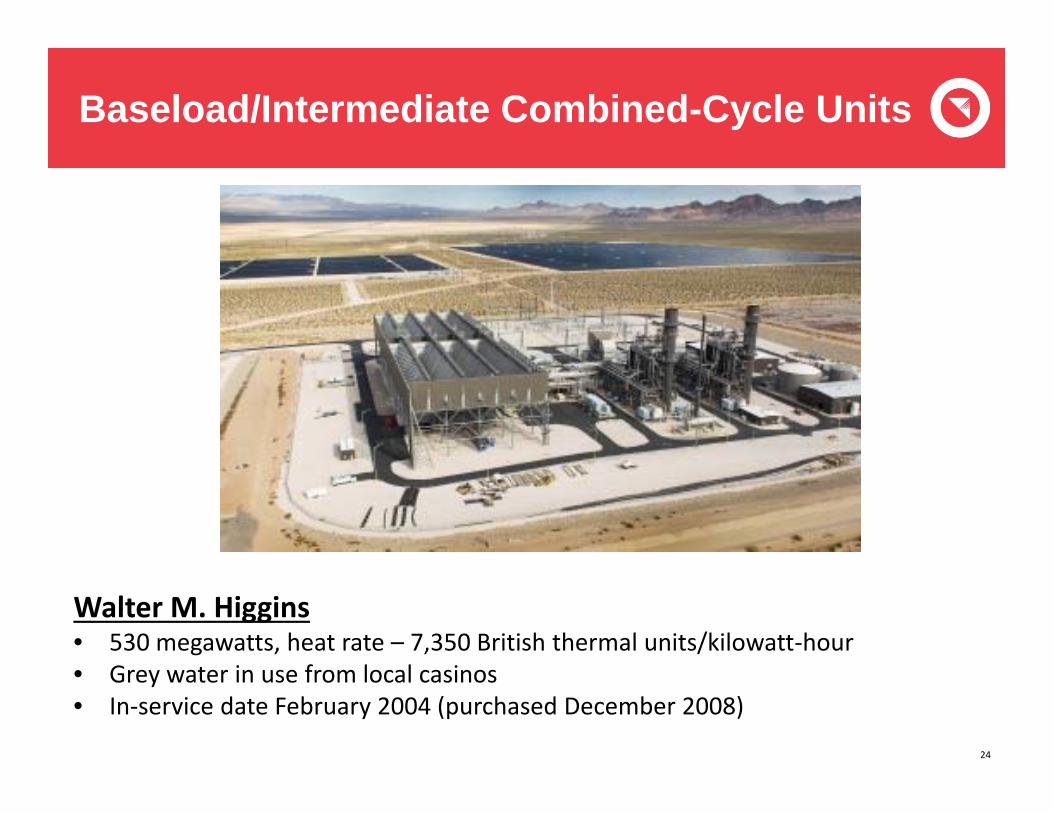
Walter M. Higgins• 530 megawatts, heat rate – 7,350 British thermal units/kilowatt‐hour• Grey water in use from local casinos• In‐service date February 2004 (purchased December 2008)

Baseload/Intermediate Combined-Cycle Units
25
Frank A. Tracy – Unit 10• 541 megawatts, heat rate – 7,150 British thermal units/kilowatt‐hour• In‐service date July 2008
Coal-Fueled Power Plants
26
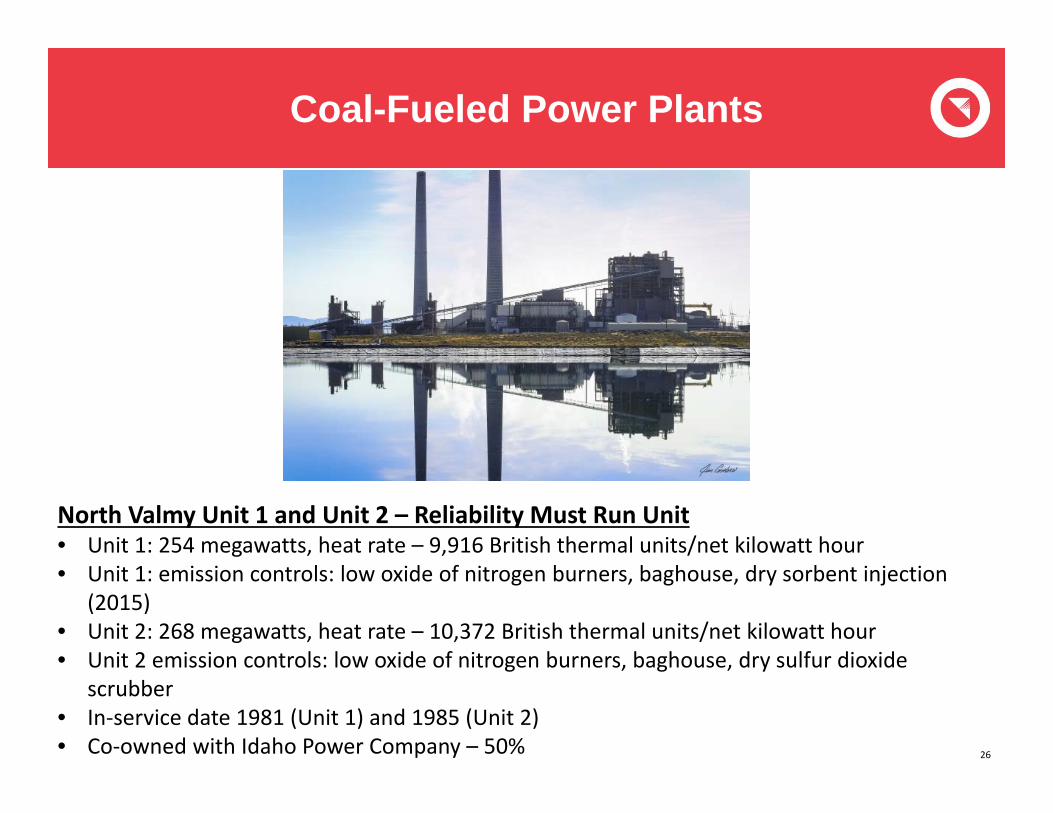
North Valmy Unit 1 and Unit 2 – Reliability Must Run Unit• Unit 1: 254 megawatts, heat rate – 9,916 British thermal units/net kilowatt hour• Unit 1: emission controls: low oxide of nitrogen burners, baghouse, dry sorbent injection
(2015)• Unit 2: 268 megawatts, heat rate – 10,372 British thermal units/net kilowatt hour• Unit 2 emission controls: low oxide of nitrogen burners, baghouse, dry sulfur dioxide
scrubber• In‐service date 1981 (Unit 1) and 1985 (Unit 2)• Co‐owned with Idaho Power Company – 50%

Coal-Fueled Power Plants
27
Navajo Generating Station Units 1 thru 3• 2,250 megawatts (each unit is 750 megawatts), heat rate – 10,090 British thermal units/net
kilowatt‐hour • Salt River Project is the operator• NV Energy owns 11.3% of the plant – 255 megawatts• Emission controls: low oxide of nitrogen burners, hot‐side precipitators , wet sulfur dioxide
scrubber• In‐service date 1974 (Unit 1), 1975 (Unit 2), 1976 (Unit 3)• Original lease expires December 2019 – NV Energy will eliminate interest at that time

Intermediate/Peaking Combined-Cycle Units
28
Clark Combined‐Cycle Units – Unit 9 and Unit 10• 430 megawatts, heat rate – 9,730 British thermal units/net kilowatt‐hour • Emission controls: dry‐low oxide of nitrogen burners• Each combustion turbine has a bypass duct – heat rate is 15,050 British thermal units/net
kilowatt‐hour in this mode• Plant uses grey water from the City of Las Vegas• In‐service date 1979 (Units 5 and 6), 1980 (Unit 7), 1982 (Unit 8), 1993 (Unit 9) and 1994
(Unit 10)

Intermediate/Peaking Combined-Cycle Units
29
Tracy Combined‐Cycle Unit 5• 104 megawatts, heat rate – 8,355 British thermal units/net kilowatt‐hour • Emission controls: dry low oxide of nitrogen burners and steam injection• Steam augmented output• In‐service date 1996• Unit was originally constructed as an integrated coal gasification combined‐cycle
unit
Intermediate/Peaking Combined-Cycle Units
30
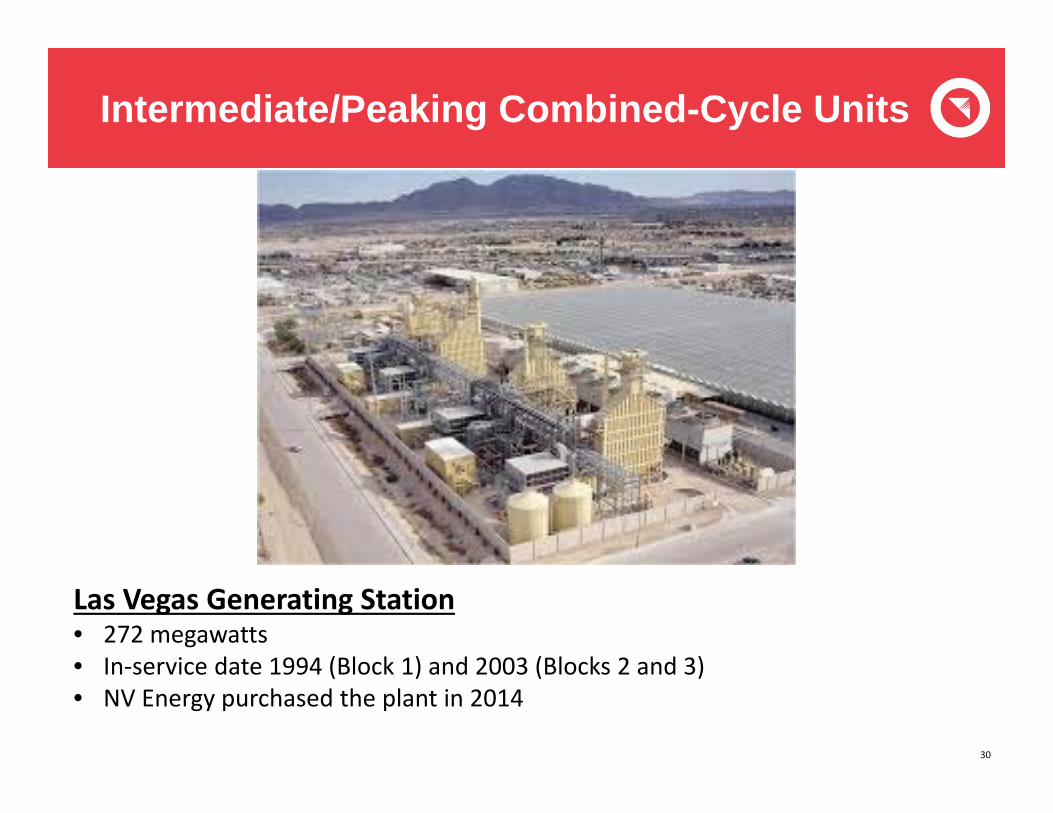
Las Vegas Generating Station• 272 megawatts• In‐service date 1994 (Block 1) and 2003 (Blocks 2 and 3)• NV Energy purchased the plant in 2014

Gas-Fueled Steam Units
31
Tracy Unit 3• 108 megawatts, heat rate – 10,001 British thermal units/net kilowatt‐hour • Emission controls: low oxide of nitrogen burners (2015)• In‐service date 1974

Gas-Fueled Steam Units
32
Fort Churchill Units 1 and 2 – Reliability Must Run Unit• 226 megawatts (each unit is 113 megawatts), heat rate – 10,092 British thermal
units/net kilowatt‐hour • Emission controls: low oxide of nitrogen burners (2015) • In‐service date 1968 (Unit 1), 1971 (Unit 2)• Units are currently required (must run) for Carson area load support

Peaking Units
Clark Unit 4• 54 megawatts; 12,900 British thermal units/net kilowatt‐hour • In‐service date 1973• Start time – 12 minutes
33
Peaking Units
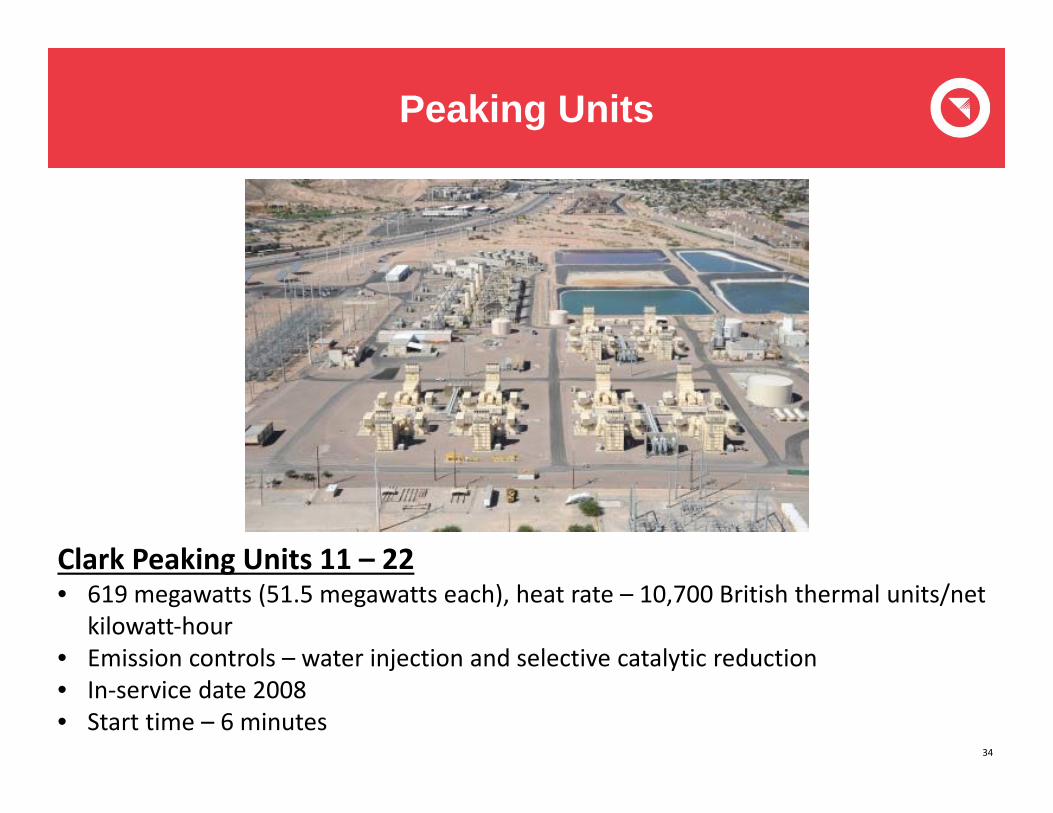
Clark Peaking Units 11 – 22• 619 megawatts (51.5 megawatts each), heat rate – 10,700 British thermal units/net
kilowatt‐hour • Emission controls – water injection and selective catalytic reduction• In‐service date 2008• Start time – 6 minutes
34

Peaking Units
Harry Allen Unit 3 and 4• 144 megawatts (72 megawatts each), heat rate – 12,900 British thermal units/net
kilowatt‐hour • Emission controls – dry low oxide of nitrogen burners• In‐service date 1995 (Unit 3), 2006 (Unit 4)• Start time – 8 minutes 35
Peaking Units
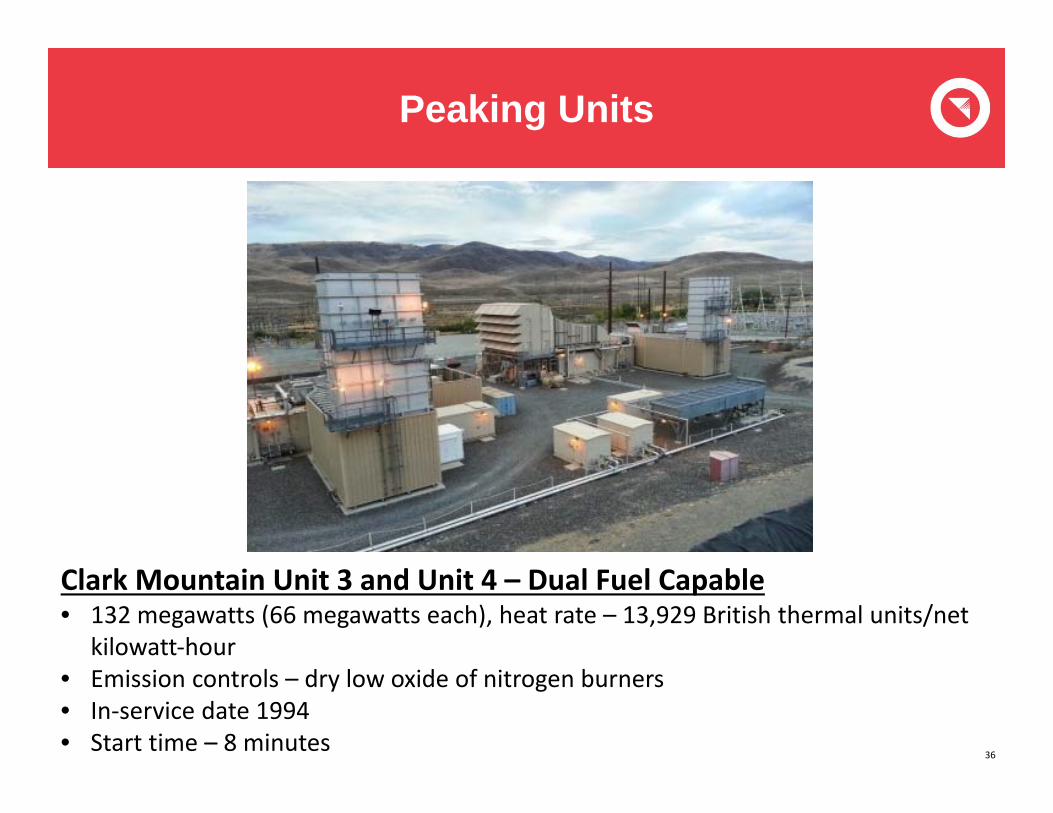
Clark Mountain Unit 3 and Unit 4 – Dual Fuel Capable• 132 megawatts (66 megawatts each), heat rate – 13,929 British thermal units/net
kilowatt‐hour • Emission controls – dry low oxide of nitrogen burners• In‐service date 1994• Start time – 8 minutes
36

Peaking Units
Sun Peak Units 3, 4 and 5 ‐ Dual Fuel Capable• 210 megawatts (70 megawatts each)• In‐service date 1991; NV Energy purchased the plant in 2014• Start time – 8 minutes
37

Goodsprings Waste Heat Generator
38
Goodsprings Compressor Station• 5 megawatts• In‐service date 2010• Uses waste heat from Kern River Gas pipeline

Nellis Solar Photovoltaic II
39
Nellis Solar Photovoltaic II• 15 megawatts • In commercial operation December 2015