Embed Size (px)
Citation preview

NUWC-NPT Technical Report 12,218 30 September 2016
Composite Failures: A Comparison of Experimental Test Results and Computational Analysis Using XFEM Andrew W. Hulton Paul V. Cavallaro Ranges, Engineering, and Analysis Department
Naval Undersea Warfare Center Division Newport, Rhode Island Approved for public release; distribution is unlimited.

PREFACE This report was funded under NUWC Division Newport Internal Investment Program, NWA 300000099822/0010. The principal investigator was Andrew W. Hulton (Code 7023). The technical reviewer was Matthew E. Johnson (Code 7023). The authors gratefully acknowledge the Office of Naval Research and Neil J. Dubois (00T1) for funding this research.
Reviewed and Approved: 30 September 2016
Eric S. Spigel
Head, Ranges, Engineering, and Analysis Department

REPORT DOCUMENTATION PAGE Form Approved OMB No. 0704-0188
The public reporting burden for this collection of information is estimated to average 1 hour per response, including the time for reviewing instructions, searching existing data sources, gathering and maintaining the data needed, and completing and reviewing the collection of information. Send comments regarding this burden estimate or any other aspect of this collection of information, including suggestions for reducing this burden, to Department of Defense, Washington Headquarters Services, Directorate for Information Operations and Reports (0704-0188), 1215 Jefferson Davis Highway, Suite 1204, Arlington, VA 22202-4302. Respondents should be aware that notwithstanding any other provision of law, no person shall be subject to any penalty for failing to comply with a collection of information if it does not display a currently valid OPM control number. PLEASE DO NOT RETURN YOUR FORM TO THE ABOVE ADDRESS. 1. REPORT DATE (DD-MM-YY)
30-09-2016 2. REPORT TYPE
Technical Report 3. DATES COVERED (From – To)
4. TITLE AND SUBTITLE Composite Failures: A Comparison of Experimental Test Results and Computational Analysis Using XFEM
5a. CONTRACT NUMBER
5b. GRANT NUMBER
5c. PROGRAM ELEMENT NUMBER
6. AUTHOR(S) Andrew W. Hulton Paul V. Cavallaro
5.d PROJECT NUMBER
5e. TASK NUMBER
5f. WORK UNIT NUMBER
7. PERFORMING ORGANIZATION NAME(S) AND ADDRESS(ES) Naval Undersea Warfare Center Division 1176 Howell Street Newport, RI 02841-1708
8. PERFORMING ORGANIZATION REPORT NUMBER
TR 12,218
9. SPONSORING/MONITORING AGENCY NAME(S) AND ADDRESS(ES) Naval Undersea Warfare Center Division 1176 Howell Street Newport, RI 02841-1708
10. SPONSORING/MONITOR’S ACRONYM
NUWC 11. SPONSORING/MONITORING REPORT NUMBER
12. DISTRIBUTION/AVAILABILITY STATEMENT Approved for public release; distribution is unlimited.
13. SUPPLEMENTARY NOTES
14. ABSTRACT Fiber-reinforced polymers (FRPs)—composites consisting of a thermoset or thermoplastic polymer matrix reinforced by carbon, glass or aramid fibers—have been used as a substitute for more conventional materials in a wide range of applications, particularly in the aerospace, defense, and automobile industries. Because of the widespread availability of measurement techniques, experimental testing of composite materials has largely outpaced the computational modeling ability, forcing design of composite structures to follow a build-test-build cycle. The use of the extended finite-element method (XFEM) has revolutionized the computational design process: it improves modeling efficiency and allows previously unfeasible analyses of complex failure mechanisms to be investigated. To establish confidence in any new computational technique, however, it is imperative that computational results be compared with experimental test results to validate the analytical models. The research documented in this report clearly demonstrates the ability of XFEM to model various modes of failure in composite materials while taking into account composite layer-orientation-dependent fracture properties. Comparisons between experimental and computational results show that XFEM successfully replicates the failure mechanisms of composite cylinders under lateral compression. With proper material property characterization, better confidence can be gained in utilizing efficient computational analysis tools such as XFEM in the design of previously untested composite arrangements, reducing cost and time requirements.
15. SUBJECT TERMS Undersea Warfare Fiber-Reinforced Composites Finite-Element Method Fracture Mechanics Physics-Based Modeling Extended Finite-Element Method Linear Elastic Fracture Mechanics Virtual Crack Closure Technique
16. SECURITY CLASSIFICATION OF: 17. LIMITATION OF ABSTRACT
SAR
18. NUMBER OF PAGES
28
19a. NAME OF RESPONSIBLE PERSON Andrew W. Hulton
a. REPORT Unclassified
b. ABSTRACT Unclassified
c. THIS PAGE Unclassified 19b. TELEPHONE NUMBER (Include area code)
401-832-6830 NSN 7540-01-280-5500 Standard Form 298 (Rev. 2-89) Prescribed by ANSI Std. Z39-18 298-102


i
TABLE OF CONTENTS Page LIST OF TABLES .......................................................................................................................... ii LIST OF ABBREVIATIONS AND ACRONYMS ...................................................................... iii LIST OF SYMBOLS ..................................................................................................................... iii INTRODUCTION .......................................................................................................................... 1 FRACTURE OF COMPOSITES .................................................................................................... 2
FRP Composites.......................................................................................................................... 2 Fracture Mechanics ..................................................................................................................... 3
EXPERIMENTAL TEST ............................................................................................................... 5
Test Setup.................................................................................................................................... 5 Test Results ................................................................................................................................. 7
PHYSICS-BASED MODELING ................................................................................................... 9
FEM ............................................................................................................................................ 9 XFEM ......................................................................................................................................... 9
3-D FINITE ELEMENT MODEL ................................................................................................ 11
Overview ................................................................................................................................... 11 Material Fracture ....................................................................................................................... 12 Results ....................................................................................................................................... 13 Effects of Fracture Parameters .................................................................................................. 15
CONCLUSION ............................................................................................................................. 17 REFERENCES ............................................................................................................................. 18
LIST OF ILLUSTRATIONS Figure Page 1 (a) Mode I, (b) Mode II, (c) Mode III Fracture ....................................................................3 2 Crack Growth with the Crack Face Parallel (Left) and Perpendicular (Right) to the Fiber Direction (Perpendicular cracks require fiber fracture.) ................................4 3 Cylinder Specimen and Experimental Test Setup with Assumed Failure Location at the 3 o’clock Position ....................................................................................................5 4 Partial Cylinder Specimen Construction ..............................................................................6

ii
LIST OF ILLUSTRATIONS (Cont’d) Figure Page 5 Failure of Carbon Fiber/Epoxy Cylinder Subjected to Lateral Compression ......................7 6 Enhanced View of Cylinder Failure ....................................................................................7 7 Force Versus Displacement for Experimental Results ........................................................8 8 Crack Running Through a Set of Elements with Enriched Functions ...............................11 9 Cylinder Model Construction with Hoop (Orange) and Longitudinal (Green) Oriented Fibers; XFEM-Enriched Elements Highlighted in Red .....................................................12 10 Maximum Principal Stress Immediately Before Fracture Initiation (ksi) .........................14 11 Maximum Principal Stress Immediately Before Fracture Initiation at Region of Interest (ksi) ................................................................................................................14 12 Partially Propagated Crack ................................................................................................15 13 Initial Crack Added to Model ............................................................................................16 14 Failure of Cylinder with Strain Energy Release Rates at 1% of Values Listed in Table 1 .............................................................................................................16
LIST OF TABLES Table Page 1 Constant Material Properties for the Composite Layers ....................................................13 2 Fracture Toughness Values and Failure Stresses for the Hoop and Longitudinal Layers ..............................................................................................................................13

iii (iv blank)
LIST OF ABBREVIATIONS AND ACRONYMS 3-D Three-dimensional CZM Cohesive zone method FEM Finite-element method FRP Fiber-reinforced polymer GPa Gigapascal ksi Kilopound per square inch LEFM Linear elastic fracture mechanics MMB Mixed-mode bending MPa Megapascal N Newton Pa Pascal PBM Physics-based modeling PUM Partition-of-unity method UD Unidirectional VCCT Virtual crack closure technique XFEM Extended finite-element method
LIST OF SYMBOLS E Young’s modulus of elasticity G Shear modulus of elasticity GC Critical material strain energy release rate
GI (GII, GIII) Mode strain energy release rate GIC (GIIC, GIIIC) Critical Mode strain energy release rate
GT Total strain energy release rate
H Heaviside function m Semi-empirical criterion exponent 𝑞𝑞𝐽𝐽0 Enrichment coefficients SC Set of elements encompassing crack SH Set of elements encompassing crack tip t Experimental cylinder thickness uI Nodal degrees of freedom σps Maximum principal stress criterion ν Poisson’s ratio
𝛹𝛹(𝑗𝑗) Enrichment coefficients near crack tip


1
COMPOSITE FAILURES: A COMPARISON OF EXPERIMENTAL TEST RESULTS AND COMPUTATIONAL ANALYSIS USING XFEM
INTRODUCTION Fiber-reinforced polymers (FRPs)—composites consisting of a thermoset or thermoplastic polymer matrix reinforced by carbon, glass, or aramid fibers—have the potential to dramatically influence the design and manufacturing processes of innumerable industries. In applications where weight is a premium concern, FRPs present unique opportunities to improve existing designs. The significance of FRP composites is that they can be customized in the manufacturing process to meet the needs of specific applications. Fiber orientation can be tailored to provide optimal strength and toughness for certain loading conditions. FRPs are of particular interest to the military and defense industries because of their potential use in underwater applications where corrosion-resistance, weight, and implosion-resistance are indispensable design factors. Because of the widespread availability of measurement techniques, experimental testing of composite materials has largely outpaced the computational modeling ability of such complicated materials—thus, relegating the design of composite structures to a build-test-build methodology. Recent advancements in computational physics-based modeling (PBM), however, are changing the manufacture of FRPs: comprehensive modeling techniques can significantly reduce the effort required to build and test future composite structures. Previously untested composite arrangements can be properly analyzed prior to any physical testing, vastly reducing cost and time requirements. Preliminary computational results can be compared to experimental testing results to validate the analytical models. The finite-element method (FEM) has been a popular computational analysis technique for modeling mechanical deformations and failure for any material, including FRPs. Recent research has enabled numerically efficient fracture modeling capabilities using the extended finite-element method (XFEM). Initiation and propagation of multiple cracks can be modeled simultaneously without mesh refinement or successive re-meshing near the crack tip. Numerical computation of FRP fracture has historically consisted of imposing failure conditions on a homogenous material with averaged composite properties to capture one of the common failure methods, such as delamination. These homogenized materials, however, do not account for local effects such as fiber/matrix interfaces or fiber orientation. This report documents a comparison between computational analysis and experimental testing of unidirectional (UD) carbon fiber/epoxy composite cylinders under lateral compression between two flat plates. The three-dimensional (3-D) computational model incorporates fracture using the XFEM capability available in Abaqus v6.13. XFEM is used to model crack growth and propagation throughout each distinct orientation-dependent layer of the composite, with different fracture criteria depending on fiber orientation. Experimental and computational results for crack initiation location and propagation path are compared. To simulate the effect of surface

2
defects in experimental specimens, an initial crack is then instituted into the computational model. To further demonstrate the influence of fracture properties on analytical results, the fracture parameter inputs of the computational model are reduced to identify the effects of strain energy release rate and fracture toughness on failure response.
FRACTURE OF COMPOSITES FRP COMPOSITES FRP composites consist of a thermoset or thermoplastic polymer matrix reinforced by carbon, glass, or aramid fibers. Hundreds of thousands of individual fibers, whose diameters are 5 to 10 μm, are bundled together to form a tow. Single-direction-fiber-tow layers can be (1) stacked into varying orientation plies or (2) woven together. The nature of manufacturing FRPs provides a unique ability to customize the FRP for specific applications. Fiber and matrix material selection, fiber/matrix volume fraction, and laminate organization are just a few of the many factors associated with designing and manufacturing a desired composite material.
Although numerous options exist when the use and design of FRP composites are being contemplated, the exact mechanical nature of the composite has not been fully evaluated. While FRPs show particularly good material properties in the fiber axial direction, transverse loads on complex structures can lead to failure at lower stress states. These issues can be mitigated by properly designing the composite layer construction to provide strength in strategic component orientations.
Typical development of composite prototypes has consisted of extensive testing of
previously built structures. For example, composite cylinders designed for underwater applications are first subjected to rigorous impact and implosion testing to determine their structural efficacy.1, 2 The design of composite structures that are exposed to extreme loading events requires that attention be paid to material failure and damage absorption characteristics.3 Material properties can be derived from testing of circular tubes, and the analytical solutions can be derived.4, 5 Cavallaro researched the role of weave styles and crimp gradients on the damage tolerance of woven fabric composites.6 The majority of structural research as it pertains to energy absorption capabilities has occurred with axial compression of cylindrical or rectangular tubes, where local wall buckling occurs. Another method of energy absorption is through lateral compression of thin-walled cross-sectional tubes. Impact energy is absorbed as strain energy (elastic and plastic), dissipative energy, and fracture energy. To properly design composites to absorb impact energy and resist damage propagation, fracture mechanisms in composites must be well understood.

3
FRACTURE MECHANICS In a generic material, three different modes of fracture can occur (see figure 1). A review
of the various modes of fracture, which are discussed in this section, is provided by Prasad et al.7
1. Mode I fracture results in two crack faces being pulled away from each other. 2. Mode II fracture occurs because of in-plane shear loading, where the two fractured surfaces slide with respect to each other along the crack plane. 3. Mode III fracture, out-of-plane shear, occurs when the crack faces separate out of the crack plane.
Figure 1. (a) Mode I, (b) Mode II, (c) Mode III Fracture
In order to fully understand the response of composite materials to crack initiation and propagation, fracture mechanisms must be researched at the local scale through controlled experiments. Contrary to isotropic materials such as metals, FRP composites possess a discontinuous fiber/matrix interface, where complex interactions govern material failure. As such, FRP composites exhibit localized fracture beyond the three primary fracture modes listed above. Some examples of composite failure are (1) fiber fracture, (2) matrix cracking, (3) delamination, or (4) fiber pull-out. The most common methods of composite failure are the failure of the matrix (matrix cracking, delamination) or the failure of the fiber/matrix interface (fiber pull-out). Each local failure phenomenon relates to a failure in one of the three primary modes of material fracture.
A comprehensive overview of the mathematical modeling of different fracture
phenomena in fiber composites is provided by Mishnaevsky and Brøndsted.8 In addition, Pinho et al.9 developed physically based criteria for calculating multiple modes of failure in FRPs. Depending on the orientation of the composite layer with respect to the advancing crack front, different modes of fracture occur (see figure 2). For cracks that are parallel to the fiber direction, intralaminar crack growth occurs between fibers and through the matrix. If the crack face has formed perpendicular to the fiber direction, however, crack growth requires fiber fracture.
(a) (b) (c)
Opening In-Plane Shear Out-of-Plane Shear

4
Figure 2. Crack Growth with the Crack Face Parallel (Left) and Perpendicular (Right) to the Fiber Direction (Perpendicular cracks require fiber fracture.)
Fracture toughness, which is the resistance to the onset and growth of cracks, is a key material parameter that governs the ability of composites to absorb damage. This toughness can be determined by comparing the total strain energy release rate GT to a critical material fracture toughness value GC. GC is an experimentally determined material property and can be broken down into a combination of the individual mode fracture toughness values GIC, GIIC, and GIIIC. GT is a summation of GI, GII, and GIII, which correspond to energy release rates due to mode I, II, and III fractures, respectively. When GT > GC, the crack can be expected to propagate. Using these individual strain energy release rates, an overall failure criterion can be established. Benzeggagh and Kenane created a simple mathematical relationship combining the various mode strain energy release rates to determine GC, which is shown in equation (1).10 𝐺𝐺𝐶𝐶 = 𝐺𝐺𝐼𝐼𝐶𝐶 + (𝐺𝐺𝐼𝐼𝐼𝐼𝐶𝐶 + 𝐺𝐺𝐼𝐼𝐼𝐼𝐼𝐼𝐶𝐶 − 𝐺𝐺𝐼𝐼𝐶𝐶) �𝐺𝐺𝐼𝐼𝐼𝐼+𝐺𝐺𝐼𝐼𝐼𝐼𝐼𝐼
𝐺𝐺𝑇𝑇�𝑚𝑚
𝐺𝐺𝑇𝑇 = 𝐺𝐺𝐼𝐼 + 𝐺𝐺𝐼𝐼𝐼𝐼 + 𝐺𝐺𝐼𝐼𝐼𝐼𝐼𝐼 . (1)
To study this phenomenon, Rebière and Gamby decomposed the strain energy release rates for different modes of fracture into components depending on the type of crack present; transverse cracks, longitudinal cracks or delamination.11, 12 Pinho et al. determined the intralaminar fracture toughness of carbon/epoxy composites by using the four-point bend and compact tension tests.13, 14 Variations in mode I intralaminar and interlaminar fracture toughness have been observed.15, 16 Fiber bridging may occur in interlaminar failure resulting in higher strain energy release rates, whereas for intralaminar fracture the failure path navigates between fibers.
The vast majority of loading conditions on composite materials, however, involve mixed-mode loading. Even when global single-mode loading is applied to a composite, such as double-cantilevered beam test, localized fiber/matrix interactions experience mixed-mode loading. Mixed-mode bending (MMB) has been applied globally to composites to ascertain the mode I and mode II delamination strain energy release rates.10, 17 The present authors have investigated localized mixed-mode fracture for single- and mixed-mode loading of woven composites as well.18 For curved structures, such as composite tubes under lateral compression, the constituent components can be expected to experience mixed-mode loading.

5
EXPERIMENTAL TEST TEST SETUP
For composites, fracture mechanisms can have significant dependence on layer
construction and orientation. With mixed-mode loading and different strain energy release rates depending on fiber orientation, different types of loading can produce drastically different failure responses. For example, composite tubes that are made with alternating UD composite layers will fail differently than will woven composites under the same loading condition. Moreover, failure modes can change within a single-composite construction, depending on the layer properties impacted by the crack front. To demonstrate the different failures, lateral compression was performed on UD carbon fiber/epoxy composite tubes composed of axial 0° and circumferential 90° direction layers.
A cylinder was subjected to lateral compression between two flat plates until primary failure (see figure 3). The test was performed in an Instron machine with a 1000-lb load cell at a rate of 0.01 inch per minute (0.25 mm/min). The loading rate was selected to represent a static load test where inertial effects can be neglected. The tested cylinders, produced by ACP Composites (Livermore, CA), are standard modulus wrapped UD carbon fibers in an epoxy matrix. The laminate construction consists of two 90° hoop layers and eight 0° longitudinal layers.
Figure 3. Cylinder Specimen and Experimental Test Setup with Assumed Failure Location at the 3 o’clock Position
6
Figure 4 illustrates the layup construction with the hoop-direction layers shaded green. After alternating single-layer fiber orientations at the inner portion, the large, outer longitudinal layer consists of seven consecutive layers in the same direction. Four specimens, approximately 3 inches (76 mm) in length, are cut from the same cylinder. The inner and outer diameters are 0.9 inch (23 mm) and 1 inch (25 mm), respectively. For a cylinder under lateral compression, maximum principal stress concentrations occur at the vertical inner diameter and horizontal outer diameter locations. With longitudinal-oriented fibers on the outermost layer and hoop-oriented fibers on the innermost layer, fracture is expected to initiate on the side of the cylinders at the 3 o’clock or 9 o’clock positions (see figure 3).
Figure 4. Partial Cylinder Specimen Construction
(Hoop layers are shaded green.)

7
TEST RESULTS Failure of the specimens occurs with an audible crack and a sudden dropoff of force.
Closer inspection reveals that the failure initiates in the outer layer on one side of the cylinder, matching the presumed failure location described in figure 3. After failure initiation, the crack propagates radially inward through the matrix until it interacts with the reinforcing fibers of the hoop layer. The path of least resistance then follows along the interlaminar interface between the hoop and longitudinal layers toward the 3 o’clock position. The failure occurs at a consistent position near the 3 o’clock position for each specimen, where the maximum tensile stress acts on the matrix between the fibers. Figure 5 shows a partial view of a failed specimen near the region of interest. A series of enhanced microscopic images of the crack site are concatenated in figure 6 to highlight the crack path. Small defects and delaminations can be seen in the longitudinal layers; however, it is unknown if those defects are a product of the lateral compression or the specimen preparation process.
Figure 5. Failure of Carbon Fiber/Epoxy Cylinder Subjected to Lateral Compression
Figure 6. Enhanced View of Cylinder Failure
(After mode I fracture through the specimen, the crack encounters a reinforcing hoop layer and diverts to a delamination.)
8
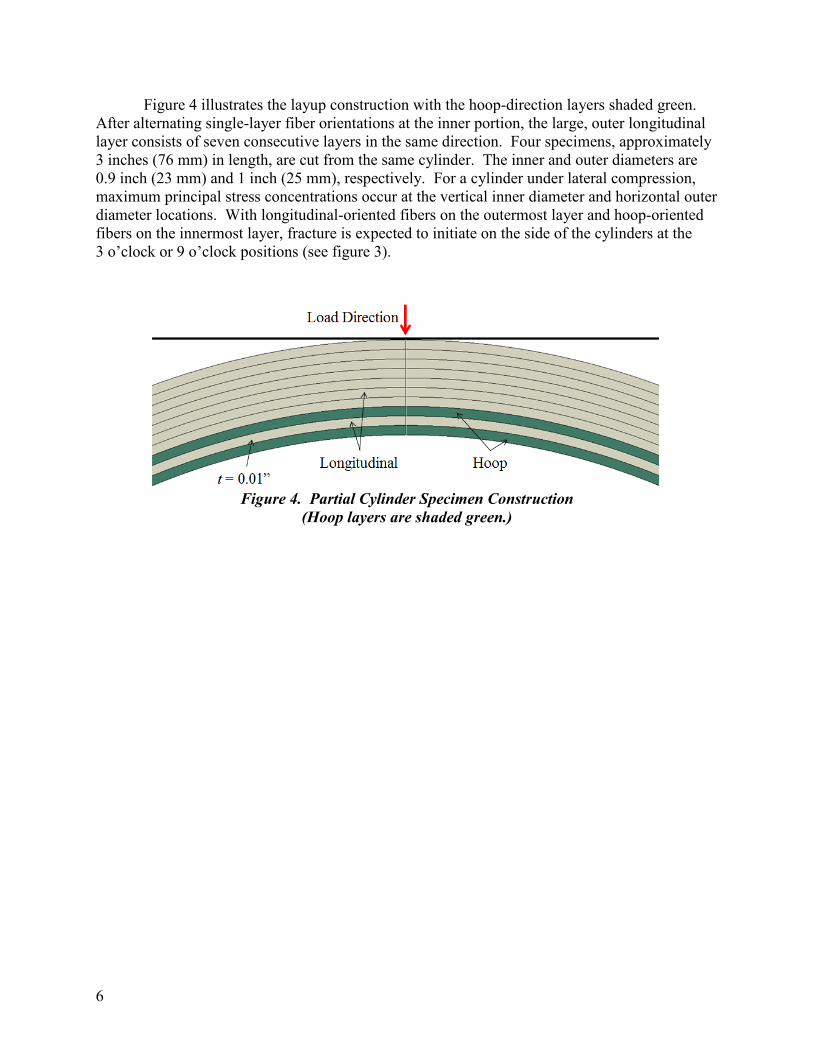
Figure 7 shows the load-versus-displacement data for each of the four test specimens. Each specimen dataset is adjusted to coincide at a consistent point of compression where a linear load/displacement curve begins. The data for tubes 1, 3, and 4 show a consistent linear slope; tube 2 experiences gradual cracks before failing completely. The average slope of force versus displacement for tubes 1, 3, and 4 is 5023 lb/in.; whereas the slope for tube 2 is 4397 lb/in. Although the tests were stopped at this point, further deformations would presumably involve further delamination and eventually failure of the hoop fibers. The variation in failure load can be attributed to the presence of surface defects that act as crack initiation sites.
Figure 7. Force Versus Displacement for Experimental Results
For these composite tubes, the layer construction played a large role in the manner of failure. Longitudinal layers proved to be weak in lateral compression; whereas the hoop layers resisted a propagating crack. The higher failure strength and fracture toughness of the fibers prevented a continued radial crack path; instead, the intralaminar crack was diverted to a delamination between the hoop and longitudinal layers. The longitudinal layers, though weak in lateral compression, are significantly stronger in axial bending. This bending load condition places the fibers in tension and compression, giving support to the tube structure. Just as the longitudinal fibers are weak in lateral compression, the hoop fibers would be weak in axial bending. One method of improving the strength and damage tolerance of these tubes under lateral compression is to add a hoop layer to the outer skin of the tube, providing circumferential strength at the crack initiation point.
0
50
100
150
200
250
300
0 0.02 0.04 0.06 0.08
Forc
e (lb
)
Displacement (in)
Tube 1 Tube 2Tube 3 Tube 4

9
PHYSICS-BASED MODELING FEM
Because of the widespread availability of measurement techniques, experimental testing
of composite materials has outpaced the computational modeling ability of such complicated materials. Recent advancements in computational PBM, such as FEM, are changing the manufacture of FRPs. Comprehensive modeling techniques can significantly reduce the effort required to build and test future composite structures, reducing cost and time requirements. These analytical results can be compared to experimental testing to further refine existing designs or develop novel systems.
The majority of computational modeling has focused on investigating composites in a large scale, where the composite is assumed to be a homogenous material with averaged mechanical properties. In ordinary static analyses, for which fracture is not a concern, this assumption may be sufficient. For dynamic loading and other analyses that focus on material failure, localized fracture mechanisms must be addressed. Many techniques have been studied in attempting to model damage in composites. Customized damage parameters can be created to initiate failure at certain thresholds.19, 20 Upon reaching the threshold, material properties are changed to reflect the loss of load-carrying capacity of failed elements. Other techniques incorporate fracture into the analyses. Typically, fracture analyses are assessed by implementing an initial crack into the component.21 Crack growth forms along a predetermined path. Numerous studies of quasi-static and dynamic impact of composite tubes have been investigated using various techniques.22-26
Composite materials, however, consist of multiple distinct materials with varying failure mechanisms. Drastically different material responses to impact occur when interactions between the fiber and matrix are accounted for. Segala and Cavallaro have investigated the failure modes of distinct UD fiber/matrix composite systems subjected to ballistic impacts, blast pressures, and mechanical shock with these interactions in mind.27 Even still, most analyses focus on consistent layer properties throughout the component thickness, which neglect the orientation dependence of woven and UD composites. XFEM
While most of the research on the fracture of composite materials has used conventional
FEM techniques, the XFEM offers unique capabilities in modeling fracture. Though standard finite-element analyses require a highly refined mesh near the assumed crack location, XFEM allows cracks to form and propagate along a natural crack path without prior knowledge of its location; moreover, continual re-meshing near the crack front is not required. Eliminating these computationally expensive methods makes modeling fracture using XFEM markedly easier. Widespread research has been conducted implementing XFEM into established finite-element codes.28 Recently, commercial software packages such as Abaqus have included an XFEM capability. With these new abilities, previously impractical simulations involving composite

10
structures can be analyzed quickly and efficiently. In turn, XFEM can be used to validate experimental procedures and predict future test results.
This analysis utilizes the XFEM available in Abaqus. XFEM has been widely used to model fracture in composites under various loading conditions.17, 29-31 An initial investigation of the efficacy of XFEM was previously reported.32 In that report, XFEM and cohesive zone modeling (CZM) were combined to simulate the failure mechanisms of distinct fiber and matrix components in carbon fiber/epoxy tubes under hydrostatic depth pressure. XFEM was shown to adequately identify crack initiation locations and propagate crack growth under further loading.
Within XFEM, fracture of the cylinder is governed by the virtual crack closure technique
(VCCT) under the assumption of linear elastic fracture mechanics (LEFM). In VCCT, the energy absorbed through material fracture is assumed to be equal to the work required to close the crack faces. Krueger documented a large review of fracture toughness characterization for multiple modes of fracture using the VCCT.33 XFEM was originally developed by Belytschko and Black34 and is based on the partition-of-unity method (PUM) developed by Melenk and Babuška.35 In PUM, additional enrichment functions are inserted into the conventional shape functions to account for discontinuities across the crack front. This continuity allows cracks to form and propagate without prior knowledge of the crack location and does not require re-meshing throughout the simulation to maintain a fine mesh near the crack tip. The partition of unity is further described in detail by Belytschko et al.36 The applied enrichment functions introduce additional degrees of freedom to affected elements, allowing the element to undergo transformation while maintaining continuity. In fracture mechanics, the enrichment functions consist of a near-tip asymptotic function, which captures the stress singularity at the crack tip, and a discontinuous function to map the displacement of the crack faces within an element. The enriched shape function is given in equation (2):36
𝑢𝑢ℎ(𝑥𝑥) = ∑ 𝑁𝑁𝐼𝐼∀𝐼𝐼 (𝑥𝑥)𝑢𝑢𝐼𝐼 + ∑ 𝑁𝑁𝐽𝐽𝐽𝐽∈𝑆𝑆𝐻𝐻 (𝑥𝑥) �𝐻𝐻�𝑓𝑓(𝑥𝑥)� − 𝐻𝐻 �𝑓𝑓�𝑥𝑥𝐽𝐽��� 𝑞𝑞𝐽𝐽0
+∑ ∑ 𝑁𝑁𝐾𝐾(𝑥𝑥)𝐾𝐾∈𝑆𝑆𝐶𝐶𝑗𝑗 �Ψ(𝑗𝑗)(𝑥𝑥) −Ψ(𝑗𝑗)(𝑥𝑥𝐾𝐾)�𝑞𝑞𝐾𝐾(𝑗𝑗)
Ψ(𝑗𝑗) . (2)
The first summation term includes the typical finite-element shape function, where NI are the standard shape functions and uI are nodal degrees of freedom. The second summation term adds additional enrichments to the elements in the set SH encompassing the crack tip. H is the Heaviside function and 𝑞𝑞𝐽𝐽0 are enrichment coefficients. The third summation term adds enrichments to the elements cut by the crack, excluding the elements inherent in the second term and are included in the set SC. The term 𝛹𝛹(𝑗𝑗) is a set of enrichment functions near the crack tip. H is defined in equation (3) as:
𝐻𝐻(𝑓𝑓) = �1, 𝑓𝑓 > 00, otherwise . (3)

11
Because the crack only affects elements through which it passes, only the connecting nodes gain the additional degrees of freedom. Limiting the enrichment function to nodes of interest maximizes the efficiency of instituting the additional degrees of freedom. Figure 8 shows a schematic of how the nodes are assigned around a given crack.
Figure 8. Crack Running Through a Set of Elements with Enriched Functions
3-D FINITE ELEMENT MODEL OVERVIEW
In order to properly compare failure mechanisms in the analysis with those of the
experimental specimens, a 3-D finite-element model was created in Abaqus to represent the test cylinders. Eight node brick elements (C3D8R) were utilized to construct the solid model. The cylinder has a 0.9-inch (23 mm) inner diameter, a 1.0-inch (25 mm) outer diameter, and is 0.02 inch (0.5 mm) in depth. Geometrical nonlinearities are accounted for in the static analysis as well. To reduce the number of elements in the model, a half-symmetry boundary condition is implemented. The half-symmetry boundary condition is imposed on the vertical midplane due to the crack location at the 3 o’clock position. A long cylinder is simulated by applying symmetry boundary conditions on each z-direction face. Plane strain is not applicable to this analysis because of the different modulus of elasticity in the z-direction for each layer. To match the test specimen construction, eight layers are oriented in the longitudinal 0° direction and the remaining two layers are oriented in the 90° hoop direction. The cylinder wall thickness is 0.1 inch (2.5 mm), with each layer representing a 0.01-inch (0.25 mm) thickness. Figure 9 shows a side view of the model and load condition. The hoop layers are depicted in orange, and the longitudinal layers are green.

12
Two rigid surfaces represent the flat plates that compress the test specimen. As in the experimental procedure, the bottom plate is held fixed while the top plate moves at a prescribed vertical displacement. With an assumed crack location that is based on the experimental results, only a subset of elements in the model must include the XFEM enrichment functions.
Figure 9. Cylinder Model Construction with Hoop (Orange) and Longitudinal (Green) Oriented Fibers; XFEM-Enriched Elements Highlighted in Red
MATERIAL FRACTURE Each layer is modeled as a homogenized material using a linear elastic orthotropic constitutive behavior. The fibers are oriented in the local 1-direction; whereas the fibers vary with respect to the global 1-direction depending on the layer orientation. The hoop layers are oriented so that the fibers provide support to the tube circumferentially. This direction corresponds to the global θ-direction of the cylindrical coordinate system. The longitudinal fibers provide strength in the global z-direction, which is not subjected to significant deformation in this analysis. Table 1 shows the local material properties used for both the hoop and longitudinal layers. Although the detailed material properties are not available for the tested specimens from ACP Composites, the applied values correlate to typical carbon/epoxy systems.

13
Table 1. Constant Material Properties for the Composite Layers
E11 ksi
(GPa)
E22 ksi
(GPa)
E33 ksi
(GPa)
G12 ksi
(GPa)
G13 ksi
(GPa)
G23 ksi
(GPa) ν12 ν13 ν23
19000 (131)
1300 (9)
1300 (9)
750 (5.2)
750 (5.2)
750 (5.2) 0.33 0.33 0.25
Damage of the layers is controlled by a maximum principal stress condition. The material undergoes fracture above the prescribed maximum principal stress σps. For the hoop-direction layers, it is assumed that mode I crack growth would result in fiber fracture. For the longitudinal layers, the crack would propagate through the matrix in between the fibers. As such, the hoop layers are significantly more resistant to fracture than are the longitudinal layers.
The Benzeggagh-Kenane criterion is used to calculate GC for each layer. Once the total strain energy rate GT exceeds GC, fracture is assumed to propagate. Table 2 details the strain energy release rates and principal failure stresses for the hoop and longitudinal layers, which are taken from literature.4, 5
Table 2. Fracture Toughness Values and Failure Stresses for the Hoop and Longitudinal Layers
Property GIC
lb/in. (kN/m)
GIIC lb/in.
(kN/m)
GIIIC lb/in.
(kN/m)
σps ksi
(MPa)
Hoop 140 (24.5)
140 (24.5)
1 (0.175)
15 (103)
Longitudinal 1 (0.175)
1 (0.175)
1 (0.175)
350 (2413)
Using XFEM enables the modeling of fracture for both the hoop and longitudinal layers without modifying the parameters of the initial model. Because the fibers are significantly stronger than the matrix and have a higher fracture toughness, the longitudinal layers are expected to fail before the hoop layers. RESULTS
Before fracturing, the cylinder experiences the maximum principal stress in the innermost
hoop layer near the plates (see figure 10). This location is a combination of tensile strain as the cylinder bends to a flatter profile and a high modulus of elasticity for the hoop-oriented fibers. The tensile state of stress is similar to that for a curved beam in bending. The stress at this location, however, does not reach the considerably higher principal failure stress of the fibers, and fracture is not achieved.

14
Figure 10. Maximum Principal Stress Immediately Before Fracture Initiation (ksi)
The other location of high stress is at the outermost layer of the cylinder at the 3 o’clock position. At the location of interest, the highest principal stress occurs in the outer (longitudinal) layer. Because of the lower modulus of elasticity in the circumferential direction, the longitudinal layers experience lower stress than do the reinforcing hoop layers for the resultant bending strain. At the region of interest, however, the inner hoop layers are in compression and the outer layers are in tension. Figure 11 shows the maximum principal stress contour for the cylinder immediately prior to fracture initiation near the 3 o’clock position.
Figure 11. Maximum Principal Stress Immediately Before Fracture Initiation at Region of Interest (ksi)

15
The outermost layer of the matrix reaches its failure threshold σps before the vertical inner hoop layer reaches its higher failure threshold, inducing crack initiation on the outer edge. The crack is first directed inward and, with further loading, propagates radially inward as shown in figure 12. No additional cracks are formed in the longitudinal layers, and the maximum principal stress in the hoop layers remains below σps. At a displacement of 0.125 inch (3.18 mm), matching the failure displacement in the experimental test, the crack has propagated only partially through the cylinder.
Figure 12. Partially Propagated Crack EFFECTS OF FRACTURE PARAMETERS
For a plate displacement that causes a large crack and delamination to form in the test
specimens, the computational analysis exhibits only partial crack propagation. One possible explanation for this discrepancy is an overestimation of the strain energy release rate values. A drawback of implementing a half symmetry boundary condition is that it assumes that a crack forms on both sides of the cylinder—which contradicts the experimental results. The additional strain energy introduced by modeling a full cylinder under lateral compression could lead to further strain energy release via crack propagation. Exploring this possible energy deficiency requires reducing the strain energy release rates proportionally in both the hoop and longitudinal materials. Varying the critical strain energy release rate values provides a method for investigating crack growth beyond what the initial model parameters can exhibit. At a lower GC, the crack requires less energy to grow. Another theory for the decreased crack growth is the lack of an initial crack site. Realistically, composite materials exhibit numerous defects and surface deformations that are eligible sites for crack initiation. In this finite-element model, the energy that is needed to form a crack must first be achieved before crack propagation can commence.
To facilitate the crack growth, an initial crack is placed in the cylinder edge at the previously determined crack location (see figure 13). Instituting an initial crack removes the requirement of reaching σps to form a crack. The energy that was originally applied to forming the initial crack is converted to crack propagation energy instead. Additionally, to exaggerate the crack growth response, the GC values are reduced to 1% of the values listed in table 1.

16
Figure 13. Initial Crack Added to Model
With these modifications included in the model, the crack propagates farther for a given deformation and achieves complete penetration. Figure 14 shows the crack length after a plate displacement of 0.125 inch (3.18 mm), matching the previous analysis and experimental test. As the crack approaches the reinforcing hoop layer, it begins to turn before reverting to its radial path. This crack path is somewhat similar to that in the experimental results, where the intralaminar matrix crack turns to a delamination between the hoop and longitudinal layer. The delamination fracture toughness is lower than the intralaminar fracture toughness of the hoop layers. In this model, however, the difference in fracture toughness may not be sufficient to substantially change the maximum tangential stress direction in which the crack propagates. The crack then reverts back to a radial crack and propagates through the hoop layers. One possible solution to this modeling delamination as a separate phenomenon is to incorporate a cohesive strength between each constitutive layer, which, in conjunction with the strain energy release rates available in this analysis, would provide an additional method of failure.
Figure 14. Failure of Cylinder with Strain Energy Release Rates at 1% of Values Listed in Table 1

17
CONCLUSION
In this report, the extended finite-element method (XFEM) was incorporated into a 3-D finite-element model to simulate lateral compression of 0°/90° unidirectional carbon fiber/epoxy cylinders. The results were compared with failure modes observed in representative experimental tests. The finite-element model, utilizing XFEM, replicated the test parameters and loading procedure by instituting a prescribed compression between two flat plates. Orientation-dependent material properties were used for each of the 10 distinct composite layers. Different fracture criteria were applied to the longitudinal and hoop-oriented layers based on the respective failure mechanisms: fiber fracture for the 90° hoop-oriented layers and intralaminar matrix fracture for the 0° longitudinal-oriented layers.
Experimental failure initially occurred in the outermost longitudinal layer of the cylinder and propagated through the matrix radially inward. Upon reaching a hoop-oriented layer, the crack path turned to a delamination between the hoop and longitudinal layers. In the computational model, the crack formed in the outermost layer as well and near the same location as that of the experimental test. The crack, however, did not fully propagate through the composite tube as was seen in the experimental specimens. An initial crack was instituted into the model to represent surface defects in the composite specimens. Furthermore, the fracture parameters were decreased to facilitate crack growth. When these changes were instituted, the crack path more closely reflected what was observed in the experimental specimens.
This research demonstrated the ability to compare failure in composite materials using XFEM with experimental results—thus improving modeling efficacy, diminishing the need for build-test-build methodology, and potentially reducing cost and time requirements. Further work must be done to accurately account for material defects and the effect of localized discontinuities on the fracture toughness of unidirectional composite laminates. The goal is that, with more accurate modeling practices, computational analysis of composite fracturing can reduce the current iterative build-test-build process.

18
REFERENCES 1. P. Davies, L. Riou, F. Mazeas, P. Warnier, “Thermoplastic Composite Cylinders for Underwater Applications,” Journal of Thermoplastic Composite Materials, vol. 18, no. 5, pp. 417–443, 2005. 2. P. B. Gning, M. Tarfaoui, F. Collombet, L. Riou, P. Davies, “Damage Development in Thick Composite Tubes Under Impact Loading and Influence on Implosion Pressure: Experimental Observations,” Composites Part B: Engineering, vol. 36, pp. 306–318, 2005. 3. S. Abrate, “Impact of Laminated Composite Materials,” Applied Mechanics Reviews, vol. 44, no. 4, pp. 155–190, 1991. 4. G. Rathnaweera, Y. Durandet, D. Ruan, S. Kinoshita, “Characterizing the Material Properties of a Tube from a Lateral Compression Test,” International Journal of Protective Structures, vol. 2, no. 4, pp. 465–476, 2011. 5. E. F. Abdewi, “Experimental Testing of Composite Tubes with Different Corrugation Profile Subjected to Lateral Compression Load,” International Journal of Mechanical, Aerospace, Industrial, Mechatronic and Manufacturing Engineering, vol. 7, no. 2, pp. 79–82, 2013. 6. P. V. Cavallaro, “Effects of Weave Styles and Crimp Gradients in Woven Kevlar/Epoxy Composites,” Experimental Mechanics, 2015. 7. M. S. S. Prasad, C. S. Venkatesha, T. Jayaraju, “Experimental Methods of Determining Fracture Toughness of Fiber Reinforced Polymer Composites Under Various Loading Conditions,” Journal of Minerals & Materials Characterization & Engineering, vol. 10, no. 13, pp. 1263–1275, 2011. 8. L. Mishnaevsky Jr. and P. Brøndsted, 2009, “Micromechanical Modeling of Damage and Fracture of Unidirectional Fiber Reinforced Composites: A Review,” Computational Materials Science, vol. 44. no. 4, pp. 1351–1359, 2009. 9. S. T. Pinho, L. Iannucci, P. Robinson, “Physically-Based Failure Models and Criteria for Laminated Fibre-Reinforced Composites with Emphasis on Fibre Kinking: Part I: Development,” Composites Part A: Applied Science and Manufacturing, vol. 37, no. 1, pp. 63–73, 2006. 10. M. Benzeggagh, M. Kenane, “Measurement of Mixed-Mode Delamination Fracture Toughness of Unidirectional Glass/Epoxy Composites with Mixed-Mode Bending Apparatus,” Composites Science and Technology, vol. 56, pp. 439–449, 1996.

19
REFERENCES (Cont’d) 11. J.-L Rebière and D. Gamby, “A Decomposition of the Strain Energy Release Rate Associated with the Initiation of Transverse Cracking, Longitudinal Cracking and Delamination in Cross-Ply Laminates,” Composite Structures, vol. 84, pp. 186–197, 2008. 12. J.-L. Rebière and D. Gamby, “Strain Energy Release Rate Analyses of Matrix Micro Cracking in Composite Cross-Ply Laminates,” Materials Sciences and Applications, vol. 2, pp. 537–545, 2011. 13. S. T. Pinho, P. Robinson, L. Iannucci, “Fracture Toughness of the Tensile and Compressive Fibre Failure Modes in Laminated Composites,” Composites Science and Technology, vol. 66, no. 13, pp. 2069–2079, 2005. 14. S. T. Pinho, P. Robinson, L. Iannucci, “Developing a Four Point Bend Specimen to Measure the Mode I Intralaminar Fracture Toughness of Unidirectional Laminated Composites,” Composites Science and Technology, vol. 69, no. 7, pp. 1303–1309, 2009. 15. N. S. Choi, “Rate Effects on the Delamination Fracture of Multidirectional Carbon- Fiber/Epoxy Composites Under Mode I Loading,” Journal of Materials Science, vol. 36, pp. 2257–2270, 2001. 16. M. W. Czabaj, J. G. Ratcliffe, “Comparison of Intralaminar and Interlaminar Mode-I Fracture Toughness of Unidirectional IM7/8552 Graphite/Epoxy Composite,” 2012. 17. D. Motamedi and A. S. Milani, “Mixed-Mode Fracture Analysis of Delamination Using Non-Linear Extended Finite Element Method,” International Conference on Composite Materials, vol. 19, 2017. 18. P. V. Cavallaro and A. Hulton, “Effects of Crimped Fiber Paths on Mixed Mode Delamination Behaviors in Woven Fabric Composites,” American Society of Mechanical Engineers International Mechanical Engineering Congress ASME IMECE2016-65646, (accepted for publication, 2016). 19. B. G. Falzon and P. Apruzzese, “Numerical Analysis of Intralaminar Failure Mechanisms in Composite Structures. Part I: FE Implementation,” Composite Structures, vol. 93, pp. 1039–1046, 2011. 20. J. P. Parmigiani, N. Atanasov, I. Hyder, “Failure of Notched Laminates under Out-of- Plane Bending, Phase VII Update,” Proceedings of the 2014 FAA Joint Advanced Materials and Structures Technical Review Meeting, Seattle, WA, 2014. 21. H. S. M. Waseem and N. K. Kumar, “Finite Element Modeling for Delamination Analysis of Double Cantilever Beam Specimen,” SSRG International Journal of Mechanical Engineering, vol. 1, no. 5, pp. 27–33, 2014.

20
REFERENCES (Cont’d) 22. L. Pickett Jr., “A Numerical Approach to Model and Predict the Energy Absorption and Crush Mechanics within a Long-Fiber Composite Crush Tube,” Retrospective Theses and Dissertations, vol. 1, p. 1766, 2005. 23. H. Hadavinia and H., Ghasemnejad, “Effects of Mode-I and Mode-II Interlaminar Fracture Toughness on the Energy Absorption of CFRP Twill/Weave Composite Box Sections, Composite Structures, vol. 89, pp. 303–314, 2009. 24. S. T. Pinho, P. P. Camanho, M. F. de Moura, “Numerical Simulation of the Crushing Process of Composite Materials,” International Journal of Crashworthiness, vol. 9, no. 3, pp. 263–276, 2004. 25. N. R. Janapala, Z. Wu, F.-K Chang, R. K. Goldberg, “Lateral Crashing of Tri-Axially Braided Composite Tubes,” Proceedings of Earth and Space 2008 Conference, American Society of Civil Engineers ASCE, 2008. 26. P. P. Camanho, C. G. Dávila, D. R. Ambur, 2001, “Numerical Simulation of Delamination Growth in Composite Materials,” NASA/TP-2001-211041, National Areonautics and Space Administration, Hampton, VA, 2001. 27. D. Segala and P. V. Cavallaro, “Energy Absorption Mechanisms in Unidirectional Composites Subjected to Dynamic Loading Events,” NUWC-NPT Technical Report 12,090, Naval Undersea Warfare Center Division, Newport, RI, 2012. 28. D. Motamedi, “Nonlinear XFEM Modeling of Delamination in Fiber Reinforced Composites Considering Uncertain Fracture Properties and Effect of Fiber Bridging,” University of British Columbia Dissertation, Okanagan, 2013. 29. M. Levén and D. Rickert, “Stationary 3D Crack Analysis with Abaqus XFEM for Integrity Assessment of Subsea Equipment,” Chalmers University of Technology, Thesis 35, Gӧteborg, 2012. 30. D. M. Grogan, S. B. Leen, C. M. Ó Brádaigh, “An XFEM-Based Methodology for Fatigue Delamination and Permeability of Composites,” Composite Structures, vol. 107, pp. 205–218, 2014. 31. D. Motamedi and A. S. Milani, “3D Nonlinear XFEM Simulation of Delamination in Unidirectional Composite Laminates: A Sensitivity Analysis of Modeling Parameters,” Open Journal of Composite Materials, vol. 3, pp. 113–126, 2013. 32. A. Hulton, “Modeling Unidirectional Composite Laminates Using XFEM,” NUWC-NPT Technical Report 12,178, Naval Undersea Warfare Center Division, Newport, RI, 2015.

21 (22 blank)
REFERENCES (Cont’d) 33. R. Krueger, “The Virtual Crack Closure Technique: History, Approach and Applications,” NASA/Contractor Report-2002-211628, National Institute of Aerospace, Hampton, VA, 2002. 34. T. Belytschko and T. Black, “Elastic Crack Growth in Finite Elements with Minimal Remeshing,” International Journal for Numerical Methods in Engineering, vol. 45, pp. 601–620, 1999. 35. J. M. Melenk and I. Babuška, “The Partition of Unity Finite Element Method: Basic Theory and Applications,” Computer Methods in Applied Mechanics and Engineering, vol. 39, pp. 289–314, 1996. 36. T. Belytschko, R. Gracie, G. Ventura, “A Review of Extended/Generalized Finite Element Methods for Material Modeling,” Modelling and Simulation in Materials Science and Engineering, vol. 17, pp. 1–24, 2009.


INITIAL DISTRIBUTION LIST
Addressee No. of Copies Office of Naval Research, Arlington, VA 1 (ONR-331 (R. Barsoum)) Naval Surface Warfare Center, Carderock Division, W. Bethesda, MD 3 (P. Dudt, R. Crane, E. Rasmussen) Naval Surface Warfare Center, Dahlgren Division, Dahlgren, VA 2 (S. Bartyczak, W. Mock) U.S. Army Natick Soldier Research, Development, and Engineering Center, 2 Natick, MA (M. Jee, G. Proulx) Defense Technical Information Center 1 Center for Naval Analyses 1 City College of the City University of New York, NY (A. Sadegh) 1 University of British Columbia, Kelowna, BC, Canada (A. Milani) 1 JPS Composite Materials, Anderson SC (M. Salama) 1 Core Composites, Bristol, RI (R. O’Meara) 1