Embed Size (px)
Citation preview
RESEARCH ARTICLE Open Access
Nutritional quality of the food choices ofCanadian childrenSalma Hack1, Mahsa Jessri2 and Mary R. L’Abbé1*
Abstract
Background: The release of the Canadian Community Health Survey (CCHS), Nutrition 2015 provides a uniqueopportunity since CCHS 2004 to investigate food choices of Canadian children and adolescents at a national level.
Objective: This study examined the quality and quantity of food choices of children ages 2–8 years andadolescents 9–18 years, using Health Canada’s Surveillance Tool Tier System 2014. It is hypothesized that Canadianchildren and adolescents are consuming diets poor in nutritional quality based on evidence from the last nationalnutrition survey in 2004.
Design: Intakes from CCHS 2015, 24-h dietary recall were categorized into Health Canada’s Tiers 1–4, based onCNF/CFG classification system and thresholds for nutrients to limit i.e., total fat, saturated fats, sugars, and sodium toassess quality of food choices. Additionally, dietary intakes were grouped according to Canada’s 2007 food guideservings as the 2019 food guide was not available.
Results: Majority of foods reported by children 2–18 years were categorized as Tier 2 and Tier 3 foods. Investigationof energy contributions from the Tier 4 and “other foods” represented 21–25% of daily calorie intake and of thesefoods, high fat and/or high sugar foods contributed majority of daily calories to these categories.
Conclusions: This study showed Canadian children 2–18 years are consuming diets high in nutrientsrecommended to limit. Evidence from this study provides a unique opportunity to improve the nutritional qualityof foods, and the food choices of children.
Keywords: The Canadian Community Health Survey, Nutrition 2015, Health Canada’s Surveillance Tool, Tier System,Canada’s food guide, Dietary intakes, Diet quality, Nutrition policy
IntroductionAdequate nutrition and a healthy diet throughout child-hood is critical to minimize risks for the development ofnon-communicable diseases (NCDs) such as, obesity,type- 2 diabetes, and cardiovascular diseases [1, 2]. How-ever, for many Canadians, making the healthy choice hasbecome difficult. Canada’s food environment has chan-ged over the last decade where the availability of con-venient and processed foods high in sugar, sodium, total
fats, and saturated fats have become increasingly abun-dant encouraging an obesogenic diet [1, 3, 4]. WithinCanada, obesity has been recognized as an epidemic af-fecting not only adults but children. Children who haveunhealthy weights are predisposed to having high bloodpressure, increased risk for type-2 diabetes, and add-itional physical health problems [3]. According to the2015 Canadian Community Health Survey (CCHS) Nu-trition, measured body mass index (BMI) for childrenages 5–17 years indicated 19% of children were over-weight and 12% of children were obese according to theWorld Health Organization classification system [4, 5].
© The Author(s). 2021 Open Access This article is licensed under a Creative Commons Attribution 4.0 International License,which permits use, sharing, adaptation, distribution and reproduction in any medium or format, as long as you giveappropriate credit to the original author(s) and the source, provide a link to the Creative Commons licence, and indicate ifchanges were made. The images or other third party material in this article are included in the article's Creative Commonslicence, unless indicated otherwise in a credit line to the material. If material is not included in the article's Creative Commonslicence and your intended use is not permitted by statutory regulation or exceeds the permitted use, you will need to obtainpermission directly from the copyright holder. To view a copy of this licence, visit http://creativecommons.org/licenses/by/4.0/.The Creative Commons Public Domain Dedication waiver (http://creativecommons.org/publicdomain/zero/1.0/) applies to thedata made available in this article, unless otherwise stated in a credit line to the data.
* Correspondence: [email protected] of Nutritional Sciences, Temerty Faculty of Medicine, Universityof Toronto, Toronto M5S 1A8, CanadaFull list of author information is available at the end of the article
Hack et al. BMC Nutrition (2021) 7:16 https://doi.org/10.1186/s40795-021-00422-6

To improve harmful dietary behaviours of Canadians,Canada’s Healthy Eating Strategy was released in 2016[6]. This strategy committed to restricting marketingand advertising of foods poor in nutritional quality tochildren, improve nutrition labeling, implementmandatory Front-of-Package labelling, and increase nu-trition knowledge and awareness [6]. Although imple-mentation of many of these goals are still underway,Health Canada recently released the 2019 Canada’s foodguide to help Canadians improve dietary habits [7].To assess dietary intakes of Canadians, Health Canada
developed a nutrient profiling tool i.e., the HealthCanada Surveillance Tool Tier system (HCST) in 2014to evaluate the nutritional quality of foods based onupper and lower thresholds for nutrients of public healthconcern i.e., sodium, total fat, saturated fats, and sugars[8, 9]. These nutrients have been emphasized to beavoided not only in dietary intakes according to Cana-da’s new 2019 food guide, but globally by the WorldHealth Organization (WHO) [1, 7]. Recommendationsto decrease salt intake by 30% and reduce saturated fatand sugar intake to less than 10% of daily energy havebeen encouraged globally by the WHO [1, 10].Current evidence investigating the quality of foods
choices available to Canadians and the foods Canadianschoose to consume based on the most up-to-date nutri-tion information available i.e., CCHS 2015 is lackingwithin Canada. This study aimed to examine the nutri-tional quality of foods consumed by Canadian childrenand adolescents 2–18 years according to the HCST nu-trient profiling model i.e., foods to choose most often,foods to choose few of, and foods recommended to limit[8, 9]. The results of this study can provide the evidenceneeded to support recommendations to improve thequality of foods available to children and help informnutrition policies aimed to reduce the prevalence ofNCDs.
MethodsExperimental designThe CCHS 2015 is a cross-sectional survey which sam-pled the Canadian population during January 2, 2015 toDecember 31, 2015 [11]. The survey design includedsampling individuals according to 12 age-sex DietaryReference Intake (DRI) categories. CCHS 2015 was avoluntary 24-h dietary recall survey conducted using amodified 5 - step automated multi-pass method(AMPM), adapted for the Canadian population, from theUnited States Department for Agriculture. Respondentscompleted a 24-h dietary recall, and provided additionalinformation on demographic and lifestyle characteristics.The total sample size of the survey was n = 20, 487 indi-viduals with a 61.6% response rate [11]. Following the24-h dietary recall, 35% of respondents were asked to
complete a second day recall over the phone within 3–10 days of the first interview occurring on all days of theweek.
SubjectsIndividuals sampled in the survey were ages > 1 year res-iding in Canada’s 10 provinces, excluding individuals liv-ing in: territories, reserves, Aboriginal settlements, full-time members of the Canadian Armed Force, and insti-tutionalized individuals [11]. Results from pregnant andbreastfeeding women, infants, and individuals with in-valid dietary recalls (as defined by Statistics Canada)were excluded from this study. The nutritional quality offoods consumed from single 24-h dietary recalls for boysand girls between 2 to 18 years (n = 4642) were investi-gated in this study.
Classifying foods in the 24-h dietary recall according toHCSTFoods reported in the 24-h dietary recall were catego-rized and the nutritional composition was determinedusing the 2015 Canadian Nutrient File (CNF) which con-tained information for 5690 unique Canadian foodscommonly consumed [11, 12]. Staff from Health Canadaand Public Health Agency of Canada developed theCNF/CFG classification, enabling linkage of CNF foodcodes to four CFG food groups and 21 subgroups ac-cording to Eating well with Canada’s food guide 2007[12, 13]. Foods in the CCHS 2015 were categorized ac-cording to Canada’s Food Guide subgroups, and placedinto Tiers according to established thresholds for so-dium, saturated fats, total fats, and sugars [8, 9, 13].These thresholds were derived from thresholds used fornutrient content claims, DRI, and Nutrition Standardsfor Foods in Schools [8].Exact methods used by Health Canada to categorize
foods into Tier groups are described elsewhere [8, 9].Briefly, lower thresholds for fats and sodium contentwere based on nutrient content claims for amountscommonly consumed in one sitting, termed the Refer-ence Amount (RA) [8]. Foods categorized as Tier 1 mustnot exceed any of the lower thresholds: ≤ 3 g/ RA fat,≤140 mg/RA sodium and, ≤ 6 g/RA sugar [8]. As there isno daily value (DV) for sugar, upper and lower thresh-olds for sugar were determined from the recommenda-tion by the Institute of Medicine (IOM) [8]. The 15%DV of sodium (> 360 mg/RA), total fats (> 10 g/RA) andsaturated fats (> 2 g/RA) and for sugars (> 19 g) were setas the upper thresholds [8]. Tier 2 foods could exceedone or two lower thresholds but no upper thresholds.Tier 3 foods are foods with nutrient contents above alllower thresholds (i.e., sodium, sugar, and total fat), andmay exceed one upper threshold. Tier 4 represents foodsthat exceed ≥2 upper thresholds, however special
Hack et al. BMC Nutrition (2021) 7:16 Page 2 of 10

consideration was given to foods belonging to the Meatand Alternative, and Milk and Alternative categories asthey naturally have higher saturated fat content [8].Additional adjustments for foods based on directionalstatements from CFG can be found in HCST [8].Using the CNF/CFG classification system, 9 groups of
foods could not be classified according to Tiers 1–4 [8].Of these groups, 5 categories of foods were grouped as“other foods” representing foods not recommended inthe 2007 Canada’s food guide. These groups are: 1) satu-rated and/or trans-fats and oils; 2) high-fat and highsugar foods such as, candies, chocolates, and syrups; 3)high calorie beverages ≥40 kcal/100 g; 4) low calorie bev-erages < 40 kcal/100 g (which exclude water); and 5) al-coholic beverages [8, 13].
StatisticsAnalyses were completed using Statistical Analysis Soft-ware (SAS) version 9.4 (SAS Institute Inc., Cary, NC,USA). Bootstrap balanced repeated replication with 500repeats was used to estimate population parameters i.e.,confidence intervals, standard errors, and coefficients ofvariation. Survey weights provided with the master fileswere used for all individuals 2 to 18 years, to ensuresamples from CCHS 2015 remained nationally represen-tative [11]. Dietary intakes were assessed according toDRI age-sex groupings and adjusted for additional life-style measures, which included smoking, physical activityand Body Mass Index (BMI). BMI was determined usingmeasured height and weight, and cut-offs for BMIcategorization were derived based on WHO BMI growthcurves [11]. PROC SURVEYREG and PROC SURVEY-LOGISTIC were used for continuous (e.g., servings fromfruit and vegetables) and for categorical (e.g., lifestylemeasures) analyses, respectively, adjusting for energy in-take, age, and sex where appropriate. Results with two-tailed p-value ≤0.05 were reported as statisticallysignificant.
Identification of implausible reportersStudies using the CCHS 2015 have recognized a large per-centage of under-reporting [14, 15]. Under-reporting oc-curs most often with many socially undesirable foods orthose high in fat and sugars [14–16]. Following previouspublications, this study identified individuals as under-reporters, plausible reporters, and over-reporters, basedon the comparison of their estimated energy requirement(EER) to total energy expenditure (EER: TEE) [11, 16, 17].The Institute of Medicine (IOM) developed the EER equa-tion which took into consideration age, sex, BMI andphysical activity [18]. For children < 12 years, under-reporters were classified as having a reported energy in-take (EI) < 74% of the EER, and over-reporters > 135% oftheir EER [17]. For children ≥12 years, under-reporters
were classified as having an EER less than 70% of whatwas reported and over-reporters were having an EI over142% of the EER [16]. If children had no reported physicalactivity level (PAL) they were categorized as “low active”(< 14 years) and “sedentary” (> 14 years), based on findingsby Garriguet et al. [11, 15, 17].
ApprovalsAll researchers obtained Reliability Status as outlined inthe Policy on Government Security and completed a se-curity check by the Royal Ontario Mounted Police, as re-quired by the Statistics Canada Act. Data analyses werecompleted at the Toronto, Ontario Research Data Centre(RDC) of Statistics Canada in accordance with surveyguidelines and procedures. To protect the confidentialityof respondents, RDC Analysts reviewed and released thedata presented in this manuscript, to ensure compliancewith guidelines developed by Statistics Canada. The datapresented in this study was completed exclusively as sec-ondary analyses and all information provided was de-identified and did not require institutional REB approval.
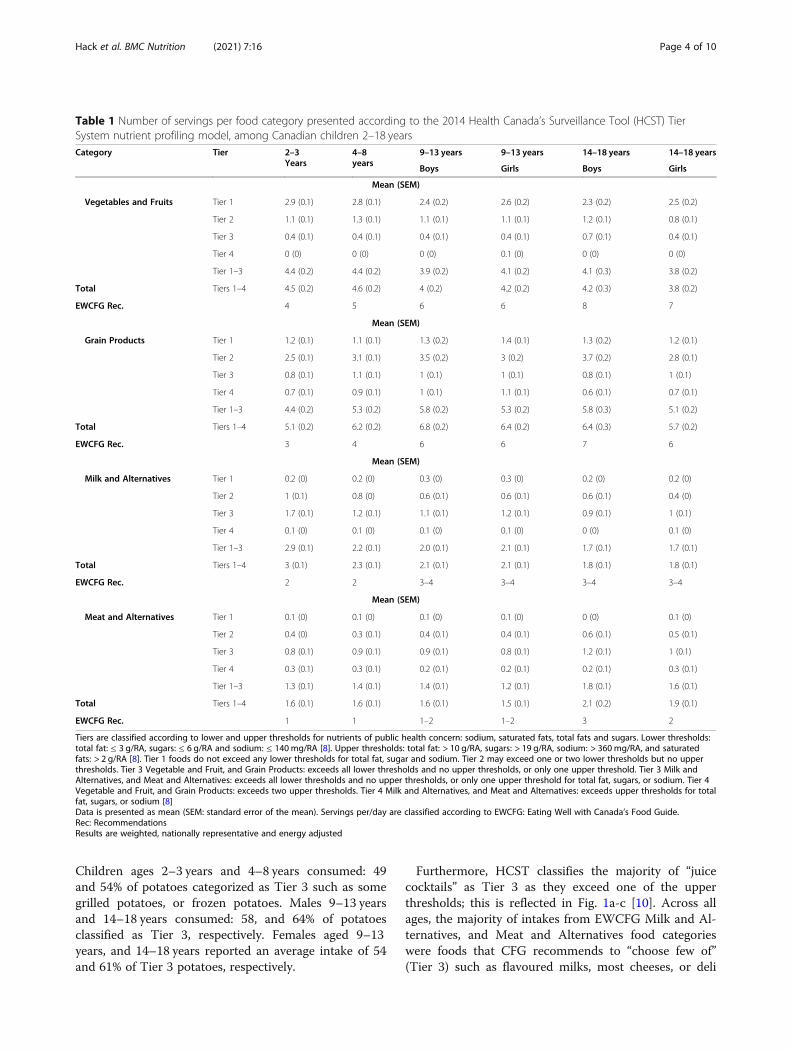
ResultsThis study included n = 4642 children ≤18 years of age.Investigation of adherence to EWCFG in Table 1, re-vealed that the intake of Vegetables and Fruits wasmainly from Tier 1 foods, with no reported intakes fromTier 4 foods. Children ages 2–3 years, and 4–8 years,were consuming more than the required number of rec-ommended EWCFG servings for all four CFG food cat-egories, with the exception of Vegetables and Fruits forchildren ages 4–8 years. Children 4–8 years to 14–18years were not meeting the minimum recommendednumber of CFG servings for Vegetable and Fruits. Forall DRI categories, the majority of CFG servings/daywere coming from the Grain Products [mean (SEM)][5.1(0.2) - 6.8(0.2)], specifically Tier 2 grains [2.5(0.1) –3.7(0.2)] followed by Vegetables and Fruits [3.8(10.2) -4.5(0.2)] specifically Tier 1 [2.3(0.2) – 2.9 (0.1)], Milkand Alternatives [1.8(0.1) - 3(0.11)] specifically Tier 3[0.9(0.1) – 1.7 (0.1)], and Meat and Alternatives[1.5(0.11) - 2.1(0.2)] specifically Tier 3 [0.8(0.1) –1.2(0.1)]. Furthermore, as age increased, for both boysand girls, the number of food guide servings from Meatand Alternatives increased, whereas with Milk and Alter-natives the opposite trend was seen, as older individualswere consuming fewer CFG servings.Analysis of intakes according to the HCST Tier system
(Fig. 1a-c) showed that across all age groups, almost100% of intakes from Vegetables and Fruits, with the ex-ception of potatoes and vegetable cocktails were fromTier 1 and Tier 2 foods. Intakes of Tier 3 potatoes,which are foods high in either: total fats, saturated fats,sodium, or sugar increased with increasing age groups.
Hack et al. BMC Nutrition (2021) 7:16 Page 3 of 10
Children ages 2–3 years and 4–8 years consumed: 49and 54% of potatoes categorized as Tier 3 such as somegrilled potatoes, or frozen potatoes. Males 9–13 yearsand 14–18 years consumed: 58, and 64% of potatoesclassified as Tier 3, respectively. Females aged 9–13years, and 14–18 years reported an average intake of 54and 61% of Tier 3 potatoes, respectively.
Furthermore, HCST classifies the majority of “juicecocktails” as Tier 3 as they exceed one of the upperthresholds; this is reflected in Fig. 1a-c [10]. Across allages, the majority of intakes from EWCFG Milk and Al-ternatives, and Meat and Alternatives food categorieswere foods that CFG recommends to “choose few of”(Tier 3) such as flavoured milks, most cheeses, or deli
Table 1 Number of servings per food category presented according to the 2014 Health Canada’s Surveillance Tool (HCST) TierSystem nutrient profiling model, among Canadian children 2–18 yearsCategory Tier 2–3
Years4–8years
9–13 years 9–13 years 14–18 years 14–18 years
Boys Girls Boys Girls
Mean (SEM)
Vegetables and Fruits Tier 1 2.9 (0.1) 2.8 (0.1) 2.4 (0.2) 2.6 (0.2) 2.3 (0.2) 2.5 (0.2)
Tier 2 1.1 (0.1) 1.3 (0.1) 1.1 (0.1) 1.1 (0.1) 1.2 (0.1) 0.8 (0.1)
Tier 3 0.4 (0.1) 0.4 (0.1) 0.4 (0.1) 0.4 (0.1) 0.7 (0.1) 0.4 (0.1)
Tier 4 0 (0) 0 (0) 0 (0) 0.1 (0) 0 (0) 0 (0)
Tier 1–3 4.4 (0.2) 4.4 (0.2) 3.9 (0.2) 4.1 (0.2) 4.1 (0.3) 3.8 (0.2)
Total Tiers 1–4 4.5 (0.2) 4.6 (0.2) 4 (0.2) 4.2 (0.2) 4.2 (0.3) 3.8 (0.2)
EWCFG Rec. 4 5 6 6 8 7
Mean (SEM)
Grain Products Tier 1 1.2 (0.1) 1.1 (0.1) 1.3 (0.2) 1.4 (0.1) 1.3 (0.2) 1.2 (0.1)
Tier 2 2.5 (0.1) 3.1 (0.1) 3.5 (0.2) 3 (0.2) 3.7 (0.2) 2.8 (0.1)
Tier 3 0.8 (0.1) 1.1 (0.1) 1 (0.1) 1 (0.1) 0.8 (0.1) 1 (0.1)
Tier 4 0.7 (0.1) 0.9 (0.1) 1 (0.1) 1.1 (0.1) 0.6 (0.1) 0.7 (0.1)
Tier 1–3 4.4 (0.2) 5.3 (0.2) 5.8 (0.2) 5.3 (0.2) 5.8 (0.3) 5.1 (0.2)
Total Tiers 1–4 5.1 (0.2) 6.2 (0.2) 6.8 (0.2) 6.4 (0.2) 6.4 (0.3) 5.7 (0.2)
EWCFG Rec. 3 4 6 6 7 6
Mean (SEM)
Milk and Alternatives Tier 1 0.2 (0) 0.2 (0) 0.3 (0) 0.3 (0) 0.2 (0) 0.2 (0)
Tier 2 1 (0.1) 0.8 (0) 0.6 (0.1) 0.6 (0.1) 0.6 (0.1) 0.4 (0)
Tier 3 1.7 (0.1) 1.2 (0.1) 1.1 (0.1) 1.2 (0.1) 0.9 (0.1) 1 (0.1)
Tier 4 0.1 (0) 0.1 (0) 0.1 (0) 0.1 (0) 0 (0) 0.1 (0)
Tier 1–3 2.9 (0.1) 2.2 (0.1) 2.0 (0.1) 2.1 (0.1) 1.7 (0.1) 1.7 (0.1)
Total Tiers 1–4 3 (0.1) 2.3 (0.1) 2.1 (0.1) 2.1 (0.1) 1.8 (0.1) 1.8 (0.1)
EWCFG Rec. 2 2 3–4 3–4 3–4 3–4
Mean (SEM)
Meat and Alternatives Tier 1 0.1 (0) 0.1 (0) 0.1 (0) 0.1 (0) 0 (0) 0.1 (0)
Tier 2 0.4 (0) 0.3 (0.1) 0.4 (0.1) 0.4 (0.1) 0.6 (0.1) 0.5 (0.1)
Tier 3 0.8 (0.1) 0.9 (0.1) 0.9 (0.1) 0.8 (0.1) 1.2 (0.1) 1 (0.1)
Tier 4 0.3 (0.1) 0.3 (0.1) 0.2 (0.1) 0.2 (0.1) 0.2 (0.1) 0.3 (0.1)
Tier 1–3 1.3 (0.1) 1.4 (0.1) 1.4 (0.1) 1.2 (0.1) 1.8 (0.1) 1.6 (0.1)
Total Tiers 1–4 1.6 (0.1) 1.6 (0.1) 1.6 (0.1) 1.5 (0.1) 2.1 (0.2) 1.9 (0.1)
EWCFG Rec. 1 1 1–2 1–2 3 2
Tiers are classified according to lower and upper thresholds for nutrients of public health concern: sodium, saturated fats, total fats and sugars. Lower thresholds:total fat: ≤ 3 g/RA, sugars: ≤ 6 g/RA and sodium: ≤ 140 mg/RA [8]. Upper thresholds: total fat: > 10 g/RA, sugars: > 19 g/RA, sodium: > 360 mg/RA, and saturatedfats: > 2 g/RA [8]. Tier 1 foods do not exceed any lower thresholds for total fat, sugar and sodium. Tier 2 may exceed one or two lower thresholds but no upperthresholds. Tier 3 Vegetable and Fruit, and Grain Products: exceeds all lower thresholds and no upper thresholds, or only one upper threshold. Tier 3 Milk andAlternatives, and Meat and Alternatives: exceeds all lower thresholds and no upper thresholds, or only one upper threshold for total fat, sugars, or sodium. Tier 4Vegetable and Fruit, and Grain Products: exceeds two upper thresholds. Tier 4 Milk and Alternatives, and Meat and Alternatives: exceeds upper thresholds for totalfat, sugars, or sodium [8]Data is presented as mean (SEM: standard error of the mean). Servings per/day are classified according to EWCFG: Eating Well with Canada’s Food Guide.Rec: RecommendationsResults are weighted, nationally representative and energy adjusted
Hack et al. BMC Nutrition (2021) 7:16 Page 4 of 10
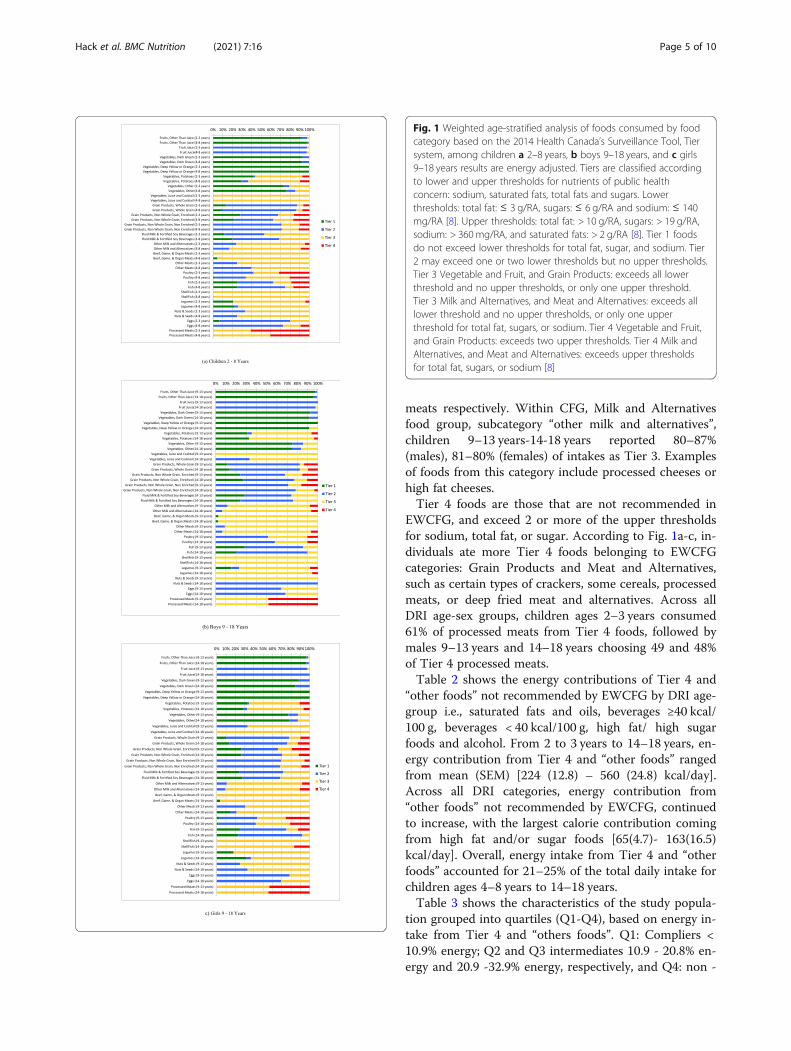
meats respectively. Within CFG, Milk and Alternativesfood group, subcategory “other milk and alternatives”,children 9–13 years-14-18 years reported 80–87%(males), 81–80% (females) of intakes as Tier 3. Examplesof foods from this category include processed cheeses orhigh fat cheeses.Tier 4 foods are those that are not recommended in
EWCFG, and exceed 2 or more of the upper thresholdsfor sodium, total fat, or sugar. According to Fig. 1a-c, in-dividuals ate more Tier 4 foods belonging to EWCFGcategories: Grain Products and Meat and Alternatives,such as certain types of crackers, some cereals, processedmeats, or deep fried meat and alternatives. Across allDRI age-sex groups, children ages 2–3 years consumed61% of processed meats from Tier 4 foods, followed bymales 9–13 years and 14–18 years choosing 49 and 48%of Tier 4 processed meats.Table 2 shows the energy contributions of Tier 4 and
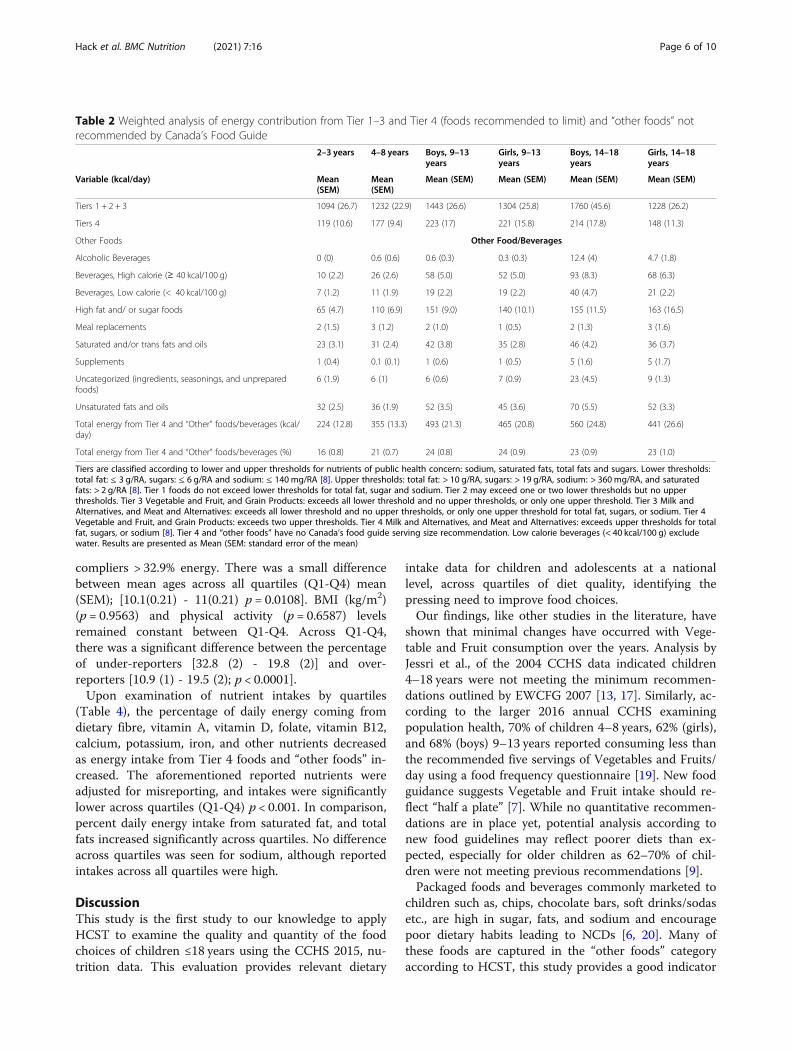
“other foods” not recommended by EWCFG by DRI age-group i.e., saturated fats and oils, beverages ≥40 kcal/100 g, beverages < 40 kcal/100 g, high fat/ high sugarfoods and alcohol. From 2 to 3 years to 14–18 years, en-ergy contribution from Tier 4 and “other foods” rangedfrom mean (SEM) [224 (12.8) – 560 (24.8) kcal/day].Across all DRI categories, energy contribution from“other foods” not recommended by EWCFG, continuedto increase, with the largest calorie contribution comingfrom high fat and/or sugar foods [65(4.7)- 163(16.5)kcal/day]. Overall, energy intake from Tier 4 and “otherfoods” accounted for 21–25% of the total daily intake forchildren ages 4–8 years to 14–18 years.Table 3 shows the characteristics of the study popula-
tion grouped into quartiles (Q1-Q4), based on energy in-take from Tier 4 and “others foods”. Q1: Compliers <10.9% energy; Q2 and Q3 intermediates 10.9 - 20.8% en-ergy and 20.9 -32.9% energy, respectively, and Q4: non -
Fig. 1 Weighted age-stratified analysis of foods consumed by foodcategory based on the 2014 Health Canada’s Surveillance Tool, Tiersystem, among children a 2–8 years, b boys 9–18 years, and c girls9–18 years results are energy adjusted. Tiers are classified accordingto lower and upper thresholds for nutrients of public healthconcern: sodium, saturated fats, total fats and sugars. Lowerthresholds: total fat: ≤ 3 g/RA, sugars: ≤ 6 g/RA and sodium: ≤ 140mg/RA [8]. Upper thresholds: total fat: > 10 g/RA, sugars: > 19 g/RA,sodium: > 360mg/RA, and saturated fats: > 2 g/RA [8]. Tier 1 foodsdo not exceed lower thresholds for total fat, sugar, and sodium. Tier2 may exceed one or two lower thresholds but no upper thresholds.Tier 3 Vegetable and Fruit, and Grain Products: exceeds all lowerthreshold and no upper thresholds, or only one upper threshold.Tier 3 Milk and Alternatives, and Meat and Alternatives: exceeds alllower threshold and no upper thresholds, or only one upperthreshold for total fat, sugars, or sodium. Tier 4 Vegetable and Fruit,and Grain Products: exceeds two upper thresholds. Tier 4 Milk andAlternatives, and Meat and Alternatives: exceeds upper thresholdsfor total fat, sugars, or sodium [8]
Hack et al. BMC Nutrition (2021) 7:16 Page 5 of 10
compliers > 32.9% energy. There was a small differencebetween mean ages across all quartiles (Q1-Q4) mean(SEM); [10.1(0.21) - 11(0.21) p = 0.0108]. BMI (kg/m2)(p = 0.9563) and physical activity (p = 0.6587) levelsremained constant between Q1-Q4. Across Q1-Q4,there was a significant difference between the percentageof under-reporters [32.8 (2) - 19.8 (2)] and over-reporters [10.9 (1) - 19.5 (2); p < 0.0001].Upon examination of nutrient intakes by quartiles
(Table 4), the percentage of daily energy coming fromdietary fibre, vitamin A, vitamin D, folate, vitamin B12,calcium, potassium, iron, and other nutrients decreasedas energy intake from Tier 4 foods and “other foods” in-creased. The aforementioned reported nutrients wereadjusted for misreporting, and intakes were significantlylower across quartiles (Q1-Q4) p < 0.001. In comparison,percent daily energy intake from saturated fat, and totalfats increased significantly across quartiles. No differenceacross quartiles was seen for sodium, although reportedintakes across all quartiles were high.
DiscussionThis study is the first study to our knowledge to applyHCST to examine the quality and quantity of the foodchoices of children ≤18 years using the CCHS 2015, nu-trition data. This evaluation provides relevant dietary
intake data for children and adolescents at a nationallevel, across quartiles of diet quality, identifying thepressing need to improve food choices.Our findings, like other studies in the literature, have
shown that minimal changes have occurred with Vege-table and Fruit consumption over the years. Analysis byJessri et al., of the 2004 CCHS data indicated children4–18 years were not meeting the minimum recommen-dations outlined by EWCFG 2007 [13, 17]. Similarly, ac-cording to the larger 2016 annual CCHS examiningpopulation health, 70% of children 4–8 years, 62% (girls),and 68% (boys) 9–13 years reported consuming less thanthe recommended five servings of Vegetables and Fruits/day using a food frequency questionnaire [19]. New foodguidance suggests Vegetable and Fruit intake should re-flect “half a plate” [7]. While no quantitative recommen-dations are in place yet, potential analysis according tonew food guidelines may reflect poorer diets than ex-pected, especially for older children as 62–70% of chil-dren were not meeting previous recommendations [9].Packaged foods and beverages commonly marketed to
children such as, chips, chocolate bars, soft drinks/sodasetc., are high in sugar, fats, and sodium and encouragepoor dietary habits leading to NCDs [6, 20]. Many ofthese foods are captured in the “other foods” categoryaccording to HCST, this study provides a good indicator
Table 2 Weighted analysis of energy contribution from Tier 1–3 and Tier 4 (foods recommended to limit) and “other foods” notrecommended by Canada’s Food Guide
2–3 years 4–8 years Boys, 9–13years
Girls, 9–13years
Boys, 14–18years
Girls, 14–18years
Variable (kcal/day) Mean(SEM)
Mean(SEM)
Mean (SEM) Mean (SEM) Mean (SEM) Mean (SEM)
Tiers 1 + 2 + 3 1094 (26.7) 1232 (22.9) 1443 (26.6) 1304 (25.8) 1760 (45.6) 1228 (26.2)
Tiers 4 119 (10.6) 177 (9.4) 223 (17) 221 (15.8) 214 (17.8) 148 (11.3)
Other Foods Other Food/Beverages
Alcoholic Beverages 0 (0) 0.6 (0.6) 0.6 (0.3) 0.3 (0.3) 12.4 (4) 4.7 (1.8)
Beverages, High calorie (≥ 40 kcal/100 g) 10 (2.2) 26 (2.6) 58 (5.0) 52 (5.0) 93 (8.3) 68 (6.3)
Beverages, Low calorie (< 40 kcal/100 g) 7 (1.2) 11 (1.9) 19 (2.2) 19 (2.2) 40 (4.7) 21 (2.2)
High fat and/ or sugar foods 65 (4.7) 110 (6.9) 151 (9.0) 140 (10.1) 155 (11.5) 163 (16.5)
Meal replacements 2 (1.5) 3 (1.2) 2 (1.0) 1 (0.5) 2 (1.3) 3 (1.6)
Saturated and/or trans fats and oils 23 (3.1) 31 (2.4) 42 (3.8) 35 (2.8) 46 (4.2) 36 (3.7)
Supplements 1 (0.4) 0.1 (0.1) 1 (0.6) 1 (0.5) 5 (1.6) 5 (1.7)
Uncategorized (ingredients, seasonings, and unpreparedfoods)
6 (1.9) 6 (1) 6 (0.6) 7 (0.9) 23 (4.5) 9 (1.3)
Unsaturated fats and oils 32 (2.5) 36 (1.9) 52 (3.5) 45 (3.6) 70 (5.5) 52 (3.3)
Total energy from Tier 4 and “Other” foods/beverages (kcal/day)
224 (12.8) 355 (13.3) 493 (21.3) 465 (20.8) 560 (24.8) 441 (26.6)
Total energy from Tier 4 and “Other” foods/beverages (%) 16 (0.8) 21 (0.7) 24 (0.8) 24 (0.9) 23 (0.9) 23 (1.0)
Tiers are classified according to lower and upper thresholds for nutrients of public health concern: sodium, saturated fats, total fats and sugars. Lower thresholds:total fat: ≤ 3 g/RA, sugars: ≤ 6 g/RA and sodium: ≤ 140 mg/RA [8]. Upper thresholds: total fat: > 10 g/RA, sugars: > 19 g/RA, sodium: > 360 mg/RA, and saturatedfats: > 2 g/RA [8]. Tier 1 foods do not exceed lower thresholds for total fat, sugar and sodium. Tier 2 may exceed one or two lower thresholds but no upperthresholds. Tier 3 Vegetable and Fruit, and Grain Products: exceeds all lower threshold and no upper thresholds, or only one upper threshold. Tier 3 Milk andAlternatives, and Meat and Alternatives: exceeds all lower threshold and no upper thresholds, or only one upper threshold for total fat, sugars, or sodium. Tier 4Vegetable and Fruit, and Grain Products: exceeds two upper thresholds. Tier 4 Milk and Alternatives, and Meat and Alternatives: exceeds upper thresholds for totalfat, sugars, or sodium [8]. Tier 4 and “other foods” have no Canada’s food guide serving size recommendation. Low calorie beverages (< 40 kcal/100 g) excludewater. Results are presented as Mean (SEM: standard error of the mean)
Hack et al. BMC Nutrition (2021) 7:16 Page 6 of 10

of children’s intake of food choices to limit. This studyshowed, on average that 21 - 24% of daily calories forchildren 4–18 years are consumed from the Tier 4 and“other foods” category, with the highest contributor be-ing high fat and/or sugary foods. Interestingly, this studyalso showed changes in the quality of foods consumed,with poorer intakes seen during the transition to adoles-cence. Average energy intake from high calorie bever-ages was almost twice as high in children 9–13 yearscompared to 4–8 year olds, in both boys and girls. Add-itionally, a higher average intake from high fat and/orsugary foods, as well as saturated fats and/or trans fatswas observed in the 9–13 year age groups. We observedno real difference in the number of servings of food ac-cording to EWCFG four food groups, but a difference inthe nutritional quality of foods consumed during thistime. It could be hypothesized that the change in the nu-tritional quality is a result of changes in preference offoods, in addition to more opportunities for childrenand adolescents to choose their own foods, and hencemarketing to children will impact their choices.Health Canada has taken action to limit consumption
of packaged foods high in sugar, sodium, and fats withproposed new mandatory Front-of-Packaging labelling
regulations [20, 21]. It is hoped that new mandatory reg-ulations, if finalized, will improve dietary choices of Ca-nadians, as minimal changes in the quality of diet haveoccurred during the intervening 11 years between thenational nutrition surveys.When comparing intakes to CCHS 2004, average daily
calories coming from this “other foods” category decreasedfrom 27 to 31% [17] to 21–24%. Caution needs to be usedwhen interpreting changes between these two cycles of na-tional nutrition data, as investigations by Statistics Canadarevealed a higher level of under-reporting with CCHS nu-trition 2015, in addition to an average 250 kcal decrease[14]. Possible explanations for these observed changes tointake may result from updates to the CNF over the inter-vening 11 years of the two survey cycles [14]. The CNF re-flect changes and updates within the food industry/market.For example, compared to the last cycle of CCHS nutrition2004, the estimated calories of “Italian dressing” declinedthree-fold [12, 14]. In addition to the updated CNF, up-dated design and pictures seen in the food module bookletmay have impacted the estimation of amounts of foodsconsumed. Additionally, standardized food sizes have chan-ged over the years which may have contributed to a largerpercentage of under-reporting [11, 12, 14].
Table 3 Weighted analysis of characteristics of compliers, intermediates, and non-compliers based on the percentage of energyfrom Tier 4 foods and “other foods” and beverages among Canadian children 2–18 years
Characteristics Compliers (Q1) Intermediates (Q2) Intermediates (Q3) Non-compliers (Q4) p-Trend< 10.9% Energy 10.9 -20.8% Energy 20.9 -32.9% Energy > 32.9% Energy
Mean (SEM) Mean (SEM) Mean (SEM) Mean (SEM)
Age (years) 10.1 (0.21) 10.2 (0.23) 10.7 (0.22) 11.0 (0.21) 0.0108
Sex (%)
Males 47.4 (2) 50.1 (2) 53 (2) 46.2 (2) 0.9499
Females 52.6 (2) 49.9 (2) 47 (2) 53.8 (2)
BMI (kg/m2) 20 (0.21) 20.1 (0.19) 19.9 (0.20) 20.1 (0.24) 0.9563
Misreporting
Under-reporter (%) 32.8 (2) 25 (2) 23.3 (2) 19.8 (2)
Over-reporters (%) 10.9 (1) 15.2 (1) 16.4 (1) 19.5 (2) <.0001
Physical Activity (%)
Sedentary 27.3 (2) 28.4 (2) 29.6 (2) 28.2 (2) 0.6587
Low Activity 40.3 (2) 41.6 (3) 43.1 (3) 41.4 (3)
Very Active 6.6 (1) 6.3 (1) 5.9 (1) 6.3 (1)
Results are presented as mean (SEM: standard error of the mean) adjusted for age and sex. Quartiles are based on the percentage of energy reported for all Tier 4foods and “other” foods and beverages classified according to lower and upper thresholds for nutrients of public health concern: sodium, saturated fats, total fatsand sugars. Lower thresholds: total fat: ≤ 3 g/RA, sugars: ≤ 6 g/RA and sodium: ≤ 140 mg/RA [8]. Upper thresholds: total fat: > 10 g/RA, sugars: > 19 g/RA, sodium:> 360 mg/RA, and saturated fats: > 2 g/RA [8]. Tier 1 foods do not exceed lower thresholds for total fat, sugar and sodium. Tier 2 may exceed one or two lowerthresholds but no upper thresholds. Tier 3 Vegetable and Fruit, and Grain Products: exceeds all lower threshold and no upper thresholds, or only one upperthreshold. Tier 3 Milk and Alternatives, and Meat and Alternatives: exceeds all lower threshold and no upper thresholds, or only one upper threshold for total fat,sugars, or sodium. Tier 4 Vegetable and Fruit, and Grain Products: exceeds two upper thresholds. Tier 4 Milk and Alternatives, and Meat and Alternatives: exceedsupper thresholds for total fat, sugars, or sodium [8]. Tier 4 and “other foods” have no Canada’s food guide serving size recommendation. Compliers (Q1) areidentified as the lowest 25% of the population with reported intakes from Tier 4 and “other” foods and beverages. Individuals categorized as “Intermediates” (Q2and Q3) are those with intakes in the interquartile range. Non-compliers (Q4) represent 25% of the population with the highest intakes from Tier 4 and “other”foods. Physical activity in the 2015 CCHS was measured according to WHO guidelines (different from CCHS 2004) for children 6 to 17 years. Physical activity wasdefined as “activity that increases their heart rate and makes them feel out of breath some of the time” [11]. Physical activity in the 2015 CCHS measured thefrequency of moderate to vigorous physical activity aimed to compare to WHO guidelines
Hack et al. BMC Nutrition (2021) 7:16 Page 7 of 10

This study investigated energy intake according toquartiles of Tier 4 and “other foods”, with individuals inthe lowest quartile categorized as compliers and in thehighest quartile as non-compliers. Under-reportingranged from 20 - 32% among children, BMI and physicalactivity remained relatively constant across all quartiles.Interestingly, individuals in lower quartiles did not havesignificantly better reported physical activity levels orlower measured BMI; this may indicate these measuresare poor across all sub-groups. However, intakes of
vitamin D, calcium, fiber, and most micronutrients de-creased with poorer quality diets and daily saturated fatsincreased among non-compliers. This trend is not sur-prising as many nutrient poor foods are low in these nu-trients. Intake of sodium (mg/1000 kcal) was high acrossall quartiles 1375.5 (20.9) - 1459.1 (20.8) indicating highsodium intake across all Canadians and thus remains atarget for Canada’s Sodium Reduction Strategy and con-tinued efforts are needed to reach sodium reduction tar-gets [10, 22].
Table 4 Weighted analysis of nutrient intakes by compliers, intermediates, and non-compliers based on the percentage of energyconsumed from Tier 4 and “other foods” and beverages among Canadian children adjusted for age, sex and misreporting status(under-reporter, plausible reporter, and over-reporters)
Nutrients Compliers (Q1) Intermediates (Q2) Intermediates (Q3) Non-compliers (Q4) p-Trend< 10.9% Energy 10.9 -20.8% Energy 20.9 -32.9% Energy > 32.9% Energy
Mean (SEM) Mean (SEM) Mean (SEM) Mean (SEM)
Energy (kcal/day) 1762 (32.3) 1978 (41.6) 1914 (32.6) 2040 (40.2) < 0.0001
Fat (% Energy) 28.6 (0.4) 30.9 (0.4) 31.4 (0.4) 32.7 (0.4) < 0.0001
Saturated fat (% Energy) 9.7 (0.2) 11.1 (0.2) 11.4 (0.2) 11.6 (0.2) < 0.0001
Monounsaturated fat (% Energy) 10.5 (0.2) 10.9 (0.2) 11.1 (0.2) 11.7 (0.2) < 0.0001
Polyunsaturated fat (% Energy) 5.7 (0.1) 6.0 (0.1) 6.0 (0.1) 6.6 (0.2) < 0.0001
Carbohydrates (% Energy) 54.1 (0.5) 53.1 (0.5) 53.9 (0.4) 54.0 (0.4) 0.4137
Protein (% Energy) 17.3 (0.2) 16.0 (0.2) 14.7 (0.2) 13.0 (0.2) < 0.0001
Alcohol (% Energy) 0 (0.0) 0 (0.0) 0 (0.0) 0.3 (0.1) 0.0676
Dietary fibre (g/1000 kcal) 10.2 (0.2) 9.0 (0.2) 8.4 (0.2) 7.1 (0.2) < 0.0001
Vitamin A (RE/1000 kcal) 398.1 (26.0) 352.1 (11.1) 326.3 (10.3) 285.9 (9.0) < 0.0001
Vitamin D (RE/1000 kcal) 3.6 (0.2) 3.1 (0.1) 2.8 (0.1) 2.6 (0.1) < 0.0001
Thiamin (mg/1000 kcal) 1.0 (0.0) 0.9 (0.0) 0.9 (0.0) 0.7 (0.0) < 0.0001
Niacin (mg/1000 kcal) 20.8 (0.3) 18.7 (0.3) 17.9 (0.2) 15.8 (0.3) < 0.0001
Riboflavin (mg/1000 kcal) 1.1 (0.0) 1.0 (0.0) 1.0 (0.0) 0.9 (0.0) < 0.0001
Vitamin B6 (ug/1000 kcal) 0.9 (0.0) 0.8 (0.0) 0.7 (0.0) 0.7 (0.0) < 0.0001
Folate (ug/1000 kcal) 112.2 (2.9) 103.2 (2.3) 90.7 (1.8) 74.3 (1.7) < 0.0001
Vitamin B12 (ug/1000 kcal) 2.6 (0.3) 2.2 (0.1) 1.9 (0.1) 1.7 (0.1) < 0.0001
Vitamin C (mg/1000 kcal) 68.7 (3.0) 67.4 (2.5) 67.2 (2.6) 56.2 (2.2) 0.0064
Calcium (mg/1000 kcal) 560.6 (10.9) 552.4 (9.0) 495.2 (9.4) 430.7 (10.5) < 0.0001
Phosphorus (mg/1000 kcal) 772.9 (10.1) 714.1 (7.2) 659.4 (7.1) 598.6 (8.9) < 0.0001
Potassium (mg/ 1000 kcal) 1528.4 (20.4) 1387.6 (15.7) 1270.6 (16.3) 1094.1 (14.3) < 0.0001
Sodium (mg/ 1000 kcal) 1431.8 (23.5) 1423.0 (18.1) 1459.1 (20.8) 1375.5 (20.9) 0.0509
Magnesium (mg/ 1000 kcal) 165.2 (2.3) 149.8 (1.5) 138.6 (1.7) 120.3 (1.7) < 0.0001
Iron (mg/ 1000 kcal) 7.2 (0.1) 6.8 (0.1) 6.8 (0.1) 6.1 (0.1) < 0.0001
Zinc (mg/ 1000 kcal) 5.7 (0.1) 5.3 (0.1) 4.8 (0.1) 4.2 (0.1) < 0.0001
Results are presented as mean (SEM: standard error of the mean). Quartiles are based on the percentage of energy reported for all Tier 4 foods and “other” foodsand beverages classified according to lower and upper thresholds for nutrients of public health concern: sodium, saturated fats, total fats and sugars. Lowerthresholds: total fat: ≤ 3 g/RA, sugars: ≤ 6 g/RA and sodium: ≤ 140 mg/RA [8]. Upper thresholds: total fat: > 10 g/RA, sugars: > 19 g/RA, sodium: > 360 mg/RA, andsaturated fats: > 2 g/RA [8]. Tier 1 foods do not exceed lower thresholds for total fat, sugar and sodium. Tier 2 may exceed one or two lower thresholds but noupper thresholds. Tier 3 Vegetable and Fruit, and Grain Products: exceeds all lower threshold and no upper thresholds, or only one upper threshold. Tier 3 Milkand Alternatives, and Meat and Alternatives: exceeds all lower threshold and no upper thresholds, or only one upper threshold for total fat, sugars, or sodium. Tier4 Vegetable and Fruit, and Grain Products: exceeds two upper thresholds. Tier 4 Milk and Alternatives, and Meat and Alternatives: exceeds upper thresholds fortotal fat, sugars, or sodium [8]. Tier 4 and “other foods” have no Canada’s food guide serving size recommendation. Compliers (Q1) are identified as the lowest25% of the population with reported intakes from Tier 4 and “other” foods and beverages. Individuals categorized as “Intermediates” (Q2 and Q3) are those withintakes in the interquartile range. Non-compliers (Q4) represent 25% of the population with the highest intakes from Tier 4 and “other” foods
Hack et al. BMC Nutrition (2021) 7:16 Page 8 of 10
This study is the first to our knowledge to provide up-to- date dietary information using the CCHS 2015, andHealth Canada’s Tier system, a nutrient profiling model,to examine the quality and quantity of the food choicesof Canadian children and adolescents. Importantly theCCHS 2015 interviewed individuals for the 24-h dietaryrecall on all days of the week, and throughout the entireyear to account for day-to-day and seasonal variations inreporting. This study is not without its limitations. Find-ings in this study used the 2014 HCST, which catego-rizes foods into Tiers according to thresholds for fournutrients of concern (i.e., sodium, sugar, saturated fats,and total fats). Future work could update or modify the2014 HCST to include guidelines for recommended nu-trients such as calcium, Vitamin D, iron, fibre andothers. Additionally, updating the 2014 HCST is neededto reflect recent changes in Canada’s new Food Guidewhich includes quantitative recommendations such ashalf a plate for Vegetables and Fruits, and a quarter of aplate for each of Protein and Grain Products [7]. Exam-ination of current dietary intakes against Canada’s newfood guide may reveal Canadians are eating poorer thanexpected, however this remains an area where further re-search is needed [7]. Alternatively, future research couldcombine HCST analysis with a broader diet quality scoreto help make further comparisons across DRI age-sexgroups.
ConclusionsThe majority of the dietary intake of Tier 1 foods arefrom Vegetables and Fruit consumption, however thequantity consumed compared to Canada’s dietary rec-ommendations is low for children 9 years and older. Thenutritional quality of foods consumed by children andadolescents were mainly from Tier 3 followed by Tier 2foods. Within all age groups, as intake from Tier 4 and“other foods” increased, the nutritional quality of thediet decreased. This data provides support to limit themarketing of unhealthy processed and packaged foods tochildren to reduce their consumption. Furthermore,Front-of-Package labeling will help parents and childrenidentify foods poor in nutritional quality. Future studiesare needed to analyze the consumption patterns of chil-dren once an updated Tier system is introduced that cat-egorizes food choices and diet with the new food guide.
AbbreviationsAMPM: Automated multi-pass method; BMI: Body mass index;CCHS: Canadian Community Health Survey; CFG: Canada’s food guide;CNF: Canadian Nutrient File; DV: Daily value; EER: Estimated energyrequirement; EI: Energy intake; EWCFG: Eating well with Canada’s food guide;GBD: Global burden of disease report; HCST: Health Canada Surveillance Tool,Tier System; IOM: Institute of Medicine; NCDs: Non-communicable diseases;Q: Quartile; RA: Reference amount; RDC: Research Data Centre; TEE: Totalenergy expenditure; USDA: United States Department for Agriculture
AcknowledgementsNot applicable.
Authors’ contributionsM.R.L. and M.J conceptualized and designed the study; S.H and M.Jcompleted the data analyses; S.H; M.J; and M.R.L interpreted the data; S.Hdrafted the manuscript; M.J and M.R.L reviewed and edited the manuscript.The author(s) read and approved the final manuscript.
Authors’ informationNot applicable.
FundingThis study was supported by the Burroughs Welcome Fund Innovation inRegulatory Science Award (M.R.L), and by funds from the Canadian Institutesof Health Research (CIHR) (M.R.L). M. J. was funded by the CIHR BantingPostdoctoral Fellowship and Banting Research Foundation DiscoveryAward. MRL was funded by the Canadian Institute of Health Research (CIHR),and Earle W. McHenry Research Chair unrestricted research grant from theUniversity of Toronto.
Availability of data and materialsThe data that supports the findings of this study are available from StatisticsCanada Toronto Research Data Center, but restrictions apply to theavailability of these data, which were used under the license for the currentstudy, and so are not publicly available. Data are however available from theauthors upon a reasonable request and with permission of Statistics CanadaToronto Research Data Centre.
Declarations
Ethics and approval and consent to participateThis study was a secondary analyses of the CCHS Nutrition (2015) data, allinformation was de-identified and vetted by a trained member of StatisticsCanada prior to release from the Toronto Research Data Center.
Consent for publicationNot applicable.
Competing interestsAll authors declare no competing interests.
Author details1Department of Nutritional Sciences, Temerty Faculty of Medicine, Universityof Toronto, Toronto M5S 1A8, Canada. 2Food Nutrition and Health Program,The University of British Columbia, Vancouver V6T 1Z4, Canada.
Received: 26 November 2020 Accepted: 17 March 2021
References1. World Health Organization. Healthy diet. 2018. Available from: http://www.
who.int/en/news-room/fact-sheets/detail/healthy-diet. Accessed 14 Jan2019.
2. GBD 2019 Cause of Death Collaborators. Health effects of dietary risks in195 countries, 1990–2017: a systematic analysis for the Global Burden ofDisease Study 2017. Lancet. 2019;393:1958–72.
3. Childhood obesity foundation. 2015. Available from: https://childhoodobesityfoundation.ca/what-is-childhood-obesity/statistics/.Accessed 14 Jan 2019.
4. Government of Canada. Childhood obesity. 2019. Available from: https://www.canada.ca/en/public-health/services/childhood-obesity/childhood-obesity.html. Accessed 16 Feb 2019.
5. Statistics Canada. Table 13-10-0795-01. Measured children and youth bodymass index (BMI) (World Health Organization classification), by age groupand sex, Canada, and provinces, Canadians Community Health SurveyNutrition Available from: https://www150.statcan.gc.ca/t1/tbl1/en/tv.action?pid=1310079501. Accessed 16 Feb 2019.
6. Government of Canada. Health Canada’s healthy eating strategy. 2019.Available from: https://www.canada.ca/en/services/health/campaigns/vision-healthy-canada/healthy-eating.html. Accessed 18 Dec 2019.
Hack et al. BMC Nutrition (2021) 7:16 Page 9 of 10

7. Health Canada. Canada’s food guide. 2019. Available from:https://food-guide.canada.ca/en/healthy-food-choices/. Accessed 2 Mar 2019.
8. Health Canada. The development and use of a surveillance tool: theclassification of foods in the Canadian nutrient file according to eating wellwith Canada’s food guide: Health Canada, 2014; 2014. Available from: http://publications.gc.ca/collections/collection_2014/sc-hc/H164-158-2-2014-eng.pdf. Accessed 13 Feb 2019.
9. Health reports. A surveillance tool to assess diets according to Eating Wellwith Canada’s Food Guide- Archived. November 18 2015. 2015011. StatisticsCanada. 2015. Available from: https://www150.statcan.gc.ca/n1/en/catalogue/82-003-X.
10. World Health Organization. Salt reduction. 2020. Available from: https://www.who.int/news-room/fact-sheets/detail/salt-reduction. Accessed 14 Jan2020.
11. Health Canada. Reference guide to understanding and using the data: 2015Canadian Community Health Survey-Nutrition. 2017.
12. Health Canada. Canadian nutrient file- user guide. 2015. Available from:https://www.canada.ca/en/health-canada/services/food-nutrition/healthy-eating/nutrient-data/canadian-nutrient-file-compilation-canadian-food-composition-data-users-guide.html. Accessed 13 Feb 2019.
13. Health Canada. Eating well with Canada’s food guide 2007. Available from:http://www.has.uwo.ca/hospitality/nutrition/pdf/foodguide.pdf. Accessed 14Jan 2019.
14. Garriguet D. Accounting for misreporting when comparing energy intakeacross time in Canada. Statistics Canada. 2018. Available from: https://www.ncbi.nlm.nih.gov/pubmed/29852052. Accessed 10 Feb 2019.
15. Garriguet D. Under-reporting of energy intakein the CanadianCommunityHealth survey. Statistics Canada, 2015. Available from: https://www150.statcan.gc.ca/n1/pub/82-003-x/2008004/article/10703/5800490-eng.htm. Accessed 10 Feb 2019.
16. Jessri M, Lou W, L'Abbe MR. Evaluation of different methods to handlemisreporting in obesity research : Evidence from the Canadian nationalnutrition survey. Br J Nutr. 115(1):1–13. https://doi.org/10.1017/S0007114515004237.
17. Jessri M, Nishi SK, L'Abbe MR. Assessing the nutritional quality of diets ofCanadian children and adolescents using the 2014 Health Canadasurveillance tool tier system. BMC Public Health. 2016;16(1):381. https://doi.org/10.1186/s12889-016-3038-5.
18. Institute of Medicine. Dietary reference intakes for energy, carbohydrate,Fiber, fat, fatty acids, cholesterol, protein and amino acids. Washington, DC:National Academy Press; 2005.
19. Statistics Canada. Health fact sheet: fruit and vegetable consumption inCanada. 2016. Available from: https://www150.statcan.gc.ca/n1/pub/82-625-x/2017001/article/54860-eng.htm. Accessed 22 Nov 2018.
20. Vanderlee, Lana and Mary L'Abbé. “Commentary - Food for thought onfood environments in Canada Commentaire” Health promotion and chronicdisease prevention in Canada : research, policy and practice vol. 37,9 (2017):263–265.
21. Health Canada. Consultation on proposed front of package labelling. 2018.Available from:https://www.canada.ca/en/health-canada/programs/consultation-front-of-package-nutrition-labelling-cgi/summary-of-proposed-amendments.html. Accessed 10 Feb 2019.
22. Government of Canada. Sodium reduction strategy for Canada. 2017.Available from: https://www.canada.ca/en/health-canada/services/food-nutrition/healthy-eating/sodium/related-information/reduction-strategy/recommendations-sodium-working-group.html. Accessed 10 Feb 2019.
Publisher’s NoteSpringer Nature remains neutral with regard to jurisdictional claims inpublished maps and institutional affiliations.
Hack et al. BMC Nutrition (2021) 7:16 Page 10 of 10