Embed Size (px)
Citation preview
Nutritional Norms for Poverty: Issues and Implications
Concept paper prepared for the Expert Group to Review the Methodology for
Estimation of Poverty
M.H. Suryanarayana E-mail: [email protected]
Indira Gandhi Institute of Development Research Gen. A.K. Vaidya Marg, Goregaon East
Mumbai 400 065
i
Nutritional Norms for Poverty Issues and Implications
M.H. Suryanarayana
Abstract Since Independence, an era marked largely by limited income and growth, the Government of India has been pursuing its policies for economic welfare with reference to a nutrition-based subsistence norm. The concept and method of estimating poverty has come in for criticism in recent years in the context of (i) economic policy reforms based on targeted policy interventions; and (ii) the findings on economic growth involving a decline in poverty along with an increase in calorie deprivation. The debate seems to have overlooked issues concerned with both method and norm. This study therefore examines the following questions: What is the status of real consumer expenditures of the poorer decile groups during the past three decades? What do estimates of cereal quantities consumed for different population groups suggest? How far they tally with such estimates for the total population? What have been the temporal changes in calorie intake across different decile groups? How valid are the exogenous norms for threshold levels of calorie intake worked out in the 1960s and 1970s since when the economy has experienced structural and technological changes and improvements? How far the self-perception of the population with reference to adequacy of food consumption corroborates such findings? How far these measures and interpretations are validated by estimates of final health outcome parameters?
Per capita calorie intake in general has declined for the richer sections and increased for the poorer ones, though not sufficiently, in both rural and urban India. Similar profiles are found across states with differences in income percentiles at which they converge. Reductions in calorie intake have taken place almost on a sustained basis for the majority, the higher decile groups in particular, for the past three decades. This should have spelt a worsening health disaster, which has not happened. State wise profiles on calorie intake and deprivation reveal little co-variation with related health outcome parameters. This might be because of either compensating changes in diets and related health parameters, which calls for serious academic attention or irrelevance of energy as the major determinant of physical capability and health. It is difficult on the basis of available information and knowledge to explain the observed relationship among income/consumption, calorie intake and health outcomes. In other words, calorie norm may no longer be relevant today for defining the minimum subsistence. Hence, one could explore alternative options for distributional outcome evaluation. With the country transforming itself into one of the fastest growing economies in the world, it is important to set sights high for not only sustaining the growth process but also make it broad based and inclusive as visualized in the Eleventh Five Year Plan. Such improvements may be measured in terms of a robust order-based average like the median. Inclusion (participation) of the relatively deprived in such a growth process may be defined with reference to the order-based average of the outcome measure, that is, assess their economic status with reference to a threshold, specified as a function of the median income/consumption.
1
Nutritional Norms for Poverty Issues and Implications
M.H. Suryanarayana Indira Gandhi Institute of Development Research
Mumbai
1. Introduction 1.1 The concept of poverty and estimates of its magnitude and profile are quite relevant
in the context of policy formulation, its process and outcome evaluation. It matters most in a country low-income developing country like India, which has been pursuing development strategies and policy programmes for ‘Growth with Poverty Reduction’. Consistent with this policy concern, the concept of poverty and norm for its definition has evolved over time depending upon information availability, prevailing exigencies, policy imperatives and priorities.
1.2 One important norm used consistently for defining poverty line relates to nutrition,
the energy intake criterion in particular. The Government of India (GoI) has been using a minimum dietary energy requirement norm of 2400 kcal per person per day for the rural sector and 2100 kcal for the urban sector while the Food Agricultural Orgnisaion norm for India as a whole for 2003-05 is 1770 kcal.1
1.3 With economic growth and development involving structural and technological
changes, observed consumption patterns have changed. This could be reflecting changes in minimum nutritional requirements. 2 The GoI has also recognized that physical activity level and energy requirement has declined over the decades and the Indian Council of Medical Research has reconstituted its Expert Committee to review the Recommended Dietary Allowance for Indians (GoI 2002a). Therefore, it appears it is time for revisions in the norm for or even the concept of poverty.
1.4 This study, therefore, raises some relevant issues and examines them from an
economic perspective. To begin with, it would examine how did the Indian approach, official in particular, to defining and measuring poverty originate and evolve over time? What are the major issues regarding the nutritional basis for poverty measurement highlighted in academic and policy debates in India? How valid are these debates in terms of their methodological basis and data relevance? What are the issues relevant today? What is the possible solution?
1.5 This concept paper is structured in the same order as the questions listed above and
ends with a final section on the main recommendation. 3
1 The FAO norms are changed periodically; they were 1740 for the period 1990-92 and 1750 for 1995-97 (see http://www.fao.org/es/ess/faostat/foodsecurity/index_en.htm). 2 See Suryanarayana (2003b) and Suryanarayana and Silva (2007). 3 The Terms of Reference for the concept paper is available in Annexure I to this paper.
2
2. Defining Poverty: Indian Approach 2.1 In India, the official approach to define and measure poverty for purposes of policy
formulation and evaluation in the context of a strategy for poverty reduction has provided much of the impetus for academic as well as policy related studies on issues concerned with definition, measurement, interpretation, policy choice and evaluation. The official approach has laid emphasis on ensuring a subsistence minimum and hence, on eradicating absolute poverty.
2.2 The approach has evolved as follows: 2.2.1 A decade prior to India’s Independence, the National Planning Committee in 1936
under Pundit Nehru made an economic review and recognized that “there was lack of food, of clothing, of housing and of every other essential requirement of human existence” (Nehru, 1946). Against this assessment, the Committee declared that the development policy objective should be to “ensure an adequate standard of living for the masses, in other words, to get rid of the appalling poverty of the people” (Nehru 1946). Towards this end, the Committee defined goals for the total population in terms of nutrition (involving a balanced diet of 2400 to 2800 calories per adult worker), clothing (30 yards per capita per annum) and housing (100 sq. ft per capita).
2.2.2 After the first two five year plans, the Government appointed a Committee on
Distribution of Income and Levels of Living for an outcome evaluation from the distributional perspective. The Government also set up a working group, which defined a national minimum of Rs 20 per capita per month (Rs 25 for urban areas) at 1960/61 prices (GoI 1962). This minimum, considered adequate to ensure minimum energy requirements for an active and healthy life and also minimum clothing and shelter, did not include expenditures on health and education, which are to be provided by the State as per the Indian Constitution.4
2.2.3 The Government of India prepared a ‘Perspective of Development: 1961-1976’
keeping this minimum of Rs 20 per capita per month at 1960/61 prices as the goal for the fifth five year plan. This was based on the explicit acknowledgement that “the minimum which can be guaranteed is limited by the size of the total product and the extent of redistribution which is feasible” (GoI 1962). The Perspective unambiguously stated that (i) poverty removal should be the central concern of planning in India; (ii) every citizen should be assured of a minimum income within a reasonable period of time; and (iii) the minimum itself should be revised upwards with economic progress (ibid. p. 13).
2.2.4 The Government set up a Task Force on Projection of Minimum Needs and Effective
Consumption Demand to consolidate academic research and information on the subject and develop it further to facilitate drafting of the Sixth Five Year Plan (GoI, 1979b; p. 4). The Task Force defined the poor as "those whose per capita consumption expenditure lies below the midpoint of the monthly per capita expenditure class having a daily calorie intake of 2,400 in rural areas and 2,100 in
4 It was Dandekar and Rath (1971), which was probably the first attempt to define an income/consumer expenditure norm for poverty with reference to an explicit average daily per capita calorie intake norm of 2250 kcals for both rural and urban areas.
3
urban areas" (GoI 1981, p. 81).5 The poverty lines corresponding to these norms were worked out with reference to the National Sample Survey (NSS) data for the year 1973-74. The poverty line turned out to be Rs 49.09 per capita per month at 1973-74 prices for rural all- India.
2.2.5 The methodological details for poverty estimation, viz., (i) integration of estimates of
mean consumption from the National Accounts Statistics (NAS) and distribution parameters from the NSS; and (ii) use of implicit private consumption deflator from the NAS to adjust poverty lines for changes in prices in particular (GoI, 1986c; p. 10), became subjects of considerable academic scrutiny and critique (Minhas et al., 1991). Given the importance of the social goal for poverty eradication and relevance of estimates of poverty for policy choice and resource allocation, the Government set up an Expert Group in 1989 to look into the methodology for estimating poverty and also the question of re-defining poverty line (GoI 1993, p. 1). The Expert Group recommended the same poverty lines as those by GoI (1979b) but revised the methodology with respect to choice of database, and price indices for corrections in spatial and temporal price variations. Some recommendations are as follows:
2.2.5.1 Poverty line defines on an average the level of per capita per day expenditure “which
meets a normative minimum standard of living, deemed reasonable. Calorie intake is but one of the ingredients, though an important one, of the minimum standard, but the poverty line makes an allowance for non-food consumption needs as well on the basis of observed consumer behaviour.” (GoI 1993, p.30).
2.2.5.2 The all-India poverty lines and norms suggested by the Task Force on Minimum Needs and Effective Consumption Demand would continue to be the basis for further estimates of poverty.
2.2.5.3 As regards state-specific poverty lines, base year (1973-74) estimates for all states are to be made with reference to the same all-India living standard norm. This is to ensure comparability of poverty estimates across states and over time. For this purpose the ‘standardised commodity basket corresponding to the poverty line at the national level’ are to be valued at state specific prices in that year. This is done using Fisher's cost of living indices reflecting inter-state price differentials with respect to all-India for the rural and urban sectors respectively. The state-sector-specific poverty lines for subsequent years are to be updated by consumer price indices obtained by weighted state-sector-specific prices where the weighting diagram is given by the corresponding all-India consumption basket for the base year poverty line. Considering that reliable, comparable data in sufficient disaggregation are not readily available to researchers and take time, the Expert Group recommends the use of published commodity group indices from the Consumer Price Index for Agricultural Labourers for the rural and a simple average of `suitably weighted' indices from Consumer Price Index for Industrial Workers and Consumer Price Index for Urban Non-manual Employees for the urban sector for purposes of consumer price indices. Given the state-specific poverty lines, the corresponding poverty ratios are to be estimated relying `exclusively' on the NSS size distribution of per capita consumption expenditure. And all-India poverty ratios are to be obtained as `a ratio of the aggregate number of State-wise poor persons to the total all-India (rural and urban) population' (GoI 1993, p. 34).
5 There are norms for the total population worked out as a population weighted average of age-gender-activity specific calorie allowances recommended by the Nutrition Expert Group (1968) (GoI 1979; p. 9)
4
3 Issues 3.1 The Expert Group Report (GoI 1993) itself has provided a comprehensive and nearly
exhaustive summary of major issues involved in estimating poverty including the need to “broaden the concept of poverty and delink food poverty from poverty in general” (GoI 1993; p. 14). Though the Report has listed several caveats and clarifications, the concept and method of estimating poverty has received wide academic attention, comment and criticism in recent years in the context of (i) economic policy reforms based on targeted policy interventions to ensure cost efficiency6; and (ii) the findings on economic growth involving decline in poverty along with (a) a decrease in average per capita calorie intake and (b) an increase in incidence of calorie deficiency.
3.2 Majority of the studies on issues related to changes in poverty and its nutritional
basis/implications are focused on documenting the changes across states and over time in, inter alia, poverty, per capita consumer expenditure, per capita food expenditure, per capita cereal consumption, per capita calorie intake, associated changes in health outcomes, explaining the observed findings, hence their methodological imperatives and policy implications. The studies, of course, differed with regard to the range of questions examined, database, sample period, method of analysis and policy perspective.7
3.3 In general, some major findings have been as follows: (i) Per capita consumer
expenditure increased since the mid-70s; (ii) Incidence of poverty declined in general in both rural and urban India with differences in experience across states; (iii) But per capita calorie intake declined in both rural and urban India; the proportionate decline was more for the rich than for the poor; (iv) Incidence of calorie deficiency increased over time; and (v) Deprivation measures based on nutrition intake indictors are weakly associated with those based on health /education outcome indicators.
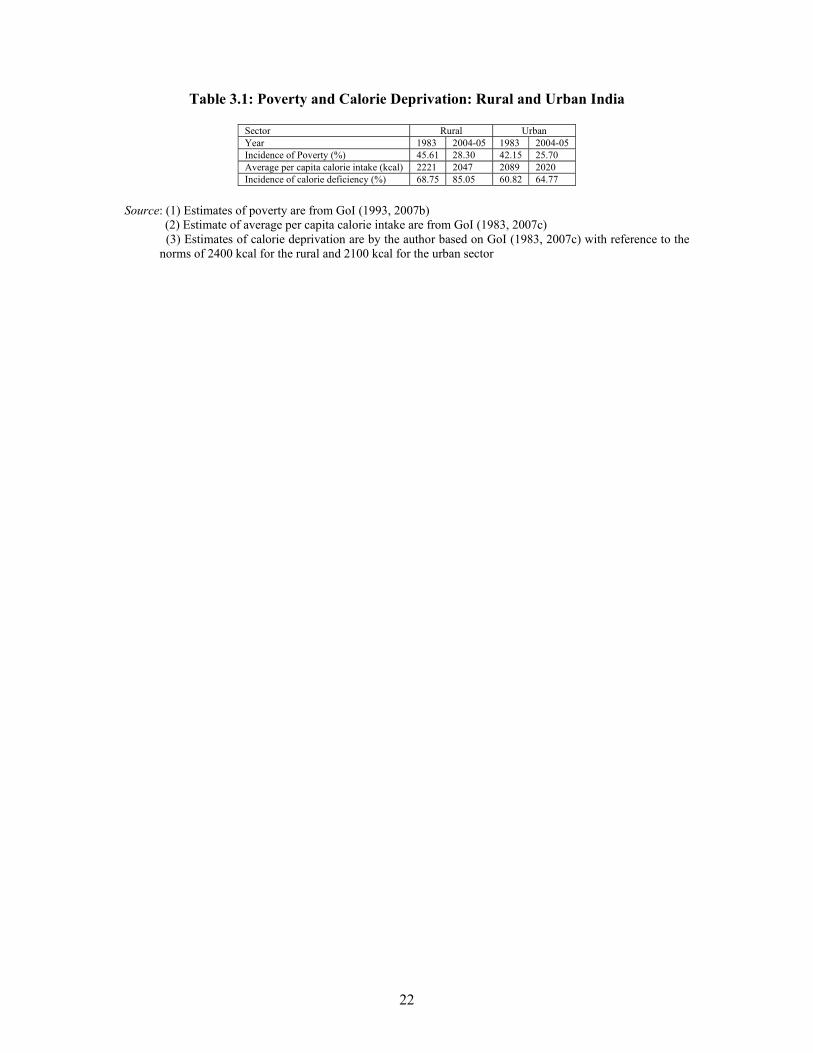
3.4 Some factual details on decline in estimates of poverty as well as average per capita
calorie intake and an increase in extent of calorie deprivation in recent years are as follows: For the country as a whole rural poverty declined from 45.61 per cent in 1983 to 28.30 percent and urban poverty declined from 42.15 per cent to 25.70 per cent between 1983 and 2004-05. Between the same two years, average calorie intake per capita declined from 2221 to 2047 and from 2089 to 2020 kcal in the rural and urban sectors respectively. As regards calorie deprivation, its extent increased from 69 to 85 per cent in rural India and from 60 to 65 per cent in urban India (Table 3.1).
3.5 Some issues relevant for a discussion on norms for poverty may be classified into the
following broad categories: (i) Conceptual; (ii) Data base, (iii) Methodology; and (iv) Norms for poverty line. The following sub-sections sum up the major issues in the same order.
6 For instance, the Seventh Five Year Plan states: “Cost-effectiveness of the programmes and minimization of leakages should be the two guiding principles in the implementation of poverty alleviation programmes.” (GoI 1985, p. 51). 7 Some of these studies are Deaton and Dreze (2009), Dev (2005), GoI (1993, 2002e), Meenakshi and Viswanathan (2005), Palmer-Jones and Sen (2005), Patnaik (2004, 2007) Radhakrishna (1991, 2005), Radhakrishna et al. (2004), Ray and Lancaster (2005), Suryanarayana, (1995, 1996, 1997, 2000a, 2000b, 2003a & 2003b, 2008b, 2009), Suryanarayana and Silva (2007).
5
3.1 Concept: 3.1.1 The Expert Group has essentially followed a well-accepted approach to defining
poverty, that is, the Basic Needs approach based on the food energy method. The Group has clarified that “The use of calorie norm in measuring poverty amounts only to a first order approximation to what may be considered to be an acceptable level of minimum need.” (GoI 1993; p. 15).
3.1.2 It has also made it explicit that “the poverty line, while being anchored in a ‘norm' of
calorie requirement, does not seek to measure the nutritional status, and more specifically the incidence of malnourishment or under-nourishment in the population. It focuses rather on the purchasing power needed to meet the specific calorie intake standard with some margin for non-food consumption needs. Moreover the calorie norms relate to an average for the reference group and not the minimum required for biological existence, given that there is a considerable variation in calorie requirement of individuals depending on their workload, age, sex and activity status” (GoI 1993, p.5).
3.1.3 The Group has also recognized “the desirability of defining the normative standard for
non-food consumption and its constituents, without reference to actual behaviour, but until this is done, the existing basis seems to be the most practical and reasonable. It is this consumption basket that constitutes the minimum standard for defining the boundary between the poor and the non-poor” (GoI 1993, p.30)
3.1.4 Given the general perception that inadequate energy intake is the major constraint
(see, for instance, Sukhatme 1978), the proposal to anchor poverty line in the calorie norm made sense. In the current era of privatization of health and education, and hence, ‘catastrophic’ health/education expenses, one issue that would need some review is to define some normative standards for the non-food components, possibly, with reference to potential policy options.
3.2 Data Base
3.2.1. One question that has received little academic attention is the very information base for defining poverty norms and estimates. The NSS is so designed as to obtain an unbiased estimate of average consumer expenditure and not consumption distribution. As the National Sample Survey Organization itself points out, the “procedure of recording cooked meals served to others in the expenditure of the serving households leads to bias-free estimates of average per capita consumption as well as total consumer expenditure. However, donors of free cooked meals are likely to be concentrated at the upper end of the per capita expenditure range and the corresponding recipients at the lower end of the same scale. Consequently, the derived nutrition intakes may get inflated for the rich (net donors) and understated for the poor (net recipients). This point has to be kept in mind while interpreting the NSS consumer expenditure data for studies relating to the nutritional status of households.” (GoI 2006b, p.5). 8 In fact, there is evidence to show that “free meals eaten outside
8 This problem must have been quite serious during the 50s and 60s when wage payment in kind like meals from the employer- to the employee- household used to be substantial, that is, more than 50 per cent of the total wage payments. This must have resulted in overestimation of poverty for the 1950s and 1906s and the extent of
6
home are concentrated at the lower end of the MPCE but are not counted against the receiving households. In the survey, they get counted against the serving households thereby the calorie intakes of serving households getting inflated in relation to actual. If crude adjustment suggested …were made, the deficits in calorie intake in relation to norm for the poorer households would be reduced and correspondingly the surpluses of the richer households would undergo downward adjustment.” (GoI 2007c, p. 35).
3.2.2. In pursuit of unbiased estimates of averages, the survey is generally carried out in the
form of successive sub-rounds spread over an agricultural year. This is to take into account seasonal variations in income and consumption in a monsoon dependent agricultural economy. This is an important factor, which has not been considered while choosing the reference year for the poverty line estimated by the Task Force (GoI 1979b). The National Sample Survey on consumer expenditure during the 28th round was not spread over the full agricultural year but lasted from October 1973 till June 1974. One would expect consumption estimates for the bottom decile groups to be much more sensitive to seasonal variations than those for the richer decile groups.9
3.2.3. The factors listed above would affect estimates of calorie Engel functions and hence,
calorie deprivation based on such a data set. Given that the poverty lines were estimated by inverse linear interpolation of the calorie Engel function, one is not sure how reliable would be the estimates of the poverty lines and under-nutrition, for rural India in particular.
3.2.4. In addition, there is also the question regarding the representativeness of the NSS
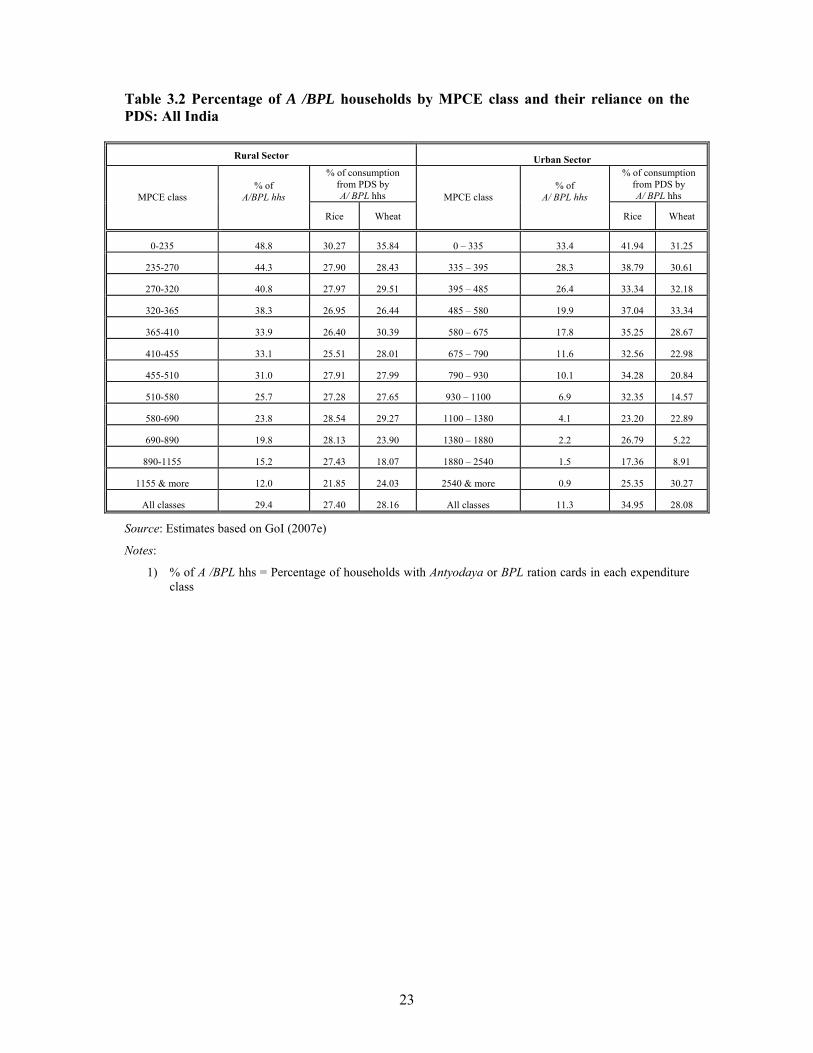
distribution (Suryanarayana 2008a). For instance, there is a general belief that the NSS 61st round data for the year 2004-05 is relatively nuisance-free. The current Expert Group, in all probability, would use this data to look into issues regarding revising the methodology for poverty estimation. However, one is not sure how far the database is reliable and representative. The NSS data for the 61st round reports size distribution of households across twelve percentile classes of monthly per capita consumer expenditure (MPCE) for both rural and urban sectors (Table 3.2). It may be noted that the first four MPCE classes account for the poorest thirty per cent of the population, which exceeds the estimate of poverty. But they do not exhaust the set of households with Antyodaya or Below Poverty Line (BPL) cardholders. More than half of the households in these MPCE classes do not have the Antyodaya or BPL ration cards. Percentage number of households possessing the Antyodaya or the BPL ration cards, of course, decline across higher percentile classes of expenditure in both rural and urban sectors. In rural India, even the richest percentile class (consisting of the richest five per cent of the rural population) includes households possessing the Antyodaya or the BPL ration cards: Nearly one (0.8) percent have the Antyodaya card and about 11 % have the BPL-card. In urban India, at least one-hundredth of the richest five per cent have the BPL-card. In other words, majority of the households
overestimation must have declined since then with monetization of the labour market in rural India (Suryanarayana 2000). 9 For similar reasons, one would expect biased estimates for the NSS 27th round (October 1972 – September 1973) and 38 round, which was conducted during a calendar year (January-December 1983).
7
with Antyodaya or BPL ration cards are APL.10 The NSSO explains this feature as follows: “It should be mentioned here that the MPCE of a household is based on its consumption expenditure during the last 30 days. A poor household that bought a durable good during the 30 days prior to the date of survey might conceivably be placed in a higher MPCE class than the class in which its usual MPCE lies.” (GoI 2007e, p. 16; Footnote # 3). One cannot vouch for the validity of this explanation since it would mean that majority of the “usually” poor households fall in the APL classes and hence, would amount to stating that the NSS estimates of consumption distribution do not represent the “usual MPCE”. Either way the information content and hence, policy relevance of the data becomes suspect.
3.3 Methodology
3.3.1 The decline in calorie intake despite an increase in per capita consumer expenditure is
not a recent finding. The Expert Group itself has presented evidence based on the NSS estimates for 1977/78 and 1983 and observed “a decline in the average intake of calories across expenditure classes even though, the real per capita expenditure has been rising.” (GoI 1993; p. 15). The Group has explained this finding in terms changes in consumption patterns. But estimates of such changes were at current prices and the interpretations were independent of the underlying database, its design and changes in institutional factors. 11
3.3.2 Attempts have also been made to correlate observed changes in all-India consumption
patterns that of cereals in particular with those in relative prices. But, it may be noted that the all-India profile is simply an aggregation over the experiences of states specialized in rice, or wheat, or jowar, etc. and simple explanations/explorations in terms of a rational behaviour of a representative consumer may not make much sense for the following reasons:
3.3.2.1 The regional differences in the predominant cereal in the consumption pattern of
different states correspond to the local crop production pattern. A state-wise analysis brings out that the larger reductions in total cereal consumption have occurred in the predominantly coarse cereal growing and consuming states of Andhra Pradesh, Gujarat, Karnataka, Maharashtra, Rajasthan and Uttar Pradesh (Suryanarayana, 1996). And decline in coarse cereal production and hence, consumption has accounted for much of the decline in total cereals consumption.
10 Estimated poverty lines for rural and urban India for the year 2004-05 are Rs 356.30 and Rs 568.60 respectively (GoI, 2007b). 11 The extent of change in consumption patterns as revealed by estimates of item wise budget shares at constant prices (using disaggregate Laspeyers’ price indices) is much less than price-unadjusted budget shares. Such estimates by decile-group-specific deflation showed some improvement in levels of living since 1977, but cereal consumption showed little or marginal improvement in both rural and urban sectors. This could be because of an increase in average cereal cost resulting from changes in cereal consumption basket in favour of superior but costlier cereals necessitated by a decline in coarse cereal availability. This factor combined with increasing landlessness and casualisation of rural labour market increased the market dependence of the poor households and adversely affected that part of their consumption through market purchases and hence total cereal consumption in the rural sector. The extent of decline is relatively less in the urban sector, perhaps due to regular availability of food grains through the PDS (Suryanarayana, 1995, 2000).
8
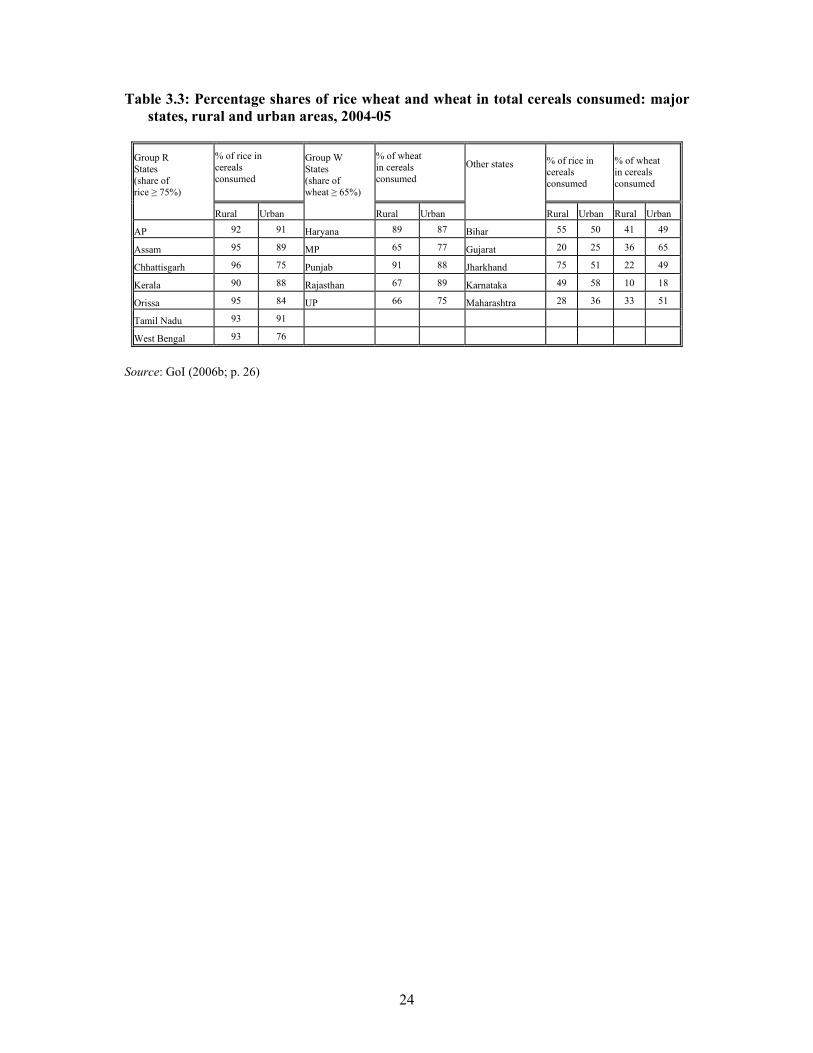
3.3.2.2 In general, for many states/regions there is a single cereal like rice or wheat dominating the local cereal consumption basket. This holds good even today (Table 3.3). Hence it may not make much sense to explain observed changes cereal consumption in terms of relative cereal prices.
3.3.2.3 The relative-price-change and substitution effect hypothesis for the decline in coarse cereal consumption may not be valid for the poorer sections in particular. This is because coarse cereals continue to be the cheapest among cereals (Table 4.7) and at sub-subsistence level of living one would expect the poor to decide by absolute prices rather than relative ones.
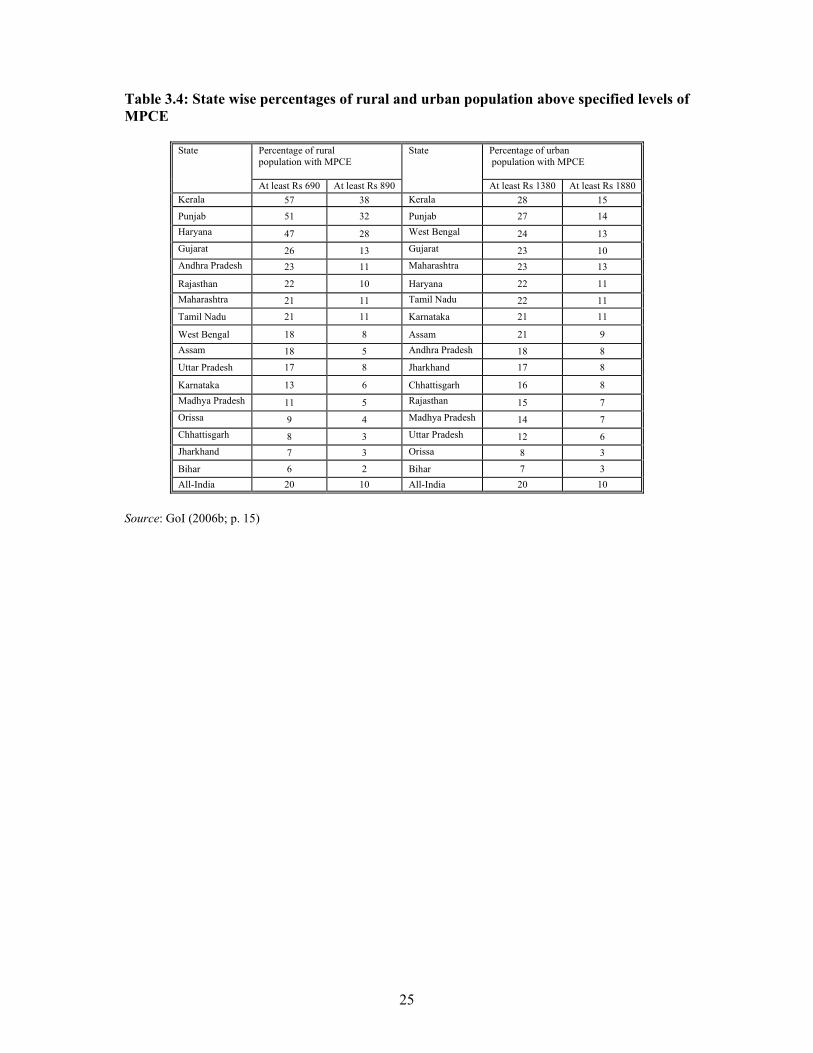
3.3.2.4 Over time, due to differential growth experiences of states, there have been re-ordering of state distributions. In particular, Kerala, which used to have an average per capita consumption less than the all-India average, has grown faster since the 1973-OPEC crisis; it now enjoys the highest average per capita consumption (Table 3.4 and GoI 2006b). But consumption basket and levels of calorie intake and responses are different for Kerala and other states. This could be one reason for observed peculiarities in calorie response to changes in average per capita real consumption for India as a whole.
3.3.2.5 Further, due to differences in state-specific policies on taxes and subsidies, the constraints on consumers differ across states
3.3.2.6 In sum, the issues listed above raise questions about he validity of the specification of an aggregate demand function to explain observed changes in consumption patterns and hence, also Engel function used to work out the poverty lines.
3.3.3 The apparently paradoxical findings on growth with a decline in average calorie
intake status received much attention particularly in the reform era, which laid emphasis on cost-efficiency via interventions targeted with reference to consumer expenditure-based poverty norms.
3.3.4 Several studies have come out with similar findings, which have been used for policy
evaluation from different perspectives. For instance, the High Level Committee (HLC) on Long Term Grain Policy (GoI, 2002e) has found that more than 70 per cent of the population had a per capita energy intake less than 2100 calorie (kcal) per day for some years since 1993-94. The HLC also found that the bottom 80 per cent of the rural and the bottom 40 per cent of the urban households respectively spend more than 60 per cent of their total expenditures on food. However, the estimates of consumption poverty were only 37.37 per cent for rural Indian and 32.36 per cent for urban India in 1993-904. The HLC observed that the magnitude of food insecurity by the calorie intake / food share criterion was more than the incidence of poverty in India. Therefore, it has concluded that any attempt to target a safety net like the Public Distribution System only to the poor would end up penalizing the non-poor but food insecure (as defined in terms of calorie deprivation).
3.3.5 The issue raised by the HLC provides an empirical illustration of a well-known
methodological problem: Though (a) the concepts of both poverty and food insecurity are anchored in terms of a subsistence food-consumption / calorie-intake norm, and (b) their estimates are based on the same consumer expenditure data set and hence, tally for any reference year, the two estimates would however differ for subsequent years because of differences in methodology. Estimates of poverty for subsequent years are made on the basis of data on consumer expenditure distribution (at current prices) with reference to poverty lines suitably adjusted only for changes in cost of
9
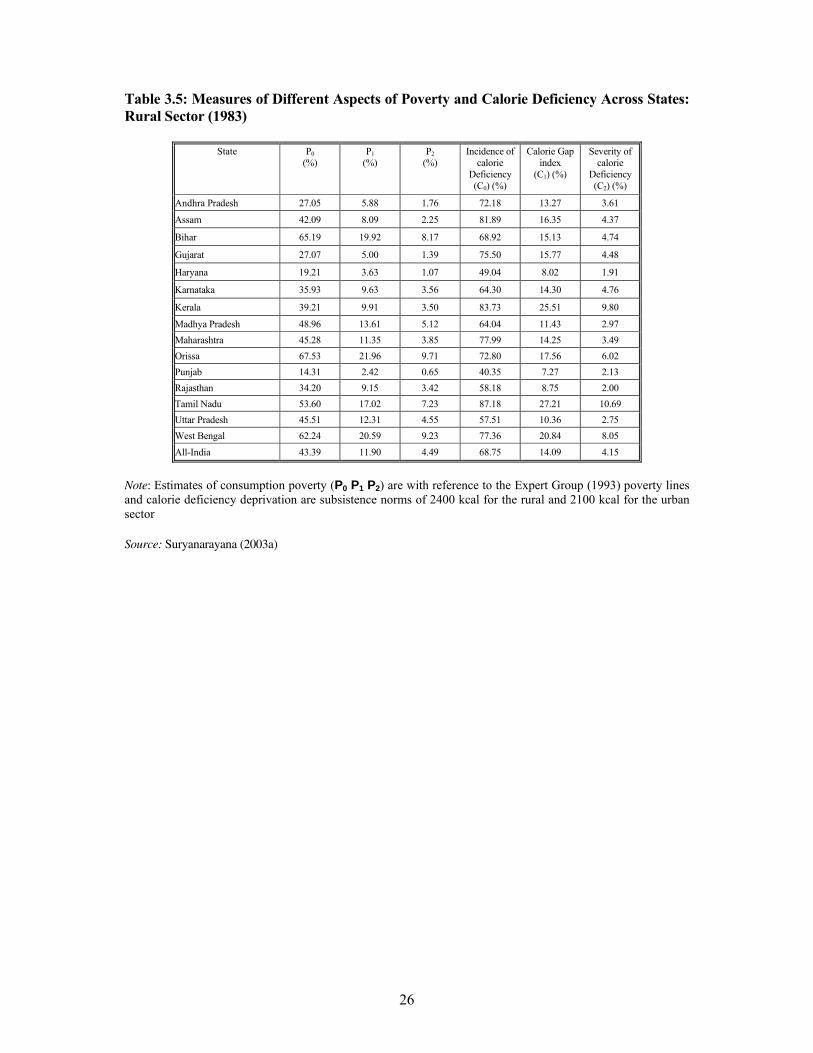
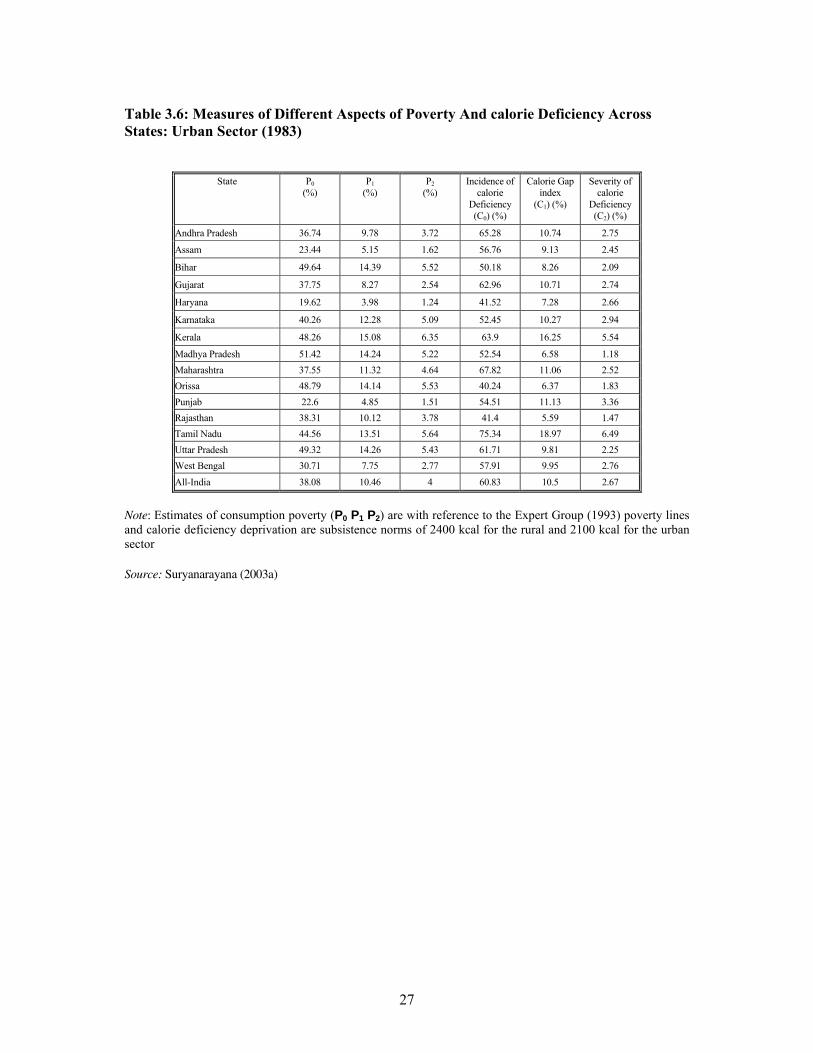
living. In contrast, food insecurity estimates are based on observed data on physical measures, such as cereal consumption and calorie intake which are realizations in response to changes in not only cost of living, including relative prices, but also tastes and preferences, as well as a host of other factors. Hence, the set of poor identified and estimated in terms of an economic access (monetary) measure need not necessarily tally with the set of food insecure (by base year norm) in terms of a physical measure for a subsequent year. 12 This is borne out by estimates of poverty and calorie deficiency for India as a whole as well states by sectors for a subsequent year, say 1983 (Tables 3.5 and 3.6)
3.4 Calorie Norms for Poverty Line
3.4.1 The HLC (GoI 2002e) and similar studies seem to have interpreted mean based averages and summary measures like incidence of calorie deficiency without much attention to the disaggregate details.13 This can have implications for interpretations particularly when dealing with consumption/food/calorie distributions, which are positively skewed. This is because mean based averages are not robust estimators for skewed distribution and would reflect changes in the upper percentiles than in the mainstream or location of distribution.
3.4.2 A disaggreagate analysis of calorie intake by decile group has shown that incidence
of calorie deficiency has increased in both rural and urban sectors because the calorie intakes of the richer decile groups have declined and those of the poor, though increased, still fall below the conventional normative minimum (Suryanarayana 2003b). The decline in the calorie intake of the richer sections could be explained in terms of changing consumption patterns in favour of non-calorie food and non-food items at the expense of calorie intake. Moreover, the poor seem to have opted for some diversification in consumption providing a more nutritious diet though not necessarily adequate energy (Suryanarayana, 1995a).14 But such worsening shortfalls in food grain consumption and calorie intake are not corroborated by final outcome indicators, such as anthropometric measures and other indicators of health status, which show some improvement (Suryanarayana, 1997). In other words, policy efforts by the GoI in terms of targeted programmes to promote both economic and physical access to food grains, better physical infrastructure and medical facilities seem to have paid dividends in terms of improved living conditions and health status and hence, reduced calorie requirement. Therefore, the observed decline in cereal consumption and calorie intake need not necessarily indicate worsening food insecurity situation. This could be interpreted as a call for revisions in nutrition norms by triangulating input, output and final impact measures for assessing food security.
12 The Expert Group has noted this methodological difference but has favoured the former approach on grounds of comparability of results: The difficulty with the second approach is that “it is difficult to make a meaningful comparison of poverty incidence across States at any given point of time because of inter-State variation in the composition and quality of the consumption basket associated with the given calorie norm. The composition of the basket differs not only due the differences in tastes and preferences, but also, it appears, due to the differences in income levels. As the incomes change, the basket changes over time as well” (GoI 1993, p. 56). 13 See for instance, GoI (2008; p. 132) 14 A major reason for diversification could be monetization of the rural labour market necessitating purchases of food grains and complementary food items & kitchen overheads (Suryanarayana 2000).
10
4 Current Scenario on Nutrition and Poverty
4.1 Studies in general are based on mean-based estimates of consumer expenditure, cereal consumption and calorie intake and summary measures of calorie deprivation like incidence of calorie deficiency and conclude that under-nutrition and food insecurity has increased in India. Of course, estimates by the official poverty-line-calorie norms (GoI 1979b) show that incidence of calorie deficiency is 85 per cent in rural India and 65 per cent in urban India (Table 3.1). But it is important to examine the disaggregate profiles of such changes and their implications.
4.2 This section examines changes in consumer expenditure, cereal consumption, and
calorie intake at the al India level since 1972/73 to address the following questions: What is the status of the real consumer expenditures of the poorer decile groups during the sample period under review? What do the estimates of cereal quantities consumed for different population groups suggest? How far they tally with such estimates for the total population? What have been the temporal changes in calorie intake across different decile groups? How valid are the exogenous norms for threshold levels of calorie intake worked out in the 1960s and 1970s since when the economy has experienced structural and technological changes and improvements? How far the self-perception of the population with reference to adequacy of food consumption corroborates such findings? How far these measures and interpretations are validated by estimates of final health outcome parameters? The following sub-sections examine these issues.
4.1 Consumption Expenditure, Cereal Consumption and Calorie Intake
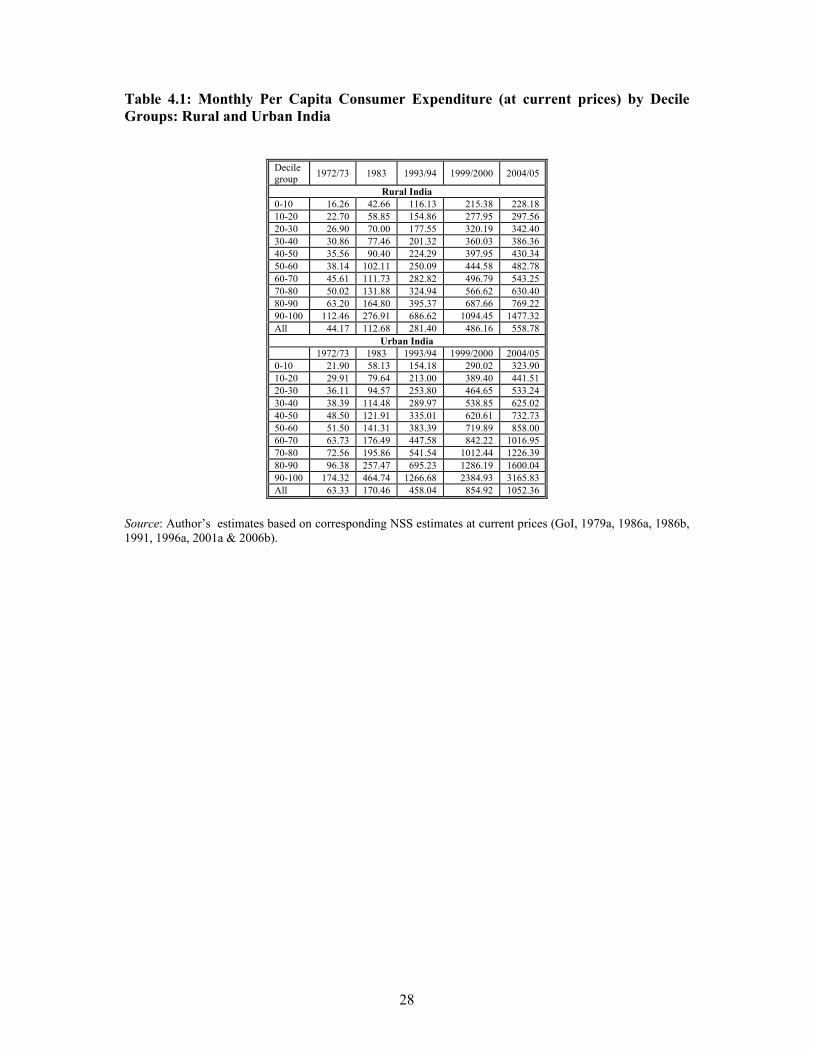
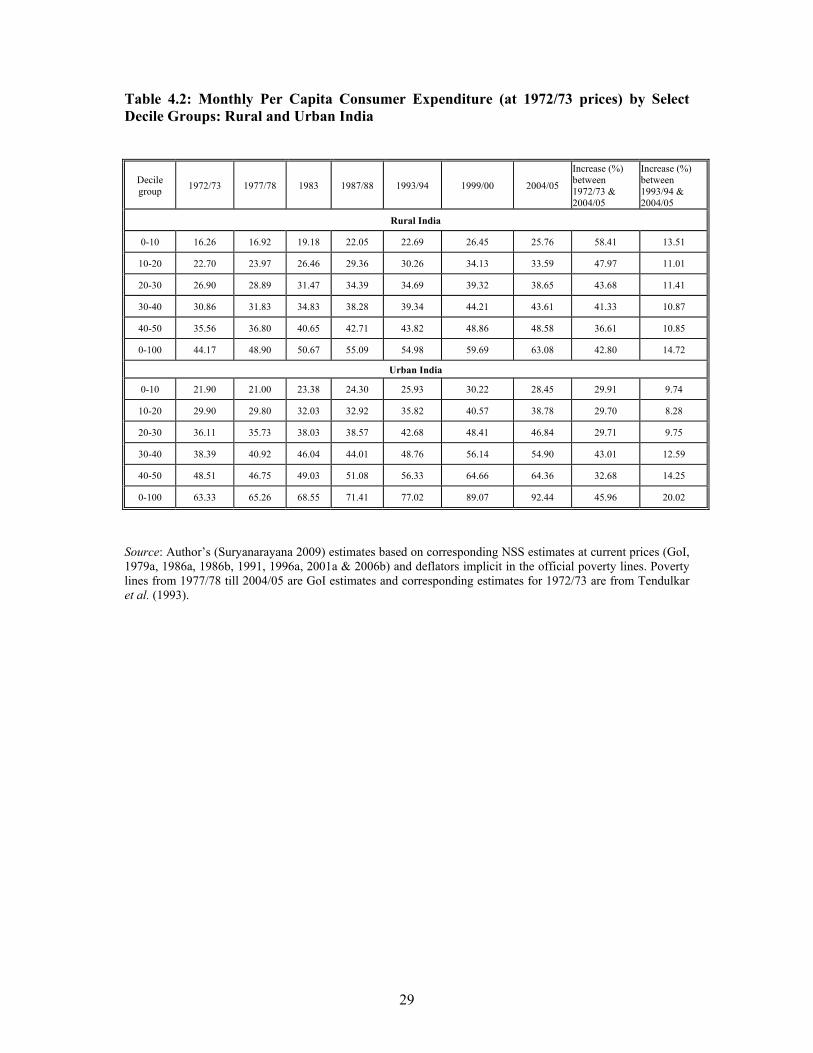
4.1.1 To examine the changes in real consumption distribution, Table 4.1 provides estimates of decile group wise per capita consumer expenditure at current prices for rural and urban India for the different years for which estimates from the NSS quinquennial rounds are available. The estimates at 1972-73 prices (Table 4.2) are obtained using deflators implicit in the poverty lines for the corresponding years. In other words, the estimates presented in Table 4.2 are obtained using common deflators for all the decile groups in rural and urban India separately.15 The estimates of these deflators show that the cost of living for the poor household increased by about 785 per cent in rural India and 1040 per cent in urban India between the terminal years. 16 The estimates of averages for both rural and urban India show that real per capita consumption levels have increased by more than 40 per cent since 1972/73 (Table 4.2). The increases have been progressive in rural India in the sense that the poorest three decile groups enjoyed greater percentage increases in their real
15 Ideally decile group specific estimates at constant price should be obtained using decile group specific deflators to account for differences in consumption baskets. For time and information constraints, this could not be done. The results from Suryanarayana (1995a) obtained using fractile-group-specific deflators based on Minhas et al.’ representative price indices for rural and urban India for the period from 1972-73 till 1988-89 have brought out the following. In rural India, the poorest three decile groups experienced higher (in percentage terms) increases in consumer expenditure than the whole population. The consumption expenditure (at constant prices) for the rural population as a whole increased by 18.88 per cent; it increased by 32.02 per cent for the poorest and by 28.05 per cent for the second poorest decile group. As regards the urban sector, the corresponding increases for different decile groups were broadly the same, between 16.50 and 20.25 per cent. 16 Not reported here but are available with the author for verification.
11
consumption than the population as a whole and hence, than the relatively better off. However, the increases in real consumption in urban India have been regressive.
4.1.2 Consistent with the observed increases in per capita total consumer expenditures at
constant prices, given the general perception that levels of consumption are low, one would expect increases in cereal consumption expenditure to be a priority. However, cereal expenditure declined for all but the poorest decile group in both rural and urban all-India. Generally the percentage decrease in cereal expenditure was higher for the richer decile groups in both the sectors (Table 4.4).
4.1.3 Both in rural and urban India, the brunt of cereal inflation has been the minimum on
the poorest decile group (Table 4.5). Relative prices have changed. Though prices have increased, coarse cereals continue to be the cheapest among cereal grains. Still both the poor and the rich have reduced their consumption of coarse cereals with the difference that the poorer decile groups in both rural and urban all-India have substituted coarse cereals by superior cereals. The net result is that only the poorest decile group enjoyed an increase (about 10 per cent) in total cereal consumption in rural and urban all-India; rest experienced a decline in cereal consumption (Table 4.6). The estimates of average per capita cereal quantities consumed for the total population show a decline in both rural and urban India during sample period under consideration (Table 4.6). A profile across decile groups of population shows, as could be expected for a mean based average, that the decline in average per capita cereal consumption for the total rural and urban population has largely been due to a pronounced decline in cereal consumption of the top decile groups.
4.1.4 With the decline in average cereal consumption, a decline in average calorie intake
would follow unless accompanied by compensating increases in non-cereal consumption. Though cereal consumption increased only for the poorest decile group (Table 4.6), per capita calorie intake has generally increased for the bottom two decile groups in rural and bottom three decile groups in urban all-India. This would suggest that there have been compensating increases in non-cereal consumption for the bottom two/three decile groups of the rural/urban population. Still their calorie intakes fall short of the norms used for defining the poverty lines. On the other hand, top decile groups have reduced their cereal consumption and hence, calorie intake by choice. The combined impact of these two diverse patterns of changes is that estimates of incidence of calorie deficiency by the conventional calorie norms for the total (rural and urban combined) population turns out to be higher about 80 per cent for India.
4.1.5 Intake of fat in general for all decile groups (Table 4.10) and that of protein for the
poorest decile groups (Table 4.9) in both rural and urban India has improved over time. While per capita fat intake is higher than the norm (16g/person/day) even for the poorest decile group, that for protein is less than the norm (48g.person./day) only for the poorest two decile groups in rural and urban India. Since calorie-intake is the critical factor limiting even fat-protein absorption, one may consider threshold minimum of calorie intake only.
4.1.6 The calorie norms cited above have been worked out in the 1970s and hence, may be
outdated and irrelevant with improvements in modes of production and standard of living. This could be one of the major reasons for voluntary reductions in cereal
12
consumption and calorie intake of the richer decile groups. This would raise a question on the relevance of the official calorie norm for food security estimates. Given the different but converging time-profiles of calorie intake across decile groups, one option could be to consider the converging limits as the subsistence norms as done in Suryanarayana and Dimitri (2007). The corresponding calorie limits based on the updated sample till 2004-05 turn out to be 1800 for rural India and 1860 for urban India (Table 4.8).17 This looks unreasonable since generally one would expect a higher calorie norm for the rural sector given the occupation specific characteristics.
4.1.7 This would raise a number of following questions: How to go about verifying their
validity? How far state-wise time profiles of changes in energy intake by decile groups replicate the all-India scenario? Could information of on subjective perceptions of adequacy of food consumption and morbidity be taken as evidence? How far measures of association between different indicators would validate these measures? What is the evidence?
4.2 State wise evidence on energy intake, perceptions on food adequacy & health status
4.2.1 This diverse profiles of changes in calorie intake across decile groups holds generally
good for all major states but for differences in consumer expenditure percentiles where they seem to converge (Tables 4.18 – 4.32). For the rural and urban sectors of Punjab and Rajasthan and rural sector of Haryana and UP, calorie intake has decreased for all decile groups between 1972-73 and 2004-05. This has happened even for the poorest decile groups with energy intake at less than 1600 kcal. (see for instance Punjab (Table 4.28)). On the other hand, in Kerala, which was noted for its “health active woman” even at levels of energy intake (1300 to 1400 kcal.) much less than the prescribed allowance (Sukhatme, 1981, p. 1323), even the ninth decile group of rural population continues increasing its energy consumption at levels higher than 2400 kcal. per capita per day today (Table 4.24).
4.2.2 It should be noted that the reductions in calorie intake in general have been taking
place almost on a sustained basis for the past three decades (since 1972-73). Given the general perception about the importance of energy in human diet, this should have spelt a sustained health disaster, which has not happened. Instead there has been some improvement though not on a scale and pace consistent with observed economic growth. This might be because of either compensating changes in diets or related health parameters, which calls for some academic attention or irrelevance of energy as the major determinant of physical capability and health.
4.2.3 Since its 38th round (1983), the National Sample Survey Organization has
periodically asked what are called probing questions like whether the household gets two square meals a day through out the year. Such questions were asked during the 38th (1983), 50th (1993-94) and the 61st (2004-05) rounds. Till the 55th round, the
17 The Corresponding estimates of per capita consumer expenditure per month at current prices for 2004-05 work out to be Rs 342 and 625 respectively for rural and urban India (Table 4.1). To provide some margin for error, one may consider the upper terminal values for these decile groups as poverty lines, that is, Rs 365 and 675 respectively.
13
investigator asked direct question to the household. In 1983, 81 per cent of the rural households reported adequate food consumption (two square meals a day); this percentage increased to 95 in 1993-94, 96 in 1999-2000 and to 97 in 2004-2005 (Table 4.11). In the urban sector, corresponding number increased from 93 per cent in 1983 to 99 percent in 1999-2000 and 2004-2005. In sum, this piece of evidence corroborates the perception that the population is well fed.
4.2.4 Some relevant information on health status is provided in Tables 4.12 to 4.14. The
estimates of association as measured by rank correlation coefficients are presented in Table 4.15. The estimates of association do not make much sense. For instance, cross sectional evidence on rural household perceptions on adequate food consumption co vary inversely with estimates of per capita calorie intake across states while the association is insignificant for the urban sector. Consistent with this finding, household perception on food adequacy bears significant positive association with incidence of calorie deficiency (with reference to alternative norms) in the rural sector and no association in the urban sector. Only sensible estimate of association pertains to the ones between calorie intake and incidence of calorie deficiency in both rural and urban sectors. Other measures of association between subjective and objective measures of food security and alternative measure of morbidity/health consciousness are insignificant for the rural sector. As regards the urban sector, either they are insignificant or do not makes any sense. For instance, association between incidence of calorie efficiency and infant mortality is significant and inverse implying that higher the incidence of calorie deprivation lower is incidence of infant mortality, which is absurd.
4.2.5 While nutrition security per se is important to promote good health outcomes, the
latter depend crucially on other important factors like biology, choice and environment. The states of Kerala and Tamil Nadu provide evidence of high health status despite poor calorie intake due to largely to other factors like safe drinking water, hygiene and awareness. Most important is to recognize prevalence of morbidity rates across sates, which definitely would affect the utilization of nutrients consumed. In sum, it is important to distinguish between input and outcome measures and recognize that the process is not instantaneous to generate contemporaneous correlations; instead, there would be lags also. There is limited scope for cross-sectional / time series comparisons between incomes/growth rates, malnutrition and health outcomes using the available statistical information.
4.2.6 All these results could mean that the available statistical information on energy intake
parameter per se has little policy relevance. Hence, one could explore alternative options for distributional outcome evaluation in the revised policy context during the New Millennium when the country has transformed itself into one of the fastest growing economies in the world. With growth confined to only a few sectors and regions, inequalities have begun to widen, which have become transparent and strike in the information era. Hence, it is important to set sights high for not only sustaining the growth process but also make it broad based and inclusive as visualized in the Eleventh Five Year Plan.
14
5 Recommendation
5.1 Norm for Broad based Growth, which is Inclusive 5.1.1 The concept of absolute poverty made sense in an era of material deprivation and
limited growth in income when the policy agenda was to ensure a subsistence minimum for the population. With growth and development involving structural changes and widening disparities, the policy agenda is no longer cast in terms of ensuring a subsistence minimum but in terms of inclusion in the mainstream growth process.
5.1.2 Given this perspective, a major question that arises is as follows: How to measure
growth performance and inclusion? Government policy documents as well as academic studies generally measure growth performance or welfare improvement in terms of mean-based averages of income/consumption. A mean-based estimator of average is not a robust measure for a skewed distribution like that of household/personal income/consumption. Hence, it would make sense to use order-based measures for welfare appraisals using data on household/personal income/consumption distributions.
5.1.3 A broad based growth process may be characterized as one wherein there is all-round
improvement as reflected in the three alternative perspectives of macro economy, viz., production, income and expenditure. Such improvements may be measured in terms of a robust order-based average like the median. We may define inclusion (participation) of the relatively deprived in such a growth process with reference to the order-based average of the outcome measure only, that is, assess their economic status with reference to a threshold, specified as a function of the median.
5.1.4 In the absence of comprehensive and related information on production (in particular)
and income accounts, one would not be able to estimate and examine order-based averages and inclusion coefficients for the three different macro dimensions. The only feasible option is that based on household consumption distribution. In such a context, profiles of inclusion could be examined to some extent by examining mean-based estimate of average income (from the NAS) and consumption from the NSS, and order-based estimates of inclusion in consumption distribution. The relevant measures could be as follows:
5.1.4.1 Elasticity of mean consumption with reference to mean income (η), which would
indicate, from an economic perspective, whether growth in income is really broad based and inclusive since if growth were concentrated at the top, even mean consumption would not increase at a corresponding rate and η would be less than unity.
Elasticity of mean consumption with reference to mean income (η) =
y
y
c
c
μμ
μμ
∂
∂
,
Where μc and μy stand for mean consumption and mean income respectively.
15
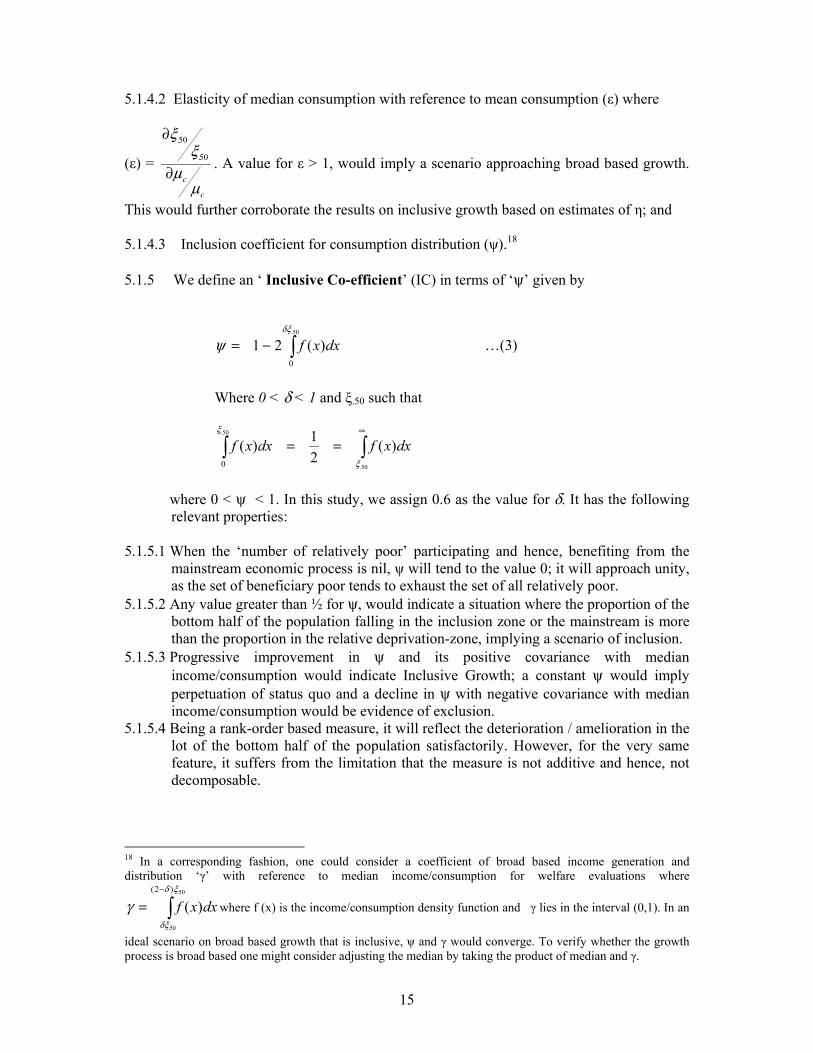
5.1.4.2 Elasticity of median consumption with reference to mean consumption (ε) where
(ε) =
c
cμ
μξ
ξ
∂
∂50.
50.
. A value for ε > 1, would imply a scenario approaching broad based growth.
This would further corroborate the results on inclusive growth based on estimates of η; and 5.1.4.3 Inclusion coefficient for consumption distribution (ψ).18 5.1.5 We define an ‘ Inclusive Co-efficient’ (IC) in terms of ‘ψ’ given by
∫−=50.
0
)(21ξδ
ψ dxxf …(3)
Where 0 < δ < 1 and ξ.50 such that
∫∫∞
==50.
50.
)(21)(
0 ξ
ξ
dxxfdxxf
where 0 < ψ < 1. In this study, we assign 0.6 as the value for δ. It has the following relevant properties:
5.1.5.1 When the ‘number of relatively poor’ participating and hence, benefiting from the
mainstream economic process is nil, ψ will tend to the value 0; it will approach unity, as the set of beneficiary poor tends to exhaust the set of all relatively poor.
5.1.5.2 Any value greater than ½ for ψ, would indicate a situation where the proportion of the bottom half of the population falling in the inclusion zone or the mainstream is more than the proportion in the relative deprivation-zone, implying a scenario of inclusion.
5.1.5.3 Progressive improvement in ψ and its positive covariance with median income/consumption would indicate Inclusive Growth; a constant ψ would imply perpetuation of status quo and a decline in ψ with negative covariance with median income/consumption would be evidence of exclusion.
5.1.5.4 Being a rank-order based measure, it will reflect the deterioration / amelioration in the lot of the bottom half of the population satisfactorily. However, for the very same feature, it suffers from the limitation that the measure is not additive and hence, not decomposable.
18 In a corresponding fashion, one could consider a coefficient of broad based income generation and distribution ‘γ’ with reference to median income/consumption for welfare evaluations where
∫−
=50.
50.
)2(
)(ξδ
ξδ
γ dxxf where f (x) is the income/consumption density function and γ lies in the interval (0,1). In an
ideal scenario on broad based growth that is inclusive, ψ and γ would converge. To verify whether the growth process is broad based one might consider adjusting the median by taking the product of median and γ.
16
5.2 Inclusion in a Plural Society 5.2.1 The measures discussed above could be generalized to account for regional/social
groupings and differentials. This is be important for the for the following reasons: 5.2.1.1 Countries like India have a plural society, that is, a society consisting of different
groups like the Scheduled Castes (SCs), Scheduled Tribes (STs), Other Backward Castes (OBCs) and other social groups called ‘Others’.19 For historical reasons, in India these social groups differ with respect to mean as well as distribution of economic welfare, however measured. For instance, in India SCs and STs constitute the socially vulnerable and economically backward classes.
5.2.1.2 In pursuit of social welfare, governments pursue both mainstream economic policies and targeted welfare programmes to uplift the generally backward classes.
5.2.1.3 But, for reasons like Type I and Type II errors, even the targeted programmes do not end up providing for a general improvement of the backward social groups.20 As a result, there are situations when only a subsection of the backward communities get included in the mainstream / benefited from welfare programmes.
5.2.1.4 Therefore, inclusion in a plural society has two dimensions: (i) inter-group and (ii) intra-group. Inter-group dimension could be examined with reference to differences / disparities in median levels of income / consumption expenditure across social groups while the intra-group dimension could be examined in terms of ICs defined with respect to group-specific as well as overall median.
5.2.2 Some details about these measures are as follows: 5.2.2.1 Inter-group inclusion as measured by proximity of sub-group-specific median (ξS
.50) to overall median (of the total /mainstream population, i.e., all sub-groups inclusive given by ξM
.50).21 For a given δ such that (0 <δ < 1), there can be two situations: Case (a): ξS
.50 < δ ξM. 50 implies exclusion of the sub-group
Case (b): ξS.50 ≥ δ ξM
. 50 would imply inclusion of the sub-group concerned.
5.2.2.2 Intra-group inclusion for any given social group ‘i’ could be measured with respect to either own median (ξS
.50) providing a measure of ψiS (that is, IC-Subgroup) or
overall median (ξM. 50 ) providing a measure of ψi
M (that is, IC-Mainstream). These two measures would (a) be distinct and different for situations when there is inter-group exclusion; and (b) converge with progressive inter-group inclusion:
a. IC-Subgroup (ψiS) would measure the extent of inclusion of the bottom
half of the sub-group under review in its own progress.
b. IC-Mainstream (ψiM) would measure the extent of inclusion of the bottom
half of the sub-group under review in the progress of the country/society as a whole. The limits for IC-Mainstream (ψi
M) are as follows:
19 For that matter, one could consider different occupations/regions/sectors/states instead of social groups. 20 When a targeted welfare programme fails to reach/benefit the intended beneficiaries, it is called Type I error. Type II error refers to a situation when the programme benefits the unintended beneficiaries (Cornia and Stewart 1993). 21 The mainstream median (ξM
.50) may be defined with reference to different combinations of the social groups including as well as excluding the sub group under review depending upon the context. For illustration purpose, we have considered the median of the total population here.
17
ψiM = (-) 1 implies perfect exclusion of the sub-group
ψiM = 1 implies perfect inclusion of the entire subgroup
5.2.2.3 IC index in a Plural Society: The ratio (ωi) of IC-Mainstream (ψi
M) to IC-Subgroup (ψi
S) for a given social subgroup ‘i’ would provide a measure of its inclusion from an integrated perspective.
Si
Mi
i ψψω = …(4)
where ‘ψi
M ’ = IC-Mainstream defined with respect to median of the total population (ξM
.50) ‘ψi
S’ = IC-Subgroup defined with respect to median of the Social group population (ξS
.50)
The conceptual Limits for IC index (ω) are given below:
ω = (-) infinity implies perfect intra- and inter-exclusion. ω = infinity implies perfect intra-exclusion and inter-inclusion of the entire subgroup.
5.2.2.4 For situations when ξS.50 < δ ξM
. 50, a comprehensive measure of inclusion for the entire (as against for the bottom half) social sub-group ‘i’ population in the mainstream would be indicated by the β-measure given by:
βi = ½ (1 + ψiM ) …(5)
where 0≤ βi ≤1.
The β-measure indicates the proportion of the subgroup population participating/included in the growth process as reflected in outcome measures like consumer expenditure distribution. Its limiting values will be zero and one; it will be zero when the entire social sub group is excluded from the mainstream and unity, otherwise.
5.2.2.5 An empirical illustration for the measures discussed above is available in
Suryanarayana (2008b)
18
References Cornia, Giovanni Andrea and Frances Stewart (1993):"Two Errors of Targeting". Journal of International Development, Vol. 5, No.5, pp. 459-496. Dandekar, V.M. and N. Rath (1971): Poverty in India, Indian School of Political Economy, Lonavala. Government of India (1962): “Perspective of Development: 1961-1976: Implications of Planning for a Minimum Level of Living”, reprinted in Srinivasan, T.N and P.K. Bhardhan (eds.) (1974): Poverty and Income Distribution in India, Statistical Publishing Society, Calcutta, pp. 9-38. Government of India (1979a): “Survey Results: Consumer Expenditure: NSS, 27th Round (October1972- September 1973)”, Sarvekshana: Journal of he National Sample Survey Oganisation, Department of Statistics, Ministry of Planning, pp. S287-S436. Government of India (1979b): Report of the Task Force on Projections of Minimum Needs and Effective Consumption Demand, Perspective Planning Division, Planning Commission, New Delhi. Government of India (1981): A Technical Note on the Sixth Plan of India (1980-85), Perspective Planning Division, Planning Commission, New Delhi. Government of India (1983): “A Note on Per Capita Per Diem Intake of Calories, Protein and Fat based on the Data Collected in the Household Survey on Consumer Expenditure, NSS 27th Round : October 1972 - September 1973', Sarvekshana, Vol. VI, Nos. 3-4, 1983. Government of India (1985): “The Seventh Five Year Plan1985-90 Vol. II, Planning Commission, New Delhi. Government of India (1986a): “Some Results on the Second Quinquennial Survey on Consumer Expenditure: National Sample Survey Thirty-second round (July ’77-June ’78)”, Sarvekshana, Vol. IX, No. 3, pp. S51-S184. Government of India (1986b): “A Report on the Third Quinquennial Survey on Consumer Expenditure: National Sample Survey. Thirty-eighth round (January-December 1983)”, Sarvekshana, Vol. IX, No. 4, pp. S1-S102. Government of India ((1986c): A Technical Note on the Seventh Plan of India (1985-90), Planning Commission, New Delhi. Government of India (1989a): “Results on Per Capita Consumption of Cereals for Various Sections of Population: NSS 38th round (1983)”, Sarvekshana, Vol. XIII, No. 2, pp. S1-S176. Government of India (1989b): “Results on Per Capita and Per Consumer Unit Per Diem Intake of Calorie, Protein and Fat and Perceptions of the People on Adequacy of Food”, Sarvekshana, Vol. XIII, No. 2, Issue No. 41, pp. S177-S258.
19
Government of India (1991): “Results of the Fourth Quinquennial Survey on Consumer Expenditure (sub-sample 1) : NSS 43rd round (July 1987 - June 1988)”, Sarvekshana, Vol. XV, No. 1, pp. . Government of India (1992): Bulletin on Food Statistics: 1991, Ministry of Agriculture, New Delhi. Government of India (1993): Report of the Expert Group on Estimation of Proportion and Number of Poor, Perspective Planning Division, Planning Commission, New Delhi. Government of India (1996a): Level and Pattern of Consumer Expenditure. 5th Quinquennial Survey 1993-94, Report No. 402, National Sample Survey Organisation, Department of Statistics, New Delhi. Government of India (1996b): Nutritional Intake in India NSS 50th Round July 1993-June 1994 Fifth Quinquennial Survey on Consumer Expenditure, Report No. 405, National Sample Survey Organisation, Department of Statistics, New Delhi. Government of India (2001a): Level and Pattern of Consumer Expenditure in India 1999-2000 NSS 55th Round July 1999 – June 2000, Report No. 457 (55/1.0/3), National Sample Survey Organisation, Ministry of Statistics & Programme Implementation, New Delhi. Government of India (2001b): Reported Adequacy of Food Intake in India 1999-2000 NSS 55th Round (July 1999-June 2000), Report No. 466(55/1.0/7), National Sample Survey Organisation, New Delhi. Government of India (2001c): Nutritional Intake in India 1999-2000 NSS 55th Round (July 1999-June 2000), Report No. 471(55/1.0/9), National Sample Survey Organisation, New Delhi. Government of India (2002d): Tenth Five Year Plan (2002-2007), Planning Commission, New Delhi. Government of India (2002e): Report of the High Level Committee on Long-Term Grain Policy, Ministry of Consumer Affairs, Food & Public Distribution, New Delhi. Government of India (2006a): Morbidity, Health Care and the Condition of the Aged NSS 60th Round (January - June 2004), Report No. 507(60/25.0/1), National Sample Survey Organisation, New Delhi. Government of India (2006b): Level and Pattern of Consumer Expenditure, 2004 –2005, NSS 61st Round (July 2004 – June 2005), NSS Report No. 508(61/1.0)/1), National Sample Survey Organisation, Ministry of Statistics and Programme Implementation, New Delhi. Government of India (2007a): Perceived Adequacy of Food Consumption In Indian Households 2004-2005 NSS 61st Round (July 2004-June 2005), Report No. 512(61/1.0/5), National Sample Survey Organisation, New Delhi. Government of India (2007b): Poverty Estimates for 2004-05, Press Information Bureau, New Delhi, India.
20
Government of India (2007c): Nutritional Intake in India 2004-2005 NSS 61st Round (July 2004-June 2005), Report No. 513(61/1.0/6), National Sample Survey Organisation, New Delhi. Government of India (2007d): Economic Survey 2006-2007, Ministry of Finance, New Delhi. Government of India (2007e): Public Distribution System and Other Sources of Household Consumption 2004-2005, Volume I, NSS 61st Round (July 2004- June 2005), Report No. 510(61/1.0/3), National Sample Survey Organisation, Ministry of Statistics and Programme Implementation, New Delhi. Government of India (2008): Eleventh Five Year Plan 2007-12 Volume II Social Sector, Planning Commission, Oxford University Press, New Delhi. Meenakshi, J V and Brinda Viswanathan (2005): “Calorie Deprivation in Rural India between 1983 and 1999-2000” in Angus Deaton and Valerie Kozel (ed.), The Great Indian Poverty Debate, Macmillan), New Delhi, pp 570-583. Minhas, B.S., L.R. Jain and S. D. Tendulkar (1991); “Declining incidence of poverty in the 1980s: Evidence versus aretefacts”, Economic and Political Weekly, Vol. XXVI, Nos. 27 & 28, pp. 1673-1682. Nehru, Jawaharlal (1946): The Discovery of India, The John Day Company, New York. Palmer-Jones, Richard, and Kunal Sen (2001): “On Indian Poverty Puzzles and Statistics of Poverty,” Economic & Political Weekly, Vol. 36, No. 3, pp. 211-217. Patnaik, Utsa (2004): “The Republic of Hunger”, Social Scientist, Vol. 32, Nos. 9-10, pp. 9-35. Patnaik, Utsa (2007): “Neoliberalism and Rural Poverty in India”, Economic & Political Weekly, Vol. 42, No. 30, pp. 3132-3150. Radhakrishna, R (1991): “Food and Nutrition : Challenges for Policy”, Journal of the Indian Society of Agricultural Statistics, Vol. XLIII, No. 3, pp. 211-227 Radhakrishna, R (2005): “Food and Nutrition Security of the Poor: Emerging Perspectives and Policy Issues”, Economic & Political Weekly, vol. 40, No. 18, pp. 1817-1821. Radhakrishna, R, K Hanumantha Rao, C Ravi, and B Sambi Reddy (2004): “Chronic Poverty and Malnutrition in 1990s”, Economic & Political Weekly, Vol. 39, No. 28, pp. 3121-3130. Ray, Ranjan and Geoffrey Lancaster (2005): “On Setting the Poverty Line Based on Estimated Nutrient Prices: Condition of Socially Disadvantaged Groups during the Reform Period”, Economic & Political Weekly, Vol. 40, No. 1, pp. 46-56. Sukhatme, P. V. (1978): “Assessment of Adequacy of Diets at Different Income Levels”, Economic and Political Weekly, Vol. 13, No. 31/33, pp. 1373- 1384
21
Sukhatme, P. V. (1981): “On Measurement of Poverty”, Economic and Political Weekly, Vol. 16, No. 32, pp. 1318- 1324. Suryanarayana, M H (1995): “Growth, Poverty and Levels of Living: Hypotheses, Methods and Policies”, Journal of Indian School of Political Economy, Vol. VII, No. 2, pp. 203-255. Suryanarayana, M H (1996): “Food Security and Calorie Adequacy Across States: Implications for Reform”, Journal of Indian School of Political Economy, Vol. VIII, No. 2, pp. 203 – 265. Suryanarayana, M H (1997): “Food Security in India: Measures, Norms and Issues”, Development and Change, Vol.28, No. 4, pp. 771-789. Suryanarayana, M H (2000a): “Public Policies, Social Development and Poverty Reduction: The Kerala Model” in Halvorson-Quevedo, Raundi and Hartmut Schneider (eds.) Waging the Global War on Poverty: Strategies and Case Studies, OECD, Paris, pp. 157-185. Suryanarayana, M H (2000b): “How Real is the Secular Decline in Rural Poverty?” Economic and Political Weekly, Vol. XXXV, No. 25, pp. 2129-2139. Suryanarayana, M H (2003a): “Nutrition Security in India: Problems and Policies”, Prabhu, K. Seeta and R. Sudarshan (eds.) Reforming India’s Social Sectors: Poverty, Nutrition, Health & Education, Social Science Press, New Delhi, pp. 171-202. Suryanarayana, M H (2003b): “Policies for Nutrition: How Imperative are They?” in Dev, S. Mahendra, K. P. Kannan and Nira Ramachandran (eds.): Towards A Food Secure India: Issues & Policies, Institute for Human Development, New Delhi, pp. 406-432. Suryanarayana, M H (2008a): “Agflation and the Public Distribution System”, Economic and Political Weekly, Vol. XLIII, No. 18, pp. 13-17. Suryanarayana, M H (2008b): “What Is Exclusive About ‘Inclusive Growth’?” Economic and Political Weekly, Vol. 43, No. 43, pp. 91-101. Suryanarayana, M.H. (2009): “Food Security: Beyond the Eleventh Plan Fiction”, in India Gandhi Institute of Development Research (ed.): Indian Development Report 2009 (submitted) (This is a revised version of the paper on food security presented in the plenary session of the International Conference on Health and Development organized by the School of Development Studies, Department of Economics, Kannur University, Thalassery and sponsored by the Indian Council of Medical Research, New Delhi, at Thalassery, 22-23 October 2008. Suryanarayana, M H and D Silva (2007): “Is Targeting the Poor a Penalty on the Food Insecure? Poverty and Food Insecurity in India”, Journal of Human Development, Vol. 8, No. 1, pp. 89-107. Tendulkar, Suresh D., K. Sundaram and L.R. Jain (1993): Poverty in India, 1970-71 to 1988-89, ARTEP Working Papers, International Labour Organisation, Asian Regional Team for Employment Promotion, New Delhi.
22
Table 3.1: Poverty and Calorie Deprivation: Rural and Urban India
Sector Rural Urban Year 1983 2004-05 1983 2004-05 Incidence of Poverty (%) 45.61 28.30 42.15 25.70 Average per capita calorie intake (kcal) 2221 2047 2089 2020 Incidence of calorie deficiency (%) 68.75 85.05 60.82 64.77
Source: (1) Estimates of poverty are from GoI (1993, 2007b) (2) Estimate of average per capita calorie intake are from GoI (1983, 2007c)
(3) Estimates of calorie deprivation are by the author based on GoI (1983, 2007c) with reference to the norms of 2400 kcal for the rural and 2100 kcal for the urban sector
23
Table 3.2 Percentage of A /BPL households by MPCE class and their reliance on the PDS: All India
Rural Sector Urban Sector % of consumption
from PDS by A/ BPL hhs
% of consumption from PDS by A/ BPL hhs MPCE class
% of A/BPL hhs
Rice Wheat
MPCE class % of
A/ BPL hhs
Rice Wheat
0-235 48.8 30.27 35.84 0 – 335 33.4 41.94 31.25
235-270 44.3 27.90 28.43 335 – 395 28.3 38.79 30.61
270-320 40.8 27.97 29.51 395 – 485 26.4 33.34 32.18
320-365 38.3 26.95 26.44 485 – 580 19.9 37.04 33.34
365-410 33.9 26.40 30.39 580 – 675 17.8 35.25 28.67
410-455 33.1 25.51 28.01 675 – 790 11.6 32.56 22.98
455-510 31.0 27.91 27.99 790 – 930 10.1 34.28 20.84
510-580 25.7 27.28 27.65 930 – 1100 6.9 32.35 14.57
580-690 23.8 28.54 29.27 1100 – 1380 4.1 23.20 22.89
690-890 19.8 28.13 23.90 1380 – 1880 2.2 26.79 5.22
890-1155 15.2 27.43 18.07 1880 – 2540 1.5 17.36 8.91
1155 & more 12.0 21.85 24.03 2540 & more 0.9 25.35 30.27
All classes 29.4 27.40 28.16 All classes 11.3 34.95 28.08
Source: Estimates based on GoI (2007e)
Notes:
1) % of A /BPL hhs = Percentage of households with Antyodaya or BPL ration cards in each expenditure class
24
Table 3.3: Percentage shares of rice wheat and wheat in total cereals consumed: major states, rural and urban areas, 2004-05
% of rice in cereals consumed
% of wheat in cereals consumed
% of rice in cereals consumed
% of wheat in cereals consumed
Group R States (share of rice ≥ 75%)
Rural Urban
Group W States (share of wheat ≥ 65%)
Rural Urban
Other states Rural Urban Rural Urban
AP 92 91 Haryana 89 87 Bihar 55 50 41 49
Assam 95 89 MP 65 77 Gujarat 20 25 36 65
Chhattisgarh 96 75 Punjab 91 88 Jharkhand 75 51 22 49
Kerala 90 88 Rajasthan 67 89 Karnataka 49 58 10 18
Orissa 95 84 UP 66 75 Maharashtra 28 36 33 51
Tamil Nadu 93 91
West Bengal 93 76
Source: GoI (2006b; p. 26)
25
Table 3.4: State wise percentages of rural and urban population above specified levels of MPCE
Percentage of rural population with MPCE
Percentage of urban population with MPCE
State
At least Rs 690 At least Rs 890
State
At least Rs 1380 At least Rs 1880 Kerala 57 38 Kerala 28 15 Punjab 51 32 Punjab 27 14 Haryana 47 28 West Bengal 24 13 Gujarat 26 13 Gujarat 23 10 Andhra Pradesh 23 11 Maharashtra 23 13
Rajasthan 22 10 Haryana 22 11 Maharashtra 21 11 Tamil Nadu 22 11 Tamil Nadu 21 11 Karnataka 21 11
West Bengal 18 8 Assam 21 9 Assam 18 5 Andhra Pradesh 18 8 Uttar Pradesh 17 8 Jharkhand 17 8
Karnataka 13 6 Chhattisgarh 16 8 Madhya Pradesh 11 5 Rajasthan 15 7 Orissa 9 4 Madhya Pradesh 14 7 Chhattisgarh 8 3 Uttar Pradesh 12 6 Jharkhand 7 3 Orissa 8 3 Bihar 6 2 Bihar 7 3 All-India 20 10 All-India 20 10
Source: GoI (2006b; p. 15)
26
Table 3.5: Measures of Different Aspects of Poverty and Calorie Deficiency Across States: Rural Sector (1983)
State P0 (%)
P1 (%)
P2 (%)
Incidence of calorie
Deficiency (C0) (%)
Calorie Gap index
(C1) (%)
Severity of calorie
Deficiency (C2) (%)
Andhra Pradesh 27.05 5.88 1.76 72.18 13.27 3.61
Assam 42.09 8.09 2.25 81.89 16.35 4.37
Bihar 65.19 19.92 8.17 68.92 15.13 4.74
Gujarat 27.07 5.00 1.39 75.50 15.77 4.48
Haryana 19.21 3.63 1.07 49.04 8.02 1.91
Karnataka 35.93 9.63 3.56 64.30 14.30 4.76
Kerala 39.21 9.91 3.50 83.73 25.51 9.80
Madhya Pradesh 48.96 13.61 5.12 64.04 11.43 2.97 Maharashtra 45.28 11.35 3.85 77.99 14.25 3.49 Orissa 67.53 21.96 9.71 72.80 17.56 6.02 Punjab 14.31 2.42 0.65 40.35 7.27 2.13 Rajasthan 34.20 9.15 3.42 58.18 8.75 2.00 Tamil Nadu 53.60 17.02 7.23 87.18 27.21 10.69 Uttar Pradesh 45.51 12.31 4.55 57.51 10.36 2.75 West Bengal 62.24 20.59 9.23 77.36 20.84 8.05 All-India 43.39 11.90 4.49 68.75 14.09 4.15
Note: Estimates of consumption poverty (P0 P1 P2) are with reference to the Expert Group (1993) poverty lines and calorie deficiency deprivation are subsistence norms of 2400 kcal for the rural and 2100 kcal for the urban sector Source: Suryanarayana (2003a)
27
Table 3.6: Measures of Different Aspects of Poverty And calorie Deficiency Across States: Urban Sector (1983)
State P0 (%)
P1 (%)
P2 (%)
Incidence of calorie
Deficiency (C0) (%)
Calorie Gap index
(C1) (%)
Severity of calorie
Deficiency (C2) (%)
Andhra Pradesh 36.74 9.78 3.72 65.28 10.74 2.75
Assam 23.44 5.15 1.62 56.76 9.13 2.45
Bihar 49.64 14.39 5.52 50.18 8.26 2.09
Gujarat 37.75 8.27 2.54 62.96 10.71 2.74
Haryana 19.62 3.98 1.24 41.52 7.28 2.66
Karnataka 40.26 12.28 5.09 52.45 10.27 2.94
Kerala 48.26 15.08 6.35 63.9 16.25 5.54
Madhya Pradesh 51.42 14.24 5.22 52.54 6.58 1.18 Maharashtra 37.55 11.32 4.64 67.82 11.06 2.52 Orissa 48.79 14.14 5.53 40.24 6.37 1.83 Punjab 22.6 4.85 1.51 54.51 11.13 3.36 Rajasthan 38.31 10.12 3.78 41.4 5.59 1.47 Tamil Nadu 44.56 13.51 5.64 75.34 18.97 6.49 Uttar Pradesh 49.32 14.26 5.43 61.71 9.81 2.25 West Bengal 30.71 7.75 2.77 57.91 9.95 2.76 All-India 38.08 10.46 4 60.83 10.5 2.67
Note: Estimates of consumption poverty (P0 P1 P2) are with reference to the Expert Group (1993) poverty lines and calorie deficiency deprivation are subsistence norms of 2400 kcal for the rural and 2100 kcal for the urban sector Source: Suryanarayana (2003a)
28
Table 4.1: Monthly Per Capita Consumer Expenditure (at current prices) by Decile Groups: Rural and Urban India
Decile group 1972/73 1983 1993/94 1999/2000 2004/05
Rural India 0-10 16.26 42.66 116.13 215.38 228.18 10-20 22.70 58.85 154.86 277.95 297.56 20-30 26.90 70.00 177.55 320.19 342.40 30-40 30.86 77.46 201.32 360.03 386.36 40-50 35.56 90.40 224.29 397.95 430.34 50-60 38.14 102.11 250.09 444.58 482.78 60-70 45.61 111.73 282.82 496.79 543.25 70-80 50.02 131.88 324.94 566.62 630.40 80-90 63.20 164.80 395.37 687.66 769.22 90-100 112.46 276.91 686.62 1094.45 1477.32 All 44.17 112.68 281.40 486.16 558.78
Urban India 1972/73 1983 1993/94 1999/2000 2004/05 0-10 21.90 58.13 154.18 290.02 323.90 10-20 29.91 79.64 213.00 389.40 441.51 20-30 36.11 94.57 253.80 464.65 533.24 30-40 38.39 114.48 289.97 538.85 625.02 40-50 48.50 121.91 335.01 620.61 732.73 50-60 51.50 141.31 383.39 719.89 858.00 60-70 63.73 176.49 447.58 842.22 1016.95 70-80 72.56 195.86 541.54 1012.44 1226.39 80-90 96.38 257.47 695.23 1286.19 1600.04 90-100 174.32 464.74 1266.68 2384.93 3165.83 All 63.33 170.46 458.04 854.92 1052.36
Source: Author’s estimates based on corresponding NSS estimates at current prices (GoI, 1979a, 1986a, 1986b, 1991, 1996a, 2001a & 2006b).
29
Table 4.2: Monthly Per Capita Consumer Expenditure (at 1972/73 prices) by Select Decile Groups: Rural and Urban India
Decile group 1972/73 1977/78 1983 1987/88 1993/94 1999/00 2004/05
Increase (%) between 1972/73 & 2004/05
Increase (%) between 1993/94 & 2004/05
Rural India
0-10 16.26 16.92 19.18 22.05 22.69 26.45 25.76 58.41 13.51
10-20 22.70 23.97 26.46 29.36 30.26 34.13 33.59 47.97 11.01
20-30 26.90 28.89 31.47 34.39 34.69 39.32 38.65 43.68 11.41
30-40 30.86 31.83 34.83 38.28 39.34 44.21 43.61 41.33 10.87
40-50 35.56 36.80 40.65 42.71 43.82 48.86 48.58 36.61 10.85
0-100 44.17 48.90 50.67 55.09 54.98 59.69 63.08 42.80 14.72
Urban India
0-10 21.90 21.00 23.38 24.30 25.93 30.22 28.45 29.91 9.74
10-20 29.90 29.80 32.03 32.92 35.82 40.57 38.78 29.70 8.28
20-30 36.11 35.73 38.03 38.57 42.68 48.41 46.84 29.71 9.75
30-40 38.39 40.92 46.04 44.01 48.76 56.14 54.90 43.01 12.59
40-50 48.51 46.75 49.03 51.08 56.33 64.66 64.36 32.68 14.25
0-100 63.33 65.26 68.55 71.41 77.02 89.07 92.44 45.96 20.02
Source: Author’s (Suryanarayana 2009) estimates based on corresponding NSS estimates at current prices (GoI, 1979a, 1986a, 1986b, 1991, 1996a, 2001a & 2006b) and deflators implicit in the official poverty lines. Poverty lines from 1977/78 till 2004/05 are GoI estimates and corresponding estimates for 1972/73 are from Tendulkar et al. (1993).
30
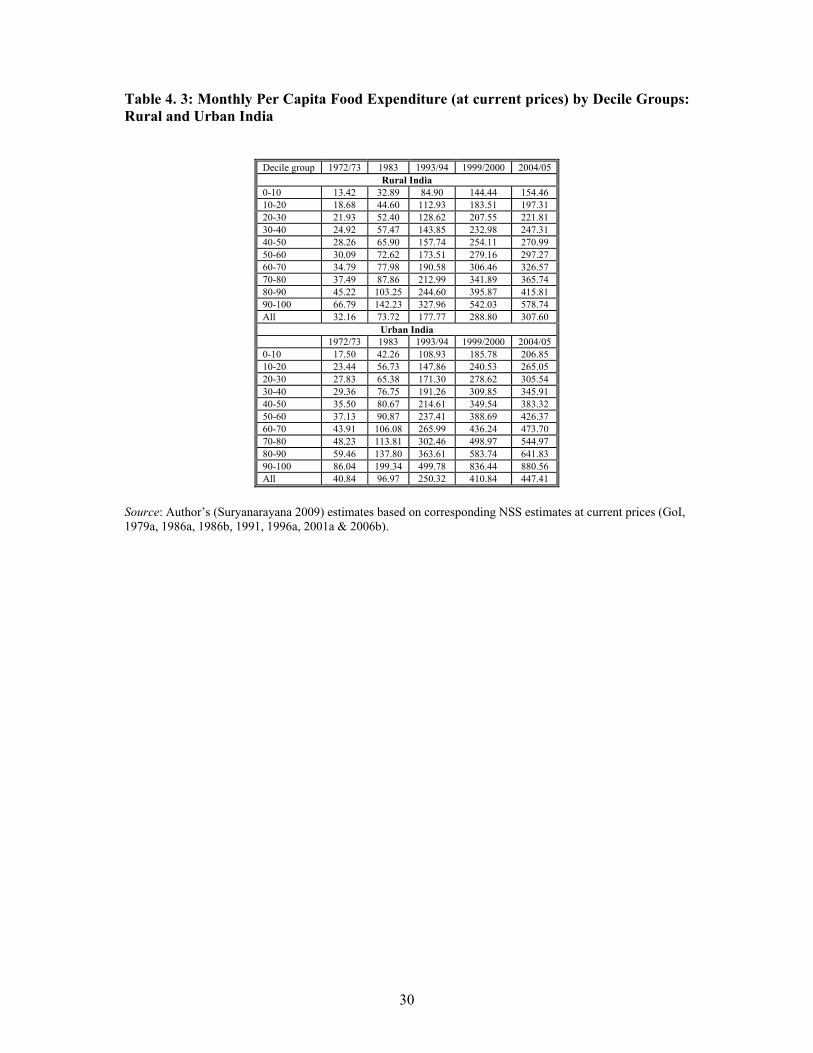
Table 4. 3: Monthly Per Capita Food Expenditure (at current prices) by Decile Groups: Rural and Urban India
Decile group 1972/73 1983 1993/94 1999/2000 2004/05 Rural India
0-10 13.42 32.89 84.90 144.44 154.46 10-20 18.68 44.60 112.93 183.51 197.31 20-30 21.93 52.40 128.62 207.55 221.81 30-40 24.92 57.47 143.85 232.98 247.31 40-50 28.26 65.90 157.74 254.11 270.99 50-60 30.09 72.62 173.51 279.16 297.27 60-70 34.79 77.98 190.58 306.46 326.57 70-80 37.49 87.86 212.99 341.89 365.74 80-90 45.22 103.25 244.60 395.87 415.81 90-100 66.79 142.23 327.96 542.03 578.74 All 32.16 73.72 177.77 288.80 307.60
Urban India 1972/73 1983 1993/94 1999/2000 2004/05 0-10 17.50 42.26 108.93 185.78 206.85 10-20 23.44 56.73 147.86 240.53 265.05 20-30 27.83 65.38 171.30 278.62 305.54 30-40 29.36 76.75 191.26 309.85 345.91 40-50 35.50 80.67 214.61 349.54 383.32 50-60 37.13 90.87 237.41 388.69 426.37 60-70 43.91 106.08 265.99 436.24 473.70 70-80 48.23 113.81 302.46 498.97 544.97 80-90 59.46 137.80 363.61 583.74 641.83 90-100 86.04 199.34 499.78 836.44 880.56 All 40.84 96.97 250.32 410.84 447.41
Source: Author’s (Suryanarayana 2009) estimates based on corresponding NSS estimates at current prices (GoI, 1979a, 1986a, 1986b, 1991, 1996a, 2001a & 2006b).
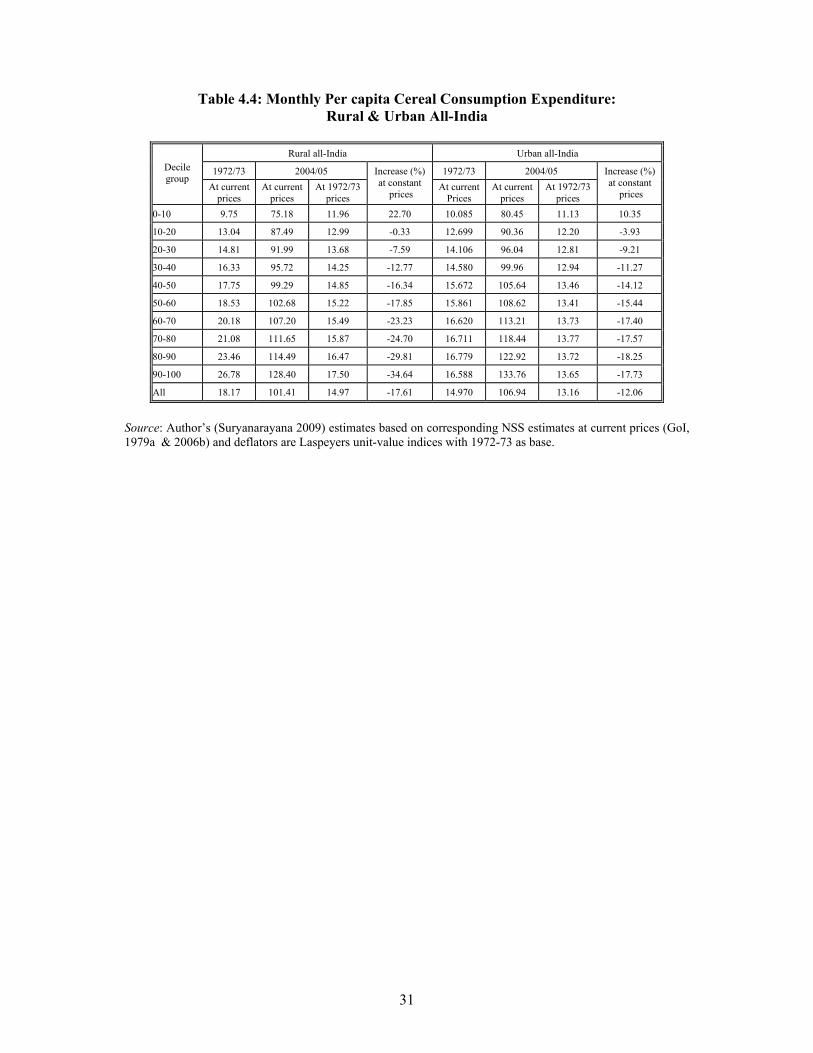
31
Table 4.4: Monthly Per capita Cereal Consumption Expenditure: Rural & Urban All-India
Rural all-India Urban all-India
1972/73 2004/05 1972/73 2004/05 Decile group
At current prices
At current prices
At 1972/73 prices
Increase (%) at constant
prices At current
Prices At current
prices At 1972/73
prices
Increase (%) at constant
prices
0-10 9.75 75.18 11.96 22.70 10.085 80.45 11.13 10.35
10-20 13.04 87.49 12.99 -0.33 12.699 90.36 12.20 -3.93
20-30 14.81 91.99 13.68 -7.59 14.106 96.04 12.81 -9.21
30-40 16.33 95.72 14.25 -12.77 14.580 99.96 12.94 -11.27
40-50 17.75 99.29 14.85 -16.34 15.672 105.64 13.46 -14.12
50-60 18.53 102.68 15.22 -17.85 15.861 108.62 13.41 -15.44
60-70 20.18 107.20 15.49 -23.23 16.620 113.21 13.73 -17.40
70-80 21.08 111.65 15.87 -24.70 16.711 118.44 13.77 -17.57
80-90 23.46 114.49 16.47 -29.81 16.779 122.92 13.72 -18.25
90-100 26.78 128.40 17.50 -34.64 16.588 133.76 13.65 -17.73
All 18.17 101.41 14.97 -17.61 14.970 106.94 13.16 -12.06
Source: Author’s (Suryanarayana 2009) estimates based on corresponding NSS estimates at current prices (GoI, 1979a & 2006b) and deflators are Laspeyers unit-value indices with 1972-73 as base.
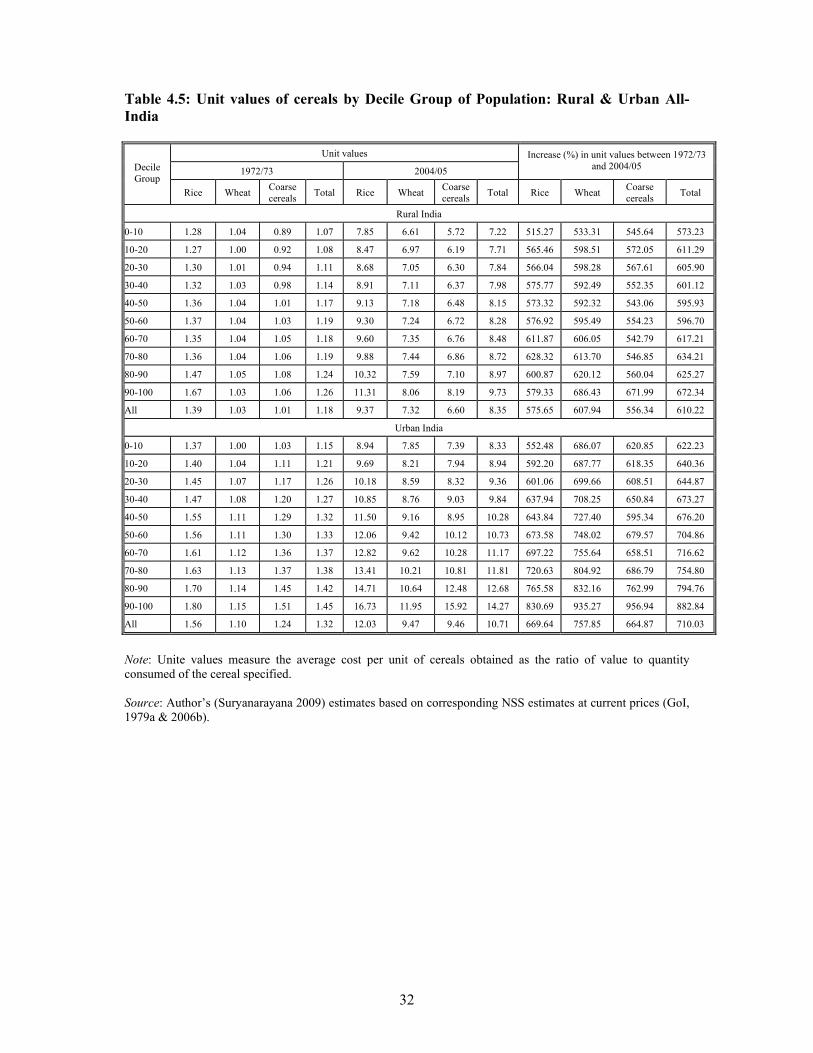
32
Table 4.5: Unit values of cereals by Decile Group of Population: Rural & Urban All-India
Unit values
1972/73 2004/05
Increase (%) in unit values between 1972/73 and 2004/05 Decile
Group Rice Wheat Coarse
cereals Total Rice Wheat Coarse cereals Total Rice Wheat Coarse
cereals Total
Rural India
0-10 1.28 1.04 0.89 1.07 7.85 6.61 5.72 7.22 515.27 533.31 545.64 573.23
10-20 1.27 1.00 0.92 1.08 8.47 6.97 6.19 7.71 565.46 598.51 572.05 611.29
20-30 1.30 1.01 0.94 1.11 8.68 7.05 6.30 7.84 566.04 598.28 567.61 605.90
30-40 1.32 1.03 0.98 1.14 8.91 7.11 6.37 7.98 575.77 592.49 552.35 601.12
40-50 1.36 1.04 1.01 1.17 9.13 7.18 6.48 8.15 573.32 592.32 543.06 595.93
50-60 1.37 1.04 1.03 1.19 9.30 7.24 6.72 8.28 576.92 595.49 554.23 596.70
60-70 1.35 1.04 1.05 1.18 9.60 7.35 6.76 8.48 611.87 606.05 542.79 617.21
70-80 1.36 1.04 1.06 1.19 9.88 7.44 6.86 8.72 628.32 613.70 546.85 634.21
80-90 1.47 1.05 1.08 1.24 10.32 7.59 7.10 8.97 600.87 620.12 560.04 625.27
90-100 1.67 1.03 1.06 1.26 11.31 8.06 8.19 9.73 579.33 686.43 671.99 672.34
All 1.39 1.03 1.01 1.18 9.37 7.32 6.60 8.35 575.65 607.94 556.34 610.22
Urban India
0-10 1.37 1.00 1.03 1.15 8.94 7.85 7.39 8.33 552.48 686.07 620.85 622.23
10-20 1.40 1.04 1.11 1.21 9.69 8.21 7.94 8.94 592.20 687.77 618.35 640.36
20-30 1.45 1.07 1.17 1.26 10.18 8.59 8.32 9.36 601.06 699.66 608.51 644.87
30-40 1.47 1.08 1.20 1.27 10.85 8.76 9.03 9.84 637.94 708.25 650.84 673.27
40-50 1.55 1.11 1.29 1.32 11.50 9.16 8.95 10.28 643.84 727.40 595.34 676.20
50-60 1.56 1.11 1.30 1.33 12.06 9.42 10.12 10.73 673.58 748.02 679.57 704.86
60-70 1.61 1.12 1.36 1.37 12.82 9.62 10.28 11.17 697.22 755.64 658.51 716.62
70-80 1.63 1.13 1.37 1.38 13.41 10.21 10.81 11.81 720.63 804.92 686.79 754.80
80-90 1.70 1.14 1.45 1.42 14.71 10.64 12.48 12.68 765.58 832.16 762.99 794.76
90-100 1.80 1.15 1.51 1.45 16.73 11.95 15.92 14.27 830.69 935.27 956.94 882.84
All 1.56 1.10 1.24 1.32 12.03 9.47 9.46 10.71 669.64 757.85 664.87 710.03
Note: Unite values measure the average cost per unit of cereals obtained as the ratio of value to quantity consumed of the cereal specified. Source: Author’s (Suryanarayana 2009) estimates based on corresponding NSS estimates at current prices (GoI, 1979a & 2006b).
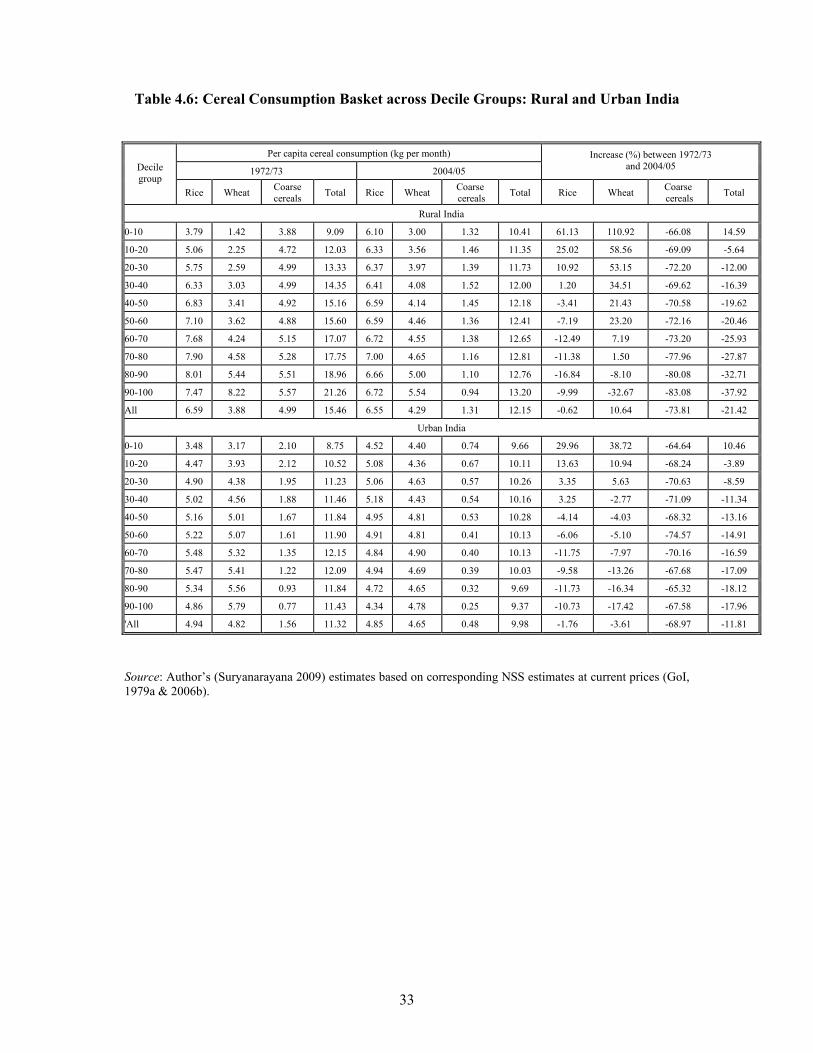
33
Table 4.6: Cereal Consumption Basket across Decile Groups: Rural and Urban India
Per capita cereal consumption (kg per month)
1972/73 2004/05
Increase (%) between 1972/73 and 2004/05 Decile
group Rice Wheat Coarse
cereals Total Rice Wheat Coarse cereals Total Rice Wheat Coarse
cereals Total
Rural India
0-10 3.79 1.42 3.88 9.09 6.10 3.00 1.32 10.41 61.13 110.92 -66.08 14.59
10-20 5.06 2.25 4.72 12.03 6.33 3.56 1.46 11.35 25.02 58.56 -69.09 -5.64
20-30 5.75 2.59 4.99 13.33 6.37 3.97 1.39 11.73 10.92 53.15 -72.20 -12.00
30-40 6.33 3.03 4.99 14.35 6.41 4.08 1.52 12.00 1.20 34.51 -69.62 -16.39
40-50 6.83 3.41 4.92 15.16 6.59 4.14 1.45 12.18 -3.41 21.43 -70.58 -19.62
50-60 7.10 3.62 4.88 15.60 6.59 4.46 1.36 12.41 -7.19 23.20 -72.16 -20.46
60-70 7.68 4.24 5.15 17.07 6.72 4.55 1.38 12.65 -12.49 7.19 -73.20 -25.93
70-80 7.90 4.58 5.28 17.75 7.00 4.65 1.16 12.81 -11.38 1.50 -77.96 -27.87
80-90 8.01 5.44 5.51 18.96 6.66 5.00 1.10 12.76 -16.84 -8.10 -80.08 -32.71
90-100 7.47 8.22 5.57 21.26 6.72 5.54 0.94 13.20 -9.99 -32.67 -83.08 -37.92
All 6.59 3.88 4.99 15.46 6.55 4.29 1.31 12.15 -0.62 10.64 -73.81 -21.42
Urban India
0-10 3.48 3.17 2.10 8.75 4.52 4.40 0.74 9.66 29.96 38.72 -64.64 10.46
10-20 4.47 3.93 2.12 10.52 5.08 4.36 0.67 10.11 13.63 10.94 -68.24 -3.89
20-30 4.90 4.38 1.95 11.23 5.06 4.63 0.57 10.26 3.35 5.63 -70.63 -8.59
30-40 5.02 4.56 1.88 11.46 5.18 4.43 0.54 10.16 3.25 -2.77 -71.09 -11.34
40-50 5.16 5.01 1.67 11.84 4.95 4.81 0.53 10.28 -4.14 -4.03 -68.32 -13.16
50-60 5.22 5.07 1.61 11.90 4.91 4.81 0.41 10.13 -6.06 -5.10 -74.57 -14.91
60-70 5.48 5.32 1.35 12.15 4.84 4.90 0.40 10.13 -11.75 -7.97 -70.16 -16.59
70-80 5.47 5.41 1.22 12.09 4.94 4.69 0.39 10.03 -9.58 -13.26 -67.68 -17.09
80-90 5.34 5.56 0.93 11.84 4.72 4.65 0.32 9.69 -11.73 -16.34 -65.32 -18.12
90-100 4.86 5.79 0.77 11.43 4.34 4.78 0.25 9.37 -10.73 -17.42 -67.58 -17.96
'All 4.94 4.82 1.56 11.32 4.85 4.65 0.48 9.98 -1.76 -3.61 -68.97 -11.81
Source: Author’s (Suryanarayana 2009) estimates based on corresponding NSS estimates at current prices (GoI, 1979a & 2006b).
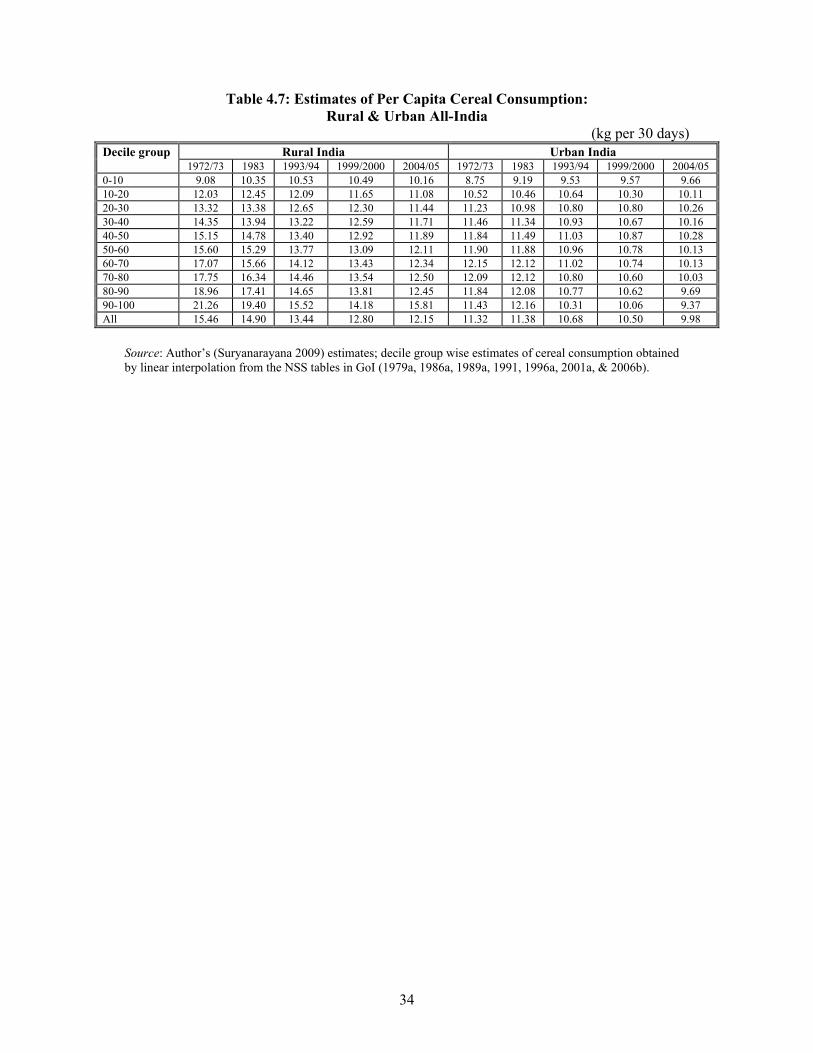
34
Table 4.7: Estimates of Per Capita Cereal Consumption: Rural & Urban All-India
(kg per 30 days) Rural India Urban India Decile group
1972/73 1983 1993/94 1999/2000 2004/05 1972/73 1983 1993/94 1999/2000 2004/05 0-10 9.08 10.35 10.53 10.49 10.16 8.75 9.19 9.53 9.57 9.66 10-20 12.03 12.45 12.09 11.65 11.08 10.52 10.46 10.64 10.30 10.11 20-30 13.32 13.38 12.65 12.30 11.44 11.23 10.98 10.80 10.80 10.26 30-40 14.35 13.94 13.22 12.59 11.71 11.46 11.34 10.93 10.67 10.16 40-50 15.15 14.78 13.40 12.92 11.89 11.84 11.49 11.03 10.87 10.28 50-60 15.60 15.29 13.77 13.09 12.11 11.90 11.88 10.96 10.78 10.13 60-70 17.07 15.66 14.12 13.43 12.34 12.15 12.12 11.02 10.74 10.13 70-80 17.75 16.34 14.46 13.54 12.50 12.09 12.12 10.80 10.60 10.03 80-90 18.96 17.41 14.65 13.81 12.45 11.84 12.08 10.77 10.62 9.69 90-100 21.26 19.40 15.52 14.18 15.81 11.43 12.16 10.31 10.06 9.37 All 15.46 14.90 13.44 12.80 12.15 11.32 11.38 10.68 10.50 9.98
Source: Author’s (Suryanarayana 2009) estimates; decile group wise estimates of cereal consumption obtained by linear interpolation from the NSS tables in GoI (1979a, 1986a, 1989a, 1991, 1996a, 2001a, & 2006b).
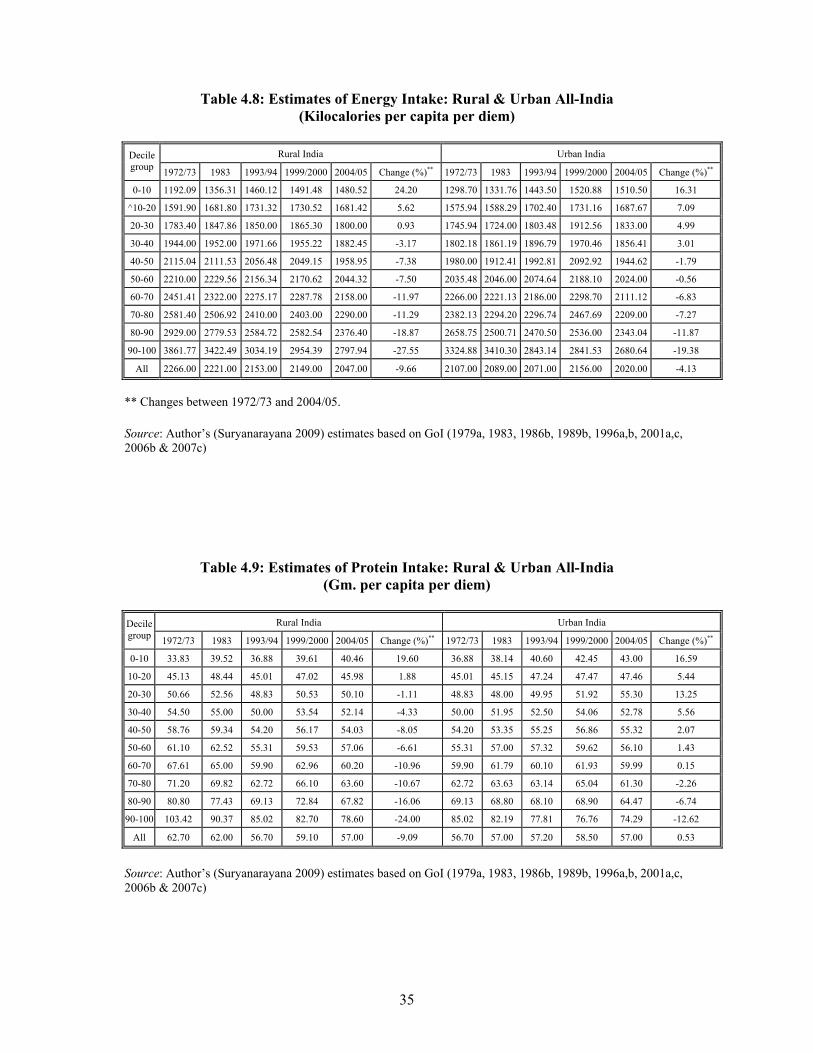
35
Table 4.8: Estimates of Energy Intake: Rural & Urban All-India (Kilocalories per capita per diem)
Rural India Urban India Decile
group 1972/73 1983 1993/94 1999/2000 2004/05 Change (%)** 1972/73 1983 1993/94 1999/2000 2004/05 Change (%)**
0-10 1192.09 1356.31 1460.12 1491.48 1480.52 24.20 1298.70 1331.76 1443.50 1520.88 1510.50 16.31
^10-20 1591.90 1681.80 1731.32 1730.52 1681.42 5.62 1575.94 1588.29 1702.40 1731.16 1687.67 7.09
20-30 1783.40 1847.86 1850.00 1865.30 1800.00 0.93 1745.94 1724.00 1803.48 1912.56 1833.00 4.99
30-40 1944.00 1952.00 1971.66 1955.22 1882.45 -3.17 1802.18 1861.19 1896.79 1970.46 1856.41 3.01
40-50 2115.04 2111.53 2056.48 2049.15 1958.95 -7.38 1980.00 1912.41 1992.81 2092.92 1944.62 -1.79
50-60 2210.00 2229.56 2156.34 2170.62 2044.32 -7.50 2035.48 2046.00 2074.64 2188.10 2024.00 -0.56
60-70 2451.41 2322.00 2275.17 2287.78 2158.00 -11.97 2266.00 2221.13 2186.00 2298.70 2111.12 -6.83
70-80 2581.40 2506.92 2410.00 2403.00 2290.00 -11.29 2382.13 2294.20 2296.74 2467.69 2209.00 -7.27
80-90 2929.00 2779.53 2584.72 2582.54 2376.40 -18.87 2658.75 2500.71 2470.50 2536.00 2343.04 -11.87
90-100 3861.77 3422.49 3034.19 2954.39 2797.94 -27.55 3324.88 3410.30 2843.14 2841.53 2680.64 -19.38
All 2266.00 2221.00 2153.00 2149.00 2047.00 -9.66 2107.00 2089.00 2071.00 2156.00 2020.00 -4.13
** Changes between 1972/73 and 2004/05. Source: Author’s (Suryanarayana 2009) estimates based on GoI (1979a, 1983, 1986b, 1989b, 1996a,b, 2001a,c, 2006b & 2007c)
Table 4.9: Estimates of Protein Intake: Rural & Urban All-India (Gm. per capita per diem)
Rural India Urban India Decile
group 1972/73 1983 1993/94 1999/2000 2004/05 Change (%)** 1972/73 1983 1993/94 1999/2000 2004/05 Change (%)**
0-10 33.83 39.52 36.88 39.61 40.46 19.60 36.88 38.14 40.60 42.45 43.00 16.59
10-20 45.13 48.44 45.01 47.02 45.98 1.88 45.01 45.15 47.24 47.47 47.46 5.44
20-30 50.66 52.56 48.83 50.53 50.10 -1.11 48.83 48.00 49.95 51.92 55.30 13.25
30-40 54.50 55.00 50.00 53.54 52.14 -4.33 50.00 51.95 52.50 54.06 52.78 5.56
40-50 58.76 59.34 54.20 56.17 54.03 -8.05 54.20 53.35 55.25 56.86 55.32 2.07
50-60 61.10 62.52 55.31 59.53 57.06 -6.61 55.31 57.00 57.32 59.62 56.10 1.43
60-70 67.61 65.00 59.90 62.96 60.20 -10.96 59.90 61.79 60.10 61.93 59.99 0.15
70-80 71.20 69.82 62.72 66.10 63.60 -10.67 62.72 63.63 63.14 65.04 61.30 -2.26
80-90 80.80 77.43 69.13 72.84 67.82 -16.06 69.13 68.80 68.10 68.90 64.47 -6.74
90-100 103.42 90.37 85.02 82.70 78.60 -24.00 85.02 82.19 77.81 76.76 74.29 -12.62
All 62.70 62.00 56.70 59.10 57.00 -9.09 56.70 57.00 57.20 58.50 57.00 0.53
Source: Author’s (Suryanarayana 2009) estimates based on GoI (1979a, 1983, 1986b, 1989b, 1996a,b, 2001a,c, 2006b & 2007c)
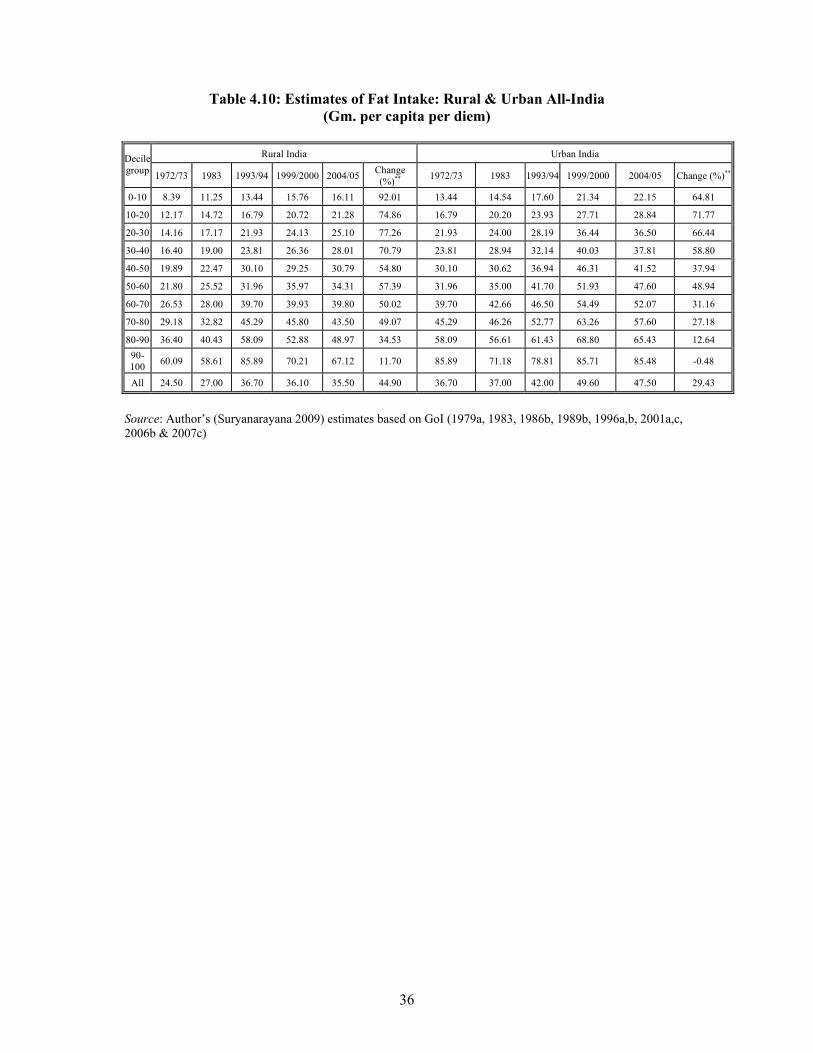
36
Table 4.10: Estimates of Fat Intake: Rural & Urban All-India (Gm. per capita per diem)
Rural India Urban India Decile
group 1972/73 1983 1993/94 1999/2000 2004/05 Change (%)** 1972/73 1983 1993/94 1999/2000 2004/05 Change (%)**
0-10 8.39 11.25 13.44 15.76 16.11 92.01 13.44 14.54 17.60 21.34 22.15 64.81
10-20 12.17 14.72 16.79 20.72 21.28 74.86 16.79 20.20 23.93 27.71 28.84 71.77
20-30 14.16 17.17 21.93 24.13 25.10 77.26 21.93 24.00 28.19 36.44 36.50 66.44
30-40 16.40 19.00 23.81 26.36 28.01 70.79 23.81 28.94 32.14 40.03 37.81 58.80
40-50 19.89 22.47 30.10 29.25 30.79 54.80 30.10 30.62 36.94 46.31 41.52 37.94
50-60 21.80 25.52 31.96 35.97 34.31 57.39 31.96 35.00 41.70 51.93 47.60 48.94
60-70 26.53 28.00 39.70 39.93 39.80 50.02 39.70 42.66 46.50 54.49 52.07 31.16
70-80 29.18 32.82 45.29 45.80 43.50 49.07 45.29 46.26 52.77 63.26 57.60 27.18
80-90 36.40 40.43 58.09 52.88 48.97 34.53 58.09 56.61 61.43 68.80 65.43 12.64 90-100 60.09 58.61 85.89 70.21 67.12 11.70 85.89 71.18 78.81 85.71 85.48 -0.48
All 24.50 27.00 36.70 36.10 35.50 44.90 36.70 37.00 42.00 49.60 47.50 29.43
Source: Author’s (Suryanarayana 2009) estimates based on GoI (1979a, 1983, 1986b, 1989b, 1996a,b, 2001a,c, 2006b & 2007c)
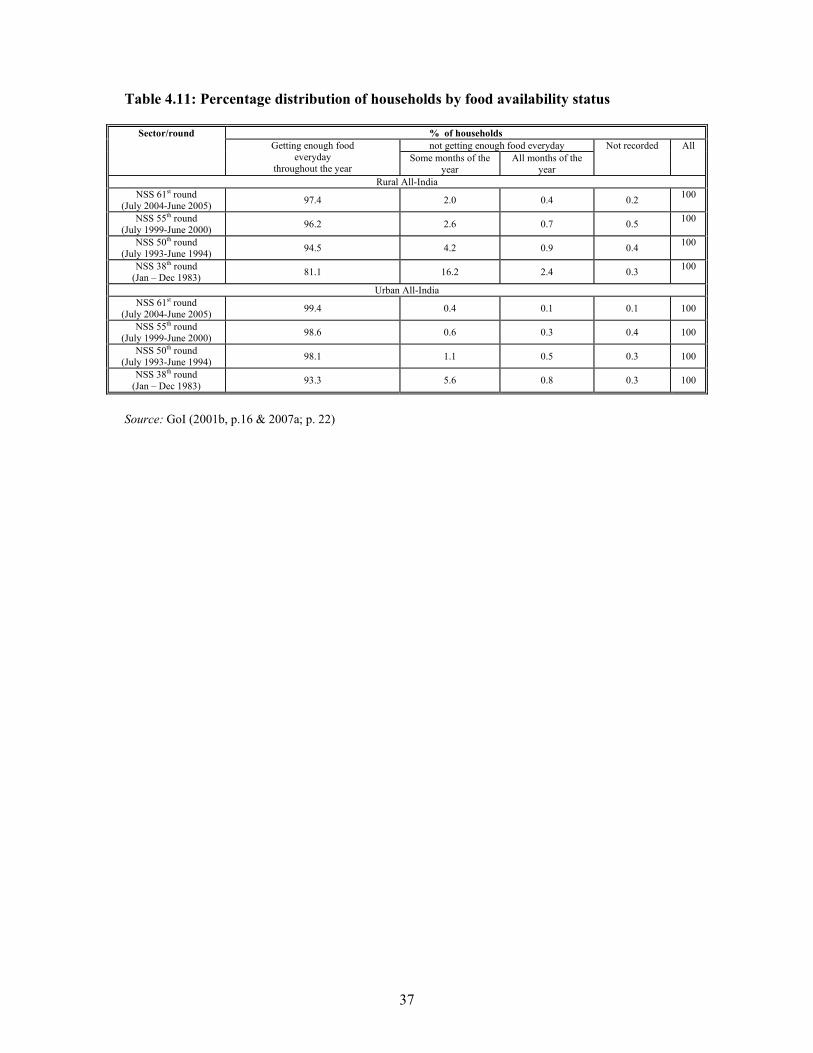
37
Table 4.11: Percentage distribution of households by food availability status
% of households not getting enough food everyday
Sector/round Getting enough food
everyday throughout the year
Some months of the year
All months of the year
Not recorded All
Rural All-India NSS 61st round
(July 2004-June 2005) 97.4 2.0 0.4 0.2 100
NSS 55th round (July 1999-June 2000) 96.2 2.6 0.7 0.5 100
NSS 50th round (July 1993-June 1994) 94.5 4.2 0.9 0.4 100
NSS 38th round (Jan – Dec 1983) 81.1 16.2 2.4 0.3 100
Urban All-India NSS 61st round
(July 2004-June 2005) 99.4 0.4 0.1 0.1 100
NSS 55th round (July 1999-June 2000) 98.6 0.6 0.3 0.4 100
NSS 50th round (July 1993-June 1994) 98.1 1.1 0.5 0.3 100
NSS 38th round (Jan – Dec 1983) 93.3 5.6 0.8 0.3 100
Source: GoI (2001b, p.16 & 2007a; p. 22)
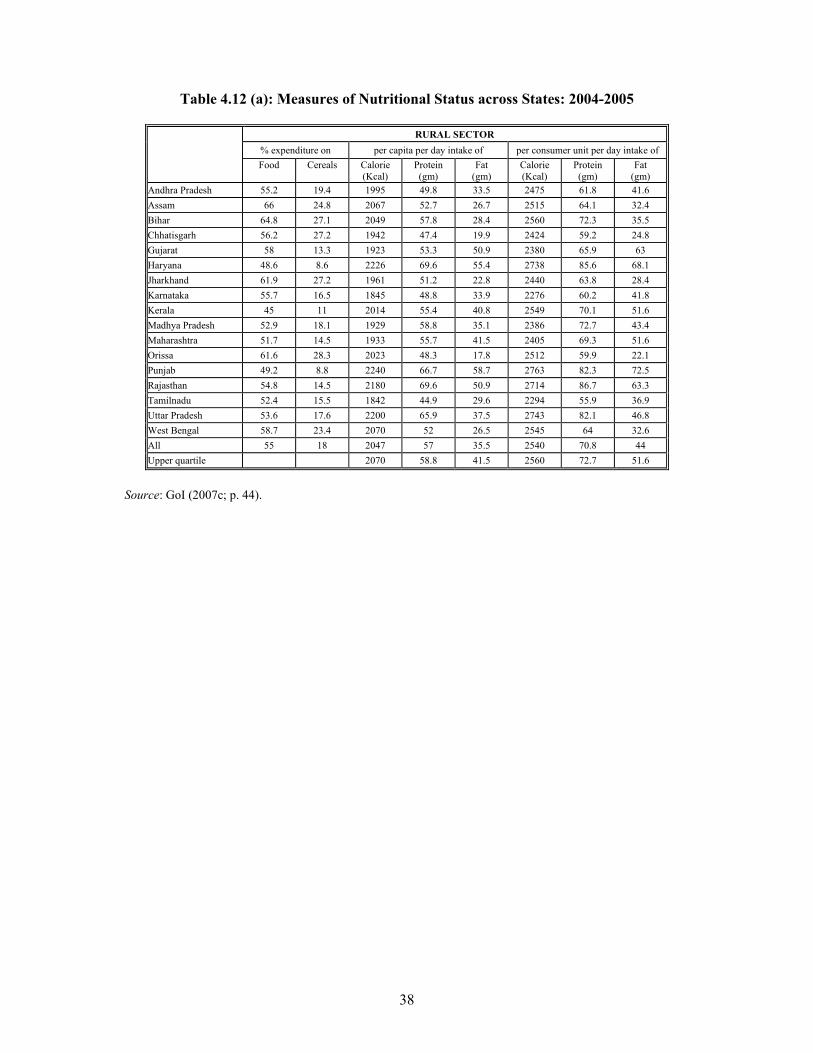
38
Table 4.12 (a): Measures of Nutritional Status across States: 2004-2005
RURAL SECTOR % expenditure on per capita per day intake of per consumer unit per day intake of Food Cereals Calorie
(Kcal) Protein (gm)
Fat (gm)
Calorie (Kcal)
Protein (gm)
Fat (gm)
Andhra Pradesh 55.2 19.4 1995 49.8 33.5 2475 61.8 41.6 Assam 66 24.8 2067 52.7 26.7 2515 64.1 32.4 Bihar 64.8 27.1 2049 57.8 28.4 2560 72.3 35.5 Chhatisgarh 56.2 27.2 1942 47.4 19.9 2424 59.2 24.8 Gujarat 58 13.3 1923 53.3 50.9 2380 65.9 63 Haryana 48.6 8.6 2226 69.6 55.4 2738 85.6 68.1 Jharkhand 61.9 27.2 1961 51.2 22.8 2440 63.8 28.4 Karnataka 55.7 16.5 1845 48.8 33.9 2276 60.2 41.8 Kerala 45 11 2014 55.4 40.8 2549 70.1 51.6 Madhya Pradesh 52.9 18.1 1929 58.8 35.1 2386 72.7 43.4 Maharashtra 51.7 14.5 1933 55.7 41.5 2405 69.3 51.6 Orissa 61.6 28.3 2023 48.3 17.8 2512 59.9 22.1 Punjab 49.2 8.8 2240 66.7 58.7 2763 82.3 72.5 Rajasthan 54.8 14.5 2180 69.6 50.9 2714 86.7 63.3 Tamilnadu 52.4 15.5 1842 44.9 29.6 2294 55.9 36.9 Uttar Pradesh 53.6 17.6 2200 65.9 37.5 2743 82.1 46.8 West Bengal 58.7 23.4 2070 52 26.5 2545 64 32.6 All 55 18 2047 57 35.5 2540 70.8 44 Upper quartile 2070 58.8 41.5 2560 72.7 51.6
Source: GoI (2007c; p. 44).
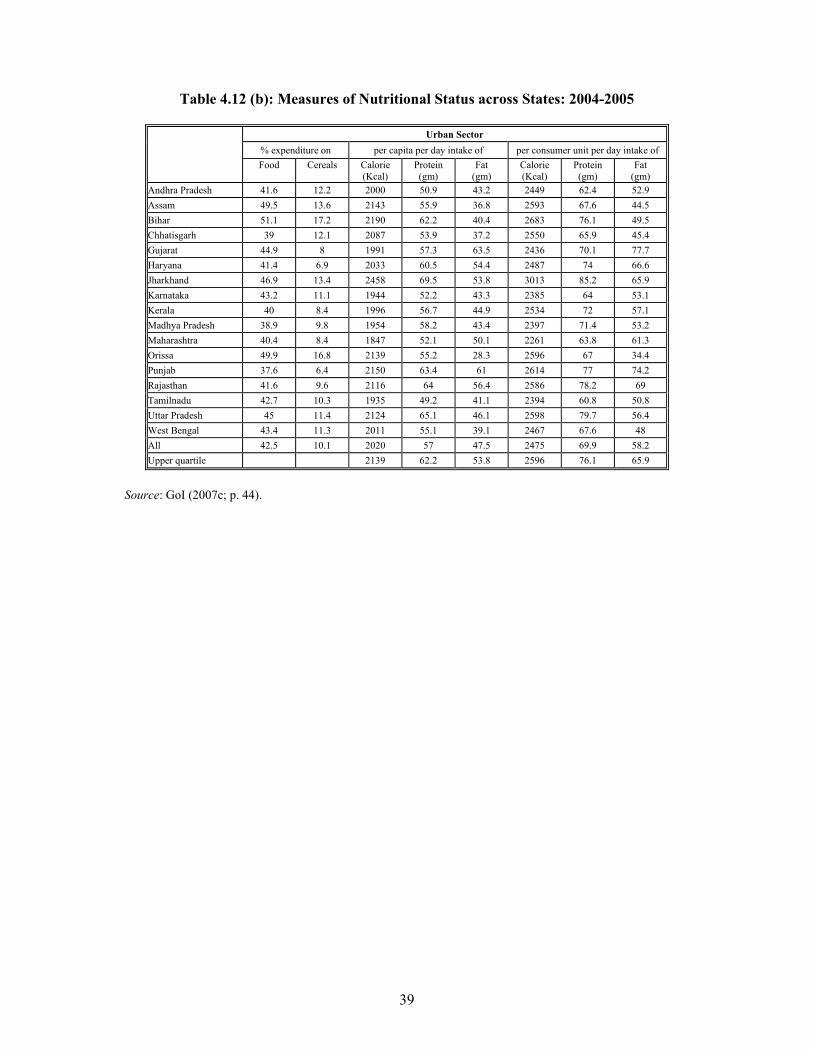
39
Table 4.12 (b): Measures of Nutritional Status across States: 2004-2005
Urban Sector % expenditure on per capita per day intake of per consumer unit per day intake of Food Cereals Calorie
(Kcal) Protein (gm)
Fat (gm)
Calorie (Kcal)
Protein (gm)
Fat (gm)
Andhra Pradesh 41.6 12.2 2000 50.9 43.2 2449 62.4 52.9 Assam 49.5 13.6 2143 55.9 36.8 2593 67.6 44.5 Bihar 51.1 17.2 2190 62.2 40.4 2683 76.1 49.5 Chhatisgarh 39 12.1 2087 53.9 37.2 2550 65.9 45.4 Gujarat 44.9 8 1991 57.3 63.5 2436 70.1 77.7 Haryana 41.4 6.9 2033 60.5 54.4 2487 74 66.6 Jharkhand 46.9 13.4 2458 69.5 53.8 3013 85.2 65.9 Karnataka 43.2 11.1 1944 52.2 43.3 2385 64 53.1 Kerala 40 8.4 1996 56.7 44.9 2534 72 57.1 Madhya Pradesh 38.9 9.8 1954 58.2 43.4 2397 71.4 53.2 Maharashtra 40.4 8.4 1847 52.1 50.1 2261 63.8 61.3 Orissa 49.9 16.8 2139 55.2 28.3 2596 67 34.4 Punjab 37.6 6.4 2150 63.4 61 2614 77 74.2 Rajasthan 41.6 9.6 2116 64 56.4 2586 78.2 69 Tamilnadu 42.7 10.3 1935 49.2 41.1 2394 60.8 50.8 Uttar Pradesh 45 11.4 2124 65.1 46.1 2598 79.7 56.4 West Bengal 43.4 11.3 2011 55.1 39.1 2467 67.6 48 All 42.5 10.1 2020 57 47.5 2475 69.9 58.2 Upper quartile 2139 62.2 53.8 2596 76.1 65.9
Source: GoI (2007c; p. 44).
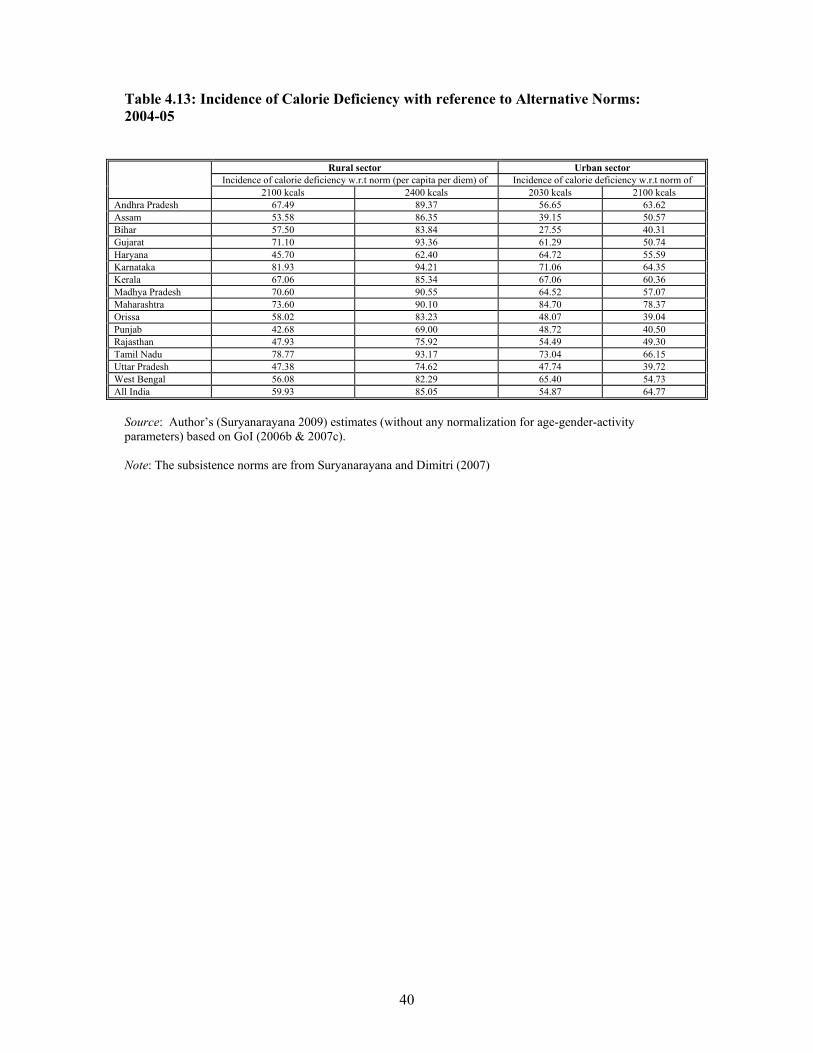
40
Table 4.13: Incidence of Calorie Deficiency with reference to Alternative Norms: 2004-05
Rural sector Urban sector Incidence of calorie deficiency w.r.t norm (per capita per diem) of Incidence of calorie deficiency w.r.t norm of
2100 kcals 2400 kcals 2030 kcals 2100 kcals Andhra Pradesh 67.49 89.37 56.65 63.62 Assam 53.58 86.35 39.15 50.57 Bihar 57.50 83.84 27.55 40.31 Gujarat 71.10 93.36 61.29 50.74 Haryana 45.70 62.40 64.72 55.59 Karnataka 81.93 94.21 71.06 64.35 Kerala 67.06 85.34 67.06 60.36 Madhya Pradesh 70.60 90.55 64.52 57.07 Maharashtra 73.60 90.10 84.70 78.37 Orissa 58.02 83.23 48.07 39.04 Punjab 42.68 69.00 48.72 40.50 Rajasthan 47.93 75.92 54.49 49.30 Tamil Nadu 78.77 93.17 73.04 66.15 Uttar Pradesh 47.38 74.62 47.74 39.72 West Bengal 56.08 82.29 65.40 54.73 All India 59.93 85.05 54.87 64.77
Source: Author’s (Suryanarayana 2009) estimates (without any normalization for age-gender-activity parameters) based on GoI (2006b & 2007c). Note: The subsistence norms are from Suryanarayana and Dimitri (2007)
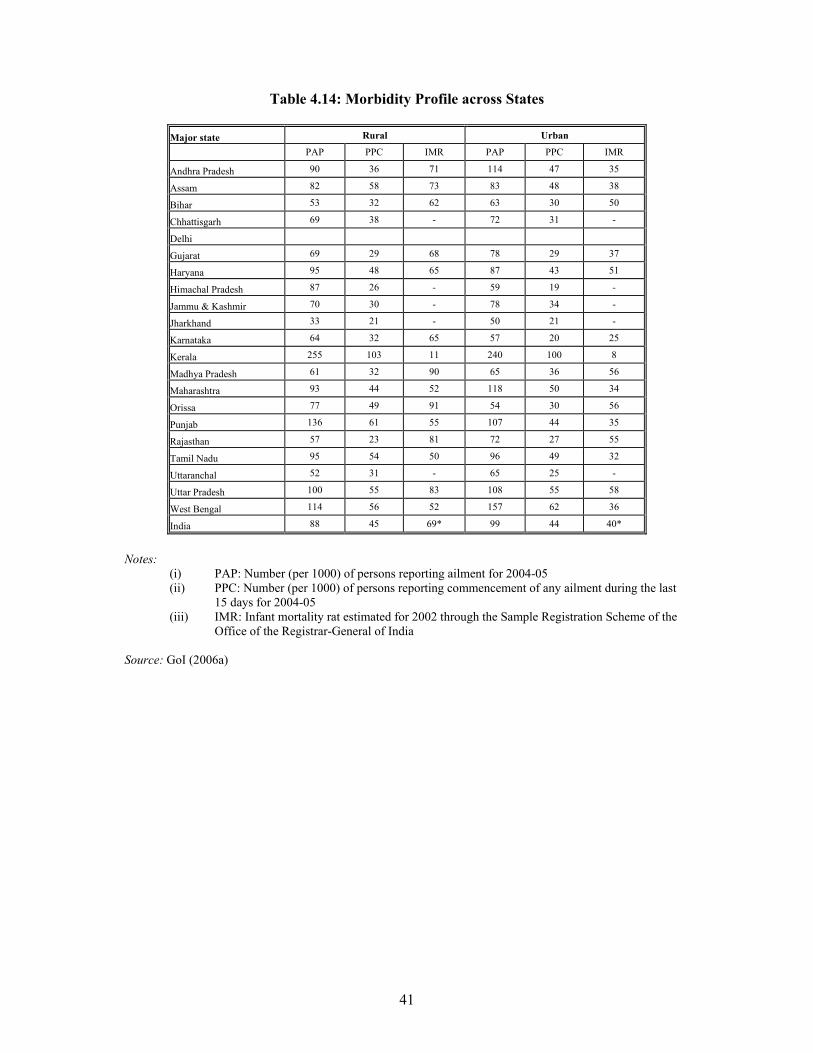
41
Table 4.14: Morbidity Profile across States
Major state Rural Urban
PAP PPC IMR PAP PPC IMR
Andhra Pradesh 90 36 71 114 47 35
Assam 82 58 73 83 48 38
Bihar 53 32 62 63 30 50
Chhattisgarh 69 38 - 72 31 -
Delhi
Gujarat 69 29 68 78 29 37
Haryana 95 48 65 87 43 51
Himachal Pradesh 87 26 - 59 19 -
Jammu & Kashmir 70 30 - 78 34 -
Jharkhand 33 21 - 50 21 -
Karnataka 64 32 65 57 20 25
Kerala 255 103 11 240 100 8
Madhya Pradesh 61 32 90 65 36 56
Maharashtra 93 44 52 118 50 34
Orissa 77 49 91 54 30 56
Punjab 136 61 55 107 44 35
Rajasthan 57 23 81 72 27 55
Tamil Nadu 95 54 50 96 49 32
Uttaranchal 52 31 - 65 25 -
Uttar Pradesh 100 55 83 108 55 58
West Bengal 114 56 52 157 62 36
India 88 45 69* 99 44 40*
Notes:
(i) PAP: Number (per 1000) of persons reporting ailment for 2004-05 (ii) PPC: Number (per 1000) of persons reporting commencement of any ailment during the last
15 days for 2004-05 (iii) IMR: Infant mortality rat estimated for 2002 through the Sample Registration Scheme of the
Office of the Registrar-General of India Source: GoI (2006a)
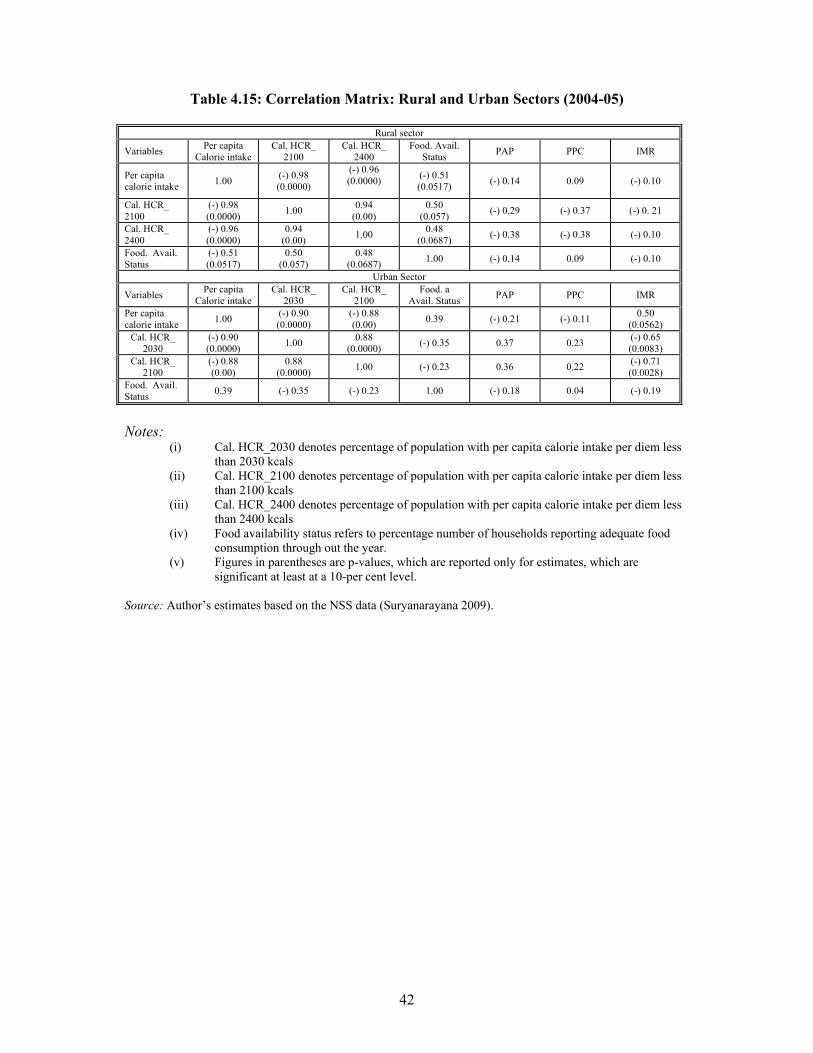
42
Table 4.15: Correlation Matrix: Rural and Urban Sectors (2004-05)
Rural sector
Variables Per capita Calorie intake
Cal. HCR_ 2100
Cal. HCR_ 2400
Food. Avail. Status PAP PPC IMR
Per capita calorie intake 1.00 (-) 0.98
(0.0000)
(-) 0.96 (0.0000)
(-) 0.51 (0.0517) (-) 0.14 0.09 (-) 0.10
Cal. HCR_ 2100
(-) 0.98 (0.0000) 1.00 0.94
(0.00) 0.50
(0.057) (-) 0.29 (-) 0.37 (-) 0. 21
Cal. HCR_ 2400
(-) 0.96 (0.0000)
0.94 (0.00) 1.00 0.48
(0.0687) (-) 0.38 (-) 0.38 (-) 0.10
Food. Avail. Status
(-) 0.51 (0.0517)
0.50 (0.057)
0.48 (0.0687) 1.00 (-) 0.14 0.09 (-) 0.10
Urban Sector
Variables Per capita Calorie intake
Cal. HCR_ 2030
Cal. HCR_ 2100
Food. a Avail. Status PAP PPC IMR
Per capita calorie intake 1.00 (-) 0.90
(0.0000) (-) 0.88 (0.00) 0.39 (-) 0.21 (-) 0.11 0.50
(0.0562) Cal. HCR_
2030 (-) 0.90 (0.0000) 1.00 0.88
(0.0000) (-) 0.35 0.37 0.23 (-) 0.65 (0.0083)
Cal. HCR_ 2100
(-) 0.88 (0.00)
0.88 (0.0000) 1.00 (-) 0.23 0.36 0.22 (-) 0.71
(0.0028) Food. Avail. Status 0.39 (-) 0.35 (-) 0.23 1.00 (-) 0.18 0.04 (-) 0.19
Notes:
(i) Cal. HCR_2030 denotes percentage of population with per capita calorie intake per diem less than 2030 kcals
(ii) Cal. HCR_2100 denotes percentage of population with per capita calorie intake per diem less than 2100 kcals
(iii) Cal. HCR_2400 denotes percentage of population with per capita calorie intake per diem less than 2400 kcals
(iv) Food availability status refers to percentage number of households reporting adequate food consumption through out the year.
(v) Figures in parentheses are p-values, which are reported only for estimates, which are significant at least at a 10-per cent level.
Source: Author’s estimates based on the NSS data (Suryanarayana 2009).
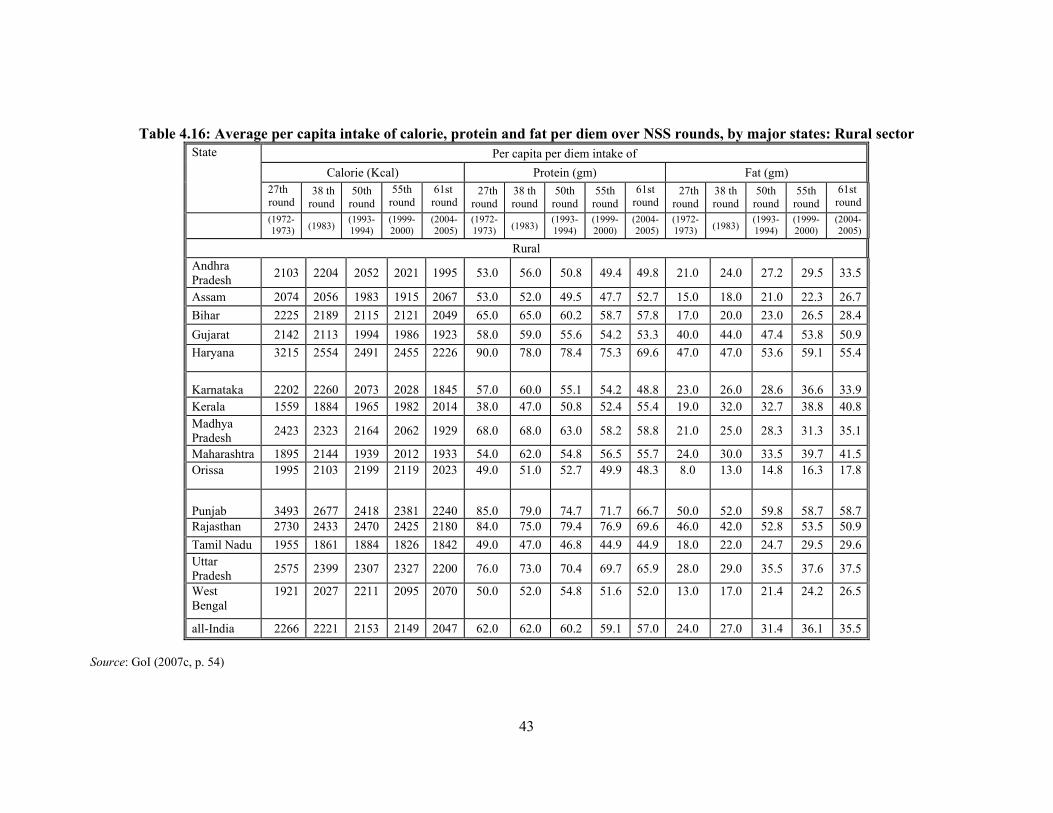
43
Table 4.16: Average per capita intake of calorie, protein and fat per diem over NSS rounds, by major states: Rural sector Per capita per diem intake of
Calorie (Kcal) Protein (gm) Fat (gm) State
27th round
38 th round
50th round
55th round
61st round
27th round
38 th round
50th round
55th round
61st round
27th round
38 th round
50th round
55th round
61st round
(1972-1973) (1983)
(1993-1994)
(1999-2000)
(2004-2005)
(1972-1973) (1983)
(1993-1994)
(1999-2000)
(2004-2005)
(1972-1973) (1983)
(1993-1994)
(1999-2000)
(2004-2005)
Rural Andhra Pradesh 2103 2204 2052 2021 1995 53.0 56.0 50.8 49.4 49.8 21.0 24.0 27.2 29.5 33.5
Assam 2074 2056 1983 1915 2067 53.0 52.0 49.5 47.7 52.7 15.0 18.0 21.0 22.3 26.7 Bihar 2225 2189 2115 2121 2049 65.0 65.0 60.2 58.7 57.8 17.0 20.0 23.0 26.5 28.4 Gujarat 2142 2113 1994 1986 1923 58.0 59.0 55.6 54.2 53.3 40.0 44.0 47.4 53.8 50.9 Haryana 3215 2554 2491 2455 2226 90.0 78.0 78.4 75.3 69.6 47.0 47.0 53.6 59.1 55.4
Karnataka 2202 2260 2073 2028 1845 57.0 60.0 55.1 54.2 48.8 23.0 26.0 28.6 36.6 33.9 Kerala 1559 1884 1965 1982 2014 38.0 47.0 50.8 52.4 55.4 19.0 32.0 32.7 38.8 40.8 Madhya Pradesh 2423 2323 2164 2062 1929 68.0 68.0 63.0 58.2 58.8 21.0 25.0 28.3 31.3 35.1
Maharashtra 1895 2144 1939 2012 1933 54.0 62.0 54.8 56.5 55.7 24.0 30.0 33.5 39.7 41.5 Orissa 1995 2103 2199 2119 2023 49.0 51.0 52.7 49.9 48.3 8.0 13.0 14.8 16.3 17.8
Punjab 3493 2677 2418 2381 2240 85.0 79.0 74.7 71.7 66.7 50.0 52.0 59.8 58.7 58.7 Rajasthan 2730 2433 2470 2425 2180 84.0 75.0 79.4 76.9 69.6 46.0 42.0 52.8 53.5 50.9 Tamil Nadu 1955 1861 1884 1826 1842 49.0 47.0 46.8 44.9 44.9 18.0 22.0 24.7 29.5 29.6 Uttar Pradesh 2575 2399 2307 2327 2200 76.0 73.0 70.4 69.7 65.9 28.0 29.0 35.5 37.6 37.5
West Bengal
1921 2027 2211 2095 2070 50.0 52.0 54.8 51.6 52.0 13.0 17.0 21.4 24.2 26.5
all-India 2266 2221 2153 2149 2047 62.0 62.0 60.2 59.1 57.0 24.0 27.0 31.4 36.1 35.5 Source: GoI (2007c, p. 54)
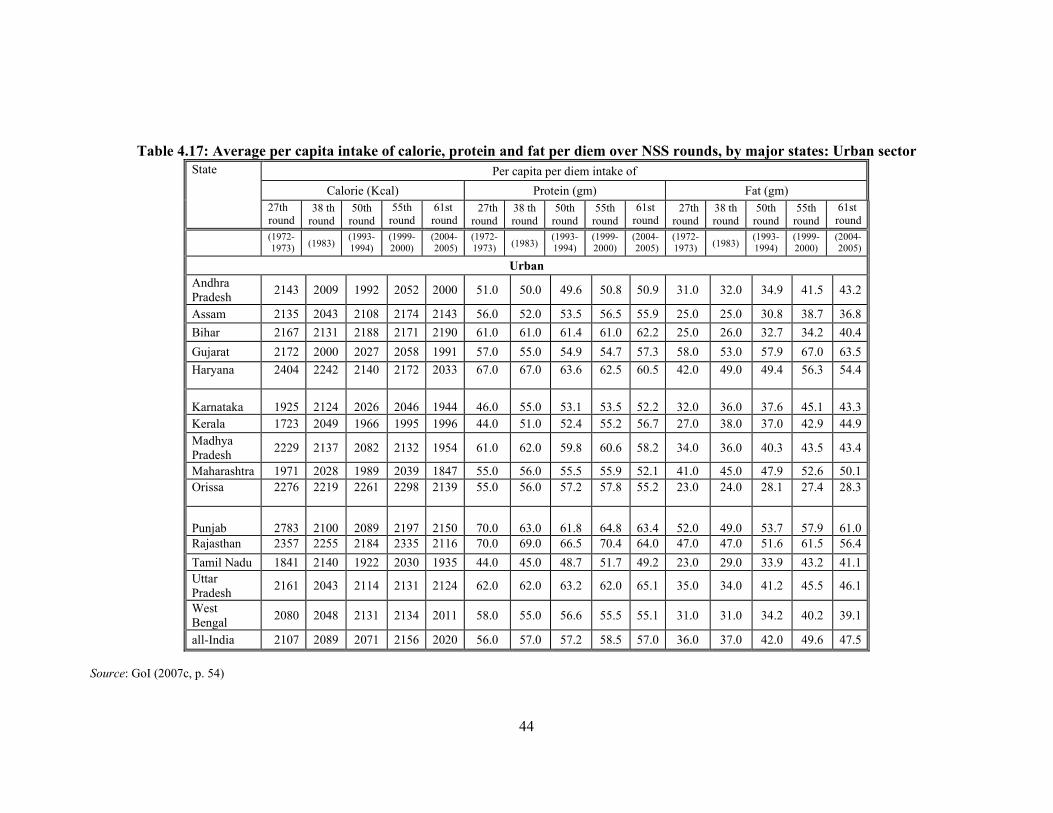
44
Table 4.17: Average per capita intake of calorie, protein and fat per diem over NSS rounds, by major states: Urban sector
Per capita per diem intake of Calorie (Kcal) Protein (gm) Fat (gm)
State
27th round
38 th round
50th round
55th round
61st round
27th round
38 th round
50th round
55th round
61st round
27th round
38 th round
50th round
55th round
61st round
(1972-1973) (1983)
(1993-1994)
(1999-2000)
(2004-2005)
(1972-1973) (1983)
(1993-1994)
(1999-2000)
(2004-2005)
(1972-1973) (1983)
(1993-1994)
(1999-2000)
(2004-2005)
Urban Andhra Pradesh 2143 2009 1992 2052 2000 51.0 50.0 49.6 50.8 50.9 31.0 32.0 34.9 41.5 43.2
Assam 2135 2043 2108 2174 2143 56.0 52.0 53.5 56.5 55.9 25.0 25.0 30.8 38.7 36.8 Bihar 2167 2131 2188 2171 2190 61.0 61.0 61.4 61.0 62.2 25.0 26.0 32.7 34.2 40.4 Gujarat 2172 2000 2027 2058 1991 57.0 55.0 54.9 54.7 57.3 58.0 53.0 57.9 67.0 63.5 Haryana 2404 2242 2140 2172 2033 67.0 67.0 63.6 62.5 60.5 42.0 49.0 49.4 56.3 54.4
Karnataka 1925 2124 2026 2046 1944 46.0 55.0 53.1 53.5 52.2 32.0 36.0 37.6 45.1 43.3 Kerala 1723 2049 1966 1995 1996 44.0 51.0 52.4 55.2 56.7 27.0 38.0 37.0 42.9 44.9 Madhya Pradesh 2229 2137 2082 2132 1954 61.0 62.0 59.8 60.6 58.2 34.0 36.0 40.3 43.5 43.4
Maharashtra 1971 2028 1989 2039 1847 55.0 56.0 55.5 55.9 52.1 41.0 45.0 47.9 52.6 50.1 Orissa 2276 2219 2261 2298 2139 55.0 56.0 57.2 57.8 55.2 23.0 24.0 28.1 27.4 28.3
Punjab 2783 2100 2089 2197 2150 70.0 63.0 61.8 64.8 63.4 52.0 49.0 53.7 57.9 61.0 Rajasthan 2357 2255 2184 2335 2116 70.0 69.0 66.5 70.4 64.0 47.0 47.0 51.6 61.5 56.4 Tamil Nadu 1841 2140 1922 2030 1935 44.0 45.0 48.7 51.7 49.2 23.0 29.0 33.9 43.2 41.1 Uttar Pradesh 2161 2043 2114 2131 2124 62.0 62.0 63.2 62.0 65.1 35.0 34.0 41.2 45.5 46.1
West Bengal 2080 2048 2131 2134 2011 58.0 55.0 56.6 55.5 55.1 31.0 31.0 34.2 40.2 39.1
all-India 2107 2089 2071 2156 2020 56.0 57.0 57.2 58.5 57.0 36.0 37.0 42.0 49.6 47.5 Source: GoI (2007c, p. 54)
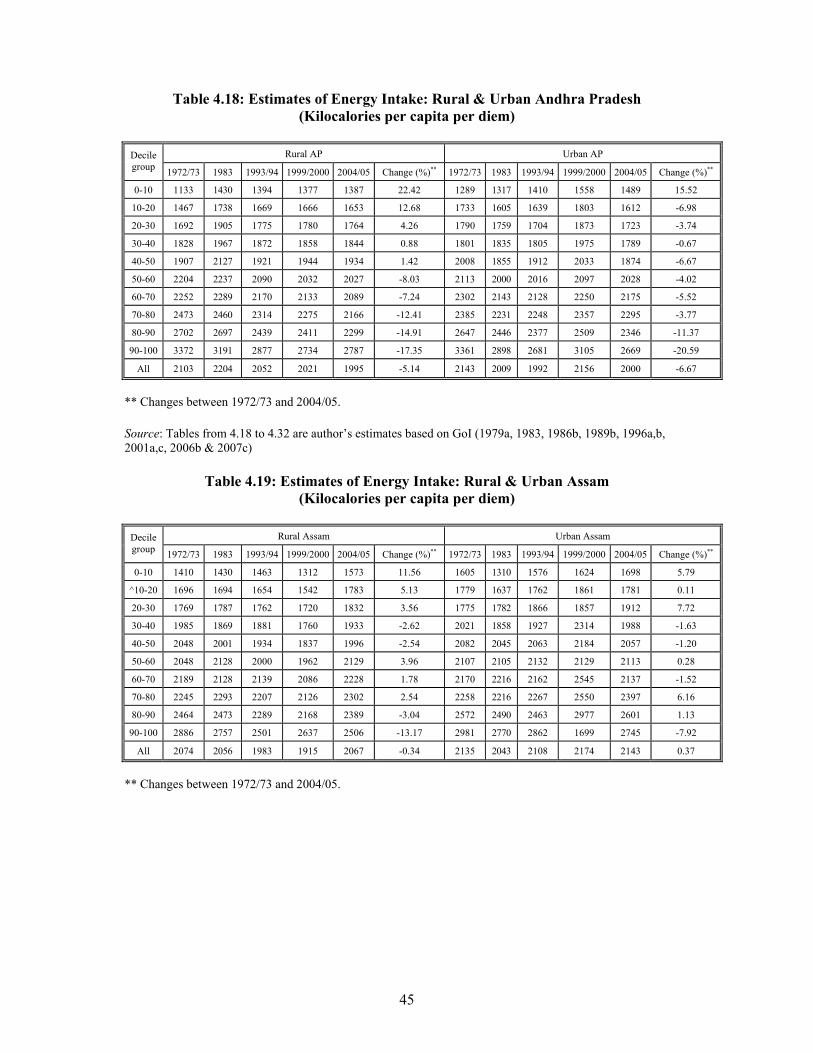
45
Table 4.18: Estimates of Energy Intake: Rural & Urban Andhra Pradesh (Kilocalories per capita per diem)
Rural AP Urban AP Decile
group 1972/73 1983 1993/94 1999/2000 2004/05 Change (%)** 1972/73 1983 1993/94 1999/2000 2004/05 Change (%)**
0-10 1133 1430 1394 1377 1387 22.42 1289 1317 1410 1558 1489 15.52
10-20 1467 1738 1669 1666 1653 12.68 1733 1605 1639 1803 1612 -6.98
20-30 1692 1905 1775 1780 1764 4.26 1790 1759 1704 1873 1723 -3.74
30-40 1828 1967 1872 1858 1844 0.88 1801 1835 1805 1975 1789 -0.67
40-50 1907 2127 1921 1944 1934 1.42 2008 1855 1912 2033 1874 -6.67
50-60 2204 2237 2090 2032 2027 -8.03 2113 2000 2016 2097 2028 -4.02
60-70 2252 2289 2170 2133 2089 -7.24 2302 2143 2128 2250 2175 -5.52
70-80 2473 2460 2314 2275 2166 -12.41 2385 2231 2248 2357 2295 -3.77
80-90 2702 2697 2439 2411 2299 -14.91 2647 2446 2377 2509 2346 -11.37
90-100 3372 3191 2877 2734 2787 -17.35 3361 2898 2681 3105 2669 -20.59
All 2103 2204 2052 2021 1995 -5.14 2143 2009 1992 2156 2000 -6.67
** Changes between 1972/73 and 2004/05. Source: Tables from 4.18 to 4.32 are author’s estimates based on GoI (1979a, 1983, 1986b, 1989b, 1996a,b, 2001a,c, 2006b & 2007c)
Table 4.19: Estimates of Energy Intake: Rural & Urban Assam (Kilocalories per capita per diem)
Rural Assam Urban Assam Decile
group 1972/73 1983 1993/94 1999/2000 2004/05 Change (%)** 1972/73 1983 1993/94 1999/2000 2004/05 Change (%)**
0-10 1410 1430 1463 1312 1573 11.56 1605 1310 1576 1624 1698 5.79
^10-20 1696 1694 1654 1542 1783 5.13 1779 1637 1762 1861 1781 0.11
20-30 1769 1787 1762 1720 1832 3.56 1775 1782 1866 1857 1912 7.72
30-40 1985 1869 1881 1760 1933 -2.62 2021 1858 1927 2314 1988 -1.63
40-50 2048 2001 1934 1837 1996 -2.54 2082 2045 2063 2184 2057 -1.20
50-60 2048 2128 2000 1962 2129 3.96 2107 2105 2132 2129 2113 0.28
60-70 2189 2128 2139 2086 2228 1.78 2170 2216 2162 2545 2137 -1.52
70-80 2245 2293 2207 2126 2302 2.54 2258 2216 2267 2550 2397 6.16
80-90 2464 2473 2289 2168 2389 -3.04 2572 2490 2463 2977 2601 1.13
90-100 2886 2757 2501 2637 2506 -13.17 2981 2770 2862 1699 2745 -7.92
All 2074 2056 1983 1915 2067 -0.34 2135 2043 2108 2174 2143 0.37
** Changes between 1972/73 and 2004/05.
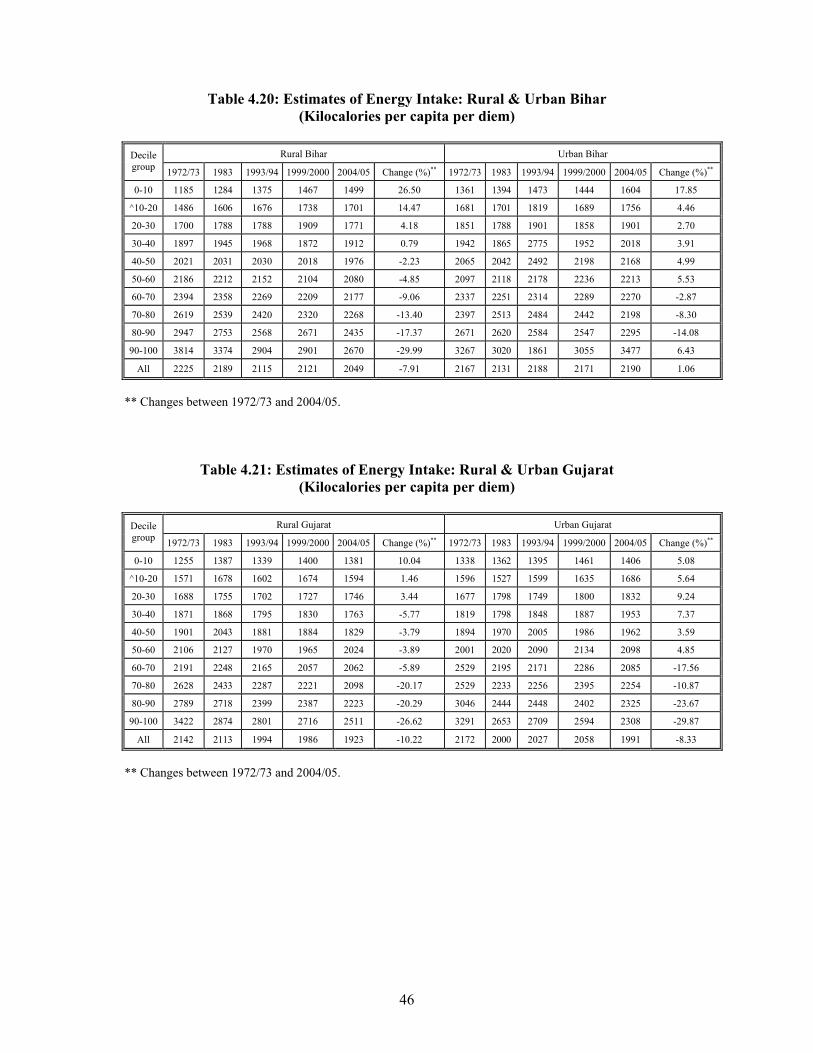
46
Table 4.20: Estimates of Energy Intake: Rural & Urban Bihar (Kilocalories per capita per diem)
Rural Bihar Urban Bihar Decile
group 1972/73 1983 1993/94 1999/2000 2004/05 Change (%)** 1972/73 1983 1993/94 1999/2000 2004/05 Change (%)**
0-10 1185 1284 1375 1467 1499 26.50 1361 1394 1473 1444 1604 17.85
^10-20 1486 1606 1676 1738 1701 14.47 1681 1701 1819 1689 1756 4.46
20-30 1700 1788 1788 1909 1771 4.18 1851 1788 1901 1858 1901 2.70
30-40 1897 1945 1968 1872 1912 0.79 1942 1865 2775 1952 2018 3.91
40-50 2021 2031 2030 2018 1976 -2.23 2065 2042 2492 2198 2168 4.99
50-60 2186 2212 2152 2104 2080 -4.85 2097 2118 2178 2236 2213 5.53
60-70 2394 2358 2269 2209 2177 -9.06 2337 2251 2314 2289 2270 -2.87
70-80 2619 2539 2420 2320 2268 -13.40 2397 2513 2484 2442 2198 -8.30
80-90 2947 2753 2568 2671 2435 -17.37 2671 2620 2584 2547 2295 -14.08
90-100 3814 3374 2904 2901 2670 -29.99 3267 3020 1861 3055 3477 6.43
All 2225 2189 2115 2121 2049 -7.91 2167 2131 2188 2171 2190 1.06
** Changes between 1972/73 and 2004/05.
Table 4.21: Estimates of Energy Intake: Rural & Urban Gujarat (Kilocalories per capita per diem)
Rural Gujarat Urban Gujarat Decile
group 1972/73 1983 1993/94 1999/2000 2004/05 Change (%)** 1972/73 1983 1993/94 1999/2000 2004/05 Change (%)**
0-10 1255 1387 1339 1400 1381 10.04 1338 1362 1395 1461 1406 5.08
^10-20 1571 1678 1602 1674 1594 1.46 1596 1527 1599 1635 1686 5.64
20-30 1688 1755 1702 1727 1746 3.44 1677 1798 1749 1800 1832 9.24
30-40 1871 1868 1795 1830 1763 -5.77 1819 1798 1848 1887 1953 7.37
40-50 1901 2043 1881 1884 1829 -3.79 1894 1970 2005 1986 1962 3.59
50-60 2106 2127 1970 1965 2024 -3.89 2001 2020 2090 2134 2098 4.85
60-70 2191 2248 2165 2057 2062 -5.89 2529 2195 2171 2286 2085 -17.56
70-80 2628 2433 2287 2221 2098 -20.17 2529 2233 2256 2395 2254 -10.87
80-90 2789 2718 2399 2387 2223 -20.29 3046 2444 2448 2402 2325 -23.67
90-100 3422 2874 2801 2716 2511 -26.62 3291 2653 2709 2594 2308 -29.87
All 2142 2113 1994 1986 1923 -10.22 2172 2000 2027 2058 1991 -8.33
** Changes between 1972/73 and 2004/05.
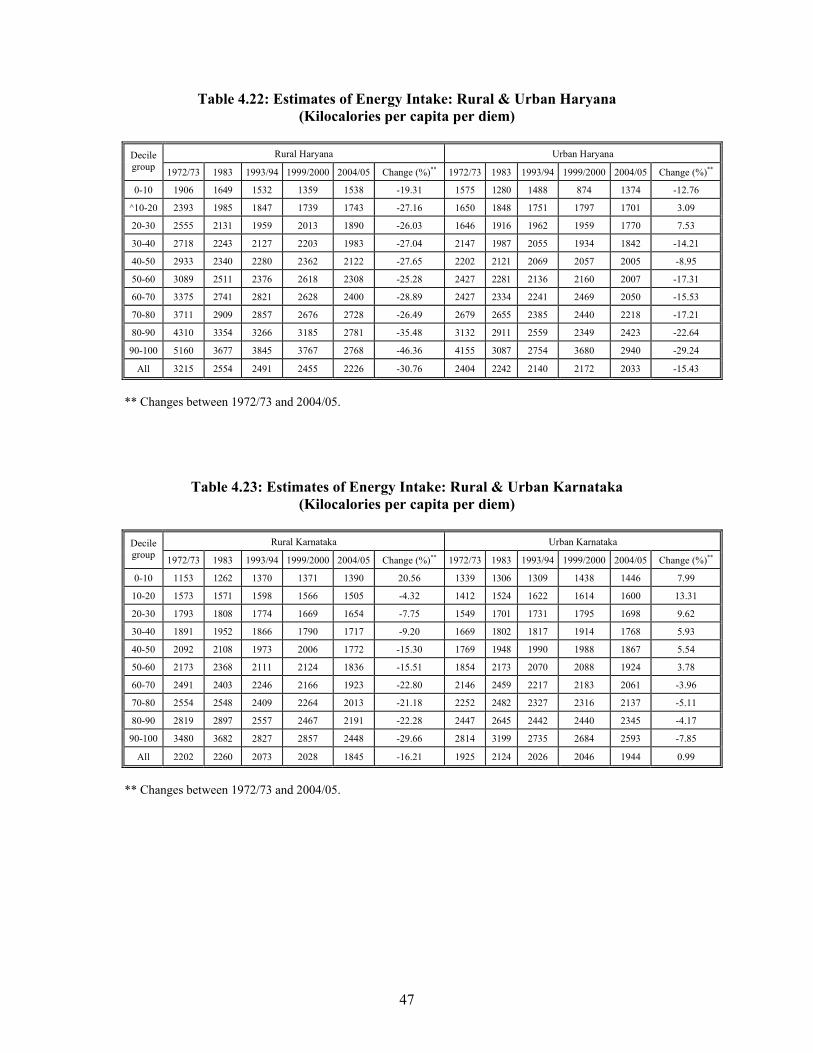
47
Table 4.22: Estimates of Energy Intake: Rural & Urban Haryana (Kilocalories per capita per diem)
Rural Haryana Urban Haryana Decile
group 1972/73 1983 1993/94 1999/2000 2004/05 Change (%)** 1972/73 1983 1993/94 1999/2000 2004/05 Change (%)**
0-10 1906 1649 1532 1359 1538 -19.31 1575 1280 1488 874 1374 -12.76
^10-20 2393 1985 1847 1739 1743 -27.16 1650 1848 1751 1797 1701 3.09
20-30 2555 2131 1959 2013 1890 -26.03 1646 1916 1962 1959 1770 7.53
30-40 2718 2243 2127 2203 1983 -27.04 2147 1987 2055 1934 1842 -14.21
40-50 2933 2340 2280 2362 2122 -27.65 2202 2121 2069 2057 2005 -8.95
50-60 3089 2511 2376 2618 2308 -25.28 2427 2281 2136 2160 2007 -17.31
60-70 3375 2741 2821 2628 2400 -28.89 2427 2334 2241 2469 2050 -15.53
70-80 3711 2909 2857 2676 2728 -26.49 2679 2655 2385 2440 2218 -17.21
80-90 4310 3354 3266 3185 2781 -35.48 3132 2911 2559 2349 2423 -22.64
90-100 5160 3677 3845 3767 2768 -46.36 4155 3087 2754 3680 2940 -29.24
All 3215 2554 2491 2455 2226 -30.76 2404 2242 2140 2172 2033 -15.43
** Changes between 1972/73 and 2004/05.
Table 4.23: Estimates of Energy Intake: Rural & Urban Karnataka (Kilocalories per capita per diem)
Rural Karnataka Urban Karnataka Decile
group 1972/73 1983 1993/94 1999/2000 2004/05 Change (%)** 1972/73 1983 1993/94 1999/2000 2004/05 Change (%)**
0-10 1153 1262 1370 1371 1390 20.56 1339 1306 1309 1438 1446 7.99
10-20 1573 1571 1598 1566 1505 -4.32 1412 1524 1622 1614 1600 13.31
20-30 1793 1808 1774 1669 1654 -7.75 1549 1701 1731 1795 1698 9.62
30-40 1891 1952 1866 1790 1717 -9.20 1669 1802 1817 1914 1768 5.93
40-50 2092 2108 1973 2006 1772 -15.30 1769 1948 1990 1988 1867 5.54
50-60 2173 2368 2111 2124 1836 -15.51 1854 2173 2070 2088 1924 3.78
60-70 2491 2403 2246 2166 1923 -22.80 2146 2459 2217 2183 2061 -3.96
70-80 2554 2548 2409 2264 2013 -21.18 2252 2482 2327 2316 2137 -5.11
80-90 2819 2897 2557 2467 2191 -22.28 2447 2645 2442 2440 2345 -4.17
90-100 3480 3682 2827 2857 2448 -29.66 2814 3199 2735 2684 2593 -7.85
All 2202 2260 2073 2028 1845 -16.21 1925 2124 2026 2046 1944 0.99
** Changes between 1972/73 and 2004/05.
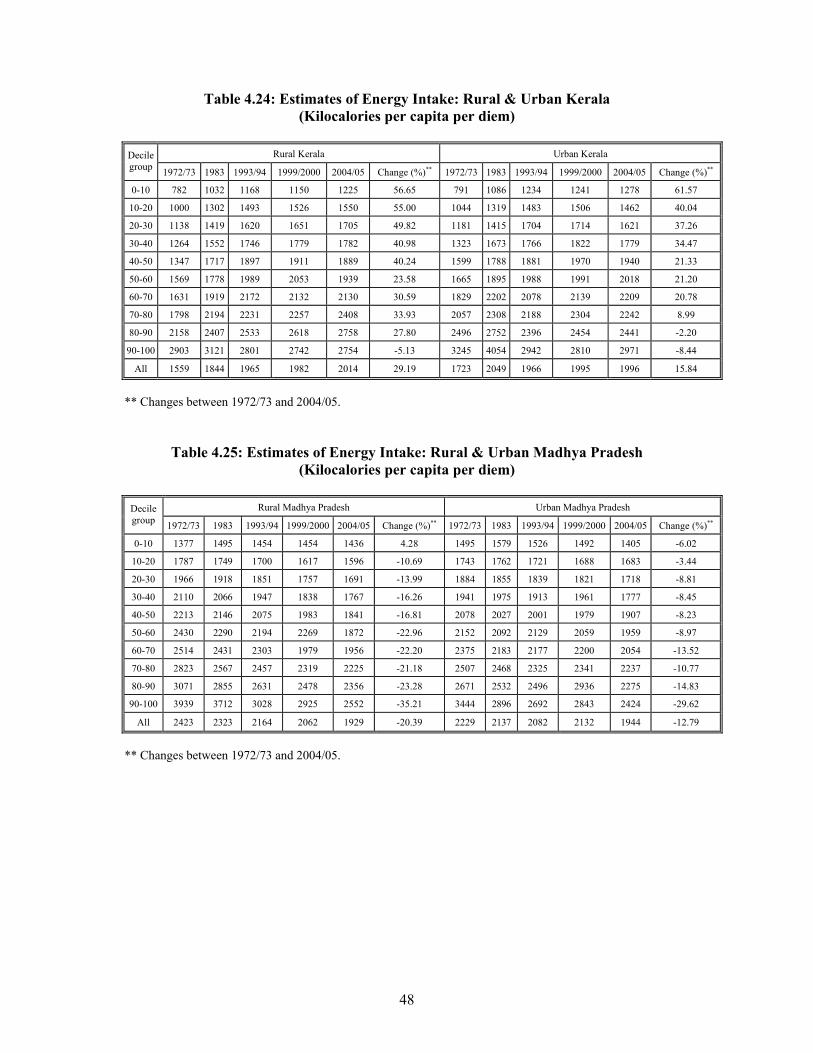
48
Table 4.24: Estimates of Energy Intake: Rural & Urban Kerala (Kilocalories per capita per diem)
Rural Kerala Urban Kerala Decile
group 1972/73 1983 1993/94 1999/2000 2004/05 Change (%)** 1972/73 1983 1993/94 1999/2000 2004/05 Change (%)**
0-10 782 1032 1168 1150 1225 56.65 791 1086 1234 1241 1278 61.57
10-20 1000 1302 1493 1526 1550 55.00 1044 1319 1483 1506 1462 40.04
20-30 1138 1419 1620 1651 1705 49.82 1181 1415 1704 1714 1621 37.26
30-40 1264 1552 1746 1779 1782 40.98 1323 1673 1766 1822 1779 34.47
40-50 1347 1717 1897 1911 1889 40.24 1599 1788 1881 1970 1940 21.33
50-60 1569 1778 1989 2053 1939 23.58 1665 1895 1988 1991 2018 21.20
60-70 1631 1919 2172 2132 2130 30.59 1829 2202 2078 2139 2209 20.78
70-80 1798 2194 2231 2257 2408 33.93 2057 2308 2188 2304 2242 8.99
80-90 2158 2407 2533 2618 2758 27.80 2496 2752 2396 2454 2441 -2.20
90-100 2903 3121 2801 2742 2754 -5.13 3245 4054 2942 2810 2971 -8.44
All 1559 1844 1965 1982 2014 29.19 1723 2049 1966 1995 1996 15.84
** Changes between 1972/73 and 2004/05.
Table 4.25: Estimates of Energy Intake: Rural & Urban Madhya Pradesh (Kilocalories per capita per diem)
Rural Madhya Pradesh Urban Madhya Pradesh Decile
group 1972/73 1983 1993/94 1999/2000 2004/05 Change (%)** 1972/73 1983 1993/94 1999/2000 2004/05 Change (%)**
0-10 1377 1495 1454 1454 1436 4.28 1495 1579 1526 1492 1405 -6.02
10-20 1787 1749 1700 1617 1596 -10.69 1743 1762 1721 1688 1683 -3.44
20-30 1966 1918 1851 1757 1691 -13.99 1884 1855 1839 1821 1718 -8.81
30-40 2110 2066 1947 1838 1767 -16.26 1941 1975 1913 1961 1777 -8.45
40-50 2213 2146 2075 1983 1841 -16.81 2078 2027 2001 1979 1907 -8.23
50-60 2430 2290 2194 2269 1872 -22.96 2152 2092 2129 2059 1959 -8.97
60-70 2514 2431 2303 1979 1956 -22.20 2375 2183 2177 2200 2054 -13.52
70-80 2823 2567 2457 2319 2225 -21.18 2507 2468 2325 2341 2237 -10.77
80-90 3071 2855 2631 2478 2356 -23.28 2671 2532 2496 2936 2275 -14.83
90-100 3939 3712 3028 2925 2552 -35.21 3444 2896 2692 2843 2424 -29.62
All 2423 2323 2164 2062 1929 -20.39 2229 2137 2082 2132 1944 -12.79
** Changes between 1972/73 and 2004/05.
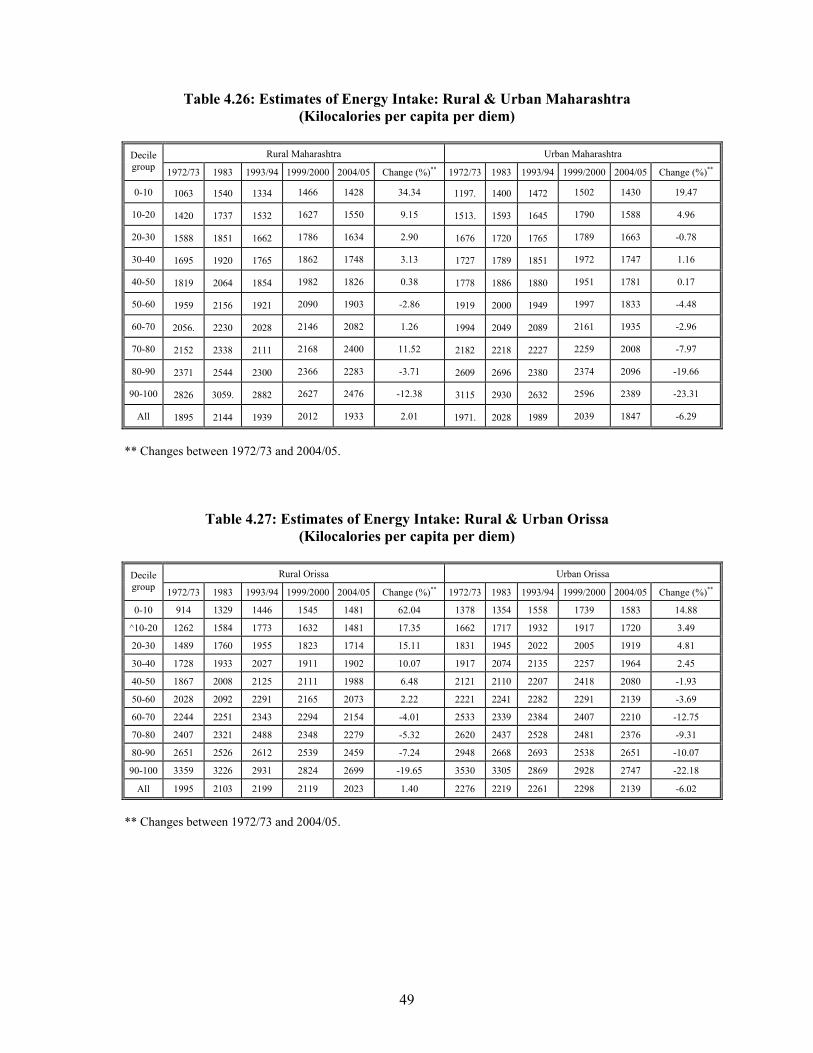
49
Table 4.26: Estimates of Energy Intake: Rural & Urban Maharashtra (Kilocalories per capita per diem)
Rural Maharashtra Urban Maharashtra Decile
group 1972/73 1983 1993/94 1999/2000 2004/05 Change (%)** 1972/73 1983 1993/94 1999/2000 2004/05 Change (%)**
0-10 1063 1540 1334 1466 1428 34.34 1197. 1400 1472 1502 1430 19.47
10-20 1420 1737 1532 1627 1550 9.15 1513. 1593 1645 1790 1588 4.96
20-30 1588 1851 1662 1786 1634 2.90 1676 1720 1765 1789 1663 -0.78
30-40 1695 1920 1765 1862 1748 3.13 1727 1789 1851 1972 1747 1.16
40-50 1819 2064 1854 1982 1826 0.38 1778 1886 1880 1951 1781 0.17
50-60 1959 2156 1921 2090 1903 -2.86 1919 2000 1949 1997 1833 -4.48
60-70 2056. 2230 2028 2146 2082 1.26 1994 2049 2089 2161 1935 -2.96
70-80 2152 2338 2111 2168 2400 11.52 2182 2218 2227 2259 2008 -7.97
80-90 2371 2544 2300 2366 2283 -3.71 2609 2696 2380 2374 2096 -19.66
90-100 2826 3059. 2882 2627 2476 -12.38 3115 2930 2632 2596 2389 -23.31
All 1895 2144 1939 2012 1933 2.01 1971. 2028 1989 2039 1847 -6.29
** Changes between 1972/73 and 2004/05.
Table 4.27: Estimates of Energy Intake: Rural & Urban Orissa (Kilocalories per capita per diem)
Rural Orissa Urban Orissa Decile
group 1972/73 1983 1993/94 1999/2000 2004/05 Change (%)** 1972/73 1983 1993/94 1999/2000 2004/05 Change (%)**
0-10 914 1329 1446 1545 1481 62.04 1378 1354 1558 1739 1583 14.88
^10-20 1262 1584 1773 1632 1481 17.35 1662 1717 1932 1917 1720 3.49
20-30 1489 1760 1955 1823 1714 15.11 1831 1945 2022 2005 1919 4.81
30-40 1728 1933 2027 1911 1902 10.07 1917 2074 2135 2257 1964 2.45
40-50 1867 2008 2125 2111 1988 6.48 2121 2110 2207 2418 2080 -1.93
50-60 2028 2092 2291 2165 2073 2.22 2221 2241 2282 2291 2139 -3.69
60-70 2244 2251 2343 2294 2154 -4.01 2533 2339 2384 2407 2210 -12.75
70-80 2407 2321 2488 2348 2279 -5.32 2620 2437 2528 2481 2376 -9.31
80-90 2651 2526 2612 2539 2459 -7.24 2948 2668 2693 2538 2651 -10.07
90-100 3359 3226 2931 2824 2699 -19.65 3530 3305 2869 2928 2747 -22.18
All 1995 2103 2199 2119 2023 1.40 2276 2219 2261 2298 2139 -6.02
** Changes between 1972/73 and 2004/05.
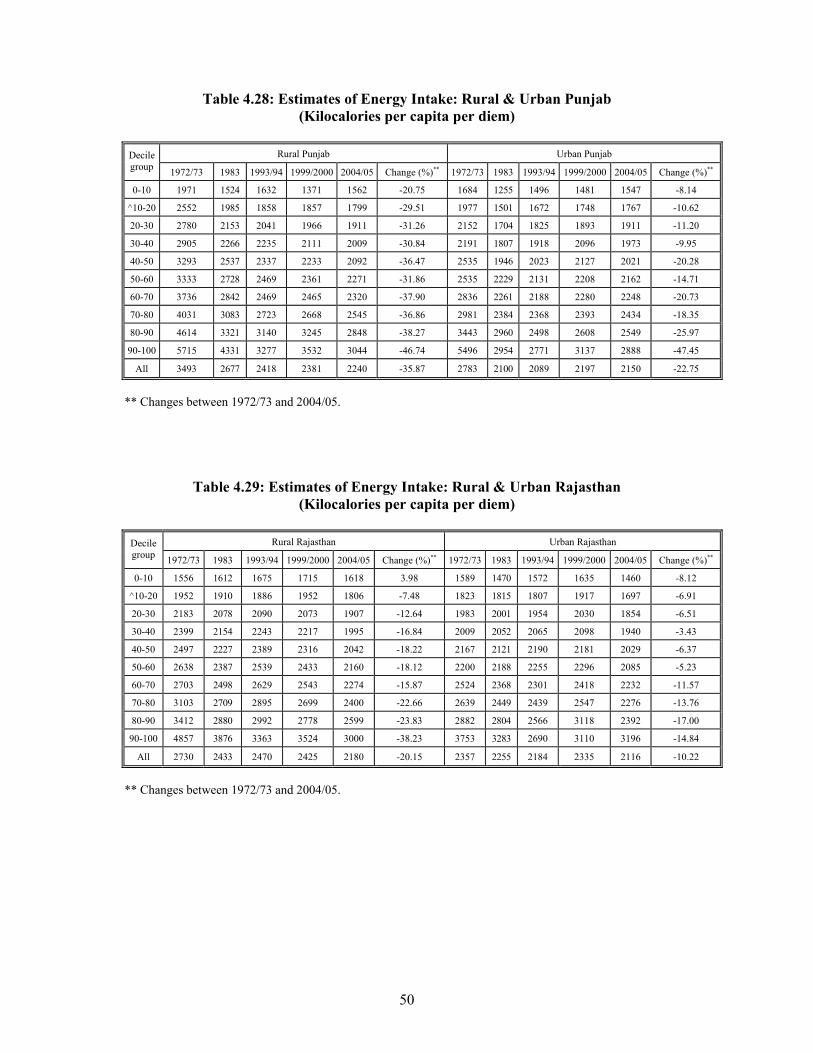
50
Table 4.28: Estimates of Energy Intake: Rural & Urban Punjab (Kilocalories per capita per diem)
Rural Punjab Urban Punjab Decile
group 1972/73 1983 1993/94 1999/2000 2004/05 Change (%)** 1972/73 1983 1993/94 1999/2000 2004/05 Change (%)**
0-10 1971 1524 1632 1371 1562 -20.75 1684 1255 1496 1481 1547 -8.14
^10-20 2552 1985 1858 1857 1799 -29.51 1977 1501 1672 1748 1767 -10.62
20-30 2780 2153 2041 1966 1911 -31.26 2152 1704 1825 1893 1911 -11.20
30-40 2905 2266 2235 2111 2009 -30.84 2191 1807 1918 2096 1973 -9.95
40-50 3293 2537 2337 2233 2092 -36.47 2535 1946 2023 2127 2021 -20.28
50-60 3333 2728 2469 2361 2271 -31.86 2535 2229 2131 2208 2162 -14.71
60-70 3736 2842 2469 2465 2320 -37.90 2836 2261 2188 2280 2248 -20.73
70-80 4031 3083 2723 2668 2545 -36.86 2981 2384 2368 2393 2434 -18.35
80-90 4614 3321 3140 3245 2848 -38.27 3443 2960 2498 2608 2549 -25.97
90-100 5715 4331 3277 3532 3044 -46.74 5496 2954 2771 3137 2888 -47.45
All 3493 2677 2418 2381 2240 -35.87 2783 2100 2089 2197 2150 -22.75
** Changes between 1972/73 and 2004/05.
Table 4.29: Estimates of Energy Intake: Rural & Urban Rajasthan (Kilocalories per capita per diem)
Rural Rajasthan Urban Rajasthan Decile
group 1972/73 1983 1993/94 1999/2000 2004/05 Change (%)** 1972/73 1983 1993/94 1999/2000 2004/05 Change (%)**
0-10 1556 1612 1675 1715 1618 3.98 1589 1470 1572 1635 1460 -8.12
^10-20 1952 1910 1886 1952 1806 -7.48 1823 1815 1807 1917 1697 -6.91
20-30 2183 2078 2090 2073 1907 -12.64 1983 2001 1954 2030 1854 -6.51
30-40 2399 2154 2243 2217 1995 -16.84 2009 2052 2065 2098 1940 -3.43
40-50 2497 2227 2389 2316 2042 -18.22 2167 2121 2190 2181 2029 -6.37
50-60 2638 2387 2539 2433 2160 -18.12 2200 2188 2255 2296 2085 -5.23
60-70 2703 2498 2629 2543 2274 -15.87 2524 2368 2301 2418 2232 -11.57
70-80 3103 2709 2895 2699 2400 -22.66 2639 2449 2439 2547 2276 -13.76
80-90 3412 2880 2992 2778 2599 -23.83 2882 2804 2566 3118 2392 -17.00
90-100 4857 3876 3363 3524 3000 -38.23 3753 3283 2690 3110 3196 -14.84
All 2730 2433 2470 2425 2180 -20.15 2357 2255 2184 2335 2116 -10.22
** Changes between 1972/73 and 2004/05.
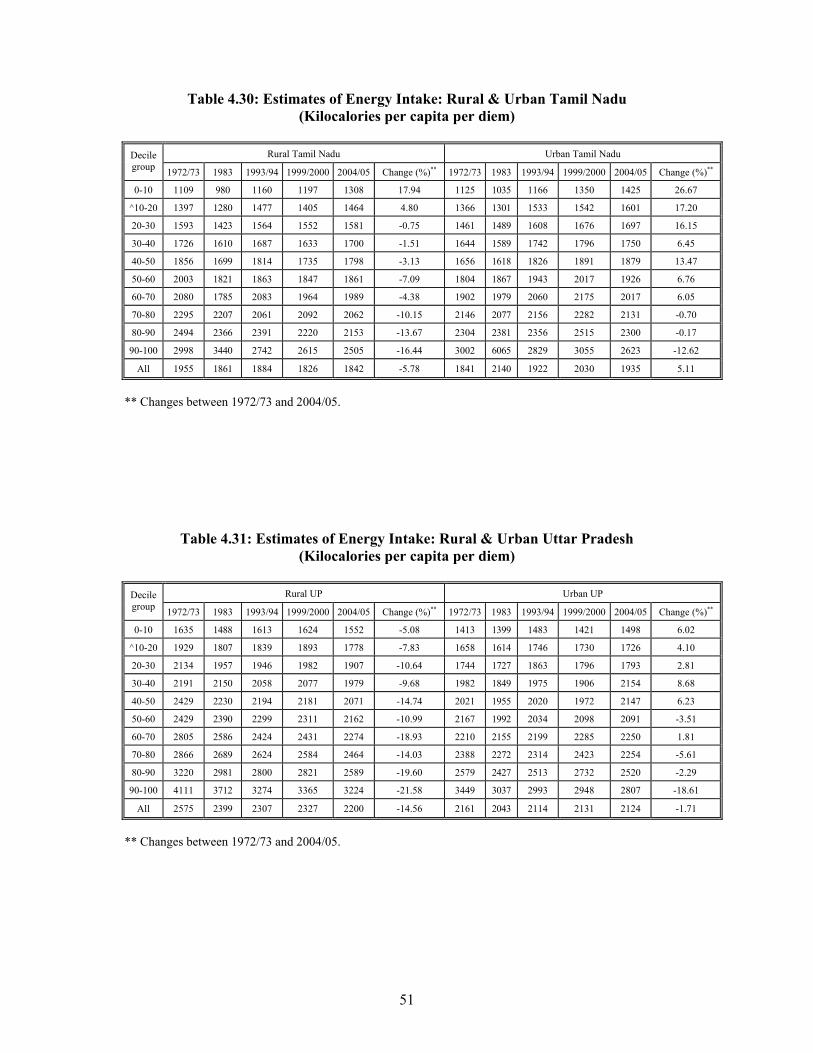
51
Table 4.30: Estimates of Energy Intake: Rural & Urban Tamil Nadu (Kilocalories per capita per diem)
Rural Tamil Nadu Urban Tamil Nadu Decile
group 1972/73 1983 1993/94 1999/2000 2004/05 Change (%)** 1972/73 1983 1993/94 1999/2000 2004/05 Change (%)**
0-10 1109 980 1160 1197 1308 17.94 1125 1035 1166 1350 1425 26.67
^10-20 1397 1280 1477 1405 1464 4.80 1366 1301 1533 1542 1601 17.20
20-30 1593 1423 1564 1552 1581 -0.75 1461 1489 1608 1676 1697 16.15
30-40 1726 1610 1687 1633 1700 -1.51 1644 1589 1742 1796 1750 6.45
40-50 1856 1699 1814 1735 1798 -3.13 1656 1618 1826 1891 1879 13.47
50-60 2003 1821 1863 1847 1861 -7.09 1804 1867 1943 2017 1926 6.76
60-70 2080 1785 2083 1964 1989 -4.38 1902 1979 2060 2175 2017 6.05
70-80 2295 2207 2061 2092 2062 -10.15 2146 2077 2156 2282 2131 -0.70
80-90 2494 2366 2391 2220 2153 -13.67 2304 2381 2356 2515 2300 -0.17
90-100 2998 3440 2742 2615 2505 -16.44 3002 6065 2829 3055 2623 -12.62
All 1955 1861 1884 1826 1842 -5.78 1841 2140 1922 2030 1935 5.11
** Changes between 1972/73 and 2004/05.
Table 4.31: Estimates of Energy Intake: Rural & Urban Uttar Pradesh (Kilocalories per capita per diem)
Rural UP Urban UP Decile
group 1972/73 1983 1993/94 1999/2000 2004/05 Change (%)** 1972/73 1983 1993/94 1999/2000 2004/05 Change (%)**
0-10 1635 1488 1613 1624 1552 -5.08 1413 1399 1483 1421 1498 6.02
^10-20 1929 1807 1839 1893 1778 -7.83 1658 1614 1746 1730 1726 4.10
20-30 2134 1957 1946 1982 1907 -10.64 1744 1727 1863 1796 1793 2.81
30-40 2191 2150 2058 2077 1979 -9.68 1982 1849 1975 1906 2154 8.68
40-50 2429 2230 2194 2181 2071 -14.74 2021 1955 2020 1972 2147 6.23
50-60 2429 2390 2299 2311 2162 -10.99 2167 1992 2034 2098 2091 -3.51
60-70 2805 2586 2424 2431 2274 -18.93 2210 2155 2199 2285 2250 1.81
70-80 2866 2689 2624 2584 2464 -14.03 2388 2272 2314 2423 2254 -5.61
80-90 3220 2981 2800 2821 2589 -19.60 2579 2427 2513 2732 2520 -2.29
90-100 4111 3712 3274 3365 3224 -21.58 3449 3037 2993 2948 2807 -18.61
All 2575 2399 2307 2327 2200 -14.56 2161 2043 2114 2131 2124 -1.71
** Changes between 1972/73 and 2004/05.
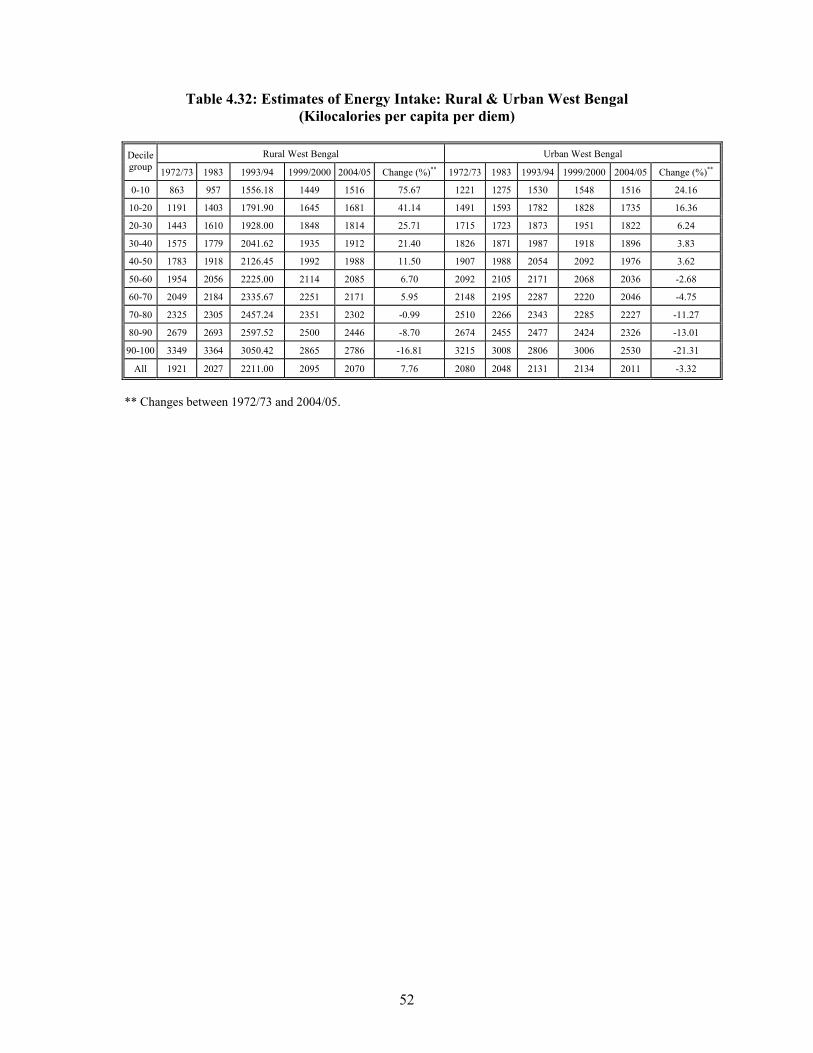
52
Table 4.32: Estimates of Energy Intake: Rural & Urban West Bengal (Kilocalories per capita per diem)
Rural West Bengal Urban West Bengal Decile
group 1972/73 1983 1993/94 1999/2000 2004/05 Change (%)** 1972/73 1983 1993/94 1999/2000 2004/05 Change (%)**
0-10 863 957 1556.18 1449 1516 75.67 1221 1275 1530 1548 1516 24.16
10-20 1191 1403 1791.90 1645 1681 41.14 1491 1593 1782 1828 1735 16.36
20-30 1443 1610 1928.00 1848 1814 25.71 1715 1723 1873 1951 1822 6.24
30-40 1575 1779 2041.62 1935 1912 21.40 1826 1871 1987 1918 1896 3.83
40-50 1783 1918 2126.45 1992 1988 11.50 1907 1988 2054 2092 1976 3.62
50-60 1954 2056 2225.00 2114 2085 6.70 2092 2105 2171 2068 2036 -2.68
60-70 2049 2184 2335.67 2251 2171 5.95 2148 2195 2287 2220 2046 -4.75
70-80 2325 2305 2457.24 2351 2302 -0.99 2510 2266 2343 2285 2227 -11.27
80-90 2679 2693 2597.52 2500 2446 -8.70 2674 2455 2477 2424 2326 -13.01
90-100 3349 3364 3050.42 2865 2786 -16.81 3215 3008 2806 3006 2530 -21.31
All 1921 2027 2211.00 2095 2070 7.76 2080 2048 2131 2134 2011 -3.32
** Changes between 1972/73 and 2004/05.
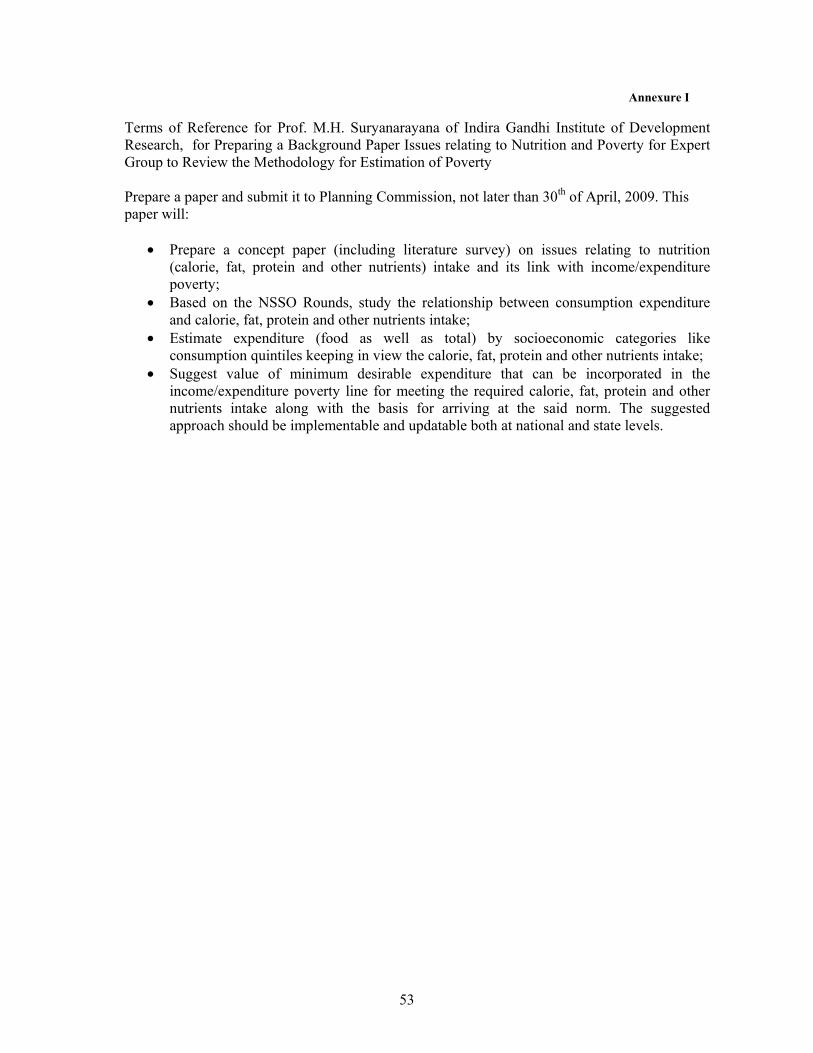
53
Annexure I Terms of Reference for Prof. M.H. Suryanarayana of Indira Gandhi Institute of Development Research, for Preparing a Background Paper Issues relating to Nutrition and Poverty for Expert Group to Review the Methodology for Estimation of Poverty Prepare a paper and submit it to Planning Commission, not later than 30th of April, 2009. This paper will:
• Prepare a concept paper (including literature survey) on issues relating to nutrition (calorie, fat, protein and other nutrients) intake and its link with income/expenditure poverty;
• Based on the NSSO Rounds, study the relationship between consumption expenditure and calorie, fat, protein and other nutrients intake;
• Estimate expenditure (food as well as total) by socioeconomic categories like consumption quintiles keeping in view the calorie, fat, protein and other nutrients intake;
• Suggest value of minimum desirable expenditure that can be incorporated in the income/expenditure poverty line for meeting the required calorie, fat, protein and other nutrients intake along with the basis for arriving at the said norm. The suggested approach should be implementable and updatable both at national and state levels.