Embed Size (px)
Citation preview

Nutrition: What you feed really does matter
2005 Beef Cattle Short Course Gainsville, FL
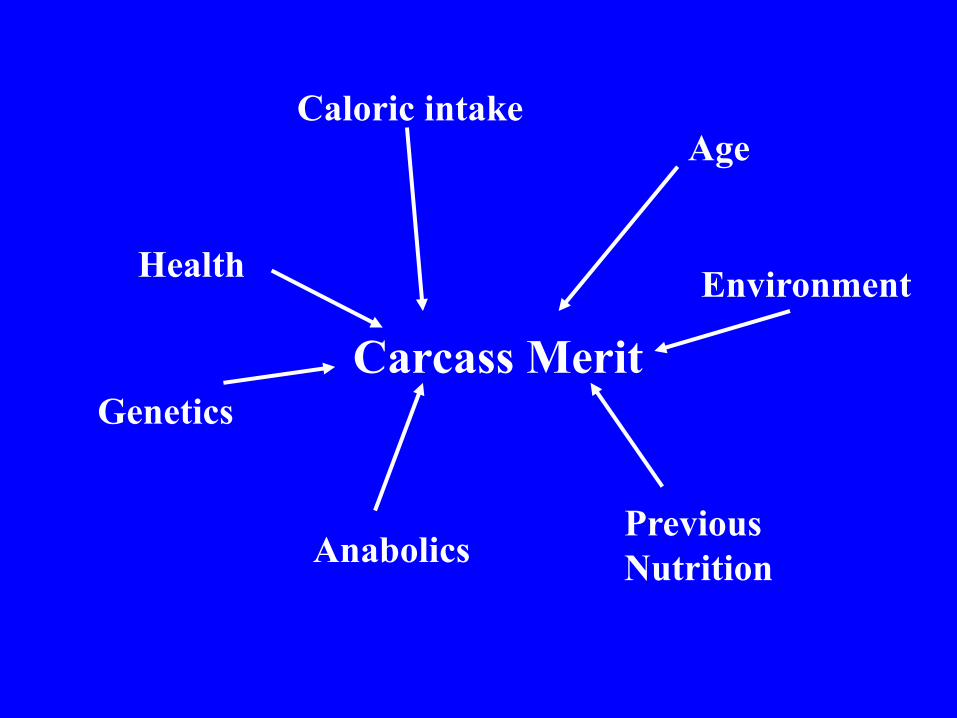
Age
Previous Nutrition
Caloric intake
Genetics
Anabolics
Carcass Merit Environment Health

Age
Previous Nutrition
Caloric intake
Genetics
Anabolics
Carcass Merit Environment Health
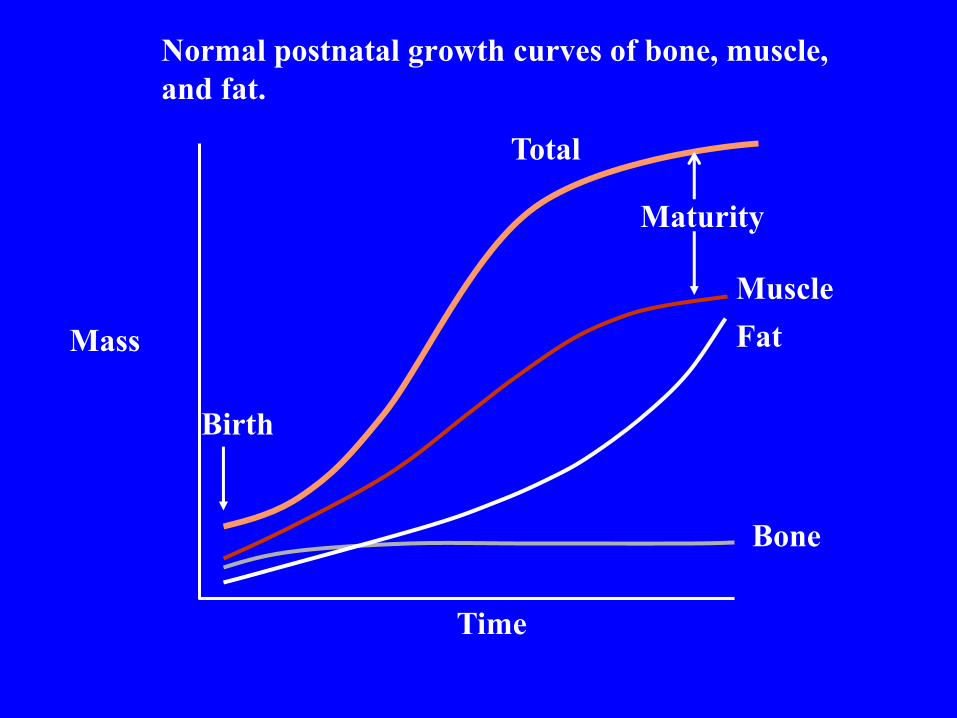
Normal postnatal growth curves of bone, muscle, and fat.
Mass
Time
Bone
Fat Muscle
Birth
Maturity
Total
Intrinsic Growth Curve
• Priority and Progression of Tissue Development – CNS, Skeletal system – Viscera – Skeletal muscle – Adipose
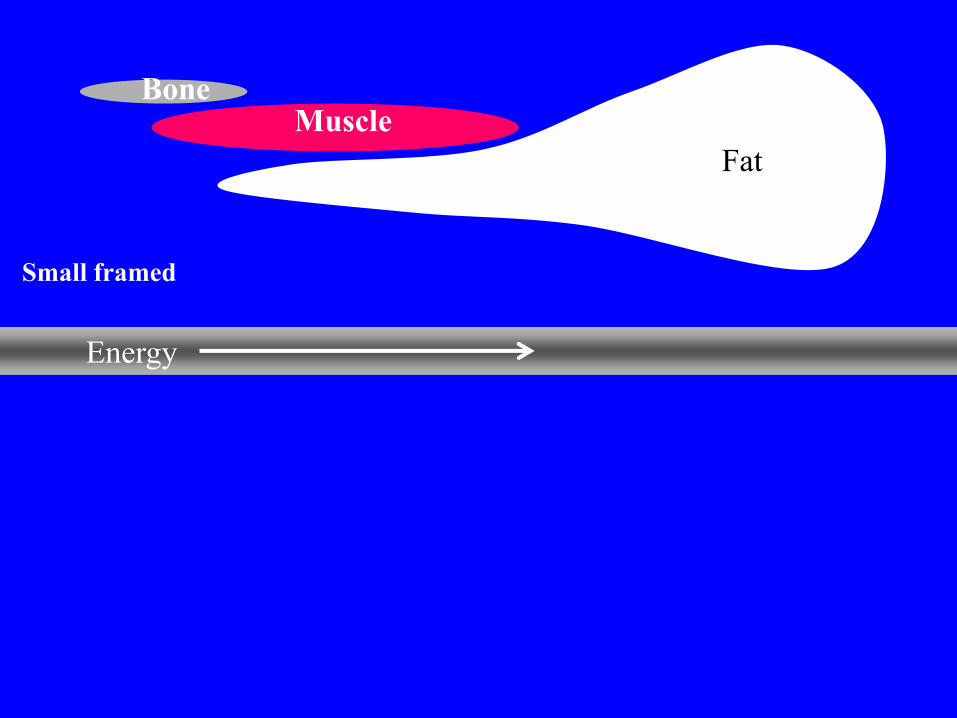
Bone Muscle
Small framed
Energy
Fat

Bone
Bone Muscle
Muscle
Fat
Large frame or
Implanted
Energy
Fat
Small frame
ADG
ADG

Bone
Bone Muscle
Muscle
Fat
Large frame or
Implanted
Energy
Fat
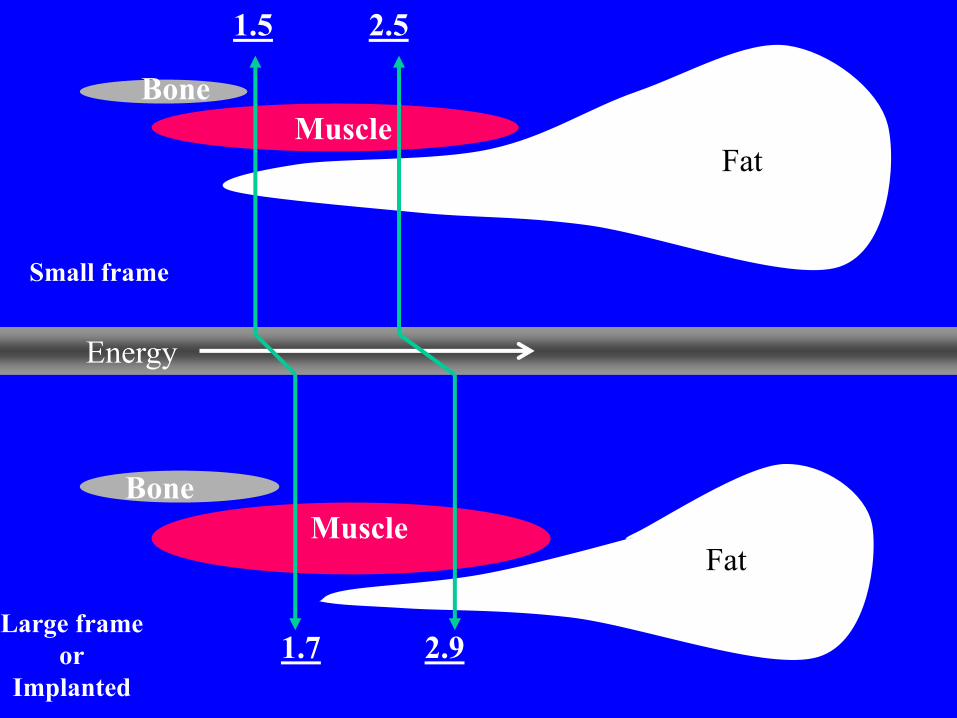
Small frame
ADG 1.5
ADG 1.7
Bone
Bone Muscle
Muscle
Fat
Large frame or
Implanted
Energy
Fat
Small frame
ADG 1.5
ADG 1.7 2.9
2.5
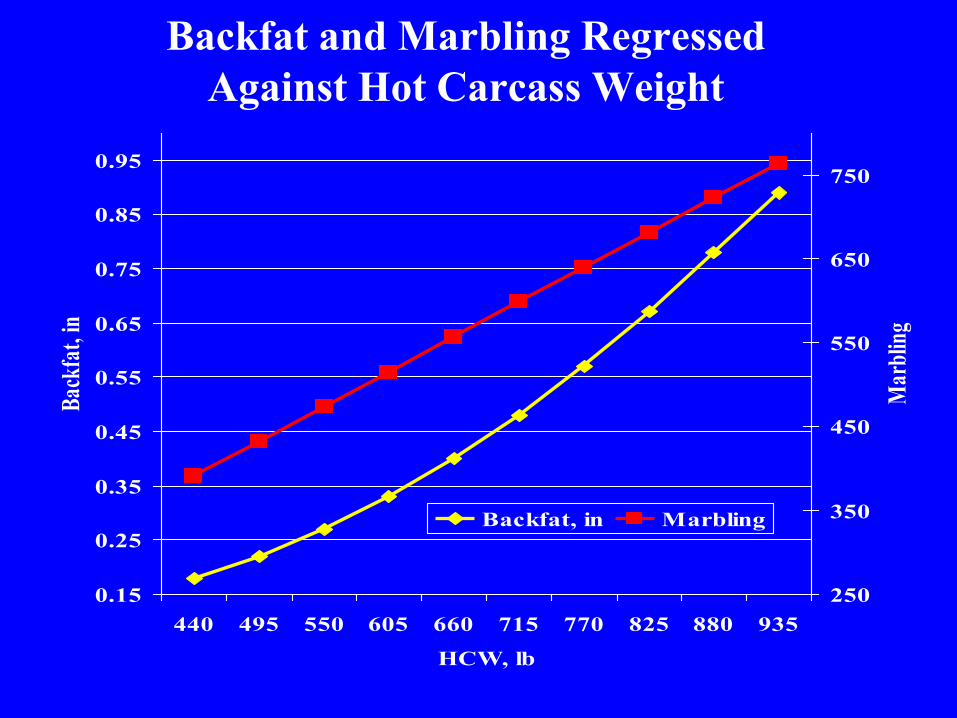
Backfat and Marbling Regressed Against Hot Carcass Weight
0.15
0.25
0.35
0.45
0.55
0.65
0.75
0.85
0.95
440 495 550 605 660 715 770 825 880 935
HCW, lb
Back
fat,
in
250
350
450
550
650
750
Mar
bling
Backfat, in Marbling
Bruns et. al.,1999
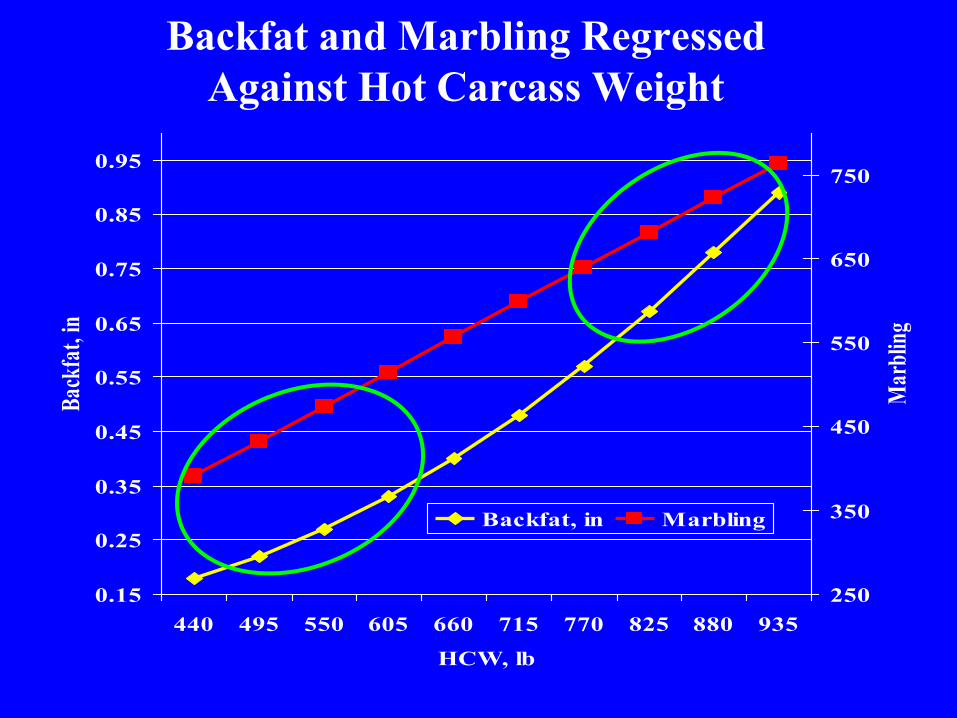
Backfat and Marbling Regressed Against Hot Carcass Weight
0.15
0.25
0.35
0.45
0.55
0.65
0.75
0.85
0.95
440 495 550 605 660 715 770 825 880 935
HCW, lb
Back
fat,
in
250
350
450
550
650
750
Mar
bling
Backfat, in Marbling
Bruns et. al.,1999
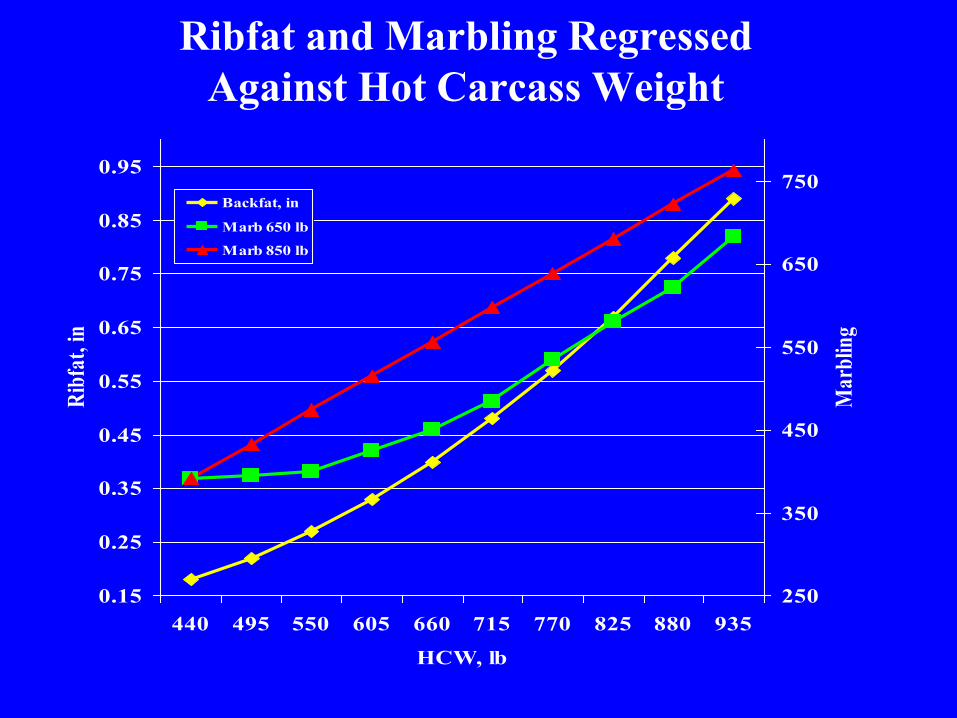
Ribfat and Marbling Regressed Against Hot Carcass Weight
0.15
0.25
0.35
0.45
0.55
0.65
0.75
0.85
0.95
440 495 550 605 660 715 770 825 880 935
HCW, lb
Ribf
at, in
250
350
450
550
650
750
Mar
blin
g
Backfat, in
Marb 650 lb
Marb 850 lb
Bruns et. al.,1999

Ribfat and Marbling Regressed Against Hot Carcass Weight
0.15
0.25
0.35
0.45
0.55
0.65
0.75
0.85
0.95
440 495 550 605 660 715 770 825 880 935
HCW, lb
Ribf
at, in
250
350
450
550
650
750
Mar
blin
g
Backfat, in
Marb 650 lb
Marb 850 lb
Bruns et. al.,1999

Rules of the Game
•Marbling development is an intrinsic component of growth. •Subcutaneous fat deposition is not. •Management can alter either of these in dramatic fashion
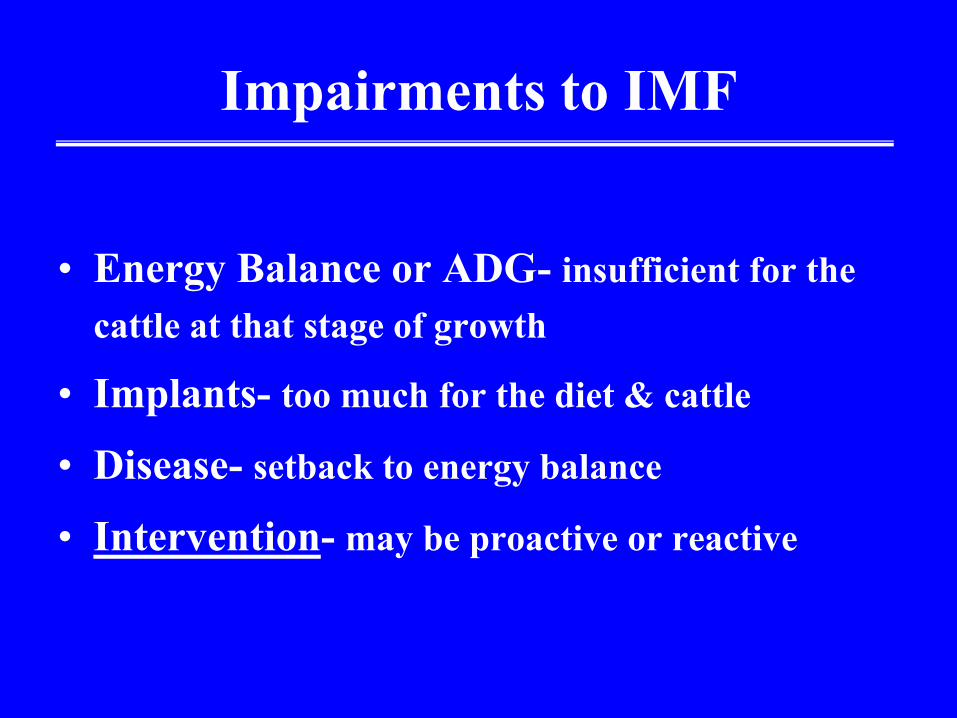
Impairments to IMF
• Energy Balance or ADG- insufficient for the cattle at that stage of growth
• Implants- too much for the diet & cattle
• Disease- setback to energy balance
• Intervention- may be proactive or reactive
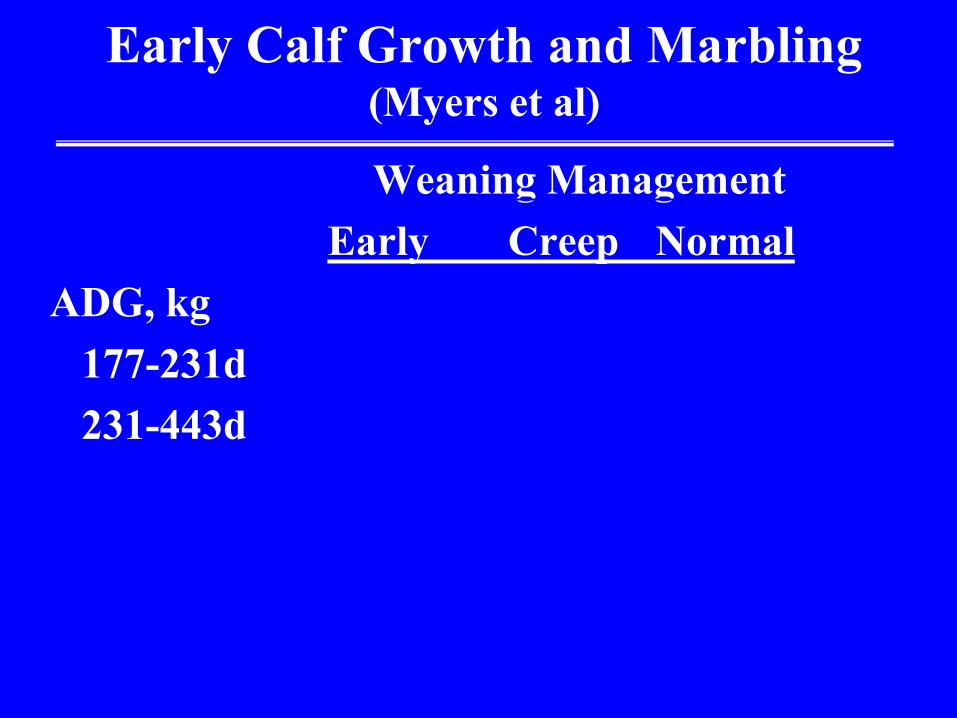
Early Calf Growth and Marbling (Myers et al)
Weaning Management Early Creep Normal ADG, kg 177-231d 231-443d

Early Calf Growth and Marbling (Myers et al)
Weaning Management Early Creep Normal SEM
ADG, kg 177-231dab 3.17 1.81 1.37 .11
231-443da 2.82 3.04 3.04 .04
aEarly vs. rest (P < .01) bCreep vs. normal (P < .05)

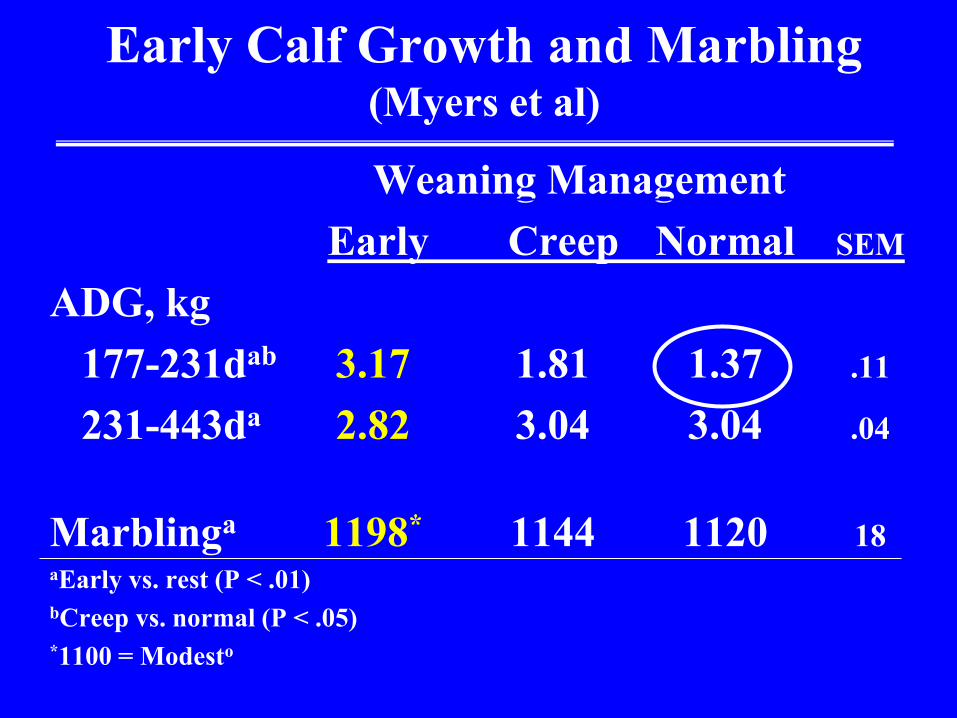
Early Calf Growth and Marbling (Myers et al)
Weaning Management Early Creep Normal SEM
ADG, kg 177-231dab 3.17 1.81 1.37 .11
231-443da 2.82 3.04 3.04 .04
Marblinga 1198* 1144 1120 18 aEarly vs. rest (P < .01) bCreep vs. normal (P < .05) *1100 = Modesto
Early Calf Growth and Marbling (Myers et al)
Weaning Management Early Creep Normal SEM
ADG, kg 177-231dab 3.17 1.81 1.37 .11
231-443da 2.82 3.04 3.04 .04
Marblinga 1198* 1144 1120 18 aEarly vs. rest (P < .01) bCreep vs. normal (P < .05) *1100 = Modesto

There is Room to Wiggle
Early Normal Diff, lb Initial BW 487 593 106 End Rec BW 541 618 77 End Bkgd 797 837 40 Final BW 1146 1180 34 Marbling 520 520 0
Arthington et al 05
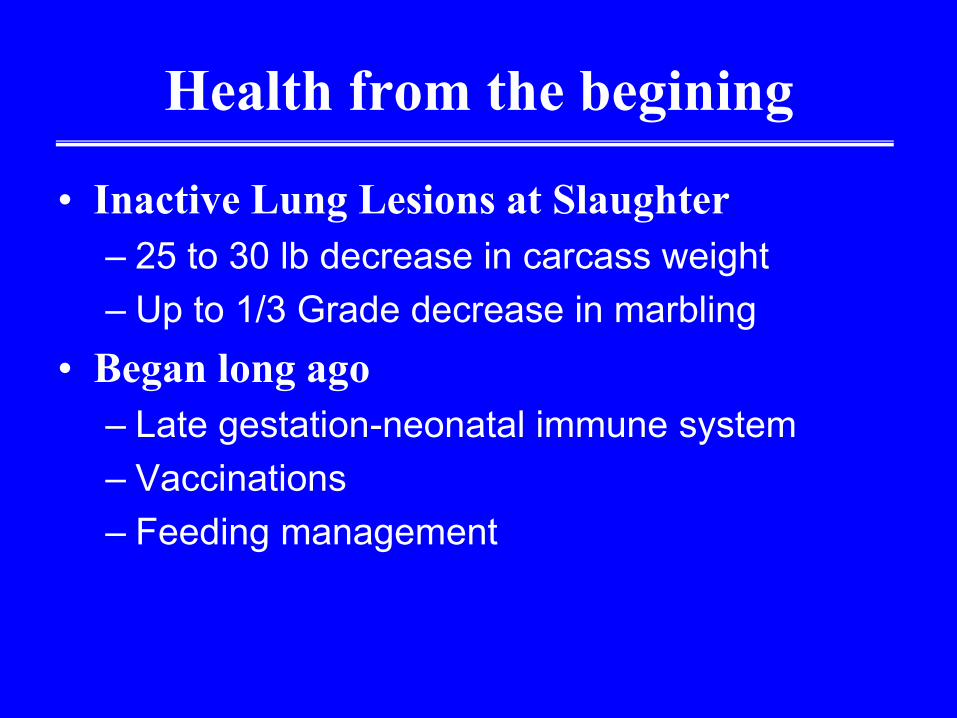
Health from the begining
• Inactive Lung Lesions at Slaughter – 25 to 30 lb decrease in carcass weight – Up to 1/3 Grade decrease in marbling
• Began long ago – Late gestation-neonatal immune system – Vaccinations – Feeding management
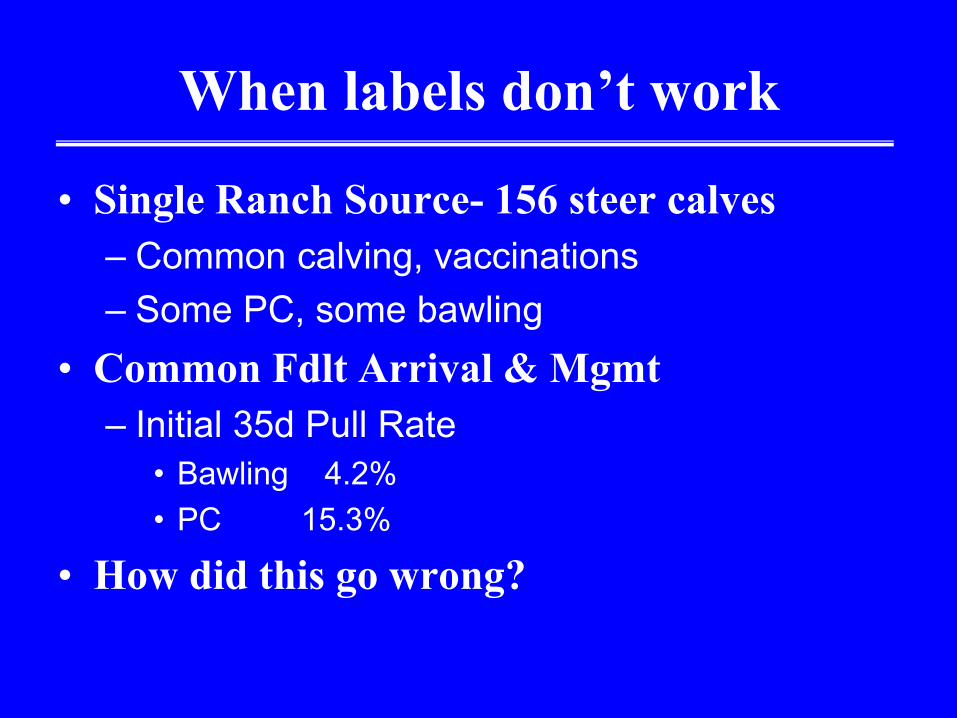
When labels don’t work
• Single Ranch Source- 156 steer calves – Common calving, vaccinations – Some PC, some bawling
• Common Fdlt Arrival & Mgmt – Initial 35d Pull Rate
• Bawling 4.2% • PC 15.3%
• How did this go wrong?
When labels don’t work
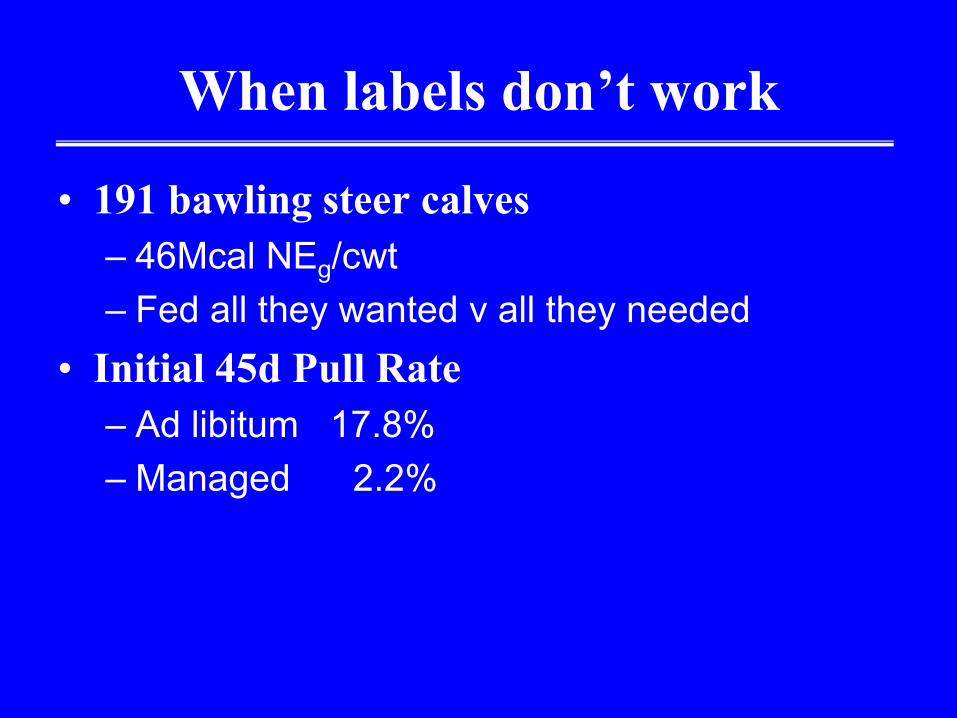
• 191 bawling steer calves – 46Mcal NEg/cwt – Fed all they wanted v all they needed
• Initial 45d Pull Rate – Ad libitum 17.8% – Managed 2.2%
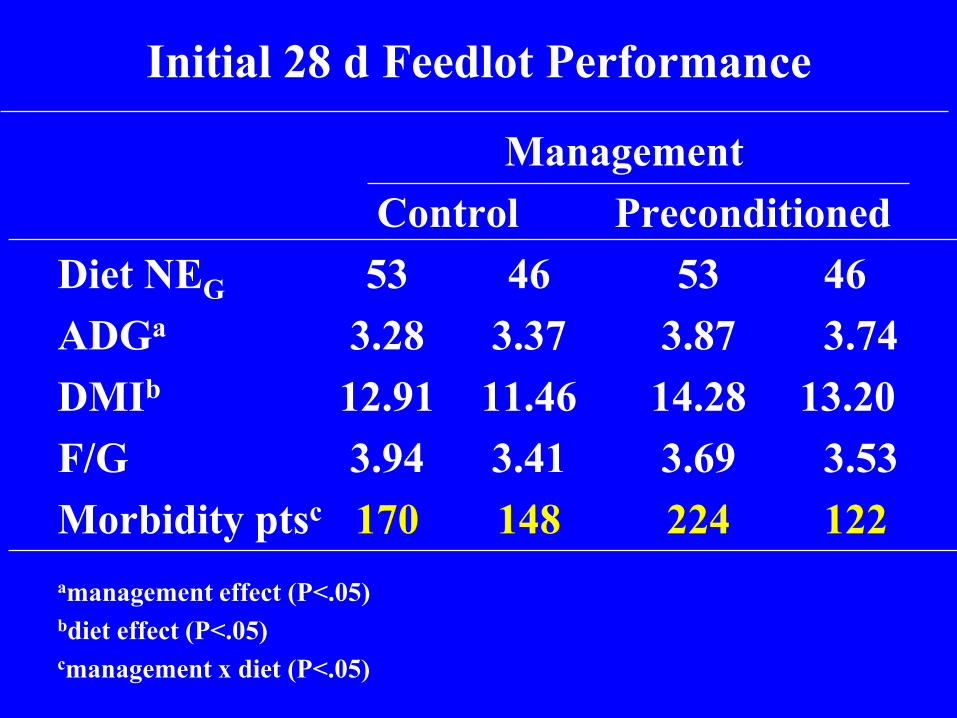
Management Control Preconditioned Diet NEG 53 46 53 46 ADGa 3.28 3.37 3.87 3.74 DMIb 12.91 11.46 14.28 13.20 F/G 3.94 3.41 3.69 3.53 Morbidity ptsc 170 148 224 122
amanagement effect (P<.05) bdiet effect (P<.05) cmanagement x diet (P<.05)
Initial 28 d Feedlot Performance
JS8440
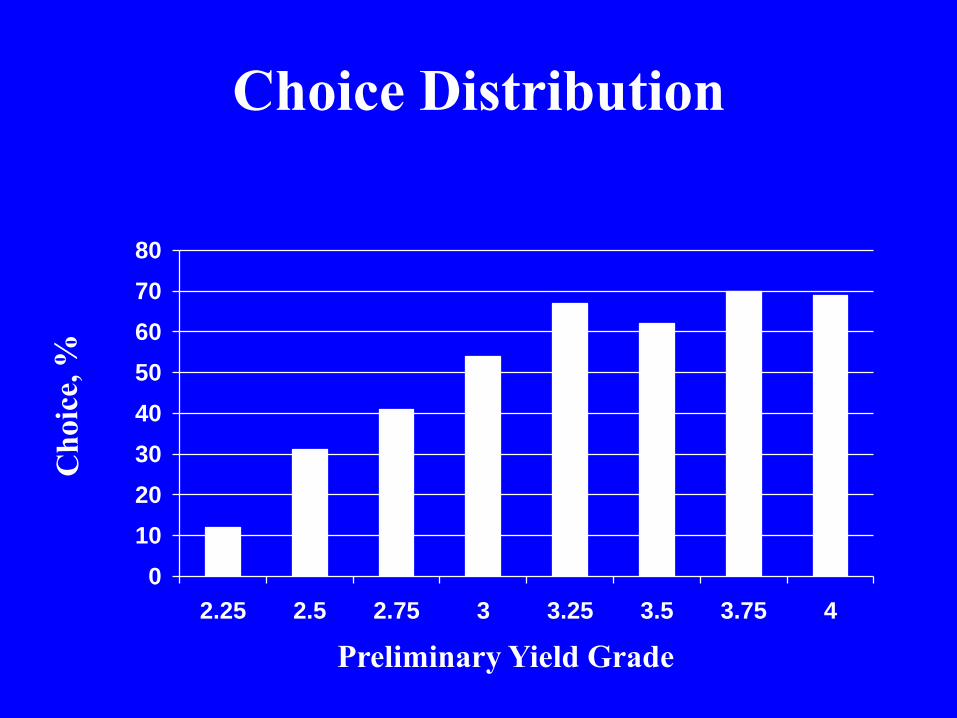
Choice Distribution
0
10
20
30
40
50
60
70
80
2.25 2.5 2.75 3 3.25 3.5 3.75 4
Preliminary Yield Grade

Choice Distribution
0
10
20
30
40
50
60
70
80
2.25 2.5 2.75 3 3.25 3.5 3.75 4
Preliminary Yield Grade

Postnatal growth curves
Mass
Time
Birth
Total
Maturity

Postnatal growth curves
Mass
Time
Birth
Total
Maturity
Health Diet Implant
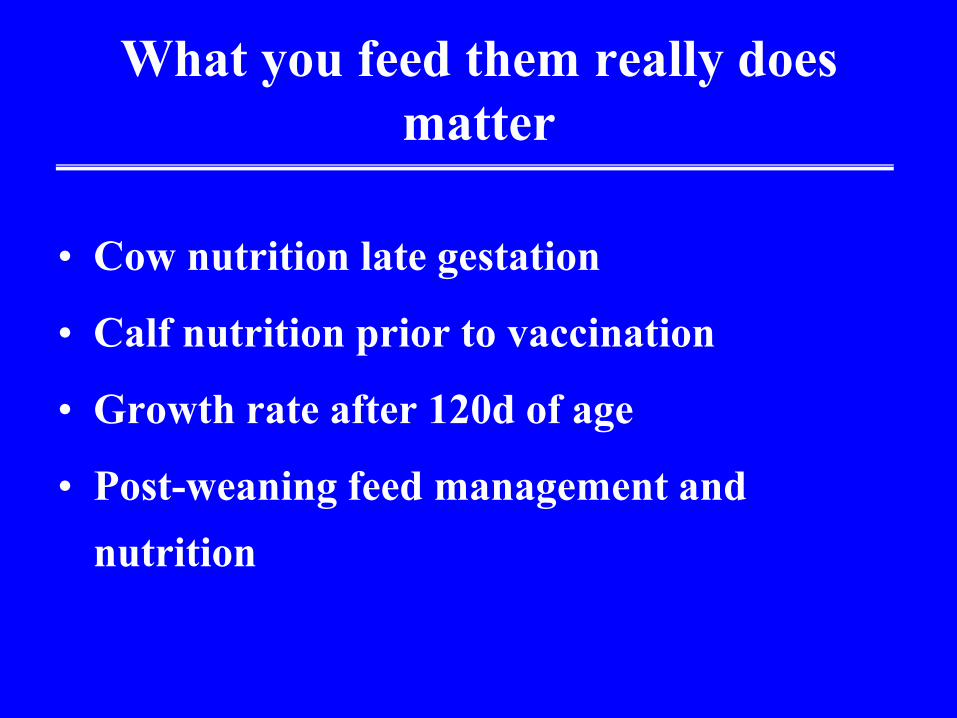
What you feed them really does matter
• Cow nutrition late gestation
• Calf nutrition prior to vaccination
• Growth rate after 120d of age
• Post-weaning feed management and nutrition

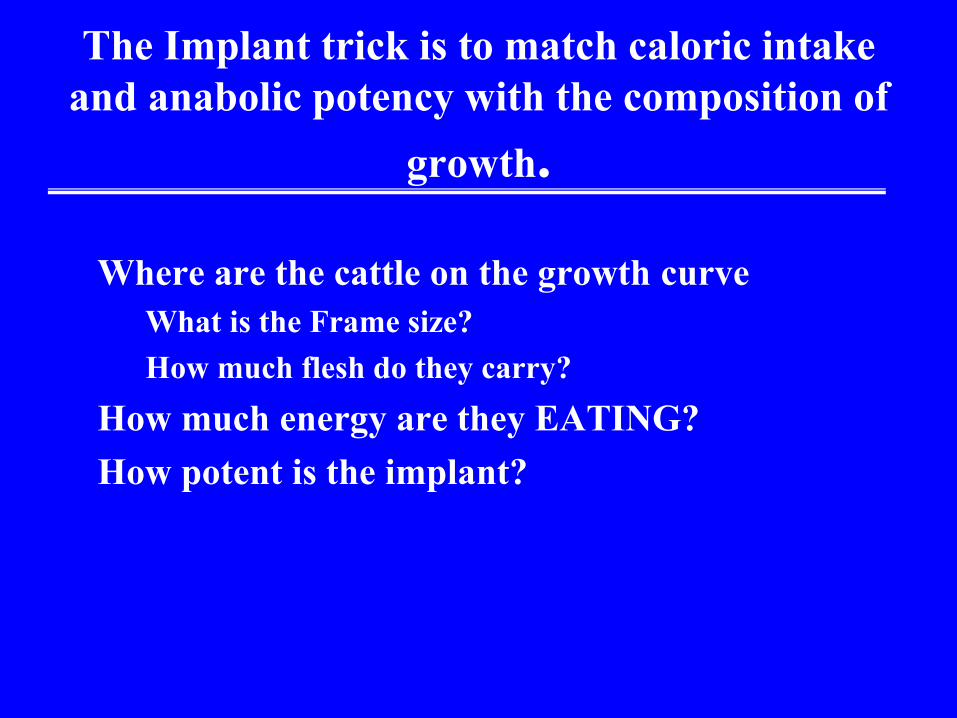
The Implant trick is to match caloric intake and anabolic potency with the composition of
growth.
Where are the cattle on the growth curve What is the Frame size? How much flesh do they carry?
How much energy are they EATING? How potent is the implant?
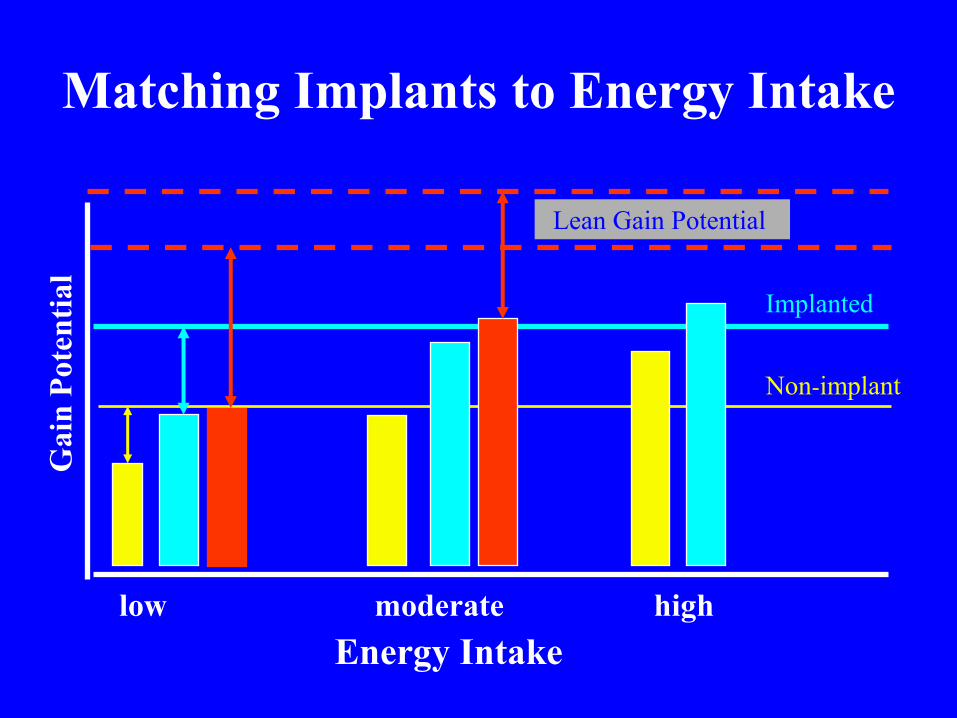
Matching Implants to Energy Intake
low moderate high
Implanted
Non-implant
Gai
n Po
tent
ial
Energy Intake
Lean Gain Potential
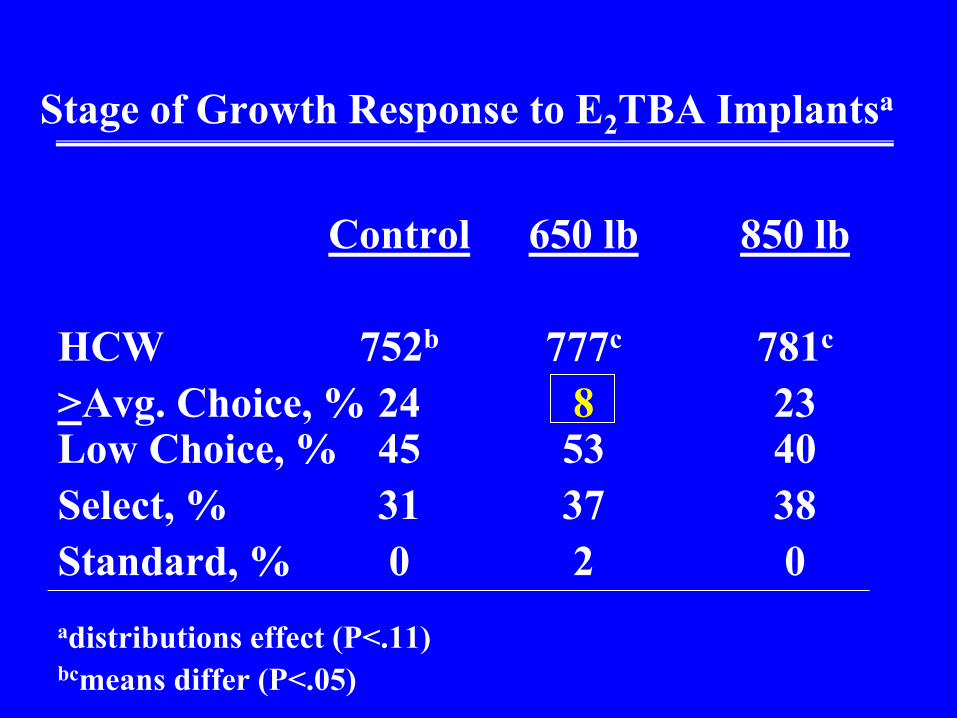
Stage of Growth Response to E2TBA Implantsa
Control 650 lb 850 lb HCW 752b 777c 781c >Avg. Choice, % 24 8 23 Low Choice, % 45 53 40 Select, % 31 37 38 Standard, % 0 2 0
adistributions effect (P<.11) bcmeans differ (P<.05)
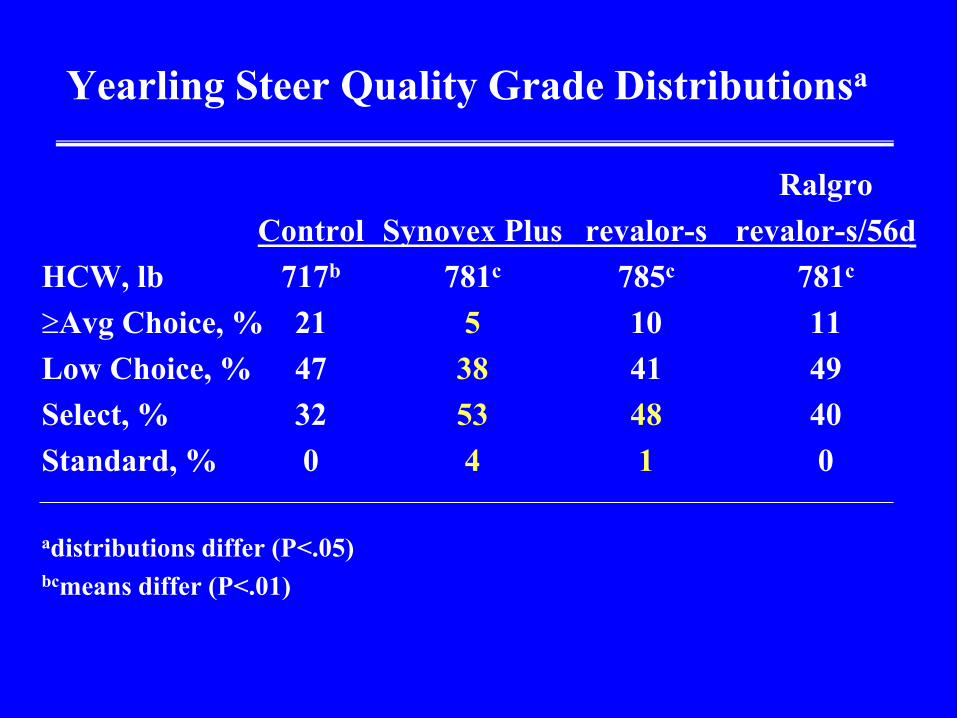
Yearling Steer Quality Grade Distributionsa
Ralgro Control Synovex Plus revalor-s revalor-s/56d HCW, lb 717b 781c 785c 781c Avg Choice, % 21 5 10 11 Low Choice, % 47 38 41 49 Select, % 32 53 48 40 Standard, % 0 4 1 0 adistributions differ (P<.05) bcmeans differ (P<.01)
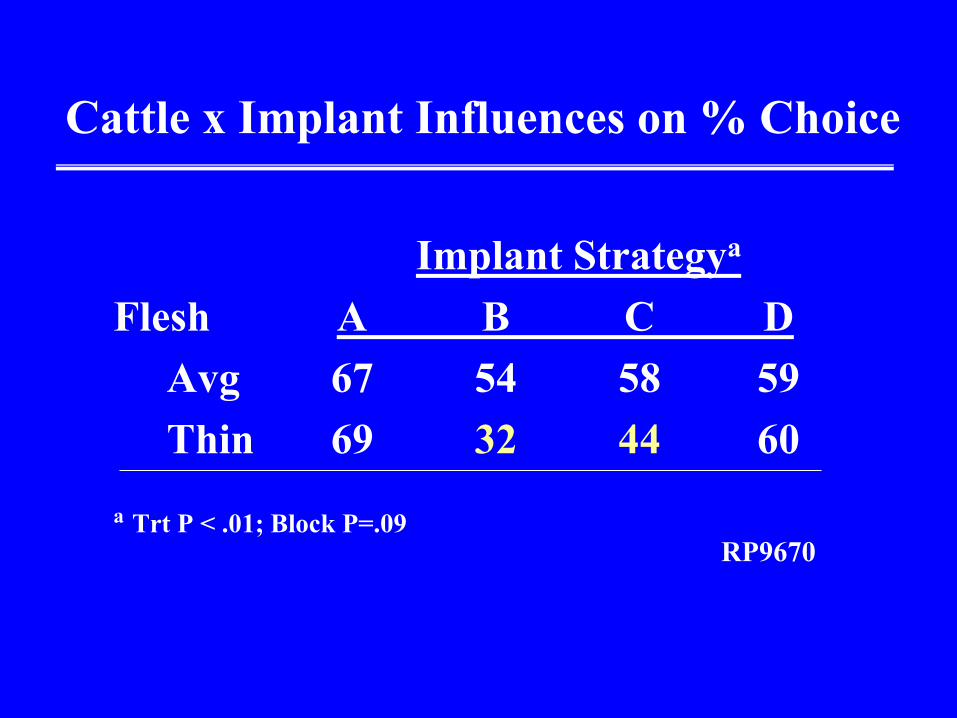
Cattle x Implant Influences on % Choice
Implant Strategya Flesh A B C D Avg 67 54 58 59 Thin 69 32 44 60
a Trt P < .01; Block P=.09 RP9670
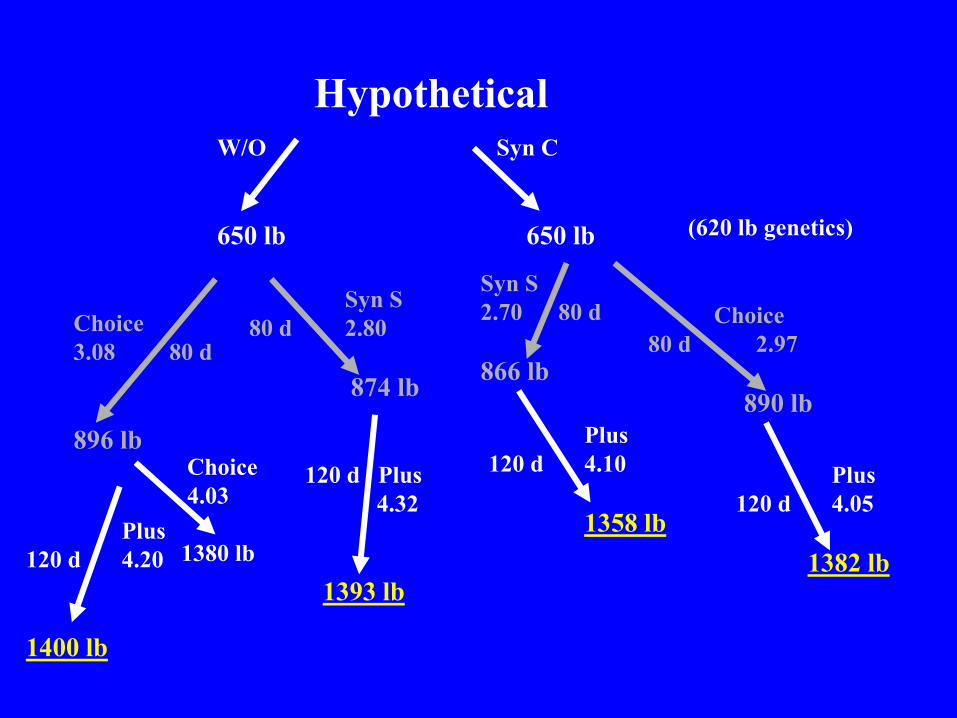
Hypothetical
(620 lb genetics)
Choice 3.08 80 d 896 lb
Syn S 80 d 2.80 874 lb
Syn S 2.70 80 d 866 lb
Choice 80 d 2.97 890 lb
Plus 120 d 4.20 1400 lb
Choice 4.03 1380 lb
120 d Plus 4.32 1393 lb
Plus 120 d 4.10 1358 lb
Plus 120 d 4.05 1382 lb
W/O 650 lb
Syn C 650 lb
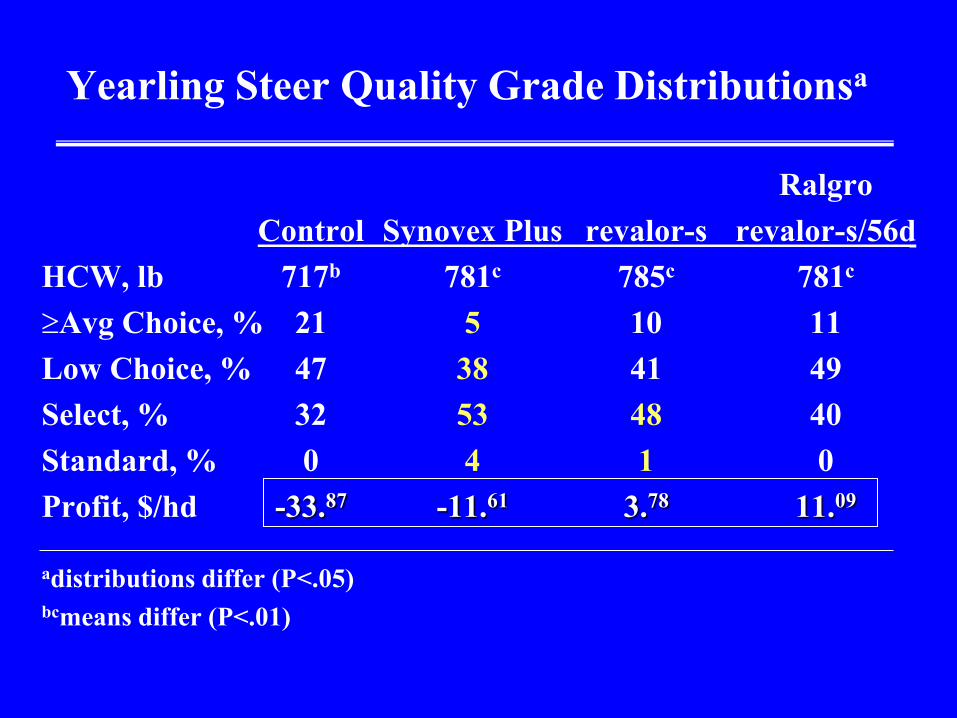
Yearling Steer Quality Grade Distributionsa
Ralgro Control Synovex Plus revalor-s revalor-s/56d HCW, lb 717b 781c 785c 781c Avg Choice, % 21 5 10 11 Low Choice, % 47 38 41 49 Select, % 32 53 48 40 Standard, % 0 4 1 0 Profit, $/hd -33.87 -11.61 3.78 11.09
adistributions differ (P<.05) bcmeans differ (P<.01)
Growth and its Relationship with Marbling