Embed Size (px)
Citation preview

Nutrition Shelf Tags’ Effectiveness: The Role of Nutrition Information Load and Label
Type
by
Asma Alfadhel, MBA
A Dissertation
In
Business Administration- Marketing
Submitted to the Graduate Faculty
of Texas Tech University in
Partial Fulfillment of
the Requirements for
the Degree of
DOCTOR OF PHILOSOPHY
Approved
Dr. Dale Duhan
Chair of Committee
Dr. Mayukh Dass
Co-Chair of Committee
Dr. Dennis Arnett
Dr. Roy Howell
Mark Sheridan
Dean of the Graduate School
August, 2018

Copyright 2018, Asma Alfadhel

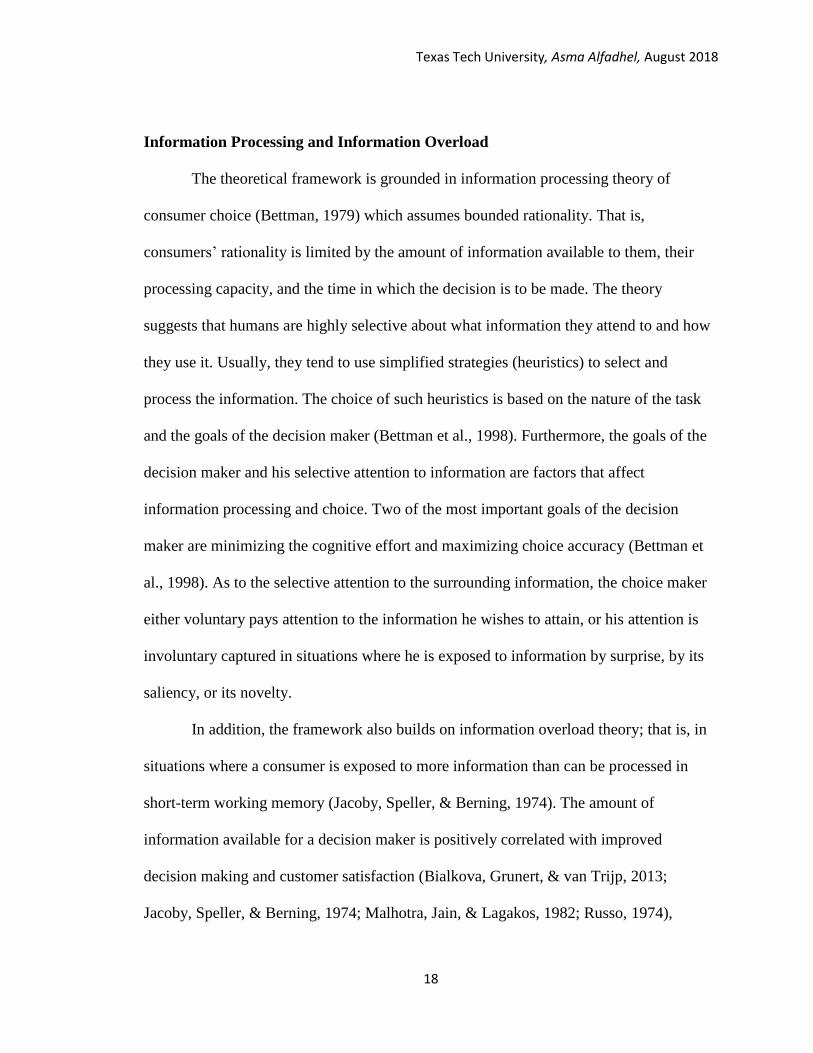
Texas Tech University, Asma Alfadhel, August 2018
ii
ACKNOWLEDGMENTS
I would like to extend my appreciation for the support I’ve received throughout
my Ph.D. program and dissertation. I am especially grateful to the program advisor (and
my committee co-chair) Dr. Mayukh Dass for his guidance, encouragement, and care.
Heartfelt thanks to my dissertation committee members for their support, input,
and feedback. Dr. Dale Duhan, my committee chair, deserves special recognition for his
facilitation and maintenance of the scanner data. Without it this dissertation would not
have been possible. I further extend my gratitude to the grocery chain’s staff for their
sincere and ready cooperation.
The experience I’ve earned and the support I’ve had during my five years in the
program is invaluable. To the faculty, colleagues, and friends in the Marketing
Department: to Dalal Ahmad, Dr. Shelby Hunt, Dr. Dennis Arnett, Terri Beard, Kiran
Pedada, and Masoud Muradi, thank you.
Above all else I am profoundly grateful to my amazing parents, my supportive
husband, my caring siblings, and my loving children: Nasser, Mohammad, and Mariam.
Their love, support, and patience uplifted me. This dream would have gone unrealized
without them.

Texas Tech University, Asma Alfadhel, August 2018
iii
TABLE OF CONTENTS
ACKNOWLEDGMENTS .................................................................................... ii
ABSTRACT .......................................................................................................... iv
LIST OF TABLES .................................................................................................v
I. INTRODUCTION ...........................................................................................1
II. LITERATURE REVIEW ...............................................................................6
Nutrition Information Labels .............................................................................6
Nutrition Shelf Tags .........................................................................................12
III. THEORETICAL FRAMEWORK AND HYPOTHESES ........................16
Information Processing and Information Overload .........................................18
Nutrition Shelf Tags and Product Sales ...........................................................19
Label Type .......................................................................................................22
Holistic vs. Nutrient-Specific Evaluative Labels .......................................22
Identified vs. Passive Evaluator .................................................................23
Special Diet ................................................................................................24
Nutrition Information Load ..............................................................................25
Number of Labels per Tag .........................................................................25
Tags Distribution Density ..........................................................................26
IV. RESEARCH METHOD ...............................................................................28
Data ..................................................................................................................28
Analysis............................................................................................................32
V. RESULTS ......................................................................................................45
Introduction of Nutrition Shelf Tags................................................................58
Nutrition Label Types ......................................................................................58
Number of Labels Per Tag ...............................................................................59
Tag Distribution Density..................................................................................60
VI. DISCUSSION ................................................................................................62
Theoretical Implications ..................................................................................63
Practical Implications.......................................................................................63
Limitations and Future Research .....................................................................64
REFERENCES .....................................................................................................66

Texas Tech University, Asma Alfadhel, August 2018
iv
ABSTRACT
Nutrition shelf tag systems, an innovation in shopper marketing, are implemented
(or are in the process of being implemented) in many retail grocery stores to help guide
shoppers toward healthier consumption. Research on the effectiveness of nutrition shelf
tags is scarce and produces mixed results. This dissertation investigates their
effectiveness reflected by the change in UPC sales after their introduction to the store and
comparing the impact of using different types of nutrition labels. In addition, the
moderating effect of information load on the effectiveness of nutrition shelf tags is
investigated both on the tag level (i.e. number of nutrition labels in the tag of an
individual UPC) and the category level (i.e. distribution density of tags within a UPC
category). Using scanner data from a large retail grocery chain shows that apposite to
what is hypothesized, there was a negative impact on the labeled UPC’s sales after the
introduction of nutrition shelf tags and no significant difference in the effect of different
types of labels. Furthermore, the number of labels per tag and tag distribution density did
not moderate the effects of introducing the nutrition shelf tags. Implications of these
counterintuitive results are shared, and the limitations of this dissertation are highlighted
along with directives for future research.

Texas Tech University, Asma Alfadhel, August 2018
v
LIST OF TABLES
Table 1: Types of Nutrition Labels ..................................................................................... 9
Table 2: Extant Research on the effect of Nutrition Shelf Tags on Sales......................... 14
Table 3: Dataset Summary ................................................................................................ 30
Table 4: Descriptions of measures of the variables of interest ......................................... 33
Table 5: Results Summary ................................................................................................ 46
Table 6: Summary of Hypotheses Test Results ................................................................ 61

Texas Tech University, Asma Alfadhel, August 2018
1
CHAPTER I
INTRODUCTION
The 1990 US Nutrition Labeling and Education Act (NLEA) requires all
packaged foods to have a nutrition label. This label has a standardized format and is
known as the nutrition fact panel (NFP), which is displayed on the back or on the side of
the package (hereafter “BOP”). The NFP provides information pertaining to serving size,
number of calories, and levels of specified nutrients. Furthermore, the US Food and Drug
Administration (FDA) has issued rules and standards to regulate the voluntary use of
front-of-package (hereafter “FOP”) nutrition claims (such as “low fat”) and health claims
(such as “Low amounts of saturated fat may reduce your cholesterol levels”). The goal of
these policies is to “assist consumers in maintaining healthy dietary practices” by
enabling them to “make informed choices about the food they purchase and consume”
(FDA, 2017).
Though NFP labeling is federally mandated in the United States, research shows
that such labeling has its limitations. First, non- or less health-conscious consumers
appear to be less likely to use them (Andrews, Burton, & Kees, 2011). Second, shoppers
are pressed for time in real-world purchasing situations, and thus the cost of processing
the NFP of products limits the use of such labels (Berning, Chouinard, Manning,
McCluskey, & Sprott, 2010; Levy & Fein, 1998; Russo, Staelin, Nolan, Russell, &
Metcalf, 1986). Third, a lack of adequate nutrition knowledge often prevents shoppers
from comprehending and using the provided nutritional figures (Andrews, Netemeyer, &
Burton, 2009; Barreiro-Hurlé, Gracia, & De-Magistris, 2010; Miller & Cassady 2015).
Finally, the NFP being located on the back or on the side of the package does not help in

Texas Tech University, Asma Alfadhel, August 2018
2
capturing shoppers’ attention while the product is on the retailer’s shelf (Federal Register,
2010). As a result, the use of simplified and more visible FOP nutrition and health claims
has begun to flourish in the United States, since manufacturers and retailers have realized
the potential advantages of such voluntary actions (Kleef & Dagevos, 2015; Newman,
Howlett, & Burton, 2014). Doing so has allowed them to demonstrate their socially
responsible efforts to combat the dramatic rise in obesity while highlighting their
products’ advantages.
As more FOP nutrition claims emerged in recent years, shelves soon became
loaded with products carrying different nutrition information structures. This tended to
overwhelm shoppers by causing distraction, difficulty in evaluation, and confusion in a
comparative shopping environment, thus triggering the need for standardized nutrition
information formats (Andrews, Lin, Levy, & Lo, 2014; Hawley et al., 2013; Hersey,
Wohlgenant, Arsenault, Kosa, & Muth, 2013). In 2007, for example, Kellogg’s
introduced its “Nutrition at a Glance,” a standardized FOP information label that includes
daily percentage values for six nutrients, on all its products. Other third-party (i.e., neither
the manufacture nor retailer) efforts toward a standardized labeling system have been
introduced, such as the 1995 American Heart Association’s heart-check symbol; the 2006
Guiding Stars1 (initially developed by Hannaford supermarkets) ranking of food as good,
better, and best; the 2008 NuVal’s nutritional value system, which scores food on a scale
of 1 to 100; the 2009 Smart Choices green checkmark (currently suspended); and, most
recently, the 2011 Facts Up Front nutrition key, introduced by the Grocery Manufacturers
Association. Retailer-specific FOP programs have also emerged, such as Walmart’s
1 Initially developed by Hannaford supermarkets with the help of a scientific advisory panel, the Guiding
Stars label is now used by several grocery stores, including Giant Food and Stop & Shop.

Texas Tech University, Asma Alfadhel, August 2018
3
“Great for you” seal of approval (2012) and the Wegmans wellness keys. Other retail
stores, such as Giant Food, Stop & Shop, SuperValu, and United Supermarkets, have
implemented their own nutrition shelf-tag system (hereafter “NST”) for a portion of their
products (Weingarten, 2013). In summary, these efforts are either manufacturer-based (in
which manufacturers use FOP labels on their product packages), retailer-based (where
retailers use FOP labels on their store brands’ packages or a unified shelf labeling system
across their stores), or a collaboration between both (where retailers request the presence
of certain FOP labels from their manufacturers).
NST labeling is an innovation in shopper marketing (Shankar, Inman, Mantrala,
Kelley, & Rizley, 2011) and have the following advantages over FOP labeling & NFP;
First, nutrition shelf tags are more prominent and simplified and thus have the advantage
of attracting shoppers’ attention and lowering their cognitive load, which in turn provides
a better chance of influencing their purchasing habits (Nikolova & Inman, 2015). Second,
it is a retail-based strategy, implemented storewide, under a uniformly integrated theme
that is expected to lower shoppers’ confusion, distraction, and difficulty in evaluating
alternatives. This may add value to the shopping experience and thus be useful in
eliciting store loyalty (Berning, Chouinard, Manning, et al., 2010). Finally, it is a retail
initiative that reflects an impartial evaluation independent of food manufacturers (Fischer
et al., 2011).
Though many retailers, have implemented (or are in the process of implementing)
some type of nutrition labeling system across their stores (Newman et al., 2014), only
few studies have investigated the effectiveness of NSTs in real-world settings (Berning,
Chouinard, & McCluskey, 2010; Cawley et al., 2015; Freedman & Connors, 2011; Hobin

Texas Tech University, Asma Alfadhel, August 2018
4
et al., 2017; Levy, Mathews, Stephenson, Tenney, & Schucker, 1985; Nikolova & Inman,
2015; Schucker et al., 1992; Sutherland, Kaley & Fischer, 2010; Teisl & Levy, 1997).
These studies have yielded mixed findings (discussed further in the next section) and
have only investigated one type of NST at a time. Furthermore, the effect of the amount
of nutrition information displayed on the NSTs’ effectiveness was not investigated.
Despite the apparent focus on this topic over the last two decades, real-world evidence is
still scarce regarding the effectiveness of these labels in promoting healthier food-
purchasing habits (Elshiewy & Boztug, 2017; Nikolova & Inman, 2015). Hence, public
policy-makers, practitioners, and scholars have all called for further research on the
subject (Andrews et al., 2014; Hawley et al., 2013; Hersey et al., 2013; Nikolova &
Inman, 2015; Roberto et al., 2012).
Using scanner data obtained from a large US-based grocery chain, this study
builds on and extends prior research on the effectiveness of nutrition shelf tags systems
by comparing the effects of different label types and investigating the moderating role of
information load: that is, the number of labels per shelf tag and the tags distribution
density within a product category. Specifically, this research attempts to address the
following questions:
1. How does the introduction of NSTs affect UPC sales?
2. Do different label types have different effects?
3. Would the displayed amount of nutrition information moderate these effects?
• 3a. Would the number of labels per shelf tag moderate these effects?
• 3b. Would the tag distribution density within a category moderate these
effects?

Texas Tech University, Asma Alfadhel, August 2018
5
This research will offer the following key contributions: (1) to our knowledge,
this study is the first to investigate the impact of different nutrition shelf label types and
nutrition information load on sales; (2) the study will provide valuable insight for theory
and practice. To our knowledge, only two articles on the impact of nutrition shelf tags on
sales and shopper behavior have been published in marketing journals (Nikolova &
Inman, 2015; Levy et al., 1985). Thus, the current research will add to different streams
of the marketing literature, such as shopper marketing strategy, retail management, and
information processing and information overload. In addition, these insights may inform
retail managers’ and public policy-makers’ decisions.
The remainder of this paper is organized as follows. The paper starts with a
related literature review on nutrition information labeling and delineate the different
types of nutrition labels. The paper then introduces the theoretical framework and
presents several hypotheses. Finally, the paper presents the study’s research
methodology.

Texas Tech University, Asma Alfadhel, August 2018
6
CHAPTER II
LITERATURE REVIEW
Nutrition Information Labels
Research on the impact of nutrition information labeling varies across three main
dimensions: (1) investigated variables, (2) methodologies, and (3) type of labels. First,
numerous studies have investigated the impact of nutrition information labeling on
product sales (Balasubramanian & Cole, 2002; Levy et al., 1985) and on consumer
behavior, such as attention (Bialkova & van Trijp, 2011; Bialkova, Grunert, & van Trijp,
2013; Bix et al., 2015; Lang, Mercer, Tran, & Mosca, 2000), information search
(Balasubramanian & Cole, 2002; Roe, Levy, & Derby, 1999; Russo et al., 1986),
information processing, comprehension (Roe et al., 1999; Russo et al., 1986), and use
(Hunt et al., 1990; Lang et al., 2000; Szykman, Bloom, & Levy, 1997), attitude toward
retailers (Newman et al., 2014) purchase intention (Hunt et al., 1990) and actual
purchase (Nikolova & Inman, 2015); and food consumption (Elshiewy & Boztug, 2017;
Steenhuis et al., 2010). A few moderating factors have also been addressed, such as
nutrition knowledge (Miller & Cassady, 2015), health-consciousness (Andrews et al.,
2011), motivation to search for nutrition information (Balasubramanian & Cole, 2002),
and demographics (Schucker, Levy, Tenney, & Mathews, 1992; Moorman, 1996).
Second, different research methods have been employed to assess the impact of
nutrition labeling, such as surveys and interviews (Lang et al., 2000; Szykman et al.,
1997), controlled experiments (Andrews et al., 2011; Newman, Howlett, & Burton,
2015), simulated shopping labs (Newman et al., 2014), field experiments (Berning,
Chouinard, Manning, et al., 2010; Freedman & Connors, 2011; Muller, 1985), and eye-

Texas Tech University, Asma Alfadhel, August 2018
7
tracking (Bialkova, Grunert, & van Trijp, 2013; Graham & Jeffery, 2011; Visschers,
Hess, & Siegrist, 2010).
Third, the impact of nutrition labeling has been investigated for different label
types (summarized in Table 1). Labels differ in the way the nutrition information is
framed and communicated/displayed. The nutrition label can include:
(1) mandated detailed information on the back or side of the product package, such as
NFP (Burton, Garretson, & Velliquette, 1999; Keller et al., 1997; Viswanathan &
Hastak, 2002);
(2) voluntary yet regulated FOP labels that are either framed as (2a) reductive nutrient-
specific information (i.e., a reduced amount of information extracted from the NFP
and placed on the front of the package); or (2b) a directive summary in the form of
an overall evaluation of a product’s healthfulness (Andrews et al., 2014; Newman et
al., 2014; Talati et al., 2016), a health claim (i.e., by linking nutrients to a positive
health outcome or a disease) or nutrient-specific claim—that is, by describing the
presence, absence, or level of nutrients within a product (Talati et al., 2016); and
(3) voluntary, yet regulated, shelf tag labels—simplified, more salient information
along with the price on the shelf right below the products—that are framed as a
directive summary in the form of (3a) a nutrient-specific evaluation, such as
describing the presence, absence, or level of nutrients within a product (Levy et al.,
1985); (3b) an overall evaluation of a product’s healthfulness that is on a single
level, as in a simplified evaluation consisting of one category such as “Fuel Your
Live” (Freedman & Connors, 2011), or on a multiple level, such as scaled
evaluations (Nikolova & Inman, 2015; Sutherland et al., 2010).

Texas Tech University, Asma Alfadhel, August 2018
8
Although researchers who have employed different methods and examined
different label types have offered several valuable insights into specific variables that
may influence decision-making (e.g., attention, comprehension, or purchase intention),
research conducted in real-world settings has been limited and has found mixed results
regarding the effect of these labels on consumer behavior (see reviewed studies in Hersey
et al. [2013]).

Texas Tech University, Asma Alfadhel, August 2018
9
Table 1: Types of Nutrition Labels
Communication Framing Illustration
Back or side of
package label
Standardized format of nutrient amounts, calories per
serving size and guided daily amounts.
(e.g. NFP, NIP)
Front of
Package Labels
Reductive (e.g. %GDA, Facts up front, Multiple Traffic
Light system in UK)
Directive
- Nutrient-Specific Evaluation
Reduction of undesired attribute
Presence of desirable attribute
Special diet

Texas Tech University, Asma Alfadhel, August 2018
10
Table 1 Continued: Types of Nutrition Labels
Communication Framing Illustration
- Holistic Single-Level Evaluation
Passive Evaluator
Identified Evaluator
- Health Claims
Shelf Tags
Labels
Directive
- Nutrient-Specific Evaluation
Reduction of undesired attribute
Presence of desirable attribute
Special diet

Texas Tech University, Asma Alfadhel, August 2018
11
Table 1 Continued: Types of Nutrition Labels
Communication Framing Illustration
- Holistic Single-Level Evaluation
Passive Evaluator
Identified Evaluator
- Holistic Scaled Evaluation
Scale size

Texas Tech University, Asma Alfadhel, August 2018
12
Nutrition Shelf Tags
Research investigating the effectiveness of nutrition shelf tags in real-world
settings (Table 2) yields mixed findings. Those that have shown evidence in support of
nutrition shelf tags’ effectiveness have reported a positive impact on the purchase of
healthier products (Nikolova & Inman, 2015; Sutherland et al., 2010) and a negative
impact on the purchase of less-healthy or unhealthy products (Cawley et al., 2015;
Sutherland et al., 2010). Other studies have reported partial influence in only some but
not all product categories (Hobin et al., 2017; Levy et al., 1985; Schucker et al., 1992;
Teisl & Levy, 1997). In one of these studies (Teisl & Levy, 1997), the authors speculated
that this partial effect was due to the magnitude of differences in taste within the
category. Interestingly, one study (Berning, Chouinard, & McCluskey, 2010) reported a
negative impact of nutrition shelf tags on the purchase of healthier products and a
positive impact on the purchase of unhealthy products, although that study only
investigated the impact on one product category (popcorn). The researchers suggested
that introducing nutrition shelf tags for healthier products might also signal less preferred
tastes (Berning, Chouinard, & McCluskey, 2010). In addition, Freedman and Connors
(2011) reported no effect of the introduction of nutrition shelf tags on food purchasing;
the authors also reported no significant increase in purchases among the four categories
they investigated, and they attributed their results to the short duration of the experiment
(five weeks post-intervention compared to six weeks pre-intervention).
These mixed results have encouraged the investigation of new factors that might
explain where and how these nutrition shelf tags are effective, especially since previous
research has varied in the investigated categories and label types. Recently, Nikolova and

Texas Tech University, Asma Alfadhel, August 2018
13
Inman (2015) showed that the effect of introducing nutrition shelf tags on consumer
purchases is moderated by category healthiness and the variability of nutrition scores
within a category, such that the effect is stronger in categories that are healthier and have
higher variance in their nutrition scores. This reported evidence suggests that category-
related factors should be investigated.
In addition, due to data-availability challenges, past research has employed only
one type of labeling at a time, including: (1) nutrient-specific summaries (Berning,
Chouinard, & McCluskey, 2010; Levy et al., 1985; Schucker et al., 1992; Teisl & Levy,
1997); (2) single-level evaluative summaries, such as “Fuel Your Life” (Freedman &
Connors, 2011); or (3) multi-level evaluative summaries, such as the Guiding Stars (1–3)
system (Cawley et al., 2015; Hobin et al., 2017; Sutherland et al., 2010) and the NuVal
(1–100) system (Nikolova & Inman, 2015). A comparison of the impact of different label
types may therefore offer valuable insight.
Although the role of package design information clutter on the effectiveness of
FOP labels was investigated (Bialkova, Grunert, & van Trijp, 2013), the role of
information load factors—such as the number of labels per tag and the ratio of tagged
items within a product category—was not investigated on NSTs’ effectiveness. Except
for one study (Schucker et al., 1992) which addressed the number of featured nutrients in
the nutrition shelf tags.

Texas Tech University, Asma Alfadhel, August 2018
14
Table 2: Extant Research on the effect of Nutrition Shelf Tags on Sales
Label Type/ Research Effect Results Design
Holistic Scaled Evaluation
Guiding Stars (0,1,2,3)
Sutherland, Lisa A., Lori A.
Kaley, & Leslie Fischer
(2010) The American journal
of clinical nutrition
Significant
Positive Effect
Increase sales of starred
products
Decreased sales of non-
starred products
New England States & NY
Quasi experiment Sales
2006-2008 (168) stores.
6 months Pre/Post
Implementation
Cawley, et al., (2015) Public
health nutrition
Partial Effects No significant change in
starred items
Sig. decrease in non-
starred items
New England States & NY
Quasi experiment Sales
2006-2008 (168) stores.
6 months Pre/Post
Implementation
101 categories
Unit sold per category
Hobin, et al., (2017) The
Milbank Quarterly
Partial Effects Sales of each level of
starred UPC varied in
direction and magnitude
across food product
categories
Canada 2012
6 months Pre/Post
Implementation
44 treatment stores & 82
control stores
11 Food categories
NuVal (1-100)
Nikolova & Inman (2015)
Journal of Marketing
Research
Positive
Effects
Effects are moderated
by category healthiness
and category (nutrition
score) variance
USA (2008)
Northeast grocery chain
(122) stores, 535,000 Loyalty
card members & 8
Categories
Holistic Single-Level
Evaluation
Freedman & Connors (2010)
J. of the American Dietetic
Association
Insignificant
Effect
--- California “Fuel your life”
On-campus convenience
store (multiethnic college)
4 category sales
6 weeks pre/ 5 weeks post

Texas Tech University, Asma Alfadhel, August 2018
15
Table 2 Continued: Extant Research on the effect of Nutrition Shelf Tags on Sales.
Label Type/ Research Effect Results Design
Nutrient-Specific
Evaluation
Levy et al., (1985) Journal of
Public Policy & Marketing
Partial Effects Positive impact in only 8
categories
Washington DC (20
treatment stores) &
Baltimore (20 control stores)
Sales of shelf-marked
products two years after
intervention
16 Categories
Schucker, et al., (1992)
Journal of Nutrition
Education
Partial Effects Positive increase in only
8 categories. The largest
market- share increases
occurred for products
with the most flagged
nutrients.
Products with fewer
flagged nutrients lost
market- share
Baltimore stores: Sales of
shelf-marked products two
years after intervention vs.
Washington D.C. stores
18 categories.
Weekly market share: the
total sales in ounces of shelf-
tagged brands, divided by the
total sales in ounces of all
tagged and untagged brands
in the same category
Teisl & Levy (1997) Journal
of Food Distribution
Research
Partial Effects Positive impact on some
categories
(1986-1989) New England
States
13 treatment stores & 12
control
Using an arrow facing
downwards next to the
nutrient
Either (fat, sodium or
Cholesterol) per category
6 Categories
Berning, Chouinard, &
McCluskey (2010) American
Journal of Agricultural
Economics
Negative
Effects
Labels decrease sales of
healthy popcorn and
increase sales of
unhealthy popcorn
across all stores
California (2007)
5 treatment stores & 5
control stores
Field Experiment
Microwave popcorn

Texas Tech University, Asma Alfadhel, August 2018
16
CHAPTER III
THEORETICAL FRAMEWORK AND HYPOTHESES
This section presents the theoretical framework for the effect of introducing
different nutrition shelf tags on UPC sales and the moderating role of nutrition
information load (Figure 1). It starts by introducing the underlying theories; that is
information processing and information overload. This is followed by the development of
the hypotheses.
Although the effectiveness of nutrition shelf tags could mean several things, in
this research, effectiveness will be viewed as the tendency of these tags to influence
shopper choice, which translates into increased sales of tagged products and a consequent
decrease in the sales of non-tagged products.

Texas Tech University, Asma Alfadhel, August 2018
17
Figure 1: Theoretical Framework for the effect of Introducing Nutrition Shelf Tags on UPC Sales
Nutrition Information Load
Number of
Labels per Tag
Tag Distribution
Density
∆ Sales
Nutrition Shelf Tags
Tagged UPCs
Non-Tagged UPCs
Tag Type
Holistic Evaluation
Vs.
Nutrient-Specific
Identified Evaluator
Vs.
Passive Evaluator
Special Diet
H1
H2
H3
H4
H5
H7a
H7b
H7c
H7d
H6a
H6b
H6c
Control:
Monthly Average
Price
Monthly Average
Lag Price
Texas Tech University, Asma Alfadhel, August 2018
18
Information Processing and Information Overload
The theoretical framework is grounded in information processing theory of
consumer choice (Bettman, 1979) which assumes bounded rationality. That is,
consumers’ rationality is limited by the amount of information available to them, their
processing capacity, and the time in which the decision is to be made. The theory
suggests that humans are highly selective about what information they attend to and how
they use it. Usually, they tend to use simplified strategies (heuristics) to select and
process the information. The choice of such heuristics is based on the nature of the task
and the goals of the decision maker (Bettman et al., 1998). Furthermore, the goals of the
decision maker and his selective attention to information are factors that affect
information processing and choice. Two of the most important goals of the decision
maker are minimizing the cognitive effort and maximizing choice accuracy (Bettman et
al., 1998). As to the selective attention to the surrounding information, the choice maker
either voluntary pays attention to the information he wishes to attain, or his attention is
involuntary captured in situations where he is exposed to information by surprise, by its
saliency, or its novelty.
In addition, the framework also builds on information overload theory; that is, in
situations where a consumer is exposed to more information than can be processed in
short-term working memory (Jacoby, Speller, & Berning, 1974). The amount of
information available for a decision maker is positively correlated with improved
decision making and customer satisfaction (Bialkova, Grunert, & van Trijp, 2013;
Jacoby, Speller, & Berning, 1974; Malhotra, Jain, & Lagakos, 1982; Russo, 1974),

Texas Tech University, Asma Alfadhel, August 2018
19
however, this is true only to a certain point, after which, more information causes
information overload that leads to poorer decision making (Jacoby, Speller, & Berning,
1974; Jacoby 1984).
Nutrition Shelf Tags and Product Sales
The effectiveness of nutrition labeling programs depends on their ability to (1)
lower the cost of a shopper’s information search by providing easy access to information
and to (2) lower the costs of information processing—such as computation,
comprehension (Russo et al., 1986), and comparison—among different alternatives.
Nutrition shelf tags have the highest potential to achieve these requirements when
compared to traditional FOP and BOP nutrition labeling, because nutrition shelf tags are
more simplified and salient and are standardized under one theme across the entire store.
The summarized and concise nature of the information presented on the labels in any of
the formats (e.g., nutrient-specific summaries and evaluative summaries) makes it easier
for shoppers to understand them, thus lowering their comprehension and computation
costs.
Being standardized and located on the shelf in a consistent location next to the
price has at least two benefits. First, this lowers the cost of searching for and allocating
information and reduces distractions caused by the information clutter from both the
variety of FOP nutrition information formats among shelved products and from the
different types of product information provided within each individual package (Nathan,
Yaktine, Lichtenstein, & Wartella, 2012a). The second benefit is that such
standardization makes it easier to make comparisons between products, which can then
serve as a reference point. These labels also have the advantage that shoppers perceive

Texas Tech University, Asma Alfadhel, August 2018
20
them as providing trustworthy and unbiased information that comes from a product-
independent source—namely, the retailer rather than the manufacturer. These outlined
features of nutrition shelf tags are in line with the recommendations of the US National
Academies of Sciences, Engineering, and Medicine for nutrition labeling (Institute of
Medicine et al., 2012; Hobin et al., 2017; Hawley et al., 2013).
Recent reports have shown that many shoppers are becoming more motivated to
incorporate health and wellness drivers into their purchase decisions in addition to the
traditional drivers, such as taste, price, and convenience (Borra, 2017; FMI 2014). For
these shoppers, as previous research suggests (Balasubramanian & Cole, 2002), nutrition
labels will enhance people’s shopping experiences and will help direct them to healthier
choices. These motivated shoppers vary in their nutrition knowledge level. Those who are
very knowledgeable tend to use the NFP, and thus nutrition shelf tags would serve to
point them toward healthier options, while those who are less knowledgeable would
benefit from these labels in their heuristic-based decision-making; that is, they could see
that if it is labeled, then it is a healthier option (Turner, Skubisz, Pandya, Silverman, &
Austin, 2014). Furthermore, shoppers usually make unplanned purchases largely due to
in-store influencing stimuli (Heilman, Nakamoto, & Rao, 2002; Park, Iyer, & Smith,
1989; Newman et al., 2014). Thus, even those shoppers who are not planning to purchase
healthier products (i.e., less motivated shoppers) may be influenced by nutrition shelf
tags. The prominence/distribution of such tags across the store provides constant
exposure, which may unconsciously prime shoppers toward the purchase of healthier
products.

Texas Tech University, Asma Alfadhel, August 2018
21
This situation could be explained by one of two underlying processes (Fitzsimons,
Chartrand, & Fitzsimons, 2008). First, doing so activates cognitive accounts, such that
the mental representation of the nutrient information on the labels is linked to a
“healthiness” construct; when shoppers are primed with the labels, they thus tend to
behave as health-conscious consumers and will likely purchase that product. With time
this activation may unconsciously serve as an educational process that nudges people
toward healthier purchasing habits rather than simply being a pointer that highlights
desirable products. Second, doing so activates goal-driven accounts, such that the mental
representation of the goal of being “healthy” is activated by the labels through situational
cues, and the labels operate automatically to drive the purchasing behavior of the labeled
products—for example, for those who have the intention of being healthier but have yet
to act on that intention.
In summary, the present study proposes that nutrition shelf tags will help guide as
well as nudge consumers toward making healthier decisions, which will likely be
translated into a sales increase of shelf-tagged products and a sales decrease of untagged
products. On the basis of this discussion, the following hypotheses have been posited:
H1: The introduction of NST will have a positive effect on the sales of tagged UPCs.
H2: The introduction of NST will have a negative effect on the sales of non-tagged
UPCs.

Texas Tech University, Asma Alfadhel, August 2018
22
Label Type
Holistic vs. Nutrient-Specific Evaluative Labels
Nutrition shelf tags have been introduced in three forms: nutrition-specific
evaluations, holistic single-level evaluations, and holistic scaled evaluations. The last two
offer an overall evaluation of a product’s healthfulness, based on several nutrients. A
review study on point-of-sale nutrition rating systems and symbols concluded that “in the
limited set of real world studies reviewed, no single system emerged as the absolute
‘best’” (Nathan, Yaktine, Lichtenstein, & Wartella, 2012b).
Previous research suggests that objective nutrition information labels such as NFP
and FOP reductive labels (such as Facts Up Front) are more effective in non-comparative
contexts and are less effective in comparative contexts, while the opposite is true for
evaluative labels, both holistic and nutrition-specific (Newman et al.,2015). Newman et
al. (2015) argue that when consumers need to compare products in a choice set, it is
cognitively easier to make the comparison along a single similar dimension. Based on the
same rationale, holistic evaluative labels offer a more uniform cue of information across
the set of alternatives (such as Smart Choice) than nutrient-specific evaluative labels
(e.g., low sodium or low fat). Holistic evaluative labels determine the healthiness of a
product by evaluating multiple nutrition contents (e.g., sodium, fat, and fiber) together,
while nutrient-specific labels evaluate single nutrient contents. Thus, although nutrient-
specific labels may be helpful in comparing products within a specific nutrient category
(such as saturated fat), they will not help in comparing these products based on other
relative nutrients. Evaluative summary labels, in contrast, offer a better solution to
shoppers so that they may select those products ranked highest in overall nutritiousness

Texas Tech University, Asma Alfadhel, August 2018
23
within that product category. They offer a more comprehensive and higher-level cue
compared to the other type, which can greatly simplify shoppers’ evaluative and choice
processes (Bettman, Luce, & Payne, 1998).
In summary, evaluative summary labels are more effective in lowering
information processing costs than nutrition-specific summary labels and thus are
expected to be more effective than nutrient-specific labels. The present study thus posits:
H3: The introduction of NST will have a stronger positive effect on the sales of UPCs
tagged using holistic evaluation label(s) than that of UPCs tagged using nutrient-
specific evaluation label(s).
Identified vs. Passive Evaluator
Holistic single-level evaluative labels may reveal the identity of the evaluator
(such as the American Heart Association) or may not (such as Smart Choice). According
to uncertainty reduction theory, individuals tend to reduce uncertainty by finding credible
information to help them in their decision making (Jacoby, Jaccard, Currim, Kuss,
Ansari, & Troutman, 1994). Research has shown that the argument strength of a message
and the credibility of its source are important factors that have a major impact on
persuasion (Chaiken, 1980). When these labels identify an area expert source (i.e., a
dietitian), they are likely to be more persuasive than those labels that do not identify a
source. Furthermore, when identifying a credible evaluator from an expert group such as
dietitians, shoppers may infer that people affiliated with this group are using these
products; from a social-influence perspective (i.e., high social consensus), this may affect

Texas Tech University, Asma Alfadhel, August 2018
24
their purchasing behavior (Sciandra, Lamberton, & Reczek, 2017). This study therefore
posits:
H4: The introduction of NST will have a stronger positive effect on the sales of UPCs
tagged using an identified evaluator label than that of UPCs tagged using a passive
evaluator label.
Special Diet
Nutrient-specific tags evaluate the presence or abundance of a single nutrient. The
absence of some nutrients may constitute special dietary requirements for some segments
of consumers, such as those who are gluten intolerant. Unlike people who need to reduce
their intake of certain nutrients, such as saturated fat or sugar, people with specific food
allergies do not have the luxury of choosing products containing such allergens, such as
gluten and dairy. In addition, in some cases because of religious or personal beliefs, some
segments of consumers refrain from certain types of ingredients, as is the case with
vegans and vegetarians. Since both segments of consumers are aware of their special
needs and are usually regular customers of specific special diet products, this study posits
that the introduction of shelf tags with only a specific “special diet” label will likely not
be as effective as the other types of labels. The study posits:
H5: The introduction of NST will have no significant effect on the sales of UPCs
tagged using only special diet label.

Texas Tech University, Asma Alfadhel, August 2018
25
Nutrition Information Load
Number of Labels per Tag
Research on human information processing has investigated the impact of the
information load on decision making in several disciplines (see Eppler & Mengis, 2004).
Relatively little research has explored the impact within nutrition information and the
brand choice context (e.g., Bialkova et al., 2013; Jacoby, Speller, & Berning, 1974;
Malhotra, Jain, & Lagakos, 1982; Russo, 1974). Their findings (in controlled
experiments) suggest that the number of attributes for a given alternative (i.e., nutrition
information) is positively correlated with improved decision making and customer
satisfaction. However, this is true only to a certain point, after which, more information
causes information overload that leads to poorer decision making (Jacoby, Speller, &
Berning, 1974; Jacoby 1984). Malhotra (1982) found that “The probability of correct
choice decreases significantly as the number of attributes on which the information is
provided increases from 5 to 15, 20, or 25” (p. 423). Regarding nutrition information on
shelf tags, this is not an issue because they are designed to carry simple and concise
information in addition to the price information (usually not exceeding four attributes).
Therefore, it is very unlikely that the amount of nutrition information on shelf tags would
lead to information overload. When investigated in real-world settings, shopper purchases
tended to be influenced by the number of featured nutrients on the shelf tag (Schucker et
al., 1992). Accordingly, we suggest that the shelf tags with more nutrition information
will be more beneficial for aiding shoppers with their decision making, especially
because more positive attributes signal better product quality (i.e., healthier foods).
Therefore, we posit the following:

Texas Tech University, Asma Alfadhel, August 2018
26
H6a (H6b & H6c): The effects predicted in H1 (H3 & H4) will be stronger for UPCs
with tags having more nutrition labels.
Tags Distribution Density
In addition to the amount of nutrition information offered on a single shelf tag,
shoppers are provided with several alternatives of tagged products within a category from
which to choose. The increased number of alternatives may impose an obstacle on the
effectiveness of the nutrition shelf tags on two dimensions: attention and processing.
Shelf tags have the advantage of being in a consistent location, that is, on the shelf
directly below the product. According to visual search studies, humans tend to rely on
familiar “scan paths” that are stored in their memories from previous search situations,
and thus shoppers know directly where to look when searching for price information, for
example (Nathan et al., 2012a). Therefore, the shelf tag represents a practical place to
look for simplified nutrition information. However, when there are many tagged products
within a category, this could lead to visual crowding and complexity. Research suggests
that increasing the number of elements in a visual scene reduces attention (Bialkova et
al., 2013), thus a larger number of shelf tags present in the visual scene or scan path may
cause lack of attention or distraction. This could also cause information overload
resulting from imposing a larger consideration set (tagged products) (Jacoby, Speller, &
Berning, 1974; Malhotra, 1982; Orth and Crouch, 2014; Orth and Wirtz, 2014).
Malhotra (1982) reported that respondents experienced information overload
when they faced 10, 15, 20, or 25 choice alternatives. In such situations (i.e., large
consideration sets), “there may be a tendency to give up trying to compare the
Texas Tech University, Asma Alfadhel, August 2018
27
alternatives” and “instead, the choice may be made impulsively” (Hendrick, Mills, &
Kiesler, 1968, p. 313–314). Thus, we argue that an increase in the number of nutrition
shelf tags within a category may lower their effectiveness. Therefore, we posit the
following:
H7a (H7b, H7c, & H7d): The effect predicted in H1 (H2, H3, H4) will be weaker in
categories experiencing high tag distribution density.

Texas Tech University, Asma Alfadhel, August 2018
28
CHAPTER IV
RESEARCH METHOD
Data
In June 2013, a large U.S.-based grocery chain implemented a nutrition shelf tags
system (figure 2). The system features 12 labels: one holistic evaluative label with an
identified evaluator (Dietitian’s Top Pick), one holistic evaluative label with an
unidentified evaluator (Heart Healthy), and eight nutrient-specific evaluative labels
(Organic, Low Sodium, Whole Grain, 100% Juice, Sugar Free, Fiber, Low Sat. Fat, and
Gluten Free). The “Gluten Free” label constitutes a special diet. The nutrition labels were
prominently displayed to shoppers on the shelf tag with the price. An individual shelf tag
can combine up to four labels at once.
The data was obtained in the form of separate files: sale transactions, products
descriptions, and nutrition labels. The nutrition labels file provides product UPCs and the
corresponding label and time of introduction and removal. The challenge with the label
data is that the number and nature of the labels vary for each UPC (i.e., within a single
shelf tag). However, using the following systematic categorization, we were able to place
each shelf tag under one type: (1) any tag that carried “Dietitian’s Top Pick” was
considered a holistic evaluative label with an identified evaluator; (2) any tag that carried
“Heart Healthy” while not accompanied by “Dietitian’s Top Pick” was considered a
holistic evaluative label with an unidentified evaluator; (3) any tag that carried only
“Gluten Free” was considered a special diet, and, finally, (4) all remaining tags were
considered nutrient specific.

Texas Tech University, Asma Alfadhel, August 2018
29
Figure 2: Nutrition Shelf Tags System
Using the scanner data from one store located in a major city, 3,374,768
transactions were obtained for 24 months (June 1st, 2012 through May 31st, 2014) for 32
categories from three departments: frozen, dairy, and grocery. Because there were items
that do not appear continuously through the 24 months period, first, the tag distribution
density for each category for each month (i.e. number of labeled items/ category width)
for 5,606 items was calculated, then its average across all 24 months was obtained for
each category. Only 2,597 items (out of the 5,606) that appear through the 24 months
period were selected for the analysis of which 449 items are labeled (see Table 3).

Texas Tech University, Asma Alfadhel, August 2018
30
Table 3: Dataset Summary
Analyzed Category
Average
Category
width
Average
Distribution
Density
Average
Number
of labeled
UPCs
Total
Number of
Purchases
Total
Analyzed
UPCs
Labeled
Analyzed
UPCs
Identified
Evaluator
Labeled
Analyzed
UPCs
Passive
Evaluator
labeled
Analyzed
UPCs
Nutrient
Specific
Labeled
Analyzed
UPCS
Special Diet
Labeled
Analyzed
UPCs
For 5606 UPCs For 2597 UPCs
Breads-Bagels 27.2 0.5909 16.1 25,352 22 13 0 12 1 0
Breads-Buns 33.5 0.5341 18.0 92,275 22 14 0 9 5 0
Breads-Specialty 104.0 0.3774 39.2 192,457 80 32 1 8 23 0
Breakfast Bars 155.5 0.0840 13.0 73,550 91 11 0 2 9 0
Canned Fish 71.5 0.5838 41.8 58,403 55 34 0 17 17 0
Canned Fruit 104.8 0.1547 16.2 40,838 55 14 0 12 2 0
Canned Vegetables 324.2 0.1674 54.3 317,826 243 46 0 32 14 0
Cheese Puffs And Misc 13.3 0.3141 3.5 6,639 5 3 0 0 3 0
Cold Cereals 257.9 0.1235 31.9 135,756 146 25 0 17 8 0
Cookies/Crackers 347.0 0.0195 6.8 138,911 167 4 1 0 3 0
Dry Pasta 88.3 0.1256 11.1 80,899 68 9 1 2 6 0
Frozen Breads & Rolls 50.5 0.1082 5.6 69,140 70 8 0 2 6 0
Frozen Breakfast Products 103.7 0.0325 3.4 67,037 81 3 1 1 1 0
Frozen Dinners & Entrees 320.9 0.1064 34.4 89,398 209 22 1 5 15 1
Frozen Ice Cream & Novelties 309.6 0.0945 29.2 122,791 165 19 0 5 14 0
Frozen Juices/Drinks 13.1 0.0761 1.0 6,241 11 1 0 1 0 0
Frozen Pizza/Snack Rolls 200.8 0.0410 8.3 52,037 88 6 0 1 5 0
Frozen Vegetables 162.2 0.0510 8.3 112,672 122 6 0 2 4 0
Hot Cereals 81.9 0.1240 10.2 27,742 56 9 0 7 2 0

Texas Tech University, Asma Alfadhel, August 2018
31
Table 3 Continued: Dataset Summary
Analyzed Category
Average
Category
width
Average
Distribution
Density
Average
Number
of labeled
UPCs
Total
Number of
Purchases
Total
Analyzed
UPCs
Labeled
Analyzed
UPCs
Identified
Evaluator
Labeled
Analyzed
UPCs
Passive
Evaluator
labeled
Analyzed
UPCs
Nutrient
Specific
Labeled
Analyzed
UPCS
Special Diet
Labeled
Analyzed
UPCs
For 5606 UPCs For 2597 UPCs
Isotonic Drinks 91.4 0.1516 13.8 87,592 65 9 0 2 7 0
Juices/Drinks (Non-Ref) 235.0 0.2662 62.5 78,638 144 46 2 36 7 1
Microwave Popcorn 52.5 0.5159 27.0 18,325 41 25 1 4 20 0
Milk Substitutes 19.8 0.0503 1.0 17,391 15 1 1 0 0 0
Peanut Butter 45.7 0.0656 3.0 25,549 29 3 0 0 1 2
Prepared Rice Mixers 53.7 0.0558 3.0 36,027 48 3 0 2 1 0
Prepared Spaghetti Sauce 87.1 0.1178 10.3 46,553 60 7 1 5 0 1
Refrigerated Orange Juice 37.7 0.0531 2.0 82,558 31 2 0 2 0 0
Salad Dressings 195.3 0.0387 7.6 58,189 149 4 0 1 3 0
Soups 123.6 0.0958 11.8 114,930 102 10 0 3 7 0
Whipping Cream 5.6 0.1812 1.0 22,245 4 1 0 0 1 0
Yogurt 254.7 0.3089 77.9 408,682 149 58 1 44 12 1
Yogurt Drinks 8.2 0.1794 1.5 8,204 4 1 0 1 0 0
Total
2,714,847 2,597 449 11 235 197 6

Texas Tech University, Asma Alfadhel, August 2018
32
Analysis
Subsets were selected from the dataset to test each corresponding hypothesis
using the corresponding set of equations. These sets of equations consist of two
generalized linear regression equations estimated simultaneously to control for price
endogeneity (Villas-Boas & Winer, 1999). Since price itself is endogenously set by
managers and failing to account for endogeneity may bias the parameter estimates.
Equation (1) estimates the logarithmic transformation of the average price of UPC
(i) in category (j) at the month (k) as a function of the logarithmic transformation of the
average price of UPC (i) in category (j) at the month (k-1). Equation (2) estimates the log
transformation of the dependent variable of interest (Salesijk); that is the total number of
UPCs (i) in category (j) purchased in month (k). The average price of UPC (i) in category
(j) at the month (k) is included in the equation as a control variable. Table 4 summarizes
all measures used in the models.

Texas Tech University, Asma Alfadhel, August 2018
33
Table 4: Descriptions of measures of the variables of interest
Variable Description
Dependent Variable
Log Unit
Sales
Indicates the log transformation of the total number of units of a UPC purchased
per month (Log_Sales for each hypothesis)
Independent Variables
Period Indicates the period in which the purchase is made; coded as 0 = pre-NST
introduction period and 1 = post-NST introduction period (Period for each
hypothesis)
Holistic
Evaluative
Label
A dummy variable indicating the type of label of the purchased UPC;
coded as 1= holistic evaluation and 0= nutrient-specific evaluation
(Holistic_Label: for H3, H6b & H7c)
Identified
Evaluator
Label
A dummy variable indicating the type of label of the purchased UPC;
coded as 1= identified evaluator and 0= passive evaluator (Identified_Eval: for
H4, H6c & H7d)
Number of
Labels Per
Tag
Indicates the number of labels (1, 2, 3, or 4) present in the shelf tag of each tagged
UPC (Num_labels: for H1, H3, & H4)
Tag
Distribution
Density
Indicates the level of tag distribution density within a category measured by the
average of (number of tagged UPCs available each month / total number of UPCs
available each month) which then split to high and low using the median; coded as
1= high and 0= low (DD_H: for H1, H2, H3 & H4)
Log Average
Price
Indicates the log transformation of the average price of each UPC purchased
eachmonth (Log_Avg_Price: Control Variable in equation 2 and dependent
variable in equation1 for each hypothesis)
Log Average
Lag Price
Indicates the log transformation of the average lag price of each UPC purchased
each month (Log_Avg_Price: independent variable in equation 1 for each
hypothesis)
Hypotheses #1
To test H1 regarding the effect of introducing NSTs on the sales of tagged UPCs,
the model utilizes the data of only the tagged UPCs; that is 449 UPCs. The specification
of the model is as follow:

Texas Tech University, Asma Alfadhel, August 2018
34
(1) Log_Avg_Priceijk = γ0 + γ 1 × (Log_Avg_Priceijk-1) + e1ijk
(2) Log_Salesijk = β0 + β1 × (Periodijk) + β2 × (Log_Avg_Priceijk) + e2ijk,
Where:
Log_Salesijk = the log transformation of the number of units of UPC i in category j
purchased in month k
Periodijk = an indicator variable that equals 0 if the purchase of the UPC i in category
j in month k occurred pre-introduction of the nutrition shelf tags and 1 if
the purchase occurred post-introduction
Log_Avg_Priceijk= the log transformation of the average price of UPC i in category j in the
month k
Log_Avg_Priceijk-1= the log transformation of the average price of UPC i in category j in the
month k
The regression coefficient β1 enables testing the effect of NST introduction on the
sales of tagged UPCs.
Hypotheses #2
To test H2 regarding the effect of introducing NSTs on the sales of non-tagged
UPCs, the model utilizes the data of only the non-tagged UPCs; that is 2,148 UPCs. The
specification of the model is as follow:
(1) Log_Avg_Priceijk = γ0 + γ 1 × (Log_Avg_Priceijk-1) + e1ijk
(2) Log_Salesijk = β0 + β1 × (Periodijk) + β2 × (Log_Avg_Priceijk) + e2ijk,
Where:
Log_Salesijk = the log transformation of the number of units of UPC i in category j
purchased in month k
Periodijk = an indicator variable that equals 0 if the purchase of the UPC i in category
j in month k occurred pre-introduction of the nutrition shelf tags and 1 if
Texas Tech University, Asma Alfadhel, August 2018
35
the purchase occurred post-introduction
Log_Avg_Priceijk= the log transformation of the average price of UPC i in category j in the
month k
Log_Avg_Priceijk-1= the log transformation of the average price of UPC i in category j in the
month k
The regression coefficient β1 enables testing the effect of NST introduction on the
sales of non-tagged UPCs.
Hypotheses #3
To test H3 regarding the effect of introducing NST on the sales of UPCs tagged
with holistic evaluation labels compared to that of UPCs tagged with nutrient specific
labels, the model utilizes the data of 443 UPCs. The specification of the model is as
follow:
(1) Log_Avg_Priceijk = γ0 + γ 1 × (Log_Avg_Priceijk-1) + e1ijk
(2) Log_Salesijk = β0 + β1 × (Periodijk) + β2 × (Holistic_Labelij) + β3 × (Log_Avg_Priceijk)
+ β4 × (Periodijk) × (Holistic_Labelij) + e2ijk,
Where:
Log_Salesijk = the log transformation of the number of units of UPC i in category j
purchased in month k
Periodijk = an indicator variable that equals 0 if the purchase of the UPC i in category
j in month k occurred pre-introduction of the nutrition shelf tags and 1 if
the purchase occurred post-introduction
Holisticij = an indicator of whether UPC i in category j is labeled with holistic
evaluation or nutrient specific label; 0= nutrient specific, 1= holistic
evaluation
Log_Avg_Priceijk= the log transformation of the average price of UPC i in category j in the
month k

Texas Tech University, Asma Alfadhel, August 2018
36
Log_Avg_Priceijk-1= the log transformation of the average price of UPC i in category j in the
month k
The interaction term (Period × Holistic) enables the testing of H3; that is the effect
of the introduction of NST on the sales of UPCs tagged via holistic evaluative labels
compared to that of UPCs tagged with nutrient specific labels.
Hypotheses #4
To test H4 regarding the effect of introducing NST on the sales of UPCs tagged
with identified evaluator labels compared to that of UPCs tagged with passive evaluator
labels, the model utilizes the data of 246 UPCs from which 11 UPCs are labeled with an
identified evaluator. The specification of the model is as follow:
(1) Log_Avg_Priceijk = γ0 + γ 1 × (Log_Avg_Priceijk-1) + e1ijk
(2) Log_Salesijk = β0 + β1 × (Periodijk) + β2 × (Identified_Evalij) + β3 × (Log_Avg_Priceijk)
+ β4 × (Periodijk) × (Identified_Evalij) + e2ijk,
Where:
Log_Salesijk = the log transformation of the number of units of UPC i in category j
purchased in month k
Periodijk = an indicator variable that equals 0 if the purchase of the UPC i in category j
in month k occurred pre-introduction of the nutrition shelf tags and 1 if the
purchase occurred post-introduction
Identifiedij = an indicator of whether UPC i in category j is labeled with an identified
evaluator or passive evaluator; label; 0= passive evaluator, 1= identified
evaluator
Log_Avg_Priceijk= the log transformation of the average price of UPC i in category j in the
month k
Log_Avg_Priceijk-
1=
the log transformation of the average price of UPC i in category j in the
month k

Texas Tech University, Asma Alfadhel, August 2018
37
The interaction term (Period × Identified) enables the testing of H4; that is the
effect of the introduction of NST on the sales of UPCs tagged with identified evaluator
labels compared to that of UPCs tagged with passive evaluator.
Hypotheses #5
To test H5 regarding the effect of introducing NST on the sales of items labeled
with special diet. This model utilizes the data of 6 UPCs labeled with only a special diet
label. The specification of the model is as follow:
(1) Log_Avg_Priceijk = γ0 + γ 1 × (Log_Avg_Priceijk-1) + e1ijk
(2) Log_Salesijk = β0 + β1 × (Periodijk) + β 2 × (Log_Avg_Priceijk) + e2ijk,
Where:
Log_Salesijk = the log transformation of the number of units of UPC i in category j
purchased in month k
Periodijk = an indicator variable that equals 0 if the purchase of the UPC i in category j
in month k occurred pre-introduction of the nutrition shelf tags and 1 if the
purchase occurred post-introduction
Log_Avg_Priceijk= the log transformation of the average price of UPC i in category j in the
month k
Log_Avg_Priceijk-1= the log transformation of the average price of UPC i in category j in the
month k
The regression coefficient β1 enables the testing of H5; that is the effect of NST
introduction on the sales of items labeled using a special diet label.

Texas Tech University, Asma Alfadhel, August 2018
38
Hypotheses #6a
To test H6a regarding the moderating effect of number of labels within a tag on H1
(i.e. the effect of introducing NSTs on the sales of tagged UPCs). The model utilizes the
same dataset used to test H1 and is specified as follow:
(1) Log_Avg_Priceijk = γ0 + γ 1 × (Log_Avg_Priceijk-1) + e1ijk
(2) Log_Salesijk = β0 + β1 × (Periodijk) + β2 × (Num_Labelsij) + β3 × (Log_Avg_Priceijk)
+ β4 × (Periodijk) × (Num_Labelsij) + e2ijk,
Where:
Log_Salesijk = the log transformation of the number of units of UPC i in category j
purchased in month k
Periodijk = an indicator variable that equals 0 if the purchase of the UPC i in category
j in month k occurred pre-introduction of the nutrition shelf tags and 1 if
the purchase occurred post-introduction
Num_Labelsij = the number of labels (1, 2, 3, or 4) present in the shelf tag of each tagged
UPC i in category j
Log_Avg_Priceijk= the log transformation of the average price of UPC i in category j in the
month k
Log_Avg_Priceijk-1= the log transformation of the average price of UPC i in category j in the
month k
The regression coefficient β4 enables the testing of the moderating effect of the
number of labels in a tag on H1.
Hypotheses #6b
To test H6b regarding the moderating effect of number of labels within a tag on H3
(i.e. the effect of introducing NST on the sales of UPCs tagged with holistic evaluation
labels compared to that of UPCs tagged with nutrient specific labels). The model utilizes
the same dataset used to test H3 and is specified as follow:

Texas Tech University, Asma Alfadhel, August 2018
39
1) Log_Avg_Priceijk = γ0 + γ 1 × (Log_Avg_Priceijk-1) + e1ijk
2) Log_Salesijk = β0 + β1 × (Periodijk) + β2 × (Holistic_Labelij)
+ β3 × (Num_Labelsij) + β4 × (Log_Avg_Priceijk)
+ β5 × (Periodijk) × (Holistic_Labelij)
+ β6 × (Periodijk) × (Num_Labelsij)
+ β7 × (Holistic_Labelij) × (Num_Labelsij)
+ β8 × (Periodijk) × (Holistic_Labelij) × (Num_Labelsij) + e2ijk,
Where:
Log_Salesijk = the log transformation of the number of units of UPC i in category j
purchased in month k
Periodijk = an indicator variable that equals 0 if the purchase of the UPC i in category
j in month k occurred pre-introduction of the nutrition shelf tags and 1 if
the purchase occurred post-introduction
Holisticij = an indicator of whether UPC i in category j is labeled with holistic
evaluation or nutrient specific label; 0= nutrient specific, 1= holistic
evaluation
Num_Labelsij = the number of labels (1, 2, 3, or 4) present in the shelf tag of each tagged
UPC i in category j
Log_Avg_Priceijk= the log transformation of the average price of UPC i in category j in the
month k
Log_Avg_Priceijk-1= the log transformation of the average price of UPC i in category j in the
month k
The regression coefficient β8 enables the testing of the moderating effect of the
number of labels in a tag on H3.

Texas Tech University, Asma Alfadhel, August 2018
40
Hypotheses #6c
To test H6c regarding the moderating effect of number of labels within a tag on H4
(i.e. the effect of introducing NST on the sales of UPCs tagged with identified evaluator
labels compared to that of UPCs tagged with passive evaluator labels). The model utilizes
the same dataset used to test H4 and is specified as follow:
1) Log_Avg_Priceijk = γ0 + γ 1 × (Log_Avg_Priceijk-1) + e1ijk
2) Log_Salesijk = β0 + β1 × (Periodijk) + β2 × (Identified_Evalij)
+ β3 × (Num_Labelsij) + β4 × (Log_Avg_Priceijk)
+ β5 × (Periodijk) × (Identified_Evalij)
+ β6 × (Periodijk) × (Num_Labelsij)
+ β7 × (Identified_Evalij) × (Num_Labelsij)
+ β8 × (Periodijk) × (Identified_Evalij) × (Num_Labelsij) + e2ijk,
Where:
Log_Salesijk = the log transformation of the number of units of UPC i in category j
purchased in month k
Periodijk = an indicator variable that equals 0 if the purchase of the UPC i in category j
in month k occurred pre-introduction of the nutrition shelf tags and 1 if the
purchase occurred post-introduction
Identifiedij = an indicator of whether UPC i in category j is labeled with an identified
evaluator or passive evaluator; label; 0= passive evaluator, 1= identified
evaluator
Num_Labelsij = the number of labels (1, 2, 3, or 4) present in the shelf tag of each tagged
UPC i in category j
Log_Avg_Priceijk= the log transformation of the average price of UPC i in category j in the
month k
Log_Avg_Priceijk-
1=
the log transformation of the average price of UPC i in category j in the
month k

Texas Tech University, Asma Alfadhel, August 2018
41
The regression coefficient β8 enables the testing of the moderating effect of the
number of labels in a tag on H4.
Hypotheses #7a
To test H7a regarding the moderating effect of tag distribution density on H1 (i.e.
the effect of introducing NSTs on the sales of tagged UPCs). The model utilizes the same
dataset used to test H1 and is specified as follow:
(1) Log_Avg_Priceijk = γ0 + γ 1 × (Log_Avg_Priceijk-1) + e1ijk
(2) Log_Salesijk = β0 + β1 × (Periodijk) + β2 × (DD_Hij) + β3 × (Log_Avg_Priceijk)
+ β4 × (Periodijk) × (DD_Hij) + e2ijk,
Where:
Log_Salesijk = the log transformation of the number of units of UPC i in category j
purchased in month k
Periodijk = an indicator variable that equals 0 if the purchase of the UPC i in category
j in month k occurred pre-introduction of the nutrition shelf tags and 1 if
the purchase occurred post-introduction
DD_Hij = an indicator variable that equals 0 if the tag distribution density in
category j is high, and 1 if it is low.
Log_Avg_Priceijk= the log transformation of the average price of UPC i in category j in the
month k
Log_Avg_Priceijk-1= the log transformation of the average price of UPC i in category j in the
month k
The regression coefficient β4 enables the testing of the moderating effect of tag
distribution density on H1.
Texas Tech University, Asma Alfadhel, August 2018
42
Hypotheses #7b
To test H7b regarding the moderating effect of tag distribution density on H2 (i.e.
the effect of introducing NSTs on the sales of non-tagged UPCs). The model utilizes the
same dataset used to test H2 and is specified as follow:
(1) Log_Avg_Priceijk = γ0 + γ 1 × (Log_Avg_Priceijk-1) + e1ijk
(2) Log_Salesijk = β0 + β1 × (Periodijk) + β2 × (DD_Hj) + β3 × (Log_Avg_Priceijk)
+ β4 × (Periodijk) × (DD_Hj) + e2ijk,
Where:
Log_Salesijk = the log transformation of the number of units of UPC i in category j
purchased in month k
Periodijk = an indicator variable that equals 0 if the purchase of the UPC i in category
j in month k occurred pre-introduction of the nutrition shelf tags and 1 if
the purchase occurred post-introduction
DD_Hij = an indicator variable that equals 0 if the tag distribution density in
category j is high, and 1 if it is low.
Log_Avg_Priceijk= the log transformation of the average price of UPC i in category j in the
month k
Log_Avg_Priceijk-1= the log transformation of the average price of UPC i in category j in the
month k
The regression coefficient β4 enables the testing of the moderating effect of tag
distribution density on H2.
Hypotheses #7c
To test H7c regarding the moderating effect of number of labels within a tag on H3
(i.e. the effect of introducing NST on the sales of UPCs tagged with holistic evaluation
labels compared to that of UPCs tagged with nutrient specific labels). The model utilizes
the same dataset used to test H3 and is specified as follow:

Texas Tech University, Asma Alfadhel, August 2018
43
1) Log_Avg_Priceijk = γ0 + γ 1 × (Log_Avg_Priceijk-1) + e1ijk
2) Log_Salesijk = β0 + β1 × (Periodijk) + β2 × (Holistic_Labelij)
+ β3 × (DD_Hj) + β4 × (Log_Avg_Priceijk)
+ β5 × (Periodijk) × (Holistic_Labelij)
+ β6 × (Periodijk) × (DD_Hj)
+ β7 × (Holistic_Labelij) × (DD_Hj)
+ β8 × (Periodijk) × (Holistic_Labelij) × (DD_Hj) + e2ijk,
Where:
Log_Salesijk = the log transformation of the number of units of UPC i in category j
purchased in month k
Periodijk = an indicator variable that equals 0 if the purchase of the UPC i in category
j in month k occurred pre-introduction of the nutrition shelf tags and 1 if
the purchase occurred post-introduction
Holisticij = an indicator of whether UPC i in category j is labeled with holistic
evaluation or nutrient specific label; 0= nutrient specific, 1= holistic
evaluation
DD_Hij = an indicator variable that equals 0 if the tag distribution density in
category j is high, and 1 if it is low.
Log_Avg_Priceijk= the log transformation of the average price of UPC i in category j in the
month k
Log_Avg_Priceijk-1= the log transformation of the average price of UPC i in category j in the
month k
The regression coefficient β8 enables the testing of the moderating effect of tag
distribution density on H3.
Hypotheses #7d
To test H7d regarding the moderating effect of number of labels within a tag on H4
(i.e. the effect of introducing NST on the sales of UPCs tagged with identified evaluator

Texas Tech University, Asma Alfadhel, August 2018
44
labels compared to that of UPCs tagged with passive evaluator labels). The model utilizes
the same dataset used to test H4 and is specified as follow:
1) Log_Avg_Priceijk = γ0 + γ 1 × (Log_Avg_Priceijk-1) + e1ijk
2) Log_Salesijk = β0 + β1 × (Periodijk) + β2 × (Identified_Evalij)
+ β3 × (DD_Hj) + β4 × (Log_Avg_Priceijk)
+ β5 × (Periodijk) × (Identified_Evalij)
+ β6 × (Periodijk) × (DD_Hj)
+ β7 × (Identified_Evalij) × (DD_Hj)
+ β8 × (Periodijk) × (Identified_Evalij) × (DD_Hj) + e2ijk,
Where:
Log_Salesijk = the log transformation of the number of units of UPC i in category j
purchased in month k
Periodijk = an indicator variable that equals 0 if the purchase of the UPC i in category
j in month k occurred pre-introduction of the nutrition shelf tags and 1 if
the purchase occurred post-introduction
Identifiedij = an indicator of whether UPC i in category j is labeled with an identified
evaluator or passive evaluator; label; 0= passive evaluator, 1= identified
evaluator
DD_Hij = an indicator variable that equals 0 if the tag distribution density in
category j is high, and 1 if it is low.
Log_Avg_Priceijk= the log transformation of the average price of UPC i in category j in the
month k
Log_Avg_Priceijk-1= the log transformation of the average price of UPC i in category j in the
month k
The regression coefficient β8 enables the testing of the moderating effect of tag
distribution density on H4.

Texas Tech University, Asma Alfadhel, August 2018
45
CHAPTER V
RESULTS
Each set of equations were simultaneously estimated to test each hypothesis.
First, using only main effects, then including the two-way interactions (except for model
1, 2, & 5), and finally including the three-way interactions when relevant. Regression
coefficients and model fit summaries are reported in table 5.

Texas Tech University, Asma Alfadhel, August 2018
46
Table 5: Results Summary
Regression
Coefficient
(Standard Error)
Model 1
Regression
Coefficient
(Standard Error)
Model 2
Regression
Coefficient
(Standard Error)
Model 3
Hypotheses
H1: Tagged UPCs
Intercept 1 (γ0) 0.0157(0.0019) **
Log Average Lag Price (γ1) 0.9833(0.0017) **
Intercept 2 (β0) 4.0242(0.0212) **
Period (β1) -0.0721(0.0193) ** H1 Not Supported
Log Average Price (β3) -0.6479(0.0175) **
Log Likelihood -5965
AIC 11946
BIC 12004

Texas Tech University, Asma Alfadhel, August 2018
47
Table 5 Continued: Results Summary
Regression
Coefficient
(Standard Error)
Model 1
Regression
Coefficient
(Standard Error)
Model 2
Regression
Coefficient
(Standard Error)
Model 3
Hypotheses
H2: Non-tagged UPCs
Intercept 1 (γ0) 0.0161(0.0008) **
Log Average Lag Price (γ1) 0.9827(0.0008) **
Intercept 2 (β0) 3.6498(0.0098) **
Period (β1) -0.0477(0.0087) ** H2 Supported
Log Average Price (β3) -0.4988(0.0083) **
Log Likelihood -24919
AIC 49854
BIC 49925

Texas Tech University, Asma Alfadhel, August 2018
48
Table 5 Continued: Results Summary
Regression
Coefficient
(Standard Error)
Model 1
Regression
Coefficient
(Standard Error)
Model 2
Regression
Coefficient
(Standard Error)
Model 3
Hypotheses
H3: Tagged UPCs with Holistic Evaluative Labels and Nutrient Specific Labels
Intercept 1 (γ0) 0.0156(0.0019) ** 0.0156(0.0019) **
Log Average Lag Price (γ1) 0.9834(0.0017) ** 0.9834(0.0017) **
Intercept 2 (β0) 4.0159(0.0248) ** 3.9997(0.0271) **
Period (β1) -0.0716(0.0196) ** -0.0392(0.0293)
Holistic Evaluative Label (β2) 0.0068(0.0198) 0.0360(0.0279)
Log Average Price (β3) -0.6450(0.0177) ** -0.6450(0.0177) **
Period × Holistic Evaluative Label (β4) -0.0583(0.0394) H3 Not Supported
Log Likelihood -5929 -5928
AIC 11876 11876
BIC 11941
11948

Texas Tech University, Asma Alfadhel, August 2018
49
Table 5 Continued: Results Summary
Regression
Coefficient
(Standard Error)
Model 1
Regression
Coefficient
(Standard Error)
Model 2
Regression
Coefficient
(Standard Error)
Model 3
Hypotheses
H4: Tagged UPCs with Holistic Evaluative Labels (i.e. identified evaluator and passive evaluator)
Intercept 1 (γ0) 0.0139(0.0024) ** 0.0139(0.0024) **
Log Average Lag Price (γ1) 0.9841(0.0023) ** 0.9841(0.0023) **
Intercept 2 (β0) 4.0261(0.0274) ** 4.0280(0.0275) **
Period (β1) -0.0978(0.0260) ** -0.1016(0.0266) **
Identified Evaluator Label (β2) 0.1407(0.0629) * 0.0979(0.0889)
Log Average Price (β3) -0.6404(0.0231) ** -0.6404(0.0231) **
Period × Identified Evaluator Label (β4) 0.0856(0.1257) H4 Not Supported
Log Likelihood -3203 -3202
AIC 6423 6425
BIC 6483 6492

Texas Tech University, Asma Alfadhel, August 2018
50
Table 5 Continued: Results Summary
Regression
Coefficient
(Standard Error)
Model 1
Regression
Coefficient
(Standard Error)
Model 2
Regression
Coefficient
(Standard Error)
Model 3
Hypotheses
H5: Tagged UPCs Special Diet Label
Intercept 1 (γ0) 0.0295(0.0205)
Log Average Lag Price (γ1) 0.9728(0.0185) **
Intercept 2 (β0) 4.4672(0.1276) **
Period (β1) -0.1053(0.0960) H5 Supported
Log Average Price (β3) -0.9510(0.1071) **
Log Likelihood -1.21977
AIC 18.43954
BIC 42.19805

Texas Tech University, Asma Alfadhel, August 2018
51
Table 5 Continued: Results Summary
Regression
Coefficient
(Standard Error)
Model 1
Regression
Coefficient
(Standard Error)
Model 2
Regression
Coefficient
(Standard Error)
Model 3
Hypotheses
H6a: Tagged UPCs
Intercept 1 (γ0) 0.0157(0.0019) ** 0.0157(0.0019) **
Log Average Lag Price (γ1) 0.9833(0.0017) ** 0.9833(0.0017) **
Intercept 2 (β0) 3.9188(0.0296) ** 3.9083(0.0350) **
Period (β1) -0.0720(0.0193) ** -0.0512(0.0424)
Number of Labels per Tag (β2) 0.0555(0.0109) ** 0.0615(0.0153) **
Log Average Price (β3) -0.6385(0.0175) ** -0.6385(0.0175) **
Period × Number of Labels per Tag (β4) -0.0120(0.0216) H6a Not Supported
Log Likelihood -5952 -5952
AIC 11922 11923
BIC 11987 11996

Texas Tech University, Asma Alfadhel, August 2018
52
Table 5 Continued: Results Summary
Regression
Coefficient
(Standard Error)
Model 1
Regression
Coefficient
(Standard Error)
Model 2
Regression
Coefficient
(Standard Error)
Model 3
Hypotheses
H6b: Tagged UPCs with Holistic Evaluative Labels and Nutrient Specific Labels
Intercept 1 (γ0) 0.0156(0.0019) ** 0.0156(0.0019) ** 0.0156(0.0019) **
Log Average Lag Price (γ1) 0.9834(0.0017) ** 0.9834(0.0017) ** 0.9834(0.0017) **
Intercept 2 (β0) 3.9122(0.0299) ** 4.2316(0.0537) ** 4.2124(0.0675) **
Period (β1) -0.0716(0.0195) ** -0.0502(0.0428) -0.0118(0.0922)
Holistic Evaluative Label (β2) -0.0791(0.0241) ** -0.4716(0.0623) ** -0.4471(0.0812) **
Number of Labels per Tag (β3) 0.0830(0.0134) ** -0.2066(0.0396) ** -0.1902(0.0528) **
Log Average Price (β4) -0.6386(0.0177) ** -0.6346(0.0177) ** -0.6345(0.0177) **
Period × Holistic Evaluative Label (β5) -0.0682(0.0480) -0.1171(0.1149)
Period × Number of Labels per Tag (β6) 0.0094(0.0267) -0.0233(0.0746)
Holistic Evaluative Label × Number of Labels per Tag (β7) 0.3269(0.0400) ** 0.3081(0.0565) **
Period × Holistic Evaluative Label × Number of Labels per Tag (β8) 0.0375(0.0799) H6b Not Supported
Log Likelihood -5910 -5875 -5875
AIC 11839 11776 11778
BIC 11912 11871 11880

Texas Tech University, Asma Alfadhel, August 2018
53
Table 5 Continued: Results Summary
Regression
Coefficient
(Standard Error)
Model 1
Regression
Coefficient
(Standard Error)
Model 2
Regression
Coefficient
(Standard Error)
Model 3
Hypotheses
H6c: Tagged UPCs with Holistic Evaluative Labels (i.e. identified evaluator and passive evaluator)
Intercept 1 (γ0) 0.014(0.002) ** 0.0139(0.0024) ** 0.0139(0.0024) **
Log Average Lag Price (γ1) 0.984(0.002) ** 0.9841(0.0023) ** 0.9841(0.0023) **
Intercept 2 (β0) 3.739(0.043) ** 3.7612(0.0535) ** 3.7701(0.0541) **
Period (β1) -0.098(0.026) ** -0.1279(0.0677) -0.1456(0.0695) *
Identified Evaluator Label (β2) 0.072(0.063) -0.1080(0.1842) -0.2890(0.2447)
Number of Labels per Tag (β3) 0.124(0.014) ** 0.1145(0.0205) ** 0.1105(0.0208) **
Log Average Price (β4) -0.622(0.023) ** -0.6221(0.0231) ** -0.6222(0.0231) **
Period × Identified Evaluator Label (β5) 0.0792(0.1258) 0.4412(0.3460)
Period × Number of Labels per Tag (β6) 0.0120(0.0284) 0.0201(0.0293)
Identified Evaluator Label × Number of Labels per Tag (β7) 0.0522(0.0598) 0.1194(0.0846)
Period × Identified Evaluator Label × Number of Labels per Tag (β8) -0.1343(0.1196) H6c Not Supported
Log Likelihood -3165 -3165 -3164
AIC 6351 6355 6356
BIC 6418 6442 6450

Texas Tech University, Asma Alfadhel, August 2018
54
Table 5 Continued: Results Summary
Regression
Coefficient
(Standard Error)
Model 1
Regression
Coefficient
(Standard Error)
Model 2
Regression
Coefficient
(Standard Error)
Model 3
Hypotheses
H7a: Tagged UPCs
Intercept 1 (γ0) 0.0157(0.0019) ** 0.0157(0.0019) **
Log Average Lag Price (γ1) 0.9833(0.0017) ** 0.9833(0.0017) **
Intercept 2 (β0) 3.7136(0.0301) ** 3.6974(0.0345) **
Period (β1) -0.0717(0.0192) ** -0.0393(0.0387)
Tag Distribution Density (β2) 0.3317(0.0230) ** 0.3532(0.0320) **
Log Average Price (β3) -0.5830(0.0179) ** -0.5830(0.0179) **
Period × Tag Distribution Density (β4) 0.0429(0.0446) H7a Not Supported
Log Likelihood -5862 -5862
AIC 11742 11743
BIC 11808 11816

Texas Tech University, Asma Alfadhel, August 2018
55
Table 5 Continued: Results Summary
Regression
Coefficient
(Standard Error)
Model 1
Regression
Coefficient
(Standard Error)
Model 2
Regression
Coefficient
(Standard Error)
Model 3
Hypotheses
H7b: Non-tagged UPCs
Intercept 1 (γ0) 0.0161(0.0008) ** 0.0161(0.0008) **
Log Average Lag Price (γ1) 0.9827(0.0008) ** 0.9827(0.0008) **
Intercept 2 (β0) 3.4735(0.0115) ** 3.4676(0.0120) **
Period (β1) -0.0474(0.0086) ** -0.0357(0.0110) **
Tag Distribution Density (β2) 0.2682(0.0094) ** 0.2836(0.0129) **
Log Average Price (β3) -0.4191(0.0087) ** -0.4190(0.0087) **
Period × Tag Distribution Density (β4) -0.0307(0.0178) H7b Not Supported
Log Likelihood -24514 -24513
AIC 49047 49046
BIC 49126 49134
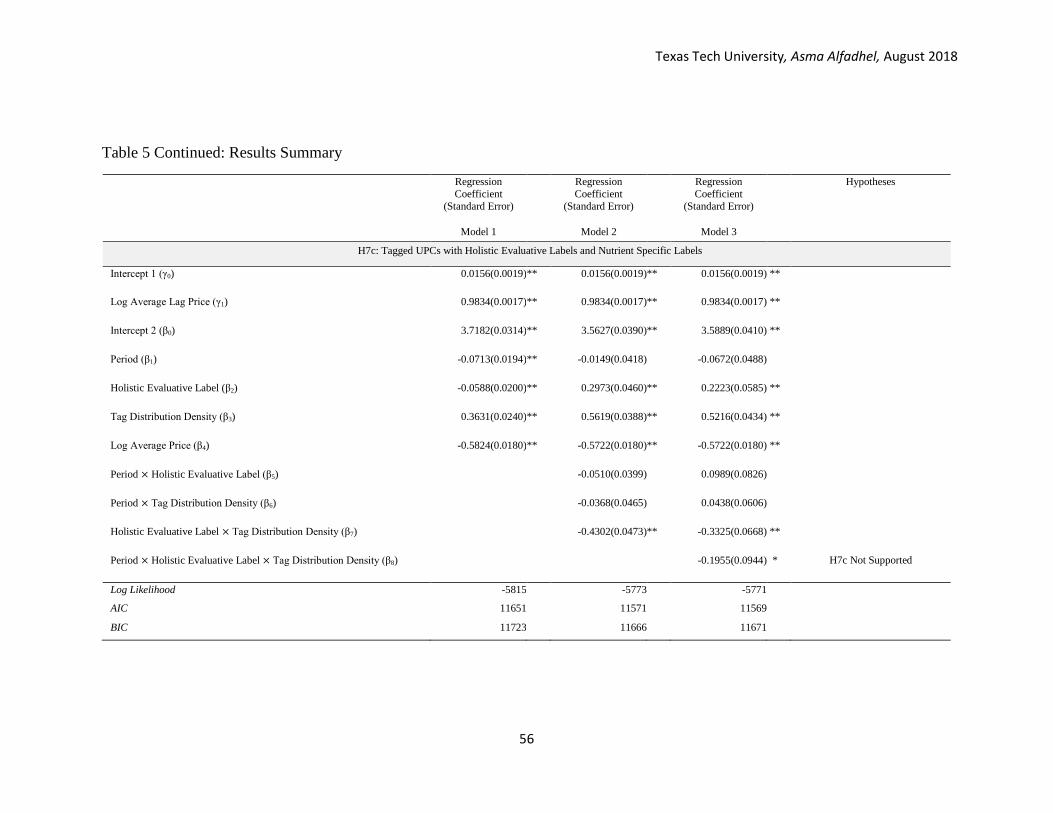
Texas Tech University, Asma Alfadhel, August 2018
56
Table 5 Continued: Results Summary
Regression
Coefficient
(Standard Error)
Model 1
Regression
Coefficient
(Standard Error)
Model 2
Regression
Coefficient
(Standard Error)
Model 3
Hypotheses
H7c: Tagged UPCs with Holistic Evaluative Labels and Nutrient Specific Labels
Intercept 1 (γ0) 0.0156(0.0019) **
88*
*
0.0156(0.0019) ** 0.0156(0.0019) **
Log Average Lag Price (γ1) 0.9834(0.0017) ** 0.9834(0.0017) ** 0.9834(0.0017) **
Intercept 2 (β0) 3.7182(0.0314) ** 3.5627(0.0390) ** 3.5889(0.0410) **
Period (β1) -0.0713(0.0194) ** -0.0149(0.0418) -0.0672(0.0488)
Holistic Evaluative Label (β2) -0.0588(0.0200) ** 0.2973(0.0460) ** 0.2223(0.0585) **
Tag Distribution Density (β3) 0.3631(0.0240) ** 0.5619(0.0388) ** 0.5216(0.0434) **
Log Average Price (β4) -0.5824(0.0180) ** -0.5722(0.0180) ** -0.5722(0.0180) **
Period × Holistic Evaluative Label (β5) -0.0510(0.0399) 0.0989(0.0826)
Period × Tag Distribution Density (β6) -0.0368(0.0465) 0.0438(0.0606)
Holistic Evaluative Label × Tag Distribution Density (β7) -0.4302(0.0473) ** -0.3325(0.0668) **
Period × Holistic Evaluative Label × Tag Distribution Density (β8) -0.1955(0.0944) * H7c Not Supported
Log Likelihood -5815 -5773 -5771
AIC 11651 11571 11569
BIC 11723 11666 11671

Texas Tech University, Asma Alfadhel, August 2018
57
Table 5 Continued: Results Summary
Regression
Coefficient
(Standard Error)
Model 1
Regression
Coefficient
(Standard Error)
Model 2
Regression
Coefficient
(Standard Error)
Model 3
Hypotheses
H7d: Tagged UPCs with Holistic Evaluative Labels (i.e. identified evaluator and passive evaluator)
Intercept 1 (γ0) 0.0139(0.0024) ** 0.0139(0.0024) ** 0.0139(0.0024) **
Log Average Lag Price (γ1) 0.9841(0.0023) ** 0.9841(0.0023) ** 0.9841(0.0023) **
Intercept 2 (β0) 3.9146(0.0442) ** 3.8346(0.0555) ** 3.8410(0.0563) **
Period (β1) -0.0977(0.0260) ** 0.0259(0.0691) 0.0131(0.0719)
Identified Evaluator Label (β2) 0.1777(0.0639) ** 0.2938(0.1168) * 0.2466(0.1383)
Tag Distribution Density (β3) 0.1196(0.0372) ** 0.2145(0.0537) ** 0.2071(0.0549) **
Log Average Price (β4) -0.6309(0.0233) ** 0.0387(0.1277) -0.6311(0.0233) **
Period × Identified Evaluator Label (β5) -0.1476(0.0738) * 0.1332(0.1956)
Period × Tag Distribution Density (β6) -0.2360(0.1291) -0.1328(0.0774)
Identified Evaluator Label × Tag Distribution Density (β7) -0.1537(0.1825)
Period × Identified Evaluator Label × Tag Distribution Density (β8) -0.1647(0.2582) H7d Not Supported
Log Likelihood -3197 -3194 -3193
AIC 6415 6413 6415
BIC 6482 6500 6508
*P < 0.05 and **P < 0.01

Texas Tech University, Asma Alfadhel, August 2018
58
Introduction of Nutrition Shelf Tags
When testing H1, the main effect of period is significant (β1 = -0.0721, p < 0.05),
indicating a 7% decrease in sales of tagged UPCs post-introduction of the NSTs. Unlike what is
hypothesized, the introduction of NSTs did not positively impact the sales of tagged UPCs.
Hence, H1 is not supported (hypotheses test results are summarized in table 6).
Similarly, when testing H2, the main effect of period is significant (β1 = -0.0477, p <
0.05), indicating a 4% decrease in sales of non-tagged UPCs post-introduction of the NSTs. This
however, supports H2, that is; the introduction of NSTs had a negative impact on the sales of
non-tagged UPCs.
Though sales both tagged and non-tagged UPCs have decreased, the percentage decrease
in the sales of tagged UPCs is higher than that of non-tagged UPCs. This general decrease in UPC
sales maybe attributed to some other store related factors, however, a positive impact of the tags
could have been indicated by a lower rate of decrease in sales of tagged UPCs. Results shows that
this is not the case.
Nutrition Label Types
When testing H3, the investigated effect of the NSTs introduction is only on certain
tagged UPCs to allow the comparison of the effect of two different label types namely; holistic
evaluative labels and nutrient specific labels. The result shows that the effect of introducing
holistic evaluative labels on sales is insignificantly different from that of introducing nutrient
specific labels (β4 = -0.0583, p > 0.05), hence, H3 is not supported.
Similarly, when testing H4, the investigated effect of the NSTs introduction is only on
holistic evaluative tagged UPCs to allow the comparison of the effect of two different labels those
with an identified evaluator and a passive evaluator. The result show that the effect of introducing
holistic evaluative labels with an identified evaluator on sales is insignificantly different from that

Texas Tech University, Asma Alfadhel, August 2018
59
of introducing holistic evaluative labels with a passive evaluator (β4 = 0.0856, p > 0.05), hence,
H4 is not supported.
As to testing H5, the investigated effect of the NSTs introduction is only on UPCs tagged
with special diet label. It was predicted that there will be no effect on the sales of these UPCs
because consumers who are used to such special diet are already knowledgeable of such items
and are regular consumers to these items and it is unlikely that the labels would make a difference
in directing shoppers toward such UPCs. The main effect of period is insignificant (β1 = -0.1053,
p > 0.05), indicating there was no significant change in sales of UPCs that were tagged with the
special diet label post-introduction of the NSTs. Thus, H5 is supported.
Number of Labels Per Tag
The number of labels per tag is hypothesized to have a positive moderating effect on the
impact of introducing NSTs on UPC sales. That is because more labels per tag provide more
nutrition information and signal a more healthier option. Shoppers are expected to be more
inclined toward purchasing these UPCs and thus the expected positive impact of NSTs on sales
would be stronger for tagged UPCs having more labels per tag than those having less.
When testing H6a, that is the moderating effect of having more labels per tag on the
effect of introducing NSTs on the sales of tagged UPCs, the result show that there is no
significant impact on the UPC sales post-introduction of NSTs (β4 = -0.012, p > 0.05). Thus, H6a
is not supported.
Similarly, for H6b and H6c, the moderating effect of having more labels per tag on the
effect of introducing NSTs on the sales of the relevant tagged UPCs is insignificant (β8 = 0.0375,
p > 0.05 and β8 = -0.1343, p > 0.05). Thus, both H6b and H6c were also not supported.

Texas Tech University, Asma Alfadhel, August 2018
60
Tag Distribution Density
The high tag distribution density in a category is hypothesized to have a negative
moderating effect on the impact of introducing NSTs on UPC sales. High number of tags
displayed in a category relative to the overall number of UPCs within that category may cause
visual crowdedness and overload shoppers with information leading them to poorer decision
making or discarding these tags. That is nutrition shelf tags are expected to be less effective in
categories that experience high tag distribution when compared to those experiencing low tag
distribution density.
When testing H7a and H7b, that is the moderating effect of tag distribution density on the
effect of introducing NSTs on the sales of tagged UPCs and the sales of non-tagged UPCs, the
results show that there is no significant impact on the UPC sales post-introduction of NSTs (β4 =
0.0429, p > 0.05 and β4 = -0.0307, p > 0.05). Thus, both H7a and H7b are not supported.
When testing H7c; that is the moderating effect of tag distribution density on the effect of
introducing NSTs on the sales of the relevant tagged UPCs, the three-way interaction between the
label type, tags’ introduction and tag distribution density has a negative significant effect (β8 = -
0.1955, p < 0.05). However, this does not support H7c because both the two-way interactions
(Period x Holistic) and (Period x DD_H1) are insignificant (β5 = 0.098, p > 0.05 and β6 = 0.043,
p > 0.05) while the two-way interaction of (Holistic x DD_H1) is negatively significant (β7 = -
0.3325, p < 0.05). This does not mean that the distribution density moderates the compared effect
of introducing different types NSTs on UPC sales as hypothesized but does in a different manner
(i.e. cross interaction). Basically, the reported effect indicates a change in direction rather than a
change in magnitude which does not support the H7c.
Finally, testing H7d, also reveals a non-significant moderating effect of tag distribution
density on the effect of introducing NSTs on the sales of the relevant tagged UPCs (β8 = -0.1647,
p > 0.05).

Texas Tech University, Asma Alfadhel, August 2018
61
Table 6: Summary of Hypotheses Test Results
Hypotheses Results
H1: The introduction of NST will have a positive effect on the sales of tagged UPCs Not Supported
H2: The introduction of NST will have a negative effect on the sales of non-tagged UPCs Supported
H3: The introduction of NST will have a stronger positive effect on the sales of UPCs tagged using holistic evaluation
label(s) than that of UPCs tagged using nutrient-specific evaluation label(s)
Not Supported
H4: The introduction of NST will have a stronger positive effect on the sales of UPCs tagged using an identified
evaluator label than that of UPCs tagged using a passive evaluator label
Not Supported
H5: The introduction of NST will have no significant effect on the sales of UPCs tagged using only special diet label Supported
H6a: The effects predicted in H1 will be stronger for UPCs with tags having more nutrition labels Not Supported
H6b: The effects predicted in H3 will be stronger for UPCs with tags having more nutrition labels Not Supported
H6c: The effects predicted in H4 will be stronger for UPCs with tags having more nutrition labels Not Supported
H7a: The effect predicted in H1 will be weaker in categories experiencing high tag distribution density Not Supported
H7b: The effect predicted in H2 will be weaker in categories experiencing high tag distribution density Not Supported
H7c: The effect predicted in H3 will be weaker in categories experiencing high tag distribution density Not Supported
H7d: The effect predicted in H4 will be weaker in categories experiencing high tag distribution density Not Supported

Texas Tech University, Asma Alfadhel, August 2018
62
CHAPTER VI
DISCUSSION
Given that many retail grocery stores have implemented or in the process of
implementing an NST system, it is important to investigate its impact, especially since
these systems add to the costs of the retailer. It is not the concern of this research to
investigate the impact of NST systems on store profitability, but on the purchasing
behavior of consumers of tagged and non-tagged items. As the latter is a main factor for
the implementation such that retailers are racing to show their social responsibility
toward educating and directing consumers to healthier consumptions. This research
investigated the impact of introducing NSTs on product sales comparing the sales of
those tagged products and non-tagged products as well as different type of labels within
the tagged products. Moreover, the role of information load on the impact of NST’s was
investigated through tag distribution density within categories and the number of labels
per held per tag. This investigation was done using scanner data from one store (in a
major city) of a large U.S.-based grocery chain.
Though this research posited that the introduction of NSTs would impact the
purchasing behavior of consumers such that the sales of tagged UPCs would increase
while the sales of the non-tagged UPCs would decrease. This however was partially
supported by the analysis such that the sales of non-tagged UPCs have decreased
significantly while the sales of tagged UPCs have also decreased significantly. These
results suggest that NSTs are ineffective in directing shoppers toward healthier options.
Even with investigating the impact within different types of labels, results showed that all

Texas Tech University, Asma Alfadhel, August 2018
63
types are ineffective. Interestingly, this research, posited that the use of special-diet type
of label is not effective and results supports that.
This research was also the first to address the moderating role of tag distribution
density and number of labels per tag, however, the results showed insignificant effects.
Theoretical Implications
In general, this research adds to the body of knowledge on the impact of nutrition
labels in several ways. First, it investigates the impact of NSTs in real-world setting.
Second, it introduces the comparison between different types of labels. Third, it is the
first to investigate the moderating role of the information load represented by the
distribution density of tags and the number of labels within a tag.
Moreover, to the best of our knowledge, this research is the third among those
investigating the impact of NSTs on sales within the marketing field. Given that this is an
increasingly adopted strategy within grocery retailers, more marketing research on this
topic is warrant. Thus, insights from the present research is an addition to the field.
Practical Implications
This research provides important insight for marketers and public policy makers.
Given that the results showed that the implementation of this NSTs’ system is ineffective,
they should reconsider using this particular system which provide nutrient specific and
holistic evaluative labels. This is important because, these labels add cost with no
benefits. Another option would be to better promote the current system and introduce
periodic educational events.

Texas Tech University, Asma Alfadhel, August 2018
64
As to public policy makers’ quest to finding a solution to the obesity problem and
help consumers improve their diets and wellness, this strategy proved to be ineffective.
Limitations and Future Research
Thought the results of this current research did not support the proposed
hypotheses by showing that the introduction of NSTs in the store does not impact the
sales of neither the tagged or non-tagged products, this research has several limitations.
First, the current analysis is made for only one store, thus running the analysis on several
stores may shed more insight on the robustness of the results. Second, the introduction of
NSTs in this grocery chain was at the same time throughout all the stores which hindered
the use of a control store. Perhaps, using the data from a geographically contiguous
regions during the same period and comparing the same UPCs’ sales would be helpful.
Third, Prior to the introduction of these NSTs, another type of NSTs (i.e. NuVal) was
implemented in March 2010. This prior introduction could be a logical explanation to
why the present NST system did not influence sales. An investigation of pre- and post-
introduction of the prior system is warrant. Fourth, the presence of the different labels
within tags are not mutually exclusive but were systematically categorized into four
groups in this research. This could be tested more accurately within experimental
research. Fifth, the nutrition shelf tags are not the only tags present on the shelves, other
tags of different promotions or information is also present. This affects the actual visual
crowdedness resulting from all tags and thus may have biased the results. Finally, not all
four types of labels were present in all categories, which may have weakened the
comparison.

Texas Tech University, Asma Alfadhel, August 2018
65
An interesting alternative approach to this study is utilizing the data of the loyalty
card program to examine the change in individual shoppers’ purchases across all stores.
This is in addition to sending surveys to inquire about their awareness, motivation and
use of these tags. Another approach is through affinity analysis to discover which type of
labels are more effective in which categories.

Texas Tech University, Asma Alfadhel, August 2018
66
REFERENCES
Andrews, J. C., Burton, S., & Kees, J. (2011). Is simpler always better? Consumer
evaluations of front-of-package nutrition symbols. Journal of Public Policy &
Marketing, 30(2), 175-190.
Andrews, J. C., Lin, C. T. J., Levy, A. S., & Lo, S. (2014). Consumer research needs
from the food and drug administration on front-of-package nutritional labeling.
American Marketing Association.
Andrews, J. C., Netemeyer, R. G., & Burton, S. (2009). The nutrition elite: Do only the
highest levels of caloric knowledge, obesity knowledge, and motivation matter in
processing nutrition ad claims and disclosures? Journal of Public Policy &
Marketing, 28 (Spring), 41-55.
Balasubramanian, S. K., & Cole, C. (2002). Consumers’ search and use of nutrition
information: The challenge and promise of the Nutrition Labeling and Education Act.
Journal of Marketing, 66(3), 112-127.
Barreiro-Hurlé, J., Gracia, A., & De-Magistris, T. (2010). Does nutrition information on
food products lead to healthier food choices? Food Policy, 35(3), 221-229.
Berning, J. P., Chouinard, H. H., Manning, K. C., McCluskey, J. J., & Sprott, D. E.
(2010). Identifying consumer preferences for nutrition information on grocery store
shelf labels. Food Policy, 35(5), 429-436.
Berning, J. P., Chouinard, H. H., & McCluskey, J. J. (2010). Do positive nutrition shelf
labels affect consumer behavior? Findings from a field experiment with scanner data.
American Journal of Agricultural Economics, 93(2), 364-369.
Bettman, James R. (1979), An Information Processing Theory of Consumer Choice,
Reading, MA: Addison-Wesley
Bettman, J. R., Luce, M. F., & Payne, J. W. (1998). Constructive consumer choice
processes.” Journal of Consumer Research, 25(3), 187-217.
Bialkova, S., & van Trijp, H. C. (2011). An efficient methodology for assessing attention
to and effect of nutrition information displayed front-of-pack. Food Quality and
Preference, 22(6), 592-601.

Texas Tech University, Asma Alfadhel, August 2018
67
Bialkova, S., Grunert, K. G., & van Trijp, H. (2013). Standing out in the crowd: The
effect of information clutter on consumer attention for front-of-pack nutrition labels.
Food Policy, 41, 65-74.
Bix, L., Sundar, R. P., Bello, N. M., Peltier, C., Weatherspoon, L. J., & Becker, M. W.
(2015). To see or not to see: Do front of pack nutrition labels affect attention to
overall nutrition information? PloS One, 10(10), e0139732.
Borra, S. (2017). Food retailers: A trusted health and wellness partner. Retrieved from
https://www.fmi.org/blog/view/fmi-blog/2017/01/04/food-retailers-a-trusted-health-
and-wellness-partner
Burton, S., Garretson, J. A., & Velliquette, A. M. (1999). Implications of accurate usage
of nutrition facts panel information for food product evaluations and purchase
intentions. Journal of the Academy of Marketing Science, 27(4), 470-480.
Cawley, J., Sweeney, M. J., Sobal, J., Just, D. R., Kaiser, H. M., Schulze, W. D., … &
Wansink, B. (2015). The impact of a supermarket nutrition rating system on
purchases of nutritious and less nutritious foods. Public Health Nutrition, 18(1), 8-14.
Chaiken, S. (1980). Heuristic versus systematic information processing and the use of
source versus message cues in persuasion. Journal of Personality and Social
Psychology, 39(5), 752.
Elshiewy, O., & Boztug, Y. (2017). When back-of-pack meets front-of-pack: How salient
and simplified nutrition labels affect food sales in supermarkets. Journal of Public
Policy & Marketing, 37(1), 55-67.
Eppler, M. J., & Mengis, J. (2004). The concept of information overload: A review of
literature from organization science, accounting, marketing, MIS, and related
disciplines. The Information Society, 20(5), 325–344.
Federal Register (2010). Front-of-pack and shelf tag nutrition symbols; Establishment of
docket: Request for comments and information, 75(82), April 29, US Department of
Health & Human Services, Food & Drug Administration, 22602-22606.
Fischer, L. M., Sutherland, L. A., Kaley, L. A., Fox, T. A., Hasler, C. M., Nobel, J., … &
Blumberg, J. (2011). Development and implementation of the Guiding Stars nutrition
guidance program. American Journal of Health Promotion, 26(2), e55-e63.
Fitzsimons, G. M., Chartrand, T. L., & Fitzsimons, G. J. (2008). Automatic effects of
brand exposure on motivated behavior: how Apple makes you “think different..”
Journal of Consumer Research, 35(1), 21-35.

Texas Tech University, Asma Alfadhel, August 2018
68
FMI. (2014). Shopping for health: Mirroring healthy eating strategies at retail. Retrieved
from https://www.fmi.org/blog/view/fmi-blog/2014/06/26/shopping-for-health-
mirroring-healthy-eating-strategies-at-retail
FMI. (2017). The food retailing industry speaks. Retrieved from
https://www.fmi.org/our-research/research-reports/food-retailing-industry-speaks
Freedman, M. R., & Connors, R. (2011). Point-of-purchase nutrition information
influences food-purchasing behaviors of college students: A pilot study. Journal of
the American Dietetic Association, 111(5), S42-S46.
Graham, D. J., & Jeffery, R. W. (2011). Location, location, location: Eye-tracking
evidence that consumers preferentially view prominently positioned nutrition
information. Journal of the American Dietetic Association, 111(11), 1704-1711.
Hawley, K. L., Roberto, C. A., Bragg, M. A., Liu, P. J., Schwartz, M. B., & Brownell, K.
D. (2013). The science on front-of-package food labels. Public Health Nutrition,
16(3), 430-439.
Heilman, C. M., Nakamoto, K., & Rao, A. G. (2002). Pleasant surprises: Consumer
response to unexpected in-store coupons. Journal of Marketing Research, 39(2), 242-
252.
Hendrick, C., Mills, J., & Kiesler, C. A. (1968). Decision time as a function of the
number and complexity of equally attractive alternatives. Journal of Personality and
Social Psychology, 8(3p1), 313.
Hersey, J. C., Wohlgenant, K. C., Arsenault, J. E., Kosa, K. M., & Muth, M. K. (2013).
Effects of front‐of‐package and shelf nutrition labeling systems on consumers.
Nutrition Reviews, 71(1), 1-14.
Hobin, E., Bollinger, B., Sacco, J., Liebman, E., Vanderlee, L., Zuo, F., & Hammond, D.
(2017). Consumers’ response to an on‐shelf nutrition labelling system in
supermarkets: Evidence to inform policy and practice. Milbank Quarterly, 95(3), 494-
534.
Hunt, M. K., Lefebvre, R. C., Hixson, M. L., Banspach, S. W., Assaf, A. R., & Carleton,
R. A. (1990). Pawtucket Heart Health Program point-of-purchase nutrition education
program in supermarkets. American Journal of Public Health, 80(6), 730-732.
Institute of Medicine et al. (2012). Front-of-package nutrition rating systems and
symbols: Promoting healthier choices. Washington, DC: National Academies Press.

Texas Tech University, Asma Alfadhel, August 2018
69
Jacoby, J. (1984). Perspectives on information overload. Journal of Consumer
Research, 10(4), 432–435.
Jacoby, J., Speller, D. E., & Berning, C. K. (1974). Brand choice behavior as a function
of information load: Replication and extension. Journal of Consumer Research, 1(1),
33–42.
Jacoby, J., Jaccard, J. J., Currim, I., Kuss, A., Ansari, A., & Troutman, T. (1994). Tracing
the impact of item-by-item information accessing on uncertainty reduction. Journal of
Consumer Research, 21(2), 291-303.
Keller, S. B., Landry, M., Olson, J., Velliquette, A. M., Burton, S., & Andrews, J. C.
(1997). The effects of nutrition package claims, nutrition facts panels, and motivation
to process nutrition information on consumer product evaluations. Journal of Public
Policy & Marketing, 16(2), 256-269.
Kleef, E. V., & Dagevos, H. (2015). The growing role of front-of-pack nutrition profile
labeling: A consumer perspective on key issues and controversies. Critical Reviews in
Food Science and Nutrition, 55(3), 291-303.
Lang, J. E., Mercer, N., Tran, D., & Mosca, L. (2000). Use of a supermarket shelf-
labeling program to educate a predominately minority community about foods that
promote heart health. Journal of the American Dietetic Association, 100(7), 804-809.
Levy, A. S., & Fein, S. B. (1998). Consumers’ ability to perform tasks using nutrition
labels. Journal of Nutrition Education, 30(4), 210-217.
Levy, A. S., Mathews, O., Stephenson, M., Tenney, J. E., & Schucker, R. E. (1985). The
impact of a nutrition information program on food purchases. Journal of Public
Policy & Marketing, 4, 1-13.
Malhotra, N. K. (1982). Information load and consumer decision making. Journal of
Consumer Research, 8(4), 419–430.
Malhotra, N. K., Jain, A. K., & Lagakos, S. W. (1982). The information overload
controversy: An alternative viewpoint. Journal of Marketing, 46(2), 27–37.
Miller, L. M. S., & Cassady, D. L. (2015). The effects of nutrition knowledge on food
label use: A review of the literature. Appetite, 92, 207-216.
Moorman, C. (1996). A quasi experiment to assess the consumer and informational
determinants of nutrition information processing activities: The case of the Nutrition
Labeling and Education Act. Journal of Public Policy & Marketing, 15(1), 28-44.

Texas Tech University, Asma Alfadhel, August 2018
70
Muller, T. E. (1985). Structural information factors which stimulate the use of nutrition
information: A field experiment. Journal of Marketing Research, 22(2), 143-157.
Nathan, R., Yaktine, A., Lichtenstein, A. H., & Wartella, E. A. (Eds.). (2012a). Front-of-
package nutrition rating systems and symbols: promoting healthier choices –
Chapter6. National Academies Press.
Nathan, R., Yaktine, A., Lichtenstein, A. H., & Wartella, E. A. (Eds.). (2012b). Front-of-
package nutrition rating systems and symbols: promoting healthier choices –
Chapter5. National Academies Press.
Newman, C. L., Howlett, E., & Burton, S. (2014). Shopper response to front-of-package
nutrition labeling programs: Potential consumer and retail store benefits. Journal of
Retailing, 90(1), 13-26.
Newman, C. L., Howlett, E., & Burton, S. (2015). Effects of objective and evaluative
front-of-package cues on food evaluation and choice: The moderating influence of
comparative and noncomparative processing contexts. Journal of Consumer
Research, 42(5), 749-766.
Nikolova, H, & Inman, J. (2015). Healthy choice: The effect of simplified point-of-sale
nutritional information on consumer food choice behavior. Journal of Marketing
Research, 52(6), 817-835.
Orth, U. R., & Crouch, R. C. (2014). Is beauty in the aisles of the retailer? Package
processing in visually complex contexts. Journal of Retailing, 90(4), 524-537.
Orth, U. R., & Wirtz, J. (2014). Consumer processing of interior service environments:
the interplay among visual complexity, processing fluency, and
attractiveness. Journal of Service Research, 17(3), 296-309.
Park, C. W., Iyer, E. S., & Smith, D. C. (1989). The effects of situational factors on in-
store grocery shopping behavior: The role of store environment and time available for
shopping. Journal of Consumer Research, 15(4), 422-433.
Roberto, C. A., Shivaram, M., Martinez, O., Boles, C., Harris, J. L., & Brownell, K. D.
(2012). The Smart Choices front-of-package nutrition label: Influence on perceptions
and intake of cereal. Appetite, 58(2), 651-657.
Roe, B., Levy, A. S., & Derby, B. M. (1999). The impact of health claims on consumer
search and product evaluation outcomes: Results from FDA experimental data.
Journal of Public Policy & Marketing, 18(1), 89-105.

Texas Tech University, Asma Alfadhel, August 2018
71
Russo, J. E. (1974). More information is better: A reevaluation of Jacoby, Speller and
Kohn. Journal of Consumer Research, 1(3), 68–72.
Russo, J. E., Staelin, R., Nolan, C. A., Russell, G. J., & Metcalf, B. L. (1986). Nutrition
information in the supermarket. Journal of Consumer Research, 13(1), 48-70.
Schucker, R. E., Levy, A. S., Tenney, J. E., & Mathews, O. (1992). Nutrition shelf-
labeling and consumer purchase behavior. Journal of Nutrition Education, 24(2), 75-
81.
Sciandra, M. R., Lamberton, C., & Reczek, R. W. (2017). The wisdom of some: Do we
always need high consensus to shape consumer behavior? Journal of Public Policy &
Marketing, 36(1), 15-35.
Shankar, V., Inman, J. J., Mantrala, M., Kelley, E., & Rizley, R. (2011). Innovations in
shopper marketing: Current insights and future research issues. Journal of Retailing,
87, S29-S42.
Steenhuis, I. H. M., Kroeze, W., Vyth, E. L., Valk, S., Verbauwen, R., & Seidell, J. C.
(2010). The effects of using a nutrition logo on consumption and product evaluation
of a sweet pastry. Appetite, 55(3), 707-709.
Sutherland, L. A., Kaley, L. A., & Fischer, L. (2010). Guiding Stars: The effect of a
nutrition navigation program on consumer purchases at the supermarket. The
American Journal of Clinical Nutrition, 91(4), 1090S-1094S.
Szykman, L. R., Bloom, P. N., & Levy, A. S. (1997). A proposed model of the use of
package claims and nutrition labels. Journal of Public Policy & Marketing, 16(2),
228-241.
Talati, Z., Pettigrew, S., Dixon, H., Neal, B., Ball, K., & Hughes, C. (2016). Do health
claims and front-of-pack labels lead to a positivity bias in unhealthy foods? Nutrients,
8(12), 787.
Teisl, M. F., & Levy, A. S. (1997). Does nutrition labeling lead to healthier eating?
Journal of Food Distribution Research, 28, 18-27.
Turner, M. M., Skubisz, C., Pandya, S. P., Silverman, M., & Austin, L. L. (2014).
Predicting visual attention to nutrition information on food products: The influence of
motivation and ability. Journal of Health Communication, 19(9), 1017-1029.

Texas Tech University, Asma Alfadhel, August 2018
72
Weingarten, H. (2013). A history of what is required on food labels and the nutrition facts
panel. Retrieved from http://www.eatingwell.com/article/278358/a-history-of-what-
is-required-on-food-labels-and-the-nutrition-facts-panel/
Villas-Boas, J. M., & Winer, R. S. (1999). Endogeneity in brand choice
models. Management science, 45(10), 1324-1338.
Visschers, V. H., Hess, R., & Siegrist, M. (2010). Health motivation and product design
determine consumers’ visual attention to nutrition information on food products.
Public Health Nutrition, 13(7), 1099-1106.
Viswanathan, M., & Hastak, M. (2002). The role of summary information in facilitating
consumers’ comprehension of nutrition information. Journal of Public Policy &
Marketing, 21(2), 305-318.