Embed Size (px)
Citation preview
NUTRITION OF WOMEN AND CHILDREN IN TANZANIA
Theobald C.E. Mosha; Ph.D.
SOKOINE UNIVERSITY OF AGRICULTURE

BACKGROUND
• Tanzania is one of the countries in East Africa.
• It has a land area of 945,087 sqkm of which 886,039 sqkm is dry land and 59,048 sqkm is water body
• It has a population of 44,929,002.
• 47% of the household members are children less than 15 years
Background
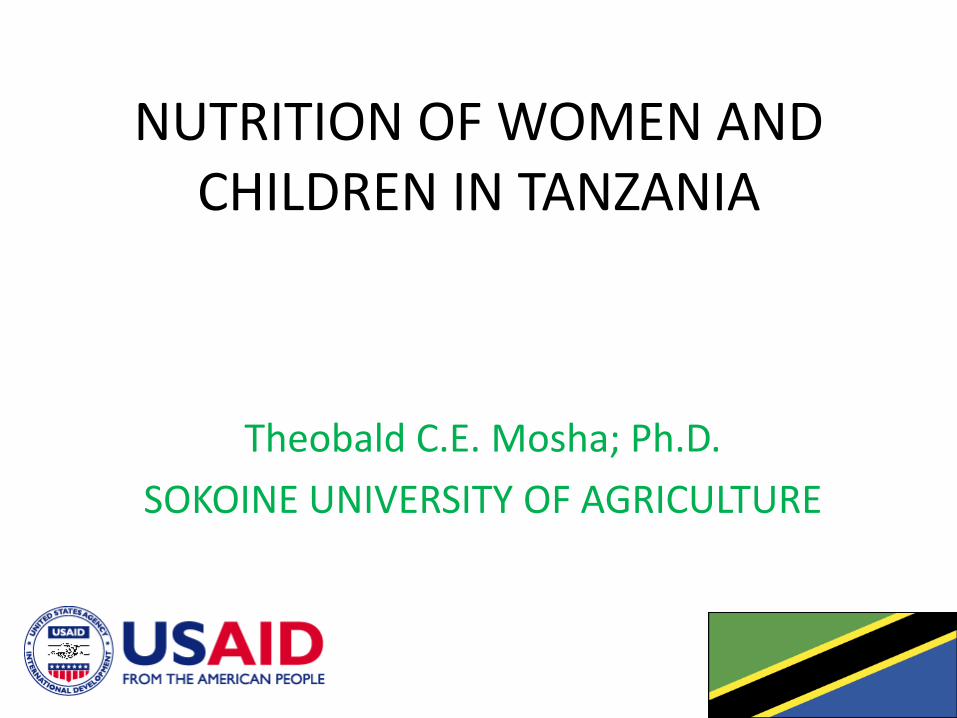
• Average household size is 5 people
• Literacy level:
--- Men – 82%, and Women: 72%
• Secondary education
--- Men – 23%, and Women: 16%
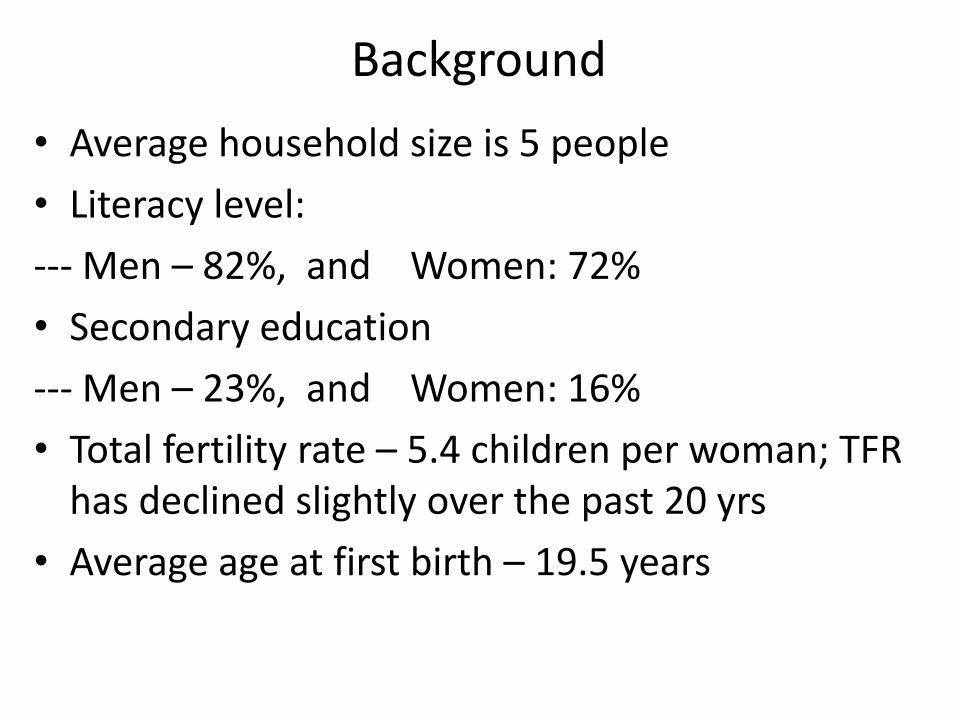
• Total fertility rate – 5.4 children per woman; TFR has declined slightly over the past 20 yrs
• Average age at first birth – 19.5 years
Trends in Fertility TFR for women age 15-49 for the 3-year period before the survey

Tanzania 5.4
Zanzibar 5.1
Northern 4.6
Central 6.5
Western 7.1
Southern Highlands 5.4
Eastern 3.9
Southern 4.4
Lake 6.3
Fertility by Zone
TFR for women age 15-49 for the 3-year period before the survey

Background
• Infant Mortality rate = 51 per 1000 live births
• Under-five mortality rate = 81 per 1000 live births
• Neonatal mortality rate = 26 per 1000 live births
• Life expectancy = 53.14 years
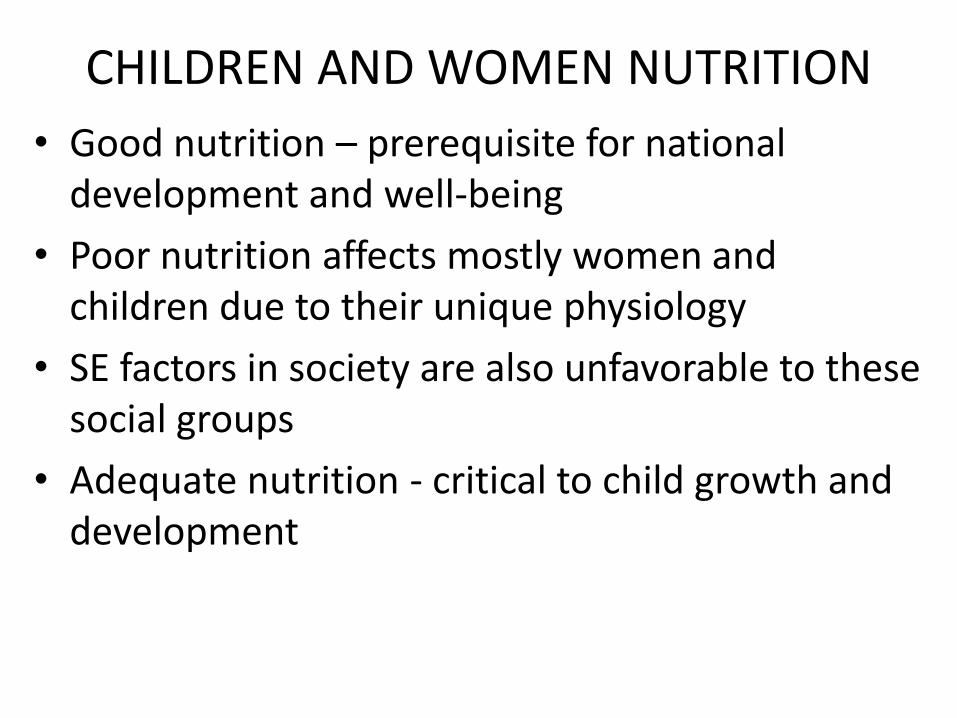
CHILDREN AND WOMEN NUTRITION
• Good nutrition – prerequisite for national development and well-being
• Poor nutrition affects mostly women and children due to their unique physiology
• SE factors in society are also unfavorable to these social groups
• Adequate nutrition - critical to child growth and development
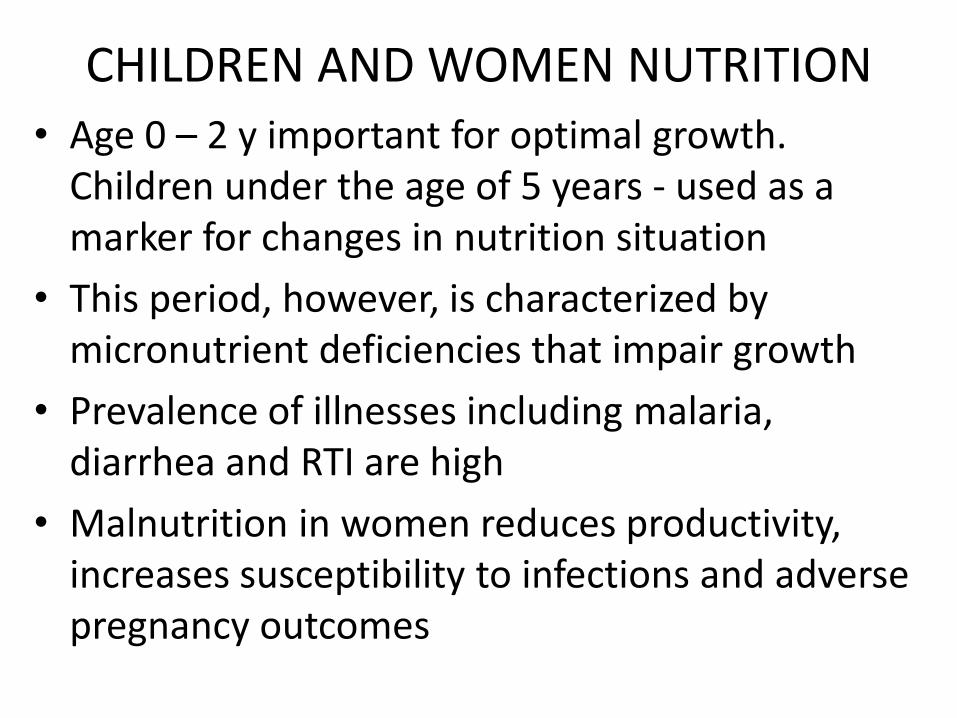
CHILDREN AND WOMEN NUTRITION
• Age 0 – 2 y important for optimal growth. Children under the age of 5 years - used as a marker for changes in nutrition situation
• This period, however, is characterized by micronutrient deficiencies that impair growth
• Prevalence of illnesses including malaria, diarrhea and RTI are high
• Malnutrition in women reduces productivity, increases susceptibility to infections and adverse pregnancy outcomes

Nutrition situation of children in TZ
• Stunting – low height relative to age
• Prevalence of stunting = 42%
---Highest prevalence (55%) = 18 – 23 mo children
--- Lowest prevalence (18%) = < 6 mo children
• Stunting by sex:
--- Boys = 46%
--- Girls = 39%
• Stunting by Residence
--- Rural areas = 45%
--- Urban areas = 32%

Nutrition situation of children in TZ
• Stunting by region
--- 4 regions had levels exceeding 50%
1. Dodoma = 56%
2. Lindi = 54
3. Iringa = 52%
4. Rukwa = 50%
---- 2 regions had levels below 20%
1. Zanzibar urban = 20%
2. Dar es Salaam = 19%
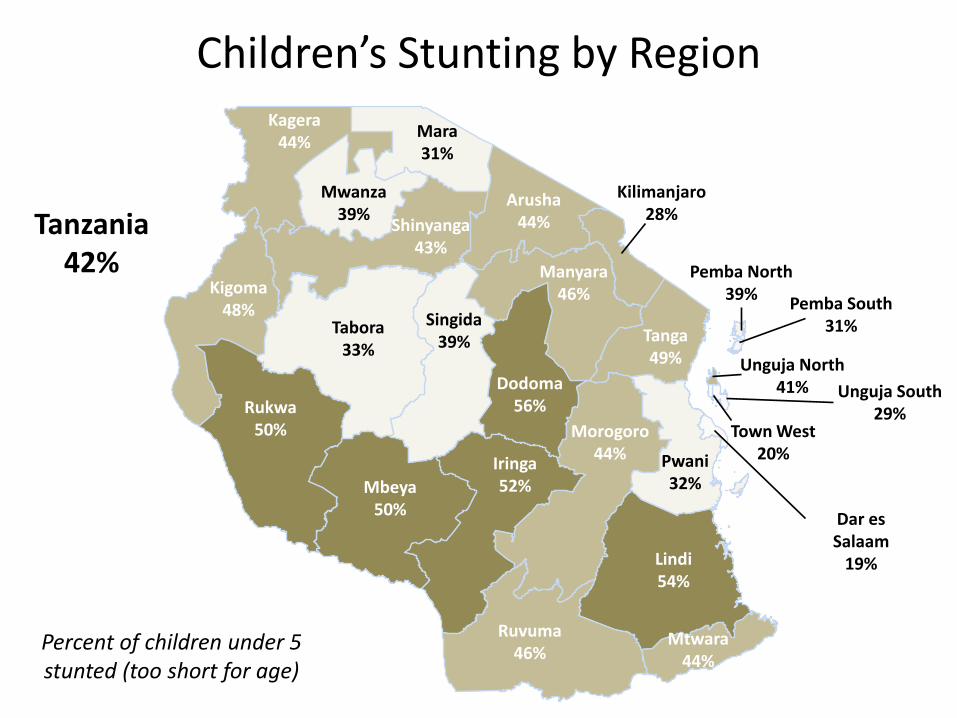
Children’s Stunting by Region
Percent of children under 5 stunted (too short for age)
Tanzania 42%
Kagera 44%
Mwanza 39%
Mara 31%
Arusha 44%
Manyara 46%
Tanga 49%
Kilimanjaro 28%
Pwani 32%
Morogoro 44%
Dodoma 56%
Singida 39%
Tabora 33%
Shinyanga 43%
Kigoma 48%
Rukwa 50%
Mbeya 50%
Iringa 52%
Ruvuma 46%
Mtwara 44%
Lindi 54%
Dar es Salaam
19%
Pemba North 39%
Pemba South 31%
Town West 20%
Unguja North 41% Unguja South
29%
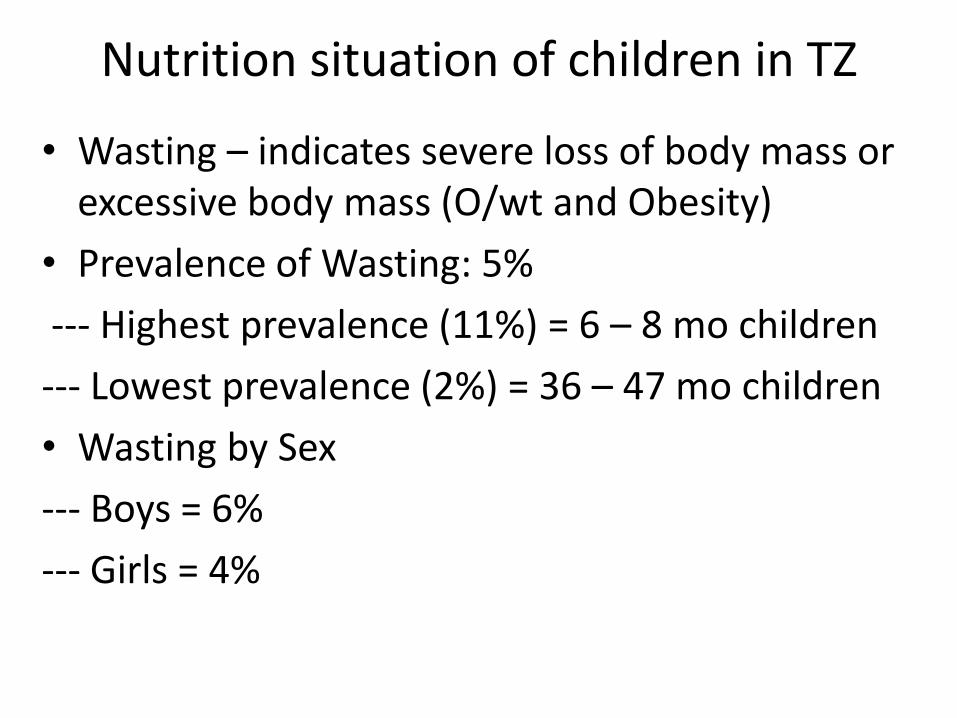
Nutrition situation of children in TZ
• Wasting – indicates severe loss of body mass or excessive body mass (O/wt and Obesity)
• Prevalence of Wasting: 5%
--- Highest prevalence (11%) = 6 – 8 mo children
--- Lowest prevalence (2%) = 36 – 47 mo children
• Wasting by Sex
--- Boys = 6%
--- Girls = 4%
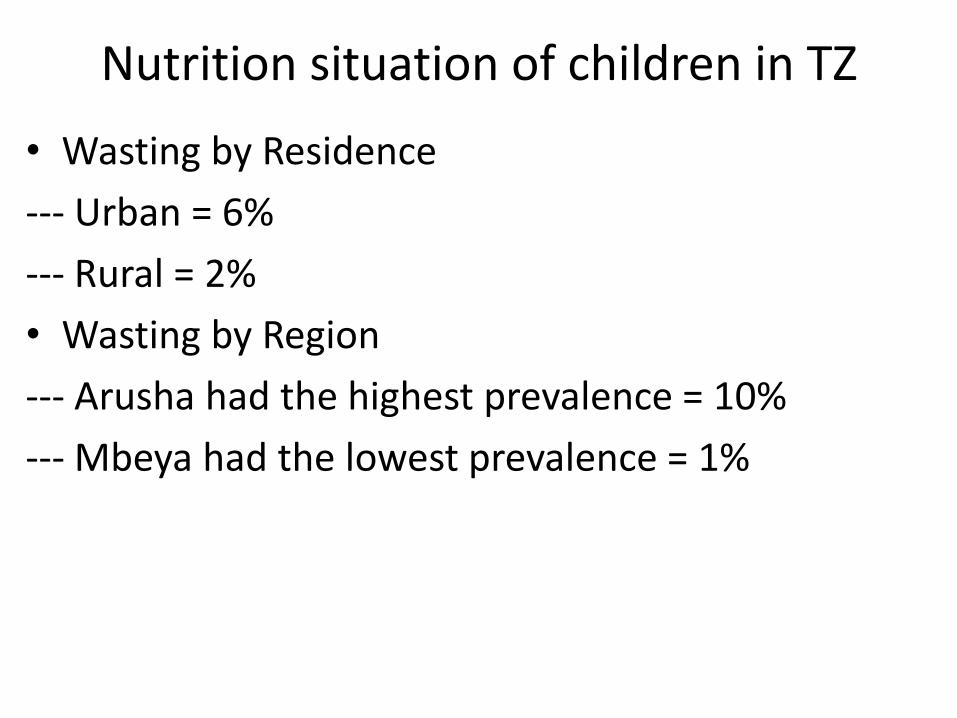
Nutrition situation of children in TZ
• Wasting by Residence
--- Urban = 6%
--- Rural = 2%
• Wasting by Region
--- Arusha had the highest prevalence = 10%
--- Mbeya had the lowest prevalence = 1%
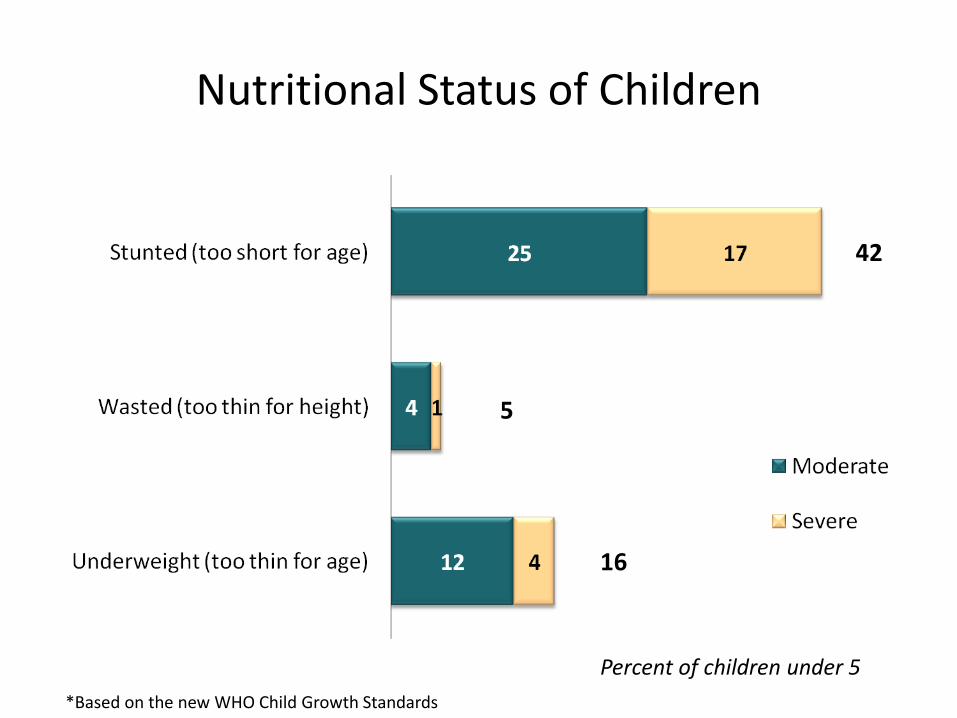
Nutritional Status of Children
Percent of children under 5
5
16
42
*Based on the new WHO Child Growth Standards
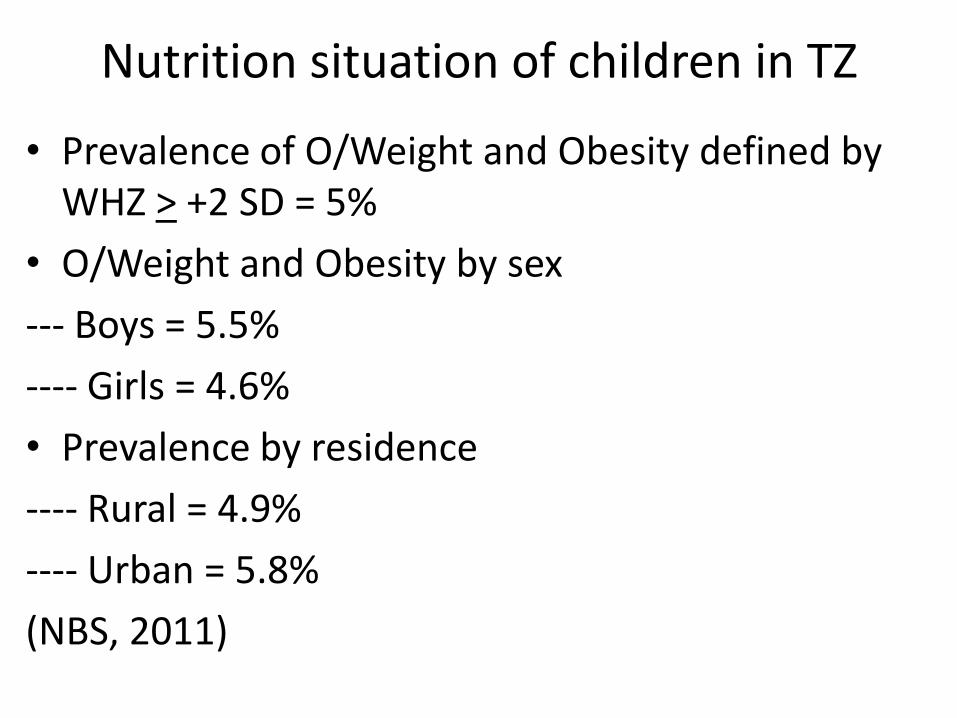
Nutrition situation of children in TZ
• Prevalence of O/Weight and Obesity defined by WHZ > +2 SD = 5%
• O/Weight and Obesity by sex
--- Boys = 5.5%
---- Girls = 4.6%
• Prevalence by residence
---- Rural = 4.9%
---- Urban = 5.8%
(NBS, 2011)
Nutrition situation of children in TZ
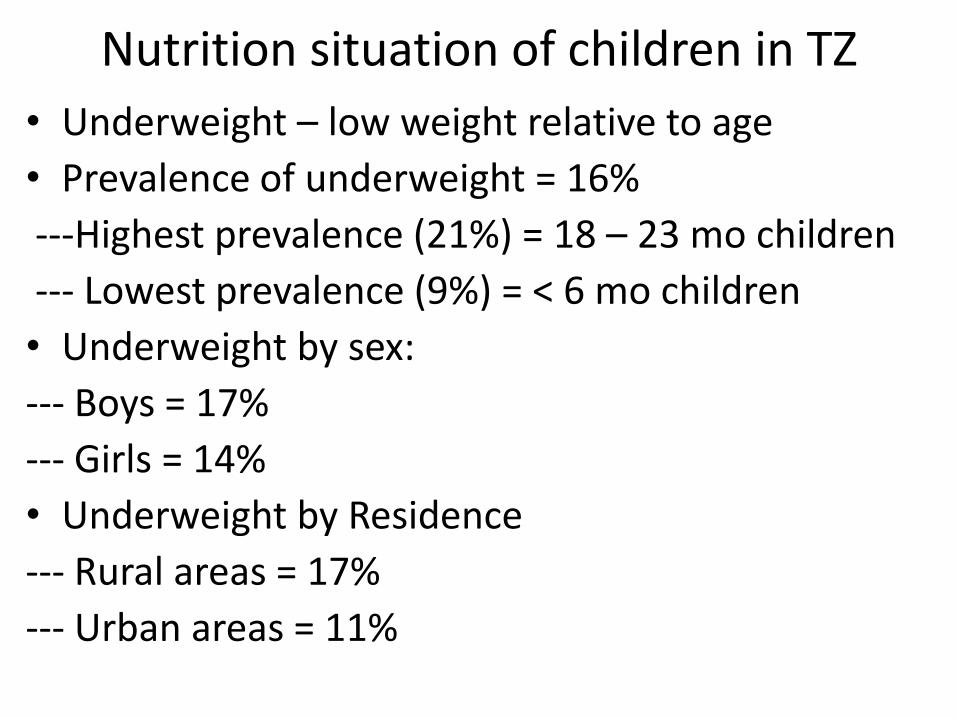
• Underweight – low weight relative to age
• Prevalence of underweight = 16%
---Highest prevalence (21%) = 18 – 23 mo children
--- Lowest prevalence (9%) = < 6 mo children
• Underweight by sex:
--- Boys = 17%
--- Girls = 14%
• Underweight by Residence
--- Rural areas = 17%
--- Urban areas = 11%
Nutrition situation of children in TZ
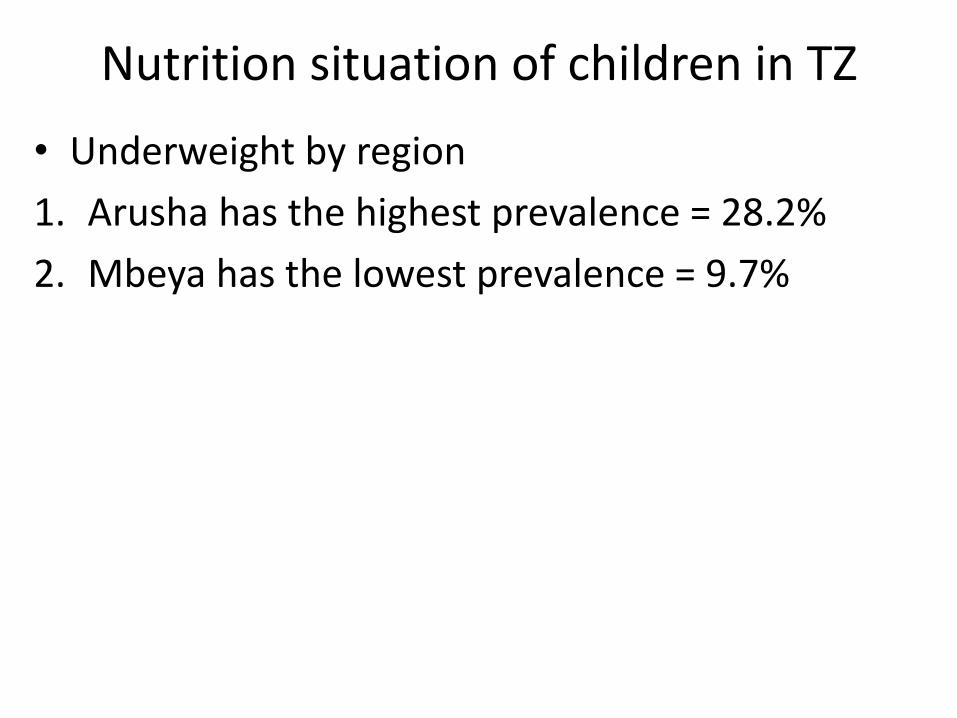
• Underweight by region
1. Arusha has the highest prevalence = 28.2%
2. Mbeya has the lowest prevalence = 9.7%

Nutrition situation of children in TZ
• Anemia – characterized by low levels of Hb in blood
• Major public health problem in TZ among children and pregnant women
• Cause – inadequate intake of iron, folate, Vit B12
• Enhanced by malaria, parasitic infection and sickle cell diseases
Nutrition situation of children in TZ
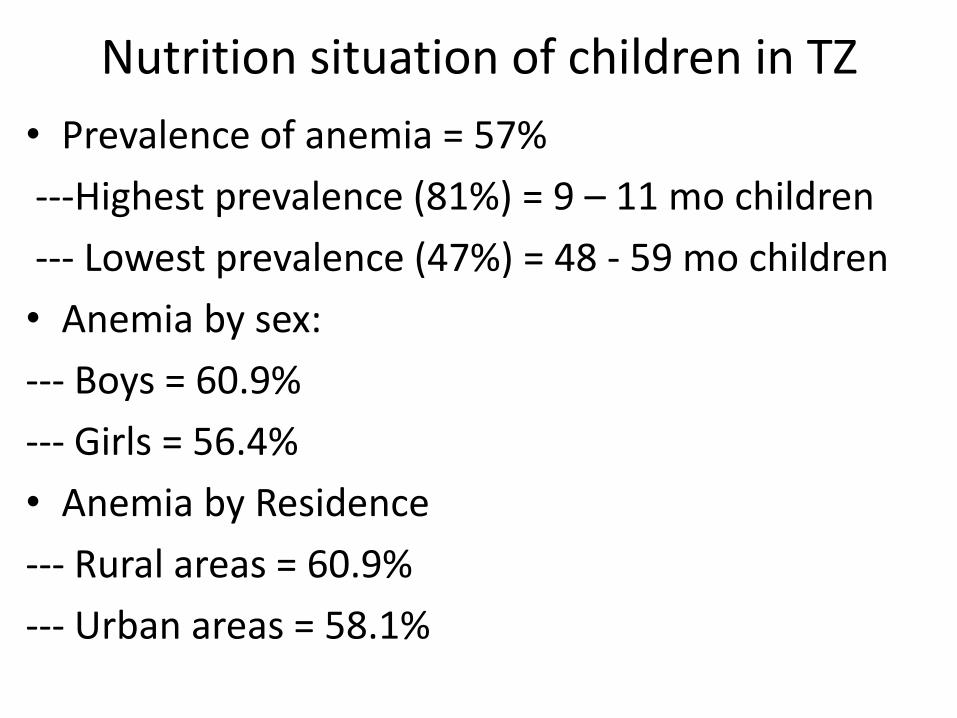
• Prevalence of anemia = 57%
---Highest prevalence (81%) = 9 – 11 mo children
--- Lowest prevalence (47%) = 48 - 59 mo children
• Anemia by sex:
--- Boys = 60.9%
--- Girls = 56.4%
• Anemia by Residence
--- Rural areas = 60.9%
--- Urban areas = 58.1%

Anaemia in Children
Percentage of children age 6-59 classified as having anaemia
Nutrition situation of children in TZ
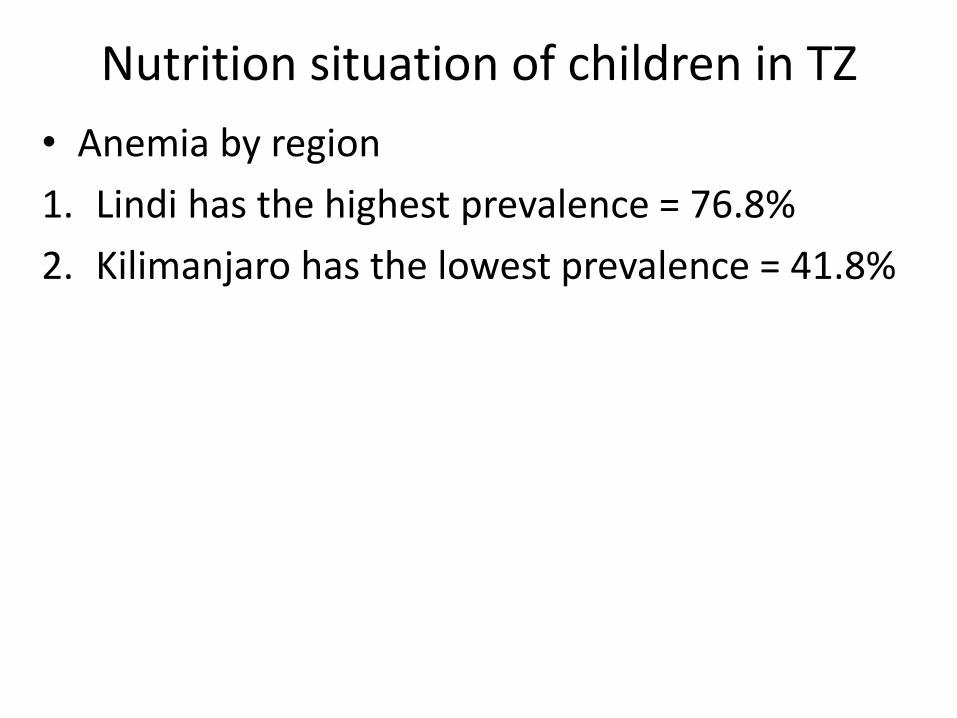
• Anemia by region
1. Lindi has the highest prevalence = 76.8%
2. Kilimanjaro has the lowest prevalence = 41.8%
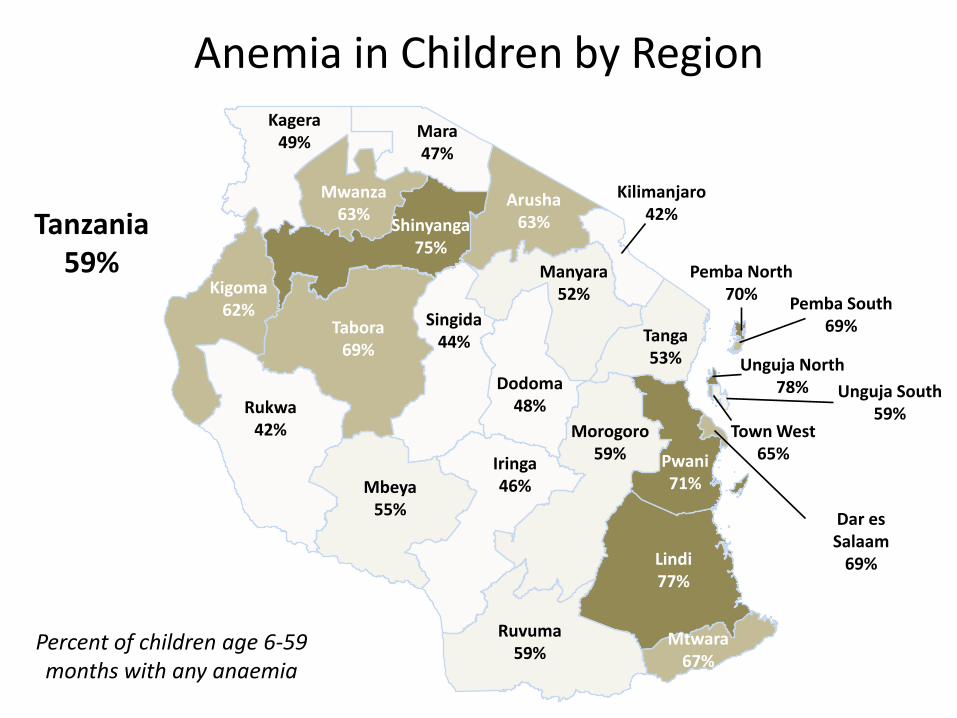
Anemia in Children by Region
Percent of children age 6-59 months with any anaemia
Tanzania 59%
Kagera 49%
Mwanza 63%
Mara 47%
Arusha 63%
Manyara 52%
Tanga 53%
Kilimanjaro 42%
Pwani 71%
Morogoro 59%
Dodoma 48%
Singida 44%
Tabora 69%
Shinyanga 75%
Kigoma 62%
Rukwa 42%
Mbeya 55%
Iringa 46%
Ruvuma 59%
Mtwara 67%
Lindi 77%
Dar es Salaam
69%
Pemba North 70%
Pemba South 69%
Town West 65%
Unguja North 78% Unguja South
59%
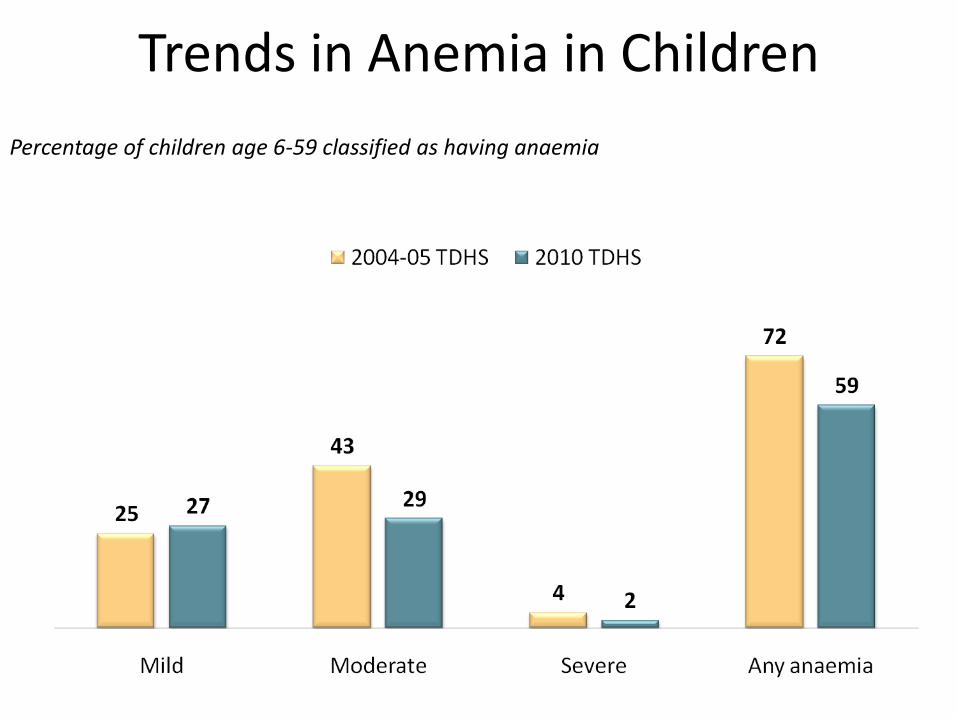
Trends in Anemia in Children
Percentage of children age 6-59 classified as having anaemia
Nutrition Situation of Women in TZ
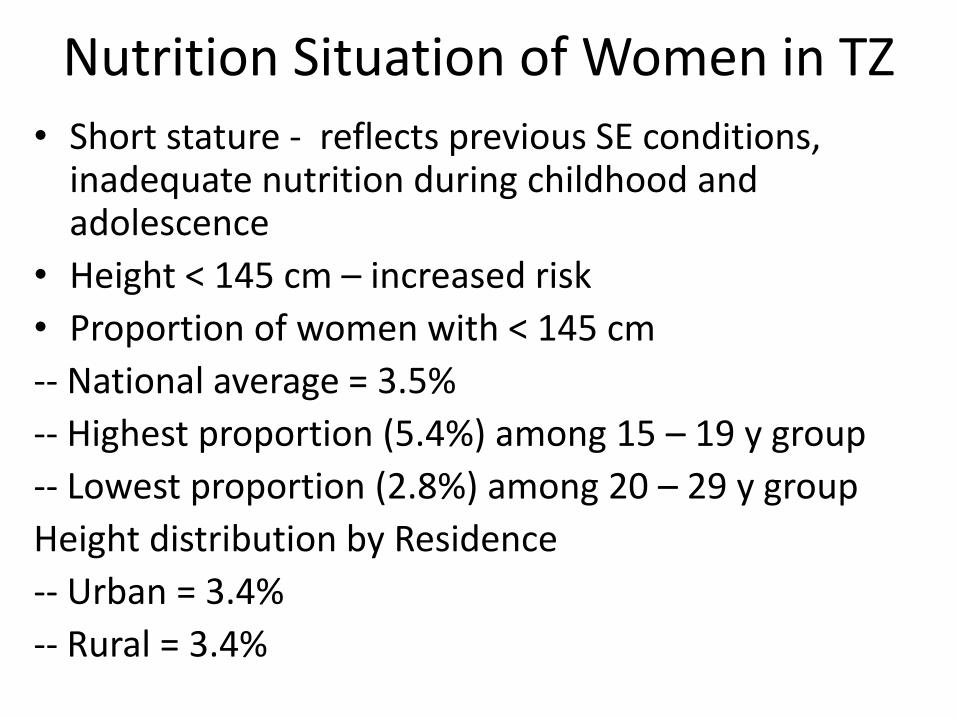
• Short stature - reflects previous SE conditions, inadequate nutrition during childhood and adolescence
• Height < 145 cm – increased risk
• Proportion of women with < 145 cm
-- National average = 3.5%
-- Highest proportion (5.4%) among 15 – 19 y group
-- Lowest proportion (2.8%) among 20 – 29 y group
Height distribution by Residence
-- Urban = 3.4%
-- Rural = 3.4%

Nutrition Situation of Women in TZ
• Distribution of heights by region
-- Highest proportion (11%) of women with height < 145 cm = Mtwara region
-- Lowest proportion (1%) of women with height < 145 cm = Arusha, Mara and Shinyanga regions
Nutrition Situation of Women in TZ
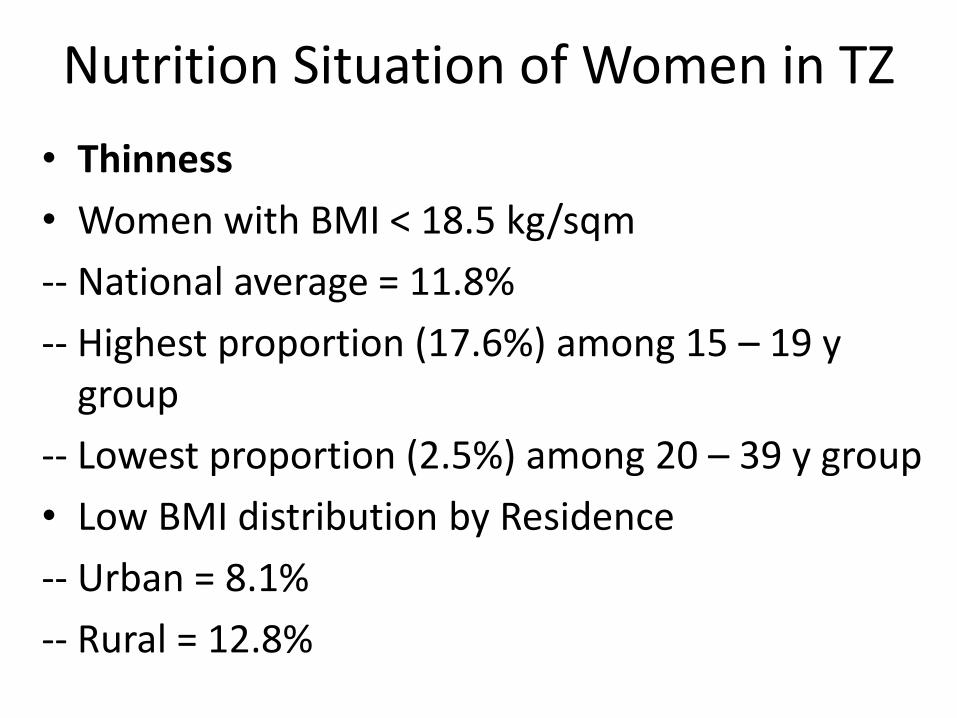
• Thinness
• Women with BMI < 18.5 kg/sqm
-- National average = 11.8%
-- Highest proportion (17.6%) among 15 – 19 y group
-- Lowest proportion (2.5%) among 20 – 39 y group
• Low BMI distribution by Residence
-- Urban = 8.1%
-- Rural = 12.8%
Nutrition Situation of Women in TZ
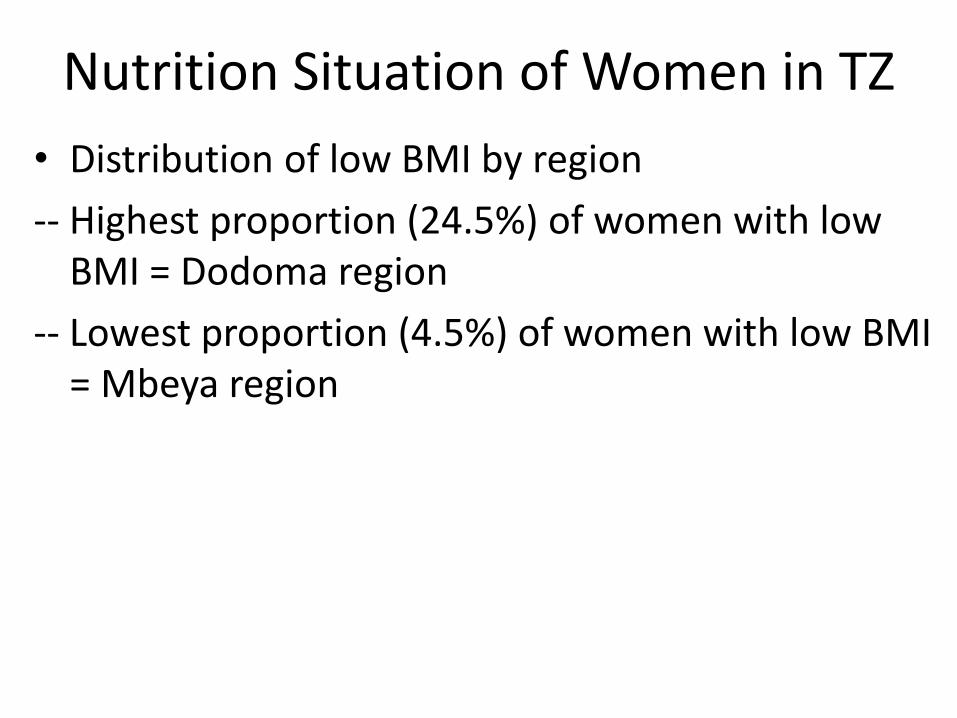
• Distribution of low BMI by region
-- Highest proportion (24.5%) of women with low BMI = Dodoma region
-- Lowest proportion (4.5%) of women with low BMI = Mbeya region
Nutrition Situation of Women in TZ
• Overweight and Obesity
• Women with BMI > 25 kg/sqm
-- National prevalence = 21.6%
-- Highest prevalence (29.3%) among 30 – 39 y group
-- Lowest prevalence (9.1%) among 15 – 19 y group
• Overweight/Obese by Residence
-- Urban = 36.3%
-- Rural = 15.2%
Nutrition Situation of Women in TZ
• Prevalence of Overweight/Obesity by region
-- Highest prevalence (44.6%) = Dar es Salaam region
-- Lowest prevalence (9.5%) = Dodoma region

Nutritional Status of Women
Percent of women 15-49 by nutritional status

Nutrition Situation of Women in TZ • Anemia Prevalence
• Women with Hb < 12 g/dL (non pregnant) and Hb < 11 g/dL (pregnant women)
• National prevalence = 40%
-- Highest prevalence (42.2%) among 15 – 19 y group
-- Lowest prevalence (38.8%) among 30 – 39 y group
• Anemia distribution by Residence
-- Urban = 43.5%
-- Rural = 38.8%
Nutrition Situation of Women in TZ
• Prevalence of anemia by region
-- Highest prevalence (64.2%) = North Pemba region
-- Lowest prevalence (17.9%) = Kilimanjaro region
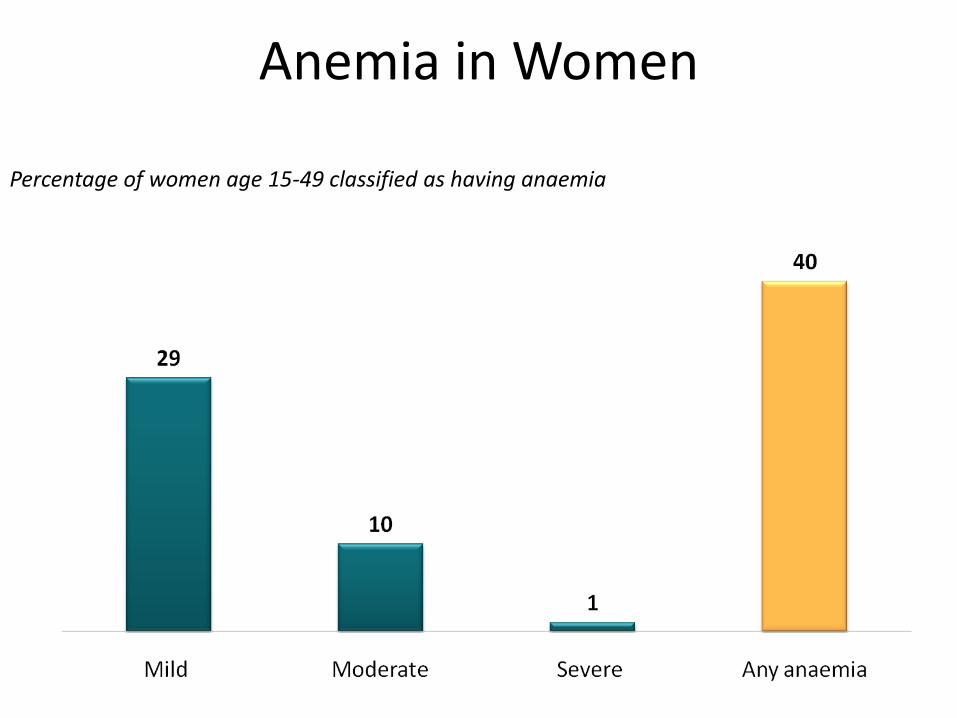
Anemia in Women
Percentage of women age 15-49 classified as having anaemia
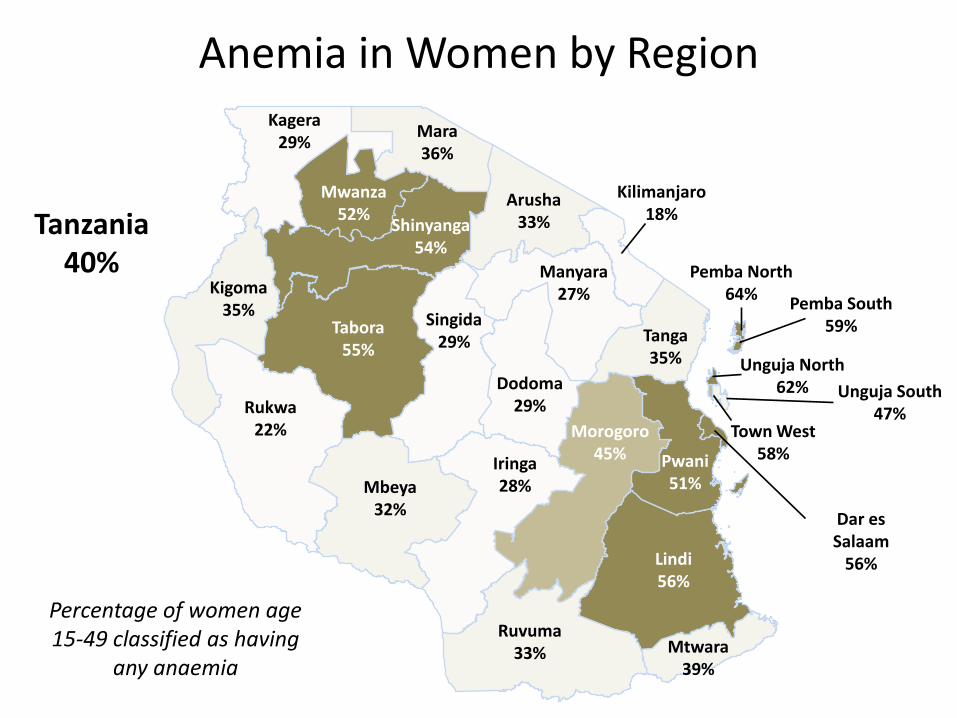
Anemia in Women by Region
Tanzania 40%
Kagera 29%
Mwanza 52%
Mara 36%
Arusha 33%
Manyara 27%
Tanga 35%
Kilimanjaro 18%
Pwani 51%
Morogoro 45%
Dodoma 29%
Singida 29%
Tabora 55%
Shinyanga 54%
Kigoma 35%
Rukwa 22%
Mbeya 32%
Iringa 28%
Ruvuma 33% Mtwara
39%
Lindi 56%
Dar es Salaam
56%
Pemba North 64%
Pemba South 59%
Town West 58%
Unguja North 62% Unguja South
47%
Percentage of women age 15-49 classified as having
any anaemia

Trends in Anemia in Women
Percentage of women age 15-49 classified as having anaemia
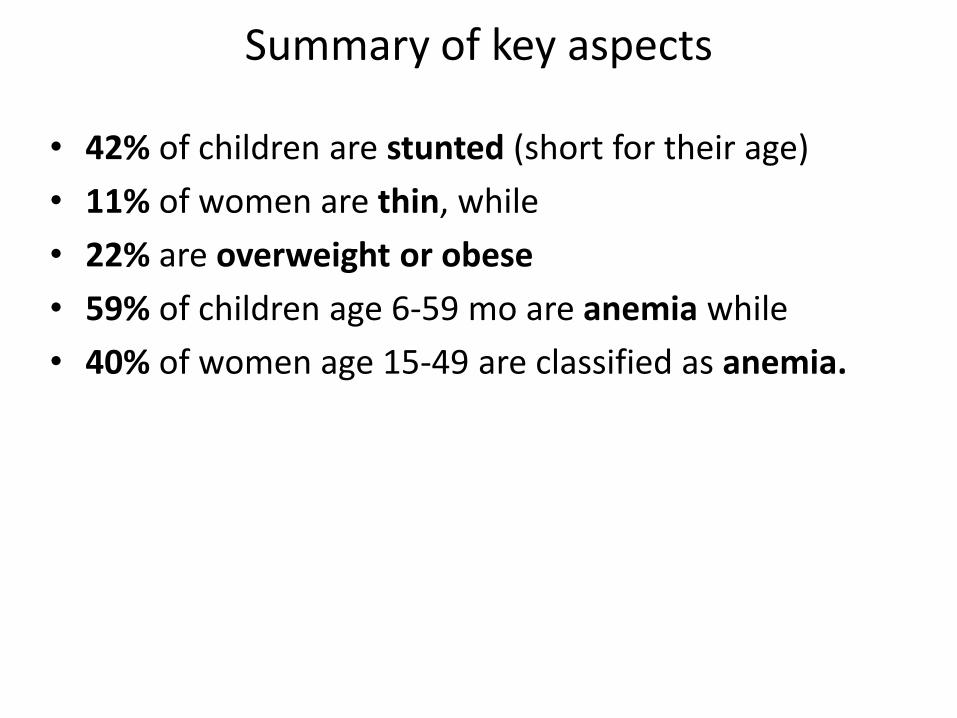
Summary of key aspects
• 42% of children are stunted (short for their age)
• 11% of women are thin, while
• 22% are overweight or obese
• 59% of children age 6-59 mo are anemia while
• 40% of women age 15-49 are classified as anemia.
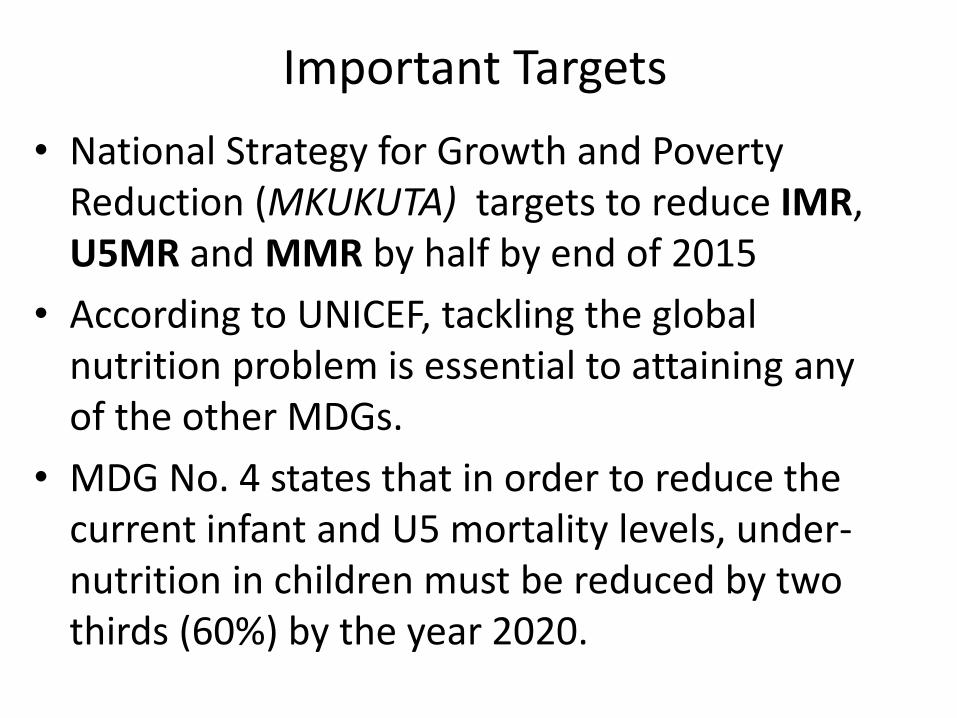
Important Targets
• National Strategy for Growth and Poverty Reduction (MKUKUTA) targets to reduce IMR, U5MR and MMR by half by end of 2015
• According to UNICEF, tackling the global nutrition problem is essential to attaining any of the other MDGs.
• MDG No. 4 states that in order to reduce the current infant and U5 mortality levels, under-nutrition in children must be reduced by two thirds (60%) by the year 2020.

Important Targets • According to FtF - comprehensive package of proven
nutrition interventions can achieve a ―one-fifth to one-third decrease in stunting among children under five years over a two to three year period.
• FtF program is thus determined to improve the nutritional status of women and children in Tanzania
• They set following targets that must be attained by the end of the 5 year project
1. Reduce the prevalence of stunting among children from 42% to 32%
2. Reduce the prevalence of wasting among children from 5.9% to <5%
3. Reduce the prevalence of underweight among women (BMI < 18.5 kg/sqm) from 11% to <1%
Important Targets
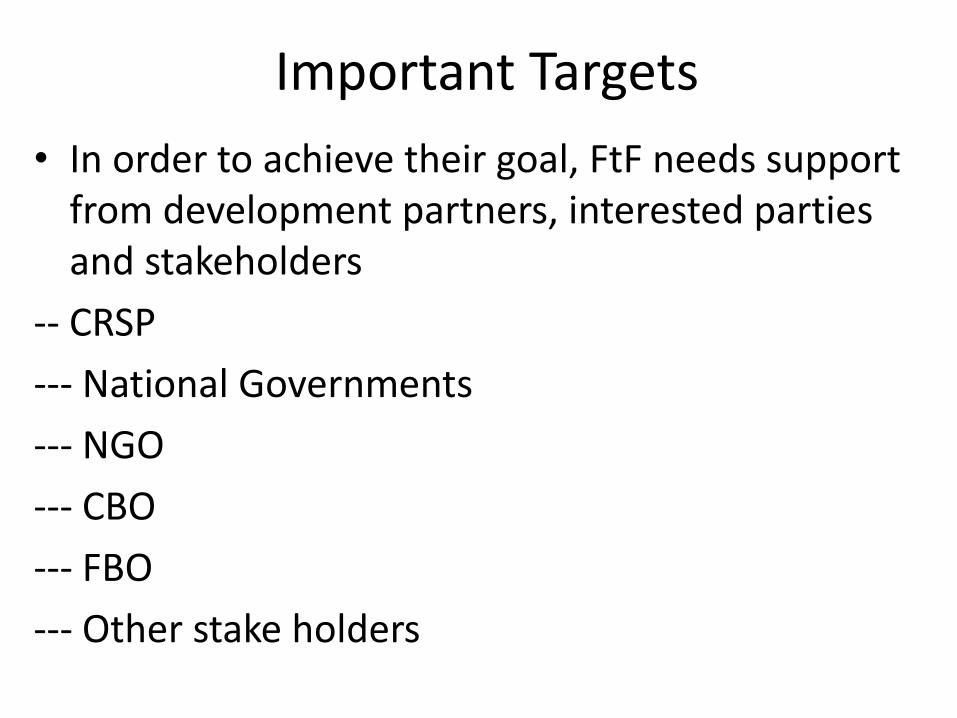
• In order to achieve their goal, FtF needs support from development partners, interested parties and stakeholders
-- CRSP
--- National Governments
--- NGO
--- CBO
--- FBO
--- Other stake holders
Thank you for listening