Embed Size (px)
Citation preview

Nutrition: obtaining reliable biomarker data to gstudy the health status of populations
Christine M. Pfeiffer, Ph.D.Chief, Nutritional Biomarkers Branch, DLS
AAAS 2011 Annual MeetingScience Without Borders Session
February 18, 2011
National Center for Environmental HealthDivision of Laboratory Sciences
Outline
• Introduction to CDC’s Nutritional Biomarkers Branch
• Introduction to an important U.S. health survey, NHANES
• Vitamin D as an example:
– Evolution of measurement techniques used for NHANES
– Consequences of method changes on long-term monitoring of l ti t dpopulation trends
– Programs & partnerships across different sectors to improve measurements, make them comparable across the globe, and create a lasting impact on public health
2
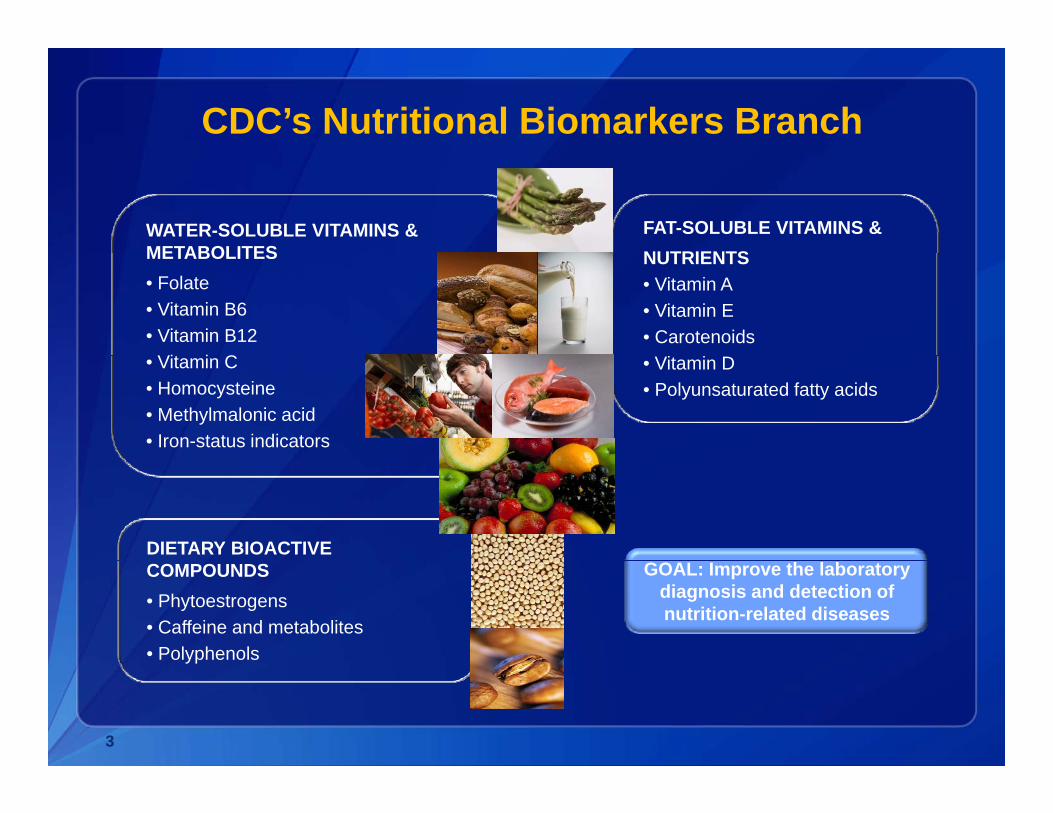
CDC’s Nutritional Biomarkers Branch
WATER-SOLUBLE VITAMINS & METABOLITES
FAT-SOLUBLE VITAMINS & NUTRIENTSMETABOLITES
• Folate• Vitamin B6• Vitamin B12
Vit i C
NUTRIENTS• Vitamin A• Vitamin E• Carotenoids
• Vitamin C• Homocysteine• Methylmalonic acid• Iron-status indicators
• Vitamin D• Polyunsaturated fatty acids
DIETARY BIOACTIVE COMPOUNDS• Phytoestrogens• Caffeine and metabolites• Polyphenols
GOAL: Improve the laboratory diagnosis and detection of nutrition-related diseases
yp
3

U.S. NHANESCross-sectional nationally representative survey
• Conducted by the National Center for Health Statistics, CDC
• Designed to collect information about the health and diet of people in the United St tStates
• Approximately 5,000 persons examined per yearU i i th t it bi h• Unique in that it combines a home interview with health tests that are done in a Mobile Examination Center
4

U.S. NHANESSampling Design
Stage 1Counties
Stage 2Segments
Counties
Stage 3Stage 3Households
Stage 4SPsSPs
5

National Report on Biochemical Indicators of Diet and Nutrition in the U. S. Population
1999 20021999-2002
6

Reference Interval Tables by Age and Sex
www.cdc.gov/nutritionreport7
Vitamin D Examplep
• Why is it important to measure biological levels of vitamin D?y p g
• What measurement techniques are suitable for NHANES?
• What happens if measurement techniques have to be changed• What happens if measurement techniques have to be changed mid-stream?
• How do we make measurements comparable across the globe?• How do we make measurements comparable across the globe?
• What do we need to ensure high quality measurements?
8
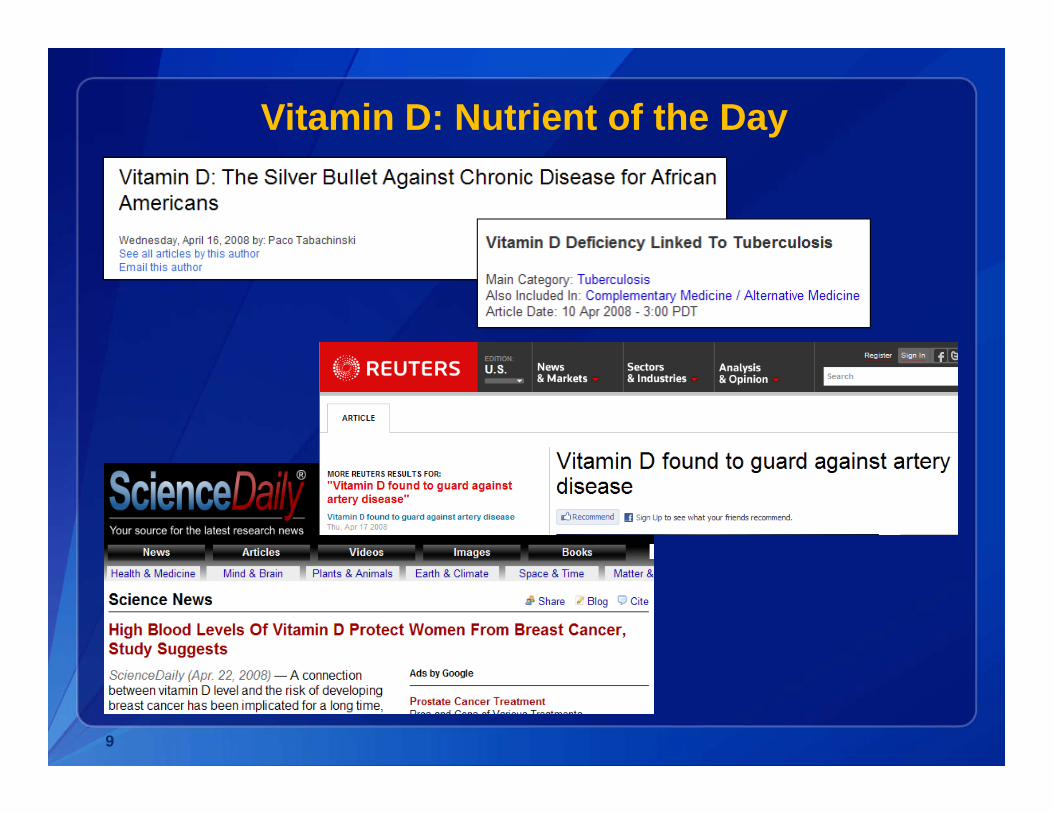
Vitamin D: Nutrient of the Day
9
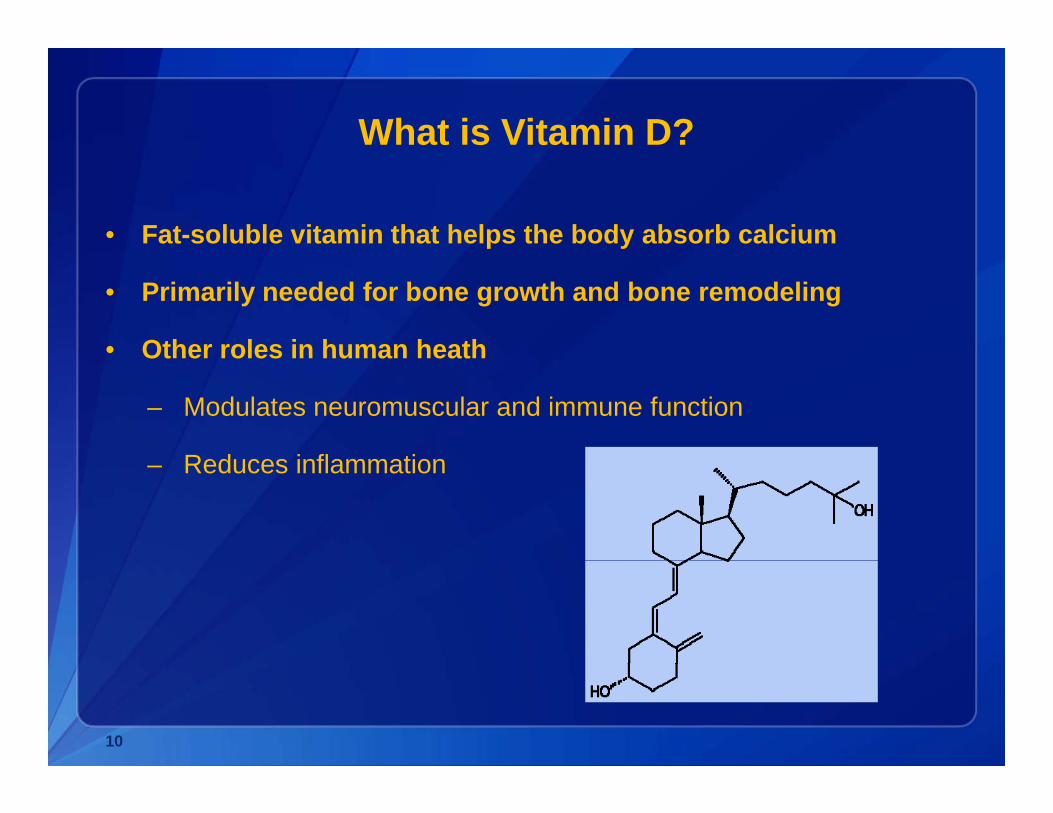
What is Vitamin D?
• Fat-soluble vitamin that helps the body absorb calcium
• Primarily needed for bone growth and bone remodeling
• Other roles in human heathOther roles in human heath
– Modulates neuromuscular and immune function
R d i fl ti– Reduces inflammation
10
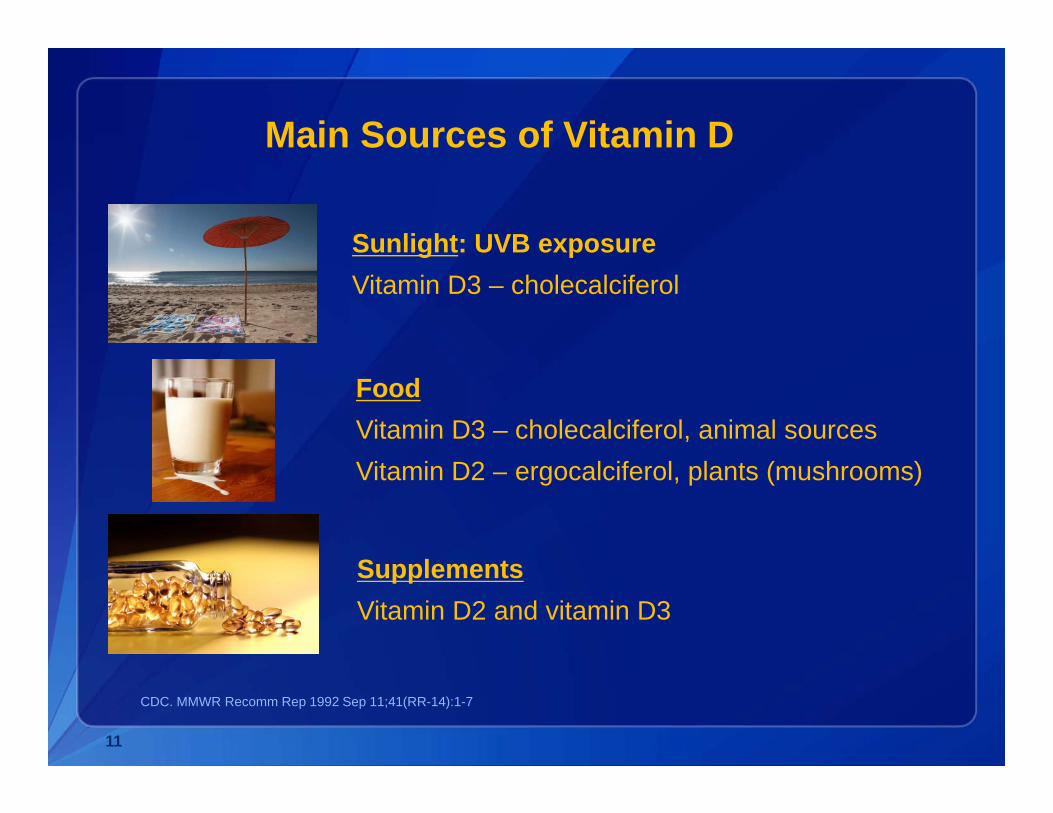
Main Sources of Vitamin D
Sunlight: UVB exposureg pVitamin D3 – cholecalciferol
FoodVitamin D3 – cholecalciferol, animal sources
S l t
Vitamin D2 – ergocalciferol, plants (mushrooms)
SupplementsVitamin D2 and vitamin D3
CDC. MMWR Recomm Rep 1992 Sep 11;41(RR-14):1-7
11

Vitamin D Metabolism
• Vitamin D is rapidly taken up and transported to the liver
• Vitamin D2 and vitamin D3 are metabolized
o First, in the liver to the circulating form of 25-hydroxyvitamin D or 25(OH)D
o Then in the kidney to the active form of 1,25-dihydroxyvitamin D
CDC. MMWR Recomm Rep 1992 Sep 11;41(RR-14):1-7
12
Vitamin D and Health
• In children, there is a high risk of rickets with low levels of 25(OH)D
• In adults, there is a risk of osteomalacia with inadequate levels of 25(OH)D
• Low levels of 25(OH)D have been associated with increased risk for numerous other health outcomes
• These associations are primarily based on ecologic/observational studies
13
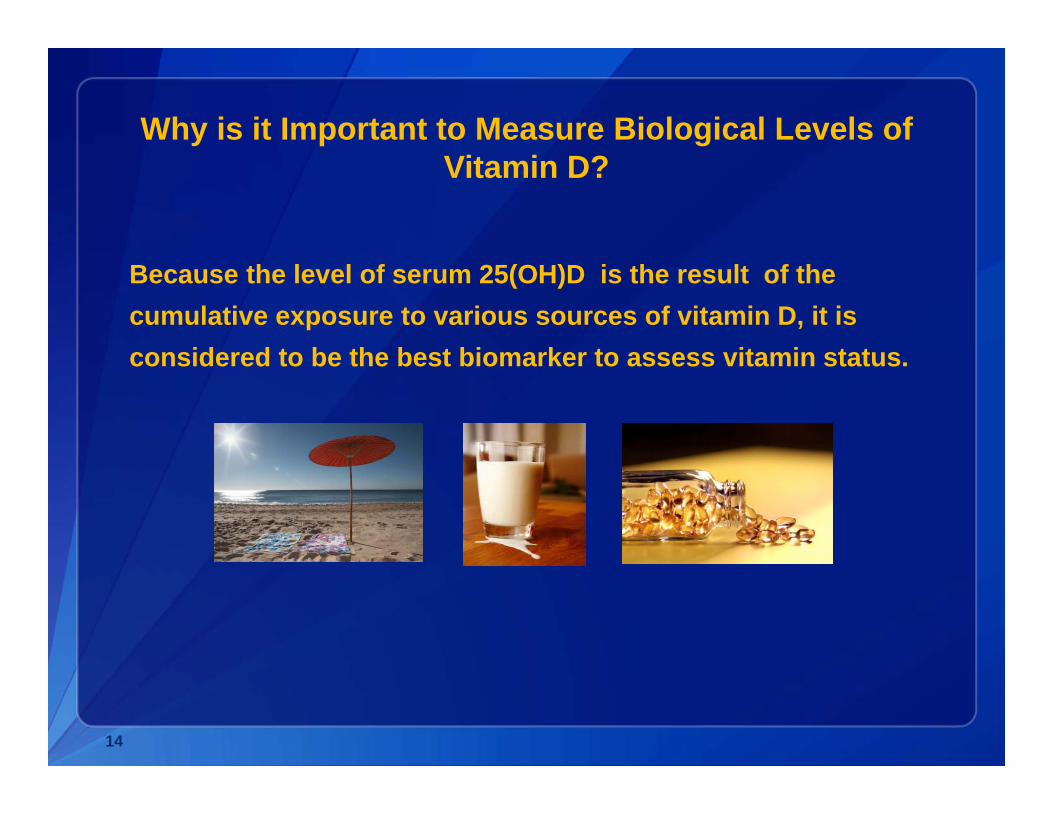
Why is it Important to Measure Biological Levels of Vitamin D?
Because the level of serum 25(OH)D is the result of the cumulative exposure to various sources of vitamin D, it is considered to be the best biomarker to assess vitamin statusconsidered to be the best biomarker to assess vitamin status.
14

What Measurement Techniques are Suitable for NHANES?
Hi h t ibl• Highest possible accuracy
• Best possible precision
Good sensitivity because only small sample volumes are available• Good sensitivity because only small sample volumes are available
• High enough throughput to handle minimum 5,000 samples per year
• Stable over time to avoid method fluctuations• Stable over time to avoid method fluctuations
• Has to be affordable and sustainable over multiple years
anes
15
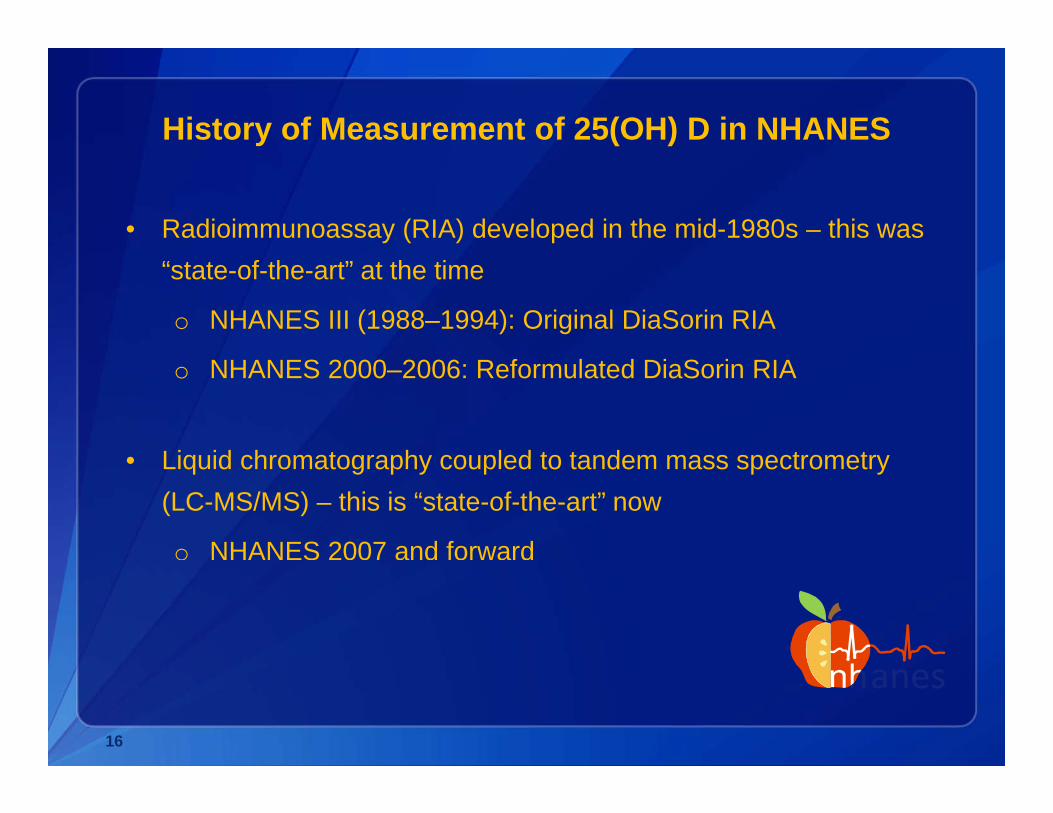
History of Measurement of 25(OH) D in NHANES
• Radioimmunoassay (RIA) developed in the mid-1980s – this was “state-of-the-art” at the time
o NHANES III (1988–1994): Original DiaSorin RIA
o NHANES 2000–2006: Reformulated DiaSorin RIA
• Liquid chromatography coupled to tandem mass spectrometry• Liquid chromatography coupled to tandem mass spectrometry (LC-MS/MS) – this is “state-of-the-art” now
o NHANES 2007 and forward
anes
16
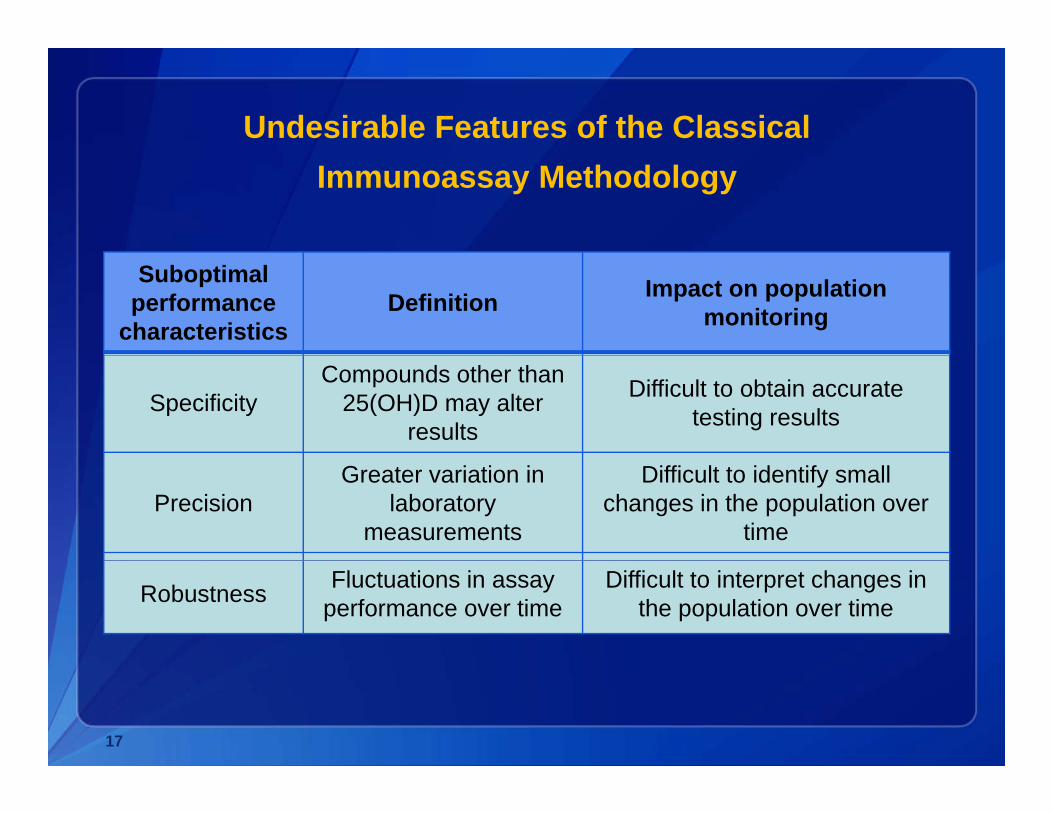
Undesirable Features of the Classical Immunoassay Methodology
Suboptimal performance
characteristicsDefinition Impact on population
monitoring
SpecificityCompounds other than
25(OH)D may alter results
Difficult to obtain accurate testing results
PrecisionGreater variation in
laboratory measurements
Difficult to identify small changes in the population over
time
Robustness Fluctuations in assay performance over time
Difficult to interpret changes in the population over time
17
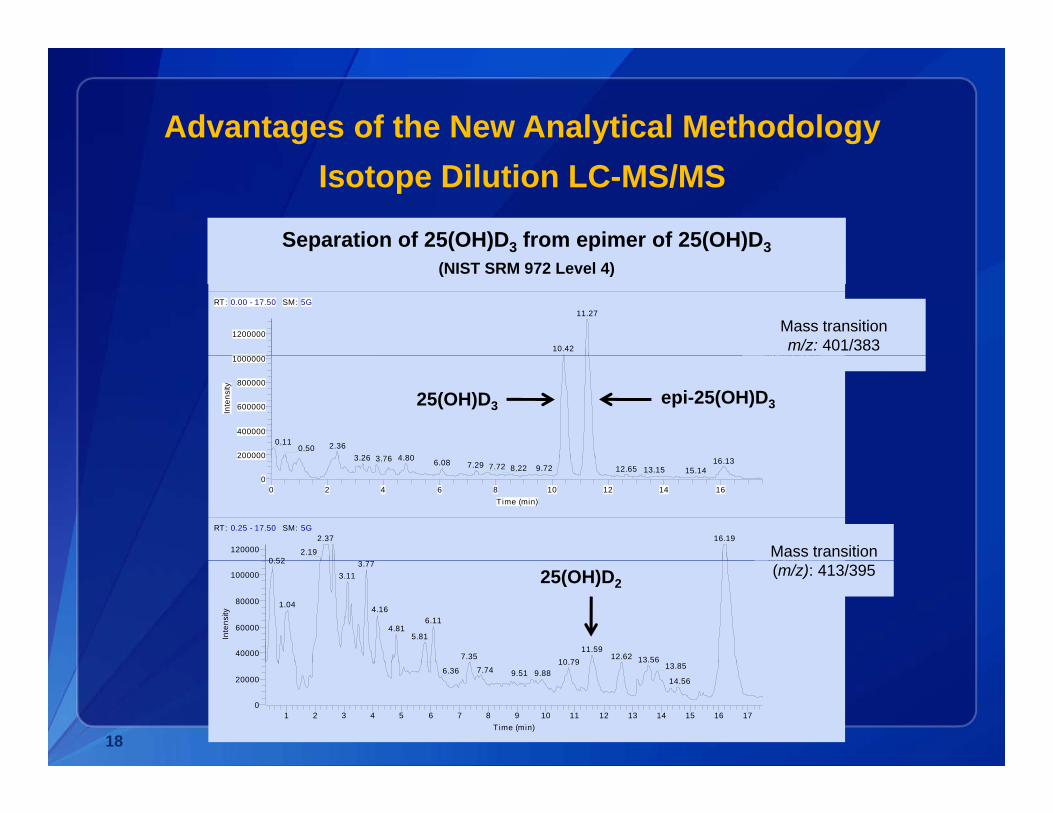
Advantages of the New Analytical MethodologyIsotope Dilution LC-MS/MS
Separation of 25(OH)D3 from epimer of 25(OH)D3
C:\Xcalibur\...\data090720a18 7/20/2009 4:50:35 PM SRM 972 L4
RT: 0.00 - 17.50 SM: 5G
1200000
11.27
10.42
NL: 1.32E6TIC F: + p sid=-7.00 SRM ms2 [email protected] [ 382 80-383 80]
Mass transitionm/z: 401/383
(NIST SRM 972 Level 4)
200000
400000
600000
800000
1000000
Inte
nsity
0.11 2.360.504 803 26 3 76 16 13
382.80-383.80] MS data090720a18
25(OH)D3 epi-25(OH)D3
0 2 4 6 8 10 12 14 16Time (min)
0
200000 4.803.26 3.76 16.136.08 7.29 7.72 9.728.22 12.65 13.15 15.14
RT: 0.25 - 17.50 SM: 5G
1200002.37 16.19
2.190 52
NL: 1.86E5TIC F: + p sid=-7.00 SRM ms2Mass transition
40000
60000
80000
100000
Inte
nsity
0.52 3.773.11
1.04 4.166.11
4.815.81
11.597.35 12.62 13.5610 79 13 85
SRM ms2 [email protected] [ 394.80-395.80] MS data090720a18
25(OH)D2(m/z): 413/395
1 2 3 4 5 6 7 8 9 10 11 12 13 14 15 16 17Time (min)
0
20000
10.79 13.857.746.36 9.889.5114.56
18
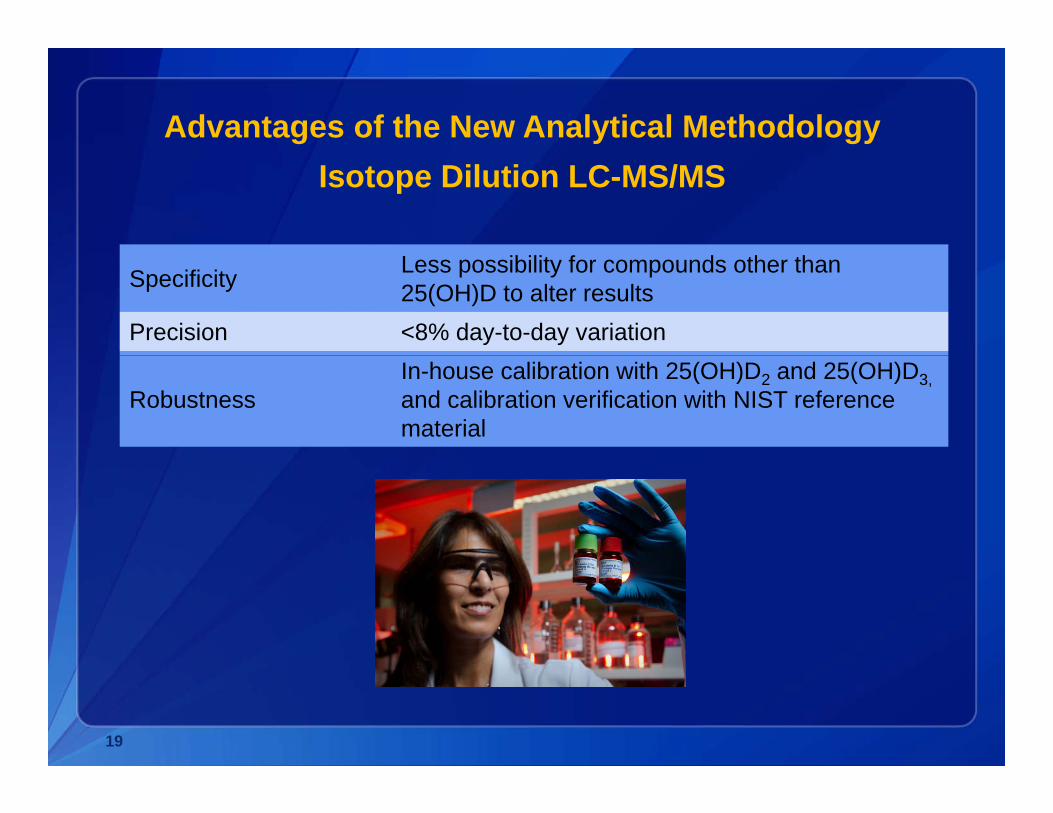
Advantages of the New Analytical MethodologyIsotope Dilution LC-MS/MS
Specificity Less possibility for compounds other than 25(OH)D to alter results
Precision <8% day-to-day variation
RobustnessIn-house calibration with 25(OH)D2 and 25(OH)D3, and calibration verification with NIST reference material
19

How to Make Past and Current Data Comparable?
In 2009, the NIH Office of Dietary Supplements and the CDC NCHS sponsored a roundtable on vitamin D issues in NHANES
Future methodology should be LC-MS/MS A subset of the samples analyzed with the DiaSorin RIA will be re-
analyzed by LC MS/MS to bridge the past and the futureanalyzed by LC-MS/MS to bridge the past and the future
Yetley EA et al. J. Nutr. Nov 2010
20
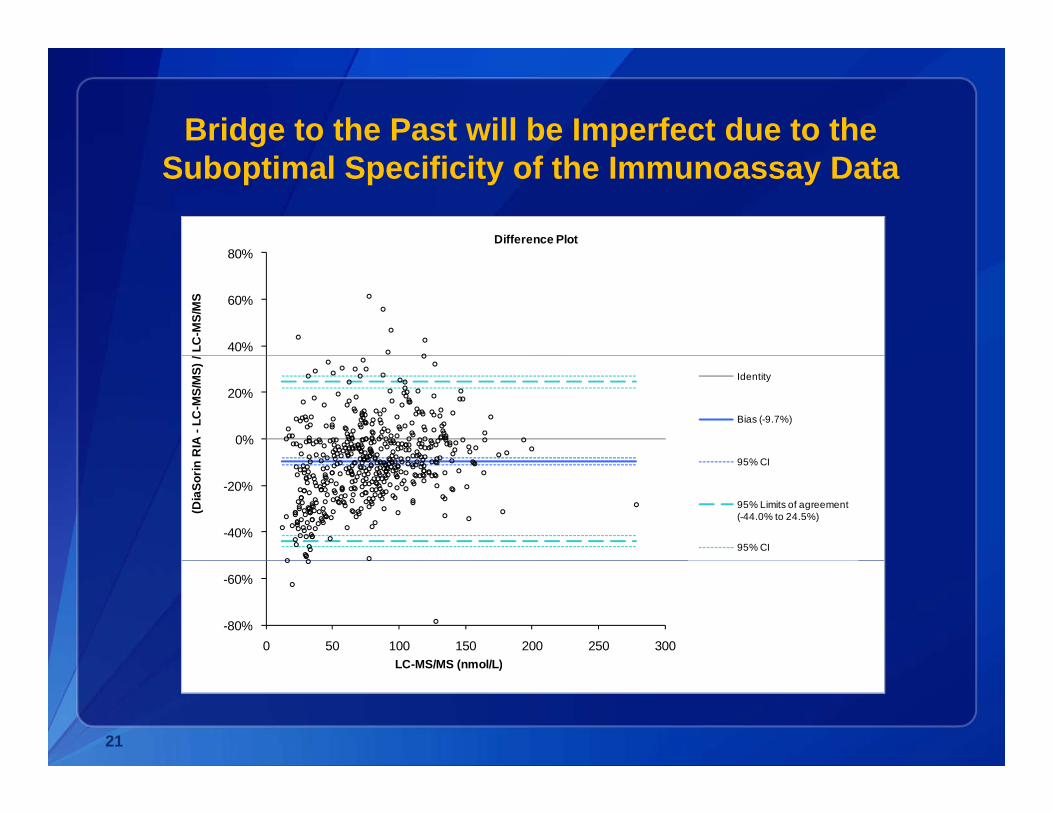
Bridge to the Past will be Imperfect due to the Suboptimal Specificity of the Immunoassay Data
80%Difference Plot
40%
60%
80%
LC-M
S/M
S
0%
20%
RIA
-LC
-MS/
MS)
/
Identity
Bias (-9.7%)
-40%
-20%
(Dia
Sorin
95% CI
95% Limits of agreement(-44.0% to 24.5%)
95% CI
-80%
-60%
0 50 100 150 200 250 300LC MS/MS (nmol/L)LC-MS/MS (nmol/L)
21
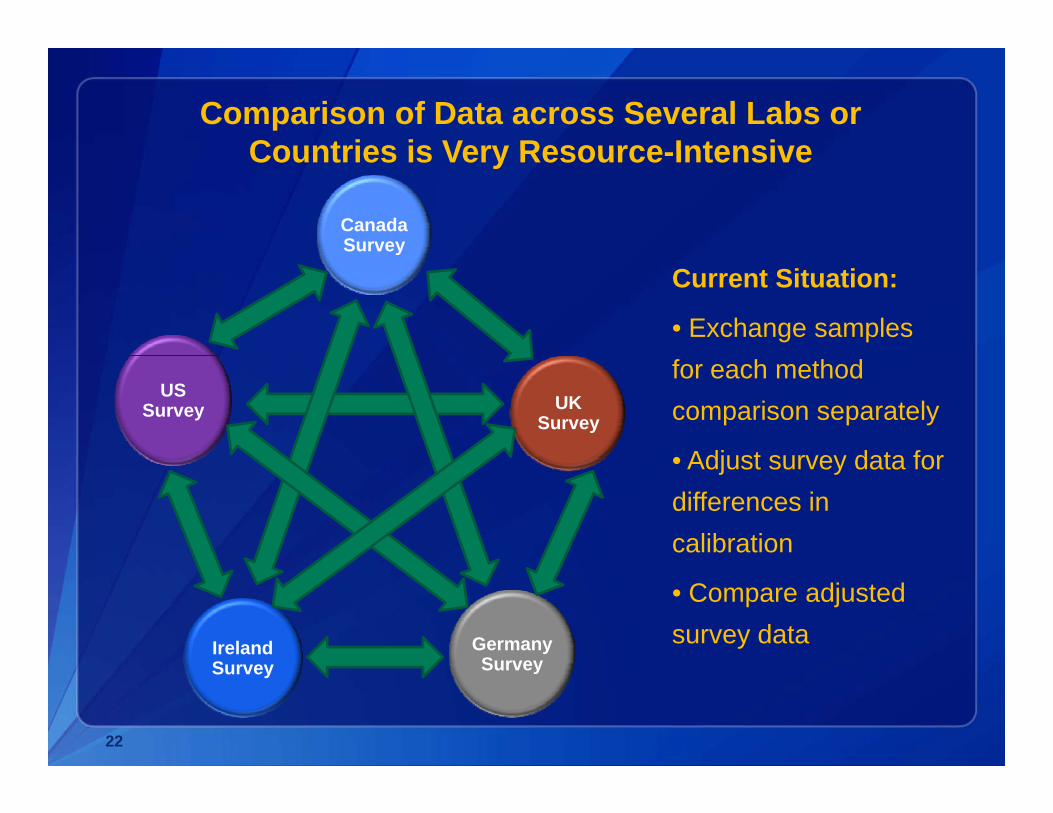
Comparison of Data across Several Labs or Countries is Very Resource Intensive
Canada Survey
Countries is Very Resource-Intensive
y
Current Situation:
• Exchange samples
UK Survey
US Survey
for each method comparison separately
• Adjust survey data for• Adjust survey data for differences in calibration
Germany Survey
Ireland S
• Compare adjusted survey data
SurveySurvey
22
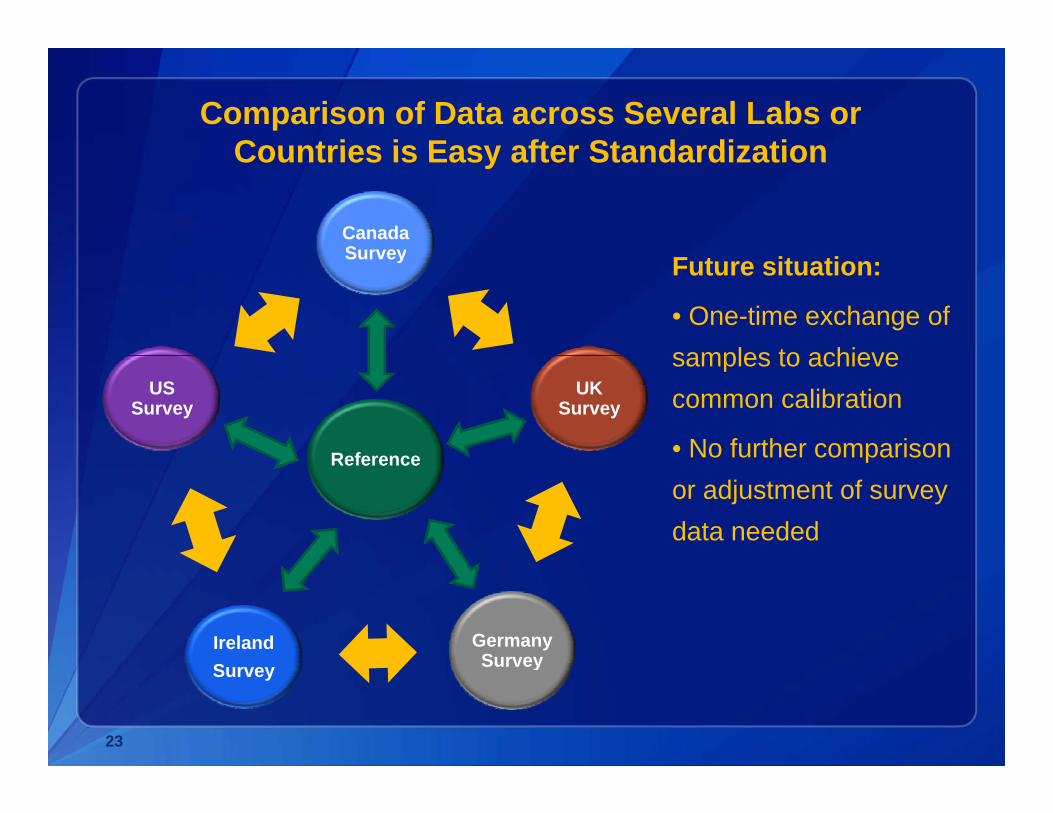
Comparison of Data across Several Labs or Countries is Easy after Standardization
Canada Survey
Countries is Easy after Standardization
Survey Future situation:
• One-time exchange of samples to achieve
UK Survey
US Survey
Reference
samples to achieve common calibration
• No further comparison Reference por adjustment of survey data needed
GermanySurvey
IrelandSurveySurvey
23
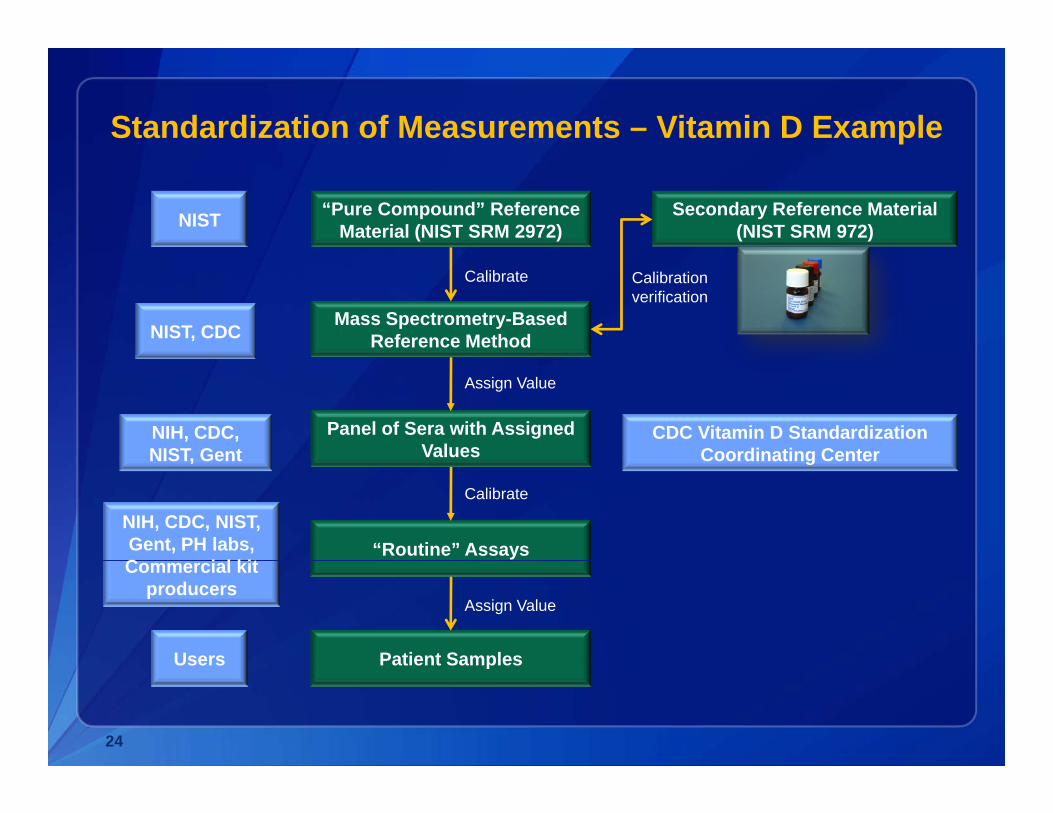
Standardization of Measurements – Vitamin D Example
“Pure Compound” Reference Material (NIST SRM 2972)
Secondary Reference Material(NIST SRM 972)NIST
Mass Spectrometry-Based Reference Method
Calibrate Calibrationverification
NIST, CDC
Panel of Sera with Assigned Values
Assign Value
NIH, CDC, NIST Gent
CDC Vitamin D Standardization Coordinating Center
“Routine” Assays
Calibrate
NIST, Gent Coordinating Center
NIH, CDC, NIST, Gent, PH labs, C i l kit
Patient Samples
Assign Value
Commercial kit producers
Users Patient SamplesUsers
24
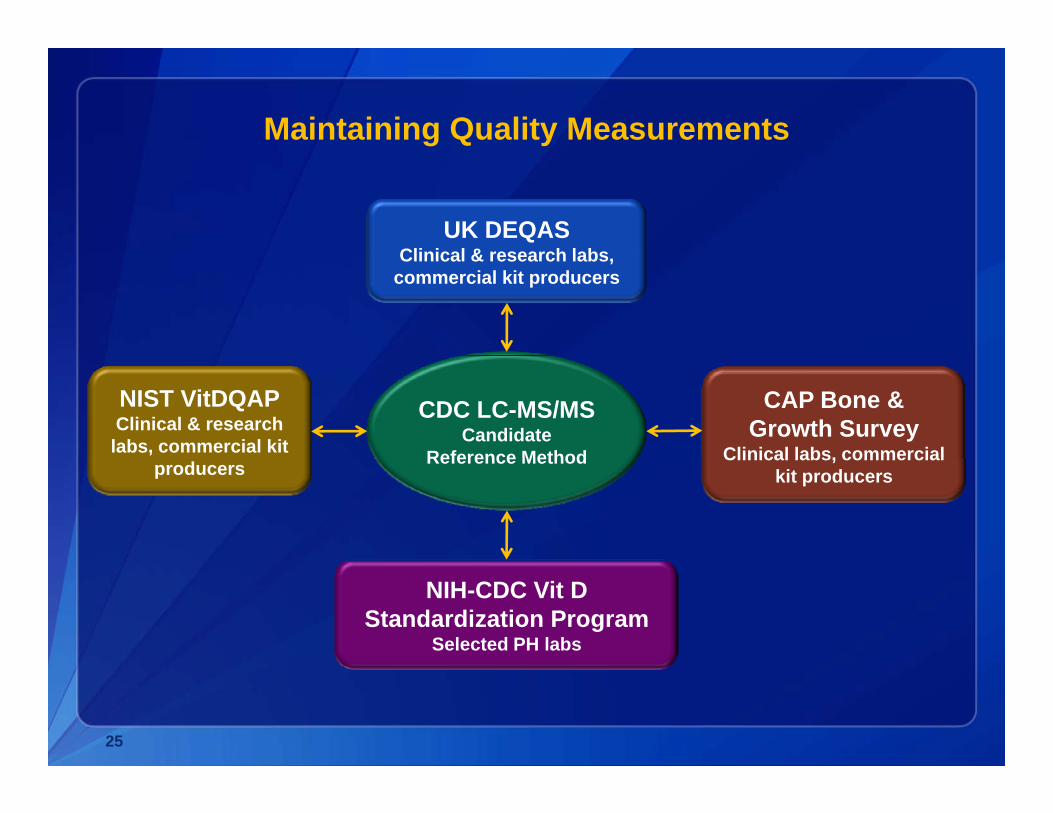
Maintaining Quality Measurements
UK DEQASClinical & research labsClinical & research labs,
commercial kit producers
CDC LC-MS/MS Candidate
Reference Method
NIST VitDQAPClinical & research labs, commercial kit
CAP Bone & Growth Survey
Clinical labs, commercialReference MethodproducersClinical labs, commercial
kit producers
NIH-CDC Vit D Standardization Program
Selected PH labs
25

What do we Need to Ensure Continued High Quality Measurements?
• Use method anchored to accuracy-based traceability chain
• Establish and follow detailed SOPs
• Train staff well in all procedures
• Include internal quality control samples in every run
• Participate in external quality assurance programs
• Use reference materials on a regular basis
26

Ulti t l f i d tUltimate goals of improved measurements:
• Better diagnosis and treatment:
• Better assessment of the vitamin D status of the individual and populationsand populations
• More reliable prevalence estimates of inadequate levels
• Help reduce or prevent negative health outcomes:
• Better estimation of optimal levels of 25(OH)D for various p ( )health outcomes
27

Acknowledgments
• CDC/NCEH:
o Rosemary Schleicher and her vitamin D laboratory team
o Hubert Vesper - CDC Vitamin D Standardization Coordinating CenterCenter
• CDC/NCHS: Anne Looker, David Lacher, Cliff Johnson
• NIH/ODS: Beth Yetley, Chris Sempos, Paul Coates
• NIST: Karen Phinney Steven Wise
28
• NIST: Karen Phinney, Steven Wise