Embed Size (px)
Citation preview
Nutrition & Food Security Programme
WHO Food and Nutrition WHO Food and Nutrition Action PlanAction Plan
Dr Aileen RobertsonDr Aileen Robertson
Nutrition and Food Security Nutrition and Food Security ProgrammeProgramme
WHO Regional Office for EuropeWHO Regional Office for Europe
CopenhagenCopenhagen
Nutrition & Food Security Programme
Nutrition & Food Security Programme
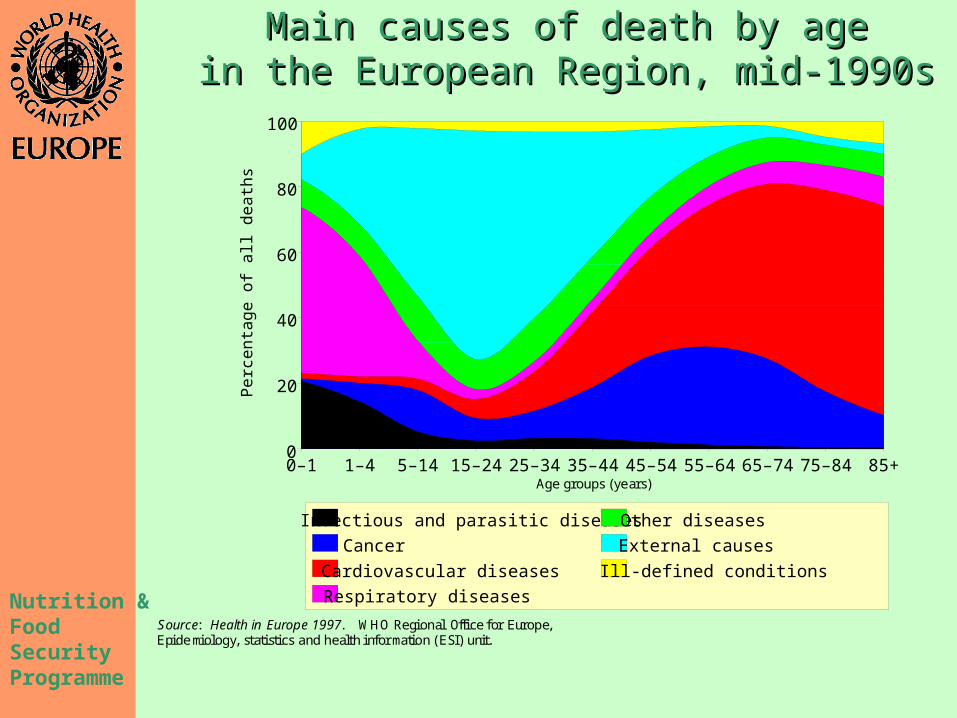
Main causes of death by ageMain causes of death by agein the European Region, mid-1990sin the European Region, mid-1990s
0–1 1–4 5–14 15–24 25–34 35–44 45–54 55–64 65–74 75–84 85+0
20
40
60
80
100
Infectious and parasitic diseases
Cancer
Cardiovascular diseases
Respiratory diseases
Other diseases
External causes
Ill-defined conditions
Age groups (years)
Source: Health in Europe 1997. WHO Regional Office for Europe, Epidemiology, statistics and health information (ESI) unit.
Perc
enta
ge o
f all
death
s
Nutrition & Food Security Programme
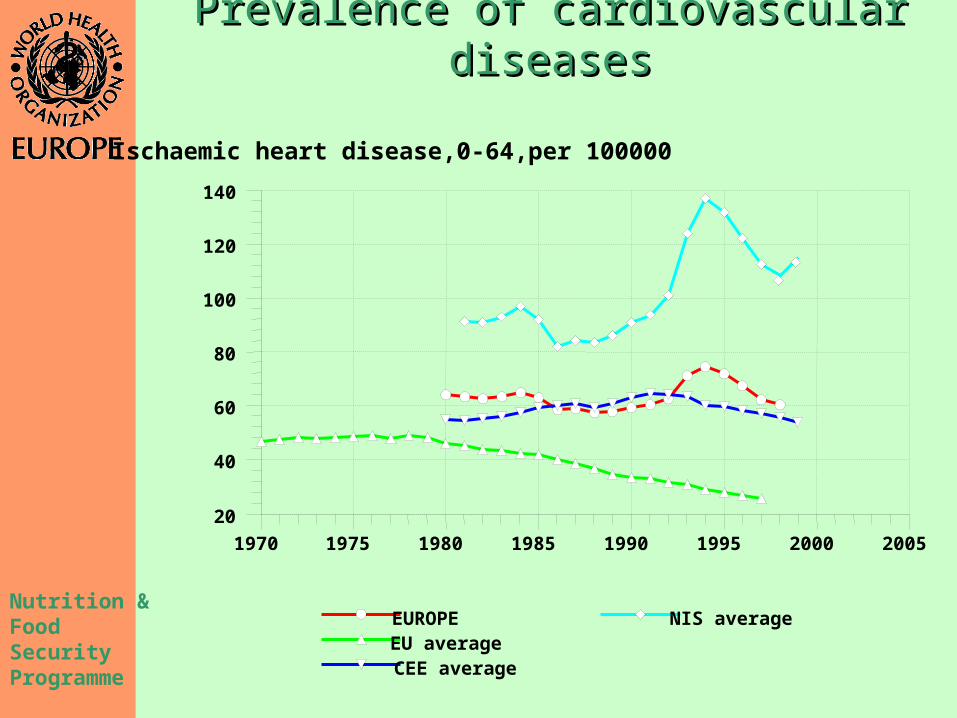
Prevalence of cardiovascular Prevalence of cardiovascular diseasesdiseases
20
40
60
80
100
120
140
1970 1975 1980 1985 1990 1995 2000 2005
EUROPE EU average CEE average
NIS average
Ischaemic heart disease,0-64,per 100000
Nutrition & Food Security Programme
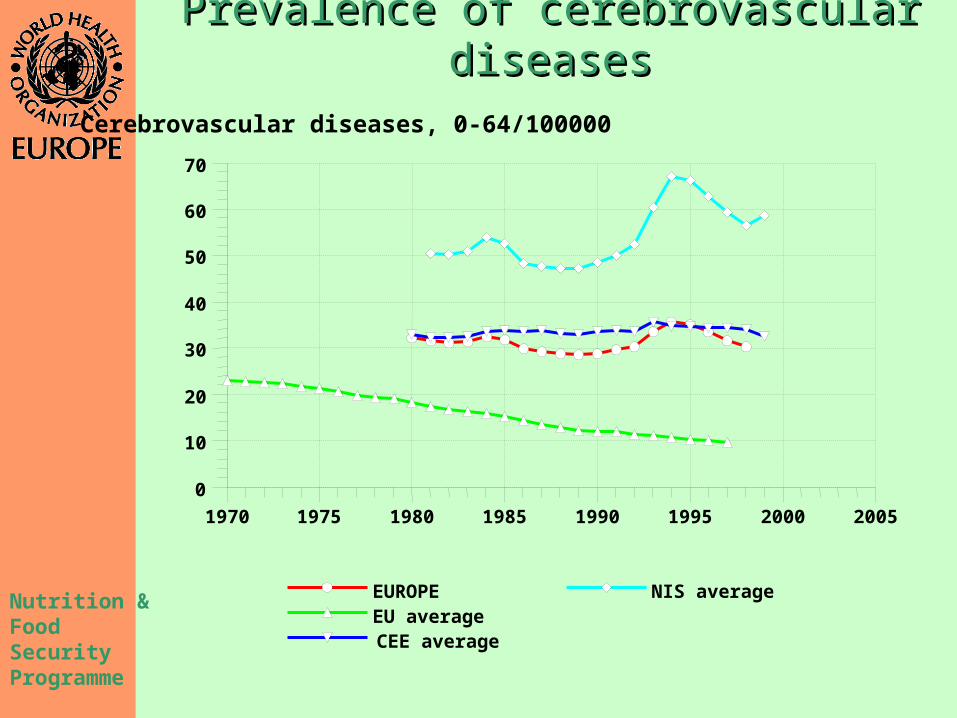
Prevalence of cerebrovascular diseasesPrevalence of cerebrovascular diseases
0
10
20
30
40
50
60
70
1970 1975 1980 1985 1990 1995 2000 2005
EUROPE EU average CEE average
NIS average
Cerebrovascular diseases, 0-64/100000
Nutrition & Food Security Programme
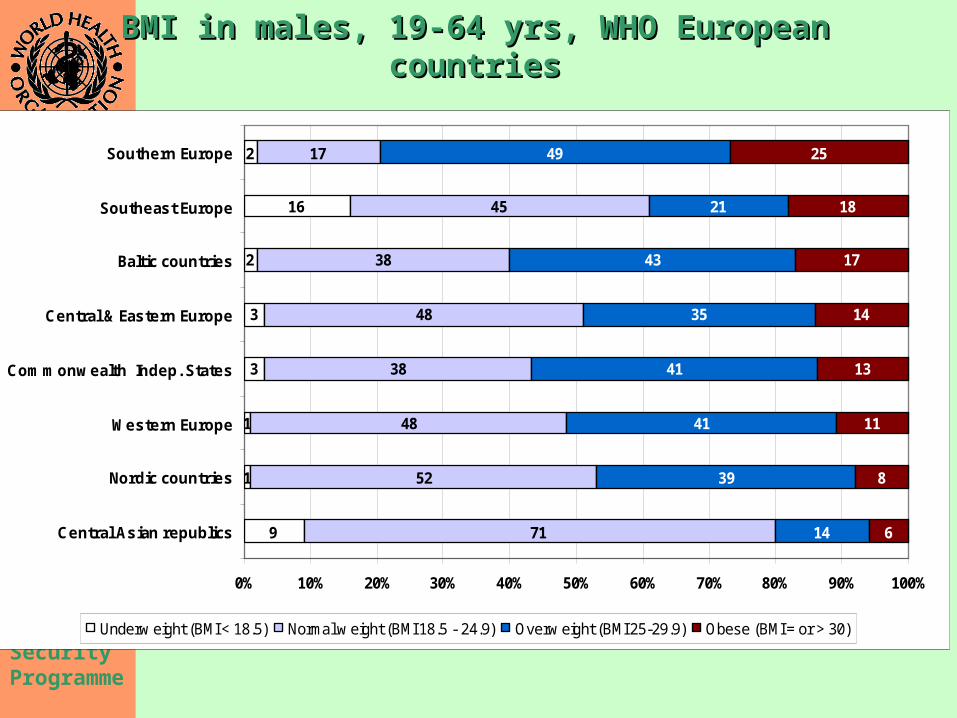
BMI in males, 19-64 yrs, WHO European BMI in males, 19-64 yrs, WHO European countriescountries
9
1
1
3
3
2
16
2
71
52
48
38
48
38
45
17
14
39
41
41
35
43
21
49
6
8
11
13
14
17
18
25
0% 10% 20% 30% 40% 50% 60% 70% 80% 90% 100%
Central Asian republics
Nordic countries
Western Europe
Commonwealth Indep. States
Central & Eastern Europe
Baltic countries
Southeast Europe
Southern Europe
Underw eight (BMI < 18.5) Normal w eight (BMI 18.5 - 24.9) Overw eight (BMI 25-29.9) Obese (BMI = or > 30)
Nutrition & Food Security Programme
ObesityObesity In Europe the prevalence of obesity In Europe the prevalence of obesity
reaches more than 30% in some adults reaches more than 30% in some adults and shows escalating rates in children, and shows escalating rates in children, increasing the risk of cardiovascular increasing the risk of cardiovascular diseases, certain cancers and diabetes.diseases, certain cancers and diabetes.
Obesity is estimated to cost some Obesity is estimated to cost some health services 7% of their total health health services 7% of their total health care budget.care budget.
Around one third of cardiovascular Around one third of cardiovascular disease cases, the leading cause of disease cases, the leading cause of death, is linked to unbalanced nutrition, death, is linked to unbalanced nutrition, and up to 30-40% of certain cancers.and up to 30-40% of certain cancers.
Nutrition & Food Security Programme
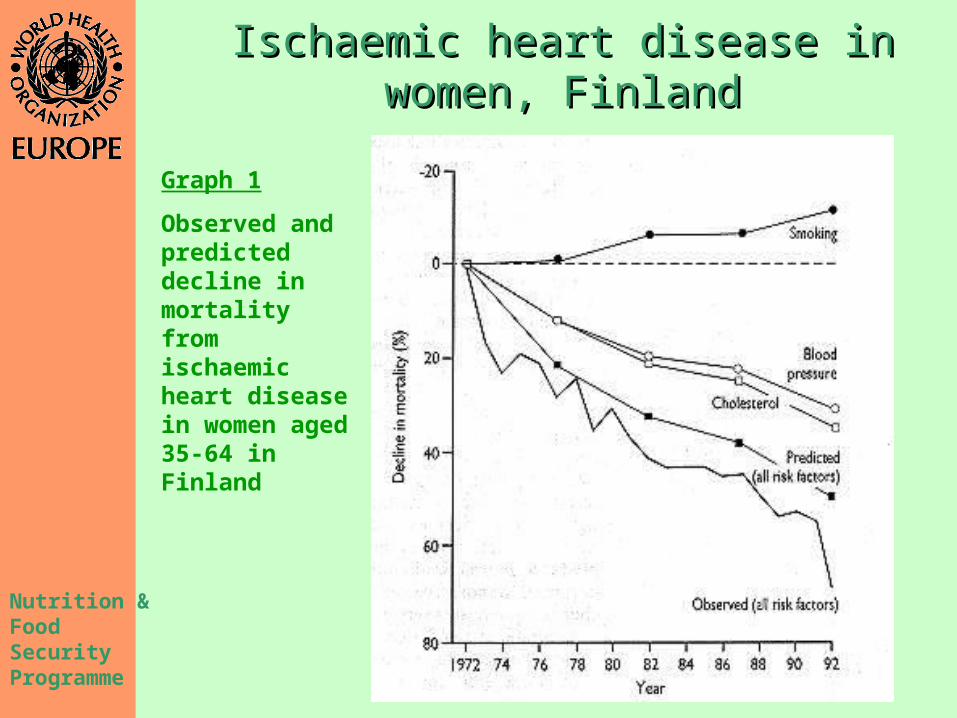
Ischaemic heart disease in women, Ischaemic heart disease in women, FinlandFinland
Graph 1
Observed and predicted decline in mortality from ischaemic heart disease in women aged 35-64 in Finland
Nutrition & Food Security Programme
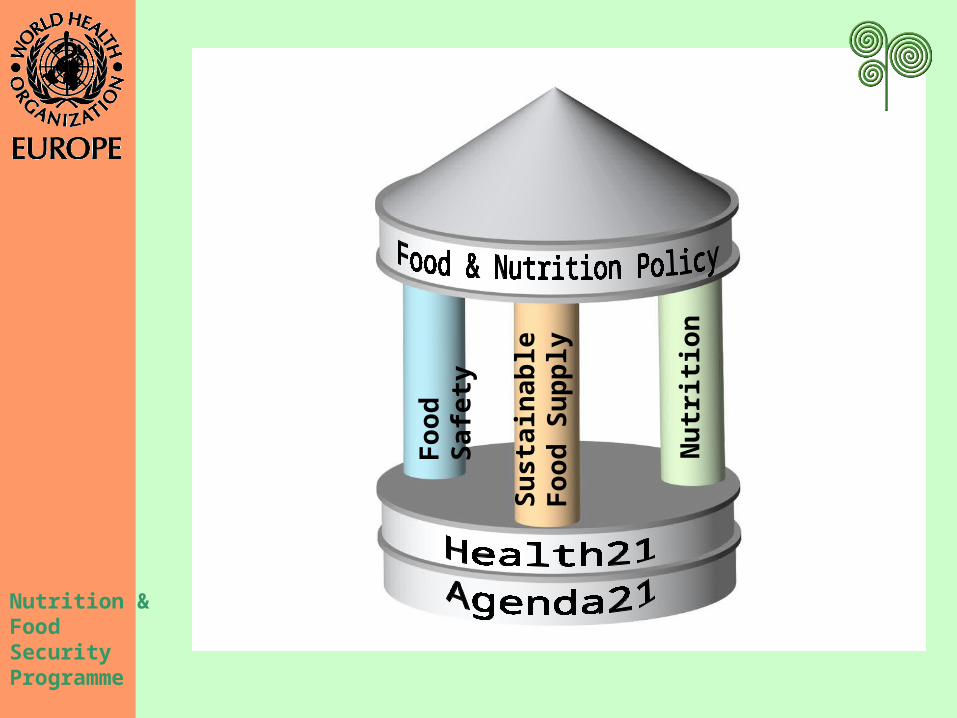
Foo
d S
afet
y
Nu
trit
ion
Su
stai
nab
le
Foo
d S
up
ply
Nutrition & Food Security Programme
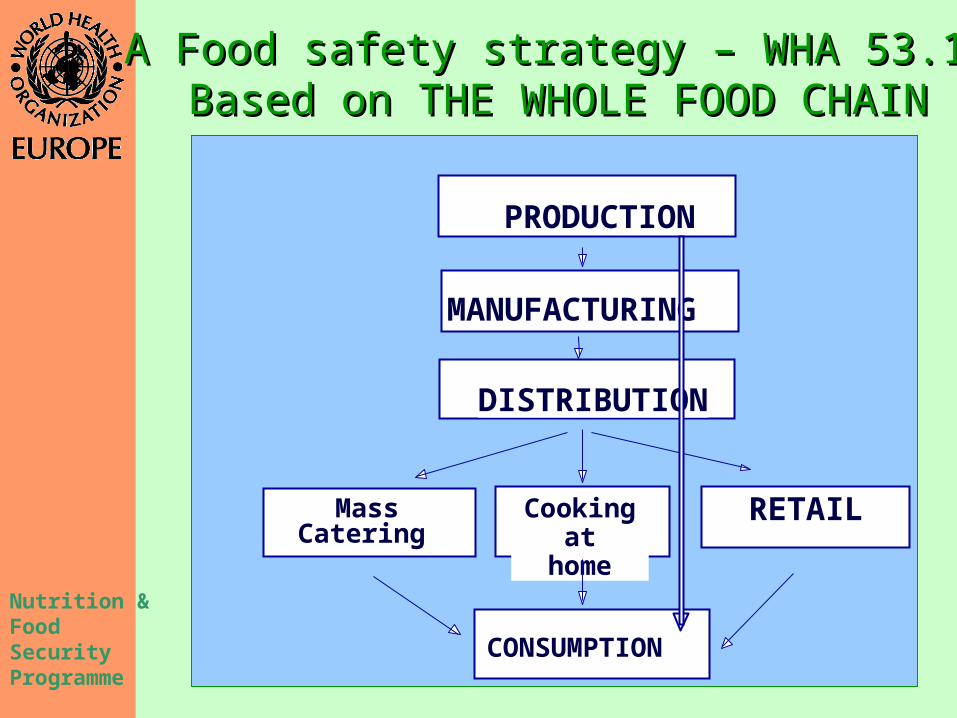
PRODUCTION
MANUFACTURING
DISTRIBUTION
Cooking at
home
MassCatering
RETAIL
CONSUMPTION
A Food safety strategy – WHA 53.15A Food safety strategy – WHA 53.15Based on THE WHOLE FOOD CHAINBased on THE WHOLE FOOD CHAIN
Nutrition & Food Security Programme
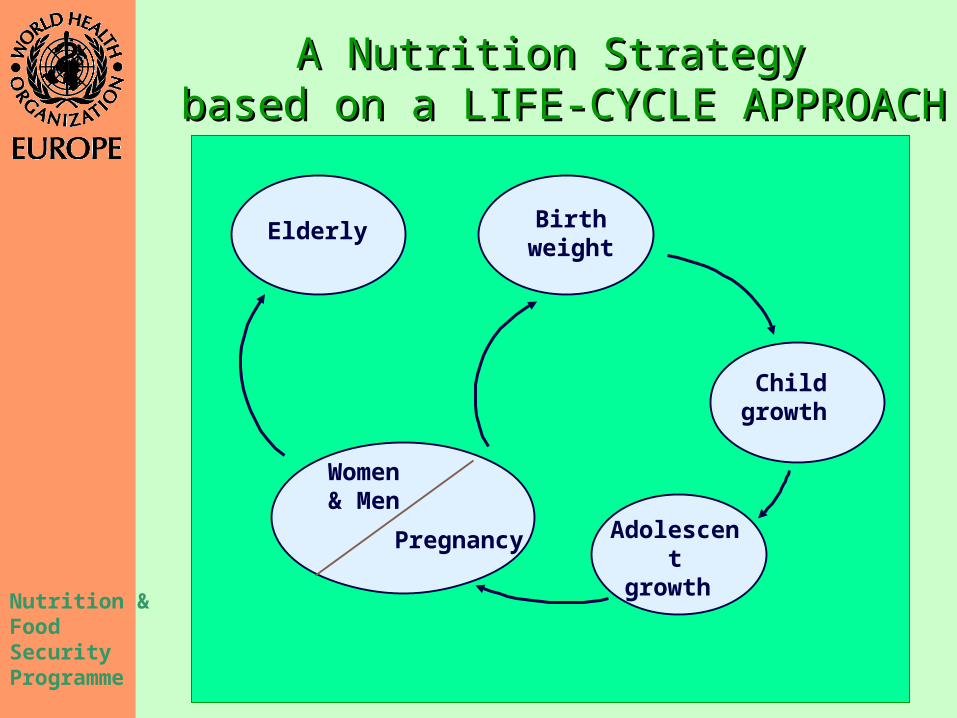
A Nutrition StrategyA Nutrition Strategy based on a LIFE-CYCLE APPROACHbased on a LIFE-CYCLE APPROACH
Woman
Adolescentgrowth
Pregnancy
Elderly
Child growth
Women& Men
Birthweight
Nutrition & Food Security Programme
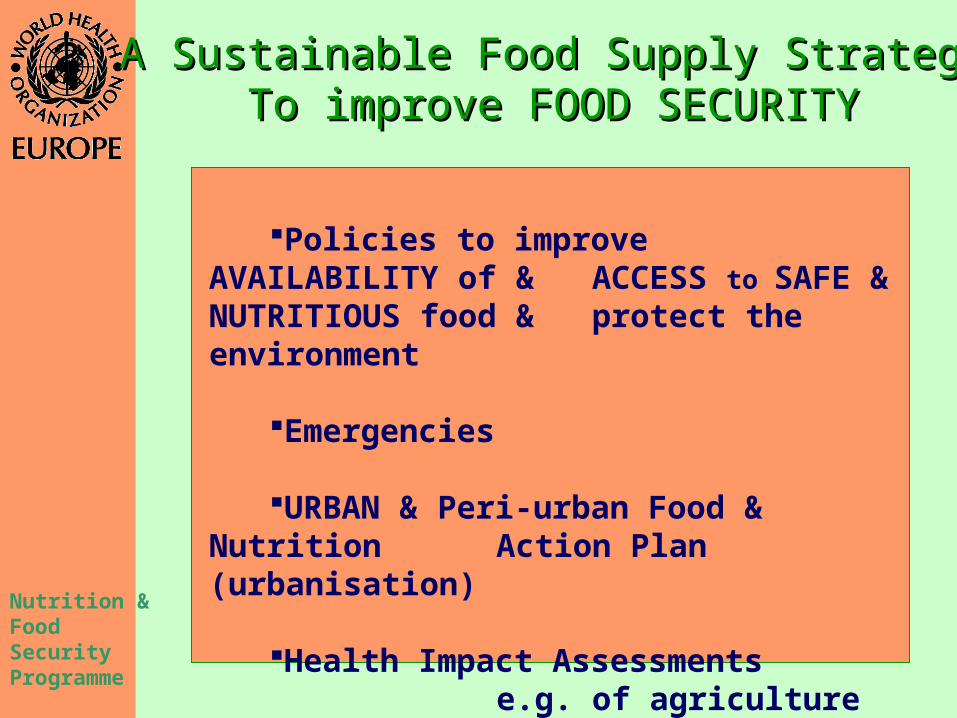
A Sustainable Food Supply StrategyA Sustainable Food Supply StrategyTo improve FOOD SECURITYTo improve FOOD SECURITY
Policies to improve AVAILABILITY of & ACCESS to SAFE & NUTRITIOUS food & protect the environment
Emergencies
URBAN & Peri-urban Food & Nutrition Action Plan (urbanisation)
Health Impact Assessments e.g. of agriculture policies
Nutrition & Food Security Programme
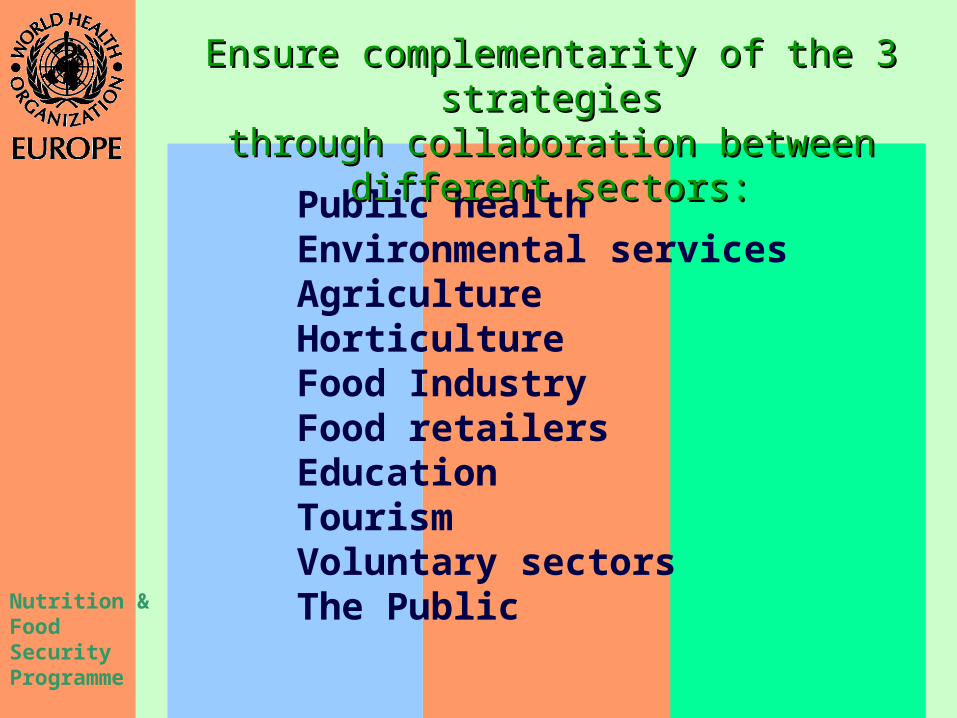
Public healthEnvironmental services AgricultureHorticultureFood IndustryFood retailersEducationTourismVoluntary sectorsThe Public
Ensure complementarity of the 3 Ensure complementarity of the 3 strategiesstrategies
through collaboration between different through collaboration between different sectors:sectors:
Nutrition & Food Security Programme
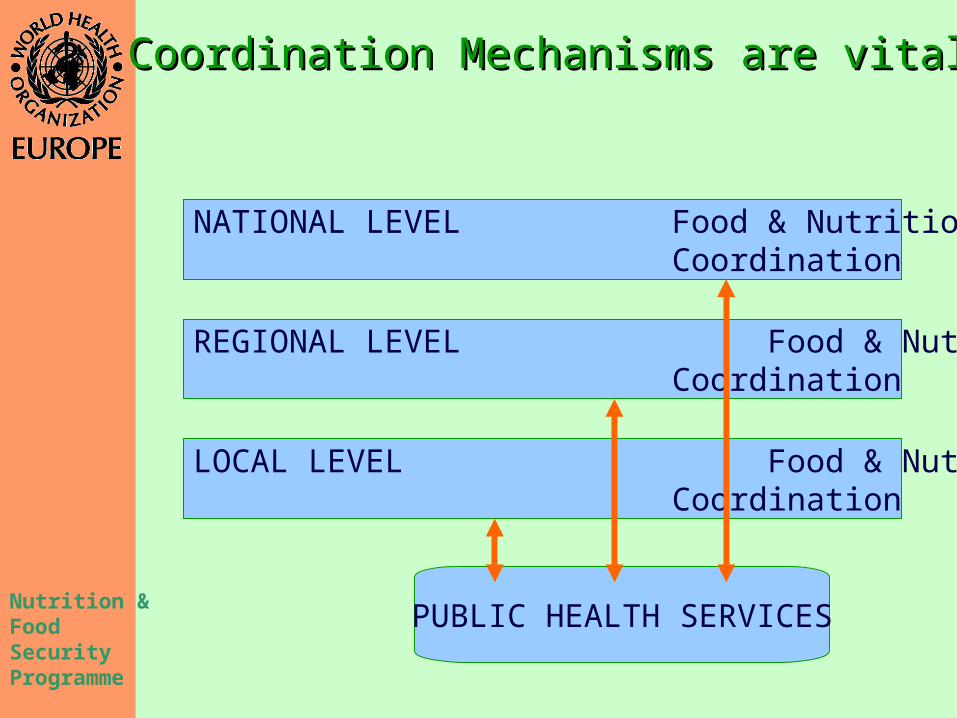
NATIONAL LEVEL Food & NutritionCoordination
REGIONAL LEVEL Food & NutritionCoordination
LOCAL LEVEL Food & NutritionCoordination
PUBLIC HEALTH SERVICES
Coordination Mechanisms are vitalCoordination Mechanisms are vital
Nutrition & Food Security Programme
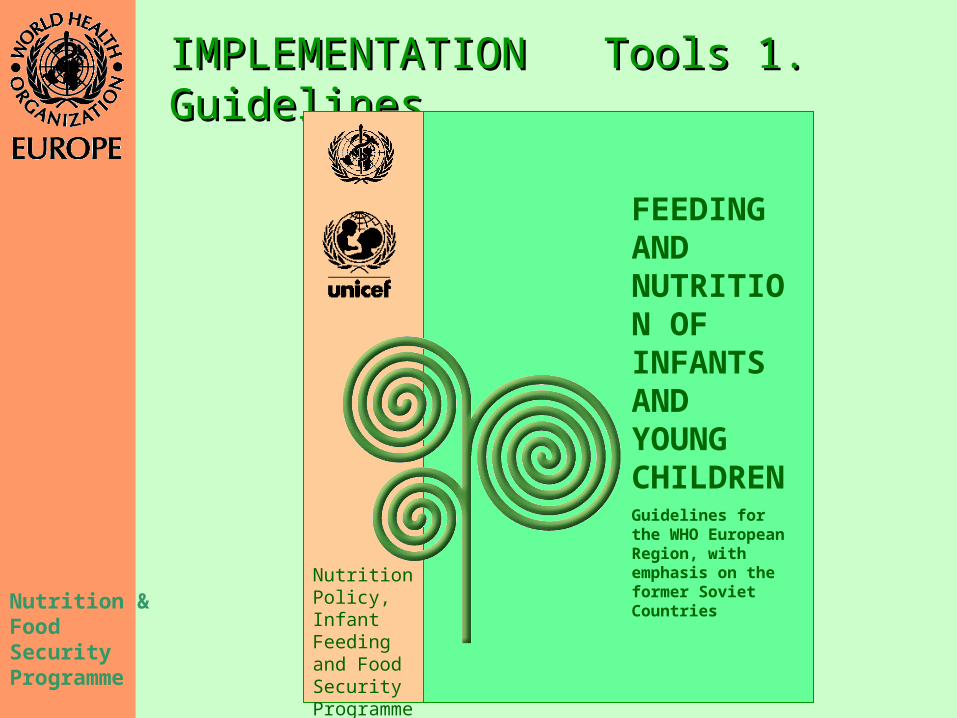
IMPLEMENTATION Tools 1. IMPLEMENTATION Tools 1. GuidelinesGuidelines
FEEDING AND NUTRITION OF INFANTS AND YOUNG CHILDRENGuidelines for the WHO European Region, with emphasis on the former Soviet CountriesNutrition
Policy, Infant Feeding and Food Security Programme
Nutrition & Food Security Programme
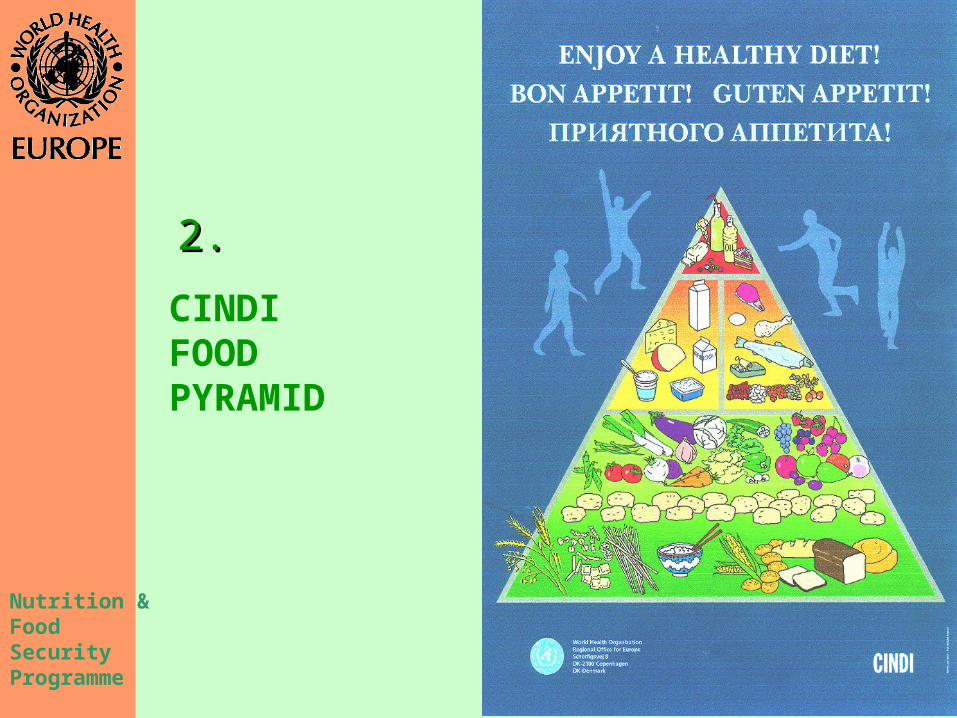
CINDI FOOD PYRAMID
2. 2.
Nutrition & Food Security Programme
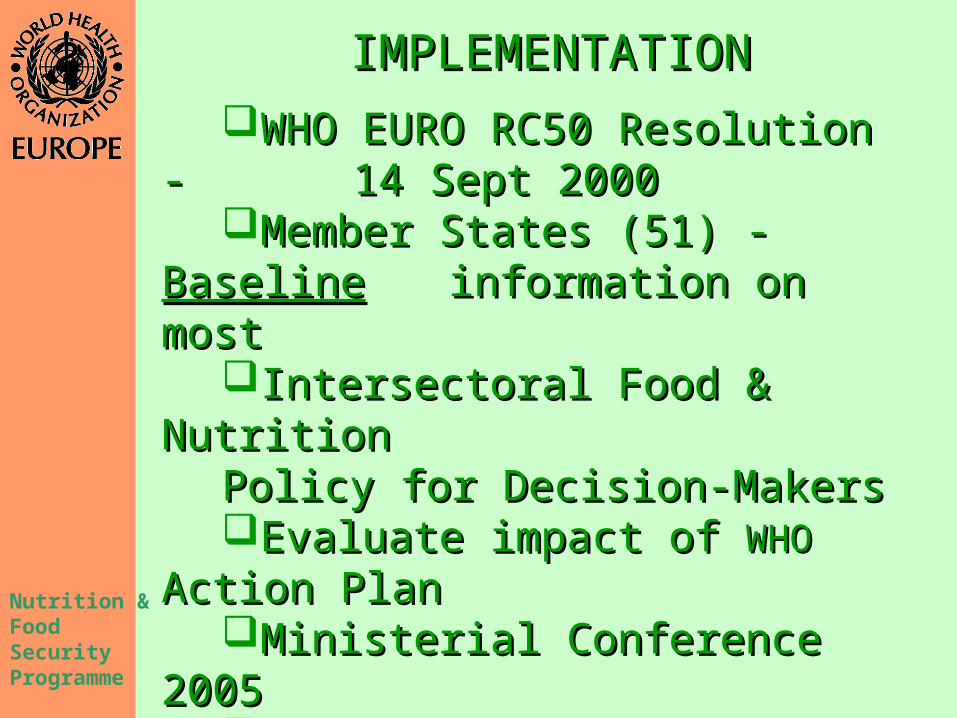
IMPLEMENTATIONIMPLEMENTATIONWHO EURO RC50 Resolution - WHO EURO RC50 Resolution -
14 Sept 2000 14 Sept 2000 Member States (51) - Member States (51) -
BaselineBaseline information on mostinformation on mostIntersectoral Food & Nutrition Intersectoral Food & Nutrition Policy for Decision-MakersPolicy for Decision-MakersEvaluate impact of Evaluate impact of WHOWHO
Action PlanAction PlanMinisterial Conference 2005Ministerial Conference 2005EU Resolution - EU Resolution - Council of Council of Ministers, 14 Dec 2000Ministers, 14 Dec 2000
Nutrition & Food Security Programme
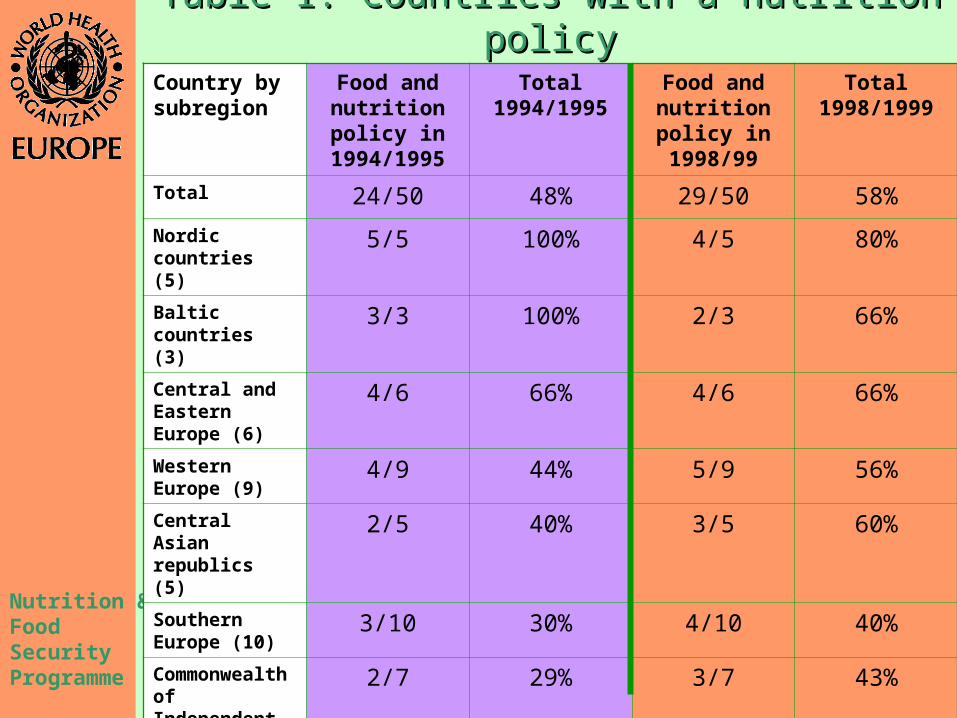
Table 1: Countries with a nutrition policyTable 1: Countries with a nutrition policyCountry by subregion
Food and nutrition policy in
1994/1995
Total 1994/1995
Food and nutrition policy in 1998/99
Total 1998/1999
Total 24/50 48% 29/50 58%Nordic countries (5)
5/5 100% 4/5 80%
Baltic countries (3)
3/3 100% 2/3 66%
Central and Eastern Europe (6)
4/6 66% 4/6 66%
Western Europe (9)
4/9 44% 5/9 56%
Central Asian republics (5)
2/5 40% 3/5 60%
Southern Europe (10)
3/10 30% 4/10 40%
Commonwealth of Independent States (7)
2/7 29% 3/7 43%
Southeast Europe (5)
1/5 20% 4/5 80%
Nutrition & Food Security Programme
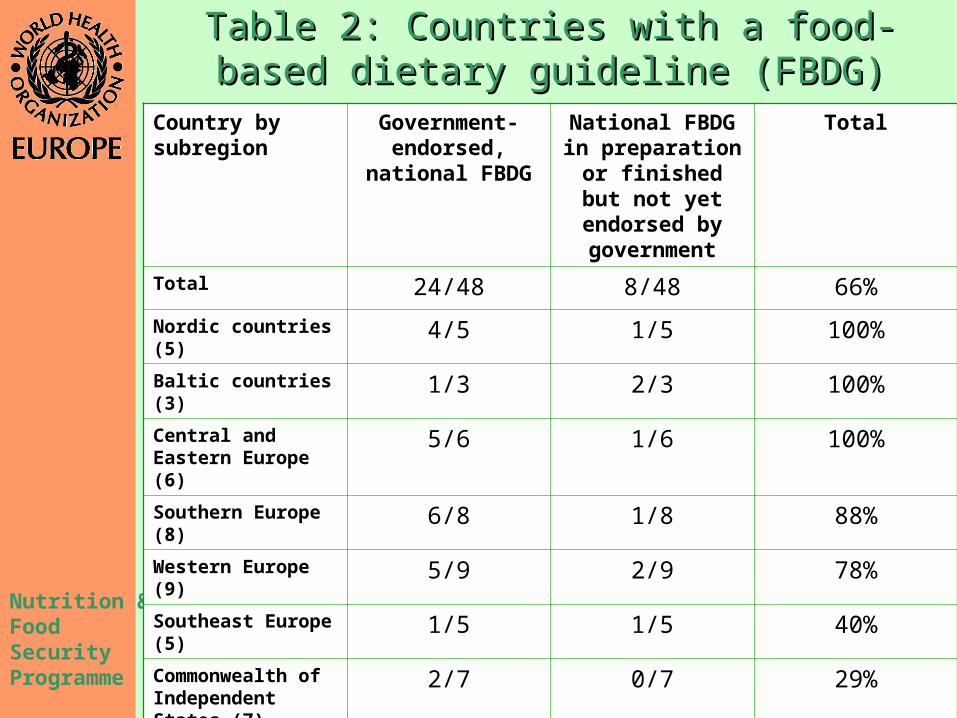
Table 2: Countries with a food-based Table 2: Countries with a food-based dietary guideline (FBDG)dietary guideline (FBDG)
Country by subregion
Government-endorsed,
national FBDG
National FBDG in preparation or
finished but not yet endorsed by
government
Total
Total 24/48 8/48 66%
Nordic countries (5) 4/5 1/5 100%
Baltic countries (3) 1/3 2/3 100%
Central and Eastern Europe (6)
5/6 1/6 100%
Southern Europe (8) 6/8 1/8 88%
Western Europe (9) 5/9 2/9 78%
Southeast Europe (5)
1/5 1/5 40%
Commonwealth of Independent States (7)
2/7 0/7 29%
Central Asian republics (5)
0/5 0/5 0%
Nutrition & Food Security Programme
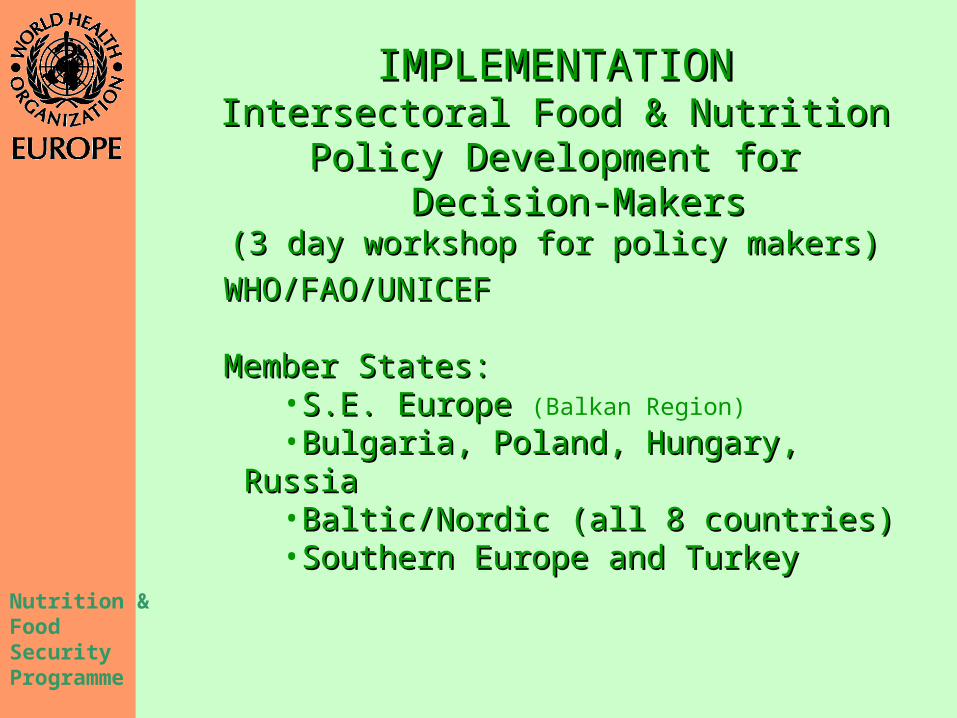
IMPLEMENTATIONIMPLEMENTATIONIntersectoral Food & Nutrition Intersectoral Food & Nutrition
Policy Development for Decision-Policy Development for Decision-MakersMakers
(3 day workshop for policy makers)(3 day workshop for policy makers)
WHO/FAO/UNICEFWHO/FAO/UNICEF
Member States:Member States:•S.E. Europe S.E. Europe (Balkan Region)
•Bulgaria, Poland, Hungary, RussiaBulgaria, Poland, Hungary, Russia•Baltic/Nordic (all 8 countries) Baltic/Nordic (all 8 countries) •Southern Europe and TurkeySouthern Europe and Turkey
Nutrition & Food Security Programme
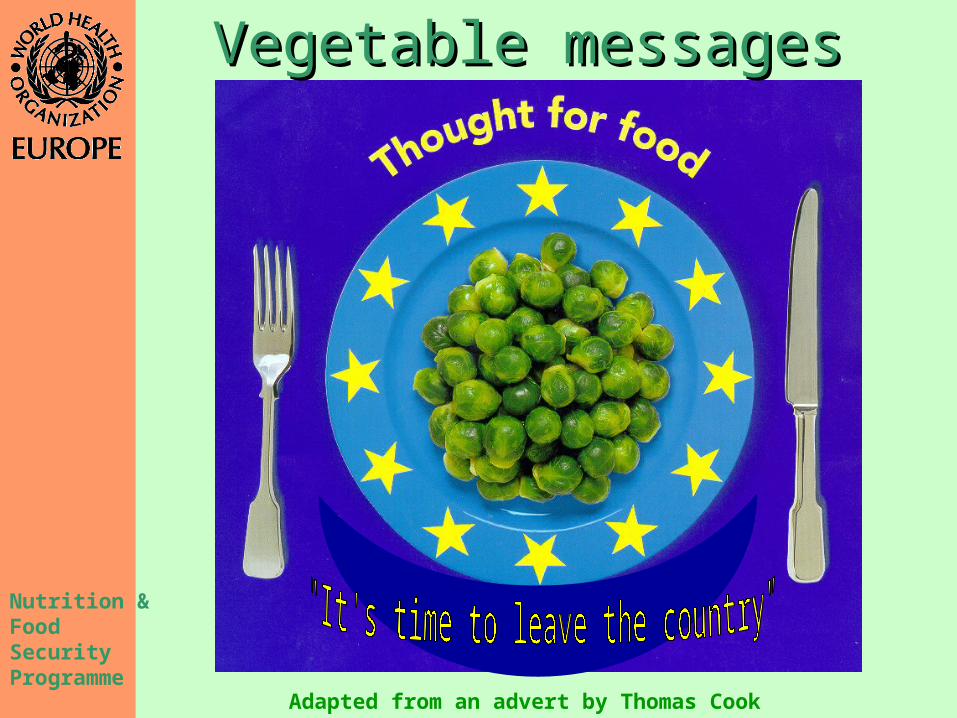
Vegetable messagesVegetable messages
Adapted from an advert by Thomas Cook
Nutrition & Food Security Programme
Eat your veggies!
I wish somebody
would start a scare about
“greens”
Nutrition & Food Security Programme
Nutrition and Food Nutrition and Food SecuritySecurityWeb SiteWeb Site
http://www.euro.who.int/Nutrition