Embed Size (px)
Citation preview

Volume 2 • Issue 3 • 1000138J Nutr Food SciISSN: 2155-9600 JNFS, an open access journal
Open AccessResearch Article
Agili et al., J Nutr Food Sci 2012, 2:3 DOI: 10.4172/2155-9600.1000138
*Corresponding author: Agili S, International potato center, Nairobi, Kenya, Tel: 0722365784; E-mail: [email protected]
Received January 05, 2012; Accepted April 21, 2012; Published April 25, 2012
Citation: Agili S, Nyende B, Ngamau K, Masinde P (2012) Selection, Yield Evaluation, Drought Tolerance Indices of Orange-Flesh Sweet potato (Ipomoea batatas Lam) Hybrid Clone. J Nutr Food Sci 2:138. doi:10.4172/2155-9600.1000138
Copyright: © 2012 Agili S, et al. This is an open-access article distributed under the terms of the Creative Commons Attribution License, which permits unrestricted use, distribution, and reproduction in any medium, provided the original author and source are credited.
Selection, Yield Evaluation, Drought Tolerance Indices of Orange-Flesh Sweet potato (Ipomoea batatas Lam) Hybrid CloneAgili S1, Nyende B2, Ngamau K2 and Masinde P2
1International potato center, Nairobi, Kenya2Jomo Kenyatta University of Agriculture and Technology, Nairobi, Kenya
AbstractOrange-Fleshed Sweet Potato (OFSP) varieties have high pro-vitamin A and medium amounts of iron and zinc.
Drought susceptibility is perceived as one of the major drawbacks of this crop type and currently available varieties do not allow sustainable and enduring production in drought affected regions. Screening and selection for OFSP for drought tolerance could have a positive impact on the livelihood and health of vitamin A deficient people in Sub-Saharan Afica (SSA). In this study 18 OFSP genotypes from Lima, Peru and two Kenyan check cultivars, Marooko (drought tolerant) and K566632 (susceptible) were screened for drought tolerance at Kiboko (Latitude 010 15’ S; Longitude 360 44’ E; Altitude 975 masl) and Marigat (Latitude 0° 38, 0” N; Longitude 36° 5, 0” E; Altitude 970 masl) during the years 2008-2009. A split-plot design was used with two levels of treatment, non-irrigated and irrigated as the main factor and the genotypes as the sub-factor. All the treatments were laid out in a randomized complete block design. Stress tolerance index was used to identify genotypes with high stress tolerance and high yield potential. In both site genotypes 194573.9, 420014, 440286, 189135.9, 187017.1 and 441725 showed high stress tolerance and yield potential compared with the check by registering higher stress index that ranged between 0.37- 0.96 and very low susceptibility index. The multidimensional preference analysis of the bi-plot distinguished the same genotypes as high yielding in both treatments imposed. Correlation analysis revealed that Yield potential (Yp) and Stress yield (Ys) had highly significant positive correlation coefficients with Stress Tolerance Index (STI), Mean Productivity (MP) and Geometric Mean Productivity (GMP) and they can be used as the most desirable indices for screening drought tolerance genotypes.
Keywords: Orange-fleshed sweet potato; Drought tolerance;Genotype; Stress Tolerance Index; Stress Intensity Index
IntroductionSweet potato is one of the most widely grown root crops in Sub-
Saharan Africa, covering around 2.9 million hectares with an estimated production of 12.6 million tons of roots in 2007 [1]. It is predominantly grown in small plots by poor farmers; hence it is known as the poor man’s food [2]. It is regarded as a food security crop because of its low input requirements, ease of production and ability to produce under adverse weather and soil conditions [3]. Its role is changing from a reliable, low-input, low-output crop to an increasingly important market crop. It combines tremendous agronomic and nutritive qualities with a short maturity period of 3-8 months after planting which makes growing two crops season in a year possible [4].
Most Sweet potato varieties grown in Africa are white, cream or yellow fleshed [5] and supply little or no Vitamin A. To date Orange-fleshed varieties introduced from other parts of the world or bred locally have been readily accepted in pilot areas in East Africa and preliminary results have shown that they contain sufficient levels of β-carotene to play an important role in eliminating Vitamin A Deficiency (VAD) [6]. VAD is responsible for night blindness, increased susceptibility to infections and impaired growth and development. One of the easiest ways to introduce more vitamin A into the diet is to consume orange-fleshed Sweet potato. This type of Sweet potato is rich in beta-carotenes that the body converts easily into vitamin A, they are easy to grow and the average consumer can easily access them. Adding 100 g of the sweet potato to the daily diet can prevent vitamin A deficiency in children and dramatically reduce maternal mortality.
Two more recent studies [7,8] in South Africa and Mozambique respectively have demonstrated that regular consumption of orange-
fleshed sweet potato (OFSP) significantly increased vitamin A status of children.
The drought susceptibility of Orange-Fleshed Sweet Potato (OFSP) is perceived as one of the major drawbacks of this crop type and currently available varieties do not allow sustainable and enduring production in drought prone regions. Traditional OFSP varieties on average produce 3t/ha which is a very low average yield compared with the introduced OFSP varieties that yield over 20t/ha. Development of improved, drought tolerant OFSP will increase Sweet potato yields especially in Arid and Semi Arid Lands (ASAL), where seasonal drought is a significant problem.
Considering the low heritability of drought tolerance and lack of efficient selection strategies, production of drought tolerance cultivars is difficult. Based on the relative yield of genotypes in both stressed and non-stressed conditions, we can identify effective traits for drought stress tolerance. In order to identify drought tolerant genotypes under such environment, some selection indices (GMP, MP, TOL, STI and SSI) have been used in different conditions [9,10] evaluated F3 and F4 generations obtained from the intersection of two durum wheat genotypes at different moisture regimes they calculated drought tolerance indices based on yield in both stressed and non-stressed
Journal of Nutrition & Food SciencesJo
urna
l of N
utrition & Food Sciences
ISSN: 2155-9600

Citation: Agili S, Nyende B, Ngamau K, Masinde P (2012) Selection, Yield Evaluation, Drought Tolerance Indices of Orange-Flesh Sweet potato (Ipomoea batatas Lam) Hybrid Clone. J Nutr Food Sci 2:138. doi:10.4172/2155-9600.1000138
Page 2 of 8
Volume 2 • Issue 3 • 1000138J Nutr Food SciISSN: 2155-9600 JNFS, an open access journal
conditions and concluded that there is meaningful correlation between yield in non-stressed environment and in stressed environment with indices MP, GMP and STI, so these indices can be appropriate
predictors of yield of a genotype in normal irrigation condition (Yp) and and yield of agenotype in water deficient condition (Ys) as compared with SSI and TOL indices. Components analysis of above
Color
-
Color
-
Color
-
- -
Genotype 440287
Color- Dark orange
Dry matter content 25%
Color
-
Color
-
25%
Genotype 420014
Color orange
Dry matter content
Genotype 422656
Color- orange
Dry matter content 25%
Genotype 441725
Color Dark orange
Dry matter content 25%
Genotype 192033.5
yellow
Dry matter content 30 %
Genotype 440240
OrangeDry matter content 30%
Genotype 421006
Orange Dry matter content 20
Genotype 440001
Dark orange
Dry matter content 25%
Genotype 187017.1
orange
Dry matter content 25 %
Genotype 189135.9 Genotype 401055 Genotype 440286
Color- Orange Color- Orange Color- Dark orange
Dry matter content-25% Dry matter content- 25 % Dry matter content-25%
Genotype194515.15 Genotype 441538 Genotype 194573.9
Color-Dark orange Color- Dark orange Color- Dark orange
Dry matter content-25% Dry matter content-25 Dry matter content-25%
Genotype 189148.21 Genotype 194549.6 Marooko
Color- Orange Color- Dark orange Color- Light cream
Dry matter content- 25% Dry matter content-25% Dry matter content- 35%
Figure 1: Genotypes screened and evaluated for drought tolerance at Kiboko and Marigat.
Citation: Agili S, Nyende B, Ngamau K, Masinde P (2012) Selection, Yield Evaluation, Drought Tolerance Indices of Orange-Flesh Sweet potato (Ipomoea batatas Lam) Hybrid Clone. J Nutr Food Sci 2:138. doi:10.4172/2155-9600.1000138
Page 3 of 8
Volume 2 • Issue 3 • 1000138J Nutr Food SciISSN: 2155-9600 JNFS, an open access journal
indices and biplot drawing in this experiment showed that genotypes with one addition component and two smaller components are suitable genotypes for moisture stressed and non stressed conditions. Fernandez [11] in his review used by-plot method to identify effective indices on evaluation and selection of Vetch genotypes stress tolerant plants and concluded that there is positive and meaningful correlation betweenYp and MP and STI indices and also between Yp and Ys with STI and MP indices. Therefore, the same indices can be introduced as appropriate indices to identify stress tolerant genotypes. Kaya et al. [12] in their study concluded that genotypes with large PC1 and small PC2 have higher yield in both stressed and non stressed conditions (stable) and genotypes with large PC1 and small PC2 have lower yield (unstable). Mollasadeghi [13] in their study on wheat genotypes concluded that indices MP, GMP and STI are very appropriate to identify high yield genotypes in both stressed and non-stressed conditions. Thus, drought indices providing a measure of drought based on yield loss under drought-conditions compared to normal conditions are being used in screening drought-tolerant genotypes [14].
A field evaluation study was conducted in two sites over a season to evaluate and select for drought tolerant orange-fleshed Sweet potato genotypes that are high in yield dry matter content and β-carotene levels.
Materials and MethodsPlant material and propagation
The genetic materials used in this study consisted of 18 genotypes with contrasting beta carotene and mineral content that were provided by International Potato Center (CIP) (Figure 1). These were imported as invitro plantlets from Lima, Peru. For initial propagation the materials were transferred into in vitro and routinely propagated from the nodal cuttings. Each node consisted of 0.2-0.5 cm stem segment with axillary with each circle lasting 2-4 weeks. The plantlets were raised on Murashige and Skoog (MS) basal solid medium, (Murashige and Skoog, 1962) containing 30g/litre sucrose and 2,8g/litre of phytogel maintained at pH 5.7. These were grown under long day conditions (16 hours of light at 3,000 lux and at temperatures ranging from 25°C to 28°C. These were later transferred to sterilized vermiculate soil in polythene bags in the screen house for a period of 2 months for acclimatization, multiplication and bulking. At harvest 24 cuttings each having a length of 30 cm were obtained from each genotyped for planting in the field.
The 18 genotypes were tested against 2 local: Marooko (drought tolerant) and K566632 (drought susceptible).
Experimental site
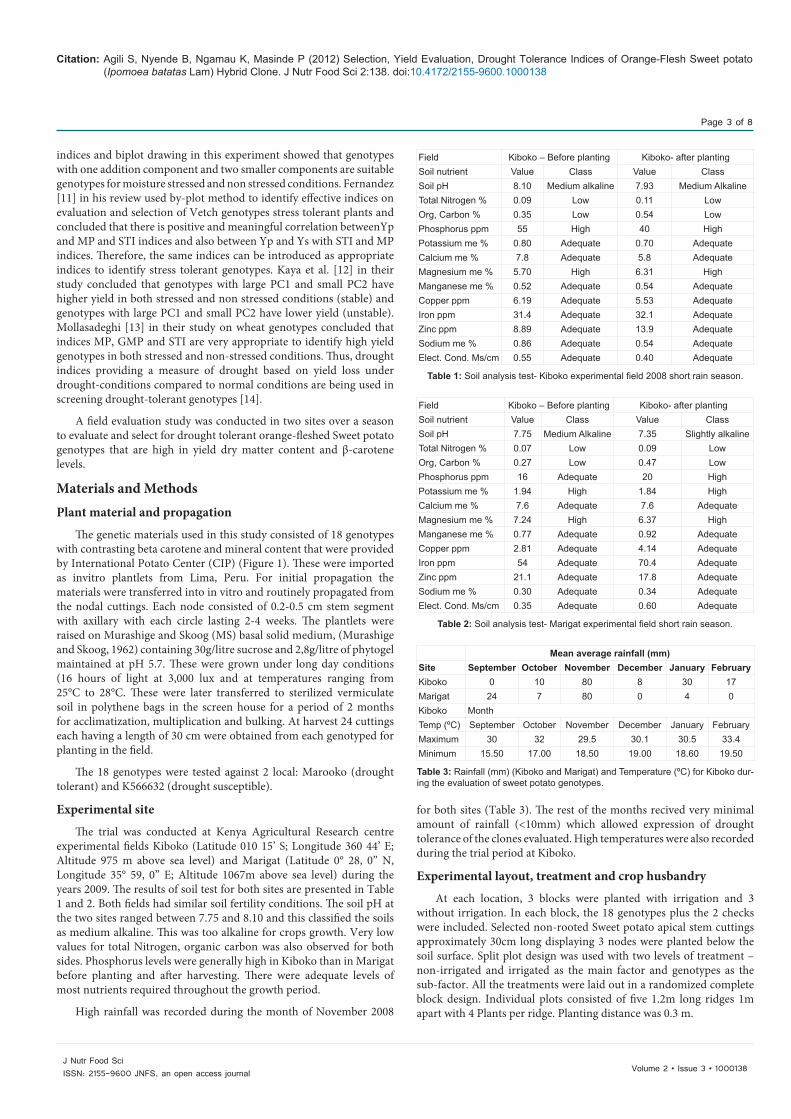
The trial was conducted at Kenya Agricultural Research centre experimental fields Kiboko (Latitude 010 15’ S; Longitude 360 44’ E; Altitude 975 m above sea level) and Marigat (Latitude 0° 28, 0” N, Longitude 35° 59, 0” E; Altitude 1067m above sea level) during the years 2009. The results of soil test for both sites are presented in Table 1 and 2. Both fields had similar soil fertility conditions. The soil pH at the two sites ranged between 7.75 and 8.10 and this classified the soils as medium alkaline. This was too alkaline for crops growth. Very low values for total Nitrogen, organic carbon was also observed for both sides. Phosphorus levels were generally high in Kiboko than in Marigat before planting and after harvesting. There were adequate levels of most nutrients required throughout the growth period.
High rainfall was recorded during the month of November 2008
for both sites (Table 3). The rest of the months recived very minimal amount of rainfall (<10mm) which allowed expression of drought tolerance of the clones evaluated. High temperatures were also recorded during the trial period at Kiboko.
Experimental layout, treatment and crop husbandry
At each location, 3 blocks were planted with irrigation and 3 without irrigation. In each block, the 18 genotypes plus the 2 checks were included. Selected non-rooted Sweet potato apical stem cuttings approximately 30cm long displaying 3 nodes were planted below the soil surface. Split plot design was used with two levels of treatment – non-irrigated and irrigated as the main factor and genotypes as the sub-factor. All the treatments were laid out in a randomized complete block design. Individual plots consisted of five 1.2m long ridges 1m apart with 4 Plants per ridge. Planting distance was 0.3 m.
Field Kiboko – Before planting Kiboko- after plantingSoil nutrient Value Class Value ClassSoil pH 8.10 Medium alkaline 7.93 Medium AlkalineTotal Nitrogen % 0.09 Low 0.11 LowOrg, Carbon % 0.35 Low 0.54 LowPhosphorus ppm 55 High 40 HighPotassium me % 0.80 Adequate 0.70 AdequateCalcium me % 7.8 Adequate 5.8 AdequateMagnesium me % 5.70 High 6.31 HighManganese me % 0.52 Adequate 0.54 AdequateCopper ppm 6.19 Adequate 5.53 AdequateIron ppm 31.4 Adequate 32.1 AdequateZinc ppm 8.89 Adequate 13.9 AdequateSodium me % 0.86 Adequate 0.54 AdequateElect. Cond. Ms/cm 0.55 Adequate 0.40 Adequate
Table 1: Soil analysis test- Kiboko experimental field 2008 short rain season.
Field Kiboko – Before planting Kiboko- after plantingSoil nutrient Value Class Value ClassSoil pH 7.75 Medium Alkaline 7.35 Slightly alkalineTotal Nitrogen % 0.07 Low 0.09 LowOrg, Carbon % 0.27 Low 0.47 LowPhosphorus ppm 16 Adequate 20 HighPotassium me % 1.94 High 1.84 HighCalcium me % 7.6 Adequate 7.6 AdequateMagnesium me % 7.24 High 6.37 HighManganese me % 0.77 Adequate 0.92 AdequateCopper ppm 2.81 Adequate 4.14 AdequateIron ppm 54 Adequate 70.4 AdequateZinc ppm 21.1 Adequate 17.8 AdequateSodium me % 0.30 Adequate 0.34 AdequateElect. Cond. Ms/cm 0.35 Adequate 0.60 Adequate
Table 2: Soil analysis test- Marigat experimental field short rain season.
Mean average rainfall (mm)Site September October November December January FebruaryKiboko 0 10 80 8 30 17Marigat 24 7 80 0 4 0Kiboko MonthTemp (ºC) September October November December January FebruaryMaximum 30 32 29.5 30.1 30.5 33.4Minimum 15.50 17.00 18.50 19.00 18.60 19.50
Table 3: Rainfall (mm) (Kiboko and Marigat) and Temperature (ºC) for Kiboko dur-ing the evaluation of sweet potato genotypes.

Citation: Agili S, Nyende B, Ngamau K, Masinde P (2012) Selection, Yield Evaluation, Drought Tolerance Indices of Orange-Flesh Sweet potato (Ipomoea batatas Lam) Hybrid Clone. J Nutr Food Sci 2:138. doi:10.4172/2155-9600.1000138
Page 4 of 8
Volume 2 • Issue 3 • 1000138J Nutr Food SciISSN: 2155-9600 JNFS, an open access journal
Normal agronomic practices were carried out including regular manual weeding and earthing-up when it was deemed necessary. Over head irrigation was done for all the blocks for 4 weeks until all the plants had established and thereafter stress treatment imposed throughout the growth period for the non-irrigated treatment but continued with irrigation for the irrigated treatment for a period of 5 months when harvesting was done.
Data measurement
During harvesting the two outer rows in each plot were left out and only the three inner rows with a net plot size of 2.4 m2 was used for data collection. For root observation total number of roots per net plot were counted and recorded. These were further weighed in kg and later converted to yields in tones per hectare.
Evaluation of susceptibility and tolerance of the genotypes
Stress tolerance index was used to identify genotypes with high stress tolerance and high yield potential. The biplot display of principal component analysis (Gabriel 1971) was used to identify stress-tolerant and high yielding genotypes and to study the interrelationship between the stress-tolerant attributes.
For every genotype, the six drought tolerance indices were calculated based on their root yield in normal irrigation and water deficit conditions. The drought tolerance indices were calculated as follows:
• StressSusceptibilityIndex[15]:
s
P
YSSI= 1- /SIY
Where: ( )s PSI=1 Y /Y
• MeanProductivity[16]:
P SY +YMP=2
• Tolerance [16]:
P STOL=Y -Y
• StressToleranceIndex[11]:
P sGMP= Y .Y
• GeometricMeanProductivity[11]:
P sGMP= Y .Y
• HarmonicMeanProductivity[17]:
p s
p s
2(Y -Y )HAR=
(Y +Y )Where:
Yp = Yield of a genotype in normal irrigation condition
Ys = Yield of a genotype in water deficit condition
PY = Mean yield in normal irrigation condition
Ys = Mean yield in water deficit condition
The biplot display of principal component analysis was used to identify stress tolerant and high-yielding genotypes and to study the interrelationship among the drought tolerance indices.
Statistical analysis
The PC-SAS procedures, GLM, PRINCOMP, GPLOT (SAS 1988)
and PRINQUAL (SAS 1988) were used in developing the SAS codes to display the biplots.
Results
Correlation matrix and estimation of drought tolerance indices
Correlation coefficients between Ys and Yp and other quantitative indices of drought tolerance were calculated for both sites (Table 4 and Figure 2 for Marigat and Table 5 and Figure 3 for Kiboko) to determine the most desirable drought tolerance criteria. High significant
Yp YS SI Mp GMP TOL SSI STIYp 1.000 0.671 0.434 0.098 0.875 0.965 0.435 0.862
0.0012 0.056 <0.0001 <0.0001 <0.0001 0.055 <0.0001YS 0.671 1.000 -0.202 0.793 0.875 0.965 0.435 0.862
0.001 0.393 <0.0001 <0.0001 <0.0001 0.055 <0.0001SI 0.434 -0.202 1.000 0.308 0.875 0.965 0.435 0.862
0.056 0.393 0.187 <0.0001 <0.0001 0.055 <0.0001Mp 0.983 0.793 0.307 1.000 0.945 0.903 0.310 0.923
<0.0001 <0.0001 0.187 <0.0001 <0.0001 0.184 <0.0001GMP 0.875 0.935 0.818 0.945 1.000 0.722 0.085 0.968
<0.0001 <0.0001 0.732 <0.0001 0.0003 0.723 <0.0001TOL 0.965 0.454 0.593 0.903 0.722 1.000 0.594 0.722
<0.0001 0.044 0.006 <0.0001 0.0003 0.006 0.0003SSI 0.435 -0.199 1.000 0.310 0.085 0.594 1.000 0.080
<0.0001 0.400 <0.0001 0.184 0.723 0.006 0.738STI 0.862 0.889 0.0773 0.923 0.967 0.722 0.075 1.000
<0.0001 <0.0001 0.746 <0.0001 <0.0001 0.0003 0.738
YP: Total root yield under normal irrigation condition; YS: Total root yield under water deficit condition; SI Susceptible index; MP: Mean productivity; GMP: Geometric mean productivity; STI: Stress tolerance index; TOL: Tolerance; SSI: Stress sus-ceptibility indexTable 4: Pearson Corrélation Coefficients (N = 20 Prob > |r| under H0: Rho=0) for various drought tolerant indices for 18 genotypes screened at Marigat.
Preference Ratings for CLONES EVALUATED IN MARIGAT
YpY
sS
IM
PG
MP
TOL
SSI
STI
YsYp SI MP GMP TOL SSI STI
Figure 2: Scatter diagrams for various drought tolerant indices for the 18 gen-otypes screened at Marigat.

Citation: Agili S, Nyende B, Ngamau K, Masinde P (2012) Selection, Yield Evaluation, Drought Tolerance Indices of Orange-Flesh Sweet potato (Ipomoea batatas Lam) Hybrid Clone. J Nutr Food Sci 2:138. doi:10.4172/2155-9600.1000138
Page 5 of 8
Volume 2 • Issue 3 • 1000138J Nutr Food SciISSN: 2155-9600 JNFS, an open access journal
correlations were found between root yield under stress environment and the drought indices Mp, GMP STI, TOL. Under irrigated condition significant correlation were found for root yield with Mp, GMP TOL and STI. The results showed high significant correlations among some drought tolerant parameters for root yield. A correlation of nearly one was found between STI and GMP and these were positively correlated with Mp and not with SSI. SSI was found to be correlated with TOL only at both sites. Using Fernandez’s [11] parameter, STI, genotypes 421066, 194573.9, 192033.5, 187017.1 and 189135.9 with the highest values in both sites were considered to be tolerant genotypes, whereas genotypes 422656, 440240, 440001, Marooko and 401055 with the lowest STI were
intolerant (Table 6 and 7). In case of the parameter TOL, the lowest difference between yields in both conditions (TOL) was observed for genotypes 401055, 440001, 422656, 441725 and 189135.9 but the highest difference belonged to genotypes 187017.1, 421066, 440286, 441097 and 194573.9. These results indicate genotypes with high STI usually have high difference in yield in two different conditions. In general, similar ranks for the genotypes were observed by GMP and MP parameters as well STI, suggesting that these three parameters are in equal for selecting genotypes. According to Fischer and Maurer’s [15] parameter, SSI, the genotypes 441725, 401055, 189135.9, 194515.2 and 440001 for Kiboko and 187017.1, 189135.9, 440287, 194549.6 and 440286 for Marigat were in the lowest, which were considered as genotypes with low drought susceptibility and high yield stability in the both conditions, whereas the genotypes 440001 and 422656 for Marigat and genotypes 440286 and 189148.2 for Kiboko with SSI values higher than unit can be identified as high drought susceptibility and poor yield stability genotypes. Similar ranks for genotypes were also found by Yield Stability Index (YSI) (Table 6). In case of comparison between the parameters to selection of the genotypes, the TOL, SSI and YSI gave same results.
Biplot analysis
Present results obtained from biplot analysis for Marigat (Table 8, Figure 4) and Kiboko (Table 9, Figure 5) confirmed correlation analysis between studied criteria. Principal Component Analysis (PCA) for both sites revealed that the first PCA explained 66.05% for Kiboko and 73.08% for Marigat of the variation with Yp, Ys, MP, GMP and STI. Thus, the first dimension can be named as the yield potential and drought tolerance. The second PCA explained 30.59% (Kiboko) and 23.14% (Marigat) of the total variability. Therefore, the second component
Yp YS SI Mp GMP TOL SSI STIYp 1.00 0.071 0.660 0.991 0.760 0.991 0.655 0.718
0.767 0.002 <.0001 0.0001 <.0001 0.002 0.0004YS 0.071 1.000 -0.569 0.203 0.676 -0.065 -0.574 0.660
0.009 0.391 0.001 0.785 0.008 0.002SI 0.660 -0.569 1.000 0.572 0.165 0.737 1.000 0.139
0.002 0.009 0.009 0.488 0.0002 <.0001 0.558Mp 0.991 0.203 0.572 1.000 0.836 0.964 0.566 0.792
<.0001 0.391 0.009 1.000 <.0001 <.0001 0.009 <.0001GMP 0.760 0.676 0.165 0.836 1.000 0.668 0.158 0.975
0.0001 0.001 0.488 <.0001 0.001 0.507 <.0001TOL 0.991 -0.065 0.737 0.964 0.668 1.000 0.733 0.628
<.0001 0.785 0.0002 <.0001 0.001 0.0002 0.582SSI 0.655 -0.574 1.000 0.566 0.158 0.733 1.000 0.131
0.002 0.008 <.0001 0.009 0.507 0.0002 0.582STI 0.718 0.660 0.139 0.792 0.975 0.628 0.131 1.000
0.0004 0.002 0.558 <.0001 <.0001 0.003 0.582
Yp: Total root yield under normal irrigation condition; YS: Total root yield under water deficit condition; SI: Susceptible index; MP: Mean productivity; GMP: Geometric mean productivity; STI: Stress tolerance index; TOL: Tolerance; SSI: Stress sus-ceptibility indexTable 5: Pearson Corrélation Coefficients (N = 20 Prob > |r| under H0: Rho=0) for various drought tolerant indices for genotypes screened at Kiboko.
Preference Ratings for CLONES EVALUATED IN MARIGAT YsYp SI MP GMP TOL SSI STI
YpY
sS
IM
PG
MP
TOL
SSI
STI
Figure 3: Scatter diagrams for various drought tolerant indices for the 18 genotypes screened at Kiboko.
Genotype Yp Ys Mp GMP TOL SSI STI421066 53.1 6.1 29.69 18.00 47.0 1.006 0.375194573.9 42.6 5.3 23.95 15.03 37.3 0.995 0.261192033.3 38.1 4.2 21.15 12.65 33.9 1.011 0.185187017.1 51.3 3.1 27.20 12.61 48.2 1.068 0.184189135.9 21.8 6.7 14.25 12.09 15.1 0.787 0.169194515.2 23.3 5.8 14.55 11.62 17.5 0.853 0.156420014 39.4 3.1 21.25 11.05 36.3 1.047 0.141441097 41.8 2.9 22.35 11.01 38.9 1.058 0.140K566632 36.9 2.9 19.90 10.34 34.0 1.047 0.124440287 33.1 2.9 18.00 9.80 30.2 1.037 0.111441725 12.2 7.8 10.00 9.76 4.4 0.410 0.110194549.6 26.9 2.7 14.80 8.52 24.2 1.022 0.084189148.2 38.8 1.7 20.25 8.12 37.1 1.087 0.076440286 41.4 1.5 21.45 7.88 39.9 1.095 0.072441538 25.3 1.5 13.40 6.16 23.8 1.069 0.044422656 12.5 2.1 7.30 5.13 10.4 0.945 0.030440240 19.6 1.3 10.45 5.05 18.3 1.061 0.029440001 8.5 2.9 5.70 4.97 5.6 0.749 0.029Marooko 16.5 1.3 8.90 4.64 15.2 1.047 0.025401055 5.0 2.3 3.65 3.39 2.7 0.614 0.013Mean 29.41 3.41 16.41 9..39 26.00 0.95 0.12LSD(0.05) 5.64 1.35 6.51 3.73 10.32 0.38 0.05
YP: Total root yield under normal irrigation condition; YS: Total root yield under water deficit condition; MP: Mean productivity; GMP: Geometric mean productivity; STI: Stress tolerance index; TOL: Tolerance; SSI: Stress susceptibility indexTable 6: Estimation of drought tolerance indices based on total root yield of sweet potato genotypes under normal irrigation and water deficit conditions in Kiboko (SI= 0.84).

Citation: Agili S, Nyende B, Ngamau K, Masinde P (2012) Selection, Yield Evaluation, Drought Tolerance Indices of Orange-Flesh Sweet potato (Ipomoea batatas Lam) Hybrid Clone. J Nutr Food Sci 2:138. doi:10.4172/2155-9600.1000138
Page 6 of 8
Volume 2 • Issue 3 • 1000138J Nutr Food SciISSN: 2155-9600 JNFS, an open access journal
can be named as stress-tolerant dimension and it separates the stress-tolerant genotypes from non-stress tolerant ones. Thus, selection of genotypes that have high PCA1 and low PCA2 are suitable for both stress and non-stress environments. PCs axes divided the genotypes into four groups. Group 1- genotypes with good performance and high drought tolerant, this included genotypes 420014,440286, 189148.2, 440287 and 441097 for Kiboko and genotypes 440286, 420014, 421006 and 189135.9 and 441725 for Marigat. These genotypes also had the highest amount of Yp, Ys, GMP, MP and STI. Group 2 which include genotypes with low performance are stable and less sensitive to drought. This group consisted of genotypes 401055, 194573.9 and 194549.6 for Marigat and genotypes 441538, 440240, 422656, 440001 and 194549.6 for Kiboko. Group 3 that included genotypes with low to moderate- yield performance and low relative sensitivity/ tolerance to drought. Genotypes that fell under this group included 422656, 440240, 441097, 194515.2, 192033.5 and 441538. Group 4 included genotypes with good performance but very sensitive to drought. Genotypes identified under this group included 421066 and 194573.9 for Kiboko and 440001 and 440287 for Marigat.
DiscussionSTI, GMP and MP were strongly correlated with yield under
both conditions, suggesting that these parameters are suitable to screen drought-tolerant, high yielding genotypes in both rainfed and irrigated conditions. Similar results were reported by Fernandez [11], Mohammadi et al. [18], Golabadi et al. [10]; Sio Se-Mardeh [9] and Mohammadi et al. [19], all of whom found these parameters to be suitable for discriminating the best genotypes under stress and irrigated conditions. In stress condition, root yield showed negative association with TOL and SSI. Similar observations were made by Bansal and Sinha [20], in wheat grain yield. Therefore, TOL and SSI indices are suitable factors to identify Sweet potato genotypes with low yield and tolerant to drought because under stress yield decreased with increasing SSI. In this study, genotypes 441725, 401055, 189135.9, 194515.2 and 440001 for Kiboko and 187017.1, 189135.9, 440287, 194549.6 and 440286 for Marigat had the lowest SSI value and therefore these genotypes had low drought susceptibility and high yield stability in both conditions, whereas genotype. 440001 and 422656 for Marigat and genotypes 440286 and 189148.2 for Kiboko with SSI values higher than unit were identified as high drought susceptible and poor yield stability genotypes.
Genotype Yp YS Mp GMP TOL SSI STI421066 30.7 8.00 19.35 15.67 22.70 0.999 0.959194573.9 32.3 6.80 19.55 14.82 22.50 1.067 0.858192033.3 25.0 7.70 16.35 13.87 17.30 0.935 0.752187017.1 26.8 6.30 16.55 12.99 20.50 0.034 0.660189135.9 17.4 7.60 12.50 11.50 9.80 0.761 0.517194515.2 21.6 6.00 13.80 11.38 15.60 0.976 0.506420014 20.4 6.29 13.30 11.25 14.20 0.941 0.494441097 18.4 4.60 11.50 9.20 13.80 1.014 0.331K566632 15.7 3.22 9.46 7.11 12.48 1.074 0.197440287 7.1 6.00 6.55 6.52 1.10 0.209 0.166441725 20.9 1.70 11.30 5.96 19.20 1.241 0.139194549.6 8.7 3.60 6.15 5.59 5.10 0.792 0.122189148.2 13.6 2.30 7.95 5.59 11.30 1.123 0.122440286 8.4 3.60 6.00 5.50 4.80 0.772 0.118441538 10.6 2.70 6.65 5.35 7.90 1.007 0.112422656 17.6 1.30 9.45 4.79 16.30 1.252 0.089440240 6.4 1.70 4.05 3.30 4.70 0.992 0.043440001 15.9 0.20 8.05 1.79 15.70 1.334 0.012Marooko 0.9 0.80 0.85 0.84 0.10 0.150 0.003401055 1.2 0.18 0.69 0.45 1.02 1.149 0.001Mean 15.98 4.03 7.67 7.67 11.96 0.94 0.31LSD(0.05) 3.56 1.04 2.16 1.84 2.96 0.12 0.10
YP: Total root yield under normal irrigation condition; YS: Total root yield under water deficit condition; MP: Mean productivity; GMP: Geometric mean productivity; STI: Stress tolerance index; TOL: Tolerance; SSI: Stress susceptibility indexTable 7: Estimation of drought tolerance indices based on total root yield of sweet-potato genotypes under normal irrigation and water deficit conditions in Marigat (SI= 0.84).
Component Cumulative % Yp YS Mp TOL SSI STI1 73.08 0.471 0.370 0.476 0.435 0.169 0.4442 96.22 0.107 -0.032 -0.032 0.304 0.763 -0.2543 99.04 -0.259 0.509 -0.090 -0.491 0.624 0.1914 100.00 0.158 0.463 0.241 0.026 0.00 -0.8385 100.00 0.335 0.307 -0.084 0.295 0.000 0.0006 100.00 -0.750 0.220 0.000 0.624 0.000 0.000
Table 8: Principal component loadings for drought tolerance indices on the 18 sweet potato genotypes screened at Marigat.
Sweetpotato Stress marigatPlot of the First Two Principal Components
4
3
2
1
0
-1
-2
-3
-4
-3 -2 -1 0 1 2 3 Prin2
440286
420014
189148.2421066
1891359
401055 Marooko194573.9
194549.6
440001
422656441097
194515.2
192033.5
441538
K566632
440240
440287
187017.1
441725* *
**
***
* ** *
**
*
**
***
*
Prin
1
Figure 4: Biplot based on first two principal component axes (PC 1 and 2) for 18 sweet potato genotypes evaluated in Marigat.
Component Cumulative % Yp YS Mp TOL SSI STI1 66.05 0.499 0.057 0.497 0.491 0.333 0.3852 96.64 -0.027 0.723 0.070 -0.125 -0.511 0.4403 99.10 -0.029 0.177 -0.259 -0.031 0.709 0.4674 100.00 0.069 0.638 0.153 -0.018 0.354 -0.0665 100.00 -0.814 0.002 0.407 0.414 0.000 0.0006 100.00 0.000 0.187 -0.070 0.688 0.000 0.000
Table 9: Principal component loadings for drought tolerance indices on the 18 sweet potato genotypes screened at Kiboko.

Citation: Agili S, Nyende B, Ngamau K, Masinde P (2012) Selection, Yield Evaluation, Drought Tolerance Indices of Orange-Flesh Sweet potato (Ipomoea batatas Lam) Hybrid Clone. J Nutr Food Sci 2:138. doi:10.4172/2155-9600.1000138
Page 7 of 8
Volume 2 • Issue 3 • 1000138J Nutr Food SciISSN: 2155-9600 JNFS, an open access journal
Similar results were reported by Golabadi et al. [10] and Talebi et al. [21], who showed that SSI can be a more useful index in discriminating better genotypes under rainfed condition. In the present study SSI and TOL were negatively correlated with Ys for both sites. Larger TOL and SSI values represent relatively more sensitivity to stress, thus smaller TOL and SSI values are favoured. Selection based on these two criteria favours genotypes with high yield potential under non-stressed conditions and low yield under stressed conditions [11]. In this study, genotypes 441725, 401055, 189135.9, 194515.2 and 440001 for Kiboko and 187017.1, 189135.9, 440287, 194549.6 and 440286 for Marigat had the lowest SSI value and therefore these genotypes had low drought susceptibility and high yield stability in both conditions, whereas genotype.440001 and 422656 for Marigat and genotypes 440286 and 189148.2 for Kiboko with SSI values higher than unit were identified as high drought susceptible and poor yield stability genotypes.
PCA was performed to assess the relationships between all attributes at once. The results obtained from biplots confirmed correlation analyses. Thomas et al. [22] observed that some 25 accessions of meadowfescue from seven countries investigated in four experiments could be distinguished based on a biplot display. The observed relations were also in agreement with those reported by Fernandez [11] in mungbean, Farshadfar and Sutka [17] in maize and Golabadi et al. [10] in durum wheat. In the present study, genotypes 420014,440286, 189148.2, 440287 and 44097 for Kiboko and genotypes 440286, 420014, 421006 and 189135.9 and 441725 for Marigat were identified as genotypes with good performance and high drought tolerant.
ConclusionGenotypes 420014, 440286, 189148.7, 44109, 440287 and 187017.1
for Kiboko and genotypes 421066, 420014, 421006 194573.9, 192033.3
and 189135.9 for Marigat were identified as genotypes with good performance, high drought tolerance, high dry matter and high levels of beta carotene. The same genotypes had higher values of STI and very low suscepttability index in both sites. Correlation analysis revealed that Yield potential (Yp) and stress yield (Ys) had highly significant positive correlation coefficients with Stress Tolerance Index (STI), Mean Productivity (MP) and Geometric Mean Productivity (GMP) and they can be used as the most desirable indices for screening drought tolerance genotypes.
Acknowledgement
• Harvest Plus
• International Potato Center
• Kenya Agriculture Research Institutes- Kiboko and Mariagat
• Jomo Kenyatta University for Agriculture , Technology (JKUAT)
References
1. FAOSTAT (2008) Production and area harvested statistics for Sweet potato for 2002.
2. Woolfe JA (1992) Post harvest procedures. Sweet Potato an Untapped Food Source. Cambridge University Press, Cambridge, UK.
3. Ndolo PJ, Mcharo T, Carey EE, Gichuki ST, Ndinya C, et al. (2001) Participatory on-farm evaluation of Sweet potato varieties in western Kenya. African Crop Science Journal 9: 41-48.
4. Bradbury H and Holloway WD (1987) Chemistry of tropical root crops: significance for nutrition and agriculture in the Pacific. Australian Centre for International Agricultural Research, Canberra, Australia.
5. Loebenstein G, Thottappilly G (2009) The Sweet potato. Library of congress, Washington DC, USA.
6. Hagenimana V, Carey EE, Gichuki ST, Oyunga MA, Imungi JK (1998) Carotenoid contents in fresh, dried and processed sweetpotato products. Ecol Food Nutr 37: 455-473.
7. van Jaarsveld PJ, Faber M, Tanumihardjo SA, Nestel P, Lombard CJ, et al. (2005) β-Carotene–rich orange-fleshed sweet potato improves the vitamin A status of primary school children assessed with the modified-relative-dose-response test1,2,3. Am J Clin Nutr 81: 1080-1087.
8. Low JW, Arimond M, Osman N, Cunguara B, Zano F, et al. (2007) A food-based approach introducing orange-fleshed sweet potatoes increased vitamin A intake and serum retinol concentrations in young children in rural Mozambique. J Nutr 137: 1320-1327.
9. Sio-Se Mardeh A, Ahmadi A, Poustini K, Mohammadi V (2006) Evaluation of drought resistance indices under various environmental conditions. Field Crops Research 98: 222-229.
10. Golabadi M, Arzani A, Mirmohammadi Maibody SAM (2006) Assessment of Drought Tolerance in Segregating Populations in Durum Wheat. Afri J Agri Res 1: 162-171.
11. Fernandez GCJ (1992) Effective selection criteria for assessing plant stress tolerance. Proceedings of the International Symposium on Adaptation of Vegetables and other Food Crops in Temperature and Water Stress. Shanhua, Taiwan.
12. Kaya Y, Palta C, Taner S (2002) Additive Main Effects and Multiplicative Interactions Analysis of Yield Performances in Bread Wheat Genotypes across Environments. Turk J Agric For 26: 275-279.
13. Mollasadeghi V (2010) Effect of potassium humate on yield and yield components of wheat genotypes under end seasonal drought stress condition. Islamic Azad University, Ardabil, Iran.
14. Mitra J (2001) Genetics and genetic improvement of drought resistance in crop plants. Curr Sci 80: 758-763.
15. Fischer RA, Maurer R (1978) Drought resistance in spring wheat cultivars. I. Grain yield responses. Aust J Agric Res 29: 897–912.
16. Rosielle AA, Hamblin J (1981) Theoretical Aspects of Selection for Yield in Stress and Non-Stress Environment. Crop Sci 21: 943–946.
Sweetpotato Stress KibokoPlot of the First Two Principal Components
4
3
2
1
0
-1
-2
-3
-4
-2 -1 0 1 2 3 4
Prin
1
Prin 2
421066
187017.1
420014440286
189148.2K566632440287
194549.6441538
440240Marooko
422656
440001
401055
194515.2189135.9
441097192033.5
194573.9
441725
*
**
******
***
** *
*
* * *
*
Figure 5: Biplot based on first two principal component axes (PC 1 and 2) for 18 sweet potato genotypes evaluated in Kiboko.

Citation: Agili S, Nyende B, Ngamau K, Masinde P (2012) Selection, Yield Evaluation, Drought Tolerance Indices of Orange-Flesh Sweet potato (Ipomoea batatas Lam) Hybrid Clone. J Nutr Food Sci 2:138. doi:10.4172/2155-9600.1000138
Page 8 of 8
Volume 2 • Issue 3 • 1000138J Nutr Food SciISSN: 2155-9600 JNFS, an open access journal
17. Farshadfar E, Sutka J (2002) Screening drought tolerance criteria in maize. Acta Agron Hungarica 50: 411-416.
18. Mohammadi R, Farshadfar E, Aghaee M, Shutka J (2003) Locating QTLs controlling drought tolerance criteria in rye using disomic addition lines. Cereal Res Comm 31: 257-263.
19. Mohammadi R, Armion M, Kahrizi D, Amri A (2010) Efficiency of screening techniques for evaluating durum wheat genotypes under mild drought conditions. International Journal of Plant Production 4: 11-24.
20. Bansal KC, Sinha SK (1991) Assessment of drought resistance in 20 accessions of Triticum aestivum and related species I. Total dry matter and grain yield stability. Euphytica 56: 7-14.
21. Talebi R, Fayaz F, Naji AM (2009) Effective selection criteria for assessing drought stress tolerance in durum wheat (Triticum durum Desf.). Gen Appl Plant Physiol 35: 64-74.
22. Thomas H, Dalton SJ, Evans C, Chorlton KH, Thomas ID (1995) Evaluating drought resistance in germplasm of meadow fescue. Euphytica 92: 401-411.