Embed Size (px)
Citation preview

FOOD AND AGRICULTURE ORGANIZATION OF THE UNITED NATIONS
NUTRITION COUNTRY PROFILE PALESTINE

Palestine Nutrition Profile – Food and Nutrition Division, FAO, 2005 2
Acknowledgments
This profile was prepared by Osman Galal, M.D., Ph.D., Professor and Director, International Health Program, Secretary General, International Union of Nutritional Sciences, UCLA School of Public Health, in collaboration with Estelle Bader and Chiara Deligia, Consultants and Marie Claude Dop, Nutrition Officer, Nutrition Planning, Assessment and Evaluation Service, Food and Nutrition Division, Food and Agriculture Organization of the United Nations. The assistance of James Geehan, Statistician, Basic Food and Agriculture Statistics Service, Food and Agriculture Organization of the United Nations, is gratefully acknowledged.

Palestine Nutrition Profile – Food and Nutrition Division, FAO, 2005 3
Summary
Situated in the Near East region, Palestine is a small, fragmented territory, involved since 1948 in a conflict with Israel. Natural resources are scarce, water resources are diminishing rapidly and the country depends primarily on imports for its sources of energy. Before the start of the second Intifada, progress had been achieved in almost all areas relevant to the Millennium Development Goals. Child mortality and maternal mortality rates were low. School enrolment was high. The poverty rate had decreased, and environmental issues were starting to be addressed. The outbreak of the Second Intifada in September 2000 is threatening these achievements. Some indicators of health, education, gender, poverty and of the environment have regressed. The political unrest has damaged the socio-economic infrastructure and shifted efforts from development into relief and humanitarian aid. The severe restrictions on movement of goods and people combined with the loss of jobs and incomes and the destruction of assets and property since September 2000 have had a major impact on food security. Currently, the dietary energy supply, mainly constituted of fruit and vegetables and cereals, is adequate but the country is highly dependent on cereals imports. As a consequence of urbanization, the diversity of the diet is progressing. Breastfeeding is a common practice but the exclusive breastfeeding rate remains low. The nutritional status of preschool children has worsened since 2000. Currently, the situation is improving slightly but one out of ten preschool children remains stunted. Major determinants of malnutrition are limited access to health services and food insecurity. Children of Gaza Strip are particularly affected. Meanwhile there are signs of a nutrition transition, as prevalence of overweight and obesity are high among adult women. Micronutrient deficiencies are still widespread. Prevalence of goitre remains high among school-age children in Middle and Southern regions of the West Bank. Despite important efforts made, a large part of the households still do not use adequately iodized salt. Subclinical vitamin A deficiency affects preschool children. An effective programme of supplementation is now in place and plans to fortify foods are envisaged. Anemia affects almost a quarter of young children and half of women of childbearing age. The coverage of iron supplementation needs to be increased.

Palestine Nutrition Profile – Food and Nutrition Division, FAO, 2005 4
Summary Table Basic Indicators Year
Population
Total population 3.805 million 2004
Rural population in West Bank 27 % 2004
Rural population in Gaza Strip 2 % 2004
Population under 15 years of age 47 % 2000
Population growth rate 3.6 % 2002
Life expectancy at birth 72 years 2000/05
Agriculture
Agricultural area in West Bank 92 % 2002
Agricultural area in Gaza Strip 8 % 2002
Arable and permanent cropland per agricultural inhabitant 1 Ha 2002
Level of development
Human development and poverty
Human development index 0.726 [0-1] 2002
Proportion of population living with less than 1$ a day (PPP) MDG1 61 % 2001
Population living below the national poverty line MDG1 70 % 2004
Education
Net primary enrolment ratio MDG2 95 % 2001/02
Youth literacy (15-24 years) MDG2 97 % 2000/04
Ratio of girls to boys in primary education MDG3 1.01 girl per 1 boy 2001/02
Health
Infant mortality rate MDG4 25 ‰ 2003
Under-five mortality rate MDG4 29 ‰ 2003
Maternal mortality ratio (adjusted) MDG5 n.a.
Tuberculosis prevalence MDG6 37 per 100 000 people 2003
Environment
Sustainable access to an improved water source in rural area MDG7 86 % of population 2002
Nutrition indicators Year
Energy requirements
Population energy requirements n.a.
Food supply
Dietary Energy Supply (DES) 2 186 kcal per capita/day 2000/02
Prevalence of undernourishment MDG1 n.a.
Percent of energy from protein 11 % 2000/02
Percent of energy from lipids 24 % 2000/02
Food diversification index 52 % 2000/02
Food consumption
Average energy intake (per capita) 2 836 kcal/day 1996/98
Percent of energy from protein 11 % 1996/98
Percent of energy from lipids 25 % 1996/98
Infant and young child feeding Age
Exclusive breastfeeding rate <6 months 27 % 2004
Timely complementary feeding rate 6-9 months n.a.
Bottle-feeding rate 0-11 months n.a.
Continued breastfeeding rate at 2 years of age n.a.
Nutritional anthropometry
Stunting in children under 5 years 9 % 2004
Wasting in children under 5 years 2 % 2004
Underweight in children under 5 years MDG1 4 % 2004
Women with BMI<18.5 kg/m² 2 % 2002
Micronutrient deficiencies
Prevalence of goitre in school-age children 15 % 1997
Percentage of households consuming adequately iodized salt 65 % 2004
Prevalence of sub-clinical vitamin A deficiency in preschool children
22 % 2004
Prevalence of vitamin A supplementation in children under 1 year 62 % 2004
Prevalence of vitamin A supplementation in mothers n.a.
Prevalence of anemia in women 47 % 2002
Prevalence of iron supplementation in mothers 44 % 2004
MDG: Millennium Development Goal; n.a.: not available

Palestine Nutrition Profile – Food and Nutrition Division, FAO, 2005 5
TABLE OF CONTENTS
Acknowledgments.................................................................................................................................. 2 Summary ................................................................................................................................................. 3 Summary Table....................................................................................................................................... 4 List of tables and figures ....................................................................................................................... 6 Acronyms ................................................................................................................................................ 7 Part I: Overview and basic indicators .................................................................................................. 8
I.1 Context ........................................................................................................................................... 8 I.2 Population...................................................................................................................................... 8
Population indicators ....................................................................................................................... 8 Population pyramid for 2004............................................................................................................ 9
I.3 Agriculture ..................................................................................................................................... 9 Land use and irrigation statistics ................................................................................................... 10 Main crops ..................................................................................................................................... 10 Livestock production and fishery ................................................................................................... 10
I.4 Economy ...................................................................................................................................... 11 I.5 Social indicators ......................................................................................................................... 11
Health indicators ............................................................................................................................ 11 Water and sanitation...................................................................................................................... 12 Access to health services .............................................................................................................. 13 Education ....................................................................................................................................... 13 Level of development, poverty....................................................................................................... 14 Other social indicators ................................................................................................................... 15
Part II: Food and nutrition situation ................................................................................................... 16 II.1 Qualitative aspects of the diet and food security................................................................... 16
Food security situation................................................................................................................... 16 II.2 National food supply data ......................................................................................................... 17
Supply of major food groups.......................................................................................................... 17 Dietary energy supply, distribution by macronutrient and diversity of the food supply.................. 17 Vegetable/animal origin of macronutrients .................................................................................... 17 Dietary energy supply by food group............................................................................................. 18 Food imports and exports expressed as percentage of DES........................................................ 18 Food aid ......................................................................................................................................... 18
II.3 Food consumption..................................................................................................................... 19 National level surveys.................................................................................................................... 19
II.4 Infant and young child feeding practices ................................................................................ 21 II.5 Nutritional anthropometry......................................................................................................... 21
Low birth weight ............................................................................................................................. 21 Anthropometry of preschool children............................................................................................. 21 Anthropometry of school-age children........................................................................................... 24 Anthropometry of adolescents ....................................................................................................... 24 Anthropometry of adult women...................................................................................................... 24 Anthropometry of adult men .......................................................................................................... 24
II.6 Micronutrient deficiencies......................................................................................................... 25 Iodine deficiency disorders (IDD)................................................................................................... 25
Prevalence of goitre and urinary iodine level ............................................................................ 25 Iodization of salt at household level .......................................................................................... 26
Vitamin A deficiency (VAD)............................................................................................................ 26 Prevalence of sub-clinical and clinical vitamin A deficiency...................................................... 26 Vitamin A supplementation........................................................................................................ 27
Iron deficiency anemia (IDA) ......................................................................................................... 27 Prevalence of IDA...................................................................................................................... 27 Interventions to combat IDA ...................................................................................................... 28
Other micronutrient deficiencies .................................................................................................... 29 II.7 Policies and programmes aiming to improve nutrition and food security .......................... 29
Reference list ........................................................................................................................................ 31
Palestine Nutrition Profile – Food and Nutrition Division, FAO, 2005 6
List of tables and figures List of tables Table 1: Population indicators ................................................................................................................. 9 Table 2: Land use and irrigation............................................................................................................ 10 Table 3: Livestock and fishery statistics ................................................................................................ 10 Table 4: Basic economic indicators....................................................................................................... 11 Table 5: Health indicators...................................................................................................................... 12 Table 6: Access to safe water and sanitation........................................................................................ 13 Table 7: Access to Health Services....................................................................................................... 13 Table 8: Education................................................................................................................................. 14 Table 9: Human development and poverty ........................................................................................... 14 Table 10: Other social indicators........................................................................................................... 15 Table 11: Food consumption data......................................................................................................... 20 Table 12: Anthropometry of preschool children .................................................................................... 22 Table 13: Anthropometry of adult women ............................................................................................. 24 Table 14: Prevalence of goitre and level of urinary iodine in school-age children ................................ 25 Table 15: Iodization of salt at household level ...................................................................................... 26 Table 16: Prevalence of sub-clinical vitamin A deficiency in children under 5 years ............................ 27 Table 17: Prevalence of anemia in preschool children ......................................................................... 28 Table 18: Prevalence of anemia in women of childbearing age............................................................ 28
List of figures � Figure 1: Vegetable/animal origin of energy, protein and lipid supplies ....................................... 17 � Figure 2: Dietary energy supply by food group............................................................................. 18

Palestine Nutrition Profile – Food and Nutrition Division, FAO, 2005 7
Acronyms
AQU Al Quds University
BMI Body mass index
CED Chronic energy deficiency
DES Dietary energy supply
DPT3 Diphtheria, pertussis (whooping cough) and tetanus vaccine – three doses
FAO Food and Agriculture Organization of the United Nations
FAOSTAT FAO Statistical Databases
FIVIMS Food Insecurity and Vulnerability Information and Mapping Systems
GDP Gross domestic product
GNP Gross national product
HIV/AIDS Human immunodeficiency virus/ acquired immuno deficiency
ICCIDD International Council for the Control of Iodine Deficiency Disorder
IDA Iron deficiency anemia
IDD Iodine deficiencies disorders
IMCI Integrated Management of Childhood Illness
ITU International Telecommunication Union
IVACG International Vitamin A Consultative Group
JHU John Hopkins University
MARAM Community Maternal and Child Initiative in the Palestinian Territories (Arabic acronym)
MICS Multiple Indicator Cluster Survey
MOH Ministry of Health
PCBS Palestinian Central Bureau of Statistics
PPP Purchase power parity
RDA Recommended dietary allowances
UNAIDS Joint United Nations Programme on HIV/AIDS
UNDP United Nations Development Programme
UNESCO United Nations Educational, Scientific and Cultural Organization
UNICEF United Nations Children’s Fund
UNPD United Nations Population Division
UNRWA United Nations Relief and Works Agency
UNS United Nations System
UNSTAT United Nations Statistics Division
USAID United States Agency for International Development
VAD Vitamin A deficiency
WB World Bank
WFP World Food Programme
WHO World Health Organization

Palestine Nutrition Profile – Food and Nutrition Division, FAO, 2005 8
Part I: Overview and basic indicators I.1 Context
Palestine is currently divided in two main territories: the West Bank, located along the northwest border of Jordan, and the Gaza
Strip of land on the Mediterranean coast, northeast of Egypt. The
West Bank is about 130 km long and 40-65 km wide and ranges in elevation from 400 m below sea level to 1 022 m above sea level. The Gaza Strip is a narrow strip of coastal plain 45 km long and 5-12 km wide, divided into five governorates. Rainfall and temperatures vary according to areas and elevations within Palestine, but in general the climate is Mediterranean, with dry and hot summers and cool and wet winters.
After 26 years of Israeli occupation, the Declaration of Principles (Oslo Agreement), signed on 13 September 1993, was a major milestone in returning control of the West Bank and Gaza Strip to the Palestinians. However, under existing arrangements, Palestine is not recognized as a sovereign state and the Palestinian Authority, the administrative authority responsible for administering the Occupied Palestinian Territory, controls only parts of the West Bank and Gaza Strip (FAO & WFP, 2004).
The two parts of the territory under the control of the Palestinian Authority, the West Bank and Gaza Strip, are not geographically contiguous and their physical separation, combined with the great difficulties in inter- and intra-connectivity between these areas and between governorates, towns and villages makes coordination and economic exchange very difficult (FAO & WFP, 2004). I.2 Population
Population indicators
The Palestinian population is distributed by type of locality in urban (56%), rural (29%) and refugee camps (15% - most in Gaza Strip). It is a very young population with 47% under 15 years (PCBS, 2004a; UNPD, 2004).
Population density varies dramatically between Gaza and the West Bank. The 1.397 million residents of the Gaza Strip are crowded into primarily urban communities and refugee camps with a density of 3 829 persons per km
2. In comparison, nearly 27% of residents of the West Bank live in rural areas,
and the population density is approximately of 426 persons per km2. Population density is expected to
increase significantly due to high population growth (PCBS, 2004a). The average household size is 5.5 in the West Bank, and 6.2 in Gaza Strip (PCBS, 2004b).
Today the number of displaced Palestinians registered with the United Nations Relief and Works Agency for Palestine Refugees in the Near East (UNRWA) totals 4.3 million, of which 39% are Internally Displaced People (IDPs), 42% are refugees in Jordan, 10% are refugees in Syria and 9% are refugees in Lebanon (UNRWA, 2005).

Palestine Nutrition Profile – Food and Nutrition Division, FAO, 2005 9
Table 1: Population indicators
Indicator Estimate Unit Reference Period Source
Total Population 3.805 million 2004 PCBS
Annual population growth rate 3.6 % 2002 PCBS
Crude birth rate 39.6 ‰ 2002 PCBS
Population distribution by age: 2000 UNPD
0-4 years 19 %
5-14 years 28 %
15-24 years 19 %
60 and over 5 %
Rural population-West Bank 27 % 2004 PCBS
Rural population-Gaza Strip 2 % 2004 PCBS
Agricultural population 6 % 2004 PCBS
Population density-West Bank 426 inhabitants per km2 2004 PCBS
Population density-Gaza Strip 3 829 inhabitants per km2 2004 PCBS
Median age 17 years 2000 UNPD
Life expectancy at birth 72 years 2000-2005 UNPD
Population sex ratio 102.7 males per 100
female 2004 PCBS
Net migration rate -2.3 ‰ 2000 UNPD
Total dependency rate 100 % 2000 UNPD
Population pyramid for 2004
Source: PCBS, 2004a I.3 Agriculture
Agriculture remains a key sector of the economy and smallholder agriculture provides a major contribution to household food security with traditional products such as olive oil, milk, cheese and vegetables (FAO, 2005).In much of the West Bank, family farms dominate the sector, especially in the western hills, with 90% of farms below 5 Ha. In the Jordan Valley, farms are relatively large, with absentee owners living in Jordan. In the Gaza Strip, there are a few large farms run by absentee owners, with the remainder being family farms. Olive trees dominate but 12% of the land is used to grow wheat and 10% to grow fruit and vegetables. About 9% of the area is used to produce feed crops

Palestine Nutrition Profile – Food and Nutrition Division, FAO, 2005 10
for animals but also some tobacco. The remaining area is used mainly to produce nuts, legumes, tubers and spices. A small area is exploited for the production of cut flowers (FAO & WFP, 2004).
Restricted access to fertile land, to adequate water supplies, and to markets limits production and export. Wages in agriculture are lower than in any other sector of the economy, especially for women. In the first quarter of 2003, agriculture, fisheries and forestry accounted for 13% of the employed in the West Bank, 20% in the Gaza Strip and 8% in Israel and the settlements (FAO & WFP, 2004).
Land use and irrigation statistics
Table 2: Land use and irrigation
Type of area Estimate Unit Reference period Source
Total Land Area 602 1000 Ha 2002 FAO
Agricultural Area-West Bank 92 % 2002 PCBS
Agricultural Area-Gaza Strip 8 % 2002 PCBS
Arable lands & Permanent Crops 38 % 2002 FAO
Permanent Crops 20 % 2002 FAO
Permanent Pasture 25 % 2002 FAO
Forested land areas 6 % 2003 PCBS
Irrigated agricultural land 3 % 2002 FAO
Arable and Permanent cropland in Ha per agricultural inhabitant
1 Ha 2002 FAO
N.B. Percents are calculated on the total land area.
Main crops
Palestine’s main agricultural productions are olives and olive oil, fruit and vegetables (tomatoes, oranges, grapes) and cut flowers (FAO, Statistics Division).
Livestock production and fishery
Livestock contributes about 45% of the gross value of agricultural production, through raising of sheep, goats, cattle, poultry and bees, particularly in parts of Central and Southern West Bank. There are concerns over the reduced capacity to control animal diseases due to restrictions on the availability of veterinary drugs and services (PCBS, 2003a; FAO & WFP, 2004).
Fish production derives mainly from marine catches in the Gaza Strip (PCBS, 2003a). In 2001-2002, the available supply of fish had declined from 2 kg to around 1 kg per capita per year, including imports. However, a small quantity of tinned fish was being distributed by UNRWA (FAO & WFP, 2004). Table 3: Livestock and fishery statistics Livestock production and fishery
Estimate Unit Reference period Source
Cattle 33 235 number of heads 2002-2003 PCBS
Sheep and Goats 1 220 800 number of heads 2002-2003 PCBS
Poultry Birds 39 960 thousands 2002-2003 PCBS
Fish catch and aquaculture 1 507 tons 2003 PCBS

Palestine Nutrition Profile – Food and Nutrition Division, FAO, 2005 11
I.4 Economy
The Palestinian economy is characterized by its heavy dependence on the Israeli economy, on official external aid and grants for development expenditure as well as on remittances and transfers from Palestinians living abroad (UN, 2003).
Since the occupation of the West Bank and the Gaza Strip in 1967 until the signing of the interim peace agreement at the end of 1995 (Paris Protocol), Israel exercised full authority over these territories resulting in the close integration of the Palestinian economy with that of Israel. Consequently its development and growth was and still is conditioned by Israeli demand for goods and labour force, whose free flow is dependent on stable political relations with Israel. Events since the signing of the interim agreements (Oslo II and Paris Protocol) have shown that the political relations with Israel and their impact on economic development remain the overriding factors that determine the level of food security for the Palestinian people (FAO & WFP, 2004). According to the Office of the United Nations Special Coordinator (UNSCO), the primary cause of the Palestinian economic crisis is a sharp rise of unemployment, primarily caused by closure and curfews (UN, 2003).
Human resources have a high potential in Palestine and are by far the most important resource in the Palestinian economy. Education indicators are fairly high, and there is a potential to develop a highly skilled workforce. Opportunities exist for the development of services, infrastructure and technology-driven activities (UN, 2003). Table 4: Basic economic indicators
Indicator Estimate Unit Reference Period Source
Gross Domestic Product per capita 1 203.4 US $ 2002 PCBS
GDP annual growth -2 % 2003 WB
Gross National Income per capita 1 110 $ 2003 WB
Industry as % of GDP 12 % 2003 WB
Agriculture as % of GDP 6 % 2003 WB
Services as % of GDP 82 % 2003 WB
Paved roads as % of total roads n.a.
Internet users 400 per 10 000
people 2003 ITU
Total debt service as % of GDP n.a.
Military Public expenditure n.a.
n.a.: not available Israel is by far Palestine’s most important trade partner, heavily dominating both imports and exports (FAO & WFP, 2004). I.5 Social indicators
Health indicators
Although Palestine health indicators were relatively satisfactory before the beginning of the current Intifada, the situation has deteriorated since then (UN, 2003).
The MOH report for 2002 indicated that infant mortality was 23‰ live births, although the report also indicated significant variations among districts/governorates. The reported under 5 mortality rate was 27‰ and overall maternal mortality was 14 per 100 000 live births among women of reproductive age (15 to 49 years) (MOH, 2003). Thanks to extremely high immunization coverage (above 90% for most antigens), communicable diseases have declined (PCBS, 2004b).
Chronic diseases including hypertension and diabetes (affecting respectively 14% and 11% of Palestinians 18-64 years old) are a significant public health concern, as are iron deficiency anemia and, more recently, undernutrition among women and children (PCBS, 2004b).
The protracted conflict is causing high levels of psychological trauma and stress among children and young people. About 48% of children report having experienced or witnessed conflict-related violence. (WB, 2004).

Palestine Nutrition Profile – Food and Nutrition Division, FAO, 2005 12
Serving approximately 70% of the population registered as refugees in the Gaza Strip and 27% of the same population in the West Bank, the United Nations Relief and Works Agency (UNRWA) is the main provider of basic services including education, health, social services. Some 1.1 million refugees live in 59 recognized camps, and UNRWA's services are located in or near these camps where there are large concentrations of refugees (Heiberg and Ovensen, 1993). In 1982, UNRWA ceased distribution of food rations to all registered refugees and began to focus instead on those refugees most in need (Bellisari, 1994). Table 5: Health indicators
Indicator Estimate Unit Reference Period Source
Mortality
Infant mortality 25 ‰ 2003 PCBS
Under-five mortality 29 ‰ 2003 PCBS
Maternal mortality ratio : UNICEF
reported 14 per 100 000 live births
2002 MOH
adjusted n.a.
Morbidity
Prevalence of diarrhoea in the last 2 weeks in under-fives
7 % 2003 PCBS
Oral Rehydration rate among under-fives
n.a.
Percentage of under-fives with acute respiratory infections in the last 2 weeks
17 % 1998-2003 UNICEF/MICS
Tuberculosis prevalence 37 per 100 000
people 2003 UNSTAT
AIDS/HIV
Prevalence in adults 1.8 % 2001 UN
Percentage of women (15-24) who know that a person can protect herself from HIV infection by consistent condom use
38 % 2003 UNSTAT
Immunization
Percent of infants with immunization against tuberculosis at 1 year of age
99 % 2003 UNICEF/WHO
Percent of infants with DTP3 immunization at 1 year of age
98 % 2003
UNICEF/WHO
Percent of infants with immunization against measles at 1 year of age
95 % 2003
PCBS
Percent of pregnant women immunized against tetanus
35 % 2003 PCBS
n.a.: not available
Water and sanitation
Water resources are diminishing in Palestine. The total amount available to the Palestinians is only 216 Million Cubic Meters (MCM), of which almost 70% is allocated to agriculture, leaving only 56 MCM for domestic use. This represents less than 70L per capita per day, far below the water deprivation level defined by WHO, which is 120L per capita per day. Signs of a desertification process have been identified in various parts of the country (UN, 2003).
The construction of the Separation Barrier had caused the destruction or confiscation of a number of wells and water sources (PCBS, 2004a). Water shortages often occur, and water network cuts as well as electricity cuts are frequent (FAO & WFP, 2004).

Palestine Nutrition Profile – Food and Nutrition Division, FAO, 2005 13
Table 6: Access to safe water and sanitation
Indicator Estimate Unit Reference period Source
Sustainable access to an improved water source:
Urban 97 % of population 2002 WHO
Rural 86 % of population 2002 WHO
Access to improved sanitation:
Combined urban/rural 76 % of population 2002 UNICEF
Access to health services
UNRWA provides health services to a significant segment of the population, particularly in the Gaza Strip. The public sector along with UNRWA clinics provides the immunizations recommended for children and women (tetanus toxoid) free of charge (UNRWA, 2000). The healthcare services provided by UNRWA are provided on the basis of one health clinic per 10 000 persons (Marshy, 1999). The continued extension of the Separation Barrier, conflict-related curfews, check points and movement restrictions have a negative effect on health, limiting –and sometimes preventing– access to health facilities by medical staff and patients, and affecting refuse collection thus leading to the creation of inappropriate temporary dumpsites (UNRWA, 2000; WB, 2004). Table 7: Access to Health Services
Indicator Estimate Unit Reference
Period Source
Health personnel: number of physicians 84 per 100 000
people 1990-2003 WHO
Population with sustainable access to affordable essential drugs
n.a.
Percent of births attended by skilled health personnel
97 % 1995-2002 UNICEF
Public expenditure on Health n.a.
n.a.: not available
Education
The Palestinian net enrolment rate is the highest of the Near East region. Despite the fact that the country is classified as lower middle-income since the mid-1990s, it performs at an upper middle-income country’s level in terms of education (UN, 2003).
Educational services are undertaken by the public sector (69%), UNRWA (25%) and the private sector (6%) (PCBS, 2004a). The quality of primary education has been maintained at pre-Intifada levels, but that of higher education is deteriorating. The Palestinian Authority’s deteriorating financial situation, the drop in payment of student tuition fees due to increasing poverty, the destruction of infrastructure and severe restrictions on movement have created a difficult environment for the development of the education sector. If this situation continues, the positive trend witnessed in the second half of the 1990s could suffer a significant setback (UN, 2003; WB, 2004).

Palestine Nutrition Profile – Food and Nutrition Division, FAO, 2005 14
Table 8: Education
Indicator Estimate Unit Reference
Period Source
Adult literacy 89 % 2001 PCBS
Adult literacy rate : females as % of males n.a.
Youth literacy (15-24 years) 97 % 2000-2004 UNESCO
Net primary enrolment ratio 95 % 2001-2002 UNESCO
Grade 5 completion rate n.a.
Ratio of girls to boys in primary education 1.01 number of girls
per 1 boy 2001-2002 UNESCO
Public expenditure on education n.a.
n.a.: not available
Level of development, poverty
Following the outbreak of the second Intifada, poverty increased sharply in Palestine. It is estimated that poverty rates are unlikely to decrease if the current political situation persists (UN, 2003). Nearly one-half of all Palestinians live below the poverty line. More than 16% of the population cannot afford even basic necessities. The precipitator of this economic crisis has been a multi-faceted system of restrictions on the movement of Palestinian people and goods including the building of the Separation Barrier, which the Government of Israel argues is essential to protect Israelis in Israel and in the settlements. Unemployment increased from 10% on the eve of the Intifada to about 25% in 2003 (WB, 2004), and wages diminished, particularly for the poorer categories of population (UN, 2003).
Donors disbursed US$883 million in 2003 to sustain social service delivery, as well as US$264 million for food aid, job creation programmes and cash assistance for the poorest. It is estimated that these programmes prevented an increase of 35% of the proportion of people falling under the subsistence level (WB, 2004). Table 9: Human development and poverty
Indicator Estimate Unit Reference period Source
Human development index 0.726 value
between 0-1 2002 UNDP
Proportion of population living with less than 1$ a day (PPP)
61 % 2001 UN
Population living below the national poverty line
70 % 2004 WB
Human poverty index (HPI-1) n.a.
n.a.: not available

Palestine Nutrition Profile – Food and Nutrition Division, FAO, 2005 15
Other social indicators
Although progress was made in the last eight years in reducing gender inequity in education, thanks to UNRWA’s education system and to the Palestinian Authority’s positive measures, improved participation of women in economic and political decision-making did not materialize. Women represent 13% of all employees, but only 3% occupy key managerial positions (UN, 2003).
The Palestinian Labour Law prohibits the employment of children before the age of 15, as well as the employment of children between 15-18 years in industries hazardous to their safety or health, in night work, or on official holidays. Nonetheless, about 6% of children 10-17 year old were in the labour force in 2000, and this figure is estimated to have grown since the beginning of the second Intifada due to increased poverty (UN, 2003; UNICEF & Birzeit University, 2004).
Table 10: Other social indicators
Indicator Estimate Unit Reference
period Source
Gender related development index (GDI) n.a. value
between 0-1 n.a.
Women’s wage employment in non-agricultural sector as % of total non agricultural employees
16.8 % 2003 UNSTAT

Palestine Nutrition Profile – Food and Nutrition Division, FAO, 2005 16
Part II: Food and nutrition situation II.1 Qualitative aspects of the diet and food security
Food security situation
Food security is defined as “A situation that exists when all people, at all times, have physical, social and economic access to sufficient, safe and nutritious food that meets their dietary needs and food preferences for an active and healthy life” (FIVIMS). Food insecurity may be caused by the unavailability of food, insufficient purchasing power, inappropriate distribution, or inadequate use of food at the household level. Food insecurity may be chronic, seasonal or transitory.
The progress towards achieving increased access to food for all was abruptly disrupted by the onset of the second Intifada in September 2000. The severe restrictions on the movement of goods and people both within and between the West Bank and the Gaza Strip combined with the loss of jobs and incomes and the destruction of assets and property since September 2000 has had a major impact on food security (FAO, 2003). A World Food Programme food-security assessment conducted in June 2004 found that 1.3 million people – 37% of the population – are food-insecure, comprising 752 000 non-refugees and 564 000 refugees. Despite positive political signs during early 2005, a considerable part of the population is likely to remain food-insecure and in need of assistance until closures are lifted, employment opportunities increase and the economy recovers (WFP, 2005a).
In Palestine, food insecurity is partly due to reduced availability of food but mainly to reduced access. The quantity of available food has been reduced as a decline in agricultural and livestock productions has occurred. Nevertheless, the overall supply of food, increasingly from imports, is adequate for the depressed market, but there are problems in getting it to the local markets. Since September 2000, farmers have faced several obstacles. Access to their land and markets has been restricted. Checkpoints blockaded and destroyed or blocked roads have created logistical problems and extreme transport cost increases. It has become mostly impossible to move inputs to producers or outputs to processors or to internal or external markets in a timely manner (FAO, 2003).
A large share of the agricultural land area is used to produce rainfed crops. But the characteristics of the land, the variability in annual rainfall and the limited supply of freshwater results in extreme year-to-year fluctuations in the production of food. The limited supply and high cost of water restrict the expansion of irrigated areas and the cost of water can only be covered by relatively high value crops. Cereals, legumes and oilseeds are not high value crops. The instability in agricultural production is a major problem for the producers, but is of minor consequence to the consumers as they depend primarily on commercial and food aid imports of flour, rice, wheat and cereal preparations which make up most of the diet (FAO, 2003).
The loss of jobs and consequently the loss of economic access to food is the primary reason for the massive increase in food insecurity. Many households do not have the ability to purchase food when it is available and a large share of them have shifted to lower cost foods that provide a less nutritious diet. The numbers of meals, the portion size and the frequency by which certain foods are consumed have all been reduced. Many meals consist solely of bread and tea. Cereals and increasingly potatoes, pulses, the cheaper vegetables and fruit form the core of the diet (FAO, 2003).
With rising unemployment, falling incomes and increasing numbers of dependant household members, per capita household incomes fall sharply and many households are forced to find alternative means to provide food. Households have responded to these severe livelihood constraints by adopting a variety of short-term coping mechanisms. For many the first coping strategy was to cut expenditures on food, health, key social events and utility bills. Living with extended family members to save rent and pooling resources is another common strategy, as well as selling assets. Traditional coping mechanisms such as rearing small livestock and planting home gardens are employed to a greater degree although this can rarely meet all of households’ food requirements. Home-gardens are used as a source of food by half of the West Bank respondent households. However, the cost of inputs and lack of access to water are constraints (FAO, 2003).

Palestine Nutrition Profile – Food and Nutrition Division, FAO, 2005 17
II.2 National food supply data
Supply of major food groups
In 2000/02, in terms of per capita supply for human consumption, the major food groups were fruit and vegetables (703g/day) and cereals (364g/day). Fruit and vegetables are comprised of oranges, mandarins, grapes and tomatoes, all mainly coming from the local production. Wheat and rice are the major cereals. Wheat is mainly imported and the totally of rice is imported. The daily supply was complemented with starchy roots (50g/per capita/day), vegetable oils (30g/per capita/day) and pulses, nuts and oilcrops (18g/per capita/day). Potatoes, locally produced are the main component of starchy roots. Vegetable oils include olive oil and soyabean oil. The daily per capita supply of animal products was constituted of 181g of milk and eggs, 91g of meat and offals, 3g of fish and 2g of animal fats. Poultry meat, which is locally produced, is the major component of the supply of meat. The supply of sweeteners was high, estimated at 92g/per capita/day (FAO, FAOSTAT Database).
Dietary energy supply, distribution by macronutrient and diversity of the food supply
In 2000/02, the dietary energy supply (DES) was of 2 186 kcal per capita/day. The share of macronutrients in the total DES was 65% for carbohydrates, 24% for lipids and 11% for protein (FAO, FAOSTAT Database). The current percentage of lipids is adequate with respect to recommendations (energy from lipids not exceeding 30%) (WHO, 2003).
Vegetable/animal origin of macronutrients
• Figure 1: Vegetable/animal origin of energy, protein and lipid supplies
Figure 1: Origin of energy, protein and lipid supplies, 2000-2002
87
64 69
13
36 31
0
20
40
60
80
100
Energy Protein Lipid
Vegetable/animal origin
(in % )
Percentage of animal originPercentage of vegetable origin
Palestine, 2000-2002 Source: FAOSTAT
The food supply is mainly constituted of vegetable products. Animal foods represent about one third of the supply of protein and lipids and only 13% of the energy supply in 2000/02 (FAO, FAOSTAT Database). The limited supply of animal products results in low intake and/or low bioavailability of iron, vitamin A and calcium.

Palestine Nutrition Profile – Food and Nutrition Division, FAO, 2005 18
Dietary energy supply by food group
• Figure 2: Dietary energy supply by food group
Other 1%
Animal fats 1%Starchy roots 2%
Palestine
Source: FAOSTAT
Figure 2: Percentage of energy provided by major food group in 2000-2002
N.B. Values under 1% are not presented.
Cereals (excl. beer) 46%
Sw eeteners 13%
Vegetable oils 12%
Fruit and vegetables 10%
Milk and eggs 7%
Meat and offals 6%
Pulses, nuts, oilcrops 2%
Cereals, sweeteners and vegetable oils provided 71% of the total DES. The share of cereals remains important, constituting 46% of the total DES in 2000/02. Sweeteners ranked second with a share of 13% of DES, followed by vegetable oils (12%). Major animal products contributing to DES were meat and offals and milk and eggs, each food group contributing about 6% of the DES (FAO, FAOSTAT Database). In 2000/02, the food diversification index was 52%, indicating a relatively high diversity of the diet.
Food imports and exports expressed as percentage of DES
The country exports cereals (wheat), vegetable oils (olive and sesameseed oil) and vegetables (tomatoes). Nevertheless, these food exports are limited and represent together only about 5% of the DES (FAO, FAOSTAT Database).
The country is dependant on imports of cereals for human food consumption (mainly wheat), which constitute 59% of the DES. Sweeteners and vegetable oils (soyabean oil) are other major food imports constituting 13% and 8% respectively of the DES (FAO, FAOSTAT Database).
Food aid
UNRWA is the largest food aid provider and is responsible for providing food aid to the refugee population while the World Food Programme (WFP) is the largest food aid provider to non refugees. UNRWA distributes food aid to the following groups: refugee hardship cases, pregnant and lactating women fron the 3
rd month of pregnancy until 6 months after birth and emergency affected refugees.
Altogether it distributes food to over 3.6 million registered Palestine refugees in West Bank, Gaza Strip, Jordan, Lebanon, and Syria (UN, 2003).
WFP on the other hand targets: female headed households, orphans, elderly, the chronically ill and persons who have become poor because of the restricted movement and increased unemployment. In addition, WFP provides food aid via clinics, food for work, and food for training activities (MOH, 2005).
In 2004, Palestine received a food aid of 183 886 t from WFP, of which 170 045 t of cereals (mainly wheat, wheat flour and rice) and 13 840 t of non-cereals (mainly pulses, other non-cereals, oils and fats). This food aid was mainly delivered as emergency (179 539 t) and project aid (4 346 t). No programme food aid was delivered
1 (WFP, 2005b). The WFP has been providing food assistance since 1991. The
1 Emergency food aid is destined to victims of natural or man-made disasters; Project food aid aims at supporting specific
poverty-alleviation and disaster-prevention activities; Programme food aid is usually supplied as a resource transfer for balance of payments or budgetary support activities. Unlike most of the food aid provided for project or emergency purposes, it is not targeted to specific beneficiary groups. It is sold on the open market, and provided either as a grant, or as a loan.

Palestine Nutrition Profile – Food and Nutrition Division, FAO, 2005 19
emergency operation, which ended in August 2005, assisted 480 000 food-insecure non-refugee Palestinians (WFP, 2005a).
Food aid delivered by UNRWA was rendered to more than 200 000 families in the Gaza Strip and the West Bank (UNRWA, 2003). II.3 Food consumption
National level surveys
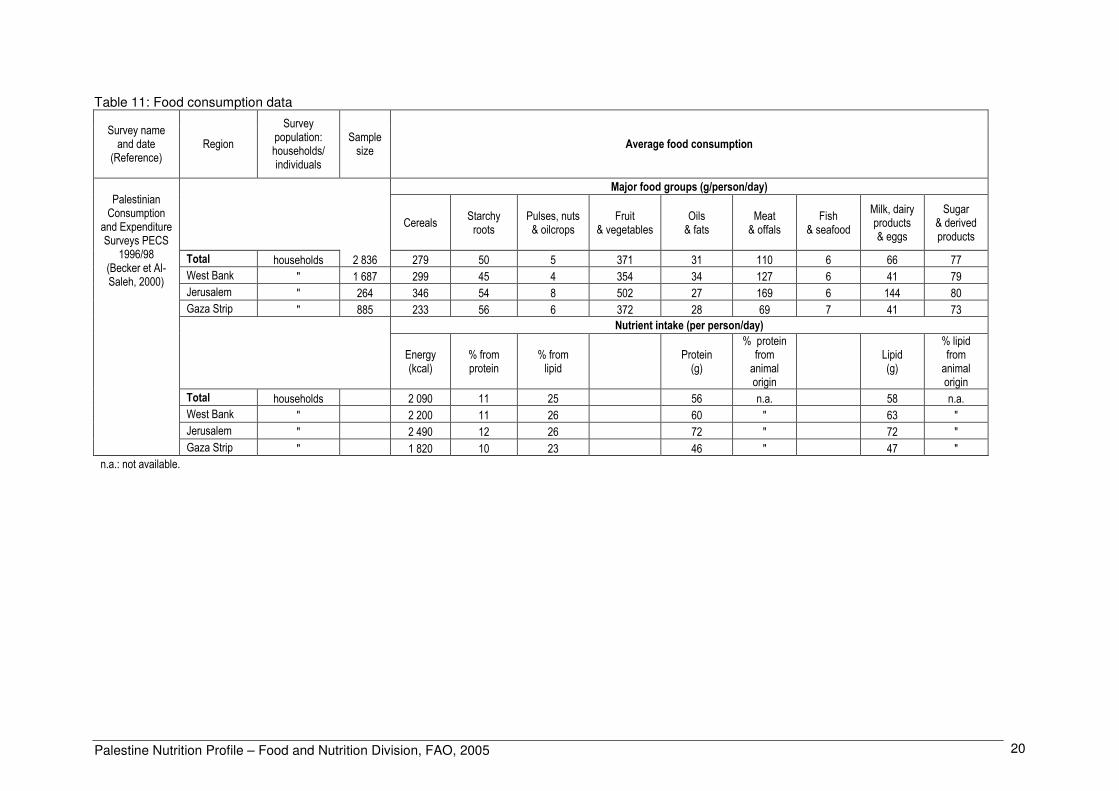
The Palestinian Central Bureau of Statistics conducted a Consumption and Expenditure Survey (PECS) in 1998. Thereafter a mission used the PECS data to extract more information on the food and nutrient consumption of households (Becker & Al-Saleh, 2000). Fruit and vegetables and cereals constituted the staple foods. The consumption of meat and offals, relatively high, was a good source of micronutrients, as well as other animal food products such as milk and dairy products. Nevertheless, important differences can be observed according to territory. The consumption of cereals, meat, milk and eggs, fruit and vegetables was higher in Jerusalem. In Gaza Strip, the overall consumption was reduced, except for starchy roots and fish. As a result, macronutrient intake was particularly low in this area. Energy intake was only of 1 820 kcal/per capita/day in Gaza while it reached 2 490 kcal/per capita/day in Jerusalem. The intake of protein and lipid was about 46g/per capita/day in the Gaza Strip and 72g/per capita/day in Jerusalem (Becker & Al-Sahel, 2000).
Several sources reported a decrease in food consumption since the beginning of the current Intifada in September 2000. It is estimated that the real per capita food consumption decreased by 25% compared to 1998. In Gaza Strip, 69% of the 1 251 families interviewed were eating 3 meals a day, whilst 22% were eating only two meals a day and 9% only one meal a day, in March 2003 (UNS, 2004).
In 2003, a survey documented the intake of children 13-59 months of age (n=2 027), based on a 24-hour recall by their mothers. It revealed that 56% of children 1-3 years in the West Bank and 62% of the children in the Gaza Strip had low energy intakes (<80% of the Recommended Energy Allowances, corresponding to 1 040 kcal/day). For children 4-5 years, 86% and 93% had low energy intakes (below 1 440 kcal/day) in the West Bank and in the Gaza Strip, respectively (NRC, 1989; USAID & CARE, 2003).
A previous survey based on the same methodology was conducted in 2002 among 477 children aged 13-59 months. Comparison with the 2003 survey shows that the percentage of children with low energy intakes had increased from 2002 to 2003 (USAID, JHU, AQU & CARE, 2002; USAID & CARE, 2003).
In 2002, over half of Palestinian mothers had energy deficient diets, increasing with age to three quarters of women in their fifties (USAID, JHU, AQU & CARE, 2002).
In conclusion, more than half of young children and more than half of mothers had low energy intake, and people living in Gaza Strip were particularly affected.
Palestine Nutrition Profile – Food and Nutrition Division, FAO, 2005 20
Table 11: Food consumption data
Survey name and date
(Reference) Region
Survey population: households/ individuals
Sample size
Average food consumption
Major food groups (g/person/day)
Cereals Starchy roots
Pulses, nuts & oilcrops
Fruit & vegetables
Oils & fats
Meat & offals
Fish & seafood
Milk, dairy products & eggs
Sugar & derived products
Total households 2 836 279 50 5 371 31 110 6 66 77
West Bank " 1 687 299 45 4 354 34 127 6 41 79
Jerusalem " 264 346 54 8 502 27 169 6 144 80
Gaza Strip " 885 233 56 6 372 28 69 7 41 73
Nutrient intake (per person/day)
Energy (kcal)
% from protein
% from lipid
Protein (g)
% protein from animal origin
Lipid (g)
% lipid from animal origin
Total households 2 090 11 25 56 n.a. 58 n.a.
West Bank " 2 200 11 26 60 " 63 "
Jerusalem " 2 490 12 26 72 " 72 "
Palestinian Consumption
and Expenditure Surveys PECS
1996/98 (Becker et Al-Saleh, 2000)
Gaza Strip " 1 820 10 23 46 " 47 "
n.a.: not available.

Palestine Nutrition Profile – Food and Nutrition Division, FAO, 2005 21
II.4 Infant and young child feeding practices
In Palestine, almost all children were breastfed (96% in 2004) and therefore received the nutritional and protective benefits of breastmilk. The percentage of infants and young children ever-breastfed was similar in the Gaza Strip and in the West Bank in 1996 and in 2004 (96%). Exclusive breastfeeding was not widespread. Indeed this practice only concerned one quarter (27%) of children under 6 months of age in the West Bank and in the Gaza Strip (24%). Nevertheless, progress has been made since 2000 at which time only 18% of children under 6 months in West Bank and 15% in Gaza Strip were exclusively breastfed. Continued breastfeeding rate at age of 9-12 months was 59% in the West Bank and 74% in the Gaza Strip. Early introduction of food, including inappropriate foods, was widespread (PCBS, 2004b).
Exclusive and prolonged breastfeeding is widely promoted. Nonetheless, the rate of exclusive breastfeeding is low and the Ministry of Health (MOH) has responded by forming a Breastfeeding Committee. The objectives are to raise public awareness, to lobby for endorsement and implementation of the International Code on Breast Milk Substitutes, and to develop a strategy to promote the Baby Friendly Hospital Initiative. MOH clinics recently started to implement the Integrated Management of Childhood Illness (IMCI) programme, which includes appropriate infant and young child feeding practices (MOH, 2005). II.5 Nutritional anthropometry
Low birth weight
In 2000, more than 95% of newborns were weighed. The prevalence of low birth weight (less than 2 500g) estimated with no adjustment was 9% (UNICEF, Low Birthweight Database; PCBS, 2000). Low birth weight is probably not only related to maternal undernutrition but also due to various factors including the young age of mothers, multi-parity, poverty and maternal anemia (MOH, 2005).
Anthropometry of preschool children
Three consecutive surveys document the nutritional status of preschool children (PCBS, 1996; USAID, JHU, AQU & CARE, 2002; PCBS, 2004b).
In 2004, 9% of children under 5 years living in the West Bank and Gaza Strip were stunted. There was no wasting. The prevalence of underweight was 4%. Children in Gaza Strip were slightly more affected by stunting (11%) than children in West Bank (9%) (PCBS, 2004b).
The previous survey of 2002 showed a higher prevalence of malnutrition. Among children aged 6-59 months, the prevalence of stunting had reached 12% and that of wasting was 8%. The nutritional situation was particularly of concern in Gaza Strip, where it was worse than in West Bank for both wasting and stunting. The prevalence of wasting was particularly high in the rural sector of the Gaza Strip (22%). The prevalence of stunting was higher in children of mothers with a low education level (USAID, JHU, AQU & CARE, 2002).
In 1996, the prevalence of stunting was 7% in the West Bank and 8% in Gaza Strip. There was no wasting in the West Bank and the prevalence was 4% in Gaza Strip (PCBS, 1996).
The nutritional situation worsened considerably between 1996 and 2002, most probably in relation with the onset of the second Intifada in September 2000, which considerably affected food security and health of the whole population. The prevalence of stunting and wasting rose by 10 and 9 percentage points respectively in Gaza Strip during this period. In the West Bank, the increase of stunting and wasting was much less significant (PCBS, 1996; USAID, JHU, AQU & CARE, 2002). Overweight was not of concern among preschool children in 1996, and more recent data are not available (PCBS, 1996).
Determinants of the situation are inadequate feeding practices and lack of access to health care due to insecurity and poverty, in addition to food insecurity. A study of outpatient clinic practices points to a serious lack of recognition and treatment of malnutrition among Palestinian children. It is clear that health providers underestimate the magnitude of the malnutrition problem in their community, limiting their ability to detect it and manage it. Only 60% of preschool children were documented to have had anthropometric measurements taken during clinic visits and among those who were measured, only 60% of malnourished cases were recognized. Most clinics lack protocols or guidelines for diagnosing malnutrition (Alden et al, 2003).

Palestine Nutrition Profile – Food and Nutrition Division, FAO, 2005 22
Table 12: Anthropometry of preschool children
Prevalence of malnutrition
Percentage of children with
Stunting Wasting Underweight
Height-for-age Weight-for-height Weight-for-age
Name/date of survey
(month/year) (Reference)
Background characteristics
Age (years)
Sex Sample size
< -2 Z-scores* < -2 Z-scores* < -2 Z-scores*
Total 0-4.99 M/F 4 824 9.4 1.9 4.0
Region
West Bank 0-4.99 M/F 2 780 8.6 2.1 4.0
Gaza Strip 0-4.99 M/F 2 044 11.0 1.4 4.0
Demographic and Health Survey
(2004) (PCBS, 2004b)
Total 0.5-4.99 M/F 936 11.7 7.8 n.a.
Sex
0.5-4.99 M 485 14.6 9.7 n.a.
0.5-4.99 F 451 11.8 8.9 n.a.
Age
0,5-1,99 M/F 321 15.3 8.7 n.a.
2-4.99 M/F 615 12.2 9.6 n.a.
Residence
urban 0.5-4.99 M/F 353 15.9 9.3 n.a.
rural 0.5-4.99 M/F 310 11.3 12.3 n.a.
Region
West Bank 0.5-4.99 M/F 416 7.9 4.3 n.a.
West Bank urban 0.5-4.99 M/F 254 8.3 4.7 n.a.
West Bank rural 0.5-4.99 M/F 162 7.4 3.7 n.a.
Gaza Strip 0.5-4.99 M/F 520 17.5 13.3 n.a.
Gaza Strip urban 0.5-4.99 M/F 372 18.3 9.9 n.a.
Gaza Strip rural 0.5-4.99 M/F 148 15.5 21.6 n.a.
Refugee camp 0.5-4.99 M/F 273 12.1 5.9 n.a.
Mother's education
no education 0.5-4.99 M/F 136 17.6 10.3 n.a.
primary 0.5-4.99 M/F 370 14.3 12.4 n.a.
Nutritional Assessment of the West Bank and
Gaza Strip (May-July 2002) (USAID, JHU, AQU & CARE,
2002)
secondary or higher 0.5-4.99 M/F 430 10.9 6.3 n.a.
* Category <-2 Z-scores includes <-3 Z-scores.
n.a.: not available.

Palestine Nutrition Profile – Food and Nutrition Division, FAO, 2005 23
Table 12: Anthropometry of preschool children (cont.)
Prevalence of malnutrition
Percentage of children with
Stunting Wasting Underweight Overweight
Height-for-age Weight-for-height Weight-for-age Weight-for-height
Name/date of survey
(month/year) (Reference)
Background characteristics
Age (years)
Sex Sample size
< -3 Z-scores < -2 Z-scores* < -3 Z-scores < -2 Z-scores* < -3 Z-scores < -2 Z-scores* > +2 Z-scores
Total 0-4.99 M/F 3 208 2.3 6.9 0.1 2.3 0.2 3.9 2.3
Sex
0-4.99 M 1 603 2.5 6.0 0.0 1.4 0.0 3.3 1.4
0-4.99 F 1 605 2.0 7.9 0.2 3.3 0.4 4.5 3.2
Age
0-0.49 M/F 361 0.2 4.8 0.1 1.9 0.0 1.5 1.2
0.5-0.99 M/F 339 0.7 3.8 0.0 6.4 0.6 8.5 1.7
1-1.99 M/F 611 1.2 5.5 0.4 4.6 0.5 3.0 5.3
2-2.99 M/F 627 5.4 8.5 0.1 1.7 0.1 5.0 1.5
3-4.99 M/F 1 269 2.3 8.3 0.0 0.6 0.1 3.2 1.7
Residence
urban 0-4.99 M/F 894 n.a. 6.8 n.a. 2.0 n.a. 3.7 n.a.
rural (camp) 0-4.99 M/F 242 n.a. 6.2 n.a. 2.0 n.a. 3.8 n.a.
The health survey in the West Bank and Gaza Strip (June-Sep. 1996) (PCBS, 1996) [West Bank]
rural (village) 0-4.99 M/F 1 810 n.a. 9.5 n.a. 4.3 n.a. 5.6 n.a.
Total 0-4.99 M/F 1 242 2.2 8.1 0.7 3.8 0.7 4.7 2.3
Sex
0-4.99 M 616 2.5 7.7 0.9 4.9 0.7 4.1 1.7
0-4.99 F 626 2.0 8.6 0.5 2.8 0.7 5.2 2.9
Age
0-0.49 M/F 50 0.0 0.0 0.0 4.0 0.0 0.0 1.2
0.5-0.99 M/F 154 0.4 4.1 2.0 11.2 0.8 5.4 2.4
1-1.99 M/F 257 2.5 8.3 1.0 7.8 1.5 7.5 2.7
2-2.99 M/F 259 2.6 9.2 1.1 2.3 1.0 4.8 2.0
3-4.99 M/F 523 2.7 9.5 0.0 0.5 0.2 3.4 2.4
Residence
urban 0-4.99 M/F 837 n.a. 9.3 n.a. 3.9 n.a. 5.6 n.a.
rural (camp) 0-4.99 M/F 670 n.a. 8.7 n.a. 4.6 n.a. 5.2 n.a.
The health survey in the West Bank and Gaza Strip (June-Sep. 1996) (PCBS, 1996) [Gaza Strip]
rural (village) 0-4.99 M/F 244 n.a. 6.9 n.a. 3.1 n.a. 4.7 n.a.
* Category <-2 Z-scores includes <-3 Z-scores.
Note: Data taken from WHO Global Database on Child Growth and Malnutrition. n.a.: not available.

Palestine Nutrition Profile – Food and Nutrition Division, FAO, 2005 24
Anthropometry of school-age children
Data are only available on the nutritional status of school children aged 6-7 years attending government schools. The MOH school health annual report of 1996 showed that 1.6% of school children were wasted while 2.1% were stunted. Only 1.1% were categorised as obese. In 2003/04, the prevalence of wasting and stunting was 2.5% and 2.4% respectively. These levels suggest that malnutrition among school-age children is not a problem in Palestine (MOH, 2005). Many schools have canteens, but more than 70% of the foods were of poor nutritional value, e.g. “bamba” (cheese puffs), sweets and chips (MOH, 2005).
Anthropometry of adolescents
Currently, no data are available on anthropometry of adolescents.
Anthropometry of adult women
A survey conducted in 2002 documents the nutritional status of adult women. The prevalence of chronic energy deficiency among women of childbearing age was low overall (4%), while overweight and obesity affected almost two thirds of the women (Table 13). Prevalence of overnutrition was similar in the West Bank and Gaza Strip. Both overweight and obesity prevalence increased steeply with age to reach an extremely high level among women 40-49 years of age (more than 80% when overweight and obesity are taken together). In this age group less than 10% of the women had a normal BMI (USAID, JHU, AQU & CARE, 2002). Table 13: Anthropometry of adult women
Anthropometry of adult women
Body Mass Index¹ (kg/m²) (BMI)
Percentage of women with BMI
Name/date of survey
(month/year) (Reference)
Background characteristics
age (years)
Sample Size
< 18.5 (chronic energy
deficiency)
18.5-24.9
(normal)
25.0-29.9 (overweight)
≥ 30 (obesity)
Total 15-49 * 3.5 35.2 39.1 22.1
Region
West Bank
Total 15-49 731 3.3 36.4 38.4 21.9
Age
15-19 193 7.8 62.2 22.8 7.3
20-29 238 2.9 39.9 44.1 13.0
30-39 194 1.0 21.1 44.8 33.0
40-49 106 0.0 9.4 42.5 48.1
Gaza Strip
Total 15-49 803 4.0 33.0 40.3 22.7
Age
15-19 244 8.6 54.1 31.6 5.7
20-29 244 3.7 34.0 45.9 16.4
30-39 208 1.0 19.7 45.2 34.1
Nutritional Assessment of the
West Bank and the Gaza Strip
(May/July 2002) (USAID, JHU, AQU & CARE,
2002)
40-49 107 0.0 8.4 38.3 53.3
* Prevalence for West Bank and Gaza Strip taken together is a weighted average of prevalences based on population data from the mid 2002 census estimates
Anthropometry of adult men.
No data are available on anthropometry of adult men.

Palestine Nutrition Profile – Food and Nutrition Division, FAO, 2005 25
II.6 Micronutrient deficiencies
Iodine deficiency disorders (IDD)
Prevalence of goitre and urinary iodine level
A survey documents the prevalence of goitre in 1997, among school-age children 8-10 years of age: 15% were affected by goitre. Prevalence varied considerably according to the region. It was found to be lowest in the Northern West Bank (4%) and in Gaza Strip (6%) and highest in Middle and Southern West Bank (32% for both). When examined by district, goitre did not prevail in Qalqelia but affected more than two thirds (68%) of children in Jericho. Girls were slightly more likely to have goitre than boys (Ramlawi, 2000).
Concerning sub-clinical IDD, the median level of urinary iodine was highest in Salfit (186µg/L) and lowest in Jericho (27µg/L) (Ramlawi, 2000).
According to WHO’s classification, prevalence of goitre showed a mild problem of public health in the whole country (prevalence between 5% and 19.9%). But in Middle and Southern regions, where nearly a third of the children were affected by goitre, the situation was considered as serious (grade III) and the need for action critical (WHO, 2001). The situation in Jericho was the worst and both indicators of prevalence of goitre and level of urinary iodine revealed a very serious situation regarding IDD. Table 14: Prevalence of goitre and level of urinary iodine in school-age children
Prevalence of goitre Level of urinary iodine
Survey name/date (Reference)
Background characteristics
Age (years)
Sex Sample size
Percentage with goitre
[Total Goitre]
Sample size
Median (µg/L)
Percentage with urinary
iodine <100µg/L
Total 8-10 M/F 2 535 14.9 2 091 106.8 45.0
Sex
8-10 M 1 369 14.3 n.a. n.a. n.a.
8-10 F 1 166 15.5 “ “ “
Region
Northern West Bank 8-10 M/F n.a. 3.9 n.a. n.a. n.a.
Middle West Bank 8-10 M/F “ 31.6 “ “ “
Gaza Strip 8-10 M/F “ 5.6 “ “ “
Southern West Bank 8-10 M/F “ 31.9 “ “ “
Prevalence of goitre among primary school students, aged 8-10 years, in the West Bank and Gaza, (1997)
(Ramlawi, 2000)¹
¹ Data taken from WHO Global Database on Iodine Deficiency. n.a.: not available.

Palestine Nutrition Profile – Food and Nutrition Division, FAO, 2005 26
Iodization of salt at household level
In 2004, 65% of households used adequately iodized salt for cooking. In the West Bank, households were very less likely to use adequately iodized salt than households of the Gaza Strip (57% and 83%, respectively) (PCBS, 2004b). Table 15: Iodization of salt at household level
Iodine level of household salt
Survey name/date (Reference)
Background characteristics
Number of households where
salt was available for testing
Inadequate (0-15 ppm)
Adequate ( ≥15 ppm)
Percentage of households tested
Total 5 779 34.7 65.3 n.a.
Region
West Bank n.a. 43.5 56.5 n.a.
Demographic and Health Survey,
2004 (PCBS, 2004b) Gaza Strip n.a. 17.3 82.7 n.a.
Note: ppm: parts per million.
n.a.: not available.
After several studies carried out in 1997/98 revealed iodine deficiency as a public health problem, a national committee was established including the Ministry of Health and several Palestinian institutions, with the support of UNICEF. The strategy of the committee focused on iodized salt and intensive nutritional education. The only salt factory was in an area controlled by the Israeli military which covered about 80% of local consumption; the rest of the salt was imported and uncontrolled. The Nutrition Unit of the Ministry of Health was established with the support of UNICEF and WHO, and has acted as focal point for IDD control since 1998. UNICEF has supported iodized salt production technically and through procurement of potassium iodate since 1999. IDD activities include training and communication, establishment of a central public health laboratory in 2000, including facilities for quality control of iodized salt and testing of urinary iodine, and preparation of legislation and standards for approval by state authorities. Constraints are scarce funding and a poor communication system (ICCIDD, 2002).
Vitamin A deficiency (VAD)
Prevalence of sub-clinical and clinical vitamin A deficiency
In 2002, vitamin A intake was evaluated by 24-hour food recall of children’s diets by their mothers among 477 children aged 12-59 months. Results were expressed as percentage of children with intakes below 80% of RDAs. Among children aged 1-3 years, half of the children living in the West Bank were below the cut-off point. In the Gaza Strip, 65% of the children were below 80% of RDAs. These percentages were higher among children aged 4-5 years: 64% and 71% respectively in the West Bank and Gaza Strip had insufficient intakes of vitamin A (USAID, JHU, AQU & CARE, 2002).
A survey conducted in 2004 documents sub-clinical vitamin A deficiency. About a fifth (22%) of children aged 1-5 years were found to have low level of serum retinol (<20µg/dL) (MARAM, 2004). The estimated prevalence is considered to fall into the severe deficiency (20%) according to the WHO classification (WHO, 1996). Results showed a significant difference between the prevalence of vitamin A deficiency (VAD) in the West Bank (19%) when compared with the Gaza Strip (27%). VAD is associated with inflammation/infection in all communities, and in the Gaza Strip, in addition to the latter factor, low intake of this nutrient in the diet is an obvious contributing factor (MARAM, 2004).
High prevalence of VAD can be related to a decreasing consumption of products rich in this vitamin. After September 2000, many households experienced a severe decline in the consumption of meat, fish and milk (USAID, JHU, AQU & CARE, 2002). A similar decrease in fruit consumption caused a reduction in intake of carotenes (FAO, 2001; USAID, JHU, AQU & CARE, 2002).
In conclusion, the prevalence of VAD in the West Bank and in the Gaza Strip, meets both the WHO and the IVACG criteria for a public health problem that requires immediate action (WHO, 1996; Sommer & Davidson, 2002).

Palestine Nutrition Profile – Food and Nutrition Division, FAO, 2005 27
Table 16: Prevalence of sub-clinical vitamin A deficiency in children under 5 years
Prevalence of low level of serum retinol
Survey name/date (Reference)
Background characteristics
Age (years)
Sex Sample size
Percentage with serum retinol <20 µg/dL or 0.70 µmol/L
Total 1-4.99 M/F 1 107 22.0
Sex
1-4.99 M 587 22.6
1-4.99 F 520 21.4
Region
West Bank 1-4.99 M/F 664 18.9
West Bank North 1-4.99 M/F 270 21.9
West Bank Middle 1-4.99 M/F 181 13.8
West Bank South 1-4.99 M/F 211 19.4
Gaza Strip 1-4.99 M/F 443 26.5
Gaza Strip North 1-4.99 M/F 231 31.2
Prevalence of
vitamin A deficiency among children,
aged 12-59 months in the West Bank and the Gaza Strip
(2004) (MARAM, 2004)
Gaza Strip South 1-4.99 M/F 214 21.5
Vitamin A supplementation
In 2004, 62% of children under one year of age living in Palestine had received a vitamin A supplement, which represents a strong increase in coverage compared to 1996 at which time only 38% of children were supplemented. However, coverage varied considerably among regions. In the West Bank, 73% of children received a supplement while this percentage was only 48% in the Gaza Strip (PCBS, 2004b).
Given that sub-clinical vitamin A deficiency continues to exist in the country, the coverage and effectiveness of the supplementation programme needs to be re-examined (MOH, 2005). The MOH intends to start supplementing all post partum women at 4 weeks after delivery with vitamin A. Development of a policy is underway (MOH, 2005).
In order to prevent further deterioration in vitamin A status, the MOH with UNICEF support, conducted a mass vitamin A supplementation during the measles immunization campaign in June 2004. About 540 000 children aged 9-59 months were covered. This was the first campaign of this type in the country (MOH, 2005). The Palestinian MOH is moving forward with plans to fortify wheat flour and possibly staples, such as oil or milk. A private sector initiative has already developed fortified biscuits, now in production (MARAM, 2004).
Iron deficiency anemia (IDA)
Prevalence of IDA
Two surveys document the prevalence of anemia among preschool children (MARAM, 2004; WHO, 2005).
In 2004, the prevalence of anemia among children aged 12-59 months was 23%. It differed between the West Bank and the Gaza Strip. In the West Bank, prevalence ranged from 14% to 22% while it reached 31% in North Gaza Strip (MARAM, 2004).
According the previous survey of 2002, 44% of children aged 6-59 months were anemic. There was no difference in prevalence between the West Bank and the Gaza Strip (WHO, 2005). Trends between 2002 and 2004 cannot be assessed because the age ranges of the two surveys do not overlap completely.
The 2002 survey also documented prevalence of anemia among women of childbearing age. About half of non pregnant women were found to be anemic (53%) in Gaza Strip. In the West Bank, the prevalence was slightly lower, affecting 44% of women. Moreover, 19% women suffered from folic acid deficiency (WHO, 2005). Since the prevalence of anemia is over 40%, WHO-EMRO (WHO Regional

Palestine Nutrition Profile – Food and Nutrition Division, FAO, 2005 28
Office for the Eastern Mediterranean) considers anemia to be a severe problem for non-pregnant women of childbearing age (WHO, 2002).
Various factors can explain the high prevalence of anemia observed in the country. Tea consumption is very common among all age groups and also among preschool children and recently weaned children. The tannins in tea inhibit the absorption of non-heme iron (USAID, JHU, AQU & CARE, 2002). Moreover, hookworm infection (Ankylostoma duodenale) is endemic in the Middle East particularly in areas of poor sanitation and lower socio-economic status (USAID & CARE, 2003). Table 17: Prevalence of anemia in preschool children
Percentage of children with
Survey name/date (Reference)
Background characteristics
Age (months)
Sex Sample size Any anemia
(<11.0 g/dL)
Total 12-59 M/F 1 106 23.0
Age
12-23 M/F n.a. 34.7
24-35 M/F n.a. 25.7
36-47 M/F n.a. 18.5
48-59 M/F n.a. 12.4
Region
West Bank North 12-59 M/F 270 21.5
West Bank Middle 12-59 M/F 181 14.9
West Bank South 12-59 M/F 210 14.3
Gaza Strip North 12-59 M/F 231 30.7
Prevalence of
vitamin A deficiency among children,
aged 12-59 months in the West Bank and the Gaza Strip
(2004) (MARAM, 2004)
Gaza Strip South 12-59 M/F 214 31.8
Hb: Hemoglobin.
n.a.: not available.
Table 18: Prevalence of anemia in women of childbearing age
Percentage of women with
Survey name/date (Reference)
Background characteristics
Age (years)
Sample size Any anemia
(Hb <12.0 g/dL)
Severe anemia (all women
Hb <7.0 g/dL)
Total 15-49 1 534 47.0 n.a.
Region
West Bank 15-49 731 43.9 0.1
West Bank urban 15-49 430 44.9 n.a.
West Bank non-urban 15-49 301 42.5 n.a.
Gaza Strip 15-49 803 52.8 0.4
Gaza Strip urban 15-49 489 53.0 n.a.
Nutritional
assessment of the West Bank and Gaza Strip (2002)
(USAID, JHU, AQU & CARE,
2002) Gaza Strip non-urban 15-49 314 52.5 n.a.
Hb: Hemoglobin. n.a.: not available.
The sample represents non-pregnant women aged 15-49 years.
Interventions to combat IDA
In MOH clinics, iron supplements are distributed to all children aged 4-12 months in the form of iron syrup which mothers take home and administer daily (MOH, 2005).
The issue of maternal nutrition and iron-deficiency anemia is important in the Palestinian context of frequent births, a high rate of breastfeeding, and short birth spacing. Anemia in pregnant women does not appear to be dealt with effectively. Pregnant women receive iron supplements in the form of tablets to be taken on a daily basis, but supplies are not always consistent (MOH, 2005). Overall, in 2004, 44% of women less than 55 years received folic acid, 52% in the West Bank and 34% in the Gaza Strip. Among pregnant women, 76% received iron tablets during antenatal care sessions (PCBS, 2004b).

Palestine Nutrition Profile – Food and Nutrition Division, FAO, 2005 29
Other micronutrient deficiencies
Whilst rickets is rarely reported in the West Bank, it is widespread in the Gaza Strip. In 2003, the number of reported new cases was 444 (MOH, 2005).
In 2003, a survey showed that intakes of folate and zinc in children aged 1-5 years were low, below 80% of RDAs (USAID & CARE, 2003). Among women of childbearing age in the West Bank and Gaza Strip combined, low intakes of folate, zinc and vitamin E were widespread (USAID, AQU, JHU & CARE, 2002). II.7 Policies and programmes aiming to improve nutrition and food security
The first National Nutrition Strategy for Palestine was developed in 2003 by the MOH with considerable support from the MARAM Project. The strategic priorities outlined were: management of malnutrition, communication strategies for behaviour change, support and encouragement to breastfeeding and appropriate complementary feeding, food fortification, development of protocols and guidelines, development of a nutrition surveillance system. The strategy provides a framework for the MOH for nutrition action, but does not incorporate the key actions that are needed to bring about nutrition improvements by other ministries. Detailed targets and resources are not included. There are also gaps with regard to addressing the problems of nutritionally vulnerable groups such as the elderly and the school-age children (MOH, 2005).
A number of nutrition-related protocols have been developed on behalf of the MOH, including for example the Integrated Management of Childhood Illnesses (IMCH) (MOH, 2005).
The main players implementing nutrition-related programmes are the MOH and UNRWA. Several other United Nations agencies and Non-Governmental Organizations are also involved in programming. There are very few community-based nutrition activities. Since 2000, there has been increased emphasis on, and funding for, nutrition from the international community.
Current nutrition programmes and pilot interventions consist of the following:
1. Programmes to prevent and address poor growth in children
• Growth monitoring of under-fives in MOH clinics: data on stunting, wasting and underweight are recorded. A major problem is the lack of analysis of growth monitoring data and the absence of a national nutrition surveillance system.
• Infant and child feeding: exclusive and prolonged breastfeeding is widely promoted by all primary health care providers.
• Management of malnutrition in specialized centres • School nutrition programmes: the MOH has a school health team who monitors the health
status of school children at primary entry (age 6 years) and secondary entry (13 years). Height and weight measurements are taken at primary entry only. Children with nutritional problems are referred to health clinics for follow-up. Nutrition education is incorporated into the school curriculum as part of promoting healthy lifestyles. There is no national school meal programme, though there have been small-scale initiatives to provide school children with milk or yogurt drinks during the school day.
2. Programmes to prevent and address micronutrient deficiencies through supplementation
• Micronutrient supplementation of school-age children: the Ministry of Education is developing a multi-micronutrient supplementation programme for school-children. Currently, a pilot project is providing weekly supplements in 87 schools. The supplements aim to provide 50-100% of needs for iron, zinc, vitamin B12, folic acid and vitamin A. This programme is not complemented by a national school meal programme and runs the risk of creating dependence on supplements rather than promoting better quality dietary intake.

Palestine Nutrition Profile – Food and Nutrition Division, FAO, 2005 30
3. Programmes to prevent and address micronutrient deficiencies through fortification
• Flour fortification: CARE International started a project with MOST to support the introduction of iron fortified flour and a surveillance system to monitor the impact.
• Salt iodization: UNICEF is supporting the MOH to re-launch the salt iodization programme. Salt fortification will be linked with CARE International flour fortification initiative.
4. Programmes to prevent and address obesity and dietary-related chronic diseases
• A number of centres at districts levels in West Bank provide services, including dietary counselling, for obesity and diet-related chronic diseases (MOH, 2005).

Palestine Nutrition Profile – Food and Nutrition Division, FAO, 2005 31
Reference list Alden, Z., Greenough, G., Dandies, B. & Qasrawi, R. 2003. Food Security and Nutritional Assessment of the West Bank and Gaza Strip, 2003. Jerusalem. Becker, W. & Al-Saleh, J. 2000. Palestinian Consumption and Expenditure surveys 1996-98 (PECS), Supply of food, energy and selected nutrients. Report from a mission to the Palestinian Central Bureau of Statistics (PCBS), Ramallah, on the West Bank. Statistics Sweden, International Consulting Office. Bellisari, A. 1994. Public health and the water crisis in the occupied Palestinian territories. Journal of Palestine Studies, 23(2) (winter), pp. 52-63. (available at http://www.palestinestudies.org/final/en/journals/issue.php?iid=90&jid=1&vid=XXIII&vol=119).
FAO. 2003. Food Security Assessment West Bank and Gaza Strip. Food and Agriculture Organization of the United Nations in collaboration with World Food Programme. Rome. European Commission, Palestinian National Authority Ministry of Agriculture, United States Agency for International Development. (available at: ftp://ftp.fao.org/docrep/fao/006/j1575e/j1575e01.pdf or http://www.fao.org/documents/show_cdr.asp?url_file=/docrep/006/j1575e/j1575e00.htm). FAO. 2001. Nutrition in developing countries. Food and Agriculture Organization of the United Nations. Rome.
FAO. FAOSTAT Database. Food and Agriculture Organization of the United Nations. Rome. (available at http://faostat.external.fao.org/faostat). Accessed in 2005. FAO. Statistics Division. Database on Major Food and Agricultural Commodities and Producers: commodities by country. Food and Agriculture Organization of the United Nations. Rome. (available at http://www.fao.org/es/ess/top/country.jsp).
FAO. GIEWS workstation. Food and Agriculture Organization of the United Nations. Rome. (available at http://www.fao.org/giews/workstation/english/index.htm). Accessed in 2005.
FAO & WFP. 2004. Report of the Food Security Assessment, West Bank and Gaza Strip. Food and Agriculture Organization of the United Nations and World Food Programme of the United Nations. Rome. (available at http://www.fao.org/documents/show_cdr.asp?url_file=/DOCREP/006/J1575E/J1575E00.HTM).
Heiberg, M. & Ovensen, G. 1993. Palestinian Society in Gaza, West Bank and Arab Jerusalem: A Survey of Living Conditions. Oslo: FAFO Report 151. (available at http://almashriq.hiof.no/general/300/320/327/fafo/reports/FAFO151/index.html). ICCIDD. 2002. Newsletter 2002. International Council for the Control of Iodine Deficiency Disorder. (available at http://nutrition.tufts.edu/conferences/childhood/iodine/IDD_Palestine_ICCIDD.pdf). Accessed in July 2005. ITU. World Telecommunication Indicators Database. International Telecommunication Union. (available at http://www.itu.int/ITU-D/ict/statistics/). Accessed 2005. MARAM. 2004. Prevalence of vitamin A deficiency among children aged 12-59 months in the West Bank and the Gaza Strip. The MARAM Project, Ministry of Health, MOST Project (United States Agency for International Development Micronutrient Program). (available at http://nutrition.tufts.edu/conferences/childhood/va/vawbg2003.pdf).
Palestine Nutrition Profile – Food and Nutrition Division, FAO, 2005 32
Marshy, M. 1999. Social and Psychological Effects of Overcrowding in Palestinian Refugee Camps in the West Bank and Gaza Literature Review and Preliminary Assessment of the Problem. Expert and Advisory Services Fund, administered by the International Development Research Centre, Ottawa, Canada. (available at http://www.arts.mcgill.ca/MEPP/PRRN/marshy.html). MOH. 2005. The State of Nutrition: West Bank and Gaza Strip. Nutrition Department, Ministry of Health, Palestinian National Authority, with the support of the World Health Organization, Geneva. (available at http://www.moh.gov.ps/pdffiles/State%20of%20Nutrition%20-%20June%202005%20_2_.pdf). MOH. 2003. Health Status in Palestine 2002. July 2003. Ministry of Health, Palestinian National authority. NRC. 1989. Recommended Dietary Allowances. 10
th edition. National Research Council (U.S.),
Washington, DC: National Academy Press. (available at http://www.nap.edu/books/0309046335/html). PCBS. 2004a. Statistical Monitoring of the Socio-economic Conditions of the Palestinian Society, (Second quarter, 2004). Palestinian Central Bureau of Statistics. Ramallah, Palestine. (available at http://www.pcbs.org). PCBS. 2004b. Initial Survey Results: Demographic and Health Survey, 2004. Palestinian Central Bureau of Statistics. Ramallah, Palestine. (available at http://www.pcbs.org). PCBS. 2003. Land Use in the Palestinian Territory, 2003. Palestinian Central Bureau of Statistics. Ramallah, Palestine. (available at http://www.pcbs.org/land_us/lnd03_list.aspx). PCBS. 2003a. Agriculture Statistics: Main Findings. Palestinian Central Bureau of Statistics. Ramallah, Palestine. (available at http://www.pcbs.org/agricul/a_main.aspx).
PCBS. 2000. Health Survey 2000. Regional reports Series (No 1). North of the West Bank. Palestinian Central Bureau of Statistics. Ramallah, Palestine. (available at http://www.pcbs.org). PCBS. 1996. The health survey in the West Bank and Gaza Strip: main findings (MICS). Palestinian Central Bureau of Statistics. Ramallah, Palestine. (available at http://www.pcbs.org).
Ramlawi, A. 2000. Prevalence of goitre among primary school students aged 8-10 years, in the West Bank and Gaza, 1997. Public Health Review, 28 (1-4): 67-69. Sommer, A. & Davidson, F.R. 2002. Assessment and Control of Vitamin A Deficiency: The Annecy Accords. Proceedings of the XX International Vitamin A consultative Group Meeting. J.Nutr. 132: 2845S-2850S. (available at: http://www.nutrition.org/cgi/content/full/132/9/2845S). UN. 2003. The Millennium Development Goals Progress Report 2002 – Occupied Palestinian Territory. United Nations, Jerusalem, August 2003. (available at http://192.115.229.1/pub/pr/mdg.pdf). UNDP. Human Development Report 2004. United Nations Development Programme, New York. (available at http://hdr.undp.org/reports/global/2004/). UNPD. 2004. World Population Prospects: the 2004 Revision. Population Database. Population Division, Department of Economic and Social Affaire. United Nations. (available at http://esa.un.org/unpp).

Palestine Nutrition Profile – Food and Nutrition Division, FAO, 2005 33
UNESCO. Global Education Digest 2004. Institute for Statistics, United Nations Educational, Scientific and Cultural Organization. Montreal. (available at http://www.uis.unesco.org/TEMPLATE/pdf/ged/2004/GED2004_EN.pdf). UNICEF. 2004. The State of the World's Children 2005. United Nations Children’s Fund, New York. (available at http://www.unicef.org/publications/index_24432.html). UNICEF. Information by country. United Nations Children’s Fund, New York. (available at http://www.unicef.org/statistics/). Accessed 2005.
UNICEF. Low Birthweight Database. United Nations Children’s Fund, New York. (available at: http://www.childinfo.org/areas/birthweight/database.php). Acceded July 2005. UNICEF & Birzeit University. 2004. The Children of Palestine in the Labour Market (A qualitative participatory study). Occupied Palestinian Territory. United Nations Children’s Fund, New York. (available at http://www.miftah.org/Doc/Reports/2004/unicefrep.pdf). UNPD. World Population Prospects: the 2004 Revision. Population Division of the Department of Economic and Social Affairs of the United Nations Secretariat. New York, USA. (available at http://esa.un.org/unpp). Accessed in 2005. UNRWA. 2005. Selected refugee statistics (as at 31 March 2005). United Nations Relief and Works Agency for Palestine Refugees in the Near East. (available at http://www.un.org/unrwa/publications/pdf/uif-dec04.pdf). UNRWA. 2003. 2003 UNRWA Health Annual Report. Amman. United Nations Relief and Works Agency for Palestine Refugees in the Near East. (available also at http://www.un.org/unrwa/publications/pdf/ar_health2003.pdf). UNRWA. 2000. UNRWA general statistical profile. United Nations Relief and Works Agency for Palestine Refugees in the Near East. (available at: http://www.un.org/unrwa/publications/pdf/figures.pdf). UNS. 2004. Nutrition Information in Crisis Situation, Occupied Palestinian Territories. Standing Committee on Nutrition. United Nations System. (available at: http://www.unsystem.org/scn/Publications/RNIS/countries/palestine_all.htm).
UNSTAT. Millennium Indicators Database. United Nations Statistics Division. New York. (available at http://unstats.un.org/unsd/mi/mi_goals.asp). Accessed 2005.
USAID & CARE. 2003. Nutritional Assessment of West Bank and Gaza Strip, 2003. United States Agency for International Development and CARE International. By Abdeen, Z., Greenough, G., Qasrawi, R. and Dandies, B. (available at http://www.carewbg.org/Documents/Nutritional-Assessment04Oct.pdf). USAID, JHU, AQU & CARE. 2002. Nutritional assessment of the West Bank and Gaza Strip. United States Agency for International Development, John Hopkins University, Al Quds University and CARE International. By Abdeen, Z., Greenough, G., Shahin, M. and Tayback, M. (available at: http://www.usaid.gov/wbg/reports/Nutritional_Assessment.pdf). WB. 2004. West Bank and Gaza Update. A Quarterly Publication of the West Bank and Gaza Office. World Bank. Washington D.C. (available at http://www.worldbank.org/we).

Palestine Nutrition Profile – Food and Nutrition Division, FAO, 2005 34
WFP. 2005a. Protracted Relief and recovery Operation- Occupied Palestinian Territory (10387.0). Projects for Executive Board Approval. World Food Programme of the United Nations. Rome. (available at http://www.wfp.org/operations/current_operations/project_docs/103870.pdf).
WFP. 2005b. The 2004 Food Aid Flows. The Food Aid Monitor - May 2005. International Food Aid Information System of the World Food Programme of the United Nations. Rome. (available at http://www.wfp.org/interfais/index2.htm#)
WHO. 2005. Health condition of, and assistance to, the Arab population in the occupied Arab territories, including Palestine. Fifty-eighth world health assembly. Agenda item 15. World Health Organization. Geneva. (available at: http://www.who.int/gb/ebwha/pdf_files/WHA58/A58_ID5-en.pdf). WHO. 2003. Diet, nutrition and the prevention of chronic diseases. Report of a joint WHO/FAO Expert Consultation. WHO Technical Report Series 916. World Health Organization. Geneva. (available at http://www.fao.org/documents/show_cdr.asp?url_file=/DOCREP/005/AC911E/AC911E00.HTM). WHO. 2002. Guidelines for the control of iron deficiency in the countries of the Eastern Mediterranean, Middle Eats and North Africa. World Health Organization, Eastern Mediterranean Region. WHO. 2001. Assessment of iodine deficiency disorders and monitoring their elimination: a guide for programme managers. 2nd ed. Dept. of Nutrition for Health and Development. World Health Organization. Geneva. (available at http://www.who.int/nut/documents/assessment_idd_monitoring_eliminination.pdf). WHO. 1996. Indicators for assessing Vitamin A Deficiency and their application in monitoring and evaluating intervention programmes. World Health Organization. Geneva. (available at: http://whqlibdoc.who.int/hq/1996/WHO_NUT_96.10.pdf). WHO.1983. Measuring Change in Nutritional Status. World Health Organization. Geneva. WHO. Global Database on Child Growth and Malnutrition. World Health Organization. Geneva. (available at: http://www.who.int/nutgrowthdb/). Accessed July 2005. WHO. Global Database on Iodine Deficiency. World Health Organization. Geneva. (available at http://www3.who.int/whosis/mn/iodine/iodine_database.cfm?path=whosis,mn,mn_iodine,mn_iodine_data,mn_iodine_data_database&language=english). Accessed July 2005.