Embed Size (px)
Citation preview

Nutrition and Food Security in Kugaaruk, Nunavut
Baseline Survey for the
Food Mail Pilot Project
Judith Lawn and Dan HarveyDialogos Educational Consultants Inc.

The baseline survey for the Kugaaruk FoodMail Pilot Project was conducted using fundsprovided to Indian and Northern Affairs Canadaby First Nations and Inuit Health Branch,Health Canada, under the Food Safety andNutrition Program initiatives announced in the1999 federal budget.
Published under the authority of theMinister of Indian Affairs andNorthern DevelopmentOttawa, 2003www.ainc-inac.gc.ca1-800-567-9604TTY only 1-866-553-0554
QS-8625-000-EE-A1Catalogue No. R2-265/2003EISBN 0-662-34806-0
© Minister of Public Works and GovernmentServices Canada
Cette publication peut aussi être obtenueen français sous le titre :
La nutrition et la sécurité alimentaire à Kugaaruk, au Nunavut :enquête de référence pour le projet-pilote lié au programme Aliments-poste
iii
Table of Contents
Executive Summary . . . . . . . . . . . . . . . . . . . . . . . . . . . . . . . . . . . . . . . . . . . . . . . . . . . ix
Background . . . . . . . . . . . . . . . . . . . . . . . . . . . . . . . . . . . . . . . . . . . . . . . . . . . . . . . . . . 1Nutrition and Food Security in Isolated Communities . . . . . . . . . . . . . . . . . . . . 1Food Mail Pilot Projects . . . . . . . . . . . . . . . . . . . . . . . . . . . . . . . . . . . . . . . . . . . 3Food Supply System and Community Profile of Kugaaruk . . . . . . . . . . . . . . . . 4Food Costs and Affordability in Kugaaruk . . . . . . . . . . . . . . . . . . . . . . . . . . . . . 5
Survey Objectives . . . . . . . . . . . . . . . . . . . . . . . . . . . . . . . . . . . . . . . . . . . . . . . . . . . . . 6
Survey Design and Methodology . . . . . . . . . . . . . . . . . . . . . . . . . . . . . . . . . . . . . . . . . . 6Sample Selection . . . . . . . . . . . . . . . . . . . . . . . . . . . . . . . . . . . . . . . . . . . . . . . . 6Assessment Tools . . . . . . . . . . . . . . . . . . . . . . . . . . . . . . . . . . . . . . . . . . . . . . . 7
Household Questionnaire . . . . . . . . . . . . . . . . . . . . . . . . . . . . . . . . . . . . 7Nutrition Questionnaire . . . . . . . . . . . . . . . . . . . . . . . . . . . . . . . . . . . . . 8
Interviewer Training and Data Collection . . . . . . . . . . . . . . . . . . . . . . . . . . . . . . 9Data Analysis . . . . . . . . . . . . . . . . . . . . . . . . . . . . . . . . . . . . . . . . . . . . . . . . . 10
Methodological Considerations . . . . . . . . . . . . . . . . . . . . . . . . . . . . . . . . . . . . . . . . . . 12Food Security Questionnaire . . . . . . . . . . . . . . . . . . . . . . . . . . . . . . . . . . . . . . 12Assessing Usual Intake . . . . . . . . . . . . . . . . . . . . . . . . . . . . . . . . . . . . . . . . . . 13Food Frequency Questionnaire . . . . . . . . . . . . . . . . . . . . . . . . . . . . . . . . . . . 15Inuit and Non-Inuit Respondents . . . . . . . . . . . . . . . . . . . . . . . . . . . . . . . . . . . 16
Household Survey Results . . . . . . . . . . . . . . . . . . . . . . . . . . . . . . . . . . . . . . . . . . . . . 17Household Size and Composition . . . . . . . . . . . . . . . . . . . . . . . . . . . . . . . . . . 17Source and Amount of Income and Expenditure on Food . . . . . . . . . . . . . . . 18Food Security . . . . . . . . . . . . . . . . . . . . . . . . . . . . . . . . . . . . . . . . . . . . . . . . . 19Food Security and Socio-economic Group . . . . . . . . . . . . . . . . . . . . . . . . . . . 26Social Issues of Concern . . . . . . . . . . . . . . . . . . . . . . . . . . . . . . . . . . . . . . . . 28Food Purchasing Practices . . . . . . . . . . . . . . . . . . . . . . . . . . . . . . . . . . . . . . . 29
Source of food purchases . . . . . . . . . . . . . . . . . . . . . . . . . . . . . . . . . . 29Perceptions about quality, variety and cost . . . . . . . . . . . . . . . . . . . . . 29Frequency of food purchases in the past four weeks . . . . . . . . . . . . . 30
Nutrition Survey Results . . . . . . . . . . . . . . . . . . . . . . . . . . . . . . . . . . . . . . . . . . . . . . . 32Respondent Profiles . . . . . . . . . . . . . . . . . . . . . . . . . . . . . . . . . . . . . . . . . . . . 32Food Frequency Questionnaire . . . . . . . . . . . . . . . . . . . . . . . . . . . . . . . . . . . . 32Food Consumption Patterns (24-hour recall) . . . . . . . . . . . . . . . . . . . . . . . . . . 35
Country food . . . . . . . . . . . . . . . . . . . . . . . . . . . . . . . . . . . . . . . . . . . . 35Store foods . . . . . . . . . . . . . . . . . . . . . . . . . . . . . . . . . . . . . . . . . . . . . 36
Dairy Products . . . . . . . . . . . . . . . . . . . . . . . . . . . . . . . . . . . . . 36Store Meat, Poultry and Fish . . . . . . . . . . . . . . . . . . . . . . . . . . 37Cereal Products . . . . . . . . . . . . . . . . . . . . . . . . . . . . . . . . . . . . 37Fruits and Vegetables . . . . . . . . . . . . . . . . . . . . . . . . . . . . . . . 38

iv
Fats and Oils . . . . . . . . . . . . . . . . . . . . . . . . . . . . . . . . . . . . . . 38Sugar and Sweets . . . . . . . . . . . . . . . . . . . . . . . . . . . . . . . . . . 38Miscellaneous Foods . . . . . . . . . . . . . . . . . . . . . . . . . . . . . . . . 39Foods of Little Nutritional Value . . . . . . . . . . . . . . . . . . . . . . . . 39
Food Preparation Methods . . . . . . . . . . . . . . . . . . . . . . . . . . . . . . . . . . . . . . . 41Health and Lifestyle of Women . . . . . . . . . . . . . . . . . . . . . . . . . . . . . . . . . . . . 41
Self-rated health status . . . . . . . . . . . . . . . . . . . . . . . . . . . . . . . . . . . . 41Smoking . . . . . . . . . . . . . . . . . . . . . . . . . . . . . . . . . . . . . . . . . . . . . . . . 41Weight-related health risks . . . . . . . . . . . . . . . . . . . . . . . . . . . . . . . . . 43Activity level . . . . . . . . . . . . . . . . . . . . . . . . . . . . . . . . . . . . . . . . . . . . . 45
Energy and Macronutrient Intake . . . . . . . . . . . . . . . . . . . . . . . . . . . . . . . . . . . 46Energy . . . . . . . . . . . . . . . . . . . . . . . . . . . . . . . . . . . . . . . . . . . . . . . . . 46Sources of energy . . . . . . . . . . . . . . . . . . . . . . . . . . . . . . . . . . . . . . . . 49Protein, fat and carbohydrate . . . . . . . . . . . . . . . . . . . . . . . . . . . . . . . . 50Sources of fat and saturated fat . . . . . . . . . . . . . . . . . . . . . . . . . . . . . . 51Fibre . . . . . . . . . . . . . . . . . . . . . . . . . . . . . . . . . . . . . . . . . . . . . . . . . . 52Caffeine . . . . . . . . . . . . . . . . . . . . . . . . . . . . . . . . . . . . . . . . . . . . . . . . 52
Vitamins . . . . . . . . . . . . . . . . . . . . . . . . . . . . . . . . . . . . . . . . . . . . . . . . . . . . . 52Vitamin A . . . . . . . . . . . . . . . . . . . . . . . . . . . . . . . . . . . . . . . . . . . . . . . 54Vitamin B6 . . . . . . . . . . . . . . . . . . . . . . . . . . . . . . . . . . . . . . . . . . . . . . 55Folate . . . . . . . . . . . . . . . . . . . . . . . . . . . . . . . . . . . . . . . . . . . . . . . . . . 58Vitamin C . . . . . . . . . . . . . . . . . . . . . . . . . . . . . . . . . . . . . . . . . . . . . . . 59Niacin, thiamin, riboflavin and vitamin B12 . . . . . . . . . . . . . . . . . . . . . . 60
Minerals . . . . . . . . . . . . . . . . . . . . . . . . . . . . . . . . . . . . . . . . . . . . . . . . . . . . . . 61Magnesium . . . . . . . . . . . . . . . . . . . . . . . . . . . . . . . . . . . . . . . . . . . . . 62Calcium . . . . . . . . . . . . . . . . . . . . . . . . . . . . . . . . . . . . . . . . . . . . . . . . 63Iron, zinc and copper . . . . . . . . . . . . . . . . . . . . . . . . . . . . . . . . . . . . . . 66
Energy and Nutrient Contribution by Food Mail Category . . . . . . . . . . . . . . . . 67Country food . . . . . . . . . . . . . . . . . . . . . . . . . . . . . . . . . . . . . . . . . . . . 67Priority Perishable foods . . . . . . . . . . . . . . . . . . . . . . . . . . . . . . . . . . . 69Nutritious Perishable foods . . . . . . . . . . . . . . . . . . . . . . . . . . . . . . . . . 70Non-perishable foods . . . . . . . . . . . . . . . . . . . . . . . . . . . . . . . . . . . . . . 71Convenience Perishables . . . . . . . . . . . . . . . . . . . . . . . . . . . . . . . . . . 71Foods of Little Nutritional Value . . . . . . . . . . . . . . . . . . . . . . . . . . . . . . 72
Discussion . . . . . . . . . . . . . . . . . . . . . . . . . . . . . . . . . . . . . . . . . . . . . . . . . . . . . . . . . 73
References . . . . . . . . . . . . . . . . . . . . . . . . . . . . . . . . . . . . . . . . . . . . . . . . . . . . . . . . . 78
Appendix A: Nutrition Questionnaire
24-Hour Diet Recall
Appendix B: Household Questionnaire
v
List of Tables
Table 1 Household composition, Kugaaruk, 2001 . . . . . . . . . . . . . . . . . . . . . . . . . . . . 17Table 2 Inuit household income and expenditures, Kugaaruk, 2001 . . . . . . . . . . . . . . 19Table 3 Food security among Inuit Households, Kugaaruk, 2001 . . . . . . . . . . . . . . . . 22Table 4 Responses to food security scale items, Inuit households, Kugaaruk, 2001 . 23Table 5 Percent reporting frequency of occurrence of behaviours, experiences, and
conditions affecting food insecurity, Inuit households, Kugaaruk, 2001 . . . . . 24Table 6 Reported reasons for food insecurity and remedial action taken, Inuit
households, Kugaaruk, 2001 . . . . . . . . . . . . . . . . . . . . . . . . . . . . . . . . . . . . . 25Table 7 Country food access among Inuit households, Kugaaruk, 2001 . . . . . . . . . . . 25Table 8 Distribution of respondents by socio-economic group, Inuit households,
Kugaaruk, 2001 . . . . . . . . . . . . . . . . . . . . . . . . . . . . . . . . . . . . . . . . . . . . . . . 26Table 9 Perceptions of quality, variety and cost of perishable foods, all households,
Kugaaruk, 2001 . . . . . . . . . . . . . . . . . . . . . . . . . . . . . . . . . . . . . . . . . . . . . . . 30Table 10 Percent of households who purchased fresh fruits and vegetables in the
past four weeks . . . . . . . . . . . . . . . . . . . . . . . . . . . . . . . . . . . . . . . . . . . . . . . 31Table 11 Mean daily amounts of Dairy Products consumed by Inuit women: 24-hour
recall, Kugaaruk, 2001 . . . . . . . . . . . . . . . . . . . . . . . . . . . . . . . . . . . . . . . . . . 37Table 12 Mean daily amounts of Meat, Poultry and Fish consumed by Inuit women:
24-hour recall, Kugaaruk, 2001 . . . . . . . . . . . . . . . . . . . . . . . . . . . . . . . . . . . 37Table 13 Mean daily amounts of Cereal Products consumed by Inuit women: 24-hour
recall, Kugaaruk, 2001 . . . . . . . . . . . . . . . . . . . . . . . . . . . . . . . . . . . . . . . . . . 38Table 14 Mean daily amounts of Fruits and Vegetables consumed by Inuit women:
24-hour recall, Kugaaruk, 2001 . . . . . . . . . . . . . . . . . . . . . . . . . . . . . . . . . . . 39Table 15 Mean daily amounts of Miscellaneous Foods consumed by Inuit women:
24-hour recall, Kugaaruk, 2001 . . . . . . . . . . . . . . . . . . . . . . . . . . . . . . . . . . . 40Table 16 Mean daily amounts of Foods of Little Nutritional Value consumed by Inuit
women: 24-hour recall, Kugaaruk, 2001 . . . . . . . . . . . . . . . . . . . . . . . . . . . . 40Table 17 Smoking, Inuit women, Kugaaruk, 2001 . . . . . . . . . . . . . . . . . . . . . . . . . . . . . 43Table 18 Mean and median energy and macronutrient intake, Inuit women, 15 to 44,
Kugaaruk, 2001 . . . . . . . . . . . . . . . . . . . . . . . . . . . . . . . . . . . . . . . . . . . . . . . 47Table 19 Mean energy intake (Calories) from food groups and Food Mail categories,
Inuit women, Kugaaruk, 2001 . . . . . . . . . . . . . . . . . . . . . . . . . . . . . . . . . . . . 48Table 20 Mean fat and saturated fat intake (grams per day) from major sources, Inuit
women, Kugaaruk, 2001 . . . . . . . . . . . . . . . . . . . . . . . . . . . . . . . . . . . . . . . . 51Table 21 Adjusted mean and median vitamin intake of Inuit women, 15 to 44, and
percent with inadequate intake, Kugaaruk, 2001 . . . . . . . . . . . . . . . . . . . . . . 53Table 22 Mean vitamin A intake (RE per day) from major sources, Inuit women,
Kugaaruk, 2001 . . . . . . . . . . . . . . . . . . . . . . . . . . . . . . . . . . . . . . . . . . . . . . . 55Table 23 Mean intake of vitamin B6 (mg per day) from major sources, Inuit women,
Kugaaruk, 2001 . . . . . . . . . . . . . . . . . . . . . . . . . . . . . . . . . . . . . . . . . . . . . . . 57Table 24 Mean Dietary Folate Equivalent intake (mcg per day) from major sources,
Inuit women, Kugaaruk, 2001 . . . . . . . . . . . . . . . . . . . . . . . . . . . . . . . . . . . . 59Table 25 Adjusted mean and median mineral intake of Inuit women, 15 to 44, and
percent with inadequate intake, Kugaaruk, 2001 . . . . . . . . . . . . . . . . . . . . . 62
vi
Table 26 Mean magnesium intake (mg per day) from major sources, Inuit women,Kugaaruk, 2001 . . . . . . . . . . . . . . . . . . . . . . . . . . . . . . . . . . . . . . . . . . . . . . . 64
Table 27 Mean calcium intake (mg per day) from major sources, Inuit women,Kugaaruk, 2001 . . . . . . . . . . . . . . . . . . . . . . . . . . . . . . . . . . . . . . . . . . . . . . . 65
Table 28 Mean daily amount of energy and selected nutrients obtained by Food Mailcategory, Inuit women, Kugaaruk, 2001 . . . . . . . . . . . . . . . . . . . . . . . . . . . . . 68
vii
List of Figures
Figure 1 Percent Inuit households receiving financial assistance, Kugaaruk, 2001 . . . 18Figure 2 Food security status, Inuit households, Kugaaruk, 2001 . . . . . . . . . . . . . . . . 21Figure 3 Adult food security by socio-economic group, Inuit households, Kugaaruk,
2001 . . . . . . . . . . . . . . . . . . . . . . . . . . . . . . . . . . . . . . . . . . . . . . . . . . . . . . . . 27Figure 4 Children’s food security by socio-economic group, Inuit households,
Kugaaruk, 2001 . . . . . . . . . . . . . . . . . . . . . . . . . . . . . . . . . . . . . . . . . . . . . . . 27Figure 5 Degree of concern over social issues, Inuit households, Kugaaruk, 2001 . . . 28Figure 6 Percent of households rating foods poor or fair, Kugaaruk, 2001 . . . . . . . . . 29Figure 7 Reasons for not buying more fresh fruit and vegetables, Inuit households,
Kugaaruk, 2001 . . . . . . . . . . . . . . . . . . . . . . . . . . . . . . . . . . . . . . . . . . . . . . . 31Figure 8 Average number of times country foods were reported eaten in the past
month, Food Frequency Questionnaire, Inuit women, Kugaaruk, 2001 . . . . . 33Figure 9 Average number of times store foods were reported consumed in the past
month, Food Frequency Questionnaire, Inuit women, Kugaaruk, 2001 . . . . . 34Figure 10 Fruit and vegetables reported most frequently in the past month, Food
Frequency Questionnaire, Inuit women, Kugaaruk, 2001 . . . . . . . . . . . . . . . . 34Figure 11 Average consumption (grams) of country foods, 24-hour recall, Inuit
women, Kugaaruk, 2001 . . . . . . . . . . . . . . . . . . . . . . . . . . . . . . . . . . . . . . . . 36Figure 12 How Inuit women rated their health, Kugaaruk, 2001 . . . . . . . . . . . . . . . . . . . 42Figure 13 Smoking rates among Inuit women of child-bearing age, Kugaaruk, 2001 . . . 42Figure 14 Percent of non-pregnant Inuit women by BMI category, Kugaaruk, 2001 . . . . 44Figure 15 Percentage of energy from protein, fat, and carbohydrate, Inuit women
(not pregnant or lactating), Kugaaruk, 2001 . . . . . . . . . . . . . . . . . . . . . . . . . . 49Figure 16 Percent of Inuit women (not pregnant or lactating) with inadequate vitamin
intakes, Kugaaruk, 2001 . . . . . . . . . . . . . . . . . . . . . . . . . . . . . . . . . . . . . . . . 56Figure 17 Percent of lactating Inuit women with inadequate vitamin intakes, Kugaaruk,
2001 . . . . . . . . . . . . . . . . . . . . . . . . . . . . . . . . . . . . . . . . . . . . . . . . . . . . . . . . 56Figure 18 Percent energy and nutrients from country food, Inuit women, Kugaaruk,
2001 . . . . . . . . . . . . . . . . . . . . . . . . . . . . . . . . . . . . . . . . . . . . . . . . . . . . . . . . 67Figure 19 Percent energy and nutrients from Priority Perishable foods, Inuit women,
Kugaaruk, 2001 . . . . . . . . . . . . . . . . . . . . . . . . . . . . . . . . . . . . . . . . . . . . . . . 69Figure 20 Percent energy and nutrients from Nutritious Perishable foods, Inuit
women, Kugaaruk, 2001 . . . . . . . . . . . . . . . . . . . . . . . . . . . . . . . . . . . . . . . . 70Figure 21 Percent energy and nutrients from Non-perishable foods, Inuit women,
Kugaaruk, 2001 . . . . . . . . . . . . . . . . . . . . . . . . . . . . . . . . . . . . . . . . . . . . . . . 71Figure 22 Percent energy and nutrients from Foods of Little Nutritional Value, Inuit
women, Kugaaruk, 2001. . . . . . . . . . . . . . . . . . . . . . . . . . . . . . . . . . . . . . . . . 72

viii
Acknowledgements
We gratefully acknowledge the co-operation and assistance received from the Kugaarukhamlet, particularly from Quinn Taggart, Elizabeth Kayatsak and the Deputy Mayor, ElijahNirlungayuk, in reviewing the questionnaire, selecting interviewers and assisting with the manyadministrative tasks associated with this survey. We are also grateful to the Kugaaruk hamletcouncil for their strong support during the survey. This project would not have been possiblewithout the commitment of each of the interviewers, Isabella Inuksaq, Bonnie Kayaitok, SharonIttimangnak, Leona Krejunark, and Mary Ningark. We thank them for their excellent work, andthank the families of Kugaaruk for their participation.
The co-operation and support of the nursing staff of the Kugaaruk Health Centre made itpossible to collect weight and height data, and the cheerful support of the Kugaaruk Co-openabled us to distribute the food vouchers in a timely manner.
We appreciate the collaboration of Dr. Danielle Brulé of the Nutrition Research Division, Bureauof Nutritional Sciences, Food Directorate, Health Canada for her advice and assistance withobtaining nutrient data for country foods, the assistance of Josie Deeks for providing data fromthe Canadian Nutrient File and the advice of Dr. Peter Fischer, Chief, Nutrition ResearchDivision for his advice on the interpretation of the Dietary Reference Intakes. We are verygrateful to Dr. Mark Nord, Economic Research Service, United States Department ofAgriculture for agreeing to review the food security data and to calculate the food securitystatus of Kugaaruk households.
The thoughtful comments of Lori Doran and Brenda McIntyre, nutritionists with Health Canadaand the Government of Nunavut respectively, were much appreciated, as was the co-operationand support of Fred Hill, the departmental representative on this project, and Luc Ladouceur,Food Mail Program Coordinator at Indian and Northern Affairs Canada. Sincere thanks to FredHill for contributing the sections, “Food Supply System and Community Profile of Kugaaruk”and “Food Costs and Affordability in Kugaaruk,” and for editing the manuscript, and to LineNadeau for editing the French version of this publication.
Jean Lavallée of Micro Gesta was also extremely helpful in making the necessary refinementsto the database. We also appreciate the excellent work of Joan Perrault, the data entry clerk, Simeonie Kunnuk, Lorna Kayakjuak and Nick Amautinuar for the Inuktitut translations.
And finally, we appreciate the careful and thoughtful work of the reviewers and theirsuggestions for improvement: Dr. Valerie Tarasuk, Associate Professor, Department ofNutritional Sciences, University of Toronto and Dr. Olivier Receveur, Associate Professor,Department of Nutrition, Université de Montréal.

ix
Executive Summary
Kugaaruk, formerly Pelly Bay, is a predominantly Inuit community of 600 people, locatedapproximately 1300 kilometres northeast of Yellowknife, which serves as the “food entrypoint” for food shipped to this community under the Food Mail Program. The onlygrocery store in the community is a co-op.
The Kugaaruk Food Mail Pilot Project was initiated by Indian and Northern AffairsCanada with the co-operation of Health Canada, the Government of Nunavut, CanadaPost and the Kugaaruk hamlet council. Its aim was to promote healthy eating andimprove food security by reducing the postage rate for “Priority Perishables” (fresh andfrozen fruit and vegetables, frozen juice concentrate, most fresh dairy products andeggs) from $0.80 per kilogram to $0.30 per kilogram, plus $0.75 per parcel, onDecember 1, 2001. The project also includes nutrition education, retail training in properfood handling and storage, and store labels to identify “Priority Perishables”.
To obtain baseline data required to measure the impact of the pilot project, trained localinterviewers administered a household questionnaire to all households and a nutritionquestionnaire to women aged 15 to 44 in October-November 2001. The householdquestionnaire, completed by 92 Inuit households, asked about food purchasingpractices, opinions about the quality, variety and cost of certain foods, reasons for notbuying more fresh fruit and vegetables, demographic information and household foodsecurity, using a modified version of the United States Department of Agriculture FoodSecurity Module. The nutrition questionnaire, completed by 87 Inuit women, included a24-hour diet recall, a food frequency questionnaire, and questions on food preparation,health and lifestyle. A second 24-hour recall was completed by 53 Inuit women. Bothquestionnaires had an excellent participation rate (94% of available households and92% of available eligible women).
Nutrient intakes were analysed using nutrient values from the 2001 Canadian NutrientFile, with additional information on country foods from published papers by Kuhnlein etal. The C-SIDE software was used to calculate the percentage of non-pregnant, non-lactating women with a usual intake below the Estimated Average Requirement forvarious nutrients. Mean energy and nutrient contributions by food group and Food Mailcategory were also calculated.
Food security was a serious problem in Kugaaruk, with five out of six Inuit householdsclassed as “food insecure” and over half of families experiencing hunger in the past 12months because they were unable to afford enough food, even though access tocountry food did not appear to be a problem or a serious concern and country foodcontinues to be shared. Food costs were double those of Yellowknife and higher than inmost other isolated communities. The lack of jobs in the community, low income levels,and the fact that over a third of households were receiving social assistance would alsoplace this population at risk of food insecurity.

x
Almost half of Inuit respondents in the household survey said they were “extremelyconcerned” about being able to afford enough food for their family. Most respondentsrated the quality of most perishable foods as only fair or poor, and cited cost, quality,availability and lack of variety as the major barriers to purchasing more fresh fruit andvegetables.
There were a number of serious nutrition and health issues. Twenty-five percent of Inuitwomen rated their health as fair or poor, a level almost four times higher than amongwomen of a similar age in the Canadian population. Ninety-three per cent of Inuitwomen, including all pregnant women in the survey, smoked. Obesity was alsoprevalent, with one third of Inuit women having a Body Mass Index over 30, placingthem at high risk of heart disease, diabetes and high blood pressure. Waistcircumference, waist/hip ratios and activity levels also suggest a high risk for thesediseases.
According to the Food Frequency Questionnaire and the 24-hour diet recall, countryfood consumption was lower than in previous surveys of Inuit women, providing only10% of energy intake, mainly from Arctic char and caribou. No organ meats and verylittle country fat, seal, walrus or muktuk were reported. Based on the 24-hour recalldata, 54% of Inuit women who were not pregnant or lactating had an inadequate intakeof vitamin C, 68% for folate, 57% for vitamin B6 and 91% for magnesium. Mean intakesof vitamin A, calcium and fibre were also very low, and the mean saturated fat intakewas higher than recommended. Foods of Little Nutritional Value were an importantsource of energy (19%), saturated fat and sugar, despite the fact that potato chips werenot available at the store during the survey.
Priority Perishables were not an important part of the diet in this community. Inuitwomen were eating only about one serving of fruit and vegetables and less than onefifth of a serving of dairy products per day. Neither fresh nor UHT milk was generallyavailable in the community. It appears, therefore, that the Food Mail Pilot Project isappropriately focussed and should help to increase the consumption of more nutritiousstore foods, thereby improving the nutrition of women of child-bearing age as well as thefood security situation of Kugaaruk families.

Nutrition and Food Security in Kugaaruk, Nunavut
1
Background
Nutrition and Food Security in Isolated Communities
A number of studies among Inuit women of child-bearing age have documented lowintakes of folate, calcium, vitamin A and fibre, together with a high consumption of foodsof little nutritional value 1 2 3. Magnesium intake was also found inadequate among Inuitadults 3. Studies in Pond Inlet and Repulse Bay in 1992 and 1997 found a higherpercentage of women reporting poor or fair health compared to the general Canadianpopulation, and an increase in the number of women with a Body Mass Index (BMI) over27 2. Kuhnlein also found a higher prevalence of overweight among Inuit womencompared to the Canadian population 3.
The Indian and Northern Affairs Canada (INAC) nutrition surveys also found that foodsecurity was a serious concern in each of the communities surveyed 2 4. In 1997,approximately 80% of women in Pond Inlet and Repulse Bay reported running out ofmoney to buy food, about half reported not having enough to eat in the house in thepast month, and about 40% of women were “extremely concerned” about not havingenough money to buy food. This situation was worse for families on social assistance,where women were significantly more likely not to have enough to eat in the house inthe previous month compared to relatively well-off families 2. In the 1997 Labrador InuitHealth Survey, 28% of households reported that they occasionally did not have enoughto eat and 7% often did not have enough to eat 5.
Food insecurity has been identified by the Institute of Medicine as a predisposing factorto poor health and nutrition and as a nutrition risk factor for women in the SpecialSupplemental Nutrition Program for Women, Infants and Children (WIC) 6. Foodinsecurity among school-age children has also been associated with compromisedpsychosocial functioning 7. Food insecurity or insufficiency has been linked to adecrease in the consumption of fruits and vegetables, a lower amount of food in thehousehold and a significant increase in scores indicative of disordered eating patternswith increasing food insecurity 8. Compared to food-secure individuals in the UnitedStates, a higher percentage of food-insecure individuals failed to follow the dietaryguidelines for vitamin C and a minimum number of servings of fruits and vegetables perday 8. Other studies have found that on a given day, women from food-insufficienthouseholds were 1.4 times more likely to have energy intakes below 50% of thoserecommended. Low intakes were also more likely for vitamins A, E, C and B6 andmean calcium intakes were only 56% of the recommended allowance 9. In Canada,
Nutrition and Food Security in Kugaaruk, Nunavut
2
Tarasuk found that low-income women who reported hunger in their household in thepast 30 days also had a lower mean intake of energy, vitamin A, folate, iron andmagnesium. She concluded that this low level of intake could place these women at riskof nutrient deficiencies 10. In Pond Inlet, folate intake was significantly lower amongwomen on social assistance than among women who were relatively well-off 2.
The high cost of food in isolated Aboriginal communities and the inadequacy of socialassistance payments to provide enough income to purchase a healthy diet have beenreported in a number of food price surveys. In the 1992/93 nutrition surveys, INACfound that the Northern Food Basket cost 2 to 2½ times more in these communitiesthan in Ottawa 11. While the cost of perishables in some communities in Nunavut hasdecreased since 1991, following changes to the Food Mail Program, the overall cost offood has not declined substantially 12. Other food price surveys in isolated communitiesin Yukon and Alberta have reported the cost of the Northern Food Basket at 80 to 200%higher than in the south 13 14. Even though most families in these communities also relyon traditional food, obtaining this food is not without a cost. For some families,traditional food is not accessible due to a lack of equipment, skills or time, poor health oravailability 2 5.
Poor quality and a lack of variety of Nutritious Perishable foods were also identified asconcerns by Inuit and Fist Nations women in previous INAC surveys 2 4 and as barriersto the purchase of more fresh fruit and vegetables in the Labrador survey on foodquality conducted by INAC 15.
Since 1991, INAC has introduced a number of changes to the Food Mail Program. These included the application of a uniform postage rate of $0.80 per kilogram plus$0.75 per parcel for Nutritious Perishable foods, effective July 1993, and changes to theeligibility criteria, so that all isolated communities became eligible for this subsidy,effective in October 1991. Non-perishable food and other essential goods continued tobe shipped at higher rates, and Foods of Little Nutritional Value were excluded. InAugust 1996, certain prepared Convenience Perishable foods, such as frozen friedbreaded chicken, became ineligible for the subsidy. These changes were expected toresult in a lower cost for Nutritious Perishable foods, improvements in nutrient intake,especially for essential nutrients such as calcium, folate and vitamin A, and a lowerconsumption of Foods of Little Nutritional Value.
Changes to the Food Mail Program have resulted in a significant increase in shipmentsof Nutritious Perishable foods, but nutrition surveys among Inuit women of child-bearingage conducted in 1992, 1993 and 1997 failed to demonstrate any significant

Nutrition and Food Security in Kugaaruk, Nunavut
3
improvement in nutrient intake in Pond Inlet or Repulse Bay over this period 2.
Food Mail Pilot Projects
In order to reduce the cost of nutritious food and promote healthy eating, Health Canadaprovided funding enabling INAC to carry out a series of Food Mail Program pilot projectsin isolated northern communities. This investment was part of the Food Safety andNutrition Program initiatives announced in the 1999 federal budget.
The Government of Nunavut and the community of Kugaaruk agreed to participate inthe first pilot project. Kugaaruk was selected because it was located in the only regionof Nunavut that had a regional nutritionist at the time and it was an appropriate size for apilot project and a baseline survey to be carried out successfully with the fundsavailable. It was also especially challenging in terms of the pilot project objectives. Food prices were unusually high in this community and the quality and supply of PriorityPerishable food was known to be less than desirable. Therefore, if the pilot projectcould be successful in Kugaaruk, it would be reasonable to expect success in othercommunities.
Effective December 1, 2001, the postage rate for shipping the most nutritious perishablefoods (designated as Priority Perishables) to Kugaaruk was reduced from $0.80 to $0.30per kilogram plus $0.75 per parcel. Priority Perishables include fresh and frozen fruitand vegetables (excluding French fries and similar potato products), frozen fruit juiceconcentrate, most fresh dairy products and eggs. A country food component to theprogram has allowed the shipment of country food from Cambridge Bay at the PriorityPerishable rate effective January 1, 2003. The project also includes measures toimprove retail food quality, nutrition education on the use and benefits of these foodsand retail promotion of healthy foods. This joint initiative is supported by INAC, HealthCanada, the Department of Health and Social Services, Government of Nunavut, andCanada Post.
Nutrition and Food Security in Kugaaruk, Nunavut
4
Food Supply System and Community Profile of Kugaaruk
Kugaaruk, formerly Pelly Bay, is a community of about 600 people, with 120 householdsand 135 census families, located approximately 1300 kilometres northeast ofYellowknife. The Koomiut Co-op, the only grocery store in the community, obtains itsperishable food from suppliers in Edmonton. Orders are placed through ArcticCo-operatives Ltd. in Winnipeg. Some food suppliers in Yellowknife also ship fooddirectly to individuals in Kugaaruk, using the Food Mail Program or air cargo service. Perishable food that is not eligible for shipment under the Food Mail Program wouldhave to be shipped as regular air cargo or by charter at much higher rates.
Kugaaruk is the most remote community in the Kitikmeot Region in terms of the supplyof both perishable and non-perishable food. Perishable food is trucked from Edmontonwholesalers to Yellowknife, the “food entry point” for food shipped to this communityunder the Food Mail Program by First Air. Fresh and frozen food is normally receivedonce a week. For a few weeks during the spring breakup on the Mackenzie River,however, food must be flown from Edmonton or Hay River to Yellowknife or shuttledacross the river by helicopter, a service provided by RTL Robertson Enterprises Ltd. Neither trucking nor air service is provided from Edmonton under the Food MailProgram. Non-perishable food is resupplied once a year in September on the sealiftfrom Montréal via Nanisivik, with the Coast Guard providing the final leg of this servicefrom Nanisivik to Kugaaruk.
Kugaaruk’s population increased by almost 50% (200 people) between 1991 and 2001. In the 2001 Census, approximately 95% of the population identified themselves as Inuit,and 47% of the population was under 15 years of age. While almost 60% of thepopulation aged 15 and over were employed at the time of the 2001 Census, only 85 outof 320 adults (27%) had worked full-time throughout the previous year, compared to35% of adults in Canada as a whole who had done so. Education levels were generallylow. For example, about half of women aged 20 to 44 had not completed high school. Because of the low levels of full-time employment and education, the median censusfamily income for the year 2000 was approximately $37,000, compared to about$39,400 in Nunavut and $55,000 in Canada 16.
Nutrition and Food Security in Kugaaruk, Nunavut
5
Food Costs and Affordability in Kugaaruk
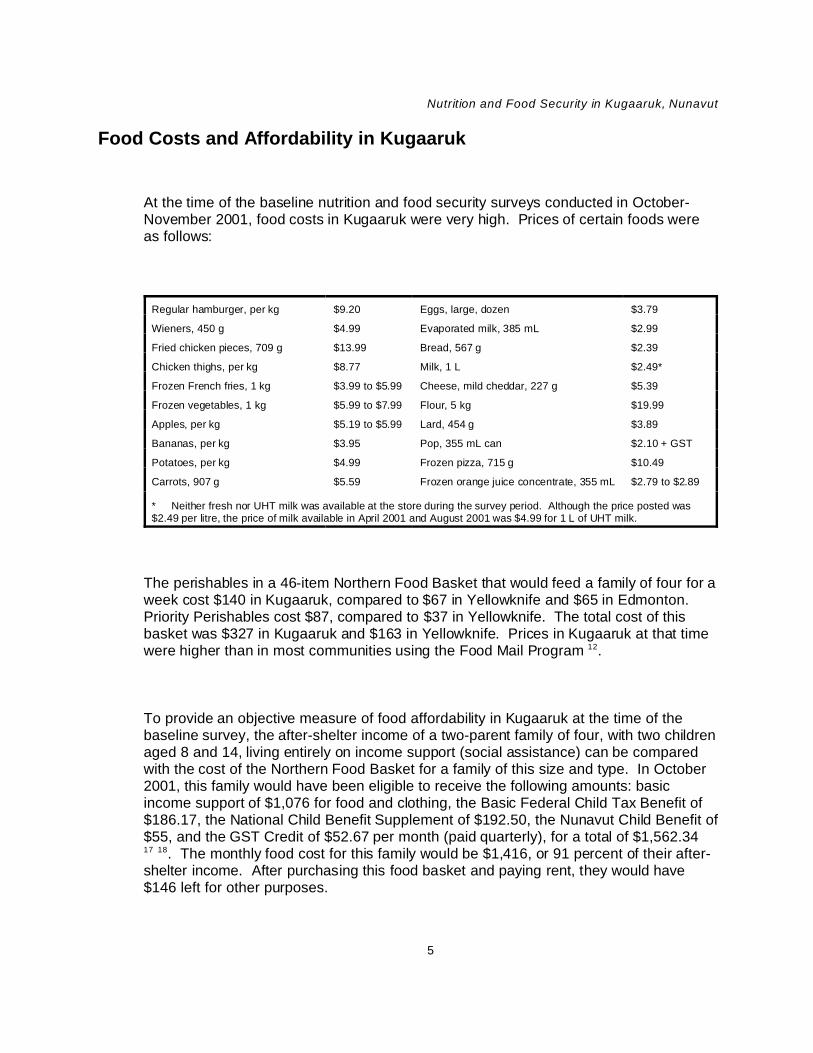
At the time of the baseline nutrition and food security surveys conducted in October-November 2001, food costs in Kugaaruk were very high. Prices of certain foods wereas follows:
Regular hamburger, per kg $9.20 Eggs, large, dozen $3.79
Wieners, 450 g $4.99 Evaporated milk, 385 mL $2.99
Fried chicken pieces, 709 g $13.99 Bread, 567 g $2.39
Chicken thighs, per kg $8.77 Milk, 1 L $2.49*
Frozen French fries, 1 kg $3.99 to $5.99 Cheese, mild cheddar, 227 g $5.39
Frozen vegetables, 1 kg $5.99 to $7.99 Flour, 5 kg $19.99
Apples, per kg $5.19 to $5.99 Lard, 454 g $3.89
Bananas, per kg $3.95 Pop, 355 mL can $2.10 + GST
Potatoes, per kg $4.99 Frozen pizza, 715 g $10.49
Carrots, 907 g $5.59 Frozen orange juice concentrate, 355 mL $2.79 to $2.89
* Neither fresh nor UHT milk was available at the store during the survey period. Although the price posted was$2.49 per litre, the price of milk available in April 2001 and August 2001 was $4.99 for 1 L of UHT milk.
The perishables in a 46-item Northern Food Basket that would feed a family of four for aweek cost $140 in Kugaaruk, compared to $67 in Yellowknife and $65 in Edmonton. Priority Perishables cost $87, compared to $37 in Yellowknife. The total cost of thisbasket was $327 in Kugaaruk and $163 in Yellowknife. Prices in Kugaaruk at that timewere higher than in most communities using the Food Mail Program 12.
To provide an objective measure of food affordability in Kugaaruk at the time of thebaseline survey, the after-shelter income of a two-parent family of four, with two childrenaged 8 and 14, living entirely on income support (social assistance) can be comparedwith the cost of the Northern Food Basket for a family of this size and type. In October2001, this family would have been eligible to receive the following amounts: basicincome support of $1,076 for food and clothing, the Basic Federal Child Tax Benefit of$186.17, the National Child Benefit Supplement of $192.50, the Nunavut Child Benefit of$55, and the GST Credit of $52.67 per month (paid quarterly), for a total of $1,562.3417 18. The monthly food cost for this family would be $1,416, or 91 percent of their after-shelter income. After purchasing this food basket and paying rent, they would have$146 left for other purposes.

Nutrition and Food Security in Kugaaruk, Nunavut
6
The average number of social assistance cases in Kugaaruk in 2001 was 55 permonth 19. Single persons aged 18 and over would be treated as a separate “case”, evenif they lived with parents or other family members.
Survey Objectives
1. To evaluate the food purchasing patterns and food security status of householdsin Kugaaruk prior to the implementation of the pilot project on December 1, 2001.
2. To assess nutrient intakes and the general health status of Inuit women of child-bearing age in Kugaaruk at that time.
Survey Design and Methodology
Sample Selection
Participants were identified through a community list provided by the hamlet. Allhouseholds were included in the household survey. All women aged 15 to 44, includingpregnant and lactating women and non-Inuit women, with the exceptions noted below,were included in the nutrition survey. This population group was selected for thenutrition survey because it is at high risk for nutritional problems, and the health ofwomen of child-bearing age has an important impact on the health of their children and,therefore, of the community.
For the Nutrition Questionnaire the following exclusions applied:
• interviewers;
• women within one week of childbirth, most of whom would be outside thecommunity during this time;
Nutrition and Food Security in Kugaaruk, Nunavut
7
• women non-resident in the community (away at school, for example); and
• women who were ill during the entire time of the survey, such that their foodconsumption was affected. For short duration acute illnesses, interviewersattempted to reschedule the interview upon recovery.
All participants were assigned an identification number to identify the household andindividual. An information form in English and Inuktitut was provided to all participantsand all eligible participants were asked to sign a bilingual consent form for eachquestionnaire. At the completion of the survey, participants were eligible for a $10 foodvoucher for each completed questionnaire. The nutritionist, coordinator and a hamletcouncil member participated in a radio interview to explain the purpose of the Food MailPilot Project and of this survey, the date when the new Food Mail rate for PriorityPerishables would be introduced, which foods would be included in this special rate andhow the results would be handled. We also explained that interviewers had sworn anoath of confidentiality and described the measures we were taking to protect theconfidentiality of their responses.
Questionnaires were reviewed with the interviewers for cultural relevance and sensitivityand minor modifications made, as necessary.
Assessment Tools
Household Questionnaire
The Household Questionnaire was administered to the individual responsible for most ofthe food purchases. It included questions on the following:
• whether they had purchased selected foods, including certain Priority Perishablefoods, Foods of Little Nutritional Value and country food over the previous fourweeks;
• where certain foods were usually purchased (Co-op, from Yellowknife by FoodMail, by air cargo or other);
• perception of the quality of certain Priority Perishable foods;

Nutrition and Food Security in Kugaaruk, Nunavut
8
• perception of the variety and price of fresh fruits and vegetables;
• reasons for not buying fresh fruit and vegetables;
• the 18-item US Food Security Survey Module with minor modifications toimprove acceptability among the Inuit population. Following cognitive testingwith the local Inuit interviewers, the food security questionnaire developed for theAlberta Northern River Basin Food Consumption Survey was modified to prefacethe food security statements with the phrase, “Some families might say.” Thisapproach was considered to be less direct and more culturally acceptable to theInuit. Modifications adopted for the Alberta Northern River Basin FoodConsumption Survey and used in the Kugaaruk survey included: (a) instead ofasking if the statements were “always true”, “sometimes true” or “never true”, therespondent was asked if this happened “often”, “sometimes” or “never” and (b)changing “balanced meals” to “healthy meals”. The former modification avoidedpossible questioning of the respondent’s truthfulness in the answers given. Thelatter modification acknowledged that “healthy” was more meaningful to theAboriginal population than “balanced”.
• reasons for being unable to afford enough food;
• action taken when there was not enough money to buy food;
• access to country food and school food programs;
• degree of concern over specific social issues (running out of money to buy food,alcohol and drug abuse, the safety of country food, family violence, lack of jobs,and access to country food). This question helped to provide a context withinwhich the perception of the severity of concern over food security could beconsidered vis-à-vis other social issues.
• socio-demographic factors relating to household size, ethnic status, sources ofincome, income of households not receiving social assistance, and expenditureon food and other necessities.
Nutrition Questionnaire
The Nutrition Questionnaire included:
• a 24-hour diet recall administered to 93 women;
• a modified food frequency questionnaire covering a total of 81 foods, includingcountry food, Priority Perishable food, Convenience Perishables, selected Non-perishable foods and Foods of Little Nutritional Value. A number of steps were

Nutrition and Food Security in Kugaaruk, Nunavut
9
taken to reduce respondent burden on the Food Frequency Questionnaire. Individual food consumption frequency was only asked about fruits andvegetables commonly consumed in Inuit villages. To handle less commonlyeaten fruits and vegetables, participants were asked to select the five mostfrequently eaten from a series of photographs. The use of photographs alsoavoided any misunderstanding which might arise from translation.
• questions on perceived health status, lifestyle (i.e., smoking, pregnancy andlactation status, activity level), medical conditions affecting diet, andanthropometric measurements (height, weight, waist and hip circumference). For participants who did not know their height and weight, weight, height, waistand hip measurements were recorded at the health centre using a balance scale. Questions relating to perceived health status and smoking were included in orderto provide a context within which food security and nutrient intake could beconsidered. Information on smoking status permitted a more accurateevaluation of the requirement for vitamin C, which is higher for smokers. Thecost of cigarettes must also be considered a factor in food insecurity. Perceivedhealth status is a well-recognized indicator of population health and, therefore, isrelevant to the issue of food insecurity and nutrient intake.
• a second 24-hour recall administered to 56 women to permit a statisticalcorrection for within-person variation in nutrient intakes.
Interviewer Training and Data Collection
Interviewers were selected by the local survey coordinator and provided with five days oftraining by the project nutritionist in survey objectives and methodology, protectingconfidentiality and minimizing refusals. Special attention was given to the proper use offood models and the standardized procedure for conducting a 24-hour diet recall. Othertopics included reading labels and details of some of the foods sold in the local store.
Data collection took place over a three-week period in October-November, 2001. Bilingual response cards were used for the questions on income, activity level and foodsecurity statements. Photographs of fruit and vegetables were used to enablerespondents to quickly identify foods purchased or consumed, and package labels wereused to clearly distinguish between fruit drink crystals with and without vitamin C, andbetween fruit juice and fruit drinks. Nutrition Canada graduated food models were usedto describe portion size.

Nutrition and Food Security in Kugaaruk, Nunavut
10
Data Analysis
Household data were entered into Excel and then into the R Statistical System foranalysis. Means and frequencies were calculated for each question. Families weredivided into three socio-economic groups (Social Assistance, Working Poor andRelatively Well-Off), based on household income and size. The division into WorkingPoor and Relatively Well-Off groups was based on the Statistics Canada Rural LowIncome Cutoff (LICO) numbers applied to reported income 20.
Food security status was analysed according to socio-economic group using the FischerExact Test, which gives exact statistical results for small sample sizes. Twenty-four-hour recall data were entered into the nutrition evaluation program of Micro Gesta Inc. Nutrient data for most foods were based on the Canadian Nutrient File 2001 (CNF)modified to reflect the most recent folic acid values. To arrive at the Dietary FolateEquivalents (DFE) for each food, food folate was calculated by subtracting folic acidvalues from folacin. This value was then added to folic acid multiplied by 1.7 to produceDFEs for each food. Nutrient data for country foods not included in the CNF were basedon the published data of Kuhnlein and the Alaska Health Service 21 22 23. Recipes wereadapted from the USDA recipe file using CNF data and published country food values. Foods were categorized into 13 food groups and six Food Mail categories.
Nutrient data were then exported into a text file for analysis. In order to determine thepercentage of a population whose usual intake of a nutrient is below the EstimatedAverage Requirement (EAR), it is necessary to estimate the distribution of usual intakesamong individuals 24. The usual intake for a group cannot be determined from 24-hourrecall data without calculations that disentangle between-individual and within-individualvariation. Because daily intakes of nutrients are generally not normally distributed, acomplex set of adjustments and transformations is required.
In the current study, the required adjustments and transformations were performedusing the C-SIDE software, which is based on the work of Nusser 25. Specifically, theC-SIDE software was used to:
1. apply a power transformation to make the distribution of the 24-hour recall datamore symmetric;
2. make adjustments to the data to account for variations between initial andsubsequent 24-hour recalls and the day of the week the interview wasconducted;

Nutrition and Food Security in Kugaaruk, Nunavut
11
3. apply a semiparametric transformation to further normalize the data; and
4. estimate the distribution of usual intakes.
This program generates an adjusted mean and median for energy and nutrients. Incases where an EAR is known, and where the distribution of requirements amongindividuals was known to be symmetric, the percent of women below the EAR forwomen 19 to 30 was determined using the EAR cut-point method 24. This percentage isconsidered to have a usual inadequate intake.
Since the distribution of requirements for iron is non-symmetrical, the EAR cut-pointmethod is not appropriate for determining the probability of inadequacy. Therefore, theprobability approach was used 24. In this calculation, distribution percentiles generatedby the C-SIDE program for iron were used in conjunction with probabilities of inadequateiron intakes to estimate the percentage of the population with an inadequate intake. These probabilities and ranges were based on data on usual intakes for a mixedpopulation of women using and not using oral contraceptives derived from theContinuing Survey of Food Intakes by Individuals, 1994-96 26.
To calculate the simple mean energy and nutrient intake and mean intake by food groupand Food Mail category, the first and repeat recalls were averaged for each respondentwho completed two recalls and combined with the data from women who completed onlyone. Mean energy and nutrient intakes were then calculated for the population, by foodgroup and Food Mail category. Frequencies were determined with Epi Info 2000.
Linear statistical modelling analysis (i.e. T-tests, Fischer Exact test) was used toexamine relationships between socio-economic group and food security versus intake ofkey nutrients, consumption of Priority Perishables (based on the mean intake of vitaminA and folate from these foods), energy intake versus BMI and age, and country foodconsumption versus age group (15 to 24 and 25 to 44). Due to the small sample size,no adjustments were made for confounding variables. For most analyses, plots wereexamined graphically in order to identify unusually high or low values.
Preliminary results were discussed with community members to verify our findings andensure that the questionnaire on food security was well understood, particularly themore severe aspects of food insecurity such as cutting down on the size of meals orgoing hungry because they were unable to afford enough food to feed their family. The

Nutrition and Food Security in Kugaaruk, Nunavut
12
findings were discussed in separate meetings with members of the hamlet council,nursing staff, the Food Mail Pilot Project Co-ordinator and the interviewers. We alsoparticipated in an open-line radio show where the results were presented andcommunity members were asked for their comments and questions.
Methodological Considerations
Food Security Questionnaire
The 1992, 1993 and 1997 INAC nutrition surveys indicated that food security wasperceived as a problem by Inuit women of child-bearing age 2 4 . However, thequestions did not assess the severity of the problem.
To date, no instrument has been validated to measure food insecurity among Aboriginalpopulations that depend in whole, or in part, on hunting or fishing for food. However, themost widely validated tool available to measure food insecurity is the US Food SecuritySurvey Module Questionnaire 27. This instrument has been validated in a number ofannual national surveys in the United States, including the Current Population Survey. This 18-item questionnaire evaluates the severity and prevalence of food insecurity andenables a classification of households by food security status. The score depends onthe number of valid affirmative responses to each question. The questions are arranged(with a few exceptions to improve readability) in increasing degree of food insecurity,reflecting ranges of severity, from a score of 0, or “Food Secure”, to a maximum scoreof 10, indicating “Food Insecure with Hunger”. The questionnaire builds on the work ofRadimer and colleagues at Cornell University who developed a food sufficiencyquestionnaire to measure food insecurity among low-income women 28, and has nowbeen used in a number of national American surveys, in the Northern River Basin FoodConsumption Survey, as well as in third-world countries. This measurementmethodology has also been used to compare the effects of ethnic/cultural differences onthe measurement of food insecurity and hunger 29.
According to Mark Nord of the USDA Economic Research Service, the modificationsmade to the questionnaire to improve cultural acceptability for an Inuit population did notaffect the scaling.

Nutrition and Food Security in Kugaaruk, Nunavut
13
It is important to remember that this questionnaire reflects “household” food securitystatus, and not necessarily the status of any individual within the household. It is alsobased on experiences over the previous 12 months, and may not relate to the incomeover the previous month or to the nutrient intake of women over the previous 24 hours.
Assessing Usual Intake
The 24-hour recall is the most widely used instrument to evaluate energy and nutrientintake. Estimating the usual intake of a group is complicated by large variations inintake from day to day, between individuals and by season 30, the degree of variationdiffering among nutrients 31 32 33 34. Individuals also vary in their requirements for energyand nutrients. For example, iron requirements vary widely among women of child-bearing age due to differences in menstrual flow. For most nutrients, an average ofthree or more 24-hour recalls on non-consecutive days is considered sufficient toproduce a reasonably accurate estimate of intake for an individual. In order to producereasonable results for a group, at least some individuals (a minimum of 40) need to beinterviewed at least twice in order to perform the necessary calculations to estimate thedistribution of usual intakes 25.
The Canadian Recommended Nutrient Intakes (RNIs) and American RecommendedDietary Allowances (RDAs) were set with a safety factor above typical requirements, sothat if a group had a mean intake equal to the RNI or RDA, you could be reasonablyconfident that their usual intake exceeded the individual requirements of mostindividuals in the group.
The new Dietary Reference Intakes (DRIs) represent a more complex set of valuesdeveloped for different planning or assessment purposes. With these new values, theRDA is defined as “the average dietary intake level that is sufficient to meet the nutrientrequirement of nearly all healthy individuals in a life stage and gender group” 24.
Comparison of the mean intake of a group with the new RDAs and the conclusion thatdiets are adequate if they meet or exceed the RDA are inappropriate because theprevalence of inadequacy depends on the shape and variation of the “usual” intakedistribution, not on mean intake. If group mean intake equals the RDA there will be asubstantial proportion of the group with usual intake less than their requirement 24.
Nutrition and Food Security in Kugaaruk, Nunavut
14
An estimate of inadequate intakes for a group is now based on the percentage belowthe EAR (i.e. the median daily nutrient intake level estimated to meet the requirement ofhalf the healthy individuals in a particular life stage and gender group within the generalNorth American population) 24. The percentage below the EAR may be calculated usinga program such as C-SIDE software, which performs the necessary adjustments toestimate the distribution of usual intakes 25.
The establishment of the EAR takes into account the reduction in the risk of chronicdegenerative diseases in addition to the prevention of nutrient deficiencies. The EARcan be used to examine the probability that an individual’s intake is inadequate. Asmentioned above, it can also be used to estimate the prevalence of inadequate intakeswithin a group. Since the EAR, by definition, only meets the requirements of half of theindividuals in a group, it cannot be used as an intake goal for individuals. The RDA,which is calculated from the EAR by taking this value and adding 2 standard deviations,thus exceeding the requirements of 97.5% of the individuals in the group, is theappropriate goal for individuals. The EAR is used to plan for an acceptable prevalenceof inadequate intakes within a group.
The 24-hour recall data were collected from women aged 15 to 44. Ideally, the resultswould be analysed according to three separate age groups (14 to 18, 19 to 30 and 31 to50) for which EARs have been estimated. However, the small sample size made thisimpossible. Instead, we selected the EARs for women aged 19 to 30, based on amedian age of 27. This methodology may result in an under- or overestimate of energyand nutrient requirements, depending on the age of individuals and the respectiverequirement.
The validity of the 24-hour recall depends on the respondent’s memory and ability torecall portion sizes. Furthermore, the validity is affected by certain respondent biases. Respondent errors may include under- or over-reporting and the influence of socialdesirability. Under-reporting of energy intake appears to affect as many as 25% ofdietary records 35. In a number of studies, BMI has been found to be a predictor ofunder-reporting 36 37 38 39 40, with women tending to under-report more than men 40 41. Social desirability also affects under-reporting, especially of macronutrient intake 37 38 39
42. Under-reporting of energy intake by social desirability trait was found to be higheramong women with less than college education than among those with collegeeducation 42.
Both the co-operation of the respondent and her ability to accurately recall foodconsumption are influenced by the interviewer’s skill with the instrument. The

Nutrition and Food Security in Kugaaruk, Nunavut
15
interviewer must be able to prompt memory, without suggesting an appropriateresponse. The instruments used to describe portion size play an important role, sincethe portion size of some foods may be more difficult to estimate than others. Householdmeasures such as cups, spoons, etc., do not allow for slight differences in amounts andthey are difficult to use for foods of irregular shape or cooked mixtures which aremounded on a plate. Standardized graduated food models improve the accuracy ofrecalling portion size by providing a range of choices. For certain nutrients, accuraterecall of portion size is critical. For example, since fat is a concentrated source ofenergy, a small underestimate in portion size would result in a significant underestimateof energy intake.
Conducting 24-hour recalls in a single season ignores important seasonal differences inthe consumption of country food and some store foods as well. Nutrient intake may alsovary seasonally, especially for nutrients such as vitamin A, vitamin D, cholesterol andlinoleic acid, all of which are concentrated in a few foods. Comparison of the results ofthis survey with previous INAC surveys of other Inuit communities may also be difficult,since most of them were conducted in the spring.
Finally, the results of a 24-hour recall may suggest areas of concern for the communityor specific groups and educational needs, but individual assessment of nutritional statusand health would require clinical and biochemical investigation.
Food Frequency Questionnaire
The food frequency questionnaire (FFQ) is generally used in large epidemiologicalstudies as a means of ranking individuals in terms of risk of chronic disease accordingto their consumption of certain foods, and may provide information on the variety of foodconsumed over a longer period than a 24-hour recall. However, it has a number ofinherent problems, including the respondent’s ability to report consumption over theselected time period. Since respondents may have difficulty estimating frequency andportion size over a long period, they tend to overestimate consumption and report theirroutine or typical diet rather than the specifics of what they ate over the period inquestion 43. Comparison of the Block FFQ and the Harvard FFQ with 24-hour recallsfound that both instruments overestimated intakes of protein, calcium, vitamin A andvitamin C. The Harvard questionnaire also overestimated energy intake, whereas theBlock questionnaire overestimated iron intake 44. While the food frequencyquestionnaire tends to overestimate food consumption, it does provide information on

Nutrition and Food Security in Kugaaruk, Nunavut
16
how frequently foods are consumed over a specific period. For these reasons, the foodfrequency questionnaire used in the current study asked only about the frequency ofconsumption, not the usual quantities consumed.
The validity of the food frequency questionnaire could be improved by basing it on a 24-hour recall, if this information were available, and by modifying the format to be moreculturally sensitive in terms of the order of foods. Alternatively, the food frequency couldbe reviewed by local representatives to select the most important foods and the mostappropriate order. In this case, the questionnaire was reviewed by local representativesto ensure that the most important foods were included.
Neither the 24-hour recall nor the food frequency questionnaire, by themselves, havethe capacity to determine what proportion of a group has an inadequate or excessiveenergy intake, since both instruments may be affected by under- or over-reporting, anddo not take activity level into account. Instead, the BMI, in addition to detailedinformation on activity level, is used for this purpose.
Inuit and Non-Inuit Respondents
Although there are very few non-Inuit residents in Kugaaruk, they were asked toparticipate. This was done to respect the wishes of the Government of Nunavut, whichrepresents all Nunavummiut, rather than the Inuit alone. However, since there wereonly six non-Inuit women who completed the nutrition survey, we did not report theresults of their 24-hour recall data. We also felt that it was more important to provideaccurate data for the Inuit alone than combined data for the entire community.
For the Household Questionnaire, we decided to include the non-Inuit responses to thequestions related to food purchasing, since we believed it was important to documentthe differences between Inuit and non-Inuit food purchasing patterns. We combinedInuit and non-Inuit responses to the questions about perceptions of variety, quality andcost. However, we did not combine their responses to the food security questionnaire inorder to focus on the food security situation of the Inuit. All non-Inuit households werefood secure.
Nutrition and Food Security in Kugaaruk, Nunavut
17
Household Survey Results
Household Size and Composition
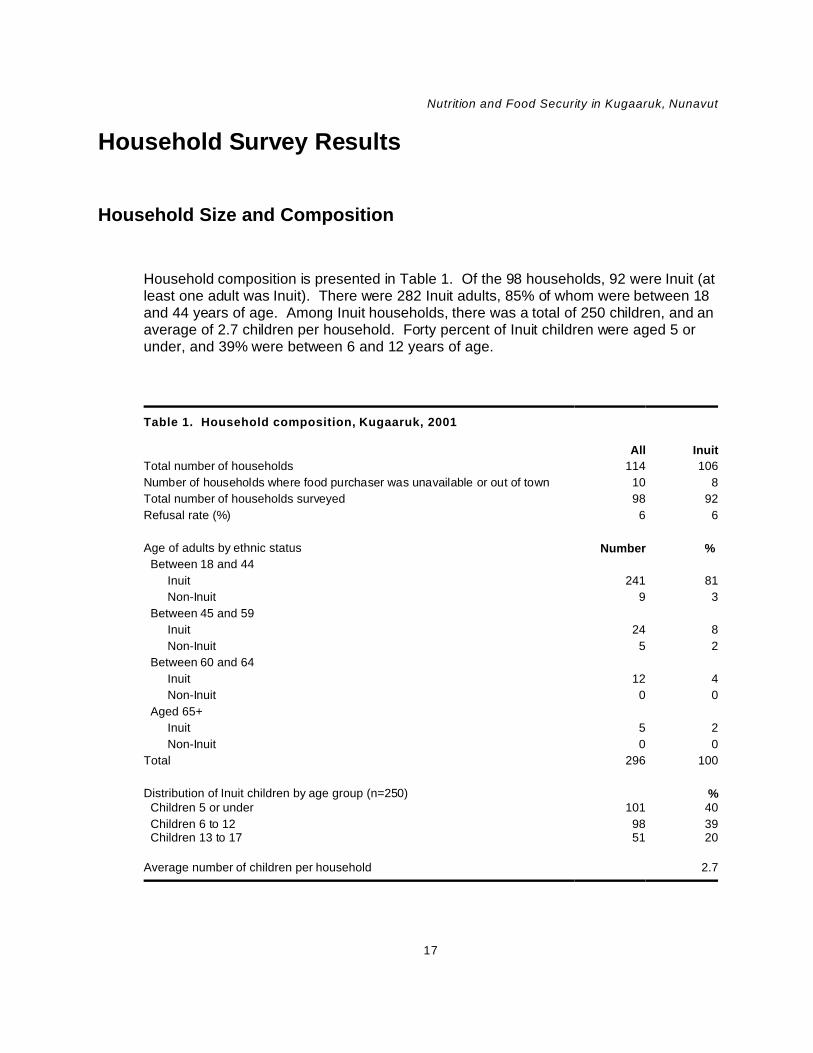
Household composition is presented in Table 1. Of the 98 households, 92 were Inuit (atleast one adult was Inuit). There were 282 Inuit adults, 85% of whom were between 18and 44 years of age. Among Inuit households, there was a total of 250 children, and anaverage of 2.7 children per household. Forty percent of Inuit children were aged 5 orunder, and 39% were between 6 and 12 years of age.
Table 1. Household composition, Kugaaruk, 2001
All Inuit
Total number of households 114 106
Number of households where food purchaser was unavailable or out of town 10 8
Total number of households surveyed 98 92
Refusal rate (%) 6 6
Age of adults by ethnic status Number %
Between 18 and 44
Inuit 241 81
Non-Inuit 9 3
Between 45 and 59
Inuit 24 8
Non-Inuit 5 2
Between 60 and 64
Inuit 12 4
Non-Inuit 0 0
Aged 65+
Inuit 5 2
Non-Inuit 0 0
Total 296 100
Distribution of Inuit children by age group (n=250) % Children 5 or under 101 40
Children 6 to 12 98 39 Children 13 to 17 51 20
Average number of children per household 2.7
Nutrition and Food Security in Kugaaruk, Nunavut
18
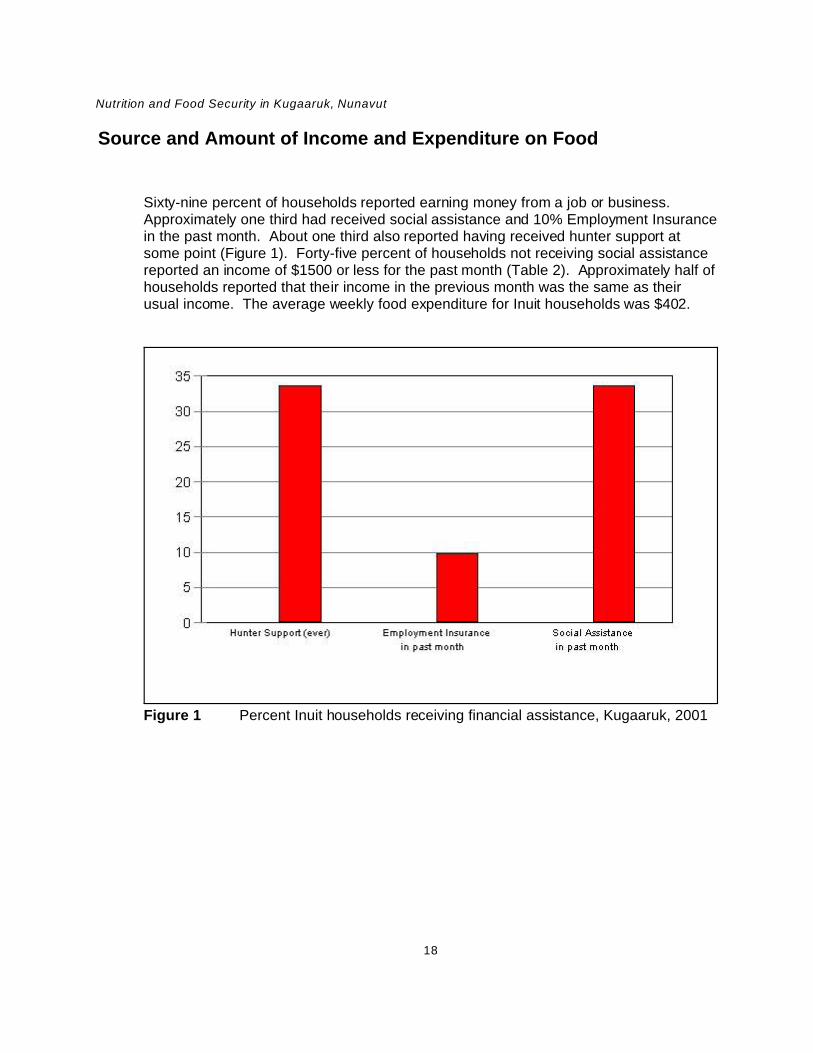
Figure 1 Percent Inuit households receiving financial assistance, Kugaaruk, 2001
Source and Amount of Income and Expenditure on Food
Sixty-nine percent of households reported earning money from a job or business. Approximately one third had received social assistance and 10% Employment Insurancein the past month. About one third also reported having received hunter support atsome point (Figure 1). Forty-five percent of households not receiving social assistancereported an income of $1500 or less for the past month (Table 2). Approximately half ofhouseholds reported that their income in the previous month was the same as theirusual income. The average weekly food expenditure for Inuit households was $402.

Nutrition and Food Security in Kugaaruk, Nunavut
19
Table 2. Inuit household income and expenditures, Kugaaruk, 2001
Percent households earning money from different sources (n=85) % Selling fur or sealskins 13
Selling crafts 21
Job or business 69
A pension 21
Percent households receiving financial assistance (n=92) % Hunter Support (at any time) 34
Employment Insurance (in past month) 10
Social assistance (in past month) 34
Total household income 1 of households not receiving social assistance in the past 4 weeks (n=61) % $1500 or less 46
$1501 to $2000 26
$2001 to $3000 16
$3001 or more 7
Don’t know 5
Reported income compared to usual income (n=42) %
Same 55
More than usual 17 Less than usual 12
Don't know 17
Average weekly food expenditure $402
1 Income includes take-home pay from a job, money from selling furs, sealskins, carvings or crafts,pensions, net income from running a business and Employment Insurance.
Food Security
The extent and severity of household food insecurity was measured with the US FoodSecurity Survey Module. The 18-item food security questionnaire asks about conditions,experiences and behaviours characteristic of a wide range of severity of food insecurityand hunger experienced over the past 12 months (See Appendix B). The first twoquestions reflect uncertainty about having enough food and the experience of runningout of food. The remaining items are arranged in increasing order of severity, screeningout food-secure participants early in the process.

Nutrition and Food Security in Kugaaruk, Nunavut
20
In the general American population, food insecurity follows a progressive scale ofseverity, such that adults will report doing without before obvious behavioural signs offood insecurity are reported for children. However, in this survey, children were affectedby household food insecurity at nearly the same level of severity as were adults. Thispattern was also typical (although not as marked) of surveys conducted among otherNorth American Aboriginal groups 45 29. For this reason, the results for the 10-itemadult/household scale and the 8-item child scale are presented separately (Table 3).
“Food insecure” or “food insecure without hunger” includes affirmative responses toquestions describing anxiety about having adequate money or food to feed the familyand perceptions that the food eaten by adults or children was inadequate in quality orquantity. Cutting down on the size of the meal, eating less than you felt you should, noteating for a whole day and being hungry because there wasn’t enough money for foodare questions describing the most severe condition, “food insecurity with hunger”.
On the 10-question adult scale, three or more affirmative responses are required for ahousehold to be classified as “food insecure without hunger”. In Kugaaruk, most foodinsecure households reported a larger number of these conditions. Six or moreaffirmative responses to adult-referenced questions are required for a household to beclassified as “food insecure with hunger”.
Children’s food security status is calculated from the eight questions that ask specificallyabout food conditions among children in the household. The first three child itemsreflect disrupted eating patterns or reduced quality and variety and identify children whoare “food insecure” or “have a restricted diet” in this analysis. “Food insecure withhunger” refers to the more severe items on the child scale, namely skipping mealsbecause there wasn’t enough money for food, doing so at in least three months in thepast year, and going hungry and not eating for a whole day. Two or more affirmativeresponses to child-referenced questions are required for a household to be classified ashaving food insecurity among children and five or more affirmative responses to beclassified as food insecure with hunger.
Adults were experiencing food insecurity without hunger in 24% of Inuit households. Adults in 54 households (59%) were “food insecure with hunger” (Table 3). On thechildren’s food security measure, children were food secure in only 17% of Inuithouseholds, 30% were food insecure without hunger and in 52% of households, childrenwere hungry at times because the household could not afford enough food (Table 3,Figure 2).

Nutrition and Food Security in Kugaaruk, Nunavut
21
Figure 2 Food security status, Inuit households, Kugaaruk, 2001
Looking at both measures for households with children, both adults and children werefood secure in only 14% of Inuit households. In two thirds of households, adults,children, or both were food insecure with hunger, and in 43% both adults and childrenwere food insecure with hunger (Table 3). In 2001, 3.3% of households in the UnitedStates were food insecure with hunger 46. Compared to the general U.S. population thiscommunity is “a very food-needy population”.
Table 4 presents responses to individual questions by food security status. Between 83and 92% of all households had experienced anxiety about being able to afford enoughfood. Between 27 and 66% of all households experienced the more severe conditions,such as cutting the size of the meal, skipping meals, eating less than they should, goinghungry and not eating for a whole day in three or more months because they wereunable to afford enough food. It is alarming that 28% of all households reported thatchildren did not eat for a whole day. These conditions were more prevalent amonghouseholds classified as “food insecure with hunger”. Fifty percent of theserespondents reported they had lost weight because there wasn’t enough money forfood, and 44% did not eat for a whole day in three or more months because they wereunable to afford enough food.

Nutrition and Food Security in Kugaaruk, Nunavut
22
Table 3. Food security among Inuit Households, Kugaaruk, 2001
Number %Adult food security (n=92) Food secure 16 17 Food insecure without hunger 22 24 Food insecure with hunger 54 59
Children's food security among households with children (n=86) Food secure or only one child-related food security problem 15 17 Food insecurity of children ("reduced quality or variety of children's diets" without hunger)
26 30
Severe food insecurity of children (children hungry at times because household couldn't afford enough food)
45 52
Food security among households with children (n=86) Food secure – both adults and children 12 14 Food insecurity without hunger among either adults or children or both 17 20
Food insecure without hunger – both adults and children 11 13
Food insecurity with hunger Hunger among either adults or children or both 57 66Hunger among both adults and children 37 43Hunger among adults but not children 12 14Hunger among children but not adults 8 9
Note: Food security was measured using the US Food Security Survey Module, modified following cognitive testingamong Inuit interviewers. For the purposes of this survey, only Inuit households are included in the analysis. The resultswere analysed by Mark Nord, Economic Research Service, USDA. For this survey, the 10-item adult/household scalewas used to describe conditions among adults and the 8-item children/household scale to describe conditions amongchildren.
The frequency of occurrence of these conditions or behaviours provides additionalinsight into the severity of food insecurity (Table 5). At least half of families reportedthey often worried about being able to afford enough food, often ran out of money to buyfood and often relied on few kinds of low-cost foods to feed their children. The moresevere conditions, such as adults cutting the size of their meals or skipping meals,affected one third of families almost every month and 18% of adults reported not eatingfor a whole day almost every month because they were unable to afford enough food. In 24% of families, children skipped meals almost every month because there was notenough money for food.
This level of food insecurity existed despite the fact that 96% of households had accessto country food most of the time, in two thirds of households children under five receivedbreakfast, lunch or snacks at day care, pre-school or kindergarten, and in 76% ofhouseholds children 6 to 17 received breakfast, lunch or snacks at school (Table 6).

Nutrition and Food Security in Kugaaruk, Nunavut
23
Table 4. Responses to food security scale items, Inuit households, Kugaaruk, 2001
Scale item Households affirming item
Allhouseholds(n=92)
All foodinsecurehouseholds without hunger(n=22)
All foodinsecurehouseholdswith hunger(n=54)
Percent 2
Household items
Worried food would run out before we got money to buy more 92 95 100
Food bought didn’t last, and we didn’t have money to get more 88 95 100
Couldn’t afford to eat healthy meals 83 91 98
Adult items
Adults cut the size of meals or skipped meals because therewasn’t enough money for food
60 18 94
Respondent ate less than felt he/she should 1 66 50 93
Adults cut size of meal or skipped meals in 3 or more months 1 53 9 87
Respondent hungry but didn’t eat because couldn’t afford 50 14 80
Respondent lost weight 1 30 4 50
Adults did not eat for a whole day 1 30 14 46
Adults did not eat for a whole day in 3 or more months 27 4 44
Child items (for households with children)
Allhouseholds(n=86)
All foodinsecurehouseholdswithout hunger(n=26)
All foodinsecurehouseholdswith hunger(n=49)
Percent 2
Relied on few kinds of low-cost foods to feed children 1 86 96 100
Couldn’t feed children healthy meals 1 80 92 100
Children were not eating enough 1 74 73 100
Cut the size of children’s meals 1 56 27 89
Children were hungry 1 56 15 98
Children skipped meals 1 44 4 82
Children skipped meals in 3 or more months 41 4 78
Children did not eat for a whole day 1 28 0 53
1 The actual wording of the item includes a specific reference to not being able to afford enough food.
2 Percentages are based on the number of valid responses to each item. Households without children are excluded fromthe child-referenced items.

Nutrition and Food Security in Kugaaruk, Nunavut
24
Table 5. Percent reporting frequency of occurrence of behaviours, experiences, and
conditions affecting food insecurity, Inuit households, Kugaaruk, 2001
Frequency of occurrence
Condition Often Sometimes
Total (everduring theyear)
Percent 2
Worried food would run out before we got money to buy more 53 39 92
Food bought didn’t last and we didn’t have money to get more 50 38 88
Couldn’t afford to eat healthy meals 35 48 83
Relied on few kinds of low-cost food to feed children 1 51 35 86
Couldn’t feed children healthy meals 1 42 38 80
Children were not eating enough 1 35 39 74
Frequency of occurrence
Almost everymonth
Some months butnot every month
In only 1 or 2months
Total (everduring theyear)
Percent 2
Adults cut size of meals or skipped meals 1 35 18 5 60
Adults did not eat for a whole day 1 18 9 3 30
Children skipped meals 1 24 17 3 44
1 The actual wording of the item includes a specific reference to not being able to afford enough food.
2 Percentages are based on the number of valid responses to each item. Households without children are excluded fromthe child-referenced items. Total includes frequency not stated.
The high cost of food and having to pay bills were the major reasons given for beingunable to afford enough food. When faced with this situation, most Inuit households(82%) borrowed food or money from friends or family (Table 6). The high cost of gasand repairs were the principal reasons why families were unable to get country food(Table 7).

Nutrition and Food Security in Kugaaruk, Nunavut
25
Table 6. Reported reasons for food insecurity and remedial action taken, Inuit households,
Kugaaruk, 2001
Reasons for not being able to afford enough food (n=78) % Food costs too much 78 Had to pay bills (like hydro, children’s clothing, school supplies) 71 Gave money away 36 Not enough income 35 Had to buy hunting, fishing or trapping equipment, supplies or gas 27 Not working 13 Spent money gambling 9 Waiting for EI or Social Assistance 5 Gave food away to others in the community 4 Don't know or refuse 1
Action taken by Inuit households when they were unable to afford enough food (n=72) % Borrow food or money from friends or family 82 Go hunting or fishing 44 Make an item to sell 39 Do without 21 Ask store manager for more credit 6 Other 11
Percent households where children under 5 received breakfast, lunch or snacks at a day care,pre-school program or kindergarten (n=74)
64
Percent households where children 6 to 17 received breakfast, lunch or snacks at school (n=79) 76
Table 7. Country food access among Inuit households, Kugaaruk, 2001
Percent households with access to country food most of the time (n=90) 96
Reasons why households are unable to get country food (n=65)
Number %
No transportation 6 9
No hunter or fisherman in household 2 3
Hunter or fisher in family is sick/injured 4 6 Hunter or fisher is working 10 15
Gas too expensive 60 92
Repairs too expensive 57 88
Country food not available 1 2
Food not shared in community 0 0
No place to store country food 4 6
No hunting or fishing equipment 4 6
Other 5 8
Total 153
Note: Households could provide up to 3 reasons.

Nutrition and Food Security in Kugaaruk, Nunavut
26
Food Security and Socio-economic Group
Table 8 shows the breakdown of Inuit families on the basis of socio-economic group.
Table 8. Distribution of respondents by socio-economic group, Inuithouseholds, Kugaaruk, 2001
% n
Received social assistance in past month 35 31
Working poor 1 49 45
Relatively well-off 12 11
Income unknown 5 5
Total 100 92
1 Working poor families: not on social assistance and family sizes 1, 2, or 3 with monthly income <$1500;
family size 4 or 5 with monthly income <$2000; and family size 6+ with monthly income <$3000.
The LICOs are used by Statistics Canada to identify Canadians in “straightenedeconomic circumstances” 20. Strictly speaking, these LICOs are not applicable to Inuitliving in the North. They do not take into account the very high price of commercial foodand other goods in the North, nor do they consider the very high cost of housing ifpurchased at market rates. On the other hand, the LICOs do not consider the fact thatmany individuals in the North have their housing costs subsidized, nor the fact that mostfamilies have access to country food. The rural LICOs are used here as a convenientway of producing two income groups of reasonable size. Raising the income level usedto determine the “relatively well-off” would reduce the already small size of this group.
As illustrated in Figure 3, over half of adults in Inuit families on social assistance or inworking poor families were classed as “food insecure with hunger,” with the bulk of theremaining families being “food insecure without hunger.” While adults in families thatwere relatively well-off were somewhat more likely to be food secure (p=.015 for theFisher Exact Test of “social assistance” and “working poor” combined vs “relatively well-off”), even here, less than half the adults were food secure. It is important to keep inmind that the US Food Security Survey Module measures the extent and severity offood insecurity during any time over the past 12 months, whereas the reported incomewas based on the previous month.

Nutrition and Food Security in Kugaaruk, Nunavut
27
Figure 3 Adult food security by socio-economic group, Inuit households, Kugaaruk,2001
Figure 4 Children’s food security by socio-economic group, Inuit households,Kugaaruk, 2001
Figure 4 shows that the results were similar for children. Again the relatively well-offwere more food secure (p=.014), but all groups had major food insecurity problems.

Nutrition and Food Security in Kugaaruk, Nunavut
28
Figure 5 Degree of concern over social issues, Inuit households, Kugaaruk, 2001
Social Issues of Concern
When asked about the degree of concern over six social issues, the two issues ofgreatest concern were the lack of jobs (80% “extremely concerned”) and not havingenough money for food (45% “extremely concerned”). About one quarter of Inuithouseholds were extremely concerned about alcohol and drug abuse and familyviolence (Figure 5). For all of these issues, the percentage who were “extremelyconcerned” was slightly higher in Kugaaruk in 2001 than in Pond Inlet or Repulse Bay in1997 2. The relative importance of not having enough money for food vis-à-vis otherissues adds further credence to the results on the food security questionnaire.

Nutrition and Food Security in Kugaaruk, Nunavut
29
Figure 6 Percent of households rating foods poor or fair, Kugaaruk, 2001
Food Purchasing Practices
Source of food purchases
Almost all Inuit households purchased their food entirely from the Co-op, whereas mostnon-Inuit households purchased meat, frozen food and milk privately from Yellowknifeby Food Mail. Fruit and vegetables were purchased from the Co-op and by Food Mailby non-Inuit households. One half of Inuit households and one third of non-Inuitreported purchasing country food from the Co-op.
Perceptions about quality, variety and cost
Poor quality of fresh fruits and vegetables and fresh milk is clearly a problem inKugaaruk (Table 9, Figure 6). Sixty to 65% of households rated the quality of apples,oranges, bananas and grapes, and lettuce, tomatoes and peppers as poor or fair.
As Table 9 indicates, two thirds of households considered the variety only “sometimes”adequate, and another 10% considered variety was “never” adequate. Three quartersof households found the price of fresh fruit and vegetables higher than last year.
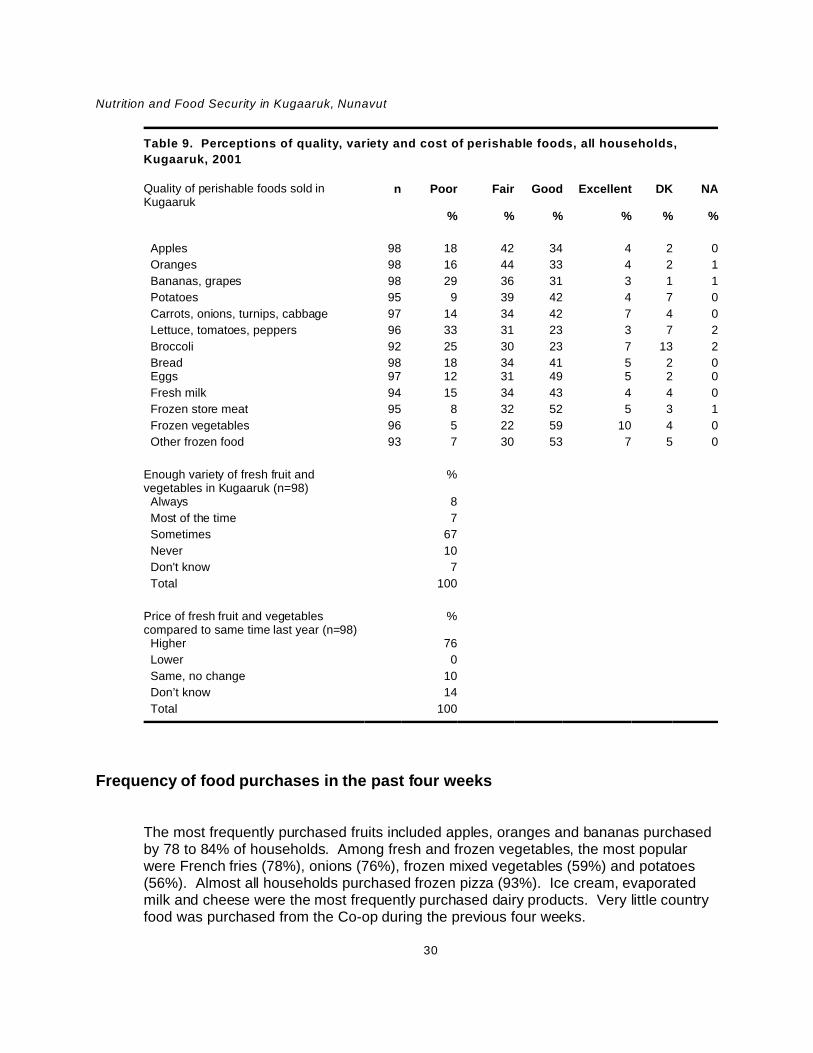
Nutrition and Food Security in Kugaaruk, Nunavut
30
Table 9. Perceptions of quality, variety and cost of perishable foods, all households,
Kugaaruk, 2001
Quality of perishable foods sold inKugaaruk
n Poor Fair Good Excellent DK NA
% % % % % %
Apples 98 18 42 34 4 2 0
Oranges 98 16 44 33 4 2 1
Bananas, grapes 98 29 36 31 3 1 1
Potatoes 95 9 39 42 4 7 0
Carrots, onions, turnips, cabbage 97 14 34 42 7 4 0
Lettuce, tomatoes, peppers 96 33 31 23 3 7 2
Broccoli 92 25 30 23 7 13 2
Bread 98 18 34 41 5 2 0 Eggs 97 12 31 49 5 2 0
Fresh milk 94 15 34 43 4 4 0
Frozen store meat 95 8 32 52 5 3 1
Frozen vegetables 96 5 22 59 10 4 0
Other frozen food 93 7 30 53 7 5 0
Enough variety of fresh fruit andvegetables in Kugaaruk (n=98)
%
Always 8
Most of the time 7
Sometimes 67
Never 10
Don't know 7
Total 100
Price of fresh fruit and vegetablescompared to same time last year (n=98)
%
Higher 76
Lower 0
Same, no change 10
Don’t know 14
Total 100
Frequency of food purchases in the past four weeks
The most frequently purchased fruits included apples, oranges and bananas purchasedby 78 to 84% of households. Among fresh and frozen vegetables, the most popularwere French fries (78%), onions (76%), frozen mixed vegetables (59%) and potatoes(56%). Almost all households purchased frozen pizza (93%). Ice cream, evaporatedmilk and cheese were the most frequently purchased dairy products. Very little countryfood was purchased from the Co-op during the previous four weeks.

Nutrition and Food Security in Kugaaruk, Nunavut
31
Figure 7 Reasons for not buying more fresh fruit and vegetables, Inuit households,Kugaaruk, 2001
Approximately one third of Inuit households purchased less than 6 kinds of fruit andvegetables, and 54% purchased between 6 and 10 fruit and vegetables in the past fourweeks (Table 10). This pattern was very different from the non-Inuit, 50% of whompurchased more than 10 fruits and vegetables over the same period.
Table 10. Percent of households who purchased fresh fruits and
vegetables in the past four weeks
Inuit (n=92) Non-Inuit (n=6) % %
Less than 3 fresh fruits and vegetables 5 17Less than 6 fruits and vegetables 35 33Six to 10 fruits and vegetables 54 17
More than 10 fruits and vegetables 11 50
For Inuit households, the most important barriers to buying fruits and vegetables were:cost (89%); poor quality and availability (64%); and not enough variety (53%) (Figure 7). Very few respondents cited a greater preference for canned or frozen products, a dislikeof the taste, a belief that these foods were unnecessary to good health, or a lack ofknowledge regarding the preparation of these foods.

Nutrition and Food Security in Kugaaruk, Nunavut
32
Nutrition Survey Results
Respondent Profiles
Ninety-three women aged 15 to 44 participated in the nutrition survey, 87 of whom wereInuit with an average age of 26. Eight women (8% of available eligible women) refusedto participate, and seven were unavailable. Ten Inuit women were pregnant and 18breastfeeding at the time of the survey. The distribution of ages among non-pregnant,non-lactating women were as follows: 15 to 18, 21%; 19 to 30, 36%; and 31 to 44, 43%.The mean and median age for this group was 27 and 28, respectively. The mean andmedian age of lactating women was 26 years, and the age groups were as follows: 15 to18, 6%; 19 to 30, 72%; and 31 to 44, 22%.
Food Frequency Questionnaire
According to the food frequency questionnaire, the most frequently consumed countryfoods in the previous month were, in descending order of importance, Arctic char,caribou, muktuk, whitefish and polar bear (Figure 8).
Among Inuit women, the most frequently consumed store foods, in descending order ofimportance, were pop, coffee, tea, Tang, white bread, chocolate bars, Kool-Aid, potatochips, oranges, eggs, frozen pizza and onions (Figure 9). Fresh or boxed milk andyogurt were reported only twice in the past month, processed cheese slices and cheesespread only four times, and block cheese, three times.

Nutrition and Food Security in Kugaaruk, Nunavut
33
Figure 8 Average number of times country foods were reported eaten in the pastmonth, Food Frequency Questionnaire, Inuit women, Kugaaruk, 2001
As Figure 10 illustrates, oranges, bananas and apples were the only fruit eaten morethan five times in the past month. The most popular vegetables, in descending order ofimportance, were onions, fresh, frozen or canned corn, frozen French fries and frozenmixed vegetables. The most popular potatoes were French fries, instant mashed andfresh potatoes.

Nutrition and Food Security in Kugaaruk, Nunavut
34
Figure 9 Average number of times store foods were reported consumed in thepast month, Food Frequency Questionnaire, Inuit women, Kugaaruk,2001.
Figure 10 Fruit and vegetables most frequently reported in the past month, FoodFrequency Questionnaire, Inuit women, Kugaaruk, 2001

Nutrition and Food Security in Kugaaruk, Nunavut
35
Food Consumption Patterns (24-hour recall)
Country food
Among Inuit women, the average consumption of country food was 140 grams per day. Country Meat, Birds and Fish accounted for 60% of all Meat, Poultry and Fish. Very fewcountry foods were reported during this period. Arctic char was the most importantcountry food (98 grams), followed by caribou (34 grams), polar bear (4 grams), muktuk(2 grams), whitefish and dried caribou (1 gram each) (Figure 11). (“Other” includeswalrus, seal, and caribou fat.) No liver or other organ meats were reported. Theconsumption of country food was similar to the amount reported in Repulse Bay andless than in Pond Inlet in the 1997 surveys 2.
Country food consumption tended to be higher among women 25 to 44 than amongyounger women. As shown below, there was a significant difference in consumptionbetween these groups (p=.07 for Calories and p=.03 for amount). A similar, butsomewhat stronger positive relationship between consumption of country food and agehas been documented elsewhere 1 47.
Dependent Variable Age Group Mean intake p value
Calories 15 to 24 131 .07
25 to 44 237
Amount (g) 15 to 24 81 .03
25 to 44 169

Nutrition and Food Security in Kugaaruk, Nunavut
36
Figure 11 Average consumption (grams) of country foods, 24-hour recall, Inuitwomen, Kugaaruk, 2001
Store foods
Dairy Products
Only 30 grams of Dairy Products were consumed, representing less than one fifth of aserving (Table 11). Whole undiluted evaporated milk accounted for 60% by weight ofthis food group. Virtually no fluid milk was consumed. However, almost no fresh orUHT milk was available in the store throughout the survey period.

Nutrition and Food Security in Kugaaruk, Nunavut
37
Table 11. Mean daily amounts of Dairy Products consumed by Inuit women: 24-hour recall,
Kugaaruk, 2001
Food Mail Category Food Amount (grams)
Nutritious Perishable Ice cream 7Cheese, processed spread, cheddar 1
Non-perishable Milk, evaporated, whole, canned 18Priority Perishable Cheese, processed, cheddar 2
Cheese, Parmesan, grated 1Milk, fluid, 2% 1
Total (all Dairy Products) 30Note: Includes foods with an average consumption of 1 gram or more.
Store Meat, Poultry and Fish
According to the 24-hour recall, store Meat, Poultry and Fish was less important thancountry food (92 grams versus 140 grams) (Table 12). One third of store Meat, Poultryand Fish was frozen, breaded, fried chicken, while ground beef accounted for about onequarter, and spareribs, wieners and canned luncheon meat a similar amount in total.
Table 12. Mean daily amounts of store Meat, Poultry and Fish consumed by Inuit women:
24-hour recall, Kugaaruk, 2001
Food Mail Category Food Amount (grams)
Nutritious Perishable Beef, ground 26Spareribs 11Wieners 7Chicken 4
Non-perishable Luncheon meat, pork, canned 8Convenience Perishable Breaded fried chicken 31
Total (all store Meat, Poultry and Fish) 92Note: Includes foods with an average consumption of more than 1 gram.
Cereal Products
This group includes all pasta except pasta and cheese dinners (e.g., Kraft Dinner),which are included with Miscellaneous foods. The most important cereal products wereinstant rice, white bread and flour (Table 13). No whole grain products were reported. Neither ready-to-eat nor cooked breakfast cereals were important foods.
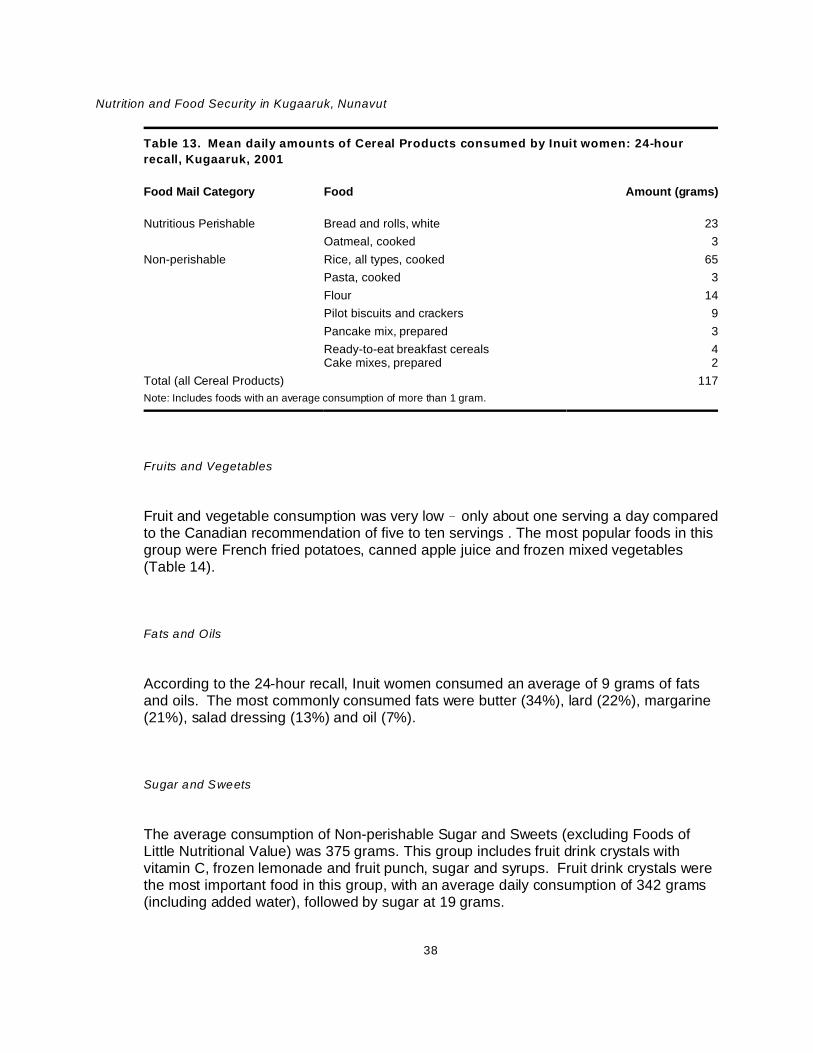
Nutrition and Food Security in Kugaaruk, Nunavut
38
Table 13. Mean daily amounts of Cereal Products consumed by Inuit women: 24-hour
recall, Kugaaruk, 2001
Food Mail Category Food Amount (grams)
Nutritious Perishable Bread and rolls, white 23
Oatmeal, cooked 3
Non-perishable Rice, all types, cooked 65
Pasta, cooked 3
Flour 14
Pilot biscuits and crackers 9
Pancake mix, prepared 3
Ready-to-eat breakfast cereals 4Cake mixes, prepared 2
Total (all Cereal Products) 117
Note: Includes foods with an average consumption of more than 1 gram.
Fruits and Vegetables
Fruit and vegetable consumption was very low ! only about one serving a day comparedto the Canadian recommendation of five to ten servings . The most popular foods in thisgroup were French fried potatoes, canned apple juice and frozen mixed vegetables(Table 14).
Fats and Oils
According to the 24-hour recall, Inuit women consumed an average of 9 grams of fatsand oils. The most commonly consumed fats were butter (34%), lard (22%), margarine(21%), salad dressing (13%) and oil (7%).
Sugar and Sweets
The average consumption of Non-perishable Sugar and Sweets (excluding Foods ofLittle Nutritional Value) was 375 grams. This group includes fruit drink crystals withvitamin C, frozen lemonade and fruit punch, sugar and syrups. Fruit drink crystals werethe most important food in this group, with an average daily consumption of 342 grams(including added water), followed by sugar at 19 grams.

Nutrition and Food Security in Kugaaruk, Nunavut
39
Table 14. Mean daily amounts of Fruits and Vegetables consumed by Inuit women:
24-hour recall, Kugaaruk, 2001
Food Group Food Mail Category Food Amount(grams)
Citrus and Tomatoes Non-perishable Apple juice, canned or bottled, vitamin C 15Tomato sauce, canned 3
Priority Perishable Oranges 9Other Fruit Non-Perishable Grape juice, canned/bottled 6
Peaches, canned 5Priority Perishable Apples 3
Blueberries, frozen 2Peaches, raw 1
Potatoes Nutritious Perishable Potato, French-fried and hash brown, frozen 56Non-perishable Potatoes, instant mashed 2Priority Perishable Potatoes, fresh 4
Other Vegetables Non-perishable Corn niblets, canned 1Priority Perishable Mixed vegetables, frozen 12
Onions 6
Corn, frozen 2Lettuce, iceberg 1
Total (all Fruits and Vegetables) 132
Note: Includes foods with an average consumption of 1 gram or more.
Miscellaneous Foods
This group includes Nutritious Perishable foods such as pizza, Non-perishable foods liketea, coffee, baking powder, macaroni and cheese dinner, canned beef stew, cannedpasta dishes, canned soup and soup mix, and Convenience Perishables such aspackaged sandwiches and burgers. Municipal water, including the water used in coffee,tea and soup, is also included in this group. An average of 1137 grams were reported,92% of which was Non-perishable food (Table 15).
Foods of Little Nutritional Value
A total of 665 grams of Foods of Little Nutritional Value were consumed per day (Table16). This included an average of approximately one and a half cans of pop and half aglass of reconstituted fruit drink crystals without vitamin C. Consumption of potato chipswas much lower than in other communities. However, potato chips were unavailablelocally at the time of the survey.

Nutrition and Food Security in Kugaaruk, Nunavut
40
Table 15. Mean daily amounts of Miscellaneous Foods consumed by Inuit women: 24-hour
recall, Kugaaruk, 2001
Food Mail Category Food Amount (grams)
Nutritious Perishable Frozen pizza 51Frozen dinners 7
Non-Perishable Coffee, brewed 437
Tea, brewed 339
Water, municipal 82
Macaroni and cheese dinner, prepared 28
Dry soup mix, added to recipes 4
Soup mix, prepared 77
Soup, canned, prepared 2
Mixed dishes, beef stew, canned 7
Canned spaghetti sauce with meat 4
Mixed dishes, Hamburger Helper 3
Canned pasta 12
Convenience Perishables Packaged sandwiches and burgers 36Total (all Miscellaneous foods) 1137Note: Includes foods with an average consumption of more than 1 gram.
Table 16. Mean daily amounts of Foods of Little Nutritional
Value consumed by Inuit women: 24-hour recall, Kugaaruk, 2001
Food Amount(grams)
Cookies 1
Potato chips 3
Fruit drink crystals, no vitamin C, with water 124
Soft drinks 513
Candies 6
Coffee whitener (non-dairy), powdered 4Chocolate bars 14
Total (all Foods of Little Nutritional Value) 665Note: Includes all foods of 1 gram or more.

Nutrition and Food Security in Kugaaruk, Nunavut
41
Food Preparation Methods
Three quarters of Inuit women reported butter as their usual spread for bannock orbread. Canned evaporated milk was the milk most commonly used on cereal and inmashed potatoes. In coffee and tea, the majority used coffee whitener rather than milk. About half of respondents used water rather than milk in bannock and macaroni andcheese dinner. Diluted evaporated milk was used in bannock by 40% of respondentsand by 36% in macaroni and cheese dinner. Almost all respondents used lard toprepare bannock. The average proportion of flour to lard (by weight) used to preparebaked bannock was 8.4 to 1.
Health and Lifestyle of Women
Self-rated health status
Most women rated their health as good. Twenty-five percent of Inuit women rated theirhealth fair or poor, similar to other INAC surveys among Inuit women in Pond Inlet andRepulse Bay (Figure 12) 2. By comparison, only 6.9% of Canadian women aged 15 to44 years of age rated their health at this level in 2000-2001 48. Six percent reportedmedical conditions that affected their diet.
Smoking
As in other nutrition surveys among Inuit women, smoking rates were extremely high(Table 17). Ninety-three percent of all women and 100% of pregnant women smoked(Figure 13). On average, women started smoking at 14 years of age. Most smokedevery day, smoking an average of 9 cigarettes per day (all women) and 7 per day(pregnant women).
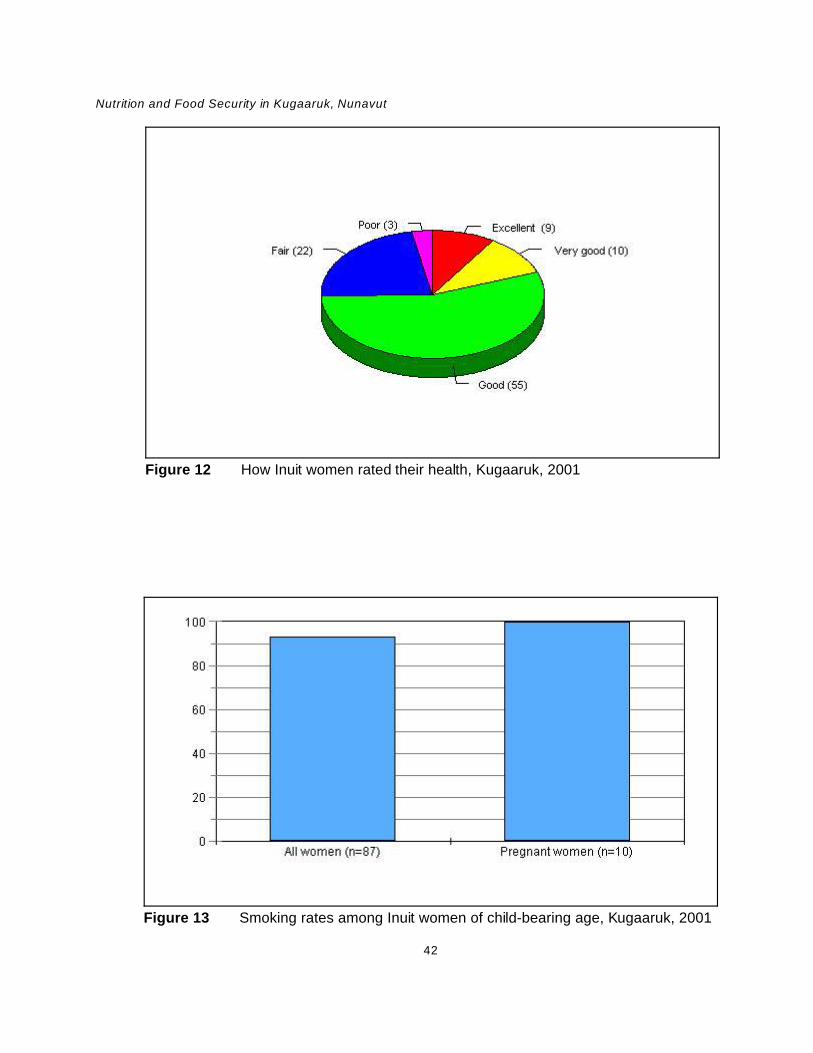
Nutrition and Food Security in Kugaaruk, Nunavut
42
Figure 12 How Inuit women rated their health, Kugaaruk, 2001
Figure 13 Smoking rates among Inuit women of child-bearing age, Kugaaruk, 2001

Nutrition and Food Security in Kugaaruk, Nunavut
43
Table 17. Smoking, Inuit wom en, Kugaaruk, 2001
Smoking rate among Inuit women % All women (n=87) 93 Pregnant women (n=10) 100
Average age Inuit women started smoking (n=84) 14
Frequency of smoking among Inuit women smokers (n=81) % Every day 95 Occasionally 5 Total 100
Average number of cigarettes per day (Inuit women)
All women 9 Pregnant women 7
Weight-related health risks
The BMI includes both height and weight and is used to provide an estimate of body fat. It is an indicator of health problems associated with underweight, overweight andobesity. There is a continuous relationship between BMI and the risk of illness anddeath 49.
In Canada obesity has been increasing among adults in the general population over thepast two decades 50 51 52. This condition is also prevalent among Inuit 1 53. According tothe Canadian Guidelines for Body Weight Classification, the classification systemestablished for Canadians in general applies to Inuit populations 49. However, it isimportant to note that little research has been done to establish the health risksassociated with body weight and body fat distribution among Inuit and that someracial/ethnic groups may be more susceptible to health problems associated with obesitythan others.
Weights and heights were available for a total of 76 non-pregnant Inuit women. Everyeffort was made to convince the participants to have their weight and heightmeasurements recorded at the clinic. However, due to very poor weather conditions, alack of babysitters and a general reluctance among participants to be weighed, we wereonly able to do clinic measurements for 18 women. Many of the women were familiarwith their weight. As a measure of overweight in a population, self-reported weights and

Nutrition and Food Security in Kugaaruk, Nunavut
44
Figure 14 Percent of non-pregnant Inuit women by BMI category, Kugaaruk, 2001
heights are considered appropriate for adults up to 60 years of age 54. Most studieshave found that self-reported weights tend to underestimate actual weight andoverestimate height, and this is especially true among overweight women 55 56 57. Thisissue has only been examined for the Inuit population by Kuhnlein et al. They found nostatistically significant differences between self-reported weight and measured weightfor the same group of individuals 3. However, the distribution of weights and heights ofthose who refused to provide these measurements by one method or the other maydiffer from the distribution of reported measurements.
Only 35% of non-pregnant Inuit women had a BMI between 18.5 and 24.9, which isconsidered the healthy range (Figure 14). Sixty-one percent had a BMI of 25 or more, alevel considered to increase the risk of certain chronic diseases, including heart disease,hypertension, type 2 diabetes, insulin resistance, osteoarthritis, some types of cancerand gallbladder disease, 8% had a BMI of 30.0 to 34.9 (high risk), 13% a BMI of 35.0 to39.9 (very high risk) and 12% were at extremely high risk with a BMI over 40 49.
Until recently, the waist/hip ratio (WHR) was thought to be of greater significance to therisk for heart disease and diabetes than the BMI, the risk increasing at a WHR of 0.88 ormore for women. A high WHR ratio may be related to the “thrifty gene” concept which

Nutrition and Food Security in Kugaaruk, Nunavut
45
suggests that people coming from a harsh environment, where food supplies are oftenscarce, develop an ability to store fat more efficiently. This promotes weight gain andpredisposes an individual to insulin resistance. The WHR ratio is strongly correlatedwith the presence of insulin resistance, and is considered one of the components of themetabolic syndrome (high levels of triglycerides, low density lipoprotein-apoprotein Band uric acid and/or microalbuminuria) so prominent in Type 2 diabetes and incardiovascular disease 58 59. Unfortunately, only 43 non-pregnant women had waist-hipmeasurements taken, so the sample may not be representative. Of these, 49% had aWHR of 0.88 or more.
Waist circumference (WC) is now replacing the WHR as a an indicator of increasedhealth risk associated with obesity 49. The WC is considered by the World HealthOrganization (WHO) to be a more practical measure of abdominal fat, which includesunder-skin fat and visceral fat (fat around internal organs), is more closely related tohealth risk than the WHR and is recommended as an adjunct to the BMI for assessinghealth risks for those with a BMI in the 18.5 to 34.9 range 60. A large amount of visceralfat is associated with insulin resistance, hyperinsulinemia, glucose intolerance andhyperlipidemia, all of which are risk factors for type 2 diabetes and cardiovasculardisease 60 61 62 63. In women, a WC of 80 cm or more is associated with an increasedrisk for Type 2 diabetes and cardiovascular disease. A WC of 88 cm or more isassociated with a substantially increased risk of these diseases 64 65. In this study, only31 women with a BMI under 35 agreed to a waist circumference measurement. Eighteen percent of these had a WC of 88 cm or more, placing them at substantiallyincreased risk of obesity-related diseases.
Activity level
In response to the question on general activity levels, 14% of Inuit women weresedentary, 43% were engaged in light activity, 23% were moderately active and 20%very active. Most women spent less than one month on the land in the past year.

Nutrition and Food Security in Kugaaruk, Nunavut
46
Energy and Macronutrient Intake
Energy
Estimating energy requirements is a complex task, since requirements are influenced bya number of factors, including age, sex and activity level. The best way to estimateenergy requirements is to consider the BMI in relation to age and sex plus activity level. The questions used in this survey to assess physical activity were very general, and didnot provide a precise description of activity patterns. More detailed questions areavailable based on the number of minutes per day spent on different activities. However, these activities are ones commonly engaged in by southern Canadians anddo not include common activities of the Inuit (e.g., hunting, fishing, snowmobiling,picking berries, etc.). Energy requirements are believed to increase by 5% in coldclimates, and there can be an additional energy cost (2 to 5%) due to the increasedweight of clothing, especially in active individuals 66 67.
Table 18 presents means and medians for energy and macronutrient intake for twogroups: women who were not pregnant or lactating, and lactating women. Mean energyintake was 1983 Calories for women who were not pregnant or lactating, and 2034 forlactating women. Energy intake was positively related to BMI, but this trend was notstatistically significant (p=0.2). Caloric intake decreased with age (p<0.01) and BMItended to increase with age (p=.07). A higher BMI in spite of reduced caloric intake maybe evidence of under-reporting, although it may also indicate that the reduction in caloricintake among older women has not kept pace with the reductions in energyrequirements or activity level.
Mean energy intakes from food groups are shown in Table 19. Meat, Poultry and Fishprovided 23% of energy, only 43% of which came from country food. Frozen friedbreaded chicken accounted for 18% of the energy contribution of this group. Foods ofLittle Nutritional Value (mainly pop and fruit drink crystals without vitamin C) were alsoan important source of energy (19%). Dairy Products, Fruit and Vegetables, Eggs andAlternates contributed a total of 12% of energy, compared to 28% from Sugar andSweets.

Nutrition and Food Security in Kugaaruk, Nunavut
47
Table 18. Mean and median energy and macronutrient intake, Inuit women, 15 to
44, Kugaaruk, 2001
Not pregnant or
lactating (n=62)
Lactating (n=18)
Mean Median Mean Median
Calories 1983 1908 2034 2175
Protein (g) 84 70 93 89
Carbohydrate (g) 269 260 260 233
Fat (g) 64 56 69 61
Trans Fatty Acids (g) 1.2 0.3 0.7 0.1
Saturated Fatty Acids (g) 23.5 21.1 22.9 22.4
Polyunsaturated Fatty Acids (g) 9.1 7.6 11.5 9.6
Cholesterol (mg) 228 177 300 202
Total sugars (g) 135 124 121 122
Dietary fibre (g) 7.9 6.4 7.3 6.7
Alcohol (g) 0 0 0 0
Caffeine (mg) 421 251 283 188
% energy distribution
Protein 17 18
Carbohydrate 54 51
Fat 29 31
Saturated fat 10.7 10.1

Nutrition and Food Security in Kugaaruk, Nunavut
48
Table 19. Mean energy intake (Calories) from food groups and Food Mail categories, Inuit
wom en, Kugaaruk, 2001
Food group Food Mail category Mean % of total
Dairy Products Priority Perishable 13 0.6
Nutritious Perishable 23 1.1Non-perishable 25 1.2
Eggs Priority Perishable 14 0.7
Meat, Poultry, Fish Nutritious Perishable 151 7.4Non-perishable 30 1.5
Country 201 9.9
Convenience Perishable 86 4.2
Alternates Nutritious Perishable 16 0.8
Cereal Products Nutritious Perishable 65 3.2Non-perishable 207 10.1
Fruits, Vegetables Priority Perishable 23 1.1Nutritious Perishable 113 5.5Non-perishable 20 1.0
Fats, Oils Nutritious Perishable 42 2.1Non-perishable 24 1.2
Country 0.5 0.02
Sugar, Sweets Non-perishable 214 10.5
Miscellaneous Nutritious Perishable 148 7.2Non-perishable 153 7.5
Convenience Perishable 85 4.2
Foods of Little Nutritional Value 387 18.9 Cereal Products 7 0.3
Potato chips 16 0.8
Sweets 362 17.7
Miscellaneous 1 0.05
Total 2040 100.0

Nutrition and Food Security in Kugaaruk, Nunavut
49
Figure 15 Percentage of energy from protein, fat, and carbohydrate, Inuit women(not pregnant or lactating), Kugaaruk, 2001
Sources of energy
For women who were not pregnant or lactating, protein and carbohydrate accounted for17% and 54% of energy, respectively (Figure 15, Table 18). The percentage ofcarbohydrate was well within nutrition guidelines (45 to 65%). Fat provided 29% ofenergy, which is also within current nutrition guidelines (20 to 35% of energy), butsaturated fat provided 10.7% of energy intake, higher than the generally recommendedlimit (8 to 10% of calories). Mean intake of trans fatty acids was 1.2 grams. However,since trans fatty acid data in the CNF are missing for a number of foods, includingFrench fried potatoes, potato chips, crackers and cookies, actual intake would be muchhigher than this amount. French fries are estimated to contain between 1.72 and 3.38grams of trans fatty acids per 100 grams 68. If these values were included, the meantrans fatty acid intake would be between 2.2 grams and 3.1 g per day. Trans fatty acidintake is positively associated with blood total and low density lipoprotein (LDL)cholesterol concentration, and therefore with a higher risk of cardiovascular disease 69. Some investigators have found trans fatty acids associated with a higher risk of Type 2diabetes 70. Median intakes of cholesterol were within the recommended range of 300mg/d or less.
Among lactating women, protein, carbohydrate and fat accounted for 18%, 51% and31% of energy, respectively, and saturated fat accounted for 10.1% of energy.

Nutrition and Food Security in Kugaaruk, Nunavut
50
Protein, fat and carbohydrate
For women who were not pregnant or lactating, mean intake of protein, carbohydrateand fat was 84 grams, 269 grams and 64 grams, respectively (Table 18). Meansaturated fat intake was 23.5 grams. Protein intake was lower and carbohydrate intakehigher than in all previous INAC surveys of Inuit women in this age group 1. Forlactating women, mean intake of protein, carbohydrate and fat was 93 grams, 260grams and 69 grams, respectively.
Individuals who are genetically susceptible to obesity are more likely to gain weight on ahigh-fat diet than those who lack these genes. High intakes of saturated fat, trans fattyacids and cholesterol increase blood total and LDL cholesterol concentrations and,therefore, the risk of cardiovascular disease. There is some evidence that individualswith a high WHR may respond differently to high-fat diets than those with a normalWHR, depositing more fat in the abdominal area 71.
In animal studies, a high-fat (mostly saturated), refined-carbohydrate (sucrose) diettends to favour obesity and an increase in plasma total cholesterol, LDL cholesterol andtriglycerides, while a low-fat, complex carbohydrate diet does the reverse 72 73. TheAcceptable Macronutrient Distribution Ranges for fat are based on evidence indicating arisk for cardiovascular disease with low intakes of fat and high intakes of carbohydrate,and the evidence for increased risk of obesity and obesity-related diseases with highintakes of fat 69. Traditional Inuit diets were very high in protein, and although they mayhave been just as high in fat as current levels, it is believed that the traditional high-protein and low-carbohydrate intake would favour low levels of LDL cholesterol. The fatconsumed in the traditional diet would have contained a higher percentage of omega-3fatty acids, and less saturated fat than is the case today. There is growing evidencethat omega-3 fats may provide some protection against cardiovascular disease. Thetraditional lifestyle, which relied heavily on marine mammals to provide an abundantsupply of antioxidants such as vitamin A, vitamin E and selenium, together with a moreactive lifestyle, less stress, less smoking, and a lower salt intake, may have actedtogether to protect against heart disease and diabetes 74.

Nutrition and Food Security in Kugaaruk, Nunavut
51
Sources of fat and saturated fat
The major food sources of fat, in descending order of importance, were store meats(27%), pizza, country food (9%), Foods of Little Nutritional Value, packaged sandwichesand burgers, margarine and butter, and frozen French fried potatoes (Table 20). Saturated fat came mainly from store meat (26%), Foods of Little Nutritional Value(chocolate bars and coffee whitener), pizza, country food (8%), butter and margarineand canned stew.
Table 20. Mean fat and saturated fat intake (grams per day) from major sources, Inuit
wom en, Kugaaruk, 2001
Food group Food Mail category Fat Saturated fat Mean % of total Mean % of total
Dairy Products Priority Perishable 1 1 0.6 3Perishable 1 2 0.7 3
Non-perishable 1 2 0.9 4
Meat, Poultry, Fish Nutritious Perishable 11 16 4.1 17
Non-perishable 2 4 0.9 4
Country 6 9 2.0 8
Convenience Perishable 5 7 1.3 5
Fruits, Vegetables Priority Perishable 1 1 0.0 0.03
Perishable 4 6 0.8 3
Fats, Oils Nutritious Perishable 5 7 1.8 8
Non-perishable 3 4 0.9 4Country 0.1 0.1 0.0 0.1
Miscellaneous Nutritious Perishable 8 11 2.5 11
Non-perishable 4 6 1.6 7
Convenience Perishable 5 8 1.7 7
Foods of Little Nutritional Value 6 9 3.3 14
Total (all sources) 67 23.9

Nutrition and Food Security in Kugaaruk, Nunavut
52
Fibre
As in other surveys of Inuit women, median total dietary fibre intake was only about onethird of that recommended for good health 75. This is not surprising, given the lowconsumption of whole grains, fruits and vegetables. A recent study on the effect of dieton cardiovascular disease, by the Children’s Hospital of Boston, Mass., followed 2909adolescents over a ten-year period. They found that fibre consumption was a strongerpredictor of insulin levels, weight gain and other cardiovascular risk factors than total fator saturated fat consumption. They concluded that high-fibre diets may protect againstobesity and cardiovascular disease by lowering insulin levels 76. After reviewing theevidence of the protective effect of fibre against cardiovascular disease, the DRICommittee concluded that the data are strong enough to make a recommendation forfibre intake and to support the claim that an increased fibre intake appears to benefitboth men and women in this respect. The data suggest that an intake of 14 grams per1000 Calories per day, particularly from cereals, will promote heart health 69.
Caffeine
Mean caffeine intake was 421 mg for non-pregnant, non-lactating women (withinCanadian health guidelines for adults but higher than maximum levels of 300 mg perday recommended for women who are planning to become pregnant) and 283 mg forlactating women 77.
Vitamins
Adjusted mean and median vitamin intakes and the percentage of women with intakesbelow the EAR are presented in Table 21. Data were not analysed for pregnant womendue to the small sample size. Since the median age was 27 for women who were notpregnant or lactating, and 26 for the lactating group, we used the EARs/AIs for women19 to 30 for both groups. The EARs for lactation were based on the requirements forthe first six months. Median intakes, as well as the percentage below the EAR, aremissing for some nutrients because the Iowa State University program was unable tofind a transformation to produce a normal distribution for these nutrients.

Nutrition and Food Security in Kugaaruk, Nunavut
53
Table 21. Adjusted mean and median vitamin intake of Inuit women, 15 to 44, and percent
with inadequate intake, Kugaaruk, 2001
Not pregnant or lactating (n=62)
Mean Median EAR % <EAR
Vitamin A RE 335 323
Vitamin C (Smokers) mg 128 85 95 54
Vitamin C (Non-smokers) mg 128 85 60 38
Thiamin mg 1.36 1.30 0.9 12
Riboflavin mg 1.47 1.41 0.9 6
Niacin NE 36 33 11 0
Vitamin B6 mg 1.09 1.04 1.1 57
Dietary Folate Equivalents mcg 288 282 320 68
Vitamin B12 mcg 10.0 8.7 2 2
Lactating (n=18)
Mean Median EAR % <EAR
Vitamin A RE 251 231
Vitamin C (Smokers) mg 120 103 135 67
Vitamin C (Non-smokers) mg 120 103 100 48
Thiamin mg 1.51 1.44 1.2 28
Riboflavin mg 1.35 1.33 1.3 45
Niacin NE 32 32 13 0
Vitamin B6 mg 1.04 1.04 1.7 100
Dietary Folate Equivalents mcg 417 375 450 63
Vitamin B12 mcg 4.0 – 2.4 –
Note: The EAR represents the average daily nutrient intake level estimated to meet the requirements of half the healthyindividuals in a particular life stage and gender group. The proportion with an intake below the EAR is considered to havea usual inadequate intake.
Dashes (“–“) indicate that the character of the data was such that the C-SIDE software was unable to calculate a medianor the percentage of the population with an intake below the EAR.

Nutrition and Food Security in Kugaaruk, Nunavut
54
Vitamin A
Among women who were not pregnant or lactating, mean and median intakes of vitaminA were 335 RE and 323 RE, respectively. Mean intake was lower than that found inRepulse Bay (441 RE) and Pond Inlet (659) in 1997 1. Among lactating women, meanvitamin A intake was only 251 RE (Table 21).
The EAR for vitamin A is now expressed in Retinol Activity Equivalents rather thanRetinol Equivalents. This new measure reflects changes to the conversion factors forcarotenoids based on the most recent research 78. Unfortunately, nutrient data for theRetinol Activity Equivalent of foods are not yet available, so that it was not possible toassess the probability of inadequacy of vitamin A.
Vitamin A is important for normal vision, gene expression and embryonic developmentand normal immune function. An inadequate intake may result in night blindness,embryonic lung defects, impaired T-cell function and a higher risk of respiratoryinfections and diarrhea. Vitamin A also interacts with other nutrients including iron. Anumber of studies suggest that vitamin A deficiency impairs haemoglobin formation andtherefore vitamin A supplementation in combination with iron may be more effective thaniron alone in the treatment of anaemia 79.
Preformed vitamin A is obtained from animal foods. It can also be manufactured in thebody from provitamin A carotenoids found in dark green or orange fruits and vegetables. The most important traditional Inuit sources of vitamin A (retinol) are seal liver and eyes,narwhal blubber and polar bear fat ! foods that were not reported on the 24-hour recall. Store foods rich in vitamin A include beef or pork liver, carrots, squash, frozen mixedvegetables, tomato sauce, cheddar cheese, eggs and margarine. In this survey, themajor sources of vitamin A were country food (mainly Arctic char), frozen mixedvegetables, butter and margarine (Table 22). Other traditional foods (e.g., muktuk,marine mammal fat, and liver) that are rich sources of vitamin A were not beingconsumed at the time of the survey. It is possible that vitamin A intake would be higherin other seasons when these foods are more available.

Nutrition and Food Security in Kugaaruk, Nunavut
55
Table 22. Mean vitamin A intake (RE per day) from major sources,
Inuit wom en, Kugaaruk, 2001
Food Mail category/food group RE % of total
Priority Perishables
Dairy Products 8 3
Eggs 16 5
Vegetables 64 20
Nutritious Perishables
Dairy Products 8 3
Fats and Oils 43 13
Miscellaneous 24 7
Non-perishable
Dairy Products 10 3
Miscellaneous 29 9
Country food 75 23
Convenience Perishable
Meat, Poultry, Fish 7 2
Miscellaneous 23 7
Total (all sources) 322
Vitamin B6
Fifty-seven percent of non-pregnant, non-lactating women and 100% of lactating womenhad an inadequate intake of vitamin B6 because of the higher requirement for lactation(Figures 16 and 17, Table 21). By comparison, the Continuing Survey of Food Intake ofIndividuals in the United States (CSFII 1994-1996) found 15% of women aged 19 to 50and 10 to 15% of lactating women had less than the EAR for vitamin B6 26.
Classic symptoms of vitamin B6 deficiency include dermatitis, microcytic anaemia,depression and confusion. Low intakes of vitamin B6 during pregnancy may lead topoor vitamin B6 status in the infant, resulting in convulsions. The EAR for vitamin B6 isderived by using biochemical indicator cutoffs that have not been linked to clinical orphysiological insufficiency. Clinical symptoms of deficiency have only been observed incontrolled studies with very low levels of vitamin B6, and have never been documentedamong non-pregnant women at intakes above 0.5 mg. Depletion-repletion studies of

Nutrition and Food Security in Kugaaruk, Nunavut
56
Figure 16 Percent of Inuit women (not pregnant or lactating) with inadequatevitamin intakes, Kugaaruk, 2001
Figure 17 Percent of lactating Inuit women with inadequate vitamin intakes,Kugaaruk, 2001

Nutrition and Food Security in Kugaaruk, Nunavut
57
healthy women, to determine the intake required to return plasma values to their originalstate, suggest the average requirement of pyridoxine (an indicator of vitamin B6 status)is less than 1.0 mg per day. However, in order to compensate for the bioavailability ofvitamin B6 in food, the EAR for women 19 to 30 is set at 1.1 mg of vitamin B6 per day. Vitamin B6 requirements may possibly be higher for individuals on very-high-proteindiets 80. The EAR for lactation is set at 1.7 mg to ensure sufficient B6 in breast milk.
In the traditional diet, organ meats, dried fish, game and marine mammals, and wildbirds are the best sources of vitamin B6. Among store foods, beef liver, meat, bananasand highly fortified cereals are good sources. The major sources of vitamin B6 inKugaaruk were country food (mainly Arctic char), store meat and French fries (Table23).
Table 23. Mean intake of vitamin B6 (mg per day) from major sources, Inuit women,
Kugaaruk, 2001
Food group Food Mail category mg % of total
Dairy Products Priority Perishable 0.00 0.2
Nutritious Perishable 0.00 0.3
Non-perishable 0.01 0.8
Eggs Priority Perishable 0.01 0.7
Meat, Poultry, Fish Nutritious Perishable 0.13 11.0Non-perishable 0.02 2.0Convenience Perishable 0.08 6.7
Fruit, Vegetables Priority Perishable 0.04 3.1Nutritious Perishable (French fries) 0.17 13.8
Non-perishable 0.03 2.1
Cereal Products Nutritious Perishable 0.01 1.2
Non-perishable 0.06 4.9
Miscellaneous Nutritious Perishable 0.05 3.8
Non-perishable 0.05 4.1
Convenience Perishable 0.04 3.3
Country food 0.47 39.0
Foods of Little Nutritional Value 0.03 2.1
Total (all sources) 1.21

Nutrition and Food Security in Kugaaruk, Nunavut
58
Folate
The DRI Committee examining the requirements for folate recognized that because of limitations in the traditional analytic methods used to estimate the folate content offoods, most nutrient databases underestimate folate intake. Therefore, current folatedata may result in an overestimate of the percentage of the population below theEAR 80. The EAR for folate is expressed as micrograms of Dietary Folate Equivalents(DFEs). This measure acknowledges the greater bioavailability of folic acid added tofoods compared to naturally occurring food folate (1 mcg DFE = 1 mcg of food folateand 1 mcg DFE = 0.6 mcg of folic acid added to foods). In this study, means andmedians have been expressed in DFEs. Folic acid supplementation of flour and pasta isnow mandatory in Canada. The folic acid values in the CNF have now been reducedfrom original estimates based on the assumption that food manufacturers would add themaximum amount of folic acid allowed under the regulations to an estimate using anaverage amount, the approach used by the USDA.
Sixty-eight percent of non-pregnant, non-lactating women and 63% of lactating womenin Kugaaruk had inadequate folate intakes (Figures 16 and 17, Table 21). A low folateintake (320 mcg or less per day) has been associated with elevated plasmahomocysteine levels (greater than 14 :mol/L) 81. When folate supply to the bonemarrow becomes restricted enough to interfere with the formation of red blood cells,macrocytic anaemia may develop. When folate intake is inadequate to support therapid development of new cells in the fetus (especially those of the brain and nervoussystem) during the first few weeks of pregnancy, this may result in neural tube defects,including spina bifida, in the newborn 80. Population-based, case control studies of 468cases with spontaneous abortion and 921 controls found that women with low plasmafolate levels were at increased risk of spontaneous abortion 82. Women who smoke mayalso be at greater risk for folate deficiency and spontaneous miscarriage, especially ifthey carry the mutant gene, methylyenetetrahydrofolate reductase 677IT, which isinvolved in the metabolism of folate 83. This would suggest that women who smokewould benefit from higher doses of folic acid prior to conception.
Traditional sources of folate include liver and other organ meats, seaweed, berries andwild plants. Store foods rich in folate include orange juice, sunflower seeds, fortifiedflour, dark green vegetables, peas and beans.
Cereal Products (mainly pasta, rice and flour) were clearly the most important sourcesof folate (50%) (Table 24). Miscellaneous foods (mainly macaroni and cheese dinner,pizza and tea) contributed 30%. Fruits and vegetables provided only 5%. In thesouthern Canadian diet, fruit, fruit juice and vegetables are also rich sources of folate.

Nutrition and Food Security in Kugaaruk, Nunavut
59
However, these foods have never been important in the Inuit diet. In this study, womenconsumed an average of one serving of fruits and vegetables per day.
Table 24. Mean Dietary Folate Equivalent intake (m cg per day) from major sources, Inuit
wom en, Kugaaruk, 2001
Food group Food Mail category mcg % of total
Dairy Products Priority Perishable 0.3 0.1
Nutritious Perishable 1.0 0.3
Non-perishable 1.4 0.5
Eggs Priority Perishable 5.1 1.7
Fruit, Vegetables Priority Perishable 7.8 2.6Nutritious Perishable (French fries) 6.7 2.2
Non-perishable 1.5 0.5
Cereal Products Nutritious Perishable 30.1 9.9
Non-perishable 120.5 39.9
Miscellaneous Nutritious Perishable 21.2 7.0
Non-perishable 54.4 18.0
Convenience Perishable 15.6 5.1
Country food 15.6 5.0
Foods of Little Nutritional Value 6.2 2.0
Total (all sources) 302
Vitamin C
Smoking depletes vitamin C stores in the body, increasing the EAR by 58%. In thisstudy, we present the EAR for smokers and non-smokers, but since the majority ofwomen, including pregnant and lactating women, were smokers, the EAR for smokers ismore appropriate. Using this standard, approximately 54% of non-pregnant, non-lactating women and two thirds of lactating women had an inadequate intake of vitaminC 84 (Figures 16 and 17, Table 21).

Nutrition and Food Security in Kugaaruk, Nunavut
60
It is important to note that the EAR for vitamin C is considerably higher than thatrequired to prevent vitamin C deficiency, so that the percentage below the EAR does notmean these women were at risk of deficiency. Severe vitamin C deficiency leads toscurvy, a condition caused by a breakdown of connective tissue, characterized byinflamed and bleeding gums and impaired wound healing. Individuals made vitamin Cdeficient, but not scorbutic, showed signs of inflamed gums and fatigue 85 86.
Traditional dietary sources of vitamin C would include raw meat, caribou stomachcontents, seaweed, berries and wild plants. The richest sources of vitamin C amongstore foods include oranges, orange juice, apple juice with added vitamin C, peppersand cabbage.
In Kugaaruk, fruit drink crystals provided 81% of the vitamin C and fruits and vegetablesonly 13%.
Niacin, thiamin, riboflavin and vitamin B12
Among women who were not pregnant or lactating, there was very little or no risk ofinadequate intake of niacin or thiamin (Table 21). However, since the EAR for thiamin ishigher for lactation, 28% of lactating women had an inadequate thiamin intake (Table21, Figure 17).
Thiamin is essential for carbohydrate and protein metabolism. The early signs ofdeficiency include anorexia, weight loss, mental changes such as apathy, decrease inshort-term memory, confusion, irritability, muscle weakness and cardiovascular changessuch as enlarged heart 80.
Caribou, marine mammals, and dried meat would be rich sources of thiamin. The majorstore food sources are fortified or enriched or whole grain products such as bread,grains and ready-to-eat cereals. Ham and pork are also rich sources of thiamin. InKugaaruk, thiamin came mainly from non-perishable cereal products, store meats andpoultry and country food.
Riboflavin intake was adequate for most non-pregnant, non-lactating women but, again,

Nutrition and Food Security in Kugaaruk, Nunavut
61
because of the higher EAR during lactation, 45% of lactating women had an inadequateintake (Figure 17, Table 21). Riboflavin is involved in a number of metabolic reactionsand in energy production. Early signs of deficiency include sore throat, swelling ofthroat and a glossy tongue 80. Again, wild game, marine mammals, fish and liver areexcellent sources of riboflavin. The best store food sources are milk, bread and fortifiedcereals. Country food and non-perishable cereal products were the main sources ofriboflavin.
Only two percent of women had an inadequate intake of vitamin B12 (Table 21). Thisvitamin is essential for normal blood formation and neurological function. A deficiencyresults in pernicious anaemia, with symptoms similar to folate deficiency anaemia. Neurological effects of vitamin B12 deficiency include numbness and tingling ofextremities, especially in the lower limbs, dizziness, loss of concentration, memory loss,disorientation, dementia, visual disturbances, insomnia, impotency and impaired boweland bladder control.
B12 comes mainly from animal foods, especially red meats, shellfish like mussels,clams, oysters and organ meats, milk and yogurt, and fortified cereals. Eighty-threepercent of the vitamin B12 in Kugaaruk came from country food. Other sourcesincluded store meat and poultry and packaged sandwiches and burgers.
Minerals
Adjusted means, medians and the percentage of women who had inadequate intakes ofselected minerals are presented in Table 25.
Among non-pregnant, non-lactating women, intakes of phosphorus, zinc, and copperwere adequate.

Nutrition and Food Security in Kugaaruk, Nunavut
62
Table 25. Adjusted mean and median mineral intake of Inuit women, 15 to 44, and
percent with inadequate intake, Kugaaruk, 2001
Not pregnant or lactating (n=62)
Mean Median EAR/AI* % <EAR
Calcium mg 485 461 1000*
Iron~ mg 12.6 12.4 8.1 14
Magnesium mg 191 187 255 91
Phosphorus mg 1096 1037 580 4
Zinc mg 10.5 10.4 6.8 5
Copper mcg 1015 990 700 4
Manganese mg 2.32 2.26 1.8*
Lactating (n=18)
Mean Median EAR/AI* % <EAR
Calcium mg 458 – 1000*
Iron~ mg 12.0 12.0 6.5
Magnesium mg 201 189 255 82
Phosphorus mg 953 937 580 1
Zinc mg 9.8 9.3 10.4 66
Copper mcg 1022 960 1000 55
Manganese mg 3.07 2.69 2.6*
Note: Means are adjusted by the C-SIDE software program.
The EAR represents the average daily nutrient intake level estimated to meet the requirements of half the healthyindividuals in a particular life stage and gender group. The proportion with an intake below the EAR is considered to havea usual inadequate intake.
* Adequate Intakes (AI) are used where EARs are not available. Intakes below the AI cannot automatically beconsidered inadequate across the population or group.
~ The percentage with an inadequate intake of iron was calculated using probabilities of inadequate intakes for a mixedpopulation of adult women using and not using oral contraceptives. The number of lactating women was too small toperform this analysis.
– The character of the underlying data is such that the C-SIDE program did not produce an estimate of the median.
Magnesium
Ninety-one percent of non-pregnant, non-lactating women and 82% of lactating womenhad an inadequate intake of magnesium (Table 25).
Nutrition and Food Security in Kugaaruk, Nunavut
63
Inadequate magnesium intake may cause a fall in the calcium concentrations in theblood. Muscle spasms are a clinical feature of emerging magnesium deficiency. Moresevere deficiency can lead to disturbances in heart rate. Magnesium deficiency mayalso play a role in the development of osteoporosis 87. Among traditional foods, the bestsources of magnesium are meats, raw and cooked clams, kelp, netted willow and Arcticwillow 21. Store food sources include green leafy vegetables, whole grains and nuts,with lower amounts in meat, fish and poultry.
In Kugaaruk, the major sources of magnesium, in descending order of importance, wereArctic char, coffee, tea, fruit drink crystals, pasta, flour, French fries and caribou (Table26).
Calcium
For non-pregnant, non-lactating women, mean and median intakes of calcium were 485mg and 461 mg (Table 25). Mean calcium intake for lactating women was 458 mg. Atthe present time, there is insufficient scientific evidence to set an EAR for calcium. Instead, based on studies of calcium retention and bone mineral content, the DietaryReference Intake Committee and its Panel on Calcium and Related Nutrientsestablished an Adequate Intake (AI). This intake is considered sufficient to maintaincalcium needs, while recognizing that lower intakes may be adequate for many 87. Inthis study, mean and median calcium intakes were less than half the AI. However, sincethe AI is not based on requirements, nothing can be said about the proportion of thepopulation with inadequate intakes 87.
Inadequate calcium intake during the period of bone formation, combined withinadequate exercise, may lead to osteoporosis in later life. Previous studies amongInuit women have all documented intakes below recommendations 1. But since calciumrequirements vary widely, and absorption is more efficient on a low intake, it is difficult todetermine whether current intakes are sufficient. Kuhnlein and coworkers suggest thatcurrent nutrient data may underestimate calcium intake in the Baffin Inuit population,which could also be the case here 21. A recent cross-sectional study of 10 Inuit children5 to 17 years of age examined the effect of a calcium load on the serum calcium andurinary calcium excretion. The results demonstrated that the Inuit had a distribution ofvitamin D receptor genotypes similar to that of some Asian populations and significantlydifferent from the white population. This genotype is believed to be an adaptation to alow-calcium diet, enabling a more efficient intestinal absorption of calcium. This geneticdifference is believed to enable the Inuit to mineralize their bones and maintain calciumbalance with a significantly lower calcium intake than is recommended for the standardAmerican diet. The authors caution that dietary calcium intakes based on the DRIs may

Nutrition and Food Security in Kugaaruk, Nunavut
64
result in hypercalciuria and renal damage for this population 88. However, it is importantto recognize the limitations of such a small cross-sectional study, especially withchildren whose calcium requirements are known to fluctuate. More rigorous researchinvolving longitudinal studies would be necessary to confirm these results.
Table 26. Mean magnesium intake (mg per day) from major
sources, Inuit women, Kugaaruk, 2001
Food group/Food Mail category mg % of total
Dairy Products
Priority Perishable 1 1
Nutritious Perishable 3 2
Non-perishable 4 2
Meat, Poultry, Fish
Nutritious Perishable 10 5
Non-perishable 2 1
Convenience Perishable 6 3
Cereal Products
Nutritious Perishable 6 3
Non-perishable 14 7
Fruit and vegetables
Priority Perishable 6 3
Nutritious Perishable 12 6
Sweets
Non-perishable 4 2
Miscellaneous
Nutritious Perishable 9 5
Non-perishable 47 24
Convenience Perishable 5 2
Country food 40 20
Foods of Little Nutritional Value 19 10
Total (all sources) 199

Nutrition and Food Security in Kugaaruk, Nunavut
65
In a study of Baffin foods, the best sources of calcium were caribou stomach contents,Arctic char skin, whole sculpin with bones, boiled duck, clams, and plants such as kelp,sorrel, netted willow and Arctic willow 21. Among store foods, the best sources are milk,cheese, yogurt and canned salmon and sardines (with the bones).
In Kugaaruk, calcium came mainly from fruit drink crystals, pizza, macaroni and cheesedinner, cheese, evaporated milk, baking powder, and packaged sandwiches andburgers (Table 27).
Table 27. Mean calcium intake (mg per day) from major
sources, Inuit women, Kugaaruk, 2001
Food group/Food Mail category mg % of total
Dairy Products
Priority Perishable 30 6
Nutritious Perishable 14 3
Non-perishable 47 10
Cereal Products
Nutritious Perishable 26 5
Non-perishable 18 4
Sweets
Non-perishable 55 12
Miscellaneous
Nutritious Perishable 77 16
Non-perishable 61 13
Convenience Perishable 27 6
Country food 26 5
Foods of Little Nutritional Value 51 11
Total (all sources) 479

Nutrition and Food Security in Kugaaruk, Nunavut
66
Iron, zinc and copper
Fourteen percent of non-pregnant, non-lactating women had an inadequate intake ofiron. Among lactating women, 66% had an inadequate intake of zinc and 55% ofcopper, because of the higher requirements during lactation (Table 25).
Iron deficiency leads to impaired work performance, anaemia and adverse pregnancyoutcomes 78.
The body has the ability to regulate the excretion of zinc when body stores are low, sozinc deficiency is rare, except in cases of general malnutrition, alcoholism or otherdiseases which affect its absorption. Impaired growth and a depressed immune functionare the most prominent features of mild zinc deficiency.
Copper is involved as a cofactor in a number enzymes that play an important role inimmune and cardiac function, connective tissue generation and repair and in theprevention of iron-deficiency anaemia. Copper deficiency is rare, but symptoms of aninadequate intake include anaemia.
The best traditional food sources of iron and zinc are red meats, particularly driednarwhal, dried beluga, dried caribou and ringed seal eyes 21. Iron and zinc are alsofound in certain seafood such as mussels and oysters, and whole grains. Major foodsources of copper include organ meats, seafood, nuts and seeds, wheat bran and wholegrains.
Low iron, zinc and copper intakes among some women may be due to seasonaldifferences in consumption of country food, reflecting a high consumption of fish and alower than normal consumption of seal and caribou.

Nutrition and Food Security in Kugaaruk, Nunavut
67
Figure 18 Percent energy and nutrients from country food, Inuit women, Kugaaruk,2001
Energy and Nutrient Contribution by Food Mail Category
Country food
Country food was the most important source of protein (40%), niacin (44%), vitamin B6(39%), vitamin B12 (83%) and cholesterol (35%) and an important source of vitamin A(23%), thiamin (29%), riboflavin (38%), iron (23%) and zinc (27%) (Figure 18, Table 28). It was not an important source of fat, vitamin C, folate or calcium. Country foodprovided only 10% of energy, the lowest percentage reported in any nutrition surveysamong the Inuit population in northern Canada.

Nutrition and Food Security in Kugaaruk, Nunavut
68
Table 28. Mean daily amount of energy and selected nutrients obtained by Food M ail
category, Inuit wom en, Kugaaruk, 2001
Countryfood
PriorityPerishable
food
NutritiousPerishable
food
Non-perishable
food
ConveniencePerishable
food
Foods ofLittle
NutritionalValue
Total
Amount (g) 140 53 209 1596 67 665 2730
Protein (g) 35 3 23 14 11 2 87
Fat (g) 6 2 31 12 10 6 67
Carbohydrate (g) 0 6 46 128 9 84 273
Calories 202 50 557 673 171 387 2040
Caffeine (mg) 0 0 0 321 0 50 371
Total sugars (g) 0 1 2 64 1 63 132
Dietary fibre (g) 0.0 0.8 3.6 2.7 0.4 0.5 7.9
Calcium (mg) 26 44 135 190 34 51 479
Iron (mg) 2.9 0.3 3.5 4.1 1.0 0.6 12.3
Magnesium (mg) 40 8 46 75 11 19 199
Phosphorus (mg) 371 51 275 263 86 130 1174
Potassium (mg) 115 88 535 689 133 133 1692
Sodium (mg) 81 70 802 1598 304 98 2954
Zinc (mg) 2.7 0.3 3.5 2.0 1.1 0.4 9.9
Copper (mcg) 204 31 230 350 39 150 1006
Manganese (mg) 0.0 0.1 0.5 1.5 0.0 0.3 2.4
Vitamin A (RE) 75 88 77 47 30 4 322
Vitamin C (mg) 1 6 7 136 0 2 152
Thiamin (mg) 0.42 0.03 0.40 0.49 0.08 0.02 1.43
Riboflavin (mg) 0.61 0.08 0.37 0.39 0.11 0.05 1.59
Niacin (NE) 18.0 0.8 10.8 7.2 3.1 0.7 40.8
Vitamin B6 (mg) 0.47 0.05 0.37 0.17 0.12 0.03 1.21
Dietary Folate Equivalents (mcg) 16 13 66 180 21 6 302Vitamin B12 (mcg) 10.2 0.1 1.1 0.4 0.4 0.0 12.2
Cholesterol (mg) 85 38 65 20 35 1 244
Trans Fatty Acids (g) 0.0 0.0 0.5 0.0 0.5 0.0 1.1
Saturated Fatty Acids (g) 2.0 0.9 10.3 4.5 2.9 3.3 23.9Polyunsaturated Fatty Acids (g) 2.0 0.2 3.8 1.6 1.5 0.7 9.8
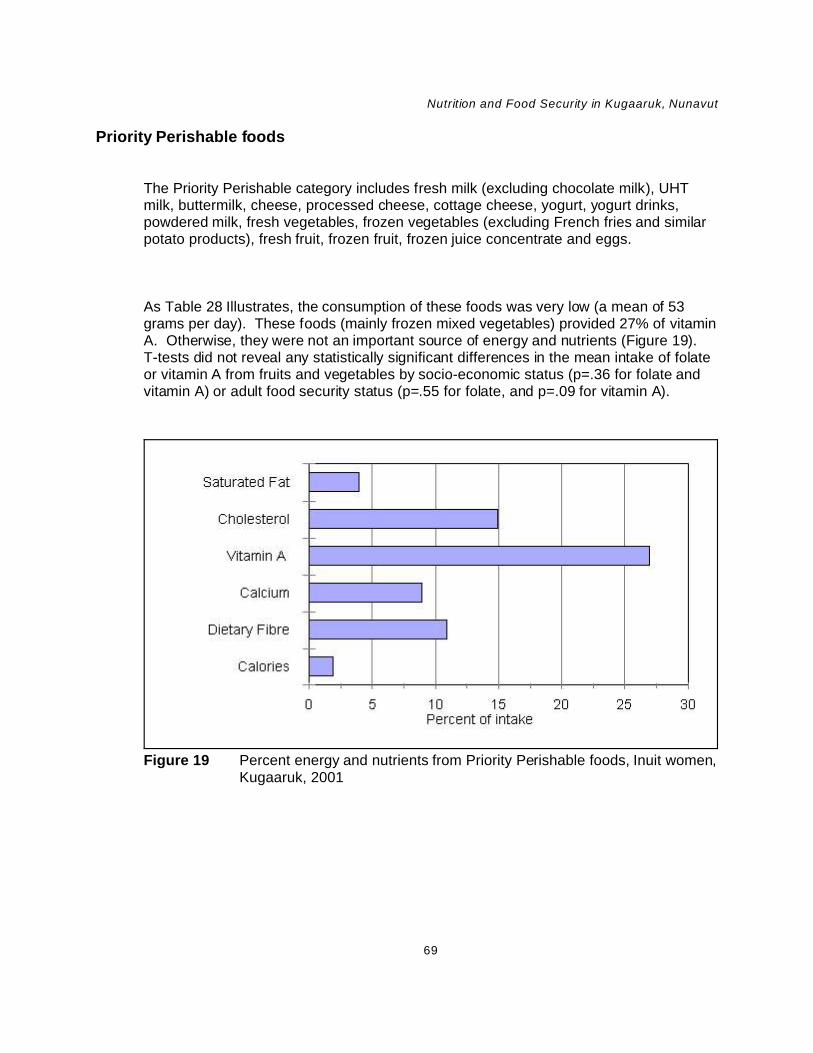
Nutrition and Food Security in Kugaaruk, Nunavut
69
Figure 19 Percent energy and nutrients from Priority Perishable foods, Inuit women,Kugaaruk, 2001
Priority Perishable foods
The Priority Perishable category includes fresh milk (excluding chocolate milk), UHTmilk, buttermilk, cheese, processed cheese, cottage cheese, yogurt, yogurt drinks,powdered milk, fresh vegetables, frozen vegetables (excluding French fries and similarpotato products), fresh fruit, frozen fruit, frozen juice concentrate and eggs.
As Table 28 Illustrates, the consumption of these foods was very low (a mean of 53grams per day). These foods (mainly frozen mixed vegetables) provided 27% of vitaminA. Otherwise, they were not an important source of energy and nutrients (Figure 19). T-tests did not reveal any statistically significant differences in the mean intake of folateor vitamin A from fruits and vegetables by socio-economic status (p=.36 for folate andvitamin A) or adult food security status (p=.55 for folate, and p=.09 for vitamin A).

Nutrition and Food Security in Kugaaruk, Nunavut
70
Figure 20 Percent energy and nutrients from Nutritious Perishable foods, Inuitwomen, Kugaaruk, 2001
Nutritious Perishable foods
This category includes store Meat, Poultry and Fish, bread and rolls, frozen French fries,margarine and butter, and pizza. Nutritious Perishable foods were a very importantsource of energy and nutrients (Table 28, Figure 20). They provided 46% of fat and43% of saturated fat (mainly from high-fat meats, margarine and butter, and pizza), 45%of dietary fibre (from French fries), 28% of calcium (pizza) and iron, 36% of zinc, and24% of vitamin A (margarine and butter). Nutritious Perishable foods, primarily Meat,Poultry and Fish, were an important source of cholesterol (27%), thiamin (28%),riboflavin (23%) and vitamin B6 (31%). Nutritious Perishables, mainly bread and pizza,provided 22% of DFEs. Margarine was the main source of trans fatty acids (48%), butas noted earlier, the CNF database is incomplete for this nutrient.
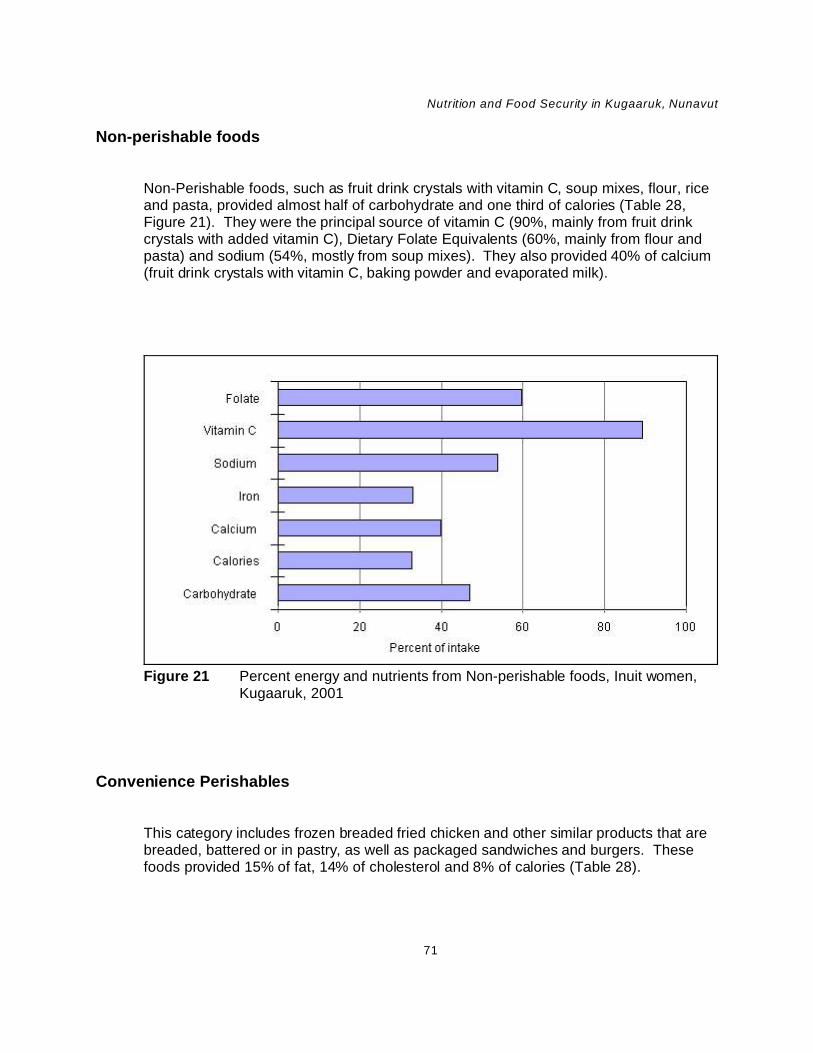
Nutrition and Food Security in Kugaaruk, Nunavut
71
Figure 21 Percent energy and nutrients from Non-perishable foods, Inuit women,Kugaaruk, 2001
Non-perishable foods
Non-Perishable foods, such as fruit drink crystals with vitamin C, soup mixes, flour, riceand pasta, provided almost half of carbohydrate and one third of calories (Table 28,Figure 21). They were the principal source of vitamin C (90%, mainly from fruit drinkcrystals with added vitamin C), Dietary Folate Equivalents (60%, mainly from flour andpasta) and sodium (54%, mostly from soup mixes). They also provided 40% of calcium(fruit drink crystals with vitamin C, baking powder and evaporated milk).
Convenience Perishables
This category includes frozen breaded fried chicken and other similar products that arebreaded, battered or in pastry, as well as packaged sandwiches and burgers. Thesefoods provided 15% of fat, 14% of cholesterol and 8% of calories (Table 28).

Nutrition and Food Security in Kugaaruk, Nunavut
72
Figure 22 Percent energy and nutrients from Foods of Little Nutritional Value, Inuitwomen, Kugaaruk, 2001.
Foods of Little Nutritional Value
This category includes soft drinks, candies, chocolate bars, potato chips, fruit drinkcrystals without vitamin C, cookies and coffee whitener. In this report, packagedsandwiches and burgers, which were previously considered as part of this category,have been moved to Convenience Perishables.
Foods of Little Nutritional Value provided 19% of calories, 31% of carbohydrate and48% of total sugars (Table 28, Figure 22). These foods were also a source of 15% ofcopper, 14% of saturated fat, 11% of calcium and phosphorus and 10% of magnesium. They supplied only 1 to 3% of B vitamins and 1% of vitamin A and vitamin C.

Nutrition and Food Security in Kugaaruk, Nunavut
73
Discussion
This study was undertaken to provide baseline data for the Food Mail Pilot Project. Thefindings will enable INAC to evaluate the impact of reducing the cost of PriorityPerishable foods and introducing measures to improve their recognition, quality andvariety, in addition to a nutrition education program, on the food security of Kugaarukhouseholds and the nutrient intake of women of child-bearing age.
The report highlights a number of nutrition concerns for Kugaaruk residents, and inparticular, for women of child-bearing age. Our findings with respect to food securityconcerns and food consumption patterns were validated in local meetings with thehamlet council, health care providers and the local project coordinator and throughdialogue with community members on the local radio.
At the time of the survey the weekly cost of the Northern Food Basket for a family offour was $327, double that of Yellowknife or Edmonton. For three quarters of families inKugaaruk, income would be insufficient or barely sufficient to cover the cost of a healthydiet and other necessary family expenditures.
Food security is defined by the American Institute of Nutrition as “access by all people atall times to enough food for an active, healthy life” 89. They claim that food security“includes at a minimum: (1) the ready availability of nutritionally adequate and safefoods, and (2) an assured ability to acquire acceptable foods in socially acceptable ways(e.g., without resorting to emergency food supplies, scavenging, stealing, or othercoping strategies).” Food insecurity is defined as “a limited or uncertain availability ofnutritionally adequate and safe foods or limited or uncertain ability to acquire acceptablefoods in socially acceptable ways” 89. Food insecurity is the deprivation of a basic needand, in the sense it is used here, it results from a lack of financial resources. Foodinsecurity is undesirable in and of itself, but it is also a possible precursor to nutritional,health, and developmental problems. In 1996, Canada and other countries at the WorldFood Summit agreed that “food security exists when all people, at all times, havephysical and economic access to sufficient, safe and nutritious food to meet their dietaryneeds and food preferences for an active and healthy life” 90.
Two thirds of households with children in Kugaaruk had experienced hunger in the past12 months among either adults or children, or both. In four out of 10 households, both

Nutrition and Food Security in Kugaaruk, Nunavut
74
adults and children experienced hunger because they were unable to afford enoughfood. This situation demands immediate attention, especially since food insecurity maycompromise psychosocial functioning among school-age children as well as theirnutrition and health. The fact that more than half of “relatively well-off” households,based on income for the previous month, were food insecure suggests that thesefamilies may be helping others in the community or that their income may fluctuate fromone month to another. Unfortunately, the small sample size made it difficult to findstatistically significant relationships between food insecurity and nutrient intakes.
Among social issues of concern, almost half of Inuit households said they wereextremely concerned about not having enough money for food. The level of concernover money for food was second only to the concern over a lack of jobs, indicating thatfood insecurity places many families under considerable stress.
Paradoxically, despite this level of food insecurity, there was a high prevalence ofobesity among women of child-bearing age. However, the prevalence of overweightamong food insecure individuals, especially among those who are only mildly foodinsecure, has been documented in a number of other studies 91 92. It is of particularinterest that about four times as many Kugaaruk women rate their health as “fair” or“poor” as women in the general Canadian population, and the vast majority of women inKugaaruk, including all those who were pregnant, smoked. Given the degree of foodinsecurity, the level of smoking and obesity and the low intake of essentialmicronutrients, it is not surprising that such a high percentage perceive their healthstatus as fair or poor. This is an area that deserves further analysis and clinicalinvestigation of nutrient status.
We did not find a statistically significant relationship between food security status orsocio-economic group and mean intakes of calcium, folate and vitamin A. It is possiblethat such relationships exist, but in view of the inherent day-to-day variation in nutrientintake, the relatively small sample size in this study may have made it impossible todetect any significant differences. Other reasons why such relationships were not foundmay include the generally low socio-economic status among all socio-economic groups,the general lack of nutritious choices available to the community, the Inuit practice ofsharing, and the lack of high quality, reasonably priced Priority Perishable foods. In anyevent, the high percentage of women with inadequate intakes of folate, vitamin B6,vitamin C and magnesium must be a cause for concern. The nursing staff reported ahigh prevalence of anaemia among young children and women of child-bearing age,although clinical tests were not performed to determine if the anaemia was due to iron orfolate deficiency. The nursing staff also reported poor compliance with vitamin ormineral supplements among women of child-bearing age.

Nutrition and Food Security in Kugaaruk, Nunavut
75
It is important to bear in mind that the EARs are based on the requirements of thegeneral North American population. While the EARs recognize differences in thedistribution of requirements of a diverse population, no information is available on thespecific nutrient requirements of the Inuit. Further research is needed to estimate theaverage nutrient requirements of the Inuit, given their present diet and lifestyle. Unfortunately, the effects of an inadequate intake of certain nutrients on health are oftensubtle and chronic diseases resulting from inadequate intakes take years to develop.
We found a low consumption of country food by women of child-bearing age comparedto all other Inuit communities surveyed by INAC since 1992. Also, no organ meats andvery little country fat, seal, walrus or muktuk were reported. A more accurate picture ofusual consumption would require collecting data in another season. However, since noCountry food was reported on the 24-hour recall that did not also appear on the FoodFrequency Questionnaire, we felt that the Food Frequency questionnaire did include themost important foods.
For centuries, country food has been central to Inuit health. It has provided most of theessential nutrients. Hunting and fishing and the preparation of country food reinforcesInuit values, provides physical exercise and contributes to a feeling of pride and well-being. Although country food supplies were limited at the time of the survey, communitymembers still felt that women of child-bearing age ate less country food than olderadults. The Food Mail Pilot Project will enable the shipment of country food fromCambridge Bay at the Priority Perishable food rate, so this should improve the supply ofcountry food. The nutrition education program will promote consumption of a variety ofcountry food and emphasize ways of using Priority Perishable store foods incombination with country foods in order to facilitate their wider adoption as soon aspossible. Food security could be further improved by improving access to country foodthrough the purchase of community freezers or increased financial assistance tohunters, but such measures are beyond the scope of the pilot project.
Unfortunately, the most frequently purchased and consumed store foods are not themost nutritious choices. Consumption of fruits, vegetables, dairy products and wholegrain cereals and bread was very low, while consumption of soft drinks, fruit drinkcrystals without vitamin C and chocolate bars was quite high. The high consumption of“junk food” by women of child-bearing age was also confirmed by our discussions withvarious community groups and health care providers during our visit to Kugaaruk. Thepurchase and consumption of Priority Perishable foods, rich sources of vitamin A,vitamin C and folate, was extremely low. Consumers cited cost, poor quality, a lack ofvariety, and limited availability, as the most important barriers to buying more fresh fruitand vegetables. More importantly, from the point of view of nutrition education, fewKugaaruk consumers said they were not buying more fresh fruit and vegetables

Nutrition and Food Security in Kugaaruk, Nunavut
76
because they preferred canned or frozen products, disliked these foods, felt that thesefoods are not needed to be healthy, or because they did not know how to prepare them.
Given the concern expressed about alcohol and drug abuse in the community, the zeroconsumption of alcohol reported on the 24-hour recall may be biassed. This is a drycommunity and people are unlikely to report consuming alcohol.
The prevalence of obesity among women of child-bearing age in Kugaaruk is a healthconcern, since obesity increases the risk of chronic diseases, such as heart disease andtype 2 diabetes. According to the BMI, 25% of women in Kugaaruk are at very high orextremely high risk of obesity-related diseases. Also, 18% of women with a BMI under35 had a waist circumference that places them at considerable risk of obesity-relateddiseases. The level of obesity suggests under-reporting of energy intake, as well as ofmacronutrients, such as fat and carbohydrate, on the 24-hour recall. It is likely thatmean fat and caloric intake would have been higher had potato chips been available atthe time of the survey. According to the food frequency questionnaire, potato chipswere consumed an average of nine times in the past month.
While a reduction in energy intake would help to improve health by reducing weight, itmay decrease the individual’s ability to meet her requirement for many nutrients unlessmore nutrient-dense foods are chosen. Much of the health risk associated with obesityis related to poor physical fitness. By increasing physical exercise, individuals canimprove fitness irrespective of changes in weight.
It is evident that food choices must change in order to meet requirements formicronutrients among women of child-bearing age. Vitamin, mineral and fibre intakescould be vastly improved by a few simple changes or substitutions. These could includethe following: preparation of breaded skinless oven-baked chicken instead of frozenfried chicken; the substitution of home-made sandwiches and burgers using countrymeat for packaged sandwiches; replacement of fruit drink crystals with frozen fruit juice;and the use of whole grain breads and cereals instead of white bread and instant whiterice. Other changes which would help to improve nutritional status include thepromotion of lower-fat dairy products, low-fat meats and non-hydrogenated margarine.
The nutrition and household surveys have demonstrated that the pilot project isappropriately focussed to address some of the major concerns of this community. Ifsuccessful, it should help to improve food security by lowering the cost of Priority
Nutrition and Food Security in Kugaaruk, Nunavut
77
Perishable foods and thereby improve the intake of essential nutrients such as vitaminA, folate, vitamin C, vitamin B6, calcium, magnesium and fibre.
The pilot project will attempt to improve food security by reducing the cost of PriorityPerishable foods. If it also succeeds in reducing the consumption of expensiveconvenience foods and Foods of Little Nutritional Value, it may indirectly lower foodexpenditures or improve nutrient intake derived from the same level of expenditure. Thenutrition education program being undertaken as part of the pilot project will addresssome of these issues and encourage more nutritious choices as well as healthiercooking methods.
The pilot project will also provide some training to retail staff and shippers in order toimprove marketing and availability of high quality Priority Perishable foods. Special shelfstickers and posters in English and Inuktitut will clearly identify the Priority Perishablefoods so that consumers will be better able to make healthier food choices. By loweringthe cost of these foods and introducing measures to improve the quality and variety offresh fruit and vegetables, the pilot project should remove some of the perceivedbarriers to the purchase of these foods.
Finally, it is important to place these findings in perspective. Obesity, smoking, and aperception of poor health status are common in societies where unemployment isrampant and where there has been radical social change. Poor health behaviours oftenrepresent coping strategies by populations under such stress. High food pricescontribute to food insecurity, but other factors, such as the purchase of high-costconvenience foods and Foods of Little Nutritional Value, as well as cigarettes, reducethe amount of money available for nutritious food. While the pilot project will help toreduce prices and improve nutrition knowledge and skills, it cannot be expected tocompletely solve the food security problem or to address all of the underlying problemsbeing experienced by the people of Kugaaruk. Major improvements to the situation inKugaaruk will require action on many fronts, including the income side, as well as thejoint effort of community leaders, health professionals and educators.

Nutrition and Food Security in Kugaaruk, Nunavut
78
1. Lawn J. An update on nutrition surveys in isolated northern communities.Ottawa: Indian and Northern Affairs Canada, 2002.
2. Lawn J, Harvey D. Change in nutrition and food security in two Inuitcommunities, 1992 to 1997. Ottawa: Indian and Northern Affairs Canada, 2001.
3. Kuhnlein HV, Receveur O, Chan HM, Loring E. Assessment of dietarybenefit/risk in Inuit communities. Centre for Indigenous Peoples’ Nutrition andEnvironment (CINE) and Inuit Taparisat of Canada. Ste-Anne-de Bellevue,Quebec, August 2000.
4. Lawn J, Langner N. Air Stage Subsidy Monitoring Program Final Report.Volume 2: Food Consumption Survey. Ottawa: Indian and Northern AffairsCanada, 1994.
5. Labrador Inuit Health Commission. What you told us ... about nutrition/diet.What you told us. 1999 April;1(3):1-4.
6. Institute of Medicine. WIC nutrition risk criteria: a scientific assessment.Washington, D.C: National Academy Press, 1996.
7. Olson CM. Nutrition and health outcomes associated with food insecurity andhunger. J Nutr 1999 Feb;129 (2S Suppl);521S-524S.
8. Kendall A, Olson CM, Frongillo EA. Relationship of hunger and food insecurityto food availability and consumption. J Am Diet Assoc 1996 Oct;95(10):1019-24.
9. Rose D, Oliveira V. Nutrient intakes of individuals from food-insufficienthouseholds in the United States. Am J Public Health 1997 Dec;87(12):1956-1961.
10. Tarasuk VS, Beaton GH. Women’s dietary intakes in the context of foodsecurity. J Nutr 1999;129:672-79.
11. Lawn J. Air Stage Subsidy Monitoring Program Final Report. Volume 1: FoodPrice Survey. Ottawa: Indian and Northern Affairs Canada, 1994.
12. Indian and Northern Affairs Canada, unpublished data.
13. Wein E. The high cost of a nutritionally adequate diet in four Yukoncommunities. Can J Public Health 1994 Sept - Oct;85(5):310-12.
References
Nutrition and Food Security in Kugaaruk, Nunavut
79
14. Lawn J. Food costs in Treaty 8 communities of Northern Alberta: NorthernRiver Basins Food Consumption Study. Prepared for Alberta Treaty 8 HealthAuthority, Feb 2000, unpublished.
15. Ladouceur LL, Hill F. Results of the survey on food quality in six isolatedcommunities in Labrador, March 2001. Ottawa: Indian and Northern AffairsCanada, 2002.
16. Statistics Canada, 2001 Census of Canada.
17. Government of Nunavut, Department of Education, 2003.
18. National Council of Welfare. Welfare Incomes, 2000 and 2001. Ottawa, 2002.
19. Unpublished information, Government of Nunavut, Department of Education,2003.
20. Statistics Canada. Low Income Cut-Offs. Catalogue No. 13-551-X1B. Ottawa:December 1999.
21. Kuhnlein HV, Soueida R. Use and nutrient composition of traditional Baffin Inuitfoods. J Food Comp and Analysis 1992;5:112-126.
22. Kuhnlein HV, Kubow S, Soueida R. Lipid components of traditional Inuit foodsand diets of Baffin Island. J Food Comp and Analysis 1991;4:227-236.
23. Nobmann E. Nutrient value of Alaska native foods, rev October 1993.Anchorage, Alaska: U.S. Department of Health and Human Services, IndianHealth Service, Alaska Area Native Health Service, Anchorage, Alaska.
24. Institute of Medicine. Dietary Reference Intakes: applications in dietaryassessment. Washington, D.C.: National Academy Press, 2001.
25. Nusser SM, Carriquiry AL, Dodd KW, Fuller WA. A semiparametric approach toestimating usual daily intake distributions. J Am Stat Assoc 1996;91:1440-1449.
26. Beltsville Human Nutrition Research Center, Agricultural Research Service.The Continuing Survey of Food Intakes by Individuals 1994-1996 and the Dietand Health Knowledge Survey. Beltsville, Maryland: United States Departmentof Agriculture, 2000.
27. Bickel G, Nord M, Price C, Hamilton W, Cook J. Guide to measuring householdfood security: revised 2000. United States Department of Agriculture, Food andNutrition Service, Office of Analysis, Nutrition and Evaluation. Alexandria,Virginia: 2000.

Nutrition and Food Security in Kugaaruk, Nunavut
80
28. Radimer KL, Olson CM, Greene JC, Campbell CC, Habicht JP. Understandinghunger and developing indicators to assess it in women and children. J Nutr Ed1992;24((Suppl):36S-44S.
29. Nord M, Jemison K. Effects of cultural differences on the measurement of foodinsecurity and hunger. Annual Meeting of the Rural Sociological Society,Chicago, Ill, August 4-8, 1999. Unpublished revised version, June 4, 2001.
30. Kuhnlein HV, Soueida R, Receveur O. Dietary nutrient profiles of CanadianBaffin Island Inuit differ by food source, season, and age. J Am Diet Assoc1996 Feb;96(2):155-62.
31. Beaton GH, Milner J, Corey P, McGuire V, Cousins M, Stewart E, deRamos M,Hewitt D, Grambsch PV, Kassim N, Little JA. Sources of variance in 24-hourdietary recall data: implications for nutrition study design and interpretation. AmJ Clin Nutr 1979;32:2546-2559.
32. Tarasuk V, Beaton GH. The nature and individuality of within-subject variationin energy intake. Am J Clin Nutr 1991;54:464-470.
33. Tarasuk V and Beaton GH. Statistical estimation of dietary parameters:implications of patterns in within-subject variation - a case study of samplingstrategies. Am J Clin Nutr 1992;55:22-27.
34. Nelson M, Black AE, Morris JA, Cole TJ. Between- and within-subject variationin nutrient intake from infancy to old age: estimating the number of daysrequired to rank dietary intakes with desired precision. Am J Clin Nutr1989;50:155-157.
35. Schoeller DA. Validation of habitual energy intake. Abs The Fourth InternationalConference on Dietary Assessment Methods, Sept 17-20, 2000, Tucson,Arizona. University of Arizona, Tucson: 2000.
36. Briefel RR, Sempos CT, McDowell MA, Chien S, Alaimo K. Dietary methodsresearch in the Third National Health and Nutrition Examination Survey:underreporting of energy intake. Am J Clin Nutr 1997:65:1203S-1209S.
37. Lahmann P, Lissner L, Mattisson I, Gullberg B, Berglund G. Culturaldifferences in underreporting: ethnicity or obesity? Abs. The FourthInternational Conference on Dietary Assessment Methods, Tucson, Arizona,Sept 17-20, 2000. University of Arizona, Tucson: 2000.
38. Johansson G, Wikman A, Ahren AM, Hallmans G, Johansson I. Underreporting of energy intake in repeated 24-hour recalls related to gender,age, weight status, day of interview, educational level, reported food intake,smoking habits and area of living. Public Health Nutr 2001 Aug;4(4):919-27.

Nutrition and Food Security in Kugaaruk, Nunavut
81
39. Horner NK, Patterson RE, Neuhouser ML, Lampe JW, Beresford SA, PrenticeRI. Participant characteristics associated with errors in self-reported energyintake from the Women’s Health Initiative food-frequency questionnaire. Am JClin Nutr 2002 Oct;76(4):766-73.
40. Shai J, Shahar D, Vardi H, Fraser DS, Underreporting of energy intake in theIsraeli population. Abs. The Fourth International Conference on DietaryAssessment Methods, Tucson, Arizona, Sept 17-20, 2000. University ofArizona, Tucson: 2000.
41. Hebert JR, Ebbeling CB, Matthews CE. Social desirability and approval-relatedbiases in middle-aged women’s energy intake: comparing structured dietaryquestionnaires to energy expenditure using doubly-labelled water. Abs. TheFourth International Conference on Dietary Assessment Methods, Tucson,Arizona, Sept 17-20, 2000. University of Arizona, Tucson: 2000.
42. Hebert JR, Peterson KE, Hurley TG, Stoddard AM, Cohen N, Field AE,Sorensen G. The effect of social desirability trait on self-reported dietarymeasures among multi-ethnic female health center employees. Ann Epidemiol2001 Aug;11(6):417-27.
43. Cullen KW, Baranowski T, Baranowski J, Bebert D, de Moor C. Pilot study ofthe validity and reliability of brief fruit juice and vegetable screeners amonginner city African American boys and 17-20 year old adults. J Am Coll Nutr1999;18:442-450.
44. Block G. Use of the Block questionnaire in the WIC program. In: Framework fordietary risk assessment in the WIC program. An interim report from the Foodand Nutrition Board. Institute of Medicine, Washington, D.C: National AcademyPress, 2000.
45. Lawn J, Harvey D. Northern River Basins Food Consumption Survey Report:Nutritional Implications. Prepared for Alberta Treaty 8 Health Authority.(Publication in progress)
46. Nord M, Andrews M, Carlson S. Measuring food security in the United States:household food security in the United States, 2001. Food Assistance andNutrition Research Project Number 29, Food Assistance and NutritionResearch Program, Economic Research Service, United States Department ofAgriculture, Washington: 2002.
47. Blanchet C, Dewailly E, Ayotte P, Bruneau S, Receveur O, Holub BJ.Contribution of selected traditional and market foods to the diet of Nunavik Inuitwomen. Can J Diet Pract Res 2000 Summer;61(2):50-59.
48. Statistics Canada. Self-rated health by age group and sex, householdpopulation aged 12 and over, Canada, 2000/01. May 23, 2002. Web site:

Nutrition and Food Security in Kugaaruk, Nunavut
82
http://www.statcan.ca/english/freepub/82-221-XIE/00502/tables/1115.htm.
49. Office of Nutrition Policy, Health Canada. Canadian guidelines for body weightclassification in adults. In press. Ottawa: February 3, 2003.
50. Torrance GM, Hooper MD, Reeder BA. Trends in overweight and obesityamong adults in Canada (1970-1992): evidence from national surveys usingmeasured height and weight. International J Obesity 2002;26:797- 804.
51. Katzmarzyk PT. The Canadian obesity epidemic, 1985-1998. CMAJ2002;166(8):1039-40.
52. Tremblay MS, Katzmarzyk PT, Willms JD. Temporal trends in overweight andobesity in Canada, 1981-1996. International J Obesity 2002;26(4):538-543.
53. Young TK, Reading J, Elias B, O’Neil JD. Type 2 diabetes mellitus in Canada’sFirst Nations: status of an epidemic in progress. CMAJ 2000;163(5):561-6.
54. Kuczmarski MF, Kuczmarski RJ, Najjar M. Effects of age on validity of self-reported height, weight, and body mass index: findings from the Third NationalHealth and Nutrition Examination Survey, 1988-1994. J Am Diet Assoc 2001Jan; 101 (1):28-34.
55. Spencer EA, Appleby PN, Davey GK, Key TJ. Validity of self-reported heightand weight in 4808 EPIC-Oxford participants. Pub Health Nutr 2002Aug;5(4):561-5.
56. Pirie P, Jacobs D, Jeffery R, Hannan P. Distortion in self-reported height andweight data. J Amer Diet Assoc 19981 Jun;78(6):601-6.
57. Villanueva EV. The validity of self-reported weigh tin US adults: a populationbased cross-sectional study. BMC Pub Health 2001;1(1):11
58. NHLBI/NIDDK (National Heart, Lung, and Blood Institute/National Institute ofDiabetes and Digestive and Kidney Diseases). Clinical guidelines on theidentification, evaluation, and treatment of overweight and obesity in adults: theevidence report. NIH Publication No. 98-4083. National Institutes of Health,Bethesda: 1998.
59. National Cholesterol Education Program. Third report of the NationalCholesterol Education Program (NCEP) Expert Panel on Detection, Evaluation,and Treatment of High Blood Cholesterol in Adults (Adult Treatment Panel III).NIH Publication No. 01-3670, National Institutes of Health, Bethesda: 2001.
60. World Health Organization. Obesity: preventing and managing the globalepidemic: report of a WHO consultation. Geneva: World Health Organization,2000.

Nutrition and Food Security in Kugaaruk, Nunavut
83
61. Ledoux M, Lambert J, Reeder BA, Despres JP. A comparative analysis ofweight to height and waist to hip circumference indices as indicators of thepresence of cardiovascular disease risk factors. Canadian Heart HealthSurveys Research Group. CMAJ 1997;157 Suppl 1:S32-8.
62. Reeder BA, Senthilselvan A, Despres JP, Angel A, Liu L, Wang H et al. Theassociation of cardiovascular disease risk factors with abdominal obesity inCanada. Canadian Heart Health Surveys Research Group. CMAJ 1997;157Suppl 1:S39-45.
63. Rexrode KM, Carey VJ, Hennekens CH, Walters EE, Colditz GA, Stampfer MJet al. Abdominal and total adiposity and risk of coronary heart disease inwomen. JAMA 1998;280(21):1843-8.
64. Han TS, van Leer EM, Seidell JC, Lean ME. Waist circumference action levelsin the identification of cardiovascular risk factors: prevalence study in a randomsample. BMJ 1995;311(7017): 1401-5.
65. Lean ME, Han TS, Morrison CE. Waist circumference as a measure forindicating need for weight management. BMJ 1995;311(6998):158-61.
66. Consolazio CF, Johnson RE, Pecora LJ. Physiological measurements ofmetabolic functions in man. New York: McGraw-Hill, 1963: s414-416.
67. Armstrong DW. Metabolic and endocrine responses to cold air in womendiffering in aerobic capacity. Med Sci Sport Exerc 1998;30:880-884.
68. Health Canada. Nutrition Bureau, Nutrition Research Division, Ottawa, personalcommunication, November 2001.
69. Panel on Micronutrients, Panel on the Definition of Dietary Fiber, Subcommitteeon Upper Reference Levels of Nutrients, Subcommittee on Interpretation andUses of Dietary Reference Intakes, and the Standing Committee on theScientific Evaluation of Dietary Reference Intakes, Institute of Medicine. DietaryReference Intakes for energy, carbohydrate, fiber, fat, fatty acids, cholesterol,protein and amino acids. Washington: The National Academies Press, 2002.
70. Salmerón J, Hu FB, Manson JE, Stamfer MJ, Colditz GA, Rimm EB, WillettWC. Dietary fat intake and risk of Type 2 diabetes in women. Amer J Clin Nutr2001 Jun(73); 6: 1019-1026.
71. Jeqier E. Pathways to obesity. Int J Obes Metab Disord 2002 Sep;26 Suppl2:S12-7.
72. Roberts CK, Barnard RJ, Liang KH, Vaziri ND. Effect of diet on adipose tissueand skeletal muscle VLDL receptor and LPL: implications for obesity andhyperlipidemia. Atherosclerosis 2002 Mar;161 (1):133-41.
Nutrition and Food Security in Kugaaruk, Nunavut
84
73. Bessesen DH. The role of carbohydrates in insulin resistance. J Nutr 2001Oct;131(10):2782S-2786S.
74. Cordain L, Eaton SB, Miller JB, Mann N, Hill K. The paradoxical nature ofhunterer-gatherer diets: meat-based, yet non-atherogenic. Eur J Clin Nutr 2002Mar;56 Suppl 1:S42-52.
75. American Dietetic Association. Health implications of dietary fiber - position ofADA. J Am Diet Assoc 1997;97:1157-1159.
76. Ludwig DS, Pereira MA, Kroenke CH, Hilner JE, Van Horn L, Slattery ML, Jacobs DR Jr. Dietary fiber, weight gain, and cardiovascular disease riskfactors in young adults. JAMA 1999 (Oct 27);282 (16):1539-46.
77. Nawrot P, Jordan S, Eastwood J, Rotstein J, Hugenholtz A, Feeley M. Effectsof caffeine on human health. Food Add and Contaminants 2003; 20:1-30.
78. Panel on Micronutrients, Subcommittees on Upper Reference Levels ofNutrients and of Interpretation and Use of Dietary Reference Intakes and the Standing Committee on the Scientific Evaluation of Dietary Reference Intakes,Food and Nutrition Board, Institute of Medicine. Dietary Reference Intakes forvitamin A, vitamin K, arsenic, boron, chromium, copper, iodine, iron,manganese, molybdenum, nickel, silicon, vanadium. Washington: NationalAcademy Press, 2001.
79. Lynch SR. Interaction of iron with other nutrients. Nutr Rev 1997;55:102-110.
80. Standing Committee on the Scientific Evaluation of Dietary Reference Intakesand its Panel on Folate, Other B Vitamins, and Choline and Subcommittee onUpper Reference Levels of Nutrients, Food and Nutrition Board, Institute ofMedicine (IOM). Dietary Reference Intakes for thiamin, riboflavin, niacin,vitamin B6, folate, vitamin B12, pantothenic acid, biotin and choline.Washington: National Academy Press, 2000.
81. O’Keefe CA, Bailey LB, Thomas EA, Hofler SA, Davis BA, Cerda JJ, GregoryJF 3rd. Controlled dietary folate affects folate status in non-pregnant women. JNutr 1995;125:2717-2725.
82. George L, Mills JL, Johansson AL, Nord Mark A, Olander B, Granath F,Cnattingius S. Plasma folate levels and risk of spontaneous abortion, JAMA2002 Oct 16;288(15):1867-73.
83. McDonald SD, Perkins SL, Jodouin CA, Walker MC. Folate levels in pregnantwomen who smoke: and important gene/environment interaction. Am J ObstetGynecol 2002 Sep;187(3):620-5.
Nutrition and Food Security in Kugaaruk, Nunavut
85
84. Panel on Dietary Antioxidants and Related Compounds, Subcommittees onUpper Reference Levels of Nutrients and Interpretation and Uses of DietaryReference Intakes, and the Standing Committee on the Scientific Evaluation ofDietary Reference Intakes, Food and Nutrition Board, Institute of Medicine.Dietary Reference Intakes for vitamin C, vitamin E, selenium, and carotenoids.Washington: National Academy Press, 2000.
85. Leggott PJ, Robertson PB, Rothman DL, Murray PA, Jacob RA. Effects ofascorbic acid depletion and supplementation on periodontal health. JPeriodontiol 1986;57:480-485.
86. Levine M, Conry-Cantilena C, Wang Y, Welch RW, Washko PW, Dhariwal KR,Park JB, Lazare A, Graumlich JF, King J, Catilena LR. Vitamin Cpharmokinetics in healthy volunteers: evidence for a recommended dietaryallowance. Proc Natl Acad Sci 1996;93:3704-3709.
87. Standing Committee on the Scientific Evaluation of Dietary Reference Intakes,Food and Nutrition Board, Institute of Medicine (IOM). Dietary ReferenceIntakes for calcium, phosphorus, magnesium, vitamin D, and fluoride.Washington: National Academy Press, 1999.
88. Sellers, EAC, Sharma A, Rodd C. Adaptation of Inuit children to a low-calciumdiet. CMAJ 2003;168 (9):1141.
89. Anderson SA, editor. Core indicators of nutritional sate for difficult-to-samplepopulations: a report prepared by the Life Sciences Research Office,Federation of American Societies for Experimental Biology for the AmericanInstitute of Nutrition under Cooperative Agreement No. HPU 880004-01-0,Nutritional Status Indicators of Low-income Populations, with the Office ofDisease Prevention and Health Promotion, Department of Health and HumanServices. J Nutr 1990;120 (11S):1557-1600.
90. Agriculture and Agri-Food Canada. Canada’s action plan for food security: aresponse to the World Food Summit. Pub No. 1987E, Ottawa: 1998.
91. Alaimo K, Olson CM, Frongillo EA. Low family income and food insufficiency inrelation to overweight in U.S. children: is there a paradox?. Arch PediatrAdolesc Med 2001 Oct;155(10):1161-7.
92. Townsend MS, Peerson J, Love B, Achterberg C, Murphy SP. Food insecurityis positively related to overweight in women. J Nutr 2001 Jun;131(6):1738-45.

APPENDIX A – NUTRITION QUESTIONNAIRE
ID
INT NO
Note to interviewer: Please enter starting time:________AM /PM
Nutrition Questionnaire
Kugaaruk Food Mail Pilot Project
2001
Note to interviewer: Please enter time when the interview is complete andcircle AM or PM: _______AM / PM

ID
FMPP2001-1
A. 24-Hour Recall
This part of the questionnaire asks about all the foods and drinks you consumed over the past24 hours. We want to include everything, that is, both country and store foods, and not onlymeals, but also snacks and beverages. First we will make a list, according to the TIME of dayyou ate each meal or snack. Then later we will review the list to make sure that nothing isforgotten and to add the amounts of each item. This is easier than you may think at first. Fromthis list we will be able to know if people are getting the energy and nutrients they need for goodhealth.
Let’s begin at this time yesterday. Where were you at this time yesterday? (This helps theperson to recall.) Did you eat or drink anything at this time yesterday? When was the first timeafter this that you ate or drank something? What did you eat (and/or drink)?... When was thenext time you had something to eat or to drink? What did you have? [LEAVE SPACESBETWEEN FOODS AND TIMES, ESPECIALLY AFTER COFFEE AND TEA SO THAT MILK ORSUGAR CAN BE ADDED ON THE SECOND PASS.]
(When you have covered 24 hours, then say) Let’s go back over this list and add the amounts. (Ask for details about each food. For example, you might say) I have some measuring cups,spoons, bowls and food models to help estimate the amounts. (Set out the householdmeasures and the food models.)
First, you mentioned (name of food or drink). [ON THE SECOND PASS, ASK FOR MOREDETAIL ABOUT THE DESCRIPTION OF THE FOOD, E.G., What type? Did you add anythingto it (e.g. to the coffee, to the bannock, to the cereal, etc.)? What brand?] Using thesemeasuring cups or food models, how much did you have at (time) yesterday? (Continue until thefull 24 hours are covered. Review list to ensure that a full 24 hours are covered, and for acomplete description of each food and amount.) [DON\T FORGET TO ASK IF THE FOODWAS CANNED, MADE FROM A MIX OR FROZEN AND TO NOTE “C”, “M” OR “F” IN THESECOND COLUMN.]
(If homemade food mixtures are reported, ask about the recipe and record on the recipe form atthe end.) USING A SMALL POST-IT, LABEL EACH RECIPE WITH A NUMBER AND AFTERYOU FEEL YOU HAVE A COMPLETE DESCRIPTION OF EVERYTHING CONSUMEDDURING THAT 24 HOURS, ASK THE PARTICIPANT TO PROVIDE THE INGREDIENTS ANDAMOUNTS (USING THE MODELS OR HOUSEHOLD MEASURES AND THE NUMBER OFPORTIONS (USING A HOUSEHOLD MEASURE) THE RECIPE MAKES. FOR TOTALNUMBER OF SERVINGS, USE NUMBER OF PORTIONS AND MODELS (E.G. MAKES 6MO-XL).
We also need to know if you take any nutrition supplements and what kind. [COMPLETELARGE 24-HOUR RECALL FORM.]

ID
FMPP2001-2
B. Food Frequency Questionnaire
Now I would like to ask you about the past month. These questions will only ask abouthow often you ate or drank certain foods or beverages. This information is importantbecause it provides a better picture of what you usually eat over a longer period.
I will give you a series of cards with a list of foods. Together we will read each list and Iwill ask you to estimate how often you have consumed these foods or beverages overthe past month.
101 Let’s begin with list A. Starting with caribou, did you eat caribou during the pastmonth? [CHECK YES OR NO. IF NO, GO TO NEXT FOOD.]
102 If YES, how often did you eat caribou over the past month? [FOR EACH FOOD,ENTER HOW OFTEN THE FOOD IS EATEN (TIMES PER DAY OR WEEK ORMONTH) IN ONE OF THREE COLUMNS.]
101 Have you eaten any of the foods on thislist in the past month?
YES/
NO/
102. IF YES, how often? (Numberof times)
Day Week Month
1 Caribou
2 Seal
3 Walrus
4 Muskox
5 Liver from caribou, seal or walrus
6 Polar bear
7 Muktuk
8 Seal fat or oil
9 Blubber
10 Rabbit
11 Ptarmigan
12 Geese
13 Ducks
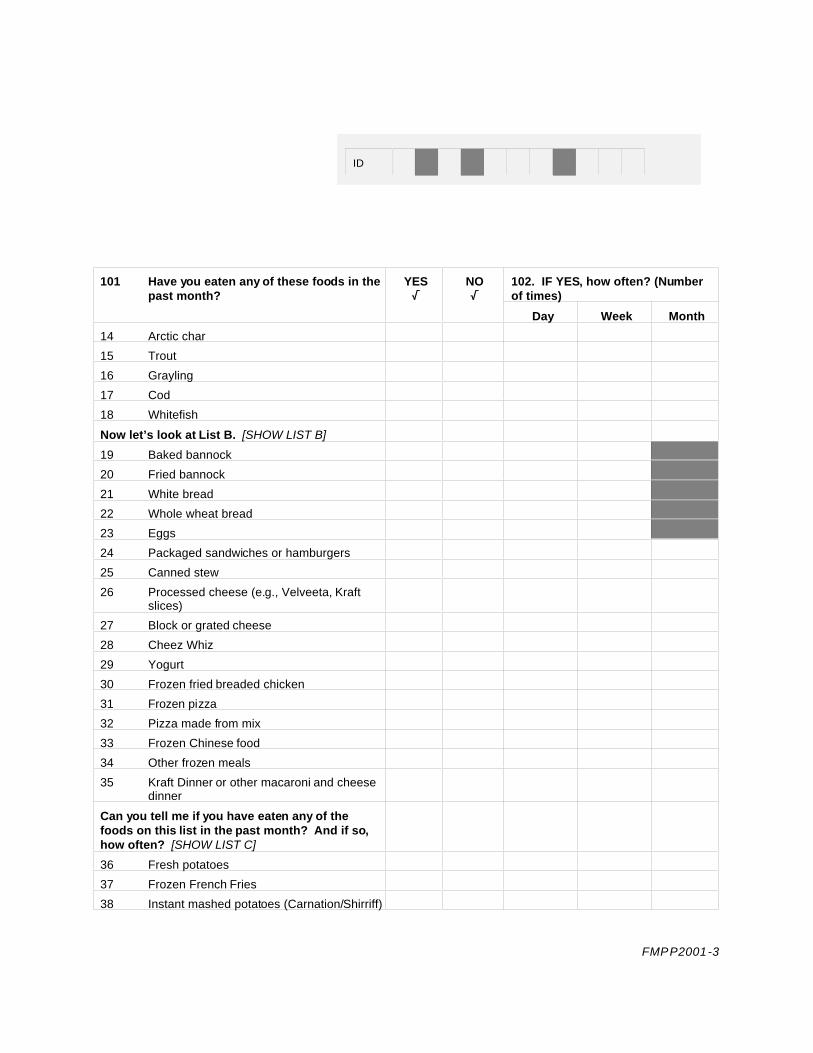
ID
FMPP2001-3
101 Have you eaten any of these foods in thepast month?
YES/
NO/
102. IF YES, how often? (Numberof times)
Day Week Month
14 Arctic char
15 Trout
16 Grayling
17 Cod
18 Whitefish
Now let’s look at List B. [SHOW LIST B]
19 Baked bannock
20 Fried bannock
21 White bread
22 Whole wheat bread
23 Eggs
24 Packaged sandwiches or hamburgers
25 Canned stew
26 Processed cheese (e.g., Velveeta, Kraftslices)
27 Block or grated cheese
28 Cheez Whiz
29 Yogurt
30 Frozen fried breaded chicken
31 Frozen pizza
32 Pizza made from mix
33 Frozen Chinese food
34 Other frozen meals
35 Kraft Dinner or other macaroni and cheesedinner
Can you tell me if you have eaten any of thefoods on this list in the past month? And if so,how often? [SHOW LIST C]
36 Fresh potatoes
37 Frozen French Fries
38 Instant mashed potatoes (Carnation/Shirriff)
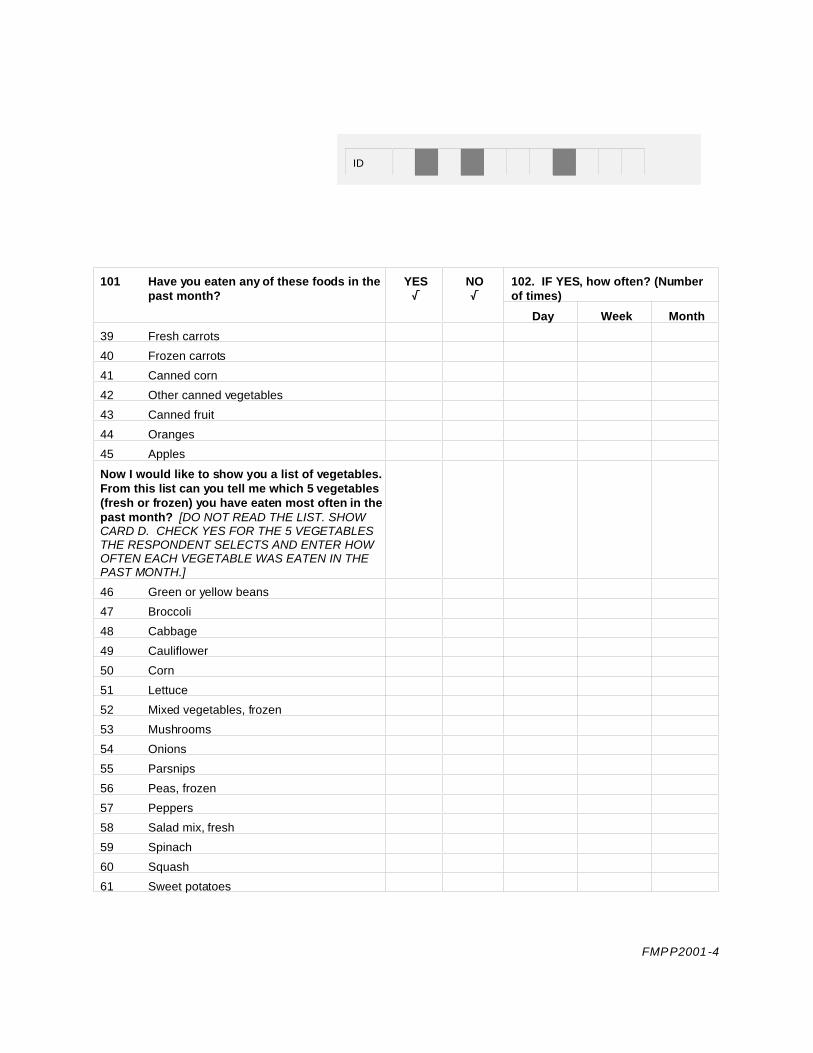
ID
FMPP2001-4
101 Have you eaten any of these foods in thepast month?
YES/
NO/
102. IF YES, how often? (Numberof times)
Day Week Month
39 Fresh carrots
40 Frozen carrots
41 Canned corn
42 Other canned vegetables
43 Canned fruit
44 Oranges
45 Apples
Now I would like to show you a list of vegetables. From this list can you tell me which 5 vegetables(fresh or frozen) you have eaten most often in thepast month? [DO NOT READ THE LIST. SHOWCARD D. CHECK YES FOR THE 5 VEGETABLESTHE RESPONDENT SELECTS AND ENTER HOWOFTEN EACH VEGETABLE WAS EATEN IN THEPAST MONTH.]
46 Green or yellow beans
47 Broccoli
48 Cabbage
49 Cauliflower
50 Corn
51 Lettuce
52 Mixed vegetables, frozen
53 Mushrooms
54 Onions
55 Parsnips
56 Peas, frozen
57 Peppers
58 Salad mix, fresh
59 Spinach
60 Squash
61 Sweet potatoes

ID
FMPP2001-5
[CHECK YES FOR THE 5 VEGETABLES THERESPONDENT SELECTS AND ENTER HOWOFTEN EACH VEGETABLE WAS EATEN IN THEPAST MONTH]
YES/
NO/
102. IF YES, how often? (Numberof Times)
Day Week Month
62 Tomatoes
63 Turnips
64 Other fresh or frozen vegetables (specify)
Now I would like to show you a list of fruit. Fromthis list can you tell me which 5 fruit (fresh orfrozen) you have eaten most often in the pastmonth? [DO NOT READ THE LIST. SHOW CARDE. CHECK YES FOR THE 5 FRUITS THERESPONDENT SELECTS AND ENTER HOWOFTEN EACH FRUIT WAS EATEN IN THE PASTMONTH.]
65 Bananas
66 Blueberries
67 Cantaloupe
68 Cherries
69 Grapefruit
70 Grapes
71 Kiwi
72 Peaches
73 Pears
74 Pineapple
75 Plums
76 Strawberries
77 Watermelon
78 Other fresh or frozen fruit
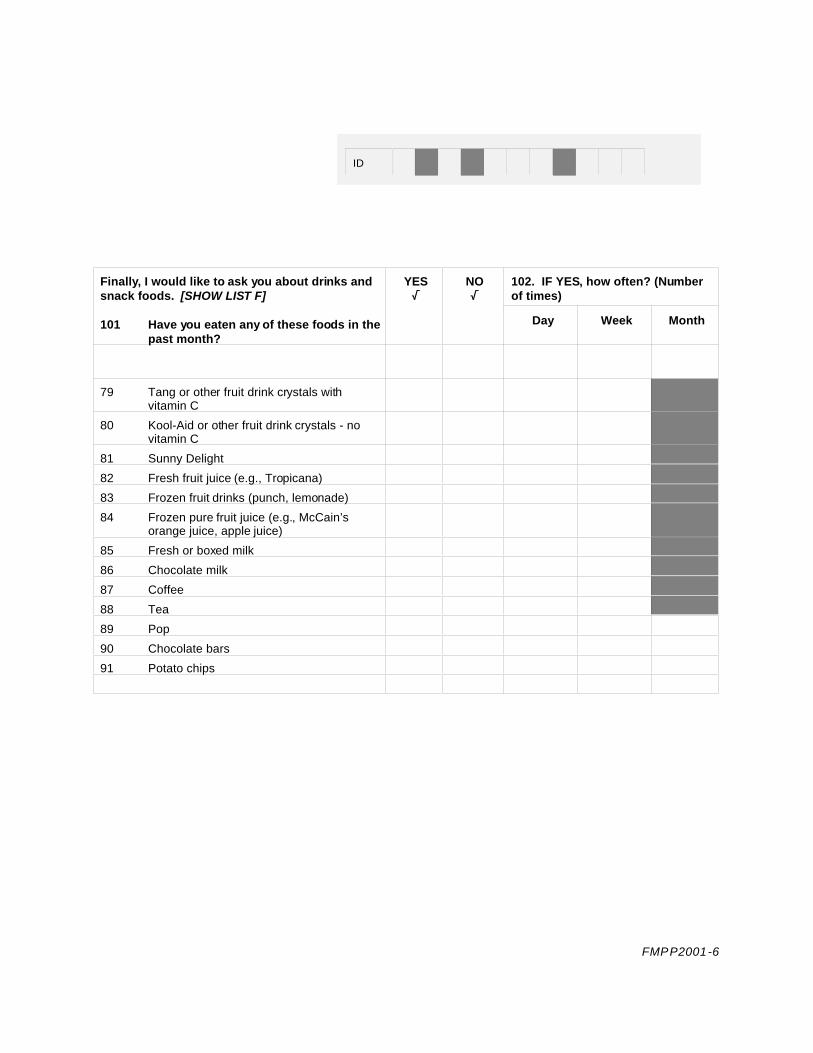
ID
FMPP2001-6
Finally, I would like to ask you about drinks andsnack foods. [SHOW LIST F]
101 Have you eaten any of these foods in thepast month?
YES/
NO/
102. IF YES, how often? (Numberof times)
Day Week Month
79 Tang or other fruit drink crystals withvitamin C
80 Kool-Aid or other fruit drink crystals - novitamin C
81 Sunny Delight
82 Fresh fruit juice (e.g., Tropicana)
83 Frozen fruit drinks (punch, lemonade)
84 Frozen pure fruit juice (e.g., McCain’sorange juice, apple juice)
85 Fresh or boxed milk
86 Chocolate milk
87 Coffee
88 Tea
89 Pop
90 Chocolate bars
91 Potato chips
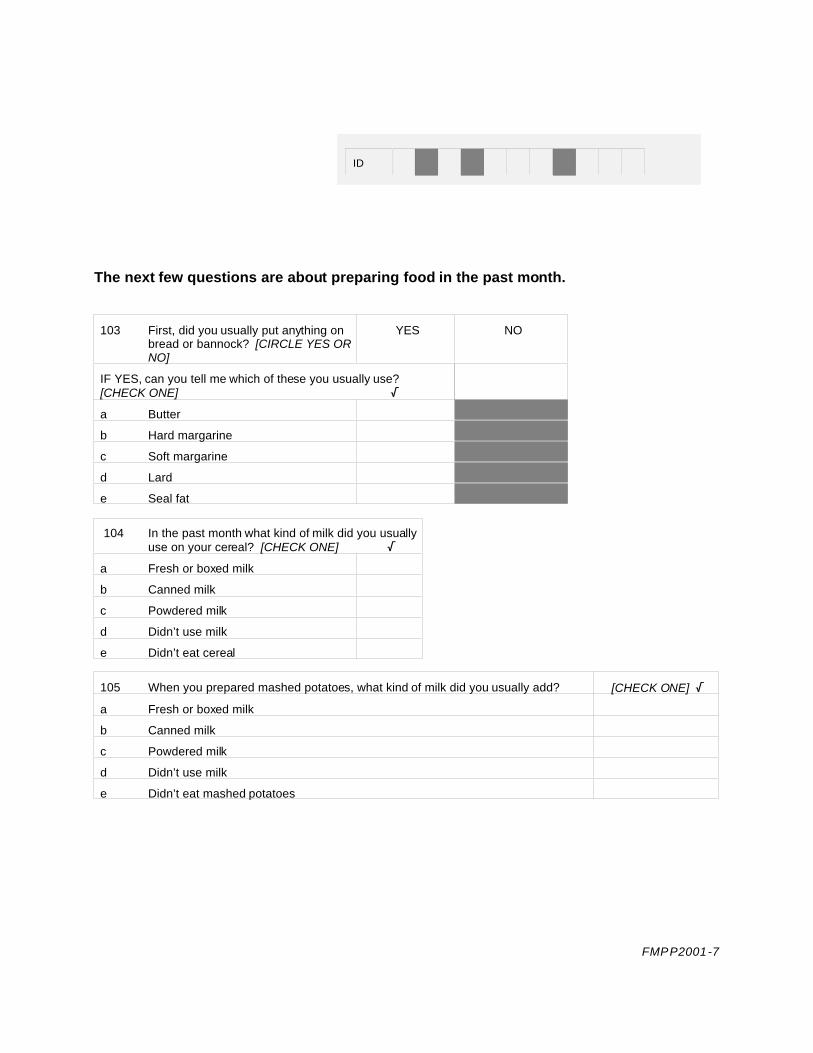
ID
FMPP2001-7
The next few questions are about preparing food in the past month.
103 First, did you usually put anything onbread or bannock? [CIRCLE YES ORNO]
YES NO
IF YES, can you tell me which of these you usually use?[CHECK ONE] /
a Butter
b Hard margarine
c Soft margarine
d Lard
e Seal fat
104 In the past month what kind of milk did you usuallyuse on your cereal? [CHECK ONE] /
a Fresh or boxed milk
b Canned milk
c Powdered milk
d Didn’t use milk
e Didn’t eat cereal
105 When you prepared mashed potatoes, what kind of milk did you usually add? [CHECK ONE] /
a Fresh or boxed milk
b Canned milk
c Powdered milk
d Didn’t use milk
e Didn’t eat mashed potatoes

ID
FMPP2001-8
106 What do you usually put in your tea and coffee? [CHECK ONE] /
a Fresh or boxed milk
b Canned milk
c Powdered milk
d Coffeemate
e Don’t use milk
f Sugar
107 In recipes, what kind of milk do you usually use? [CHECK ONE]
a. In bannock T b. In macaroni and cheese dinner T
I Fresh whole milk I. Fresh whole milk
ii Fresh or boxed 2% milk ii Fresh or boxed 2% milk
iii Powdered milk iii Powdered milk
iv Evaporated milk, mixed with water iv Evaporated milk, mixed with water
v Evaporated milk, no water v Evaporated milk, no water
vi Don't use milk vi Don't use milk
108 W hat do you usually use to make bannock? [CIRCLE ONE RESPONSE]
a Lardb Margarinec Butterd Seal fate Oilf Don’t make bannock
109 If you make bannock, what proportion of flour to (name of fat given above) do you use to make
bannock?
_______cups flour ______pounds/tablespoons fat

ID
FMPP2001-9
C. Health and Lifestyle
This section asks a few questions about your health and lifestyle.
200 Com pared to other people your age, would you say your health is excellent, very good, good, fair
or poor? [CIRCLE RESPONSE]
a excellentb very goodc goodd faire poor
201 Do you have any medical condition that affects what you eat? [CIRCLE RESPONSE]
1 YES 2 NO
If YES, please explain
202 Are you pregnant at the present time?
a YES
b NO
c Don’t know
d Refuse to answer
203 How long have you been pregnant? ________ months ___________ weeks
204 Are you presently breast-feeding? 1 YES 2 NO
Go to Q204
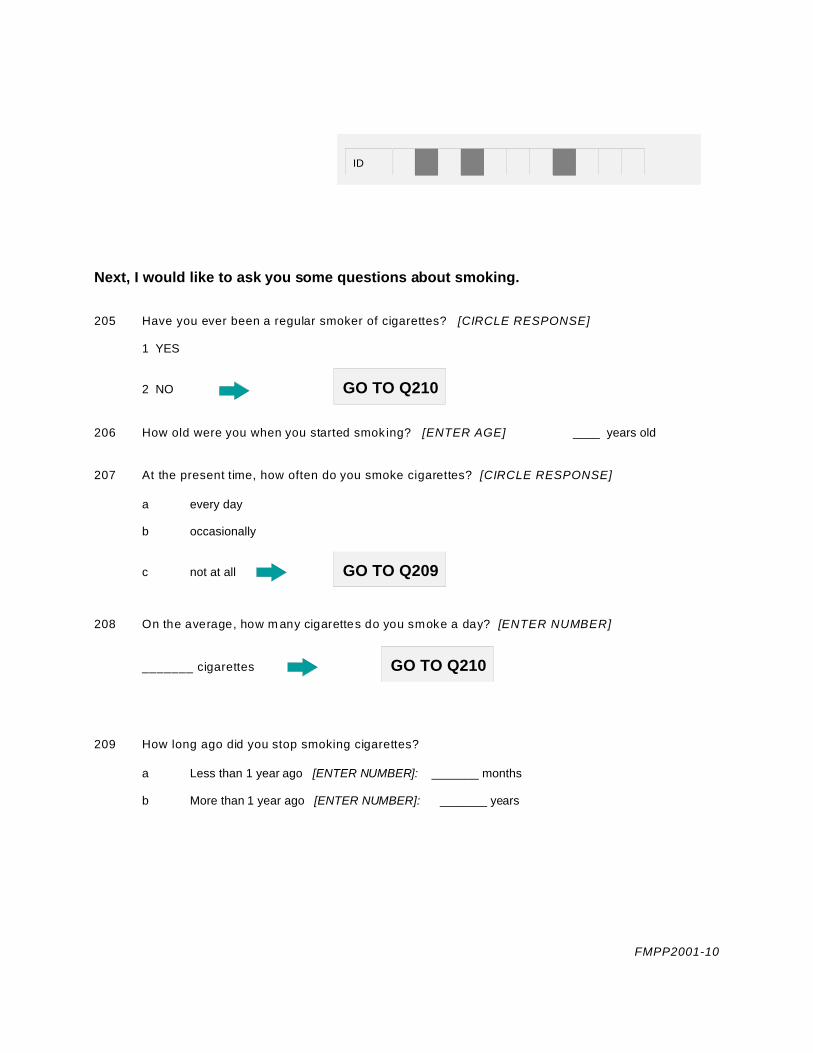
ID
FMPP2001-10
Next, I would like to ask you some questions about smoking.
205 Have you ever been a regular smoker of cigarettes? [CIRCLE RESPONSE]
1 YES
2 NO GO TO Q210
206 How old were you when you started smok ing? [ENTER AGE] ____ years old
207 At the present time, how often do you smoke cigarettes? [CIRCLE RESPONSE]
a every day
b occasionally
c not at all GO TO Q209
208 On the average, how m any cigarettes do you smoke a day? [ENTER NUMBER]
_______ cigarettes GO TO Q210
209 How long ago did you stop smoking cigarettes?
a Less than 1 year ago [ENTER NUMBER]: _______ months
b More than 1 year ago [ENTER NUMBER]: _______ years

ID
FMPP2001-11
The next few questions are about your current physical exercise.
210 W hich of the following statements best describes your activities for most days when you are in the
comm unity? [SHOW CARD AND READ LIST. CIRCLE ONE RESPONSE.]
a I am usually sitting and do not walk around very much.
b I stand or walk around quite a lot, but I do not have to carry or lift things very often.
c I usually lift or carry light loads or I have to climb stairs or hills often.
d I do heavy work or carry heavy loads.
211 In the past year, how much time would you say that you spent on the land (fishing, trapping,
hunting)? [DO NOT READ LIST, CIRCLE ONE RESPONSE]
a noneb less than 1 monthc 1 monthd 2 to 3 months
e 4 to 5 monthsf 6 monthsg more than 6 months
D. Demographic Information
To complete the study we need some personal information. Like the entire study, thisinformation is totally confidential.
300 First, what ethnic group do you belong to? [CIRCLE RESPONSE]
a Inuitb Other Aboriginalc Non-Aboriginal
301 W hat is your date of birth? ___________________________ 302 Age ____YRSMONTH DAY YEAR

ID
FMPP2001-12
Go to Household Questionnaire
In order to determine if women in this community are getting the food they need for goodhealth, we need to collect information on height, weight and waist/hip measurements. The nursing staff at the Health Centre have agreed to record this information in order tomake sure that the information is as accurate as possible.
303 W ould you be willing to go to the Health Centre on ________(date or day) to get your height,
weight and waist/hip measurements done? [CIRCLE RESPONSE]
1 YES 2 NO
304 IF NO, can you tell me your height and weight?
HEIGHT ____________cm OR ___________inches
W EIGHT ____________kg OR ___________pounds
305 Do you usually buy the food for your household?
1 YES
2 NO THANK YOU VERY MUCH FOR YOUR TIME AND COOPERATION. CAN I SPEAK TO THE PERSON WHO USUALLY BUYS THE FOOD?

Int. No. 24-Hour Diet Recall
DATE ______/_____/______ STARTING TIME_______AM/PM
M D Y
I would like to begin the interview by asking what you ate or drank over the past 24 hours. Let's begin with yesterday at this time. [ENTER C, M, OR F
IN THE "C/M/F" COLUMN IF THE FOOD ITEM WAS CANNED, FROM A MIX OR FROZEN. ENTER BRAND NAME IN DESCRIPTION COLUMN WHEN FOOD
IS A PREPARED PRODUCT. REVIEW LIST TWICE TO GET FULL DESCRIPTION AND AMOUNTS AND TO PROMPT MEMORY. ENTER RECIPES AND
NUTRITION SUPPLEMENTS AND TIME FINISHED ON BACK OF PAGE. REMEMBER TO LEAVE SPACES BETW EEN MEALS SO THAT EXTRAS CAN BE
ADDED LATER.]
TIME AM/PM
C/M/F
DESCRIPTION OF FOOD ITEM # OFPORTIONS
DESCRIPTION OFPORTIONS
Model orMeasure
Thickness(cm)

C means canned; M means made from a mix; F means frozen.

List of Nutrition Supplements
Did you take any vitamin, mineral or other nutrition supplements yesterday? [CIRCLE RESPONSE] YES/NO
If so, may I please see the label? [RECORD THE BRAND NAME AND THE DRUG IDENTIFICATION NUMBER (DIN).] What is the usualamount taken each time? How many of these did you take yesterday? How often do you usually take this (times per day/week/month)?[INCLUDE: VITAMIN/MINERAL SUPPLEMENTS (E.G., CALCIUM, IRON, MATERNA); TONICS; ROLAIDS; TUMS; HERBAL PREPARATIONS]
Nutrition Supplement
DESCRIPTION
DIN # [CHECKLABEL]
Quantity prescribed orusual amount taken
each time (e.g., 150 mg,1 tsp) [CHECK LABEL]
Amount taken inlast 24 hrs
How often do you usually take this? [ENTER TIMES PER DAY, WEEK OR MONTH]
Day Week Month

NOTE: TIME FINISHED:______AM / PM
RECIPE #1 RECIPE #2
Name of recipe:___________________Total number of servings____ Name of recipe:________________Total number of servings______
Description of ingredients and cooking method Quantity Description of ingredients and cooking method Quantity
How was it cooked? Circle one of the following: (boil, bake, roast, stew,
fry, microwave). For how long?______min _____hours
How was it cooked? Circle one of the fo llowing: (boil, bake, roast, stew, fry,
microwave). For how long?______min _____hours

APPENDIX B – HOUSEHOLD QUESTIONNAIRE

House Numb er
Interviewer Number
Note to interviewer: Please enter date and starting time DAY__ MONTH__YEAR:________AM /PM__________
Household Questionnaire
Kugaaruk Food Mail Pilot Project
2001
Note to interviewer: Please enter time when the interview is complete and circle AM or PM): _______AM / PM

House Numb er
FMPP2001-1
[PLEASE NOTE THAT ONLY THE PERSON WHO USUALLY BUYS MOST OFTHE FOOD SHOULD COMPLETE THIS QUESTIONNAIRE]
A. HOUSEHOLD COMPOSITION, ACCESS TO COUNTRY FOOD AND COMMUNITYCONCERNS
Let’s begin with a few questions about your household.
400 Can you tell me how many Inuit and non-Inuit adults are living in this household?
Age Group 1. Can you tell me how manyare Inuit?
2. Can you tell me howmany are non-Inuit?
a Between the ages of 18 and 44?
b Between the ages of 45 and 59?
c Between 60 and 64?
d And age 65 and over?
401 Can you tell me how many persons AGED 17 OR UNDER live in this house and their ages?[INDICATE THE NUMBER OF PEOPLE IN EACH AGE GROUP IN THE SECOND ROW OFTHE APPROPRIATE COLUMN.]
Age <
1
1 2 3 4 5 6 7 8 9 10 11 12 13 14 15 16 17
No.
402 Is your household able to get country food most of the time? [CIRCLE RESPONSE]
YES
NO
Don’t know

House Numb er
FMPP2001-2
403 IF YOU CANNOT GET COUNTRY FOOD, can you tell me why? [DO NOT READ REASONS.WRITE THE NUMBER OF THE FIRST 3 REASONS IN THE SPACES BELOW. IFNECESSARY, PROMPT BY ASKING “WERE THERE ANY OTHER REASONS?”]
1. No transportation 6. Repairs too expensive
2. No hunter or fisherman in the household 7. Country food not available
3. Hunter or fisherman in family is sick/ injured
8. Food is not shared in the community
4. Hunter or fisherman is working, so doesn’t have time to hunt
9. Have nowhere to store country food
5. Gas too expensive 10. No hunting or fishing equipment
11. Other, explain
Reason 1. Reason 2. Reason 3.
404 First, I would like to read a list of events or problems that may affect you and your community. For each one, please tell me if you are not concerned, a little concerned, or extremely concernedabout this problem at the present time. [READ EACH PROBLEM AND CIRCLE 1, 2 OR 3 FOREACH PROBLEM]
Not
concerned
A little
concerned
Extrem ely
concerned
a. Alcohol or drug abuse 1 2 3
b. Not having enough m oney for food 1 2 3
c. Not being able to get c ountry food 1 2 3
d. The safety of country food 1 2 3
e. Family violence 1 2 3
f. Not enough jobs in the com munity 1 2 3

House Numb er
FMPP2001-3
B. FOOD PURCHASING
Now I would like to talk about where you usually buy your food.
500 Where do you usually buy most of your food? From the Coop, from Yellowknife byFood Mail, or from the south by air cargo?
1 Coop 2 Food Mail 3 Air Cargo 4 Other (specify)
a. Store meat? 9 9 9 9
b. Fresh fruit? 9 9 9 9
c. Fresh vegetables? 9 9 9 9
d. Frozen food? 9 9 9 9
e. Fresh milk? 9 9 9 9
501 Do you ever buy any country food from the coop? 1 YES 2 NO
502 Did you get a barge order this year? 1 YES 2 NO

House Numb er
FMPP2001-4
Now I would like to talk about the quality of the food SOLD in Kugaaruk.
503 How would you describe the quality of the following kinds of food sold in yourcommunity IN THE PAST 4 WEEKS? Would you say it was poor, fair, good orexcellent? [DO NOT READ DON’T KNOW OR NOT AVAILABLE. CHECK, IF THIS ISTHE RESPONSE].
1 Poor 2 Fair 3 Good 4 Excellent DK NA
a. Apples G G G G G G
b. Oranges G G G G G G
c. Bananas, grapes G G G G G G
d. Potatoes G G G G G G
e. Carrots, onions,
turnips, cabbage G G G G G G
f. Lettuce, tomatoes
peppers G G G G G G
g. Broccoli, cauliflower G G G G G G
h. Bread G G G G G G
i. Eggs G G G G G G
j. Fresh milk G G G G G G
k. Frozen store meat G G G G G G
l. Frozen vegetables G G G G G G
m. Other frozen food G G G G G G

House Numb er
FMPP2001-5
504 Is there enough variety of fresh fruit and vegetables available in Kugaaruk?... Always,most of the time, sometimes or never? [DO NOT READ DON’T KNOW BUT CHECK IFTHIS IS THE ANSWER]
G Always G Most of the time G Sometimes G Never GDon’t know
505 Compared to this time last year, have you noticed that the price of fresh fruits andvegetables is higher, lower or the same? [DO NOT READ DON’T KNOW. CHECKRESPONSE]
G Higher G Lower G Same, no change G Don’t know
506 Here is a list of reasons people sometimes give for not buying fresh fruit and vegetables. What is keeping you from buying more of these foods? [SHOW CARD, READ LIST,CHECK ALL THAT APPLY]
9 They cost too much 9 Don’t like the taste
9 Poor quality 9 Too much trouble to cook them
9 Not enough variety 9 Don’t need these foods to be healthy
9 Often not available 9 Already eat a lot of these foods
9 Don’t know how to use them 9 Can’t digest these foods
9 They don’t keep well at home 9 Can’t afford them
9 Prefer canned products 9 Prefer frozen products
9 Another reason:____________________

House Numb er
FMPP2001-6
Now I would like to ask you about WHICH foods you have purchased IN THE PAST 4WEEKS.
507 First, can you tell me which of the following foods have you bought IN THE PAST 4WEEKS? [SHOW PICTURES OR CARD, READ LIST AND CHECK ALL THAT APPLY]
Fresh fruit: G Apples G Oranges G Bananas G Grapes G Berries
G Kiwi G Plums G Melons G Grapefruit G Watermelon
G Other (specify)
Fresh vegetables: G Lettuce G Broccoli G Tomatoes G Cauliflower G Turnips
G Cabbage G Onions G Peppers G Carrots G Potatoes
G Cucumber G Celery G Squash G Spinach G Mushrooms
Milk products: G Fresh milk G Boxed milk G Cheese G Yogurt
G Ice cream
G Powdered milk G Evaporated milk
Frozen food: G Store meat G Frozen pizza G Frozen meals
G French fries G Frozen mixed vegetables
G Other frozen vegetables
G Frozen fruit drinks (e.g., lemonade, fruit punch)
G Frozen pure fruit juice (e.g., McCain’s orange juice or apple juice)
Country Food G Caribou G Muskox G Seal
G Arctic Char G Muktuk G_____________

House Numb er
FMPP2001-7
C. FOOD SECURITY
This section asks questions about being able to afford food for your household. Some ofthe questions are very personal and may be difficult for you to answer. However, thisinformation will help community and health leaders to have a better understanding ofproblems facing families in this community and to design better programs to help. Likethe rest of the questionnaire, this information is strictly confidential and no names will bereleased to the community or government. You are free to refuse to answer anyquestion, but your answers may be able to help others in Kugaaruk and other Inuitcommunities.
I would like to read a series of statements that describe the experience of some families. I will also give you a card, so that you can read the statement and decide if it describesyour experience.

House Numb er
FMPP2001-8
The first statements are about the food eaten in your household in the last 12 months and whether youwere able to afford the food you need. For each of these statements, please tell me whether thishappened often, sometimes or never for your household in the last 12 months. [GIVE FOOD SECURITYCARD TO RESPONDENT SO THAT THEY CAN READ EACH STATEMENT.]
600 Some families might say, “We worried whether our food would run out before we gotmoney to buy more.” In the last 12 months, did that happen often, sometimes, or never foryour household?
a Often [ ]b Sometimes [ ]c Never [ ]d Don’t know or refused [ ]
601 Some families might say, “The food that we bought just didn’t last, and we didn’t havemoney to get more.” In the last 12 months did that happen often, sometimes, or never for yourhousehold?
a Often [ ]b Sometimes [ ]c Never [ ]d Don’t know or refused [ ]
602 Some families might say, “We couldn’t afford to eat healthy meals.” In the last 12 monthsdid this happen often, sometimes, or never for your household?
a Often [ ]b Sometimes [ ]c Never [ ]d Don’t know or refused [ ]
[IF CHILDREN UNDER 18 IN HOUSEHOLD, ASK Q603 AND Q604; OTHERWISE SKIP TO 1ST LEVELSCREEN]
603 Some families might say,“We could only feed our children less expensive foods because wewere running out of money to buy food.” In the last 12 months did this happen often,sometimes, or never for your household?
a Often [ ]b Sometimes [ ]c Never [ ]d Don’t know or refused [ ]
604 Some families might say,“We couldn’t feed our children a healthy meal, because wecouldn’t afford that.” In the last 12 months, did that happen often, sometimes, or never foryour household?
a Often [ ]b Sometimes [ ]c Never [ ]d Don’t know or refused [ ]
[1ST LEVEL SCREEN (SCREENER FOR STAGE 2): IF THE RESPONDENT ANSWERS “OFTEN ORSOMETIMES” TO ANY ONE OF QUESTIONS 600 TO 604, THEN CONTINUE TO STAGE 2,OTHERWISE SKIP TO Q620]

House Numb er
FMPP2001-9
Go to Q608
STAGE 2: [IF CHILDREN UNDER 18 IN HOUSEHOLD, ASK Q 605; IF NOT, SKIP TO Q606]
605 Some families might say,“The children were not eating enough because we just couldn’tafford enough food.” In the last 12 months, did this happen often, sometimes, or never foryour household?
a Often [ ]b Sometimes [ ]c Never [ ]d Don’t know or refused [ ]
606 Since October last year, did you or other adults in your household ever cut the size of your mealsor skip meals because there wasn’t enough money for food?
a YES [ ]
b NO [ ]
c Don’t know [ ]
607 [IF YES ABOVE, ASK] How often did this happen...almost every month, some months but notevery month, or in only 1 or 2 months?
a Almost every month [ ]b Some months but not every month [ ]c Only 1 or 2 months [ ] d Don’t know [ ]
608 In the last 12 months, did you ever eat less than you felt you should because there wasn’t enoughmoney to buy food?
a YES [ ]b NO [ ]c Don’t know [ ]
609 In the last 12 months, were you ever hungry but didn’t eat because you couldn’t afford enoughfood?
a YES [ ]b NO [ ]c Don’t know [ ]
610 In the last 12 months, did you lose weight because you didn’t have enough money for food?
a YES [ ]b NO [ ]c Don’t know [ ]
2ND LEVEL SCREEN (SCREENER FOR STAGE 3): IF RESPONDENT ANSWERED YES TO ANY OFABOVE QUESTIONS, THEN CONTINUE TO STAGE 3; OTHERWISE GO TO Q620]

House Numb er
FMPP2001-10
Skip Q612
Go to Q616
STAGE 3:
611 In the last 12 months, did you or other adults in your household ever not eat for a whole daybecause there wasn’t enough money for food?
a YES [ ]
b NO [ ]
c Don’t know [ ]
612 [IF YES ABOVE, ASK] How often did this happen ...almost every month, some months but notevery month, or only in 1 or 2 months?
a Almost every month [ ]b Some months but not every month [ ]c Only 1 or 2 months [ ] d Don’t know [ ]
[NOTE: IF CHILDREN UNDER 18 IN HOUSEHOLD, ASK Q613 TO Q617; OTHERWISE SKIP TOQ618]
The next questions are about persons living in the household who are under 18 years ofage.
613 In the last 12 months (since October of last year), did you ever cut the size of their mealsbecause there wasn’t enough money for food?
a YES [ ]b NO [ ]c Don’t know [ ]
614 In the last 12 months, did any of the children ever skip meals because there wasn’t enoughmoney for food?
a YES [ ]
b NO [ ]
c Don’t know [ ]
615 [IF YES ABOVE, ASK] How often did this happen...almost every month, some months but notevery month, or in only 1 or 2 months?
a Almost every month [ ]b Some months but not every month [ ]c In only 1 or 2 months [ ] d Don’t know [ ]

House Numb er
FMPP2001-11
616 In the last 12 months, were the children ever hungry but you just couldn’t afford more food?
a YES [ ]b NO [ ]c Don’t know [ ]
617 In the last 12 months, did your children ever not eat for a whole day because there wasn’t enoughmoney for food?
a YES [ ]b NO [ ]c Don’t know [ ]
[ASK Q618 IF RESPONDENT ANSWERED YES TO ANY OF QUESTIONS 605 to 617. OTHERWISEGO TO Q620]
618 I would like to ask you about why your household was unable to afford enough food. Can you tellme the main reason? [DO NOT READ REASONS. WRITE NUMBER OF FIRST 3 REASONS INTHE SPACES BELOW. IF NECESSARY, PROMPT BY ASKING, “WERE THERE ANY OTHERREASONS?”]
a. Not working
b. Waiting for EI (Employment insurance) or social assistance
c. Not enough income
d. Spent money on medicine
e. Gave money away
f. Gave food away to others in the community
g. Had to buy hunting, fishing or trapping equipment, supplies or gas
h. Had to pay bills (like hydro, children’s clothing, school supplies)
i. Spent money gambling
j. Food costs too much
k. Don’t know or refuse
l. Other, explain_______________________________________
Reason 1. Reason 2. Reason 3.

House Numb er
FMPP2001-12
[ASK Q619 IF RESPONDENT ANSWERED YES TO ANY OF QUESTIONS 605 to 617. OTHERWISEGO TO Q620]
619 When your household was unable to afford enough food, what did you do? [DO NOT READCATEGORIES. WRITE NUMBER OF FIRST THREE ACTIONS IN SPACES BELOW.]
a. Ask for more social assistance (welfare/income support)
b. Ask store manager for more credit
c. Borrow food or money for food from friends or family
d. Go hunting or fishing
e. Ask help from CHR, nurse or doctor
f. Do without
g. Make an item to sell
h. Other, explain_____________________________________________
Action 1. Action 2. Action 3.
[IF CHILDREN UNDER 5 IN THE HOUSEHOLD, ASK Q620, OTHERWISE GO TO Q621]
620 During the past month, did any of the children in this household receive breakfast, lunch orsnacks at day care, a pre-school program or kindergarten? [CIRCLE RESPONSE]
a YESb NOc Don’t know
[IF CHILDREN BETWEEN 6 AND 17 IN THE HOUSEHOLD, ASK Q621, OTHERWISE GO TO SECTION D]
621 During the past month, did any of the children in this household receive breakfast, lunch orsnacks at school? [CIRCLE RESPONSE]
a YESb NOc Don’t know

House Numb er
FMPP2001-13
GO to Q705
Finally, to complete the questionnaire, we need to ask a few questions about householdincome and expenses.
D. EMPLOYMENT, INCOME AND EXPENSES
700 Has anyone in your household received assistance from the Hunter Support Program? [CIRCLERESPONSE]
1 YES 2 NO 3 Don’t know
701 Can you tell me how many members of your household presently:
a) Earn money from selling furs or sealskins?
b) Earn money from selling crafts (e.g., carvings, sewing, jewelry, etc.)
c) Have a job or business?
d) Receive a pension?
702 In the past month, did anyone in your household receive money from Employment Insurance (EIor UI)? [CIRCLE RESPONSE]
1. YES 2. NO 3. Don’t know
703 In the past month, did anyone in your household receive social assistance (welfare/incomesupport)? [CIRCLE RESPONSE]
1. YES
2. NO
3. Don’t know

House Numb er
FMPP2001-14
704 Can you tell me APPROXIMATELY the total amount of money received in the past 4 weeks by ALL household members from all sources (e.g. take-home pay from a job, money from sellingfurs, sealskins, carvings or crafts, pensions, net income from running a business andEmployment Insurance)? [SHOW CARD TO PARTICIPANT TO REMIND HIM\HER OFDIFFERENT SOURCES OF INCOME AND ASK IF HE\SHE CAN TELL YOU ABOUT HOWMUCH INCOME WAS RECEIVED FOR PAST 4 WEEKS. CIRCLE THE CATEGORY WHICHBEST DESCRIBES THIS AMOUNT. DO NOT INCLUDE CHILD TAX CREDIT.]
a. No income f. $4001 to $5000
b. $1500 or less g. $5001 to $6000
c. $1501 to $2000 h. Over $6000
d. $2001 to $3000 i. Don’t know
e. $3001 to $4000 j. Refuse to answer
705 Was your income last month, the same as other months? [CIRCLE RESPONSE]
a YESb NO, more than usualc NO, less than usuald Don't know
706 Can you tell me approximately how much your household usually spends in an average week onfood (including food purchased from grocery stores and the hotel)? $________
707 Last month approximately how much did you pay for rent, mortgage, electricity, heating fuel, gas,water and sewage, garbage, skidoo parts and oil, bullets, naphtha and material?
$___________
The Survey is now complete.
Thank you for your cooperation