Embed Size (px)
Citation preview
NUTRIENTS IN LAKES AND RESERVOIRS – A LITERATURE REVIEW FOR USE IN NUTRIENT CRITERIA
DEVELOPMENT
VIRGINIA POLYTECHNIC INSTITUTE AND STATE UNIVERSITY BLACKSBURG, VIRGINIA
2007
NUTRIENTS IN LAKES AND RESERVOIRS – A LITERATURE REVIEW FOR USE IN NUTRIENT CRITERIA
DEVELOPMENT
Grant No. 06HQGR0021
Submitted to: Ms. Tiffany Crawford U.S. EPA Region III
Submitted by: Dr. Tamim Younos
Virginia Water Resources Research Center Virginia Tech
August 24, 2007
Authors: J. L. Walker T. Younos
C. E. Zipper
VWRRC Special Report SR34-2007
Funding for this review was provided by the U.S. Environmental Protection Agency, Region 3 through a collaboration of the Department of the Interior, USGS and the Virginia Polytechnic
Institute and State University under Grant Agreement No. 06HQGR0021. The views and conclusions contained in this document are those of the authors and should not be interpreted as
necessarily representing the official policies, either expressed or implied, of the U.S. Government or the Virginia Water Resources Research Center. The mention of commercial products, trade names, or services does not constitute an endorsement or recommendation.
This report is available online. Hard copies may be obtained from the Virginia Water Resources Research Center for a small fee.
210 Cheatham Hall (0444) Virginia Tech
Blacksburg, VA 24061 (540)231-5624
FAX: (540)231-6673 E-mail: [email protected]
Website: http://www.vwrrc.vt.edu
Stephen Schoenholtz, Director
Virginia Tech does not discriminate against employees, students, or applicants on the basis of race, color, sex, sexual orientation, disability, age, veteran status, national origin, religion, or political affiliation. Anyone having questions
concerning discrimination should contact the Equal Opportunity and Affirmative Action Office.
i
TABLE OF CONTENTS page
MAJOR SECTION CONTRIBUTORS …………………………………………………… ACKNOWLEDGMENTS ………………………………………………………………….. ACRONYMS AND ABBREVIATIONS …………………………………………………... EXECUTIVE SUMMARY …………………………………………………………………. SECTION I — BACKGROUND INFORMATION ……………………………………… SECTION I-A. INTRODUCTION …………………………………………………………
1. Purpose ………………………………………………………………………………...2. Characteristics of Lakes ……………………………………………………………... 3. Characteristics of Reservoirs ………………………………………………………... 4. Trophic State ………………………………………………………………………….
SECTION I-B. NUTRIENT INPUT AND FATE IN LAKES AND RESERVOIRS ……1. Phosphorus …………………………………………………………………………… 2. Nitrogen ………………………………………………………………………………. 3. Nutrient Limitation …………………………………………………………………... 4. Primary Production in Lakes and Reservoirs ………………………………………
SECTION I-C. PROBLEMS ASSOCIATED WITH EXCESS NUTRIENTS IN LAKES AND RESERVOIRS ………………………………………………………………
1. Dissolved Oxygen Depletion …………………………………………………………. 2. pH Fluctuations ………………………………………………………………………. 3. Release of Toxins ……………………………………………………………………... 4. Changes in the Aquatic Life Community …………………………………………... 5. Production of Disinfection Byproducts in Drinking Water ………………………..
SECTION II — WHAT WE KNOW ……………………………………………………… SECTION II-A. DIFFERENCES BETWEEN NATURAL LAKES AND RESERVOIRS ……………………………………………………………………………….
1. Differences in Nutrient Input, Cycling, and Export ……………………………….. 2. Differences in Primary Production Levels ………………………………………….. 3. Differences in Modeling Nutrient-Related Processes ………………………………
SECTION II-B. IMPOUNDMENT ISSUES THAT AFFECT NUTRIENTS …………...
1. Dam Effects …………………………………………………………………………… 2. Sedimentation ………………………………………………………………………… 3. Internal Loading ……………………………………………………………………... 4. Multipurpose Uses …………………………………………………………………….
iii
iv
v
vii
1
12346
7899
13
151617181818
20
20212224
2525262829
ii
SECTION II-C. ESTIMATING RESIDENCE TIME AND ITS IMPORTANCE IN NUTRIENT CRITERIA DEVELOPMENT ……………………………………………… SECTION II-D. RELATIONSHIP BETWEEN FISHERIES AND NATURAL COMMUNITY ………………………………………………………………………………
1. Overview ……………………………………………………………………………… 2. Water Quality in Reservoirs ………………………………………………………… 3. Reservoir Fisheries and Water Quality …………………………………………….. 4. Fisheries in Reservoirs in Virginia …………………………………………………..
SECTION II-E. RECREATIONAL USER PERCEPTIONS OF LAKE/RESERVOIR WATER QUALITY …………………………………………………………………………
1. General Findings ……………………………………………………………………... 2. Conclusions ……………………………………………………………………………
SECTION II-F. DOWNSTREAM EFFECTS OF LAKES AND RESERVOIRS ………
1. Impacts on Nutrient Levels ………………………………………………………….. 2. Impacts on Production Levels ………………………………………………………. 3. Impacts on Dissolved Oxygen and Temperature Levels …………………………...
SECTION III — TOWARD DEVELOPING NUTRIENT CRITERIA ………………… SECTION III-A. POSSIBLE VARIABLES FOR DETERMINING NUTRIENT IMPAIRMENT ………………………………………………………………………………
1. Phosphorus Concentrations …………………………………………………………. 2. Nitrogen Concentrations …………………………………………………………….. 3. Chlorophyll-a Concentrations ………………………………………………………. 4. Transparency Measurements ……………………………………………………….. 5. Trophic State Indices ………………………………………………………………… 6. Dissolved Oxygen Concentrations …………………………………………………...
SECTION III-B. MANAGEMENT ISSUES ………………………………………………
SECTION III-C. VARIOUS APPROACHES TO DEVELOPING NUTRIENT CRITERIA …………………………………………………………………………………...
1. U.S. EPA’s Approach ………………………………………………………………... 2. Minnesota’s Approach ………………………………………………………………. 3. Virginia’s Approach …………………………………………………………………. 4. Arizona’s Approach ………………………………………………………………….. 5. An Alternative Approach …………………………………………………………….
REFERENCES ………………………………………………………………………………
30
3132323436
383942
43434446
47
47474748494951
53
545458677279
81
iii
MAJOR SECTION CONTRIBUTORS Jane L. Walker, Virginia Water Resources Research Center, Virginia Polytechnic Institute and State University (AAC-VDEQ):*
Section I-A. Introduction Section I-B. Nutrient Input and Fate in Lakes and Reservoirs Section I-C. Problems Associated With Excess Nutrients in Lakes and Reservoirs Section II-A. Differences Between Natural Lakes and Reservoirs Section II-B. Impoundment Issues That Affect Nutrients Section II-C. Estimating Residence Time and Its Importance in Nutrient Criteria
Development Section II-F. Downstream Effects of Lakes and Reservoirs Section III-A. Possible Variables for Determining Nutrient Impairment Section III-B. Management Issues Section III-C. Various Approaches To Developing Nutrient Criteria
John J. Ney, Department of Fisheries and Wildlife Sciences, Virginia Polytechnic Institute and State University (retired) (AAC-VDEQ):*
Section II-D. Relationship Between Fisheries and Natural Community Section III-C. Various Approaches To Developing Nutrient Criteria (Virginia’s Approach)
Kurt Stephenson: Department of Agriculture and Applied Economics, Virginia Polytechnic Institute and State University (AAC-VDEQ):*
Section II-E. Recreational User Perceptions of Lake/Reservoir Water Quality Carl E. Zipper: Department of Crop and Soil Environmental Sciences, Virginia Polytechnic Institute and State University (AAC-VDEQ):*
Section I-A. Introduction Section I-B. Nutrient Input and Fate in Lakes and Reservoirs (Cyanobacteria) Section III-C. Various Approaches To Developing Nutrient Criteria (Virginia’s Approach)
Tamim Younos: Virginia Water Resources Research Center, Virginia Polytechnic Institute and State University (AAC-VDEQ):*
Section III-C. Various Approaches to Developing Nutrient Criteria (Virginia’s Approach), and overall document outline and document review. * Academic Advisory Committee for the Virginia Department of Environmental Quality
iv
ACKNOWLEDGMENTS Thank you to the U.S. Environmental Protection Agency, Region 3 for funding this project. We also appreciate the support and collaboration of the Department of the Interior, USGS and the Virginia Polytechnic Institute and State University under Grant Agreement No. 06HQGR0021. Numerous discussions held by the Academic Advisory Committee (ACC) for the Virginia Department of Environmental Quality (VDEQ) have provided an understanding of the nutrient criteria development process and requirements. We are grateful to the scientists who dedicate their time and energy in service to the ACC. Sections of this review were extracted from reports by the ACC (archived under “Publications, Special Reports” at www.vwrrc.vt.edu), particularly:
-- Section II-D. Relationship Between Fisheries and Natural Community by John J. Ney, Department of Fisheries and Wildlife Sciences, Virginia Polytechnic Institute and State University (from Zipper et al. 2005); and -- Section II-E. Recreational User Perceptions of Lake/Reservoir Water Quality by Kurt Stephenson, Department of Fisheries and Wildlife Sciences, Virginia Polytechnic Institute and State University (from Zipper et al. 2005).
We are also thankful to the many individuals within VDEQ’s Water Quality Program, particularly Mr. Alan Pollock and Ms. Jean Gregory, for their support of the work of the AAC and their assistance with AAC activities. Special thanks are extended to the following individuals:
-- Clifton F. Bell (Malcolm Pirnie, Inc.) and Susan T. Fitch (Arizona Department of Environmental Quality) for reviewing “Arizona’s Approach;” -- Jean W. Gregory (Virginia Department of Environmental Quality) for providing sources of information concerning approaches being taken in other states and for reviewing “Virginia’s Approach;” -- Steven A. Heiskary (Minnesota Pollution Control Agency) for reviewing “Minnesota’s Approach;” -- Melissa A. Kenney (Duke University) for reviewing “An Alternative Approach;” -- John Shearer and Mike Paterson (Experimental Lakes Area, Fisheries & Oceans Canada) for providing a photo of Lake 226 (Figure I-2); -- Ana Constantinescu (Virginia Water Resources Research Center) for assistance with figures and tables; and -- Alan L. Raflo (Virginia Water Resources Research Center) for providing sources of literature for the review and for reviewing several sections.
Thank you to the following for allowing the inclusion of figures or tables from their publications:
-- American Fisheries Society -- Arizona Department of Environmental Quality -- Awwa Research Foundation -- Fisheries and Oceans Canada, Experimental Lakes Area -- Malcolm Pirnie, Inc. -- Minnesota Pollution Control Agency -- U.S. Environmental Protection Agency -- Waveland Press, Inc.
v
ACRONYMS AND ABBREVIATIONS A&W: aquatic life and wildlife AAC: Academic Advisory Committee ac: acre ADEQ: Arizona Department of Environmental Quality Agg Ecor: aggregate nutrient ecoregion AlCl3: aluminum chloride APHA: American Public Health Association ATP: adenosine tri-phosphate Ca(NO3)2: calcium nitrate CDC: Centers for Disease Control CHF: Central Hardwood Forests Chl-a: chlorophyll-a CO2: carbon dioxide d: day DNA: deoxyribonucleic acid DO: dissolved oxygen DWS: domestic water source EPA: U.S. Environmental Protection Agency FBC: full-body contact Fe2+: ferrous ion or iron (II) Fe3+: ferric ion or iron (III) FeCl3: iron chloride ha: hectare HCO3
-: hydrogen carbonate ion (bicarbonate ion) H2CO3: carbonic acid HPLC: high pressure liquid chromatography kg/ha: kilograms per hectare L: liter m: meter μg/L: micrograms per liter (1 μg/L = 0.001 mg/L = 1 ppb = 1 mg/m3) mg: milligrams mg/m3: milligrams per cubic meter (1 mg/m3 = 0.001 mg/L = 1 ppb = 1µg/L) mL: milliliters mg/L: milligrams per liter (1 mg/L = 1,000 μg/L or 1,000 mg/m3) MPCA: Minnesota Pollution Control Agency n: number of observations in a sample (sample size) N: nitrogen NC DENR: North Carolina Department of Environment and Natural Resources NC WRRI: North Carolina Water Resources Research Institute NGP: Northern Glaciated Plains NH3: ammonia NH4
+: ammonium ion (NH2)2CO: urea NLF: Northern Lakes and Forests
vi
NMW: Northern Minnesota Wetlands NO2
-: nitrite ion NO3
-: nitrate ion P: phosphorus PBC: partial-body contact PO4
3-: phosphate ion PP: Paleozoic Plateau ppb: parts per billion (1 ppb = 0.001 mg/L = 1 μg/L = 1 mg/m3) r: coefficient of correlation for a sample r2: coefficient of determination for a sample RRV: Red River Valley SD: Secchi depth or Secchi disk depth SEM: structural equation modeling SONAR: Statement of Need and Reasonableness TIN: total inorganic nitrogen TKN: total Kjeldahl nitrogen TN: total nitrogen TP: total phosphorous TSI: Trophic State Index U.S. EPA: United States Environmental Protection Agency USGS: United States Geological Survey VDEQ: Virginia Department of Environmental Quality WCP: Western Corn Belt Plains WHO: World Health Organization wt: weight
vii
EXECUTIVE SUMMARY The U.S. Environmental Protection Agency (EPA) has identified excess nutrients as a major reason for impaired water quality in the nation’s waters. The U.S. EPA is therefore directing states and authorized tribes to develop numeric criteria for nutrients to protect the designated uses from cultural eutrophication (waters enriched with nutrients because of human activities). The goal of this document is to conduct a review of literature pertinent to the dynamics of nutrients in lakes and reservoirs. The objective is to provide information for nutrient criteria developers for use in establishing scientifically defensible nutrient criteria for lakes and reservoirs. The review is separated into three main sections entitled: (1) Background Information, (2) What We Know, and (3) Toward Developing Nutrient Criteria. BACKGROUND INFORMATION Phosphorus and nitrogen are essential nutrients for living organisms and often limit the growth of phytoplankton and aquatic plants living in lakes and reservoirs. Furthermore, in excess supply, these nutrients have been associated with a proliferation of phytoplankton and aquatic plants that can interfere with the designated uses of lakes and reservoirs. Although an excessive supply of nutrients in lakes and reservoirs can lead to eutrophic conditions, the nutrients themselves generally do not interfere with the designated uses. Instead, it is the biological response to the nutrient enrichment that causes most of the problems. Such responses include heavy growths of phytoplankton and aquatic plants that can lead to the depletion of dissolved oxygen concentrations, fluctuations in the pH of the water, changes in the taxonomic composition and structure of aquatic communities, the release of toxins from certain phytoplankton, and disinfectant byproducts in treated drinking water. WHAT WE KNOW Although there are many similarities between lakes and reservoirs, this review focuses on the differences. Compared to natural lakes, reservoirs tend to be more influenced by nutrients and other substances transported from the surrounding land. Lakes and reservoirs also differ in the amount of phytoplankton and aquatic plants (primary production) that can be supported. Because of the many differences between natural lakes and reservoirs with respect to nutrients and primary production, empirical models developed from dataset for natural lakes tend not to work well in reservoirs. Reservoirs exhibit special characteristics that are likely to affect nutrient criteria development. For example, dams can cause a longitudinal gradient from the inflow to the outflow of reservoirs. Dams also have the ability to trap large amounts of sediment, which can affect primary production by supplying nutrients to the system and/or by reducing light transmission. Internal loading of nutrients, a process whereby phosphorus is released from sediments under conditions of low oxygen, can be significant in reservoirs. Because reservoirs serve multiple purposes, developers of nutrient criteria may need to weigh the nutrient-level requirements of various uses. The hydraulic residence time, also referred to as hydraulic retention time, refers to the rate of water movement from inflow to outflow. It is related to the morphological features of lakes and
viii
reservoirs and impacts both physical and biological processes. Numerous studies have shown a strong relationship between hydraulic residence time and primary production, with long residence times being associated with higher abundances. Because hydraulic residence time is closely linked with primary production, lakes and reservoirs can be classified by residence time as a part of nutrient criteria development. Fish production in lakes and reservoirs can be limited by insufficient food and/or inadequate habitat. Low nutrient concentrations can constrain food supply by limiting primary production, and high concentrations of nutrients can limit suitable habitat by causing oxygen depletions. To protect aquatic life, therefore, nutrient conditions that promote healthy fisheries need to be considered. User perceptions of water quality conditions can be used to indicate a lake or reservoir’s ability to support recreational uses. A review of the literature concerning user perceptions reflects a general theme: the level of water quality deemed suitable for swimming varies significantly between regions, lakes, and individual users. Because of this variation, no single water clarity threshold appears to be applicable for nutrient criteria development. U.S. EPA requires that nutrient criteria protect the uses of proximal downstream waters (those within a few miles of the lake or reservoir). For natural lakes, it is generally considered that most nutrients stay trapped within the lake system. Newly constructed reservoirs tend to cause an overall gain in nutrients to downstream waters, whereas established impoundments generally reduce the annual loads of nutrients to downstream waters. The primary production of downstream receiving waters can be affected by both changes in the nutrient levels owing to the lake or reservoir and because of the addition of phytoplankton from the lake or reservoir. Furthermore, both additions and depletions of oxygen content in downstream waters have been attributed to discharges from reservoirs: discharges from deep reservoirs are likely to supply cooler, oxygenated waters, and discharges from shallow reservoirs are likely to add oxygen-depleted waters. TOWARD DEVELOPING NUTRIENT CRITERIA This section of the literature review provides general information about some of the most commonly considered variables for use in determining nutrient impairments. U.S. EPA recommends using a combination of both causal (e.g., total phosphorus [TP], total nitrogen [TN]) and response (chlorophyll-a [Chl-a], turbidity [Secchi disk depth, SD], and dissolved oxygen [DO]) variables when developing nutrient criteria. Additionally, trophic state indices (TSIs), which describe the amount of plant biomass in a body of water, can also be used in nutrient criteria development. Depending on the parameters utilized as nutrient criteria (e.g., levels of TP, TN, and Chl-a), certain management practices could affect monitoring results. For example, some lakes and reservoirs used to grow fish add fertilizers that contain nutrients to encourage primary production. Other practices such as aeration to increase dissolved oxygen levels and the addition of copper sulfate to control algal blooms (practices commonly utilized in water supply lakes and
ix
reservoirs) also need to be known before ascertaining whether or not individual lakes and reservoirs meet the developed nutrient criteria. Across the country, various approaches for meeting EPA’s nutrient criteria mandate have been proposed. This review highlights those proposed by U.S. EPA, Minnesota, Virginia, and Arizona as well as an alternative method being studied in North Carolina. -- U.S. EPA developed ambient water quality criteria recommendations for TP, TN, Chl-a, and Secchi depth within each of 14 aggregate nutrient ecoregions (regions of relative homogeneity in ecological systems). For these candidate criteria, U.S. EPA used the 25th percentile from frequency distributions of data from all lakes and reservoirs within the aggregate ecoregion. -- The Minnesota Pollution Control Agency (MPCA) is proposing ecoregion-specific nutrient criteria for its natural lakes that are based on the lake’s use designation and depth. MPCA used a weight-of-evidence approach to propose summer threshold values for TP, Chl-a, and SD. In order for the proposed eutrophication criteria to be exceeded, both the causal variable (TP) and one of the response variables (either Chl-a or Secchi depth) would need to be exceeded. -- The Virginia Department of Environmental Quality (VDEQ) worked with various researchers and stakeholders to propose ecoregional criteria. An academic advisory committee reviewed scientific literature, conducted analyses of relevant databases, and made recommendations to VDEQ. Chlorophyll-a and phosphorus limits were developed for 116 constructed reservoirs classified according to the type of recreational fishery supported (phosphorus applies only in reservoirs treated with algicides). VDEQ is working with other state agencies to develop a procedure to confirm use impairments based on the status of the fishery when nutrient criteria are exceeded. When the numeric criteria are exceeded but the designated uses of the water body are being attained, site-specific criteria are proposed for development. Site-specific modifications to the criteria are also proposed if the specified nutrient criteria do not protect downstream waters. -- The Arizona Department of Environmental Quality (ADEQ) worked with a contractor to develop a “translator” approach to interpret Arizona’s narrative nutrient criteria. The contractor developed a range of numeric targets for lake and reservoir water quality parameters that are expected to support various designated uses. A weight-of-evidence protocol is expected to be used to interpret the narrative nutrient criteria by systematically comparing monitoring data with the numeric targets. These targets were selected based on a review of the scientific literature, statistical analyses of water quality data from Arizona’s lakes and reservoirs, and a trophic state index developed specifically for Arizona’s lakes and reservoirs. Numeric targets were derived for each designated use and each lake class. Chlorophyll-a values were selected as the primary threshold value. Using Arizona’s TSI, secondary targets were set for Secchi depth and nutrient concentrations that would be expected to maintain specific levels of Chl-a in Arizona’s lakes and reservoirs. -- Another method being proposed uses statistical models to predict (1) the nutrient-related parameters most likely to indicate attainment of the designated use, and (2) the criteria level that would maximize environmental protection while minimizing costs. This approach is currently (2007) being studied using lakes and reservoirs in North Carolina.
1
SECTION I — BACKGROUND INFORMATION SECTION I-A. INTRODUCTION The Clean Water Act requires states and authorized tribes to set water quality standards to protect the physical, chemical, and biological integrity of the waters within their boundaries. A water quality standard consists of three main elements: (1) designated uses, (2) water quality criteria, and (3) an antidegradation policy. Designated uses include the existing and potential uses of a water body and may differ from state to state. Common designated uses include recreational uses, aquatic life support, production of edible and marketable fish and shellfish, and supply of potable water. Criteria are set to protect the uses of the water body and can be narrative or numeric in nature. Antidegradation policies are designed to prevent the water quality from being reduced from a higher status to a lower status (U.S. EPA 2002). The U.S. Environmental Protection Agency (EPA) has identified excess nutrients as a major reason for impaired water quality in the nation’s waters. According to the U.S. EPA’s National Water Quality Inventory 2000 Report, “more lake acres are affected by nutrients than any other pollutant or stressor…. States reported that excess nutrients pollute 3.8 million lake acres (which equals 22% of the assessed lake acres and 50% of the impaired lake acres)” (U.S. EPA 2002, page 20). Excessive nutrients in lakes and reservoirs can lead to blooms of algae, overabundance of aquatic plants, low dissolved oxygen levels, fish kills, and species shifts of flora and/or fauna. Over enrichment of nutrients may also pose human health risks through the development of harmful algal blooms (U.S. EPA 2002). The U.S. EPA is therefore directing states and authorized tribes to develop numeric criteria for nutrients to protect the designated uses of the nation’s waters. The purpose of numeric nutrient criteria is to address cultural eutrophication (waters enriched with nutrients because of human activities). Presently, all states have narrative criteria related to nutrients (U.S. EPA 2003a). Examples of narrative criteria include:
Indiana — All waters shall be free from substances “… that will cause or contribute to the growth of aquatic plants or algae to such degree as to create a nuisance, be unsightly or deleterious or be harmful to human, animal, plant, or aquatic life or otherwise impair the designated uses” (327 IAC 2-1-6).
New Mexico — “Plant nutrients from other than natural causes shall not be present in concentrations which will produce undesirable aquatic life or result in a dominance of nuisance species in surface waters of the state” (20 NMAC 6.4.12).
Numeric criteria provide specific values to measurable parameters. Relatively few states have water quality numeric criteria related to nutrients. North Carolina and Illinois are two states that have numeric criteria applicable to freshwater lakes and reservoirs to protect against nutrient impairments:
North Carolina—“Chlorophyll a (corrected): not greater than 40 µg/L for lakes, reservoirs, and other waters subject to growths of macroscopic or microscopic vegetation not designated as trout waters, and not greater than 15 µg/L for lakes, reservoirs, and other waters subject to growths of macroscopic or microscopic
2
vegetation designated as trout waters (not applicable to lakes and reservoirs less than 10 acres in surface area)…” (15A NCAC 02B.0211).
Illinois—“Phosphorus as P shall not exceed 0.05 mg/l in any reservoir or lake with a surface area of 8.1 hectares (20 acres) or more…” (35 Ill. Admin. Code 302.205).
To assist water quality managers in developing numeric criteria for lakes and reservoirs, U.S. EPA developed a technical guidance, Nutrient Criteria Technical Guidance Manual: Lakes and Reservoirs (U.S. EPA 2000a). The U.S. EPA also proposed a set of guidance criteria for lakes and reservoirs in each aggregate nutrient ecoregion within the conterminous U.S. (U.S. EPA 2000b-h, U.S. EPA 2001a-e). These criteria are based on two causal variables (total nitrogen [TN] and total phosphorus [TP]) and two early indicator response variables (chlorophyll-a [Chl-a] and turbidity [Secchi depth]) (U.S. EPA 2000a). The ecoregion criteria proposed by the U.S. EPA are to be used as the default standard unless states and authorized tribes develop their own acceptable standards. The standards developed by states and authorized tribes must meet the following basic requirements (U.S. EPA 2000a):
• Protect the designated uses of lakes and reservoirs • Protect the designated uses of the downstream receiving waters • Use a scientifically defensible approach • Use parameters that can measure the cause of and response to nutrient overenrichment.
Reckhow et al. (2005) suggest that states should develop criteria that are easily measured, good predictors of the designated use attainment, and consider societal values that balance environmental protection and cost. Reckhow et al. (2005, p. 2918) caution: “…natural variability and criterion-use prediction uncertainty will almost certainly result in some risk of nonattainment…. Furthermore, the selection of the acceptable probability [of nonattainment] is a value judgment best left to policy makers and should not be ‘hard-wired’ into the criteria level analysis.” 1. Purpose The goal of this document is to conduct a review of literature pertinent to the dynamics of nutrients in lakes and reservoirs. The objective is to provide information for nutrient criteria developers for use in establishing scientifically defensible nutrient criteria for lakes and reservoirs. Section I of this literature review covers background information about lakes and reservoirs, nitrogen, phosphorus, primary production, and the effects of excess nutrients and primary production in lakes and reservoirs. Section II provides an overview of nutrient-related effects on the trophic state of lakes and reservoirs. It includes a summary of the differences between natural lakes and impounded waters, the effect of residence time, and the relationship between fisheries and nutrient concentrations. This section also describes the possible downstream effects of lakes and reservoirs on other water bodies, such as downstream reservoirs and rivers. Section III of the review provides information toward developing nutrient criteria. It covers possible ways to express nutrient criteria and describes various approaches proposed for developing nutrient criteria.
3
2. Characteristics of Lakes In general terms, lakes are thought of as inland bodies of standing water located within a depression of the land surface. In the U.S. EPA nutrient criteria guidance document, lakes are given a more specific definition: “Natural and artificial impoundments with a surface area greater than 10 acres and a mean water residence time of 14 or more days.” Many of the natural lakes in the U.S. were formed by glaciers and are thus located in the northern latitudes. Other natural lakes common to the U.S. were formed from the dissolution of limestone, such as found in Florida and other regions with limestone bedrock (Walker 1981 in Kennedy and Walker 1990). Water enters lakes from precipitation, runoff from the surrounding land, entering streams, and groundwater. Runoff that enters lakes first passes through the surrounding wetlands, which slows the water velocity and removes sediments, nutrients, and pollutants (Ford 1990). Lakes can lose water to the atmosphere from the surface, to downstream receiving waters from an outlet, and to the groundwater through seepage from the lake bottom. Lake waters respond to climatic seasonal changes. For example, changes in the characteristics of lake waters occur with seasonal fluctuations of temperature and solar radiation, particularly in regard to the mixing of the upper and lower lake waters. When air temperatures and solar radiation are high, as in summer, the water in the upper part of a lake is likely to be warmer and therefore less dense than that in the lower reaches. The resulting change in water temperature with depth leads to stratified layers of water — the warmer, less dense water resides on top of the cooler, denser water. Because of the differences in the density of the water, little exchange occurs between these layers (Smith 1986). As the season changes and air temperatures cool, the upper layer also cools and become denser, similar to the lower water. Because of the similar density throughout, wind blowing across the lake is able to set up a mixing of the water column in a process known as turnover (Wetzel 2001). The stratification/mixing process varies among lakes. Some examples of different ways that lakes respond to seasonal temperature changes are illustrated below:
• At spring or fall turnover, small lakes may circulate during several days of windy conditions, whereas large lakes can take several weeks to circulate (Wetzel 2001).
• Shallow lakes may mix daily throughout the year or every few days. If stratification occurs in these lakes, it generally only lasts for a week or two (Horne and Goldman 1994).
• Many temperate lakes of moderate depth that are covered by ice in winter (e.g., Lake Mendota, Wisconsin) mix in the fall and spring. Ice cover prevents the wind from mixing the water in winter. Stratification thus occurs in the summer and winter (Horne and Goldman 1994, Brönmark and Hansson 2005).
• Moderately deep to deep lakes in cooler climates that are not covered by ice in winter (e.g., Great Lakes, Lake Tahoe in California) may have one long mixing period that lasts from fall into the following spring/early summer and a stratification period during summer (Horne and Goldman 1994, Brönmark and Hansson 2005).
4
Stratified lakes can be divided into three layers of water: epilimnion, metalimnion, and hypolimnion. The upper layer of water is referred to as the epilimnion, and the lower layer is called the hypolimnion. The section between these two layers is known as the metalimnion. A thermocline, a region where the temperature changes rapidly with depth, separates the upper and lower layers (For temperate lakes, the thermocline is defined as the region where temperature changes are greater than 1oC per meter depth). Because the thermocline and metalimnion occur in the same region, the terms are often used interchangeably (Horne and Goldman 1994, Wetzel 2001). The characteristics of lake water differ between stratified layers. Because the epilimnion is exposed to the sunlight, it typically has the highest temperatures during summer and is the region where most photosynthesis occurs. Oxygen levels are frequently greatest in the epilimnion because oxygen from the atmosphere is transferred to the water and because oxygen is produced from photosynthesizing lake algae. As algal populations grow, the nutrient concentrations in the epilimnion may become depleted during the growing season. In contrast, the hypolimnion receives less light so that photosynthesis is generally not possible and the temperature remains cold throughout the year. The hypolimnion tends to have low levels of oxygen, in part, because it is isolated from the atmosphere, lacks vegetation and algae that give off oxygen during photosynthesis, and has an increased population of decomposing bacteria that require oxygen. Nutrient levels tend to be higher in the hypolimnion because deceased organisms fall to the bottom of the lake where they are decomposed and because mineral particles (e.g., from soil in the drainage basin) have nutrients attached to them and accumulate at the bottom of the lake (Smith 1986). As temperatures cool, fall turnover occurs, and the stratified layers mix, i.e., the water from the upper layer mixes with the water from the bottom layer. As a result of the mixing, depleted nutrient levels in the epilimnion are typically recharged from nutrients in the bottom reaches. Likewise, depleted oxygen levels in the hypolimnion are restored by increased oxygen levels from the surface waters (Smith 1986, Horne and Goldman 1994, Wetzel 2001). Lakes can also be described as having different zones. The littoral zone is closest to the shore. In this shallow water zone, the sunlight is able to reach to the bottom of the lake. The photosynthetic activity of this region is dominated by rooted plants such as water lilies, rushes, and cattails. The pelagic (or limnetic zone) is in the deeper, open water where light is sufficient for photosynthesis. Floating algae and cyanobacteria (formerly referred to as blue-green algae) provide the most photosynthetic activity in the pelagic zone. Below the pelagic zone, lies the profundal zone. This region of the lake is characterized by low light levels so that photosynthesis does not occur in this zone (Smith 1986, Wetzel 2001). 3. Characteristics of Reservoirs U.S. EPA defines reservoirs as “man-made lakes for which the primary purpose of the impoundment is other than recreation (e.g., boating, swimming) or fishing, and the water retention time and water body depth and volume vary widely” (U.S. EPA 2000a, p. 3-1). Hutchinson (1957) classified reservoirs as one of seventy-six lake types based on the origin of lake formation. He considered the dam as the distinguishing characteristic of reservoirs.
5
Reservoirs can be classified using a combination of (1) the location in the basin, (2) the operation of the dam, and (3) the hydraulic residence time (rate of water movement from the inflow to the outflow). Three types of reservoirs include: tributary-storage reservoirs, run-of-the-river reservoirs, and mainstem-storage reservoirs (Søballe et al. 1992, Kennedy 2001).
• Tributary-storage reservoirs, as the name implies, are constructed by holding back the waters of a few low-order rivers. Thus, tributary-storage reservoirs are generally located in upstream regions of the basin. These reservoirs are typically deep and thus able to stratify. Because tributary-storage reservoirs are often used for flood control, the hydraulic residence time can be long and quite variable (depending on the amount and timing of water input to the reservoir from precipitation or snow melt).
• Run-of-the-river reservoirs are usually located further downstream in the basin than are tributary-storage reservoirs. These reservoirs are constructed to include the original river channel and the land adjacent to the original river channel. They are primarily used for power generation or navigation. Common characteristics of run-of-the river reservoirs include high amounts of turbidity and suspended sediments. When used for power generation, the surface elevations can change daily. When used primarily for navigation, there is little change in the water depth. Run-of-the-river reservoirs tend to have short hydraulic residence times.
• Mainstem-storage reservoirs are located in downstream regions of the basin. These reservoirs are constructed by flooding broad river floodplains. Mainstem-reservoirs are often designed for controlling flood events, and/or generating power. The hydraulic residence times of this class of reservoirs vary greatly. Some offer large storage volumes so have the potential to have long residence times (Søballe et al. 1992, Kennedy 2001).
Reservoirs are primarily constructed in regions where there are few natural lakes. States that were not glaciated tend to have reservoirs, whereas states that were glaciated have many natural lakes so have only a few reservoirs. Thus, most reservoirs in the U.S. are located throughout the southeast, central states, southwest, and west (Thornton 1990a). Reservoirs were built on rivers to meet a particular societal purpose or purposes. Reservoirs are primarily constructed for flood control, water supply, hydropower generation, or irrigation (Thornton 1990a). They are designed to hold back water and release it in a controlled manner. Depending on the height of the dam and the control of the outgoing flow, water storage can be short (1 day) or long (750+ days) (Kennedy 2001). Because reservoirs are formed from rivers but also store water, their characteristics are typically intermediate to those of rivers and natural lakes. Furthermore, reservoirs that more closely resemble natural lakes function within the ecosystem in a manner similar to natural lakes, whereas reservoirs that more closely resemble rivers in their physical and chemical characteristics function more like rivers (Wetzel 1990). Like natural lakes, the water quality of reservoirs is influenced by the geology of the watershed, climate of the region, and land use within the watershed. Reservoirs receive water input from precipitation, runoff from surrounding land, and groundwater. Unlike lakes, however, reservoirs receive the major portion of inflow from a few contributing tributaries (Ford 1990, Thornton 1990b). Reservoirs can lose water to the atmosphere from the surface, to the groundwater through seepage from the basin bottom, and to downstream receiving waters from the controlled
6
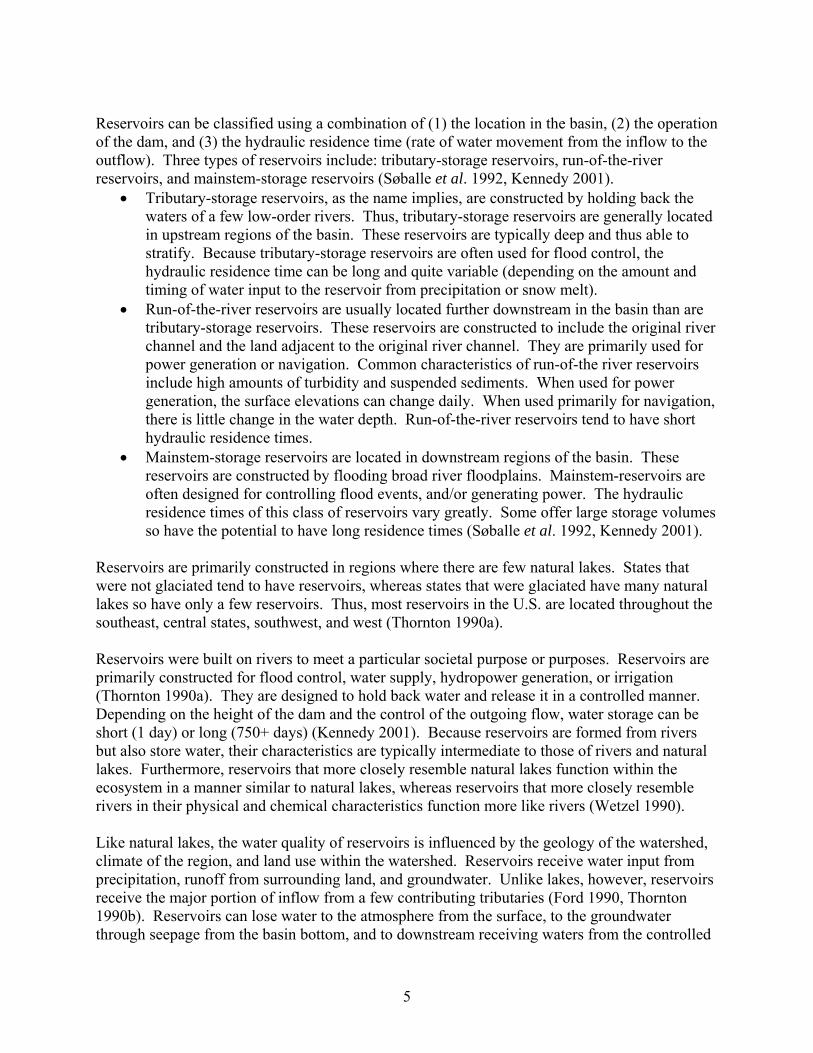
outlet (i.e., the dam). Depending on the design of the dam, the outlet can be located near the surface, near the bottom, or somewhere in between. Some dams have multiple depths from which the water can be released. Reservoirs that release water from the top more closely resemble natural lakes in this attribute (Ford 1990). Given the required climatic and morphological conditions, reservoirs are able stratify in a manner similar to lakes (i.e., they develop an epilimnion, metalimnion, and hypolimnion). Likewise, reservoirs can have periods of turnover. Just like lakes, reservoirs also have a littoral zone, pelagic zone, and profundal zone. Compared to natural lakes, however, reservoirs are more complex systems. For example, because of the significant flow of water from tributaries and the slowing of this water by the dam, reservoirs have a longitudinal gradient (from the region of inflow to the dam) that is lacking in lakes (see Section II-B). 4. Trophic State Trophic state refers to the amount of plant biomass in a body of water (Carlson and Simpson 1996). Lakes and reservoirs with low amounts of plant biomass (primary production) are said to be oligotrophic. Those with a medium amount of production are described as mesotrophic, and those with high amounts of plant biomass are called eutrophic. Eutrophication, therefore, is a process whereby water bodies move from a state of lower production (e.g., an oligotrophic state) to higher production (e.g., a eutrophic state). Eutrophication is a natural process that eventually transforms lakes into marshes. Under natural conditions, this process can take up to millions of years for some particularly deep lakes (Horne and Goldman 1994). The characteristics of the drainage basin (e.g., amount of nutrients available to the lake system) and the mean depth of the lake or reservoir are the primary factors controlling eutrophication (Horne and Goldman 1994). Thus, activities that increase the amount of nutrients in the runoff from the drainage basin accelerate the eutrophication process. A trophic state that might take several hundred years to be reached without the influence of human settlement could be attained in decades with contributions of nutrients from human activities. This accelerated eutrophication because of human-related inputs of nutrients is called cultural eutrophication. Human activities that contribute to cultural eutrophication by increasing the amount of nutrients available to the lake or reservoir include discharging municipal sewage into the water body, allowing wastes from livestock and pets to enter the water body, and fertilizing cropland and lawns in the drainage basin. Because the depth of the lake or reservoir influences the eutrophication process, the epilimnion:hypolimnion (E:H) ratio has been used as a first approximation of trophic state. This ratio reflects the volume between the zone where most algal production takes place (epilimnion) and the zone where decomposition processes are dominant (hypolimnion). If the E:H ratio is high, a more productive trophic state may be anticipated for a given nutrient load than if the ratio is low. Figure I-1, reproduced from Cole (1994) and prepared using data from Rawson (1955), illustrates the relationship between planktonic production and mean depth in lakes. The figure supports a “rule of thumb” that, absent unusual anthropogenic nutrient sources, deep lakes are generally less productive than shallow ones, and that the boundary for oligotrophic systems is a mean depth of about 18 meters (from Zipper et al. 2004).
7
Figure I-1. Standing crops of plankton in kilograms per hectare plotted against mean depths in various lakes (Data from Rawson, 1955). Reprinted by permission of Waveland Press, Inc. from Gerald A. Cole, Textbook of Limnology, 4th edition. (Long Grove, IL; Waveland Press, Inc., [reissued 1994]). All rights reserved.
Horne and Goldman (1994) summarize the contrasts between oligotrophic and eutrophic lakes. In general, oligotrophic lakes have low levels of primary production and other aquatic life. They are often deep and located in small drainage basins. Oligotrophic lakes are usually lacking in at least one macronutrient, have high dissolved oxygen concentrations, and are clear. In contrast, eutrophic lakes have high levels of primary production and aquatic life. They tend to be shallow and situated in large drainage basins. These eutrophic lakes generally have high nutrient concentrations, variable oxygen levels, and low light transparency (Horne and Goldman 1994). SECTION I-B. NUTRIENT INPUT AND FATE IN LAKES AND RESERVOIRS Nutrients are elements used by living organisms as nourishment. Some nutrients, such as carbon (C), nitrogen (N), and phosphorus (P), are needed in relatively large supply (referred to as macronutrients) whereas other nutrients, such as iron, zinc, and copper are needed in comparatively small supply (referred to as micronutrients) (Hecky and Kilham 1988). Sources of nutrients to lakes and reservoirs include the bedrock, atmospheric deposition, vegetation and animal life in and around the water body, and input from human activities. Primary producers, organisms able to photosynthesize, are able to absorb and use nutrients dissolved in water, whereas macroinvertebrates, fish, and other animals cannot. Thus, primary producers serve as the basis for aquatic food chains. Because phosphorus and nitrogen often limit the amount of growth by primary producers, these nutrients are sometimes referred to as “limiting nutrients.” Likewise, phosphorus and nitrogen are also considered to be “causal variables” because in excessive amounts, they may cause proliferation of primary producers. For these reasons, much attention is paid to phosphorus and nitrogen when developing nutrient criteria (U.S. EPA 2000a).
8
1. Phosphorus Phosphorus (P) is an essential nutrient for living organisms. For instance, phosphorus is found in DNA (the genetic material of living organisms), used to form cell membranes, and is utilized at the cell level (as ATP, adenosine tri-phosphate) to generate energy. Phosphorus enters lakes and reservoirs from a number of different sources, e.g., point-source discharges, terrestrial runoff, feces from waterfowl, decaying organisms, and rocks containing phosphorus. Some sources of phosphorus to lakes and reservoirs are natural, such as waste products from aquatic organisms and wildlife, and decaying tissues of plants and animals. Other natural sources of phosphorus in lakes and reservoirs include dissolved minerals containing phosphorus and atmospheric deposition of particulate-bound phosphorus (e.g., phosphorus attached to wind blown soils). Sources of phosphorus in lakes and reservoirs that result from human activities often include industrial and municipal effluents and surface runoff from lands affected by fertilizer, poultry litter, and/or livestock waste. Human activities that increase soil erosion may also contribute phosphorus to lakes and reservoirs as particulate-bound phosphorus (Wetzel 2001, Brönmark and Hansson 2005). In the aquatic ecosystem, phosphorus can be found in the water column, within the bodies of aquatic organisms, or attached to particles (such as in sediment) in the water. Primary producers are able to directly incorporate inorganic forms of phosphates. Primary producers may also be able to indirectly obtain phosphorus from various organic compounds (phosphorus bound to carbon-based molecules, as in excrement and in decaying plant and animal matter). For example, organic phosphorus incorporated in plant and animal tissues may be made available for use by primary producers through bacterial conversion into soluble inorganic phosphates. Likewise, particulate-bound phosphates (phosphates bound to particles) can be used by primary producers if the phosphorus disassociates from its particle to become soluble in the water column (Wetzel 2001, Brönmark and Hansson 2005). Phosphorus can cycle for quite some time through lake and reservoir systems. It is transferred from one organism to another through food chains. Alternatively, phosphorus can sink to the bottom sediment as a part of fecal waste, a dead organism, or attached to a sinking particle. Once at the bottom of the lake or reservoir, phosphorus may become buried and unavailable to the system. Alternatively, rooted plants can transport phosphorus from the sediment into their tissues, where upon death, the phosphorus can be released back into the water (Horne and Goldman 1994). Phosphorus in sediment may be released back into the system through chemical reactions, e.g., at pH values above 8, phosphate may disassociate from its particle and become soluble in water. Bottom-feeding fish and organisms that inhabit the bottom sediments such as worms and other aquatic organisms can also disturb the sediment, releasing phosphorus back into the water column. Phosphorus is released from lakes and reservoirs through the outflow to downstream waters (Hutchinson 1957, Brönmark and Hansson 2005). Phosphorus levels in water samples collected from lakes and reservoirs are usually reported as ppb, µg/L (1 µg/L = 1 ppb), or mg/L of total phosphorus. For more information about using phosphorus as a variable for determining nutrient-impaired waters see Section III-A in this literature review.
9
2. Nitrogen Nitrogen (N) is an essential nutrient for living organisms. It is primarily used to form proteins, which are the building blocks of all living matter. Proteins provide structural support, act as enzymes, regulate cell activity, etc. Nitrogen is also an important component of chlorophyll, the green pigment that makes photosynthesis possible. Nitrogen in lakes and reservoirs may come from natural sources, such as the decomposition of plants and animals, waste products from aquatic life within the water, urine and feces of wildlife in the catchment, or (in generally small amounts) mineral dissolution of rocks. Nitrogen that enters lakes and reservoirs is often of direct human origin (such as discharges from sewage treatment plants or leachate from septic systems) or is related to human activities (such as wastes from poultry and livestock facilities, runoff of fertilizers, or nitrous oxides from fuel combustion). Nitrogen can be transported to lakes and reservoirs through atmospheric deposition (precipitation on the lake surface), runoff, or groundwater (Hutchinson 1957, Wetzel 2001). Nitrogen exists in fresh water in a number of different forms. Most algae and other primary producers are able to utilize inorganic forms of nitrogen: nitrates (NO3
-), nitrites (NO2-),
ammonia (NH3), and ammonium ions (NH4+) (Smith 1986). Some species of cyanobacteria are
also able to use nitrogen (N2) directly from the atmosphere. Various forms of organic nitrogen (nitrogen that is bound to carbon-based molecules) may also become available to algae. For example, urea ([NH2]2CO), a soluble organic compound containing nitrogen that is excreted in urine and applied to land as fertilizer, easily degrades into inorganic forms of nitrogen. Likewise, organic nitrogen found in plant and animal tissues can become available for use by primary producers if converted by bacteria into inorganic forms of nitrogen (Wetzel 2001). Nitrogen is primarily lost from lakes and reservoirs through the outflow, in an exchange with groundwater, in the sediments, and by bacterial denitrification (e.g., converting NO3
- to N2) with subsequent loss of nitrogen gas (N2) to the atmosphere (Hutchinson 1957, Wetzel 2001). Measurements of nitrogen in water samples collected from lakes and reservoirs are usually reported as mg/L of total nitrogen (TN). For more information about using nitrogen concentrations as a monitoring parameter for determining nutrient-impaired waters see Section III-A. 3. Nutrient Limitation According to the Law of the Minimum, the growth rate of an algal cell is only limited by one factor at any given time. The limiting factor can be a nutrient, light, temperature, etc. Although different species have different requirements, as a generalization, plant tissue requires phosphorus, nitrogen, and carbon in the following ratio: 1 P : 7 N : 40 C by mass. This N:P ratio of 7 by mass is referred to as the Redfield Ratio, named for the oceanographer Alfred Redfield who first published it (Redfield 1934). Thus based on the nutrient requirements for P, N, and C, phosphorus is most likely to limit growth, and nitrogen is next likely to limit growth. Other elements, such as silicon, calcium, or iron, can be limiting but are not required in as large of
10
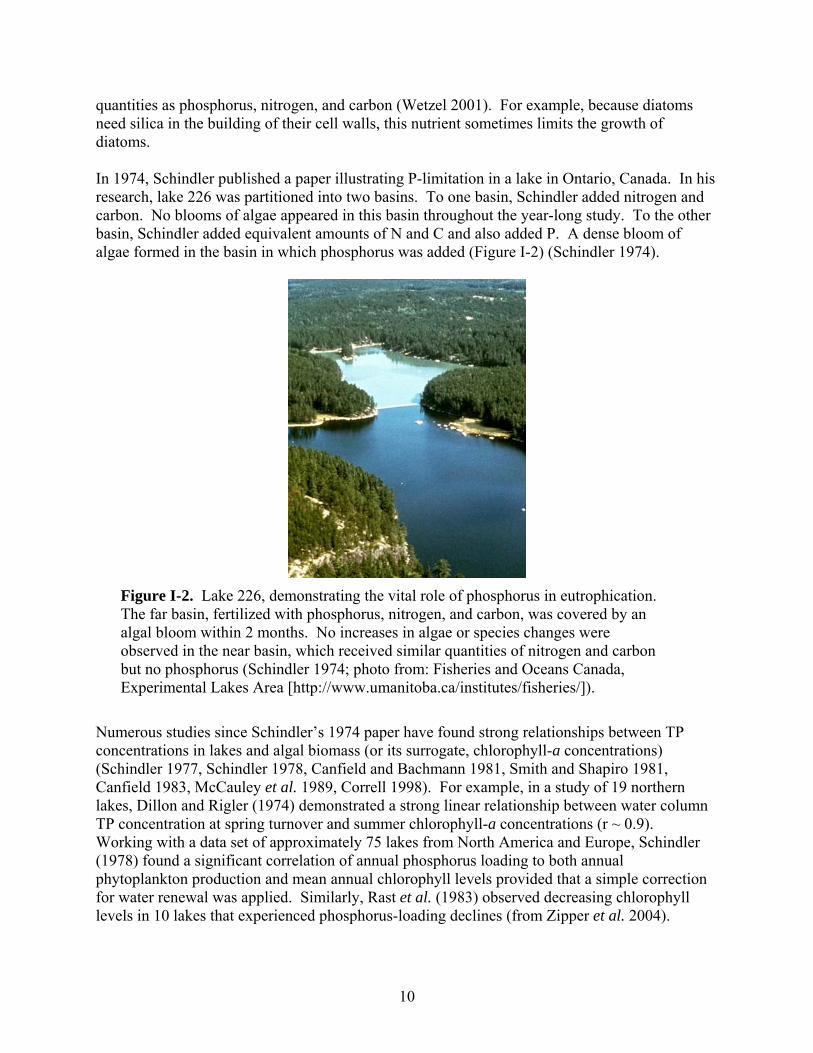
quantities as phosphorus, nitrogen, and carbon (Wetzel 2001). For example, because diatoms need silica in the building of their cell walls, this nutrient sometimes limits the growth of diatoms. In 1974, Schindler published a paper illustrating P-limitation in a lake in Ontario, Canada. In his research, lake 226 was partitioned into two basins. To one basin, Schindler added nitrogen and carbon. No blooms of algae appeared in this basin throughout the year-long study. To the other basin, Schindler added equivalent amounts of N and C and also added P. A dense bloom of algae formed in the basin in which phosphorus was added (Figure I-2) (Schindler 1974).
Figure I-2. Lake 226, demonstrating the vital role of phosphorus in eutrophication. The far basin, fertilized with phosphorus, nitrogen, and carbon, was covered by an algal bloom within 2 months. No increases in algae or species changes were observed in the near basin, which received similar quantities of nitrogen and carbon but no phosphorus (Schindler 1974; photo from: Fisheries and Oceans Canada, Experimental Lakes Area [http://www.umanitoba.ca/institutes/fisheries/]).
Numerous studies since Schindler’s 1974 paper have found strong relationships between TP concentrations in lakes and algal biomass (or its surrogate, chlorophyll-a concentrations) (Schindler 1977, Schindler 1978, Canfield and Bachmann 1981, Smith and Shapiro 1981, Canfield 1983, McCauley et al. 1989, Correll 1998). For example, in a study of 19 northern lakes, Dillon and Rigler (1974) demonstrated a strong linear relationship between water column TP concentration at spring turnover and summer chlorophyll-a concentrations (r ~ 0.9). Working with a data set of approximately 75 lakes from North America and Europe, Schindler (1978) found a significant correlation of annual phosphorus loading to both annual phytoplankton production and mean annual chlorophyll levels provided that a simple correction for water renewal was applied. Similarly, Rast et al. (1983) observed decreasing chlorophyll levels in 10 lakes that experienced phosphorus-loading declines (from Zipper et al. 2004).
11
The forms of algal responses to nutrient enrichment at relatively low levels are generally modeled as linear or log-linear functions. In studies that include lakes with very high nutrient levels, several investigators have found the relationship of TP and chlorophyll-a to be sigmoid (McCauley et al. 1989, Prairie et al. 1989). Algal response to TP is reduced at higher concentrations. Such a response would be expected at high phosphorus concentrations because other factors necessary for photosynthesis (other nutrients, sunlight, etc.) are more likely to become limiting (from Zipper et al. 2004). Algae have developed a number of ways to overcome low phosphorus concentrations in water. For example, most algae are able to take in more phosphorus than needed during times when phosphorus levels are high and store it for later use when phosphorus levels in the water column are low. This process is referred to as luxury consumption. In addition, certain species of algae are capable of obtaining phosphorus from the water column even when the phosphorus concentration is low. A third method involves the production of phosphatase, an enzyme that cleaves the bond between phosphate and an organic particle to which it is attached. Algae able to produce phosphatase are therefore able to free phosphate from organic matter, transforming the phosphorus from an unavailable form to an available form. Many studies have found that TN concentrations, as well as TP, (or, in an alternative formulate, N:P ratio) also influence algal responses (Smith 1982, Canfield 1983, Smith 1983, McCauley et al. 1989, Prairie et al. 1989) (Table I-1). Morris and Lewis (1986) found declines of TN to levels indicating nitrogen limitation during the midsummer months in three of eight Colorado lakes they were studying. Several studies have shown that short-term nitrogen limitations commonly occur in systems where seasonal means give no indication of nitrogen limitation (Barica 1990, Matthews et al. 2002). Patchy distributions of algal species and nutrients in aquatic systems, especially when stratified, can cause nitrogen limitations to occur within microenvironments even when the system average nutrient concentrations do not indicate such condition (Hyenstrand et al. 1998). Because some cyanobacteria are capable of fixing atmospheric nitrogen, long-term nitrogen limitation only occurs in systems with certain conditions such as micronutrient deficiencies that inhibit the growth of N-fixers (from Zipper et al. 2004). More often, algal communities are co-limited by both nitrogen and phosphorus (Matthews et al. 2002). Co-limitation occurs because numerous species are present and because algal communities and species vary in the proportions in which they require nitrogen and phosphorus. At a given N:P ratio in the co-limitation range, some species may be limited by nitrogen and others by phosphorus (Suttle and Harrison 1988, Dodds et al. 1989). When algal populations are co-limited by nitrogen and phosphorus, populations can be expected to respond to changes in the supply of either nutrient (from Zipper et al. 2004). A number of researchers have found that co-limitation of primary productivity by nitrogen and phosphorus is common in lakes. As reported by Dodds et al. (1989), “statements that phosphorous is the major nutrient controlling primary productivity in freshwater systems … should not be taken to mean that phosphorous is the only nutrient limiting productivity in all systems.” An example of co-limitation is presented by these researchers. They fertilized algal cultures withdrawn from a Montana reservoir with NH4
+ and PO43- in proportions equivalent to
12
the “Redfield Ratio” and with equivalent amounts of NH4+ and PO4
3- alone. The NH4+ addition
alone stimulated production by 22%; the PO43- addition increased production by 18%; and the
combined addition boosted production by 40% (Dodds et al. 1989) (from Zipper et al. 2004). In reviewing published studies of whole-lake fertilization experiments, Elser et al. (1990) found that enrichment by nitrogen and phosphorus, in combination, was often required to enhance algal growth and conclude that their results provide little support for the conventional wisdom that lake communities are almost always limited solely by phosphorus. A number of studies analyzing data from multiple lakes have found that regressions using both TN and TP can explain more variance in epilimnetic algae (or algal indicators such as chlorophyll) than do regressions using TP alone (Smith 1982, Canfield 1983, McCauley et al. 1989, Prairie et al. 1989) (from Zipper et al. 2004).
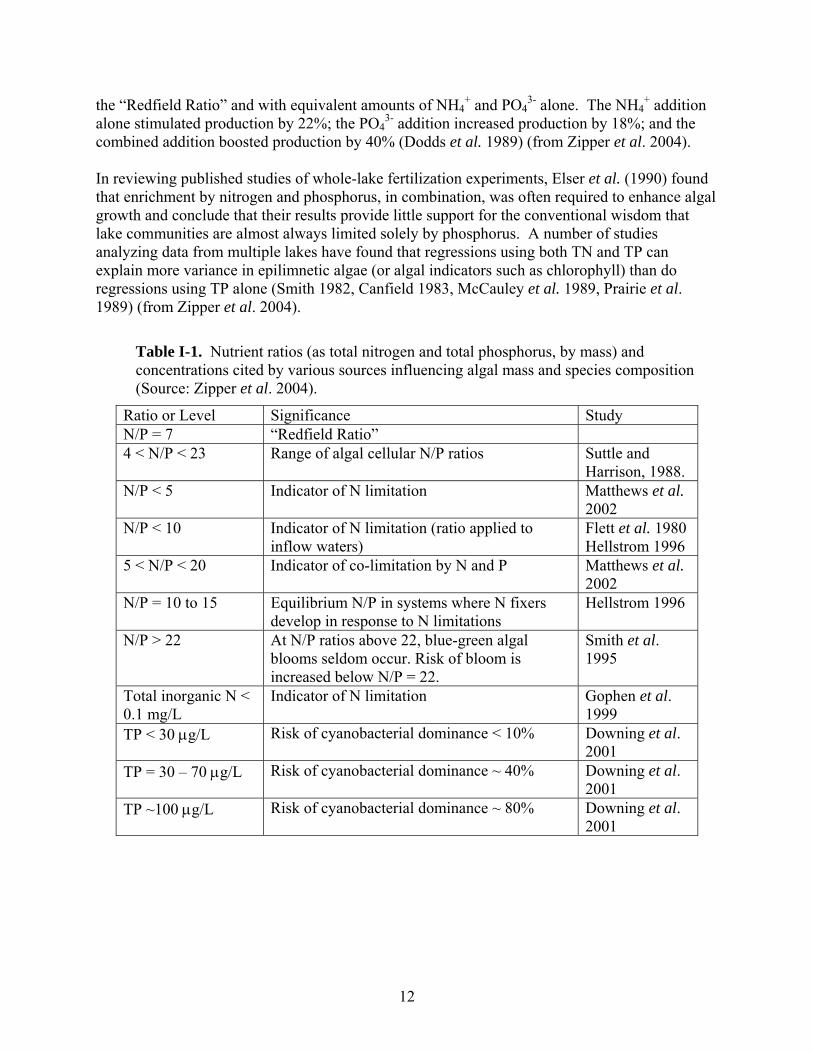
Table I-1. Nutrient ratios (as total nitrogen and total phosphorus, by mass) and concentrations cited by various sources influencing algal mass and species composition (Source: Zipper et al. 2004).
Ratio or Level Significance Study N/P = 7 “Redfield Ratio” 4 < N/P < 23 Range of algal cellular N/P ratios Suttle and
Harrison, 1988. N/P < 5 Indicator of N limitation Matthews et al.
2002 N/P < 10 Indicator of N limitation (ratio applied to
inflow waters) Flett et al. 1980 Hellstrom 1996
5 < N/P < 20 Indicator of co-limitation by N and P Matthews et al. 2002
N/P = 10 to 15 Equilibrium N/P in systems where N fixers develop in response to N limitations
Hellstrom 1996
N/P > 22 At N/P ratios above 22, blue-green algal blooms seldom occur. Risk of bloom is increased below N/P = 22.
Smith et al. 1995
Total inorganic N < 0.1 mg/L
Indicator of N limitation Gophen et al. 1999
TP < 30 μg/L Risk of cyanobacterial dominance < 10% Downing et al. 2001
TP = 30 – 70 μg/L Risk of cyanobacterial dominance ~ 40% Downing et al. 2001
TP ~100 μg/L Risk of cyanobacterial dominance ~ 80% Downing et al. 2001
13
4. Primary Production in Lakes and Reservoirs Primary production refers to the amount of organic matter made from inorganic materials through the process of photosynthesis. Primary producers are organisms able to use inorganic nutrients through the process of photosynthesis to build organic matter. Thus, primary producers need essential nutrients — nitrogen, phosphorus, magnesium, calcium, iron, zinc, etc. — in sufficient amounts in order to live and grow. The main types of primary producers in lakes and reservoirs are phytoplankton, macrophytes, and periphyton.
• Phytoplankton are suspended in the water column and are made up of photosynthesizing organisms such as algae and cyanobacteria. Phytoplankton may exist as single cells, filaments, or colonies of cells. Most phytoplankton have limited mobility so are carried with the flow of the water or settle to the lake bottom. Phytoplankton tend to be the dominant algal community in deeper waters (in the pelagic zone), where the amount of sunlight reaching the lake bottom is inadequate for the growth of macrophytes and periphyton.
• Macrophytes are plants large enough to be seen with the naked eye. They generally have
roots, stems, and leaves. Although mosses lack these tissues, they are also macrophytes. Macrophytes may be rooted in the sediment or free-floating. They are found near shore (in the littoral zone).
• Periphyton refers to a community of organisms usually dominated by algae but also
including bacteria, fungi, protozoa, and other microbes. The primary types of algae that make up periphyton include diatoms, green algae, red algae, chrysophytes, and xanthophytes. Periphyton assemblages, also known as benthic algae, grow on stable surfaces, such as rocks, woody debris, and vascular plants. Periphyton accumulation occurs in shallow waters near shore (in the littoral zone).
In nutrient-enriched lakes and reservoirs, primary producers are often found at high levels and can interfere with the uses of the water body. For example, blooms of phytoplankton may occur when certain types of microscopic phytoplankton grow quickly in the water, forming visible patches. Such nuisance phytoplankton blooms are frequently caused by diatoms or cyanobacteria. In lakes and reservoirs that are warm all year, biomass production is balanced throughout the year. In lakes in temperate environments, however, there is much seasonal variability in primary production and species composition. The amount of primary production is low in winter in temperate water bodies. Small, motile algae are likely to dominate in winter (Wetzel 2001). From spring through fall, blooms of different types of phytoplankton are most likely to occur in lakes and reservoirs in temperate regions. For example, blooms of diatoms are likely to occur in spring and fall when nutrient levels are often high. Dominance by green algae may follow the dominance by diatoms. In summer when nutrients levels are likely to be low (particularly nitrogen), blooms of cyanobacteria are common (Horne and Goldman 1994, Wetzel 2001). Depending on the environmental conditions, much variability in biomass production can be expected from year-to-year.
14
Although research into lakes and reservoir productivity has focused on phytoplankton productivity, contributions of macrophytes and periphyton can also be important. Most lakes and reservoirs are small so that the ratio of the littoral zone to pelagic zone is large. For these water bodies, macrophytes and periphyton may have a major impact on the lake ecosystem. Horne and Goldman (1994) report that emergent reeds and submerged macrophytes are the dominant primary producers and contribute the most biomass in small lakes. Wetzel (1975, p. 418) states, “In most lakes, the littoral complex of macrophytes and associated microflora is foremost in regulation of rates of eutrophication and in functional impact on the system as a whole.” Cyanobacteria Species of cyanobacteria, also called blue-green algae, vary widely in growth habits and characteristics. They are the primary nitrogen fixers in most lake and reservoir systems, however, not all cyanobacteria are nitrogen fixers. Cyanobacteria can be expected to have a negative effect on the capabilities of lakes that have aquatic life support, recreation, and water supply designated uses. Cyanobacteria are less suitable as food sources for zooplankton than other phytoplankton species; therefore, blooms of cyanobacteria will have a negative effect on higher trophic levels, including fish. Some cyanobacteria species release toxins to the water column that can be harmful to consumer organisms, including zooplankton and fish. Blooms of some species of cyanobacteria will also cause water clarity to exhibit greater decline than occurs in response to an equivalent biomass of green algae species and thus will have a negative effect on the recreational suitability of water bodies. In reservoirs used as water supplies, blooms of cyanobacteria can result in increased treatment requirements for several reasons. Bloom conditions for species of cyanobacteria have been observed to (1) reduce filter operation efficiency due to the presence of floating mats, (2) increase intensity and frequency of taste and odor episodes due to the secretion of extracellular metabolites (ECM’s), and (3) enhance the formation of regulated disinfection by-products from the reaction of chlorine with ECM’s (Hyenstrand et al. 1998, Dokulil and Teubner 2000). Several characteristics of cyanobacteria contribute to their capability to dominate under eutrophic conditions (Dokulil and Teubner 2000). Cyanobacteria are known to have lower light intensity requirements than other algal species, which allows them to have a competitive advantage under darkened environments such as those that occur under eutrophic conditions. Non-N-fixing cyanobacteria are believed to have a limited capability to assimilate nitrogen as NO3
- but are highly competitive for ammonium-N (Blomqvist et al. 1994, Hyenstrand et al. 1998). This nitrogen-species preference can provide a competitive advantage for non-N-fixing cyanobacteria under eutrophic conditions that accelerate the accumulation of particulate organic nitrogen and consequently leads to oxygen depletion in the subsurface. The resultant anoxic conditions allow conversion of organic nitrogen to NH4
+ but hinder NH4+ conversion to NO3
- and stimulate denitrification losses of NO3
- to gaseous forms. Cyanobacteria tend to be excellent competitors for phosphorus at relatively high concentrations characteristic of eutrophic systems but less successful at lower concentrations (Suttle and Harrison 1988). Some species of cyanobacteria are able to regulate their buoyancy, allowing them to move vertically in the water column to take advantage of differential vertical availability of light and nutrients (Klemer and Kanopka 1989). Some of these buoyancy-regulating species also have a capability to assimilate
15
and store phosphorus internally, allowing them to obtain phosphorus from the sediments and gain a competitive advantage under conditions of phosphorus limitation (Hyenstrand et al. 1998). Numerous factors influence cyanobacterial dominance. Due in part to the variety of species and species properties within the cyanobacteria group, the capability to predict conditions that will cause cyanobacteria blooms is fairly rudimentary. There is no single factor or theory that adequately explains or predicts cyanobacterial dominance (Hyenstrand et al. 1998). For example, although cyanobacterial dominance often occurs under eutrophic or hypertrophic conditions, there have been instances where cyanobacterial dominance has occurred under oligotrophic conditions. Working in shallow Danish lakes, Jensen et al. (1994) found different groups of cyanobacteria to be dominant under low N:P ratios and high phosphorus conditions. It has also been observed that inorganic nitrogen speciation can affect algal species dominance. One study of the Occoquan Reservoir in Virginia found that changes in the inorganic nitrogen supply from ammonium to nitrate were accompanied by shifts in algal species dominance away from cyanobacteria and towards green algae and diatoms (T. Grizzard, personal communication). The observed shift was also found (at least anecdotally) to have beneficial impacts on water treatment operations. In addition to nutrient-related factors, other water body properties can contribute to the growth of cyanobacteria. Because cyanobacteria have a high affinity for carbon as HCO3
-, conditions of low pH have been demonstrated to increase the potential for cyanobacterial dominance. Elevated water temperatures and high availabilities of trace elements are also favorable conditions for cyanobacterial development. Because cyanobacteria have higher requirements for trace elements than other algal forms, their development is hindered in water bodies with low trace element concentrations. Working with data derived from southeastern lakes and reservoirs (predominantly reservoirs, extending from Mississippi to Maryland), Reckhow (1988) found the probability of cyanobacteria dominance to increase with increasing TP, decreasing TN (and thus, by inference, decreasing TN:TP ratios), and increasing hydraulic residence time. Cyanobacterial dominance also tended to be associated with anoxic conditions in the hypolimnion. SECTION I-C. PROBLEMS ASSOCIATED WITH EXCESS NUTRIENTS IN LAKES AND RESERVOIRS Although an excessive supply of nutrients in lakes and reservoirs can lead to eutrophication, the nutrients themselves generally do not interfere with the designated uses. Instead, it is the trophic response to the nutrient enrichment that causes most of the problems. Such responses include heavy growth of phytoplankton and macrophytes and reduced levels of oxygen (particularly in the hypolimnion). Thus most problems caused by excess nutrients are related directly or indirectly to the excessive growth of primary producers (phytoplankton, macrophytes, and periphyton). The first question for protecting any water body is "What are the uses to be protected?" Water quality managers must consider the intended use of the water (e.g., aquatic life support, recreation, flood control, hydroelectric power generation, drinking water supply, etc.). The assignment of uses needs to be clear. Not every lake and/or reservoir will need to meet every
16
use. For example, many lakes in the nation are not designated for water supply use. Designated uses are often categorized into aesthetic/recreational, aquatic life, and water supply uses. Some ways that lakes and reservoirs can be impaired by nutrients or the trophic response to nutrients are provided. The effects from depletions in dissolved oxygen, fluctuations in pH, impacts of toxins, changes in the aquatic life community, and formations of disinfection byproducts in drinking water are also described.
• Aesthetic and recreational use impairments -- Excessive and visible algal growth is unappealing to many swimmers and other lake/reservoir users. -- Excessive algal growth causes slippery rocks in the shallow reaches of lakes or reservoirs and can be hazardous for users who walk or play in these regions. -- Fishing lures may become tangled in excessive growth of algae and macrophytes. -- Boat propellers may get tangled by excessive growth of some types of aquatic vegetation.
• Aquatic life use impairments
-- Depletion of oxygen concentrations may stress or kill aquatic life. -- Fluctuations in pH values may negatively impact aquatic life. -- Toxicity may result from high ammonia levels (e.g., > 1 mg/L NH3-N). -- Some algal blooms may release toxic compounds (e.g., cyanotoxins). -- A loss of diversity and other changes in the aquatic plant, invertebrate, and fish community structure may result.
• Drinking water and industrial water supply use impairments
-- Diatoms and filamentous algae can clog water intake screens and filters in water treatment plants. -- Decay of algae may lead to taste and odor problems in drinking water. -- Hypolimnetic oxygen depletion can lead to a release of iron and manganese in the sediment, causing taste and staining problems in drinking water unless treated. -- Water treatment costs may rise for waters drawn from eutrophic sources by requiring more backwashing, treatment, etc. -- Disinfection byproducts (e.g., trihalomethanes, haloacetic acids), which pose a potential risk to human health, may form during treatment of eutrophic waters to produce drinking water. -- Increased risk of bacterial growth in drinking water because of fouling within the distribution system and the increased nutrient content of the water. -- Methemoglobinemia (blue-baby syndrome) may affect infants if nitrate levels >10 mg/L in drinking water.
1. Dissolved Oxygen Depletion Dissolved oxygen (DO) is the soluble form of oxygen found in lakes and reservoirs. Low levels of DO have both direct and indirect effects on the uses of lakes and reservoirs. Excessive growth of primary producers may lead to low DO concentrations, particularly in the hypolimnion. Although primary producers generate oxygen during photosynthesis, they also use oxygen for
17
respiration, a process that continues even at night when photosynthesis has ceased. Furthermore, as primary producers die, they are decomposed by bacteria that consume oxygen, and large populations of decomposers can consume large amounts of dissolved oxygen. Because fish and other aquatic organisms obtain oxygen from the water as DO, the amount of DO in the water directly affects aquatic life. Many aquatic insects, fish, and other organisms become stressed and may even die when DO levels drop below a particular threshold level (e.g., below 5 mg/L). For this reason, therefore, states and tribes currently have ambient freshwater DO criteria to protect aquatic life. In addition to the direct influence that oxygen concentrations can have on aquatic life, low oxygen levels may also have indirect effects on aquatic life as well as on the taste and odor of drinking water. Low DO levels may cause nutrient releases from sediment. For example, when oxygen is present, ferric ions (an insoluble form of iron, Fe3+) and phosphates (PO4
3-) form complexes and sink to the sediment so that the phosphate is unavailable to primary producers. Under low oxygen (anoxic) conditions, however, the iron is transformed to its reduced state (a soluble form of iron, Fe2+), whereby the ferrous ions and phosphates are released to the water. If phosphates enter the productive zone, they could stimulate additional algal growth. As these algae die and subsequently decay, additional oxygen is required, which could potentially lead to more anoxic conditions and additional releases of nutrients from the sediment (Brönmark and Hansson 2005). In addition to releasing ferrous ions from the sediment, reduction-oxidation reactions also occur under anoxic conditions to reduce particulate manganese oxides (Mn4+) to dissolved manganese (Mn2+). Likewise, under anoxic conditions, sulfate (SO4
2-) in the sediment is converted to hydrogen sulfide (H2S), which can be toxic to bottom-dwelling organisms. Furthermore, hydrogen sulfide, iron, and manganese are undesirable in drinking water because they are associated with odor, taste, and staining problems. When a lake or reservoir has high levels of these substances and is used for potable water supply, additional treatment is needed for their removal (Cooke and Carlson 1989, Horne and Goldman 1994). The treatment often involves some form of oxidant (e.g., chlorine) that may form harmful disinfection byproducts in the presence of organic matter (see below: Production of Disinfection Byproducts in Drinking Water). 2. pH Fluctuations The pH of water is a measure of its acid-base condition (range: 0 – 14, with 7 being neutral, less than 7 indicating acidic conditions, and greater than 7 indicating basic conditions). The pH is controlled by the production of hydrogen ions (H+) and hydroxyl ions (OH-). Daily fluctuations of water column pH can be caused by excessive primary production. When photosynthesis is occurring, the water column pH level tends to be more basic. During photosynthesis, carbon dioxide (CO2) and water are converted by sunlight into oxygen and sugar (glucose, C6H12O6). During the formation of glucose, hydroxyl ions are produced. These hydroxyl ions raise the water column pH (make it more basic). Furthermore, the removal of
18
dissolved CO2 for photosynthesis results in lower levels of carbonic acid (H2CO3) in the water column, which causes a shift to a less acidic condition (more basic condition). More acidic conditions occur at night when photosynthesis ceases but respiration continues. Respiration results in the release of CO2 into the water and thus increases the production of carbonic acid:
CO2 + H2O H2CO3. Carbonic acid dissociates, producing hydrogen ions that lower the water column pH (H2CO3 HCO3
- + H+). Extremes in pH are stressful and can even be deadly to aquatic organisms. High pH levels increase the toxicity of some substances, such as ammonia, whereas low pH levels can make heavy metals in the sediment more mobile. Water column pH also affects the availability of phosphorus for algal intake, with phosphorus being unavailable to algae at high and low pH levels. High pH levels can damage fish gills, eyes, and skin. Low pH levels can interfere with fish reproduction. Levels of pH too high (e.g., > 9) or too low (e.g., < 5) can kill aquatic life. 3. Release of Toxins Some kinds of primary producers release toxins that can kill fish and other organisms. These toxins can taint drinking water supplies and recreational waters. For example, the deaths of livestock have been attributed to drinking water contaminated with toxin-producing cyanobacteria (Bowling and Baker 1996). Humans who drink or swim in water that contains high concentrations of toxins from cyanobacteria may experience gastroenteritis, skin irritation, allergic responses, or liver damage (CDC 2004). To protect human health from toxins produced from harmful algal blooms, the World Health Organization recommends maintaining cyanobacteria levels below certain thresholds (e.g., keeping recreational waters below 20,000 cyanobacterial cells/mL to protect against irritative or allergenic health effects) (Chorus and Bartram 1999). 4. Changes in the Aquatic Life Community The effect of nutrient enriched waters on the aquatic life in lakes and reservoirs depends on many factors. In some instances, nutrient inputs to lakes and reservoirs can be utilized by the existing aquatic organisms without causing measurable changes in the community structure. In other situations, excessive levels of nutrients can increase the amount of primary production, which then may support a more productive system (one that has a similar taxonomic composition but more individuals). As a third possible response, the taxonomic composition and structure of aquatic communities may also change with the addition of nutrients. Such changes could include the loss of certain species and a shift in the dominance of a particular taxonomic group or groups able to tolerate the new conditions. 5. Production of Disinfection Byproducts in Drinking Water Most public water supplies in the U.S. are treated with some form of disinfection to protect consumers against bacteria and parasites that may be present in the water. Chlorine, ozone,
19
chloramines, and chlorine dioxide are commonly used disinfectants. When these disinfectants react with organic matter (e.g., decaying vegetation) found in the water, byproducts form that may be hazardous to human health if consumed over long periods of time. For example, the disinfectant byproducts trihalomethanes (THMs), haloacetic acids (HAAs), and bromate are potentially cancer causing agents. Chlorite, another common byproduct, is known to cause anemia and affect the nervous system of infants and young children. The U.S. EPA has thus set monitoring requirements and maximum contaminant levels (MCLs) for some of the more common byproducts (THMs: MCL = 0.080 mg/L annual average; HAAs: MCL = 0.060 mg/L annual average, bromate: MCL = 0.010 mg/L annual average; and chlorite: MCL = 1.0 mg/L monthly average) (U.S. EPA 2003b).
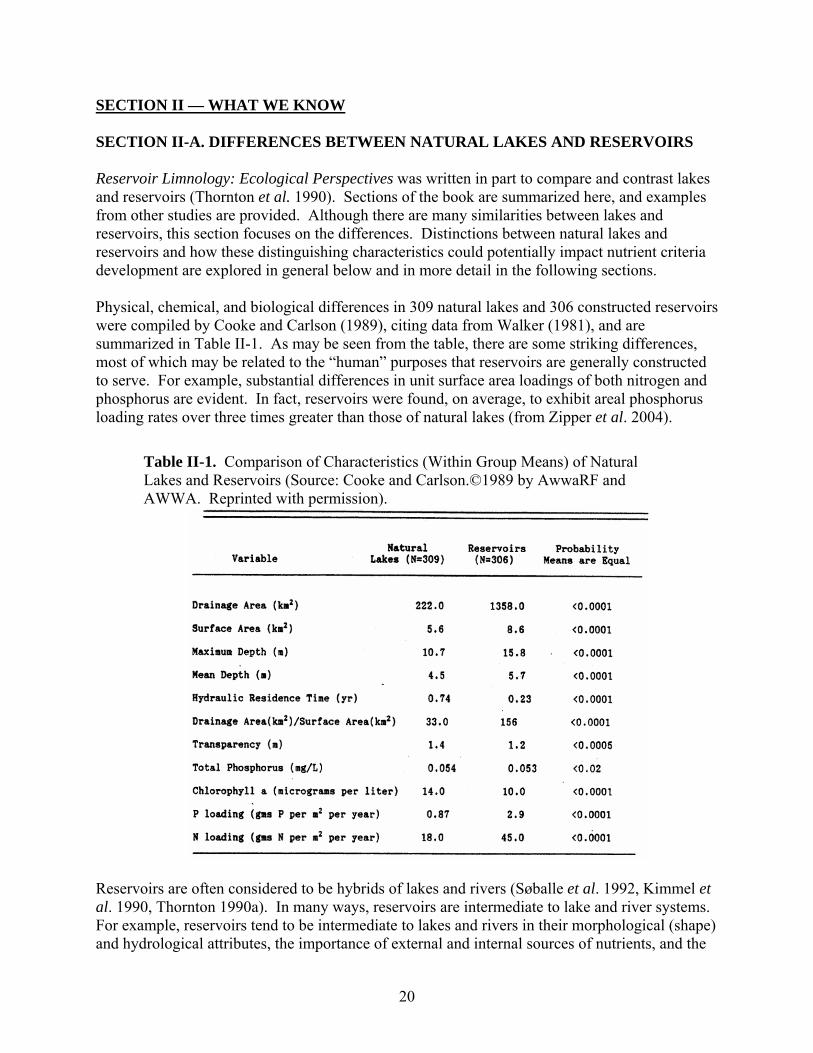
20
SECTION II — WHAT WE KNOW SECTION II-A. DIFFERENCES BETWEEN NATURAL LAKES AND RESERVOIRS Reservoir Limnology: Ecological Perspectives was written in part to compare and contrast lakes and reservoirs (Thornton et al. 1990). Sections of the book are summarized here, and examples from other studies are provided. Although there are many similarities between lakes and reservoirs, this section focuses on the differences. Distinctions between natural lakes and reservoirs and how these distinguishing characteristics could potentially impact nutrient criteria development are explored in general below and in more detail in the following sections. Physical, chemical, and biological differences in 309 natural lakes and 306 constructed reservoirs were compiled by Cooke and Carlson (1989), citing data from Walker (1981), and are summarized in Table II-1. As may be seen from the table, there are some striking differences, most of which may be related to the “human” purposes that reservoirs are generally constructed to serve. For example, substantial differences in unit surface area loadings of both nitrogen and phosphorus are evident. In fact, reservoirs were found, on average, to exhibit areal phosphorus loading rates over three times greater than those of natural lakes (from Zipper et al. 2004).
Table II-1. Comparison of Characteristics (Within Group Means) of Natural Lakes and Reservoirs (Source: Cooke and Carlson.©1989 by AwwaRF and AWWA. Reprinted with permission).
Reservoirs are often considered to be hybrids of lakes and rivers (Søballe et al. 1992, Kimmel et al. 1990, Thornton 1990a). In many ways, reservoirs are intermediate to lake and river systems. For example, reservoirs tend to be intermediate to lakes and rivers in their morphological (shape) and hydrological attributes, the importance of external and internal sources of nutrients, and the
21
input of organic matter from outside the system (allochthonous) and from within the system (autochthonous) (15 citations in Kimmel et al. 1990). Characteristics of individual reservoirs vary extensively; some reservoirs more closely resemble lakes whereas others are more similar to rivers. For example, run-of-the-river reservoirs are usually turbid and have short hydraulic residence times so are more similar to rivers, whereas many tributary-storage reservoirs tend to have characteristics that are more like natural lakes (Kimmel et al. 1990, Kennedy 2001). 1. Difference in Nutrient Input, Cycling and Export Compared to natural lakes, reservoirs tend to be more influenced by nutrients and other substances transported from the surrounding land. Main differences between lakes and reservoirs that impact the input of nutrients include the location within the watershed, comparative size of the catchment area, the shape of the water body, and the quality of inflowing water.
• Within a watershed, natural lakes are generally located near the headwaters whereas reservoirs tend to be located further downstream. Many reservoirs, particularly mainstem-storage reservoirs, are located near the mouth of large basins (Kennedy 2001). The lower position in the watershed for reservoirs means they are fed by larger drainage areas and are fed by higher-order streams compared to lakes (Thornton 1990a, 1990b).
• Reservoirs typically have much larger watersheds than natural lakes of comparable size. In the samples compiled by Cooke and Carlson, the ratio of drainage area:pool area was almost five times larger for constructed impoundments. This trait exposes reservoirs to higher mass fluxes of constituents (including nutrients) carried in tributary streamflows (from Zipper et al. 2004).
• Lakes are more circular in shape whereas reservoirs are long, narrow, and dendritic (tree-like). The shape of reservoirs has been shown to increase contact with the terrestrial ecosystem by a factor of 4 to 8 compared to natural lakes (Søballe et al. 1992). This difference can be described by the shoreline development ratio, which measures the actual shoreline length to the circumference of a circle that has the same surface area (A perfectly round lake or reservoir would have a shoreline development ratio of 1). Many glacial lakes in the U.S. have shoreline development ratios between 1.5 and 2.5 (Hutchinson 1957 in Søballe et al. 1992). In comparison, Søballe et al. (1992) found U.S. Army Corps of Engineers reservoirs in the Southeast to have a median shoreline development ratio of 12.
• Wetland areas of natural lakes filter incoming runoff from adjacent land and prevent some nutrients from reaching the lake system. In contrast, many reservoirs lack well-established wetlands because of common fluctuations in water levels and thus have diminished runoff filtering capabilities (Wetzel 1990, Søballe et al. 1992). Furthermore, the flow from one or two main tributaries serves as a much more important source of water for reservoirs, and this incoming water often carries large sediment and nutrient loads (Kennedy and Walker 1990, Thornton 1990b, Wetzel 1990).
Nutrient circulation within reservoirs differs from that in lakes primarily because of density flows, advective flow, and a longitudinal (from upstream to downstream) gradient:
• Density flows consist of incoming water of a different density than that in the lake or reservoir. Density flows may enter at the surface, middle, or bottom regions (Ford 1990,
22
Kennedy and Walker 1990, Søballe et al. 1992). When lakes and reservoirs are stratified, incoming nutrients may be isolated to a particular vertical layer. For example, if the incoming water is denser, it will flow to the bottom of the basin where its nutrients will be unavailable to phytoplankton in the epilimnion (Kennedy and Walker 1990). Because reservoirs receive the majority of incoming water from a continuous source of one or two large tributaries, density flows have a much larger impact on reservoirs than on lakes (Ford 1990, Kennedy and Walker 1990).
• Advective flow is the overall movement of water due to currents caused by inflows, outflows, and wind (Ford 1990). This flow is generally minimal in natural lakes but is pronounced in reservoirs. Advective flow contributes to reservoirs having a shorter hydraulic residence time than lakes; short residence times provide less time for phytoplankton to obtain nutrients from the water and to reproduce and grow in population (Søballe and Kimmel 1987).
• In reservoirs, advective flow in conjunction with a deepening basin as the water flows from the river to the dam often causes a continuous longitudinal gradient. This upstream-to-downstream gradient affects the bottom substrate and shape of the reservoir, the velocity of the water, water temperature, sediment and nutrient loads within the reservoir, and the biotic community (6 citations in Søballe et al. 1992) (For more information, see Section II-B). In contrast, lakes lack a longitudinal gradient.
The loss of water from natural lakes and reservoirs can differ in a number of ways that impact nutrient levels within the system and in downstream receiving waters. Natural lakes lose water and thus nutrients from surface overflows following snow melts and heavy rains. These events tend to be infrequent. The loss of nutrients from reservoirs, however, is controlled by the operation of the outlet structure. Depending on the dam design, the outlets can discharge water from the top, midsection, and/or bottom of the dam. Reservoirs that release water from the surface act more like natural lakes (Ford 1990). The amount, timing, and frequency of reservoir releases influence the water quality of the reservoir and the export of nutrients. For example, reservoirs used for flood control can have infrequent releases, whereas reservoirs used to generate power may have daily releases (Kennedy 2001). Because of large drawdowns in some reservoirs, wide fluctuations in water levels are possible. As water levels drop during these large drawdowns, the water and nutrients from inlets are forced into the deeper regions and thereby may serve as a source of nutrients for phytoplankton (Ford 1990) or may exit the reservoir and impact the downstream waters. More information on how the structure and operation of dams affects nutrients in reservoirs is provided in Section II-B. 2. Differences in Primary Production Levels In Developing Eutrophication Standards for Lakes and Reservoirs, the North American Lake Management Society (1992) states, “For the purposes of this document, perhaps the most important distinction between rivers, reservoirs, and lakes is that of algal abundance per unit of phosphorus” (p. 9). Canfield and Bachman (1981) examined data from more than 700 natural lakes and reservoirs and compared their nutrient and response parameters. They found that reservoirs usually have substantially lower chlorophyll-a levels than natural lakes at the same phosphorus concentrations (Søballe and Kimmel 1987).
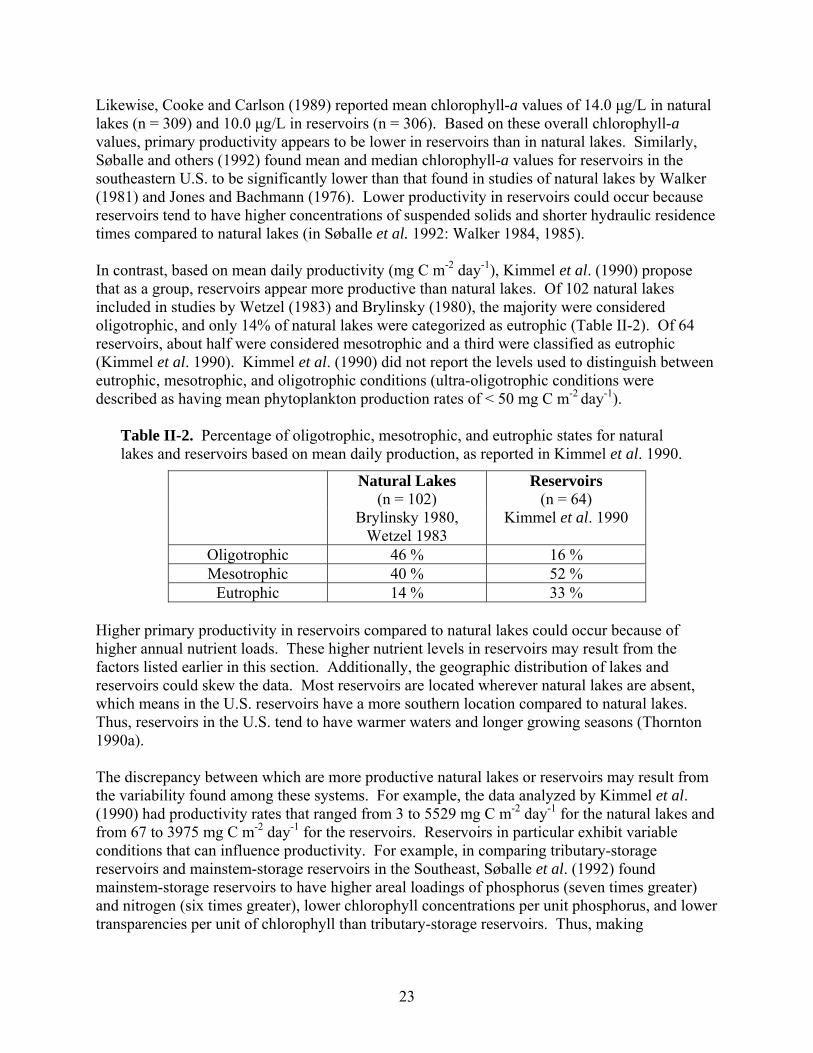
23
Likewise, Cooke and Carlson (1989) reported mean chlorophyll-a values of 14.0 μg/L in natural lakes (n = 309) and 10.0 μg/L in reservoirs (n = 306). Based on these overall chlorophyll-a values, primary productivity appears to be lower in reservoirs than in natural lakes. Similarly, Søballe and others (1992) found mean and median chlorophyll-a values for reservoirs in the southeastern U.S. to be significantly lower than that found in studies of natural lakes by Walker (1981) and Jones and Bachmann (1976). Lower productivity in reservoirs could occur because reservoirs tend to have higher concentrations of suspended solids and shorter hydraulic residence times compared to natural lakes (in Søballe et al. 1992: Walker 1984, 1985). In contrast, based on mean daily productivity (mg C m-2 day-1), Kimmel et al. (1990) propose that as a group, reservoirs appear more productive than natural lakes. Of 102 natural lakes included in studies by Wetzel (1983) and Brylinsky (1980), the majority were considered oligotrophic, and only 14% of natural lakes were categorized as eutrophic (Table II-2). Of 64 reservoirs, about half were considered mesotrophic and a third were classified as eutrophic (Kimmel et al. 1990). Kimmel et al. (1990) did not report the levels used to distinguish between eutrophic, mesotrophic, and oligotrophic conditions (ultra-oligotrophic conditions were described as having mean phytoplankton production rates of < 50 mg C m-2 day-1).
Table II-2. Percentage of oligotrophic, mesotrophic, and eutrophic states for natural lakes and reservoirs based on mean daily production, as reported in Kimmel et al. 1990.
Natural Lakes (n = 102)
Reservoirs (n = 64)
Brylinsky 1980, Wetzel 1983
Kimmel et al. 1990
Oligotrophic 46 % 16 % Mesotrophic 40 % 52 %
Eutrophic 14 % 33 % Higher primary productivity in reservoirs compared to natural lakes could occur because of higher annual nutrient loads. These higher nutrient levels in reservoirs may result from the factors listed earlier in this section. Additionally, the geographic distribution of lakes and reservoirs could skew the data. Most reservoirs are located wherever natural lakes are absent, which means in the U.S. reservoirs have a more southern location compared to natural lakes. Thus, reservoirs in the U.S. tend to have warmer waters and longer growing seasons (Thornton 1990a). The discrepancy between which are more productive natural lakes or reservoirs may result from the variability found among these systems. For example, the data analyzed by Kimmel et al. (1990) had productivity rates that ranged from 3 to 5529 mg C m-2 day-1 for the natural lakes and from 67 to 3975 mg C m-2 day-1 for the reservoirs. Reservoirs in particular exhibit variable conditions that can influence productivity. For example, in comparing tributary-storage reservoirs and mainstem-storage reservoirs in the Southeast, Søballe et al. (1992) found mainstem-storage reservoirs to have higher areal loadings of phosphorus (seven times greater) and nitrogen (six times greater), lower chlorophyll concentrations per unit phosphorus, and lower transparencies per unit of chlorophyll than tributary-storage reservoirs. Thus, making
24
generalizations is very difficult because individual lakes and reservoirs exist in various geographic locations and have widely differing structural and hydrologic conditions. 3. Differences in Modeling Nutrient-Related Processes Empirical models, such as nutrient-loading models, identify patterns within data sets. Regression analysis is applied in empirical models whereby the value of a known variable is used to predict the value of an unknown variable. Empirical models should not be used for water bodies that lie outside the range of data used to calibrate the model. Nutrient-loading models were originally designed and calibrated from data collected from natural lakes (e.g., model in Vollenweider 1969), and subsequent models are based on these early models (e.g., Canfield and Bachman 1981). Because of the differences between natural lakes and reservoirs, empirical models developed from natural lakes tend not to work well in reservoirs (in Kimmel et al. 1990: Lind 1979, Placke and Poppe 1980, Hannan et al. 1981, Higgins et al. 1981, Gloss et al. 1981, Placke 1983). For example, Smith (1990) concluded that both summer mean algal biomass and the relative biomass of cyanobacteria in four North Carolina reservoirs characterized by high levels of non-algal turbidity were lower than predicted by models developed in natural lakes. Potential reasons why empirical models developed for use in natural lakes may not work well in reservoirs include the following (Kennedy and Walker 1990, Kimmel et al. 1990, Zipper et al. 2005):
• Most of the analyses of trophic state (e.g., Carlson’s TSI) are based on the relationships of phosphorus, chlorophyll-a, and water transparency (Secchi disk depth) in northern natural lakes. These relationships are less robust in reservoirs. For example, Reckhow (1988) found a weak relationship between chlorophyll-a and phosphorus concentrations (r2 = 0.10) in reservoirs. In contrast, natural lakes tend to have close associations between these two variables (r2 ~0.70) (Brown et al. 2000). As another example, a study of more than 700 natural lakes and reservoirs from throughout the U.S. indicated that chlorophyll-a relationships with TP and Secchi depth were far more variable in reservoirs than in natural lakes (Canfield and Bachman 1981).
• Most models are developed with the assumption that phosphorus is the primary factor limiting algal growth (Kimmel et al. 1990). Other nutrients, such as nitrogen (see Section I-B, “Nutrient Limitation”), or other factors may also limit algal production, particularly in reservoirs. For example, light is often the primary factor limiting algal growth in turbid reservoirs (in Kimmel et al. 1990: Kimmel and Lind 1972, O’Brien 1975).
• Reservoirs frequently have high levels of suspended sediment that contain phosphorus. Thus, much of the phosphorus in reservoirs exists in the particulate form, and this form is not biologically available for use by primary producers. Thus, although reservoirs may have high loads of phosphorus, the supply may not translate to higher levels of biologically available forms of phosphorus (Canfield and Bachmann 1981).
• Hydrologic differences between lakes and reservoirs would not be accounted for in models developed for natural lakes. Hydraulic residence time, density flows, fluctuations in water levels, and discharges as described earlier differ between natural lakes and reservoirs. These differences affect nutrient availability and primary productivity and therefore potentially affect the ability of models to predict the trophic condition of
25
reservoirs. For instance, the location of the dam outlet influences temperature characteristics within reservoirs and creates a source of variability that is not present in natural lakes.
• Longitudinal gradients of the factors controlling trophic state exist in reservoirs but are lacking in natural lakes. The location of monitoring points within the reservoir, therefore, could determine the trophic state classification. A single reservoir can grade from eutrophic in its upper reaches to oligotrophic near the dam (Kimmel and Groger 1984, Kimmel et al. 1990, Søballe et al. 1992). Thus, predictions from spatially averaged conditions may not accurately describe the trophic state of reservoirs (Kennedy and Walker 1990).
SECTION II-B. IMPOUNDMENT ISSUES THAT AFFECT NUTRIENTS Wetzel (1990, p. 237) writes, “The irregular and extreme variations in physical factors in many reservoirs frustrate our search both for unity and order and for generalized management techniques among these ecosystems.” In comparison to natural lakes, nutrient processes in reservoirs are the same, but “…the input variables [for reservoirs] are more complex and dynamic than in many natural lakes” (Wetzel 1990, p.237). 1. Dam Effects Dams allow water to be stored and retained for subsequent controlled release. Thus, dams serve two main purposes: to store water and raise water levels. Because dams vary tremendously in size (height and width), they also vary greatly in the amount of water storage. For example, a dam on a run-of-the-river reservoir will usually be relatively low and thus consequently, yields a small storage volume and hydraulic head, and a short residence time. In contrast, a tributary-storage dam is typically tall and thus has a large storage volume and hydraulic head, and a long residence time (Søballe et al. 1992, U.S. EPA 1993). These differences among reservoirs, which can be attributed to the structure and operation of the dam, affect nutrient processes within reservoirs and in the downstream receiving waters (More information about the impact to downstream waters is in Section II-F.). Dams often cause a longitudinal gradient from the inflow to the outflow. Based on this gradient, reservoirs can be divided into three zones: riverine, transitional, and lacustrine (Kimmel and Groeger 1984, Kennedy and Walker 1990, Kimmel et al. 1990, Søballe et al. 1992). The boundaries separating these zones are not distinct and are not fixed (Kennedy and Walker 1990). The zone regions expand and contract in response to watershed runoff events, operation of the dam, and other changes within the reservoir that influence the flow (Kimmel et al. 1990).
• The riverine zone is located furthest from the dam and is characterized by having the highest flow velocity and shortest hydraulic residence time. This region tends to receive relatively high levels of nutrients and particulate matter. The turbidity within this zone limits light penetration so primary production can be limited by light in this region.
• The transitional zone is marked by an increase in basin breadth, which allows the water to spread out and thus decrease its velocity. The hydraulic residence time of the transition zone is therefore longer than that in the riverine zone. As the water velocity slows, silt,
26
clays, and fine particulate organic matter settle out of the water. Light penetration, therefore, increases in this zone. In this region, nutrient recycling begins to become a more important nutrient source than is the input of nutrients from tributaries. It is not uncommon for the transition zone to be the most productive region of the reservoir.
• The lacustrine zone is closest to the dam and most “lake-like” in characteristics. This region of the reservoir has the longest hydraulic residence time, and thus, fine clays and colloidal matter are able to settle out of the water. Most nutrients available for primary production come from within the system. During the growing season, primary production may be limited by nutrients in this zone (Thornton 1990a, Kimmel et al. 1990).
Because of the longitudinal gradient, changes in nutrient, sediment, and phytoplankton levels are often apparent from the inflow to outflow reaches of reservoirs (Kennedy and Walker 1990). It should also be noted that other influences may prevent this longitudinal gradient from forming. For example, decreased nutrient input in the upper reaches of Lake Mead due to an upstream reservoir and increased wastewater discharges from Las Vegas to a lower section of the reservoir prevents the formation of the longitudinal pattern typically observed for nutrients (Kimmel et al. 1990). The operation of the reservoir’s dam influences the amount of water released, the frequency of the release, and the timing of the release. For example, dams within reservoirs used for flood control are often operated so that water levels are lowered before the predicted flooding season to allow storage of peak flows during heavy precipitation events. These drawdowns decrease downstream high flows, stretch out or increase base flows, and alter the timing of seasonal flows (Petts 1984). Consequently, these changes in flow also change the load of nutrients exiting the reservoirs and thereby affect nutrient concentrations within reservoirs and downstream receiving waters. As another example, operation of the dam can affect the temperature and material build up of reservoirs. Dams that release water from the top behave more like natural lakes. Discharge from near the surface results in a loss of epilimnion waters (upper layer waters). Since the epilimnion waters are warmer in summer, top releases can cause the reservoir to become cooler during the growing season. In contrast, dams that withdraw water from the bottom, tend to release the cooler, hypolimnion waters plus settling material (including nutrients) (Kennedy 2001). Thus bottom-release dams result in expanding the epilimnion, warming the hypolimnion waters, and weakening the density gradient. Some dams allow releases from different depths so that operators can select from which depth to draw. With this type of dam, the outflow can be limited to a particular layer when the reservoir is stratified (Ford 1990). 2. Sedimentation Dams have the ability to trap large amounts of sediment. This sediment decreases the storage capacity of reservoirs and thus may impair the function of the reservoir. Reservoirs are often designed to hold an anticipated 100 years worth of sediment. Land use practices that disturb soil can greatly increase the amount of settable material contributed to reservoirs and thus reduce the functional life of the reservoir. For example, sediment yield increased by two orders of
27
magnitude in regions with extensive road construction (Morris and Fan 1998). Such settlable particles need to be considered when developing nutrient criteria owing to their sorptive relationship with nutrients and their effect on primary production. The differences in watershed characteristics of lakes and reservoirs, as described in Section II-A, control the quantity of particulate matter delivered to the system. In general, reservoirs have larger catchment areas and greater inflows compared to natural lakes. These factors increase the potential for greater sediment (and nutrient) loads to reservoirs (Thornton 1990b). Because reservoirs are fed primarily by one or two main tributaries, reservoirs are more influenced by precipitation events that carry high but irregular loads of particulate material and nutrients. Furthermore, the high velocity inflows to reservoirs have substantial energy for erosion, and the larger volumes of inflow yield higher sediment-load carrying capacities (Wetzel 1990). Silt and clay particles have high sorptive capacities, particularly for phosphorus. Therefore, these particles frequently carry high levels of nutrients (in Thornton 1990b: Duffy et al. 1978, McCallister and Logan 1978, Schreiber and Rausch 1979, Sharpley and Syers 1979, Sharpley et al. 1987). Such nutrient-laden material settles within the reservoir as flow velocities decrease. Sedimentation of entering particulate material is controlled by the settling velocity (rate at which the particle settles, which is influenced by the shape, size, and density of the particle as well as the viscosity and density of the water), settling distance (depth), time available for settling to occur (residence time), and biological processes (e.g., intake by feeding zooplankton, resuspension by bottom-feeding organisms) (Jones et al. 2004). Thus, physical and biological characteristics control sedimentation. As described earlier, reservoirs experience longitudinal zones with differing characteristics that influence sedimentation. The riverine zone receives the highest input of particulate matter and is the region where the largest and densest particles settle. Primary production is sometimes limited in this zone because of turbidity (Wetzel 1990). In the transition zone, silts, coarse-to-medium clays, and fine particulate organic matter settle. Although the sorptive capacity of these particles is not as high as that of the fine clays, the loss of nutrients from the water column to the bed occurs with the settling of these particles. Within the lacustrine zone of reservoirs, sedimentation patterns reflect the settling of fine clays and colloidal material (Thornton 1990b). Turbid waters can limit production by reducing light transmission (Wetzel 1990, Baker 1996). For example, Northcote et al. (2005) found phytoplankton biomass to be reduced because of light limitation from turbidity even when the water column contained high phosphate concentrations. Likewise, in an analysis of 64 reservoirs, Kimmel et al. (1990) found the most “oligotrophic” reservoir based on phytoplankton productivity estimates (mg C m-2d-1) to be limited by light because of turbidity instead of nutrients, as typically indicated by the trophic state classification. In contrast, nutrient-laden particulate material may contribute to excessive primary production. Because macrophytes obtain most of their nutrients through their roots, sediments with high nutrient concentrations (in regions where macrophytes are able to grow) may contribute to nuisance conditions of these primary producers. Disturbances of the bed by bottom dwelling organisms may cause re-suspension of the sediment and increase the possibility of releasing
28
nutrients to the water column. Furthermore, under anoxic conditions such as frequently found in the hypolimnion of eutrophic reservoirs, phosphorus may be released from the sediment and possibly made available to primary producers in the water column, thereby stimulating more primary production (Thornton 1990b, Baker 1996). 3. Internal Loading Whereas external nutrient loading describes the amount of nutrients that enter a lake or reservoir from the drainage area (outside the system), internal loading comes from within the system. Internal loading generally refers to the phosphorus (P) released from anoxic sediment surfaces. Under anoxic conditions, phosphorus may escape from the sediment into the water column and become a nutrient source for algae (Brönmark and Hansson 2005). Internal loading of nutrients is normally low in natural lakes but can be significant in reservoirs (Wetzel 1990). Even though management practices within the watershed may control the external load of nutrients, internal loading can prevent eutrophic lakes and reservoirs from recovering. Internal loads can be high for decades or centuries (Brönmark and Hansson 2005). In some systems, internal loading represents the main summer phosphorus load. Because it is already within the system, this phosphorus has the potential to greatly impact the water quality and increase primary production. There are various management practices that can be utilized in the control of internal loading and thus dampen the effects of phosphorus release from sediment. In theory, hypolimnetic aeration or oxygenation should reduce the release of phosphorus from sediments and thereby reduce algal growth. An aeration system that was installed in 1985 in St. Mary Lake, British Columbia was found to maintain DO at 5 mg/L in the hypolimnion and decrease phosphorus concentrations (Nordin et al. 1995). Maintenance of oxic conditions in the hypolimnion, however, does not always result in a reduction of productivity and algal growth in lakes. McQueen and Lean (1986) found that hypolimnetic aeration impacted the phosphorus concentrations but did not alter chlorophyll levels. Based on more than 10 years of data on hypolimnetic oxygenation and artificial mixing in two eutrophic lakes, Gächter and Wehrli (1998) found that internal cycling of phosphorus was not affected by increased hypolimnetic DO concentrations. Their research indicated that the sediment-water interface remained anoxic even in the presence of an oxic hypolimnion. Other methods used in an attempt to fix phosphates within the sediment rely on the additions of substances that promote oxidation-reduction reactions at the sediment surface. Calcium nitrate, Ca(NO3)2, and a phosphate-binding agent, such as aluminum chloride (AlCl3) or iron chloride (FeCl3), are sometimes added to reservoirs. By using the nitrate as a source of oxygen, the phosphates precipitate as metal complexes and thus become immobilized. Nitrogen gas (N2) is released as a by-product of the reaction and eventually escapes from the system into the atmosphere (Cooke et al. 1993 in Baker 1996; Horne and Goldman 1994; Brönmark and Hansson 2005). Similarly, alum (e.g., aluminum potassium sulfate, AlK(SO4)2·12H2O) may be added to reduce the internal cycling of phosphorus. The addition of alum should result in the precipitation of phosphates and form a stable floc at the sediment-water interface to prevent internal loading for an extended period of time (Kennedy and Cooke 1982, Cooke et al. 1993).
29
Treatments with alum have been shown to be effective from a few years to over 10 years (Garrison and Knauer 1984 in Baker 1996). In some reservoirs, dredging may be used to remove nutrient-rich sediment to reduce internal phosphate loading (Peterson 1981 in Baker 1996). Because of the expense involved, dredging is generally limited to small, shallow reservoirs. Care must also be used during dredging to ensure that disturbed substrate is not transported to other areas of the reservoir. For example, when fine silts are dredged, silt screens must be used to prevent suspended silt from being carried along by the water and settling elsewhere. Without changes to the external sources of nutrient loads, dredging results will be temporary because nutrient-enriched sediments begin accumulating immediately. 4. Multipurpose Uses Reservoirs differ from lakes in that the amount of water they hold is controlled to achieve some beneficial use to society. Whereas reservoirs are generally constructed for a specific purpose, they usually serve several purposes, and these purposes may change with time and often conflict. Common purposes for which reservoirs are constructed include: flood control, water supply, irrigation, navigation, hydroelectric power generation, recreation, wildlife habitat, and water quality maintenance (Martin and McCutcheon 1999) (For more specific examples of uses, see Table II-3).
Table II-3. Examples of designated uses of freshwater reservoirs.
-- Water Contact Recreation -- Noncontact Recreation -- Agricultural Supply -- Industrial Process Supply -- Industrial Service Supply -- Municipal and Domestic Supply -- Hydropower Generation -- Navigation -- Groundwater Recharge -- Freshwater Replenishment
-- Flood Control -- Commercial and Sport Fishing -- Aquaculture -- Cold Freshwater Habitat -- Warm Freshwater Habitat -- Fish Spawning -- Fish Migration -- Rare and Endangered Species -- Preservation of Biological Habitats
of Special Significance
Conflicts between the water quality requirements of various uses may be encountered when developing nutrient criteria, particularly for multiple-use impoundments. The Clean Water Act (PL92-500) identifies protection and propagation of fish, shellfish, and wildlife as well as recreation (boating, swimming) as principal designated uses for surface waters. A potential conflict is thus presented between maximizing fisheries productivity (especially for warmwater lakes) and accommodating recreational users. “Pea soup” lakes can be great fish producers but will be shunned by most anglers. Conversely, biologically sterile (“distilled water”) conditions may be preferred by some non-anglers. The issue calls for compromise by addressing two questions: 1) “How low must nutrient concentrations be to avoid undesirable plant production?” and 2) “How high must nutrients be to promote good fishing?” (from Zipper et al. 2004).
30
SECTION II-C. ESTIMATING RESIDENCE TIME AND ITS IMPORTANCE IN NUTRIENT CRTIERIA DEVELOPMENT Water enters lakes and reservoirs from streams and/or rivers, direct precipitation, and subsurface seepage. It exits the system through evaporation, subsurface seepage, and streamflow discharge. The hydraulic residence time, sometimes referred to as hydraulic retention time, refers to the rate of water movement from inflow to outflow and is measured in units of time (e.g., days, years). Hydraulic residence time (often abbreviated tw) is calculated by dividing the volume of the lake or reservoir (m3) by its total annual outflow (m3/yr). The obtained theoretical hydraulic residence time equals the actual water residence time only if the water moves through the system as a defined water mass (Søballe et al. 1992, Baker 1996). In general, water bodies with broad, deep basins (large volumes) tend to have longer hydraulic residence times. Retention time can refer to the amount of time that nutrient molecules stay within the lake or reservoir. Thus, nutrient retention time may or may not be the same as hydraulic retention time. Sedimentation and nutrient recycling affect the rate of nutrient movement through the system. In winter, nutrient retention time is more likely to be similar to that of hydraulic retention time. In spring, however, nutrients tend to move through the system more slowly because they may be taken up by algae and later released during decomposition (Horne and Goldman 1994). Hydraulic residence time is related to several important morphological features of lakes and reservoirs and impacts both physical and biological processes within lakes and reservoirs (Søballe et al. 1992). For example, hydraulic residence time has the potential to influence the type and rate of biogeochemical cycling, the settlement of particulate matter, and the occurrence of thermal stratification (Morris and Fan 1998, Kalff 2002). Hydraulic residence time thus impacts nutrient availability, turbidity, and mixing (Adams and Hackney 1992). For these reasons, hydraulic residence time has a significant impact on the structure and function of aquatic communities within lakes and reservoirs (Søballe and Kimmel 1987). Hydraulic residence time also influences the movement and transport of nutrients, sediment, and plankton to downstream receiving waters (Morris and Fan 1998, Kalff 2002). Among lakes and reservoirs, hydraulic residence times vary greatly. In general, natural lakes appear to have longer residence times than do reservoirs. Data from lakes sampled during U.S. EPA’s National Eutrophication Survey (summarized by Walker 1981) reveal a median theoretical hydraulic residence time of 270 days. In comparison, data from U.S. Army Corps of Engineers reservoirs in the southeastern U.S. indicate a theoretical residence time of about 80 days (in Søballe et al. 1992, based on data reported by Leidy and Jenkins 1977). Reservoirs in particular have a wide range of residence times. For example, Søballe et al. (1992) found mean water residence times among southeast reservoirs to range from one day to three years. In reservoirs, the structure (size) and operation of the dam controls the hydraulic residence time. For example, Kennedy et al. (1981) found that the use of floodgates at Lake Red Rock, a reservoir on the Des Moines River, cut in half the theoretical residence time (in Kennedy and Walker 1990). Consequently, hydraulic residence time determines whether reservoirs are more lake-like or river-like. Reservoirs with short residence times (< 30 – 40 days) (common for run-of-the-river reservoirs) tend to be river-like in their ecological structure and function, whereas
31
reservoirs with long residence times (> 100 days), typical of tributary-storage reservoirs, are often similar to natural lakes. Reservoirs that have water residence times within these two ranges (about 30 to 100 days) are more variable in their responses, sometimes acting like river systems and other times responding more like lake systems (Søballe et al. 1992). Long hydraulic residence times, in combination with other favorable conditions, allow populations of primary producers to grow and become established within the system. Thus, long hydraulic residence times are associated with higher algal abundances. Based on the results from a study of predominantly glacial lakes, Schindler (1978, p. 484) states: “Two variables, phosphorus input and water renewal time [a transform of residence time that reflects the time required to replace the entire volume of a lake or reservoir]… appear to serve equally well for interpreting production results and are the key to managing a wide variety of aquatic productivity problems.” Numerous studies have shown a strong relationship between hydraulic residence time and primary production (e.g., Dickman 1969, Søballe and Kimmel 1987, Ryding and Rast 1989, Maceina et al. 1996). In a study of Alabama reservoirs, Maceina et al. (1996) found hydraulic residence time, mean depth, and TP to be significant determinants of chlorophyll-a concentrations. Likewise, Søballe and Kimmel (1987) found a relationship between hydraulic residence time, TP, and algal cell counts. Algal abundance per unit phosphorus increased from rivers to impoundments to natural lakes, which also reflected a parallel increase in hydraulic residence time. Furthermore, when rivers, impoundments, and natural lakes had similar hydraulic residence times, their algal abundance per unit phosphorus did not differ significantly (Søballe and Kimmel 1987). Because hydraulic residence time affects the population growth of primary producers, lakes and reservoirs can be classified by hydraulic residence time as a part of nutrient criteria development. For example, in Nutrient Criteria Technical Guidance Manual: Lakes and Reservoirs, U.S. EPA defines lakes as “natural and artificial impoundments with a surface area greater than 10 acres and a mean water residence time of 14 or more days” (U.S. EPA 2000a, p. 3-1). U.S. EPA further advises that states that have not defined lakes should do so, stating, “The goal of such an exercise is to eliminate small water bodies that, because of their size (and resulting hydrology) or uses (e.g., small agricultural impoundments), do not accurately represent typical lake conditions or do not exhibit expected responses to stressors” (U.S. EPA 2000a, p. 3-1). SECTION II-D. RELATIONSHIP BETWEEN FISHERIES AND NATURAL COMMUNITY1 Community energetics dictate that the biomass of fish at or near the top of the trophic pyramid should be highly dependent on the amount of primary production at the base (Lindemann 1942). Primary production in lakes is limited by nutrients, principally phosphorus. U.S. EPA (2000a) notes that nitrogen limitation is largely confined to subtropical and high altitude/latitude lakes. Nitrogen limited waters have TN:TP < 30 (Alam and Glecker 1994).
1 This section was written by J.J. Ney. Modifications have been made from the original source, Zipper et al. 2005.
32
However, the productivity of a fishery can be limited not only by insufficient energy (food) but also by inadequate habitat. High levels of algal production can cause hypolimnetic oxygen deficits to the detriment of coldwater and coolwater fishes. In shallow lakes, nutrients can stimulate excessive macrophyte growth, reducing habitat for warmwater sportfish species (Wiley et al. 1984). The influence of nutrients and resulting primary production on fisheries productivity in lakes and reservoirs should thus be parabolic, with low concentrations of nutrients constraining food supply and high concentrations of nutrients limiting suitable habitat. The nutrient (phosphorus) or response (chlorophyll-a, Secchi disk water transparency) parameters that promote healthy fisheries will vary by water-body type and the species-specific requirements of the desired fishes. This section proceeds from a general overview of the fisheries-water quality relationship to a consideration of the particular nature of that relationship in reservoirs (vs. natural lakes). It concludes with an analysis of water quality requirements for Virginia’s three categories of reservoir fisheries: coldwater (trout), coolwater, and warmwater. 1. Overview Empiric relationships between productivity of fisheries (as measured by fish harvest, production, or biomass) and both primary production and phosphorus concentration have been developed and published for regional and cosmopolitan sets of lakes. Correlations between primary production and fisheries productivity are highly positive, the former explaining (r2) 67 – 84% of the latter (Table II-4). Correlations between total phosphorus (TP) concentration and fisheries productivity are equally strong (51 – 84%, Table II-5). 2. Water Quality in Reservoirs Some of the above data sets were limited to natural lakes. Indeed, most of the analyses of trophic state (e.g., Carlson’s TSI) are based on the relationships of phosphorus, chlorophyll-a, and water transparency (Secchi disk depth) in northern natural lakes (U.S. EPA 2000a). These relationships are less robust in reservoirs. Chlorophyll-a concentrations tend to be lower in reservoirs than in natural lakes (Søballe et al. 1992) because higher inorganic turbidity and flushing rates in reservoirs may limit the ability of phosphorus to stimulate phytoplankton production. In a regression analysis of about 80 southeastern U.S. reservoirs (from U.S. EPA’s National Eutrophication Survey), Reckhow (1988) reported a fairly strong correlation between transparency and phosphorus (r2 = 0.50), a weak relationship between chlorophyll-a and phosphorus (r2 = 0.10), and virtually no correlation between chlorophyll-a and transparency (r2 < 0.01). In these impoundments, inorganic turbidity largely determined water transparency, and although the suspended sediment contained phosphorus, most of the phosphorus was not biologically available. In contrast, the r2 for phosphorus concentration vs. chlorophyll-a level has been widely reported as ~0.70 (Brown et al. 2000) for sets of natural lakes. Canfield and Bachman (1981) examined the National Eutrophic Survey (NES) data set and compared nutrient and response parameters between natural lakes and reservoirs. They also found that reservoirs usually have substantially lower chlorophyll-a levels than natural lakes at the same phosphorus concentrations. Interpretation of their scatter diagram indicates that to produce 10.0 mg/m3 of chlorophyll-a (indicative of marginally eutrophic conditions) in the average natural lake would
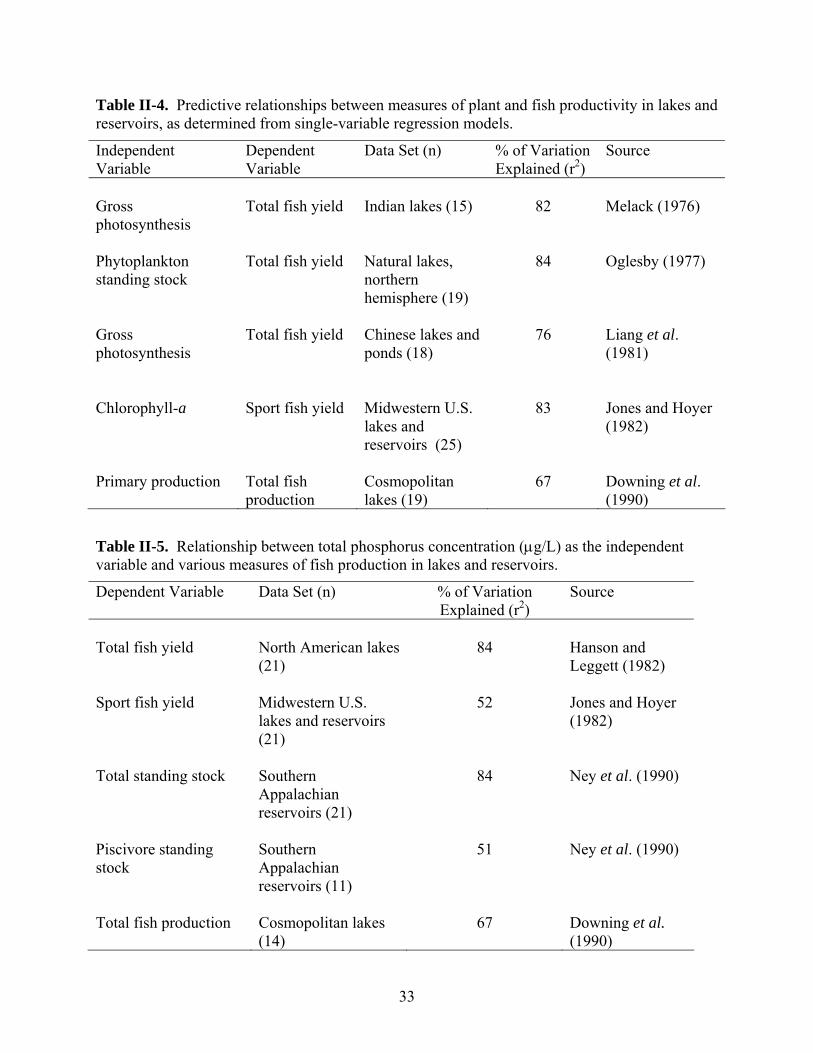
33
Table II-4. Predictive relationships between measures of plant and fish productivity in lakes and reservoirs, as determined from single-variable regression models.
Independent Variable
Dependent Variable
Data Set (n) % of Variation Explained (r2)
Source
Gross photosynthesis
Total fish yield Indian lakes (15) 82 Melack (1976)
Phytoplankton standing stock
Total fish yield Natural lakes, northern hemisphere (19)
84 Oglesby (1977)
Gross photosynthesis
Total fish yield Chinese lakes and ponds (18)
76 Liang et al. (1981)
Chlorophyll-a Sport fish yield Midwestern U.S.
lakes and reservoirs (25)
83 Jones and Hoyer (1982)
Primary production
Total fish production
Cosmopolitan lakes (19)
67 Downing et al. (1990)
Table II-5. Relationship between total phosphorus concentration (μg/L) as the independent variable and various measures of fish production in lakes and reservoirs.
Dependent Variable Data Set (n) % of Variation Explained (r2)
Source
Total fish yield North American lakes
(21) 84 Hanson and
Leggett (1982) Sport fish yield Midwestern U.S.
lakes and reservoirs (21)
52 Jones and Hoyer (1982)
Total standing stock Southern
Appalachian reservoirs (21)
84 Ney et al. (1990)
Piscivore standing stock
Southern Appalachian reservoirs (11)
51 Ney et al. (1990)
Total fish production Cosmopolitan lakes
(14) 67 Downing et al.
(1990)
34
require 30 µg/L total phosphorus, whereas the average reservoir would require 40 µg/L total phosphorus. High flushing rates (low hydraulic residence times) in reservoirs also limit development of phytoplankton biomass. In fact, the Nutrient Criteria Technical Guidance Manual: Lakes and Reservoirs (U.S. EPA 2000a) recommends that lakes and reservoirs with hydraulic residence times < 14 days be exempted from nutrient regulation because algal biomass buildup is minimal. Chlorophyll-a concentrations have long been recognized as the single best metric for assessing nutrient-induced water quality of lakes because it most directly measures the parameter that affects aesthetic value and recreational use (Carlson 1977, Heiskary and Walker 1988, Bachman et al. 1996). Chlorophyll-a concentrations would appear to be the parameter of choice as a criterion for nutrient standards for reservoirs because water transparency is affected by inorganic turbidity and phosphorus concentration is irrelevant in impoundments with a low hydraulic residence time. Reservoirs differ from natural lakes in that they characteristically exhibit a trophic gradient (Søballe et al. 1992). As dammed rivers, reservoirs lose nutrients through settling in a downstream direction. Thus a single reservoir may grade from eutrophic in its upper reaches to oligotrophic near the dam. Such systems can support good fisheries for a combination of warmwater, coolwater, and even coldwater fishes.
3. Reservoir Fisheries and Water Quality
Because inorganic turbidity and flushing can limit nutrient impacts on reservoir productivity, it might be expected that the empiric relationship between phosphorus concentration and fisheries would be relatively weak. This does not appear to be the case in large reservoirs of the southeastern United States. Ney et al. (1990) examined the relationship between fish standing stock and a variety of potential predictors in a set of 21 southeastern, Appalachian-region, multi-purpose reservoirs for which fishery and water chemistry information was available for the same time frame (within 2 years). These reservoirs varied greatly in surface area (1,700 – 132,000 ha), hydraulic residence time (4 – 438 d), and total fish standing stock (77 – 2,321 kg/ha). Total phosphorus was easily the best predictor of fish standing stock (r2 = 0.84), followed by Secchi disk depth (negative slope, r2= 0.42) and chlorophyll-a (r2 = 0.31). Fish standing stock increased linearly over the range of total phosphorus (8 – 81 µg/L) on a log-log scale, suggesting that maximum fish biomass would occur at higher phosphorus concentrations (Ney 1996). Fish production will ultimately be limited by habitat loss, resulting in a parabolic relationship with nutrient concentrations (Figure II-1).
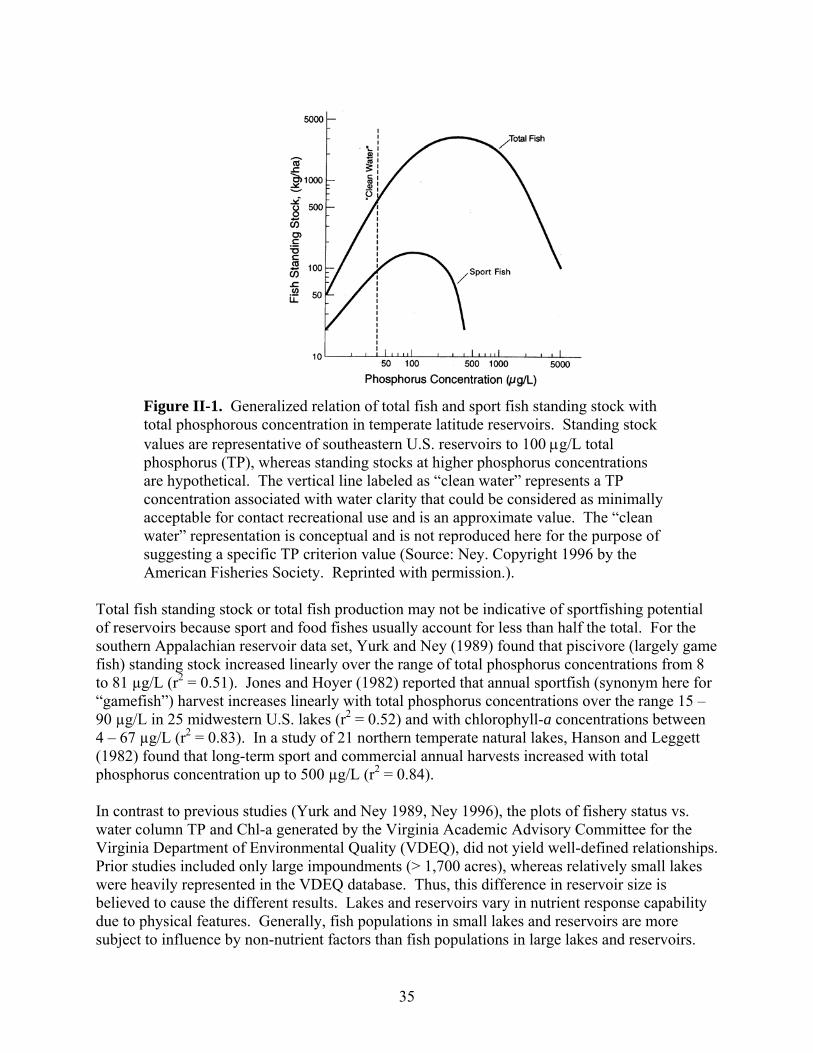
35
Figure II-1. Generalized relation of total fish and sport fish standing stock with total phosphorous concentration in temperate latitude reservoirs. Standing stock values are representative of southeastern U.S. reservoirs to 100 μg/L total phosphorus (TP), whereas standing stocks at higher phosphorus concentrations are hypothetical. The vertical line labeled as “clean water” represents a TP concentration associated with water clarity that could be considered as minimally acceptable for contact recreational use and is an approximate value. The “clean water” representation is conceptual and is not reproduced here for the purpose of suggesting a specific TP criterion value (Source: Ney. Copyright 1996 by the American Fisheries Society. Reprinted with permission.).
Total fish standing stock or total fish production may not be indicative of sportfishing potential of reservoirs because sport and food fishes usually account for less than half the total. For the southern Appalachian reservoir data set, Yurk and Ney (1989) found that piscivore (largely game fish) standing stock increased linearly over the range of total phosphorus concentrations from 8 to 81 µg/L (r2 = 0.51). Jones and Hoyer (1982) reported that annual sportfish (synonym here for “gamefish”) harvest increases linearly with total phosphorus concentrations over the range 15 – 90 µg/L in 25 midwestern U.S. lakes (r2 = 0.52) and with chlorophyll-a concentrations between 4 – 67 µg/L (r2 = 0.83). In a study of 21 northern temperate natural lakes, Hanson and Leggett (1982) found that long-term sport and commercial annual harvests increased with total phosphorus concentration up to 500 µg/L (r2 = 0.84). In contrast to previous studies (Yurk and Ney 1989, Ney 1996), the plots of fishery status vs. water column TP and Chl-a generated by the Virginia Academic Advisory Committee for the Virginia Department of Environmental Quality (VDEQ), did not yield well-defined relationships. Prior studies included only large impoundments (> 1,700 acres), whereas relatively small lakes were heavily represented in the VDEQ database. Thus, this difference in reservoir size is believed to cause the different results. Lakes and reservoirs vary in nutrient response capability due to physical features. Generally, fish populations in small lakes and reservoirs are more subject to influence by non-nutrient factors than fish populations in large lakes and reservoirs.
36
Non-nutrient factors capable of influencing fish populations include inorganic turbidity (suspended sediments), physical features, and structural elements.
4. Fisheries in Reservoirs in Virginia The fisheries of Virginia’s public reservoirs include coldwater, coolwater, and warmwater fisheries. Coldwater fisheries are managed for trout, and coolwater fisheries are managed for striped bass and walleye. Warmwater fisheries are managed for sunfish, largemouth bass, and catfish. The Virginia Department of Game and Inland Fisheries (VDGIF) manages numerous small reservoirs for sportfishing. Within the overall sportfish complex, it has long been recognized that individual species respond differently to particular levels of lake fertility. U.S. EPA’s Nutrient Criteria Technical Guidance Manual: Lakes and Reservoirs (U.S. EPA 2000a) cites the work of Oglesby et al. (1987) to predict that as phosphorus in natural lakes increases, fisheries will shift from coldwater (TP < 24 µg/L) to coolwater (TP = 24 – 48 µg/L) to warmwater (TP = 48 – 193 µg/L). Total fisheries yield (harvest) should progressively rise over this range of phosphorus concentration. However, these projections were based on rather limited data that has been supplemented by later studies and did not apply specifically to many of the sportfish species of Virginia’s reservoirs. The following was used by the Academic Advisory Committee to the VDEQ to recommend possible nutrient-related criteria for reservoirs in Virginia. a. Coldwater Fisheries Trout fisheries in Virginia’s lakes are maintained by frequent stockings from hatcheries, either on a put-and-take (adults) or put-grow-take basis (fingerlings). Rainbow, brown, and brook trout are stocked alone or in combination. Because stocked put-and-take trout fisheries are seasonal and not habitat limited, this analysis focuses on conditions necessary for trout to grow and survive over one or more years to reach harvestable size. Essentially, this requires an oxygenated hypolimnion during thermal stratification. The relevant water quality literature is sparse. In Minnesota, natural populations of lake trout (Salvelinus namayacush) achieve peak abundance at TP = 6 µg/L and chlorophyll-a = 1 µg/L (Schupp and Wilson 1993). However, the lake trout requires the lowest temperatures of any salmonid and does not live in Virginia. In another study, a fertilization experiment in a small mountain lake in British Columbia increased rainbow trout growth and interannual survival when raising TP levels from 4 to 9 µg/L and chlorophyll-a concentrations from 1 to 6 µg/L (Johnston et al. 1999). Similarly, brown trout abundance in Lake Windemere, U.K. more than doubled when TP was reduced from 30 to 11 µg/L and chlorophyll-a levels declined from 30 to 14 µg/L (Elliott et al. 1996). b. Coolwater Fisheries Virginia’s coolwater sportfish species are striped bass, hybrid striped bass (white bass x striped bass), and walleye. The smallmouth bass is sometimes considered a coolwater species, but it has virtually identical temperature tolerances to its congener largemouth bass, a warmwater fish considered below (Brown 1974). All three coolwater species are maintained by the stocking of hatchery-reared fingerlings on a put-grow-take basis in Virginia; the single exception is the striped bass population of Kerr Reservoir, which is self-sustaining.
37
Walleye, striped bass, and hybrid striped bass prefer water temperatures in the range of 19 – 28oC (Coutant 1985, Hokanson 1990, Kilpatrick 2003). By late summer in Virginia reservoirs, this habitat is usually limited to the metalimnion/hypolimnion down-lake region near the dam (Ney 1988, Kilpatrick 2003). However, all three species can tolerate water temperatures of > 28oC for extended periods without observed mortality, although growth will likely be impaired (Brown 1974, Wrenn and Forsythe 1979, Kilpatrick 2003). The influence of water quality on walleye abundance has been examined for Minnesota lakes and Lake Erie, which supports the most productive walleye fishery in the world. In Minnesota, walleye abundance peaks under mesotrophic conditions: TP concentrations of 15 – 25 µg/L and chlorophyll-a levels of 7 – 10 µg/L (Schupp and Wilson 1993). Lake Erie’s walleye populations are thriving at chlorophyll-a concentrations of 5 – 15 µg/L; it is actually projected to increase if phosphorus loading is doubled (Anderson et al. 2001). Walleye do well in lakes that experience occasional hypolimnetic anoxia but poorly in lakes with Secchi disk transparency > 4 meters (Schupp and Wilson 1993). Striped bass also fare poorly under oligotrophic conditions. When Lake Mead, Nevada, became oligotrophic (TP = 10 µg/L), striped bass became stunted and emaciated (Axler et al. 1987). Smith Mountain Lake, a reservoir formed by the Blackwater and Roanoke rivers, is Virginia’s premier inland striped bass fishery and has a classic trophic gradient. The lower segment of Smith Mountain Lake has an oxygenated hypolimnion year-round, providing a summer thermal refuge for striped bass. However, striped bass congregate further upstream in summer where prey fish are more abundant (Ney 1988), suggesting that food is more important than ideal habitat. In Virginia’s large reservoirs, coolwater fishes appear to be more food limited than habitat limited. Virginia’s coolwater sportfishes are fast-growing piscivores dependent on a large supply of forage fishes (e.g., gizzard shad, threadfin shad). These planktivores are most abundant in fertile systems (Bremigan and Stein 2001, Maceina 2001). c. Warmwater Fisheries Principal warmwater sportfishes are primarily of the sunfish family (Centrarchidae) as well as catfishes. Catfishes have higher temperature and lower dissolved oxygen (DO) tolerances than centrarchids and thus are not considered further in this review. Virginia’s centrarchids include sunfishes (bluegill, redear, redbreast, and pumpkinseed), black and white crappie, smallmouth bass, as well as the most-sought freshwater sportfish species, largemouth bass. Centrarchids are littoral and epilimnetic fishes that do not require an oxygenated hypolimnion as summer habitat. Nutrient-induced habitat limitations occur only in shallow lakes that become choked with aquatic macrophytes. In such systems, both largemouth bass and sunfish become stunted (Bennett 1962). Virginia has few macrophyte-dominated reservoirs. Where they exist, poor watershed practices (erosion) or invasive exotics (e.g., Hydrilla) are usually responsible. For the most part, centarchid populations are food-limited rather than habitat-limited. Higher levels of nutrients translate to more centrarchid biomass. In fact, centrarchid lakes devoted primarily to fishing are often fertilized at least annually. Auburn University, which pioneered
38
research on centrarchid management, recommends fertilization to achieve chlorophyll-a concentrations of 40 – 60 µg/L (Maceina 2001). The Virginia Department of Game and Inland Fisheries frequently fertilizes its small fishing lakes to produce robust centrarchid populations for anglers. In these small (< 200 acres) lakes, chlorophyll-a concentrations in the 40 – 60 µg/L range commonly result. Obviously, larger reservoirs are not subject to direct fertilization because they must accommodate aesthetic and water-contact recreation and (sometimes) coolwater fisheries. However, across reservoirs of all sizes, the pattern of “higher fertility = better centrarchid fishing” holds. In Minnesota, Schupp and Wilson (1993) reported that black crappie fisheries peak at TP concentrations ~60 µg/L and chlorophyll-a levels ~20 µg/L; white crappie do best under hypereutrophic conditions (TP ~100 µg/L; chlorophyll-a ~60 µg/L). In a study of 30 large Alabama reservoirs, Maceina et al. (1996) found that growth of crappie and largemouth bass increased with increasing chlorophyll-a levels up to ~20 µg/L. In fact, the potential for an angler to catch a trophy largemouth bass (> 5 lbs.) was about 3 times greater in eutrophic than mesotrophic lakes. Bachmann et al. (1996) confirmed a similar pattern for natural Florida lakes (n = 360): trophy largemouth bass were more abundant in highly eutrophic lakes (chlorophyll-a > 40 µg/L), as were populations of redear sunfish and black crappie. SECTION II-E. RECREATIONAL USER PERCEPTIONS OF LAKE/RESERVOIR WATER QUALITY2 The objective of this effort was to evaluate the existing evidence regarding the relationship between observable differences in water conditions (water clarity and/or algal populations) and recreational uses (primarily recreational contact uses such as swimming and aesthetics). Two general types of studies relevant to the above objective were reviewed. The first type of study examines the user perceptions of the suitability of a water body for recreational contact use (Heiskary and Walker 1988, Smeltzer and Heiskary 1990, Smith et al. 1991, Smith and Davis-Colley 1992, Smith et al. 1995, and Hoyer et al. 2004). These studies typically administer simple survey instruments to solicit respondents’ subjective evaluation of the water for either recreational use (swimming/boating) or aesthetic enjoyment. Respondents typically are asked to rank on a five-point scale the suitability of a water body for recreational contact. Survey administrators also frequently ask respondents to provide their subjective evaluation of the physical condition of the water (clear, clean, etc.). Statistical correlations are then estimated between respondent rankings and the water quality conditions existing at the place and time the survey was conducted. Water conditions were typically measured as Secchi depth and/or chlorophyll-a (Chl-a) concentrations. Much of this literature, however, is not based on representative samples of recreational water users. Rather, members of volunteer monitoring associations or members of state agency staff are asked to respond to most user-perception surveys (Heiskary and Walker 1988, Smeltzer and
2 This section was written by K. Stephenson. Modifications have been made from the original source, Zipper et al. 2005.
39
Heiskary 1990, Smith and Davis-Colley 1992, Hoyer et al. 2004). Thus, the results of these studies do not reflect representative cross-sections of recreational users or the intensity of recreational use across different sites. One study, however, found a close correspondence in the perceptions of recreational suitability between field water quality agency staff and recreational users (Smith et al. 1995). The second type of study examines a landowner’s willingness to pay for water quality improvements. These studies, called hedonic price analyses, examined whether statistical relationships exist between observed differences in the prices paid for lake-front property and water quality (Michael et al. 1996, 2000; Poor et al. 2001; Gibbs et al. 2002; Krysel et al. 2003). Hedonic price studies attempt to statistically isolate the influence of water clarity on property prices from all other factors that might influence property prices. If two lake-front properties have different levels of water quality but are similar in other dimensions (types of structures on the property, location amenities, etc.), then any observed difference in property prices is interpreted as people’s willingness to pay for water quality improvements. Water clarity (Secchi depth) is the typical measure of water quality in hedonic price studies since landowner purchasing decisions seemed to primarily be influenced by the visual appearance of the water (Brashares 1985). In these studies, water clarity is often estimated by Secchi depth. Hedonic price studies cannot discern the landowner’s interest or use of the water body (swimming, boating, aesthetics, fishing, etc.). It should be noted that most of the studies that investigate the relationship between recreational user perceptions/preferences and water clarity have been conducted in regions with relatively clear lakes. The studies reviewed, with one exception, have been conducted in Minnesota, New Hampshire, Vermont, Maine, Michigan, and New Zealand. The majority of lakes included in these studies are typically oligotrophic or mesotrophic. Secchi depth measurements reported in these studies typically average 3 to 6 meters. Only one study was found that was conducted in the southeastern United States (Florida), and it was dominated by eutrophic lakes (Hoyer et al. 2004). 1. General Findings All studies found that people’s perceptions of the desirability of a lake/reservoir for contact recreational uses and aesthetics vary directly with measures of water clarity. User-perception studies found that the desirability/suitability for recreational contact use increases as water clarity increases and Chl-a levels decrease. Many studies found that respondents distinguish suitable and unsuitable waters for swimming at Secchi depths ranging between 0.6 meters and 3 meters (Heiskary and Walker 1988, Smeltzer and Heiskary 1990, Smith et al. 1991, Smith and Davies-Colley 1992, Smith et al. 1995, Hoyer et al. 2004). In their Florida study, Hoyer et al. (2004) report mean Secchi depth of 2 meters and 1.6 meters for waters where respondents rank water “excellent for swimming” to “slightly impaired” respectively. Heiskary and Walker (1988) conclude that perceptions of recreational use and Chl-a levels in Minnesota vary. In their study, respondents generally found waters unsuitable for recreational use when Chl-a levels exceed 40 ppb, but Chl-a levels between 15-60 ppb were generally rated as only “slightly impaired” for swimming and aesthetics. Hoyer et al. (2004) report that Florida respondents generally rate the
40
suitability of waters for swimming at mean Chl-a levels of less than 15 µg/L. See Table II-6 for a summary. Hedonic price studies generally find statistically significant and positive relationships between Secchi depth and land prices. Landowners in Maine and Minnesota for example are generally willing to pay 0 to 10% more for water-front property for a one-meter increase in water clarity (Michael et al. 1996, Krysel et al. 2003). The limited evidence contained in the studies described here, however, also suggests that perceptions of suitability of water for recreational contact use exhibit considerable variation across regions and people. In the Smeltzer and Heiskary (1990) study, which includes lakes ranging from oligotrophic (northern Minnesota and Vermont) to eutrophic (southern Minnesota), considerable regional variation exists in the respondents’ recreational suitability rankings. For example respondents in northern Minnesota and Vermont rank water “excellent for swimming” at Secchi depths ranging from 3 to 5+ meters, whereas the mean response from southern Minnesota respondents range from 0.9 to 2+ meters for excellent swimming. Hoyer et al. (2004, p. 247) tentatively conclude that similar patterns exist in Florida, stating “lake users located in areas dominated by eutrophic lakes are more likely to tolerate green water and consider it good water quality.” 3 Thus, the literature seems to support the general conclusion that what is considered good water quality is what people are “used to” seeing. Other findings also confirm that good water quality for recreational uses is relative — water quality perceptions are dependent on users’ experiences. Respondents’ physical descriptions of water vary across regions. Residents in Vermont called lakes “crystal clear” with Secchi readings of 7 meters, whereas residents in southern Minnesota rated waters as “crystal clear” with Secchi readings of 1.9 meters (Smeltzer and Heiskary 1990). Further, at least one study suggests that users’ perception of water quality may be more sensitive to the change in water quality levels than to absolute levels (like Secchi depth) (Michael et al. 2000). Most studies also find considerable variation between individual respondents’ assessments of the desirability of a lake for recreational contact. For example, Hoyer et al. (2004) found that waters ranging from 0.4 to 4.3 meters were ranked by Florida-survey respondents as “excellent for swimming” (mean = 2.0 meters). In the same study, Chl-a levels ranging from 1 to 114 µg/L were reported as having “excellent” waters for swimming (mean 11 µg/L). For waters rated as excellent for swimming, Chl-a levels falling within the 25th and 75th quartiles were between 2.5 to 10.5 µg/L. The 25th and 75th quartiles for waters ranked as providing substantially diminished swimming opportunities (ranked as a “4”) ranged from 2.5 µg/L to 11 µg/L. Thus considerable overlap exists in Chl-a readings for waters judged to be excellent and those found to be unsuitable for swimming (Hoyer et al. 2004). No similar statistics were reported for Secchi depth. It is unclear whether these large variations are due to differences in individual perceptions of water quality suitability or due to the possibility that the water quality measures (Chl-a and Secchi depth) may not adequately reflect the characteristics of a water body that are important to users in determining water quality. 3 Hoyer et al. (2004) also note that water clarity in Florida is particularly important for some recreational contact users due to the presence of alligators in that state.
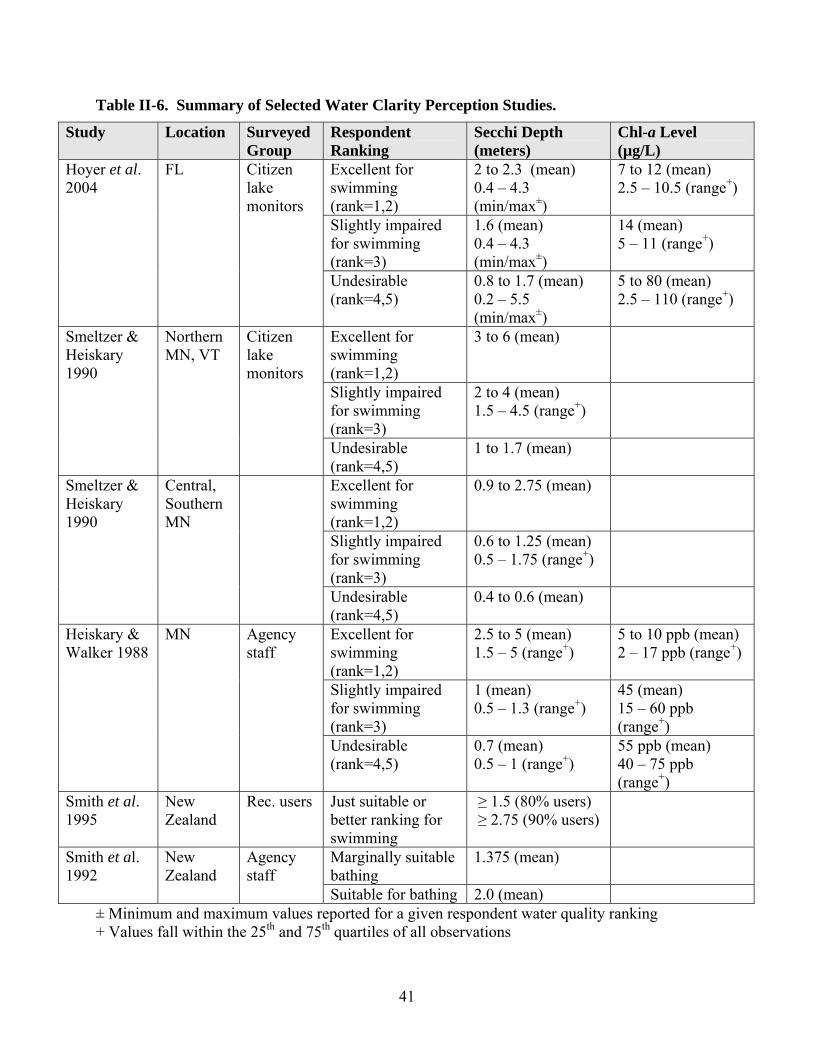
41
Table II-6. Summary of Selected Water Clarity Perception Studies.
Study Location Surveyed Group
Respondent Ranking
Secchi Depth (meters)
Chl-a Level (µg/L)
Hoyer et al. 2004
FL Citizen lake monitors
Excellent for swimming (rank=1,2)
2 to 2.3 (mean) 0.4 – 4.3 (min/max±)
7 to 12 (mean) 2.5 – 10.5 (range+)
Slightly impaired for swimming (rank=3)
1.6 (mean) 0.4 – 4.3 (min/max±)
14 (mean) 5 – 11 (range+)
Undesirable (rank=4,5)
0.8 to 1.7 (mean) 0.2 – 5.5 (min/max±)
5 to 80 (mean) 2.5 – 110 (range+)
Smeltzer & Heiskary 1990
Northern MN, VT
Citizen lake monitors
Excellent for swimming (rank=1,2)
3 to 6 (mean)
Slightly impaired for swimming (rank=3)
2 to 4 (mean) 1.5 – 4.5 (range+)
Undesirable (rank=4,5)
1 to 1.7 (mean)
Smeltzer & Heiskary 1990
Central, Southern MN
Excellent for swimming (rank=1,2)
0.9 to 2.75 (mean)
Slightly impaired for swimming (rank=3)
0.6 to 1.25 (mean) 0.5 – 1.75 (range+)
Undesirable (rank=4,5)
0.4 to 0.6 (mean)
Heiskary & Walker 1988
MN Agency staff
Excellent for swimming (rank=1,2)
2.5 to 5 (mean) 1.5 – 5 (range+)
5 to 10 ppb (mean) 2 – 17 ppb (range+)
Slightly impaired for swimming (rank=3)
1 (mean) 0.5 – 1.3 (range+)
45 (mean) 15 – 60 ppb (range+)
Undesirable (rank=4,5)
0.7 (mean) 0.5 – 1 (range+)
55 ppb (mean) 40 – 75 ppb (range+)
Smith et al. 1995
New Zealand
Rec. users Just suitable or better ranking for swimming
≥ 1.5 (80% users) ≥ 2.75 (90% users)
Smith et al. 1992
New Zealand
Agency staff
Marginally suitable bathing
1.375 (mean)
Suitable for bathing 2.0 (mean) ± Minimum and maximum values reported for a given respondent water quality ranking + Values fall within the 25th and 75th quartiles of all observations
42
Regional differences in a willingness to pay for water clarity also provide evidence of significant differences in water clarity preferences across users and regions. Hedonic price studies frequently report substantial differences in willingness to pay for one meter improvement in water clarity between lakes within a specific region, indicating that some lake landowners are more sensitive to changes in water clarity readings than their counterparts at other local lakes. In one Maine survey, only a little more than half of all owners of lake-front property stated that water quality entered into their decision of how much to pay for property (Michael et al. 2000). Significant differences in the willingness to pay for improvements in water clarity were also found between regions with lakes reporting similar levels of water clarity (Gibbs et al. 2002). Another common conclusion reached in the literature is that the relationship between water clarity and willingness to pay/recreational perceptions is nonlinear (Smith et al. 1995, Michael et al. 1996, Smith and Perrone 1996, Gibbs et al. 2002). Smith et al. (1995) found that perceptions of the desirability of a water body in New Zealand suitable for swimming changes significantly between Secchi depths of 0.9 and 1.5 meters. Depths below 0.9 meters were generally judged to be unsuitable for swimming whereas waters above 1.5 meters were generally found to be suitable. Fixed incremental improvements in water clarity above 2 meters did not generate large changes in the users’ suitability rankings (Smith et al. 1995). Most hedonic price studies also model a property owner’s perception to water clarity levels as a nonlinear relationship (Michael et al. 1996, Poor et al. 2001, Gibbs et al. 2002, Krysel et al. 2003). Neither type of study (user surveys or hedonic studies) examines user preferences for recreational uses in a multiuse setting. User-perception surveys do not solicit suitability ratings for other recreational uses, such as fishing, or provide estimates of the intensity of recreational contact use at individual lakes. User-perception surveys do not ask respondents about possible tradeoffs in water clarity, recreational contact, and fishing quality. The hedonic price studies reported here did not measure other lake attributes or lake conditions, such as fishery productivity or catch rate, and did not acknowledge that improved water clarity might be an indicator of diminished fishing opportunities. Thus, landowner willingness to pay for property on lakes with more productive fisheries may partially account for the unexplained differences in property owners’ willingness to pay for properties on different lakes. 2. Conclusions Most studies were confined to the northern United States and nearly always in areas where water clarity tends to be high (with the exception being one Florida study). Regardless of the region, however, this literature does consistently reflect a general theme: the level of water quality deemed suitable for swimming varies significantly between regions, lakes, and individual users. The lack of information of regional preferences for water clarity and the observed variation in user perceptions within in a region makes it difficult to identify a single water clarity criterion based solely on published literature.
43
SECTION II-F. DOWNSTREAM EFFECTS OF LAKES AND RESERVOIRS The U.S. EPA’s Nutrient Criteria Technical Guidance Manual: Lakes and Reservoirs states, “Before any criterion for any given class of lakes can be adopted, the potential impact on downstream waters must be considered. If the criteria do not provide for the attainment and maintenance of proximal downstream water quality, the criteria in question should be adjusted accordingly” (p. 7-2, U.S. EPA 2000a). Although U.S. EPA recognizes that estuarine and coastal waters eventually receive water discharged from lakes (so are in actuality downstream receiving waters), the agency defines downstream receiving waters for nutrient criteria development purposes as only “those immediately below the lake or reservoir and within a few miles of it” (U.S. EPA 2000a, p. 7-7). Lake and reservoir discharges can impact the temperature, flow, water quality, and biota of downstream receiving waters (in Søballe et al. 1992: Young et al. 1972; Ward 1976; Ward and Standford 1979, 1981). Outflows from natural lakes occur from the surface and commonly serve as the headwaters of streams. Most contribute to small streams, but some serve as headwaters for large rivers. For example, Lake Itasca in Minnesota contributes to the headwaters of the Mississippi River (Thornton 1990a). Reservoirs are usually located in river reaches further downstream. Outflows from reservoirs can be located anywhere from the top to the bottom of the dam. Some dams have multilevel outlets so that dam operators can choose from which depth to release water. Waters released from the hypolimnion of stratified reservoirs tend to be cooler, less-oxygenated, and carry more nutrients and solid particles than those withdrawn from the epilimnion. Primarily because of their position in the watershed and potential for the release of hypolimnion waters, reservoirs (rather than natural lakes) tend to have a greater impact on the water quality of the receiving river. The amount of water, timing of the discharge, and depth of the release influence the effect of a reservoir on downstream waters. Dam releases tend to lessen the seasonal fluctuations in downstream water levels but can increase the daily changes, as often occurs with hydroelectric generating dams (in Søballe et al. 1992: Baxter 1977, Ward and Standford 1979). 1. Impacts on Nutrient Levels Most nutrients stay trapped within natural lakes (Wright 1967 in Kennedy and Walker 1990). Newly constructed reservoirs tend to cause an overall gain in nutrients to downstream waters as nutrients are leached from inundated soils and submerged vegetation decomposes (in Kimmel et al. 1990: Baxter 1977, Ostrofsky and Duthie 1980, Grimard and Jones 1982, Kimmel and Groeger 1984). Monitoring above and below established impoundments generally shows that reservoirs reduce the annual loads of nutrients to downstream waters (e.g., Heinemann et al. 1973; Gloss et al. 1980, 1981; Frick et al. 1996; Frans et al. 2006). Lake Powell, a reservoir constructed on the Colorado River upstream of Lake Mead, was found to remove about 96% of the TP that once flowed into the upper basin of Lake Mead (Gloss et al. 1980, 1981). Lake Red Rock, a reservoir on the Des Moines River, reduced phosphorus levels in downstream waters by more than 75% and resulted in consistently low concentrations in downstream waters even during storm events (Kennedy et al. 1981). Likewise, observed
44
decreases in nutrient concentrations in the Chattahoochee River below Atlanta, Georgia are believed to result from nutrient uptake by phytoplankton and settling in a series of three reservoirs (Frick et al. 1996). Lakes and reservoirs decrease the amount of nutrients to downstream waters through several processes. Phosphorus attached to solid particles may settle out of the water and thus be made unavailable to primary producers in downstream receiving waters. Denitrification that occurs in the surrounding wetlands and in the bottom sediments removes nitrogen from the system. Phytoplankton, macrophytes, and periphyton in lakes and reservoirs take up biologically available forms of nutrients and thus, at least on a temporary basis, keep the nutrients from downstream waters (Frick et al. 1996). Runoff from overland flow tends to have a seasonal component to nutrient input, with snowmelt and spring rains providing pulses of nutrients. Reservoirs temporarily hold this nutrient laden runoff and release it to downstream waters during the following weeks and months. In this way, reservoirs extend the time period of the distribution of nutrients to downstream waters and may continue to release nutrients from spring runoff throughout the growing season (Kimmel et al. 1990). The constant input of nutrients from reservoirs can be especially noticeable if the water is discharged from the hypolimnion. This temporal redistribution of nutrients may affect the composition and abundance of algae in rivers downstream of reservoirs. Stratified reservoirs that discharge from the hypolimnion and have anoxic conditions may contribute phosphorus released from sediments. Other elements and compounds, such as ammonia, hydrogen sulfide, iron, and manganese may also be released. In sufficient quantities, ammonia and hydrogen sulfide are toxic to aquatic organisms. Hydrogen sulfide is also corrosive so can damage dam mechanisms and is associated with odor and taste problems in drinking water. Iron and manganese are undesirable in water supplies because of taste and staining problems (Baker 1996). Although it is more likely that the reservoir (instead of the downstream receiving waters) will serve as a source of water supply, the possible impact of these compounds need to be considered if the receiving waters are used for water supply. 2. Impact on Production Levels Even if eutrophic lakes and reservoirs provide phosphorus and nitrogen to downstream waters, the supplied nutrients may not lead to excessive algal biomass and impaired conditions in the receiving waters. The nutrient levels may be too low to initiate excessive algal growth in the stream or river community. Søballe and Kimmel (1987) found the ratio of algal counts per unit phosphorus to be highest in natural lakes, intermediate in reservoirs, and lowest in rivers. The authors, however, also found that natural lakes, reservoirs, and rivers did not significantly differ in their productivity per unit of phosphorus when residence times were similar, indicating that the algal response in some river systems or some reaches within a river system could be affected by the supply of nutrients from upstream reservoirs (Søballe and Kimmel 1987). In some situations, the retention of nutrients within lakes and reservoirs may negatively impact the downstream receiving waters by limiting production. For example, Libby Dam on the Kootenai River in Idaho, the second largest tributary of the Columbia River, retains nutrients to
45
the extent that periphytic growth downstream of the reservoir is limited (Snyder et al. 2002). Snyder and Minshall (2005) developed an energy budget that indicates low levels of nutrients below Libby Dam may even be linked to food limitations for declining populations of the endangered Kootenai white sturgeon (Acipenser transmontanus), particularly during early life-history stages. Phytoplankton from upstream lakes and reservoirs contribute to the food chains of receiving waters (in Søballe et al. 1992: Adams et al. 1983). This input of phytoplankton is especially noticeable when discharges occur from the surface (in Kimmel et al. 1990: Brook and Rzoska 1954, Talling and Rzoska 1967, Hammerton 1972, Shiel and Walker 1984, Petts 1984). Surface discharges contain mostly living phytoplankton whereas hypolimnion discharges have mainly deceased cells and detritus (in Kimmel et al. 1990: Coutant 1963, Cowell 1970, Lind 1971, Stroud and Martin 1973). Algae in streams and rivers either develop from phytoplankton and dislodged periphyton from upstream sources, including upstream lakes and reservoirs, or from phytoplankton that originate within the stream system (riverine phytoplankton) (Hynes 1970). Reservoirs, in particular, may provide a constant supply of algae to downstream waters (in Prygiel and Leitao 1994: Ekman-Ekebom et al. 1992, Round 1981, and Köhler 1993). Whether or not limnetic algae survive and increase in population in downstream receiving waters depends on the conditions of the lake/reservoir under which the algae are adapted, the conditions encountered in the receiving stream/river, and the growing conditions needed by the algae. According to Reynolds and Descy (1996, p. 165), “… as a general rule, obligate limnoplankton entering a river generally tends to decrease downstream ….” They qualify this generalization, however, to “exclude species introduced from shallow, well-mixed or well-flushed [lake and reservoir] systems, which tend to be dominated by algae with similar preadaptations” (Reynolds and Descy 1996, p. 165). Streams and rivers offer a complex and changing environment for phytoplankton. Not only must river phytoplankton contend with obtaining sufficient light and nutrients, they must also contend with the turbulence and downstream flow of the water. In order for phytoplankton populations to grow within a stream reach, the populations must reproduce faster than the current displaces them downstream. Therefore, fast-growing taxa have evolved in river systems (Reynolds 1994). In contrast, a fast growth rate is not required for phytoplankton adapted to lakes. Thus, limnetic phytoplankton with slow growth rates, such as some genera of cyanobacteria, are prevented from reaching bloom conditions when introduced to swift flowing streams and rivers and instead are restricted to slow-moving waters (Köhler 1994, Prygiel and Leitao 1994, Reynolds 1994). Köhler (1994) proposed that limnetic phytoplankton able to thrive under conditions of spring circulation (mixing conditions) are more likely to survive turbulent riverine conditions than are those adapted to stratified lakes and reservoirs. When lake and reservoir conditions are similar to those of the downstream receiving waters, the limnetic and riverine phytoplankton composition can be quite similar. For example, phytoplankton taxa able to withstand frequent fluctuations in light availability are likely to be successful in both shallow lakes and in rivers because both environments tend to be turbid and turbulent. In fact, phytoplankton compositions within turbid, shallow lakes more closely resemble those in rivers than those in either clear, shallow lakes or deep lakes (Reynolds et al.
46
1994). Likewise, when downstream river conditions resemble lake and reservoir environments, limnetic phytoplankton are more likely to survive in the receiving river. For example, Moss et al. (1984) and Prygiel and Leitao (1994) observed that some taxa of cyanobacteria from reservoirs continued to grow under low flow conditions in downstream receiving waters. 3. Impact on Dissolved Oxygen and Temperature Levels Both additions and depletions of oxygen content in downstream waters have been attributed to discharges from reservoirs: As an example, cold waters, which hold more oxygen, are released from the bottom of Lake Mead, a deep reservoir formed by the construction of Hoover Dam, and have been found to increase the oxygen concentrations in the upper region of a reservoir (Lake Mohave) located immediately downstream (Priscu et al. 1981 in Thornton 1990a). The input of cool water from reservoirs can impact the diversity and composition of the aquatic community in downstream waters. Native fish on the lower Colorado River that are adapted to warm, turbid waters are negatively impacted by the input of cool, clearer water from reservoirs (Baker 1996). Alternatively, sometimes the addition of cooler waters can provide habitat for coolwater species such as trout where none existed previously. In such situations, the support of trout populations would be a benefit if trout fishing is considered a designated use. More often, it is reported that discharges from the hypolimnion of stratified reservoirs deplete oxygen levels in downstream receiving waters, particularly if the discharge is from a shallow reservoir. For example, almost six miles of the Roanoke River in Virginia have been classified as impaired due to low dissolved oxygen levels because of discharges of low-oxygen waters from the hypolimnion of Kerr Reservoir (VDEQ 2004, 2006). Similarly, more than 15 miles of the Pee Dee River in North Carolina are classified as impaired for not supporting aquatic life because of low dissolved oxygen levels; water released from Norwood Dam is listed as the primary potential source of impairment (NC DENR 2006).
47
SECTION III — TOWARD DEVELOPING NUTRIENT CRITERIA SECTION III-A. POSSIBLE VARIABLES FOR DETERMINING NUTRIENT IMPAIRMENT Indicators of eutrophic conditions can be chemical, biological, or composite. Chemical indicators include concentrations of phosphorus and nitrogen. Biological indicators include measurements of biomass and productivity as well as biotic indices based on species richness, diversity, and other community attributes. Composite indicators usually refer to trophic state indices (TSIs). This section of the literature review provides general information about some of the most commonly considered variables for use in determining nutrient impairments. U.S. EPA recommends using a combination of both causal (e.g., TP, TN) and response variables (e.g., Chl-a, turbidity, DO) to avoid having false positive and false negative overenrichment results. The U.S. EPA’s technical guidance offers more information on the parameters described here as well as other potential variables (U.S. EPA 2000a). 1. Phosphorus Concentrations Section I-B of this document (Nutrient Input and Fate in Lakes and Reservoirs) provides general information about phosphorus as a nutrient and its ecological importance. As an essential and potentially limiting nutrient, phosphorus is an important variable to measure. Water samples collected from lakes and reservoirs are routinely analyzed for the amount of phosphorus. Because phosphorus tends to bind to mineral particles, water quality laboratories often filter samples through a 0.45-micron filter. The phosphorus that passes through the filter is called filterable phosphorus. Filterable phosphorus is often referred to as “soluble” or “dissolved” phosphorus even though the filtrate may contain both dissolved and colloidal (tiny particles in suspension) forms of phosphorus. The part of the sample that cannot pass through the 0.45-micron filter is referred to as particulate phosphorus. These particulate samples may contain mineral materials as well as organic components such as bacteria, algae, zooplankton, particles of plant material, etc. Total phosphorus (TP) measures all the organic and inorganic, filterable and particulate forms of phosphorus. TP is generally measured when describing the phosphorus enrichment level of lakes and reservoirs because most of the phosphorus in the system is in the particulate form and will assumedly be recycled within the water body in a form that is accessible to primary producers (Horne and Goldman 1994, Wetzel 2001). Phosphorus concentrations of water samples taken from lakes and reservoirs are generally reported in units of ppb, µg/L (1 µg/L = 1 ppb), or mg/L. 2. Nitrogen Concentrations Nitrogen is another essential nutrient that is described in more detail in Section I-B of this review. Nitrogen in water samples can be measured in several different forms, for example:
• nitrate-N = (NO3-N) • nitrite-N = (NO2-N)
48
• total ammonia-N = ammonia-N (NH3-N) + ammonium-N (NH4-N) • total Kjeldahl nitrogen (TKN) = total ammonia-N + total organic nitrogen • total nitrogen (TN) = NO3-N + NO2-N + TKN
Because these nitrogen species can be converted from one form into other forms, nitrogen in water samples from lakes and reservoirs is usually reported as total nitrogen (TN). Total nitrogen measures all the nitrates, nitrites, total ammonia-N, and total organic nitrogen in the water. Nitrogen measurements from lake and reservoir samples are typically expressed in units of mg/L. 3. Chlorophyll-a Concentrations The biomass of phytoplankton in lakes and reservoirs is often estimated by measuring the amount of chlorophyll-a (Chl-a), the predominant green pigment used in photosynthesis. Chl-a can be determined from a sample of phytoplankton collected from the water column. To determine the amount of Chl-a, the chlorophyll is extracted from the cells with a solvent such as acetone. The Chl-a value is then measured by such means as spectrophotometry, fluorometry, or high pressure liquid chromatography (HPLC) (APHA 1998). Chlorophyll-a concentrations from water samples taken from lakes and reservoirs are generally reported in units of ppb, µg/L, or mg/m3 (1 ppb = 1µg/L = 1 mg/m3). U.S. EPA cautions that Chl-a data derived from the different methodologies are not interchangeable (U.S. EPA 2000b-h, 2001a-e). Spectrophotometry measures the amount of light absorbance at specific wavelengths. One method of spectrophotometric analysis relies on trichromatic equations. U.S. EPA does not recommend the use of Chl-a values derived by trichromatic equations unless no other data exist (U.S. EPA 2000b-h, 2001a-e). Fluorometry measures the amount of light emitted at a particular wavelength when exposed to light at a different wavelength. The presence of other chlorophyll pigments (e.g., pheophytin) can interfere with the Chl-a measurement using either the spectrophotometric or fluorometric methods. For this reason, U.S. EPA prefers data from methods that also incorporate an acid correction treatment (U.S. EPA 2000b-h, 2001a-e). Standard Methods for the Examination of Water and Wastewater (APHA 1998), however, does not recommend the acidification step for freshwaters when using the fluorometric technique if pheopigments (Chl-b) are also present. Although HPLC accurately separates the pigments based on physical characteristics, it is an expensive and time-consuming method so is not used as often as the spectrophotometric and fluorometric methods (NC WRRI 2001). Furthermore, for the purpose of estimating biomass, the accuracy provided by HPLC is not necessary (U.S. EPA 2000a). Some experts suggest recording total chlorophyll pigments because all current methods of measuring chlorophyll-a concentrations ignore some interferences. Carlson and Simpson (1996) state: “It is strongly recommended that the total chlorophyll pigment be reported in addition to chlorophyll a. This value, although flawed by interferences by other chlorophylls, phaeo-pigments, as well as a number of other possible interferences, is the only value that remains fairly independent of chlorophyll methodology. Therefore, it is the only measurement that provides historical consistency. Chlorophyll a methodologies have changed over the past 25 years, and with each change, the previous chlorophyll estimates became obsolete and non-
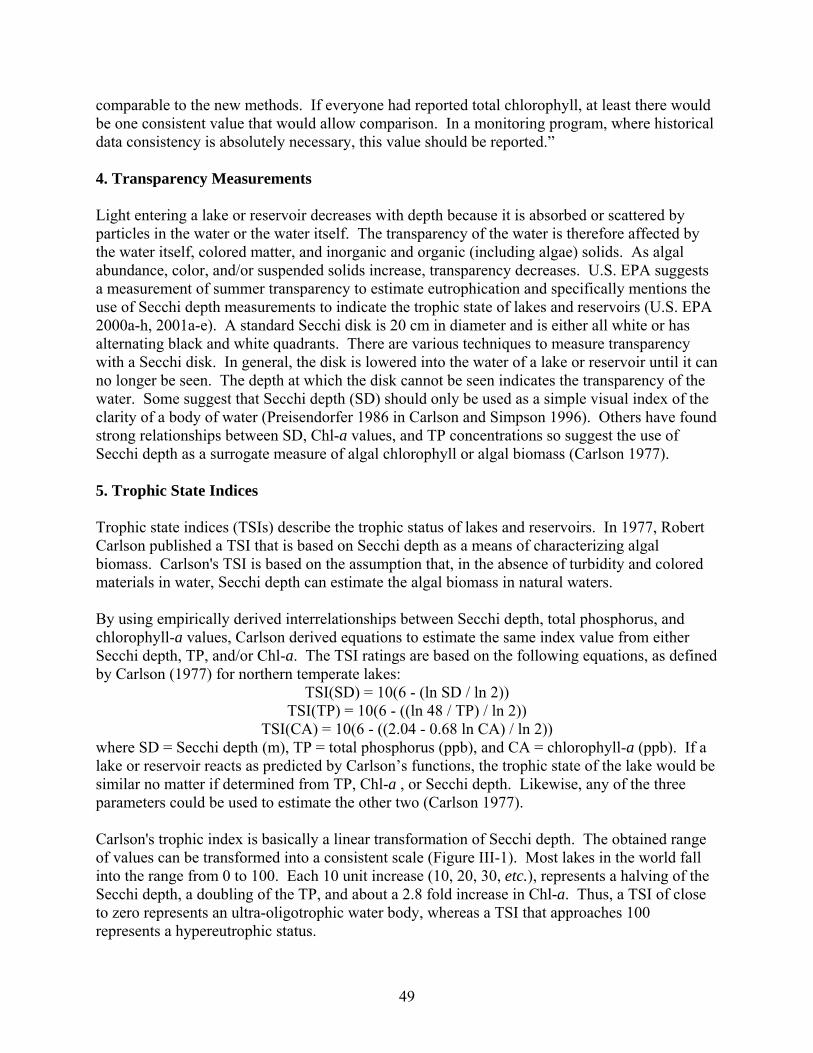
49
comparable to the new methods. If everyone had reported total chlorophyll, at least there would be one consistent value that would allow comparison. In a monitoring program, where historical data consistency is absolutely necessary, this value should be reported.” 4. Transparency Measurements Light entering a lake or reservoir decreases with depth because it is absorbed or scattered by particles in the water or the water itself. The transparency of the water is therefore affected by the water itself, colored matter, and inorganic and organic (including algae) solids. As algal abundance, color, and/or suspended solids increase, transparency decreases. U.S. EPA suggests a measurement of summer transparency to estimate eutrophication and specifically mentions the use of Secchi depth measurements to indicate the trophic state of lakes and reservoirs (U.S. EPA 2000a-h, 2001a-e). A standard Secchi disk is 20 cm in diameter and is either all white or has alternating black and white quadrants. There are various techniques to measure transparency with a Secchi disk. In general, the disk is lowered into the water of a lake or reservoir until it can no longer be seen. The depth at which the disk cannot be seen indicates the transparency of the water. Some suggest that Secchi depth (SD) should only be used as a simple visual index of the clarity of a body of water (Preisendorfer 1986 in Carlson and Simpson 1996). Others have found strong relationships between SD, Chl-a values, and TP concentrations so suggest the use of Secchi depth as a surrogate measure of algal chlorophyll or algal biomass (Carlson 1977). 5. Trophic State Indices Trophic state indices (TSIs) describe the trophic status of lakes and reservoirs. In 1977, Robert Carlson published a TSI that is based on Secchi depth as a means of characterizing algal biomass. Carlson's TSI is based on the assumption that, in the absence of turbidity and colored materials in water, Secchi depth can estimate the algal biomass in natural waters. By using empirically derived interrelationships between Secchi depth, total phosphorus, and chlorophyll-a values, Carlson derived equations to estimate the same index value from either Secchi depth, TP, and/or Chl-a. The TSI ratings are based on the following equations, as defined by Carlson (1977) for northern temperate lakes:
TSI(SD) = 10(6 - (ln SD / ln 2)) TSI(TP) = 10(6 - ((ln 48 / TP) / ln 2))
TSI(CA) = 10(6 - ((2.04 - 0.68 ln CA) / ln 2)) where SD = Secchi depth (m), TP = total phosphorus (ppb), and CA = chlorophyll-a (ppb). If a lake or reservoir reacts as predicted by Carlson’s functions, the trophic state of the lake would be similar no matter if determined from TP, Chl-a , or Secchi depth. Likewise, any of the three parameters could be used to estimate the other two (Carlson 1977). Carlson's trophic index is basically a linear transformation of Secchi depth. The obtained range of values can be transformed into a consistent scale (Figure III-1). Most lakes in the world fall into the range from 0 to 100. Each 10 unit increase (10, 20, 30, etc.), represents a halving of the Secchi depth, a doubling of the TP, and about a 2.8 fold increase in Chl-a. Thus, a TSI of close to zero represents an ultra-oligotrophic water body, whereas a TSI that approaches 100 represents a hypereutrophic status.
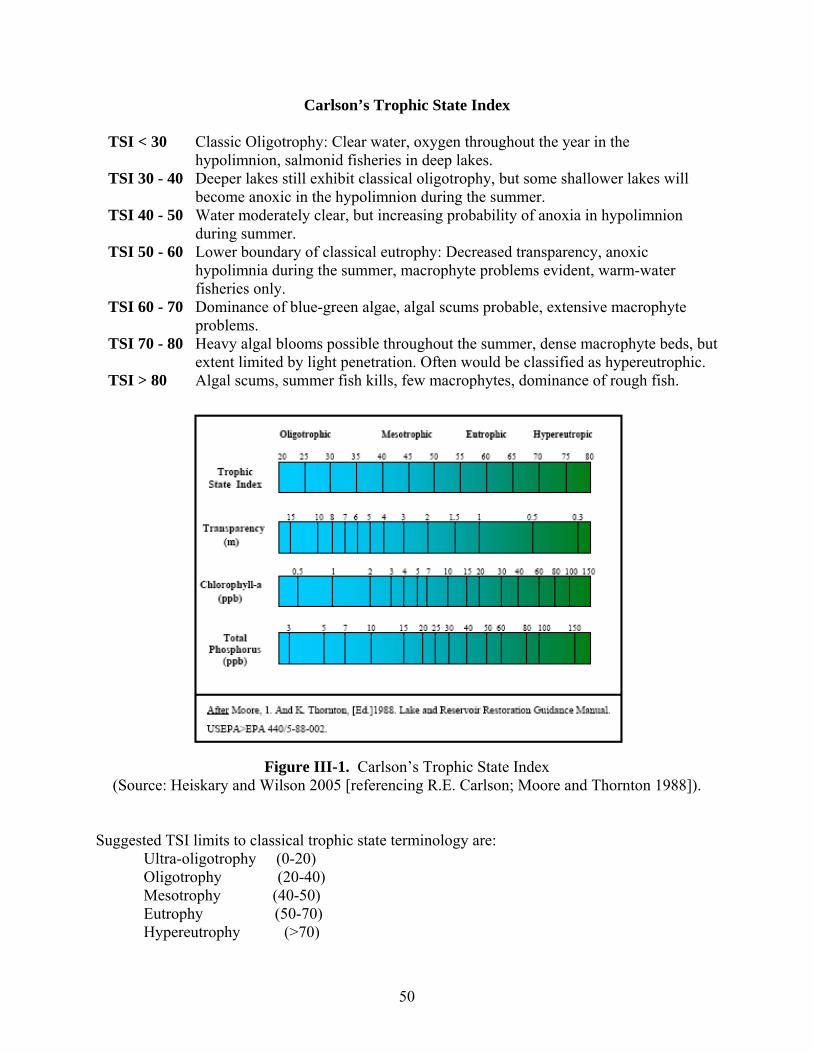
50
Carlson’s Trophic State Index
TSI < 30 Classic Oligotrophy: Clear water, oxygen throughout the year in the hypolimnion, salmonid fisheries in deep lakes.
TSI 30 - 40 Deeper lakes still exhibit classical oligotrophy, but some shallower lakes will become anoxic in the hypolimnion during the summer.
TSI 40 - 50 Water moderately clear, but increasing probability of anoxia in hypolimnion during summer.
TSI 50 - 60 Lower boundary of classical eutrophy: Decreased transparency, anoxic hypolimnia during the summer, macrophyte problems evident, warm-water fisheries only.
TSI 60 - 70 Dominance of blue-green algae, algal scums probable, extensive macrophyte problems.
TSI 70 - 80 Heavy algal blooms possible throughout the summer, dense macrophyte beds, but extent limited by light penetration. Often would be classified as hypereutrophic.
TSI > 80 Algal scums, summer fish kills, few macrophytes, dominance of rough fish.
Figure III-1. Carlson’s Trophic State Index
(Source: Heiskary and Wilson 2005 [referencing R.E. Carlson; Moore and Thornton 1988]).
Suggested TSI limits to classical trophic state terminology are: Ultra-oligotrophy (0-20) Oligotrophy (20-40) Mesotrophy (40-50) Eutrophy (50-70) Hypereutrophy (>70)
51
A TSI value of 60 or greater indicates average eutrophic conditions and corresponds to a Secchi depth of 1 meter, a chlorophyll-a value of 20 ppb (or µg/L), and a TP concentration of 48 ppb (or µg/L) (Figure III-1.). Carlson and Simpson (1996) predict that a north temperate lake with a TSI of 60 would experience taste and odor problems if used for drinking water and would possibly have nuisance macrophytes, algal scums, and low transparency that could discourage swimming and boating. According to Carlson (1977), the TSI is a simple approach based from easily obtained data with known relationships. The TSI is also a good means to portray scientific information in a way that can be understood by the general public. The Carlson index will not work if phytoplankton are limited by a nutrient other than phosphorus. For example, Carlson’s TSI is not applicable in lakes that are limited by nitrogen. Likewise, Carlson’s TSI will not work for lakes and reservoirs where Secchi depth is significantly influenced by non-algal turbidity and/or dissolved water color (Horne and Goldman 1994). Another problem with using Carlson’s TSI to express nutrient criteria is its inability to account for spatial and temporal differences within the water body. Sediment-related non-algal turbidity varies spatially across the water body and temporally in response to weather conditions and seasonal cycles. For example, in reservoirs the most turbid region is likely to be in the upper channel. The TSI would register the increased turbidity as representing a higher trophic state, but this is in not generally the most productive region. Other TSIs besides Carlson’s have also been developed. For example, Kratzer and Brezonik (1981), Huber et al. (1982), and others have developed nitrogen-based TSIs for use in N-limited lakes and reservoirs. These TSIs can be used when the N:P ratio (wt:wt) is <10, which indicates N limitation. Brezonik (1984) and Cooke et al. (1993) (in Baker [1996]) have reviewed indices based on other variables, including those that are based on macrophytes and hypolimnetic dissolved oxygen. 6. Dissolved Oxygen Concentrations Because dissolved oxygen levels are influenced by changes in the trophic state of lakes and reservoirs, DO can be an important variable for determining nutrient-impaired waters. Whereas chlorophyll-a concentrations and Secchi depth are primary response variables because increases in nutrient concentrations lead directly to greater algal growth and decreased water transparency, DO is a secondary response variable (U.S. EPA 2000a). Excess nutrients cause an increase in algal growth, which then leads to lower DO concentrations. Oxygen primarily dissolves in water from either the atmosphere or as a byproduct of photosynthesis. The amount of oxygen that freshwaters can hold depends on the water temperature and pressure. For example, colder waters are able to hold more DO. Under certain circumstances, the water can become supersaturated with oxygen, meaning that it holds more than 100% of the amount of oxygen than could be dissolved under normal circumstances at that temperature and pressure. Supersaturation can occur as a result of photosynthesis by excessive
52
amounts of primary production. Supersaturation of lakes and reservoirs (or the epilimnion of stratified waters) on sunny, warm days may indicate excessive photosynthetic activity and thus eutrophic conditions. The vertical distribution of oxygen concentrations can be used as a rough estimate of trophic state in natural lakes. In summer, within stratified oligotrophic lakes, an orthograde oxygen curve is typically observed whereby the epilimnion has lower oxygen concentrations than the hypolimnion because the warmer, surface waters hold less oxygen than the cooler, deeper waters of the hypolimnion. In these oligotrophic lakes, the water column is well oxygenated throughout. In contrast, eutrophic stratified lakes in summer tend to display a clinograde oxygen curve, whereby oxygen levels are higher in the epilimnion than in the hypolimnion. Clinograde oxygen curves indicate consumption of oxygen in the hypolimnion through such processes as decay of organic matter from deceased phytoplankton and macrophytes. Therefore, the amount of oxygen deficit in the hypolimnion of natural lakes can indicate the amount of primary production in the epilimnion (Cole 1994). The use of vertical DO concentrations to indicate trophic conditions as used for natural lakes, however, is not applicable to reservoirs because hypolimnetic DO depletion is common in both oligotrophic and eutrophic reservoirs. Compared to natural lakes, reservoirs have more complex oxygen distribution patterns. The change in depth and width along the length of a reservoir results in longitudinal differences in the amount of DO available to meet oxygen demands. Furthermore, changes in morphology and water velocity along the length of reservoirs cause longitudinal gradients in many other factors (e.g., primary production, sedimentation, hypolimnetic temperature) that impact oxygen demand (Cole and Hannan 1990). Oxygen depletion in reservoirs usually begins in the hypolimnetic waters of the thalweg (lowest part of the reservoir, generally along the length of the old streambed) within the transition zone and expands outward and upward (Cole and Hannan 1990). Maintaining an adequate DO concentration in all regions of lakes and reservoirs at all times is important because aquatic organisms require DO. During turnover, the bottom waters are transported to the surface where they are aerated. Thus, during mixing periods, oxygenated conditions are most likely to exist throughout the entire water column. In contrast during stratified periods, such as in summer, the two layers are separate. DO deficiencies are most likely in the hypolimnion because (1) the water in the hypolimnion is isolated from the atmosphere, (2) the levels of light in the hypolimnion are not sufficient for photosynthesis so oxygen as a byproduct of photosynthesis is not available, and (3) the hypolimnion is the primary region of decomposition so bacteria that utilize oxygen are active and deplete the supply of dissolved oxygen. As a lake or reservoir becomes eutrophic, the rate of oxygen deficiency in the hypolimnion increases. Under eutrophic conditions, more organic materials settle into the hypolimnion and decompose. Partially decomposed matter also accumulates in sediments where it decomposes in subsequent years. The decomposition of settled material and subsequent decrease of hypolimnion DO may occur prior to noticeable changes of the algal community of the epilimnion. Thus, the oxygen concentration of the hypolimnion and its rate of depletion may be
53
potentially useful in identifying eutrophic conditions (Carlson and Simpson 1996, U.S. EPA 2000a). Care must be taken in using oxygen depletion in the hypolimnion to indicate changes in trophic state because many other factors contribute to DO levels including the morphometry of the water body and the size of the hypolimnion relative to the epilimnion. For instance, the size of the hypolimnion is so important that oxygen depletion rates are typically indexed to the hypolimnion surface area (referred to as the areal hypolimnetic oxygen deficit) (Hutchison 1957 in U.S. EPA 2000a). The temperature of the water, dissolved color in the water, and other factors also control DO levels. For example, oligotrophic or mesotrophic lakes and reservoirs in warmer environments could be considered eutrophic if based on only oxygen deficits. SECTION III-B. MANAGEMENT ISSUES When implementing nutrient criteria, it will be important to recognize the management history of individual lakes or reservoirs. Depending on the parameters analyzed (e.g., nutrient concentrations, Chl-a levels, oxygen profiles, etc.), certain management practices could affect monitoring results. For example, some lakes and reservoirs used to grow fish for stocking or commercial harvest add fertilizer to encourage primary production and strengthen the base of the food web. Obviously, because fertilizers contain nutrients, nutrient levels and other parameters, such as Chl-a, would likely be affected by the addition of fertilizers. Low hypolimnetic DO levels, as a consequence of cultural eutrophication, are of concern to lake and reservoir managers because such waters provide poor fish habitat and release nutrients from the sediment. For example, under low hypolimnetic oxygen conditions, hydrogen sulfide, manganese, and iron — substances associated with drinking water odor, taste, and staining issues — can be released from bottom sediments and drawn into water supply treatment systems. The managers of lakes and reservoirs, therefore, often provide some means to increase oxygen levels (Cooke and Carlson 1989, Horne and Goldman 1994). Many water supply plants use one of several methods to increase oxygen concentrations in the hypolimnion of their water supply lakes and reservoirs. Methods to increase DO in managed lakes and reservoirs include the addition of calcium nitrate, artificial circulation, side stream oxygenation, and oxygenation of the hypolimnion (Horne and Goldman 1994).
• The addition of calcium nitrate, as described in Section II-B (Impoundment Issues that Affect Nutrients — Internal Loading) oxidizes, precipitates, and immobilizes phosphates, iron, and hydrogen sulfide (Horne and Goldman 1994).
• Artificial circulation vertically mixes the water with paddles, water pumps, or injected air (Pastorok et al. 1981 in Baker 1996). In addition to increasing DO levels, this method has been shown to cause a shift in the algal dominance from cyanobacteria (blue-green algae) to green algae (Cooke and Pastorok et al. 1981 in Baker 1996).
• With side stream oxygenation, small quantities of water from the hypolimnion are withdrawn, supersaturated with oxygen, and returned to the hypolimnion.
• Studies documenting the effects of hypolimnetic oxygenation have been reviewed by Fast and Lorenzen (1976), Pastorok et al. (1982), McQueen and Lean (1986), and Beutel and Horne (1999). In their review, Beutel and Horne (1999) reported that as a result of
54
hypolimnion oxygenation, average hypolimnetic DO concentrations were maintained at greater than 4 mg/L in all cases. Furthermore, hypolimnetic concentrations of dissolved phosphorus, ammonia, manganese, and hydrogen sulfide were reduced by 50 – 100 percent. Likewise McQueen and Lean (1986) found that for generally all installations, iron, manganese, and hydrogen sulfide levels decreased following hypolimnetic oxygenation (Appendix C in Zipper et al. 2005).
Biological manipulations of lakes and reservoirs need to be considered when developing and implementing nutrient criteria. If using Chl-a concentrations as a criterion, it will be important to know which lakes and reservoirs have been chemically treated and how. For instance, many water supply plants control algae by adding copper sulfate. In sufficient doses, cupric ions kill algae, which would then reduce the amount of Chl-a in water samples taken from treated lakes and reservoirs (Horne and Goldman 1994). Methods used to control nuisance levels of macrophytes in shallow lakes and reservoirs include the harvesting of plants, dredging of sediment, lowering of water, and stocking of grass carp (Horne and Goldman 1994, Baker 1996). Thus, if macrophytic coverage is used as part of the criteria, it would be necessary to know whether or not any of these or other management treatments had been used. SECTION III-C. VARIOUS APPROACHES TO DEVELOPING NUTRIENT CRITERIA 1. U.S. EPA’s Approach A group of national experts working with U.S. EPA in addressing nutrient criteria development issues recommended that U.S. EPA “not develop single criteria values for phosphorus or nitrogen applicable to all water bodies and regions of the country. Rather, the experts recommended that EPA put a premium on regionalization, develop guidance (assessment tools and control measures) for specific water bodies and ecological regions across the country, and use reference conditions (conditions that reflect pristine or minimally impacted waters) as a basis for developing nutrient criteria” (U.S. EPA 2000b-h, 2001a-e, p. 1). For the contiguous United States, therefore, U.S. EPA developed 14 aggregate nutrient ecoregions. Ecoregions represent “regions of relative homogeneity in ecological systems; they depict areas within which the mosaic of ecosystem components (biotic and abiotic as well as terrestrial and aquatic) is different than adjacent areas in a holistic sense” (U.S. EPA 2000b-h, 2001a-e, p. 3). This aggregate ecoregion system was developed by combining U.S. EPA’s level III ecoregions in such a way as to represent similarities in geology, soils, climate, hydrology, vegetation, and wildlife. These components influence the natural levels of nutrients in lakes and reservoirs and the movement of nutrients through these systems. The large-scale aggregate ecoregions were used by U.S. EPA to develop guidance nutrient levels. By lumping data from several level III ecoregions, however, variability within the aggregate nutrient ecoregion was high. Thus, U.S. EPA “recommends that States and Tribes develop nutrient criteria at the level III ecoregional scale and at the waterbody class scale where those data are readily available” (U.S. EPA 2000b-h, 2001a-e, p. 3).
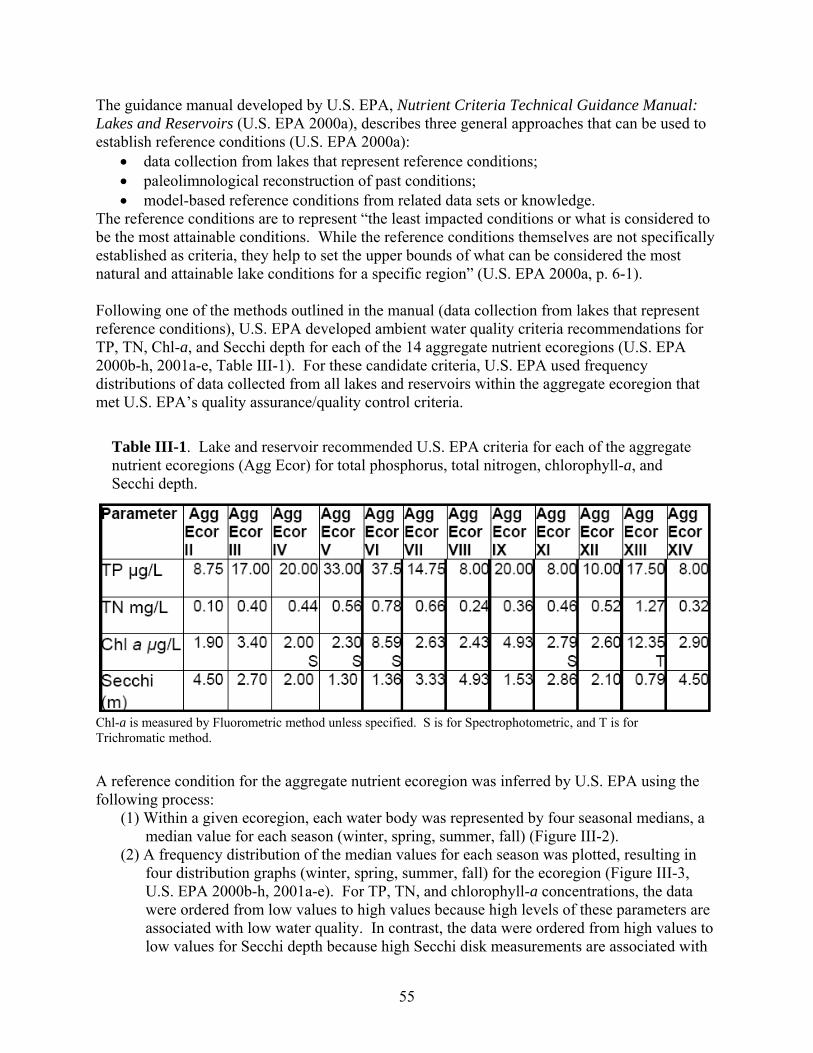
55
The guidance manual developed by U.S. EPA, Nutrient Criteria Technical Guidance Manual: Lakes and Reservoirs (U.S. EPA 2000a), describes three general approaches that can be used to establish reference conditions (U.S. EPA 2000a):
• data collection from lakes that represent reference conditions; • paleolimnological reconstruction of past conditions; • model-based reference conditions from related data sets or knowledge.
The reference conditions are to represent “the least impacted conditions or what is considered to be the most attainable conditions. While the reference conditions themselves are not specifically established as criteria, they help to set the upper bounds of what can be considered the most natural and attainable lake conditions for a specific region” (U.S. EPA 2000a, p. 6-1). Following one of the methods outlined in the manual (data collection from lakes that represent reference conditions), U.S. EPA developed ambient water quality criteria recommendations for TP, TN, Chl-a, and Secchi depth for each of the 14 aggregate nutrient ecoregions (U.S. EPA 2000b-h, 2001a-e, Table III-1). For these candidate criteria, U.S. EPA used frequency distributions of data collected from all lakes and reservoirs within the aggregate ecoregion that met U.S. EPA’s quality assurance/quality control criteria.
Table III-1. Lake and reservoir recommended U.S. EPA criteria for each of the aggregate nutrient ecoregions (Agg Ecor) for total phosphorus, total nitrogen, chlorophyll-a, and Secchi depth.
Chl-a is measured by Fluorometric method unless specified. S is for Spectrophotometric, and T is for Trichromatic method.
A reference condition for the aggregate nutrient ecoregion was inferred by U.S. EPA using the following process:
(1) Within a given ecoregion, each water body was represented by four seasonal medians, a median value for each season (winter, spring, summer, fall) (Figure III-2).
(2) A frequency distribution of the median values for each season was plotted, resulting in four distribution graphs (winter, spring, summer, fall) for the ecoregion (Figure III-3, U.S. EPA 2000b-h, 2001a-e). For TP, TN, and chlorophyll-a concentrations, the data were ordered from low values to high values because high levels of these parameters are associated with low water quality. In contrast, the data were ordered from high values to low values for Secchi depth because high Secchi disk measurements are associated with
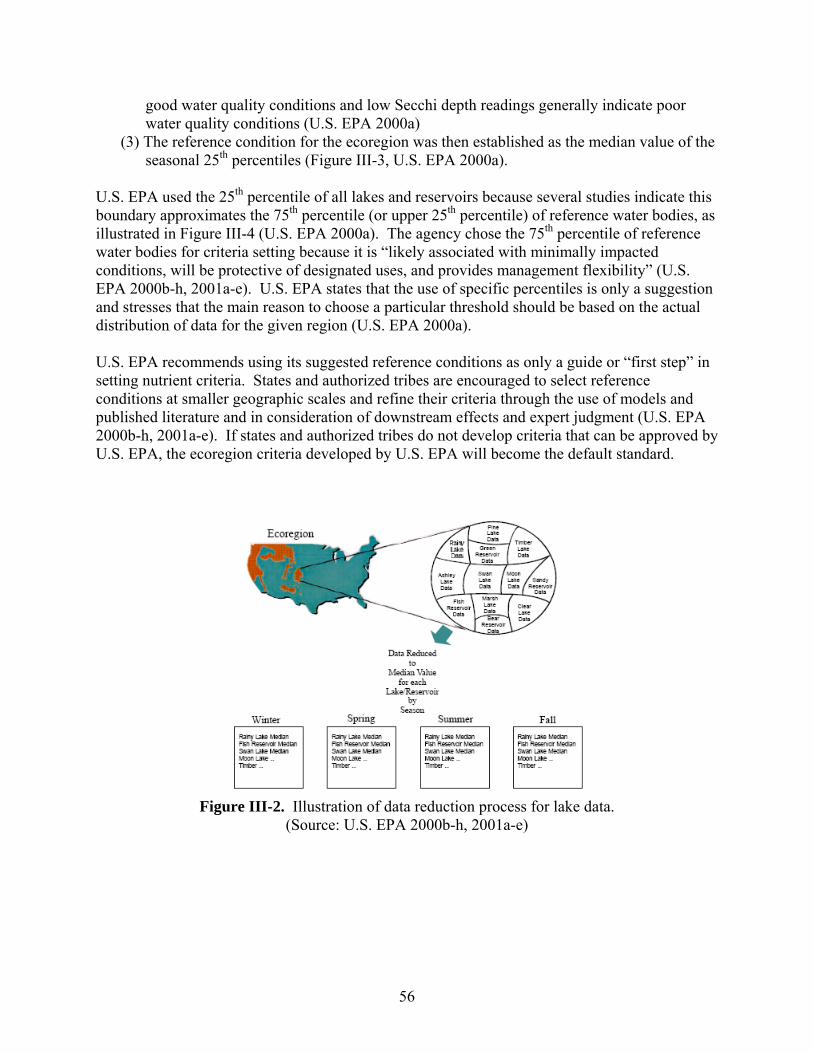
56
good water quality conditions and low Secchi depth readings generally indicate poor water quality conditions (U.S. EPA 2000a)
(3) The reference condition for the ecoregion was then established as the median value of the seasonal 25th percentiles (Figure III-3, U.S. EPA 2000a).
U.S. EPA used the 25th percentile of all lakes and reservoirs because several studies indicate this boundary approximates the 75th percentile (or upper 25th percentile) of reference water bodies, as illustrated in Figure III-4 (U.S. EPA 2000a). The agency chose the 75th percentile of reference water bodies for criteria setting because it is “likely associated with minimally impacted conditions, will be protective of designated uses, and provides management flexibility” (U.S. EPA 2000b-h, 2001a-e). U.S. EPA states that the use of specific percentiles is only a suggestion and stresses that the main reason to choose a particular threshold should be based on the actual distribution of data for the given region (U.S. EPA 2000a). U.S. EPA recommends using its suggested reference conditions as only a guide or “first step” in setting nutrient criteria. States and authorized tribes are encouraged to select reference conditions at smaller geographic scales and refine their criteria through the use of models and published literature and in consideration of downstream effects and expert judgment (U.S. EPA 2000b-h, 2001a-e). If states and authorized tribes do not develop criteria that can be approved by U.S. EPA, the ecoregion criteria developed by U.S. EPA will become the default standard.
Figure III-2. Illustration of data reduction process for lake data.
(Source: U.S. EPA 2000b-h, 2001a-e)
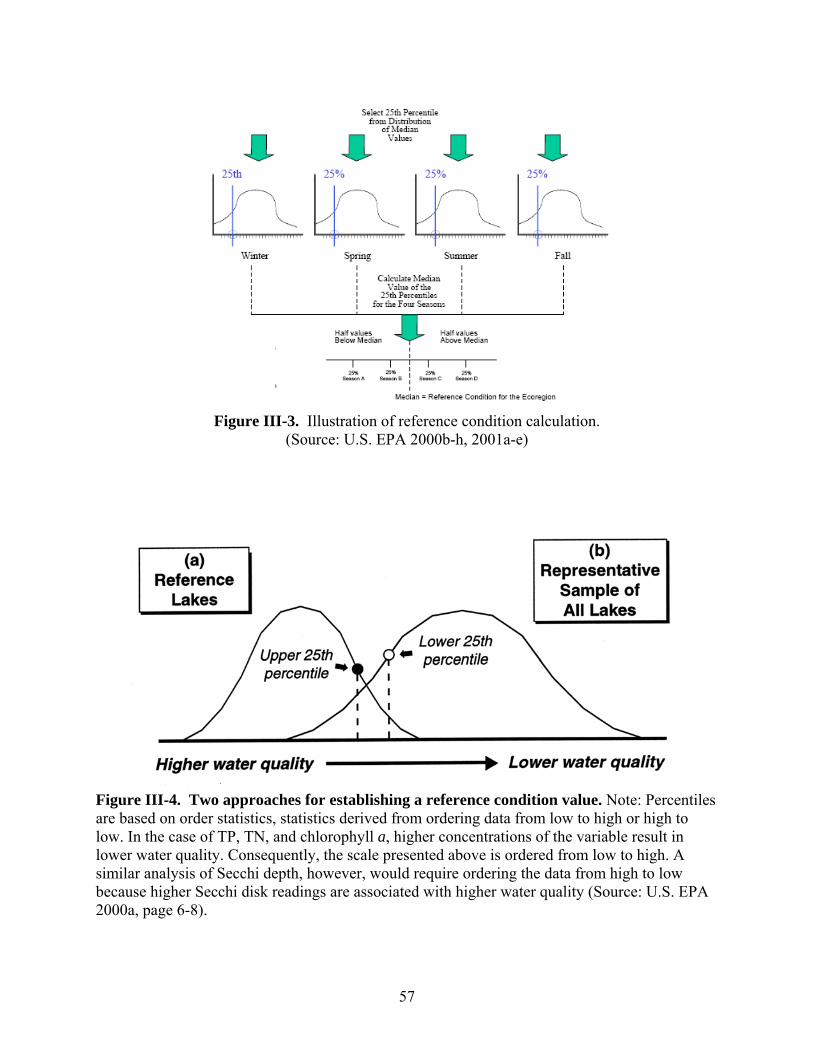
57
Figure III-3. Illustration of reference condition calculation.
(Source: U.S. EPA 2000b-h, 2001a-e)
Figure III-4. Two approaches for establishing a reference condition value. Note: Percentiles are based on order statistics, statistics derived from ordering data from low to high or high to low. In the case of TP, TN, and chlorophyll a, higher concentrations of the variable result in lower water quality. Consequently, the scale presented above is ordered from low to high. A similar analysis of Secchi depth, however, would require ordering the data from high to low because higher Secchi disk readings are associated with higher water quality (Source: U.S. EPA 2000a, page 6-8).
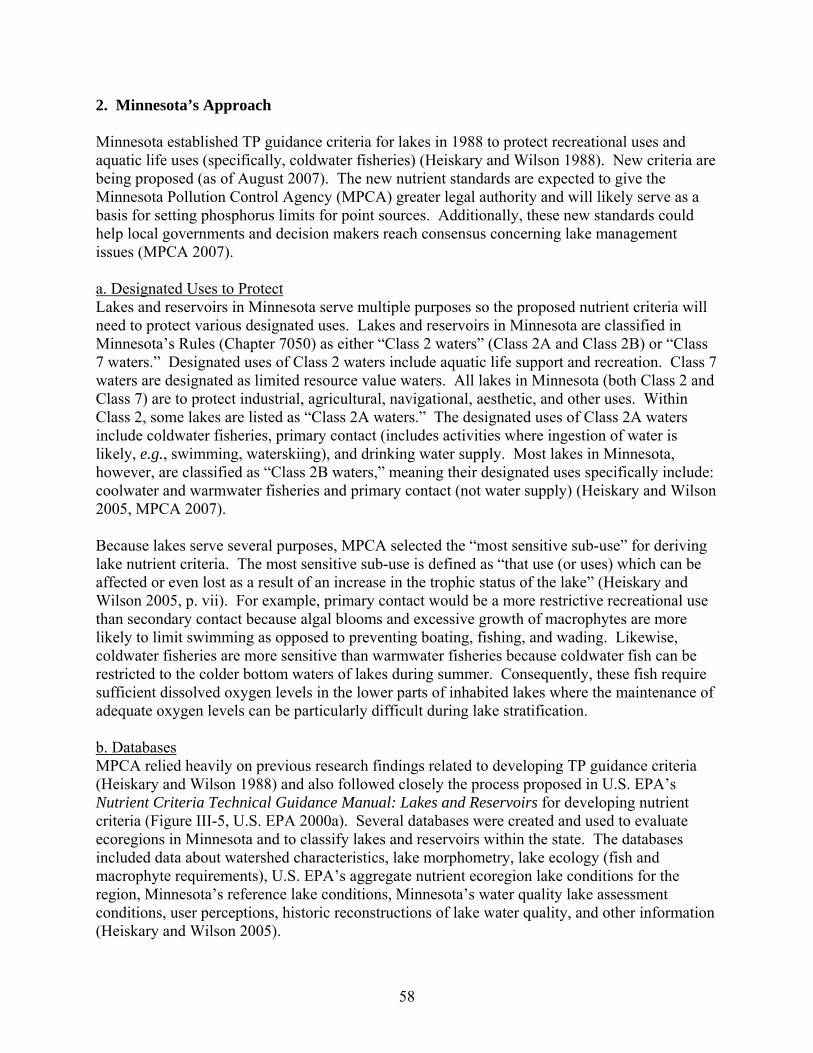
58
2. Minnesota’s Approach Minnesota established TP guidance criteria for lakes in 1988 to protect recreational uses and aquatic life uses (specifically, coldwater fisheries) (Heiskary and Wilson 1988). New criteria are being proposed (as of August 2007). The new nutrient standards are expected to give the Minnesota Pollution Control Agency (MPCA) greater legal authority and will likely serve as a basis for setting phosphorus limits for point sources. Additionally, these new standards could help local governments and decision makers reach consensus concerning lake management issues (MPCA 2007). a. Designated Uses to Protect Lakes and reservoirs in Minnesota serve multiple purposes so the proposed nutrient criteria will need to protect various designated uses. Lakes and reservoirs in Minnesota are classified in Minnesota’s Rules (Chapter 7050) as either “Class 2 waters” (Class 2A and Class 2B) or “Class 7 waters.” Designated uses of Class 2 waters include aquatic life support and recreation. Class 7 waters are designated as limited resource value waters. All lakes in Minnesota (both Class 2 and Class 7) are to protect industrial, agricultural, navigational, aesthetic, and other uses. Within Class 2, some lakes are listed as “Class 2A waters.” The designated uses of Class 2A waters include coldwater fisheries, primary contact (includes activities where ingestion of water is likely, e.g., swimming, waterskiing), and drinking water supply. Most lakes in Minnesota, however, are classified as “Class 2B waters,” meaning their designated uses specifically include: coolwater and warmwater fisheries and primary contact (not water supply) (Heiskary and Wilson 2005, MPCA 2007). Because lakes serve several purposes, MPCA selected the “most sensitive sub-use” for deriving lake nutrient criteria. The most sensitive sub-use is defined as “that use (or uses) which can be affected or even lost as a result of an increase in the trophic status of the lake” (Heiskary and Wilson 2005, p. vii). For example, primary contact would be a more restrictive recreational use than secondary contact because algal blooms and excessive growth of macrophytes are more likely to limit swimming as opposed to preventing boating, fishing, and wading. Likewise, coldwater fisheries are more sensitive than warmwater fisheries because coldwater fish can be restricted to the colder bottom waters of lakes during summer. Consequently, these fish require sufficient dissolved oxygen levels in the lower parts of inhabited lakes where the maintenance of adequate oxygen levels can be particularly difficult during lake stratification. b. Databases MPCA relied heavily on previous research findings related to developing TP guidance criteria (Heiskary and Wilson 1988) and also followed closely the process proposed in U.S. EPA’s Nutrient Criteria Technical Guidance Manual: Lakes and Reservoirs for developing nutrient criteria (Figure III-5, U.S. EPA 2000a). Several databases were created and used to evaluate ecoregions in Minnesota and to classify lakes and reservoirs within the state. The databases included data about watershed characteristics, lake morphometry, lake ecology (fish and macrophyte requirements), U.S. EPA’s aggregate nutrient ecoregion lake conditions for the region, Minnesota’s reference lake conditions, Minnesota’s water quality lake assessment conditions, user perceptions, historic reconstructions of lake water quality, and other information (Heiskary and Wilson 2005).
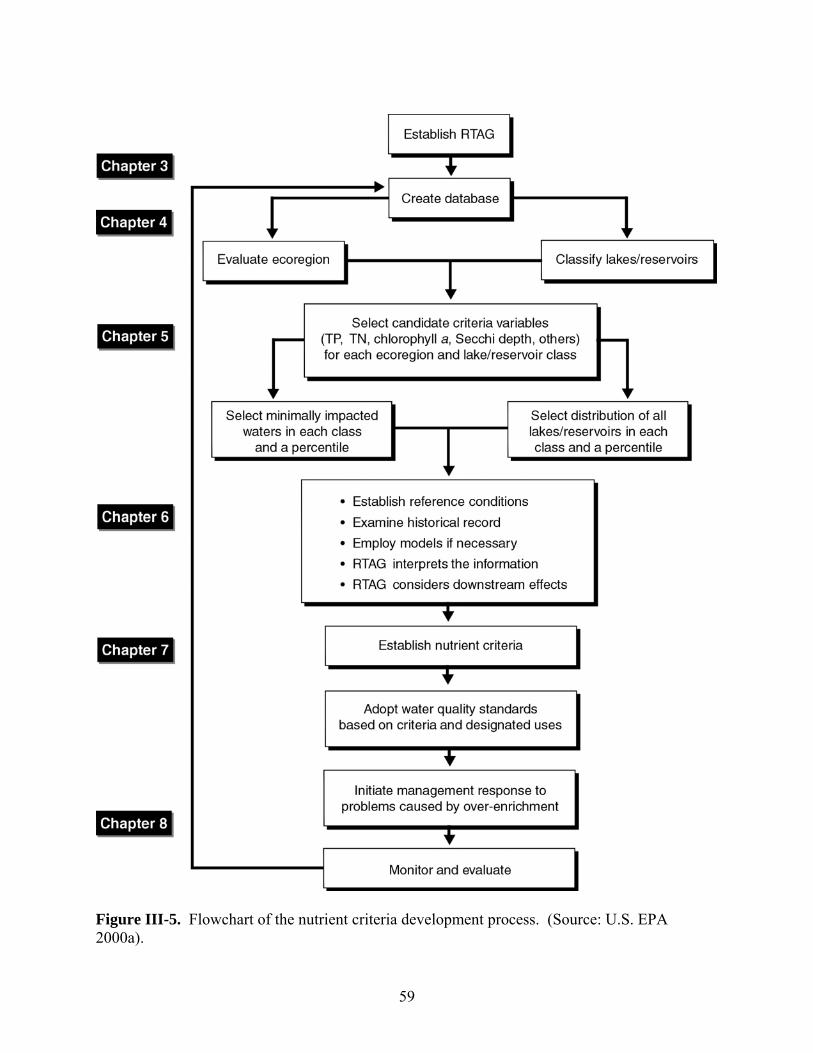
59
Figure III-5. Flowchart of the nutrient criteria development process. (Source: U.S. EPA 2000a).
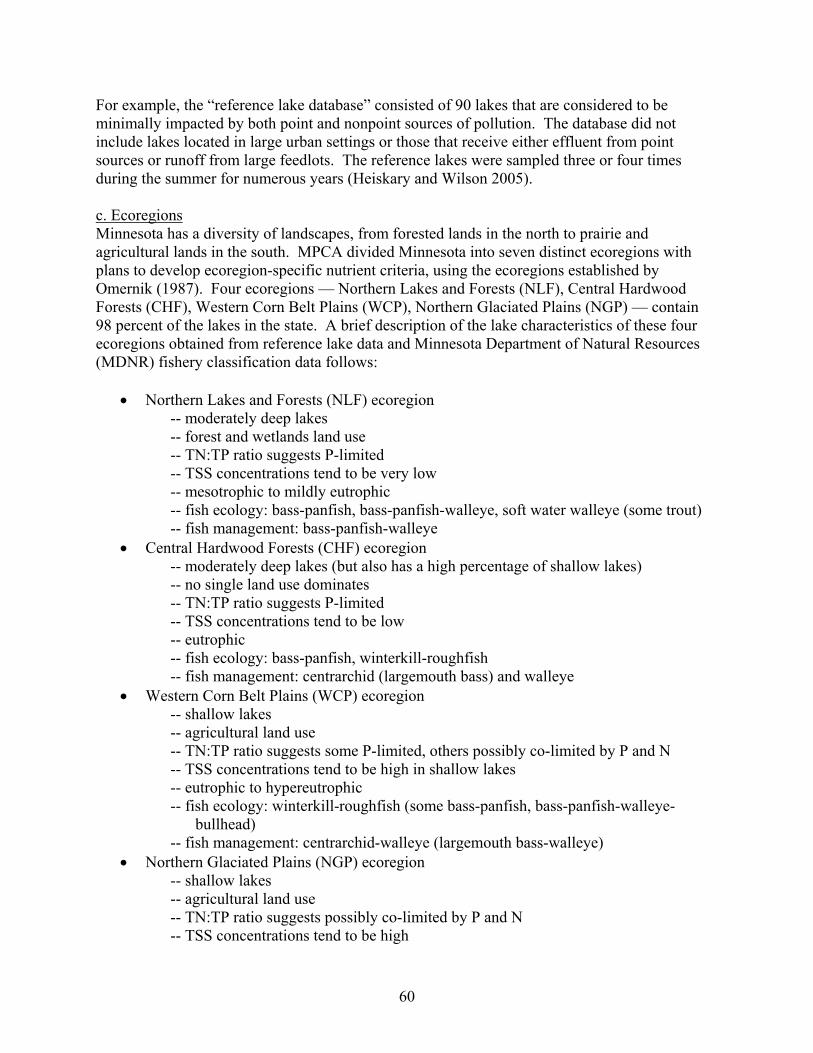
60
For example, the “reference lake database” consisted of 90 lakes that are considered to be minimally impacted by both point and nonpoint sources of pollution. The database did not include lakes located in large urban settings or those that receive either effluent from point sources or runoff from large feedlots. The reference lakes were sampled three or four times during the summer for numerous years (Heiskary and Wilson 2005). c. Ecoregions Minnesota has a diversity of landscapes, from forested lands in the north to prairie and agricultural lands in the south. MPCA divided Minnesota into seven distinct ecoregions with plans to develop ecoregion-specific nutrient criteria, using the ecoregions established by Omernik (1987). Four ecoregions — Northern Lakes and Forests (NLF), Central Hardwood Forests (CHF), Western Corn Belt Plains (WCP), Northern Glaciated Plains (NGP) — contain 98 percent of the lakes in the state. A brief description of the lake characteristics of these four ecoregions obtained from reference lake data and Minnesota Department of Natural Resources (MDNR) fishery classification data follows:
• Northern Lakes and Forests (NLF) ecoregion -- moderately deep lakes -- forest and wetlands land use -- TN:TP ratio suggests P-limited -- TSS concentrations tend to be very low -- mesotrophic to mildly eutrophic -- fish ecology: bass-panfish, bass-panfish-walleye, soft water walleye (some trout) -- fish management: bass-panfish-walleye
• Central Hardwood Forests (CHF) ecoregion -- moderately deep lakes (but also has a high percentage of shallow lakes) -- no single land use dominates -- TN:TP ratio suggests P-limited -- TSS concentrations tend to be low -- eutrophic -- fish ecology: bass-panfish, winterkill-roughfish -- fish management: centrarchid (largemouth bass) and walleye
• Western Corn Belt Plains (WCP) ecoregion -- shallow lakes -- agricultural land use -- TN:TP ratio suggests some P-limited, others possibly co-limited by P and N -- TSS concentrations tend to be high in shallow lakes -- eutrophic to hypereutrophic -- fish ecology: winterkill-roughfish (some bass-panfish, bass-panfish-walleye-
bullhead) -- fish management: centrarchid-walleye (largemouth bass-walleye)
• Northern Glaciated Plains (NGP) ecoregion -- shallow lakes -- agricultural land use -- TN:TP ratio suggests possibly co-limited by P and N -- TSS concentrations tend to be high
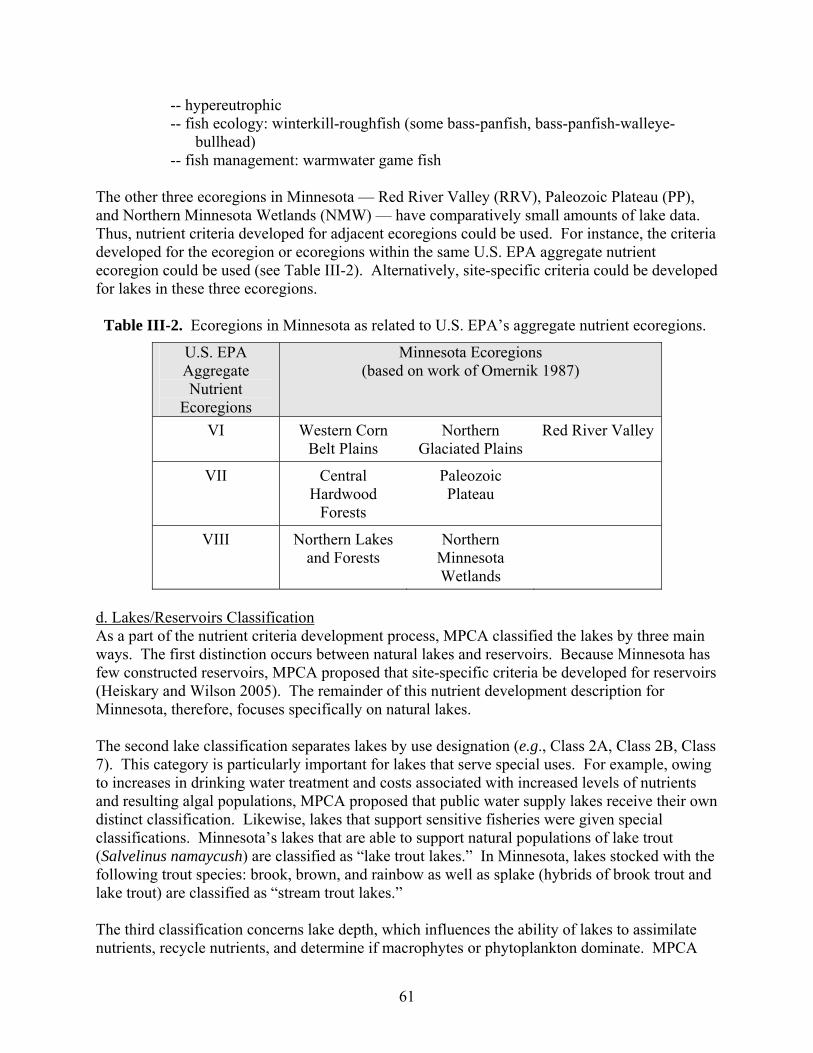
61
-- hypereutrophic -- fish ecology: winterkill-roughfish (some bass-panfish, bass-panfish-walleye-
bullhead) -- fish management: warmwater game fish
The other three ecoregions in Minnesota — Red River Valley (RRV), Paleozoic Plateau (PP), and Northern Minnesota Wetlands (NMW) — have comparatively small amounts of lake data. Thus, nutrient criteria developed for adjacent ecoregions could be used. For instance, the criteria developed for the ecoregion or ecoregions within the same U.S. EPA aggregate nutrient ecoregion could be used (see Table III-2). Alternatively, site-specific criteria could be developed for lakes in these three ecoregions. Table III-2. Ecoregions in Minnesota as related to U.S. EPA’s aggregate nutrient ecoregions.
U.S. EPA Aggregate Nutrient
Ecoregions
Minnesota Ecoregions (based on work of Omernik 1987)
VI Western Corn Belt Plains
Northern Glaciated Plains
Red River Valley
VII Central Hardwood
Forests
Paleozoic Plateau
VIII Northern Lakes and Forests
Northern Minnesota Wetlands
d. Lakes/Reservoirs Classification As a part of the nutrient criteria development process, MPCA classified the lakes by three main ways. The first distinction occurs between natural lakes and reservoirs. Because Minnesota has few constructed reservoirs, MPCA proposed that site-specific criteria be developed for reservoirs (Heiskary and Wilson 2005). The remainder of this nutrient development description for Minnesota, therefore, focuses specifically on natural lakes. The second lake classification separates lakes by use designation (e.g., Class 2A, Class 2B, Class 7). This category is particularly important for lakes that serve special uses. For example, owing to increases in drinking water treatment and costs associated with increased levels of nutrients and resulting algal populations, MPCA proposed that public water supply lakes receive their own distinct classification. Likewise, lakes that support sensitive fisheries were given special classifications. Minnesota’s lakes that are able to support natural populations of lake trout (Salvelinus namaycush) are classified as “lake trout lakes.” In Minnesota, lakes stocked with the following trout species: brook, brown, and rainbow as well as splake (hybrids of brook trout and lake trout) are classified as “stream trout lakes.” The third classification concerns lake depth, which influences the ability of lakes to assimilate nutrients, recycle nutrients, and determine if macrophytes or phytoplankton dominate. MPCA
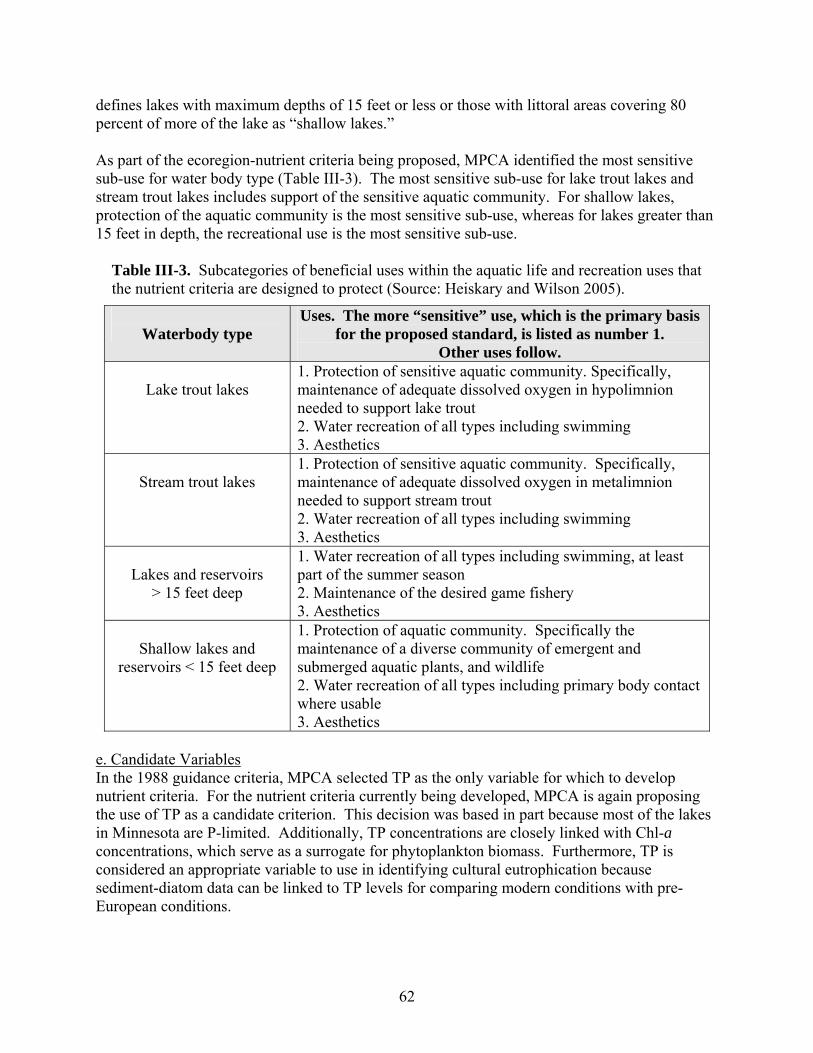
62
defines lakes with maximum depths of 15 feet or less or those with littoral areas covering 80 percent of more of the lake as “shallow lakes.” As part of the ecoregion-nutrient criteria being proposed, MPCA identified the most sensitive sub-use for water body type (Table III-3). The most sensitive sub-use for lake trout lakes and stream trout lakes includes support of the sensitive aquatic community. For shallow lakes, protection of the aquatic community is the most sensitive sub-use, whereas for lakes greater than 15 feet in depth, the recreational use is the most sensitive sub-use.
Table III-3. Subcategories of beneficial uses within the aquatic life and recreation uses that the nutrient criteria are designed to protect (Source: Heiskary and Wilson 2005).
Waterbody type
Uses. The more “sensitive” use, which is the primary basis for the proposed standard, is listed as number 1.
Other uses follow.
Lake trout lakes 1. Protection of sensitive aquatic community. Specifically, maintenance of adequate dissolved oxygen in hypolimnion needed to support lake trout 2. Water recreation of all types including swimming 3. Aesthetics
Stream trout lakes
1. Protection of sensitive aquatic community. Specifically, maintenance of adequate dissolved oxygen in metalimnion needed to support stream trout 2. Water recreation of all types including swimming 3. Aesthetics
Lakes and reservoirs
> 15 feet deep
1. Water recreation of all types including swimming, at least part of the summer season 2. Maintenance of the desired game fishery 3. Aesthetics
Shallow lakes and
reservoirs < 15 feet deep
1. Protection of aquatic community. Specifically the maintenance of a diverse community of emergent and submerged aquatic plants, and wildlife 2. Water recreation of all types including primary body contact where usable 3. Aesthetics
e. Candidate Variables In the 1988 guidance criteria, MPCA selected TP as the only variable for which to develop nutrient criteria. For the nutrient criteria currently being developed, MPCA is again proposing the use of TP as a candidate criterion. This decision was based in part because most of the lakes in Minnesota are P-limited. Additionally, TP concentrations are closely linked with Chl-a concentrations, which serve as a surrogate for phytoplankton biomass. Furthermore, TP is considered an appropriate variable to use in identifying cultural eutrophication because sediment-diatom data can be linked to TP levels for comparing modern conditions with pre-European conditions.
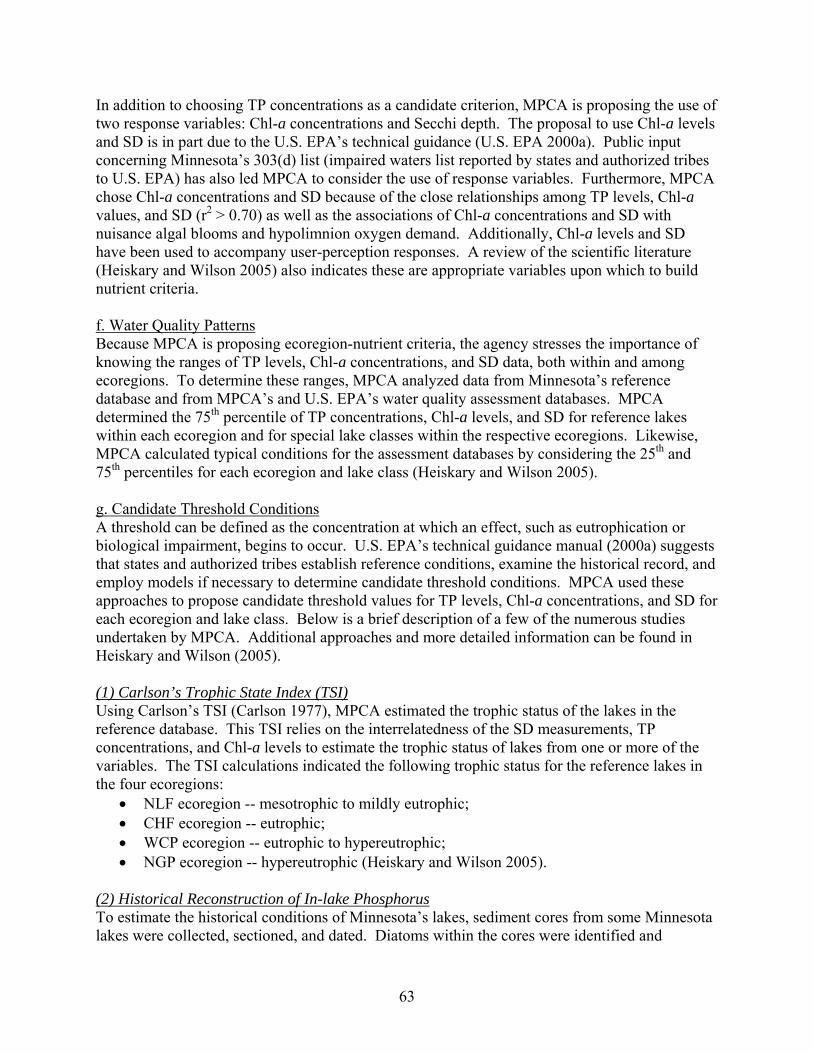
63
In addition to choosing TP concentrations as a candidate criterion, MPCA is proposing the use of two response variables: Chl-a concentrations and Secchi depth. The proposal to use Chl-a levels and SD is in part due to the U.S. EPA’s technical guidance (U.S. EPA 2000a). Public input concerning Minnesota’s 303(d) list (impaired waters list reported by states and authorized tribes to U.S. EPA) has also led MPCA to consider the use of response variables. Furthermore, MPCA chose Chl-a concentrations and SD because of the close relationships among TP levels, Chl-a values, and SD (r2 > 0.70) as well as the associations of Chl-a concentrations and SD with nuisance algal blooms and hypolimnion oxygen demand. Additionally, Chl-a levels and SD have been used to accompany user-perception responses. A review of the scientific literature (Heiskary and Wilson 2005) also indicates these are appropriate variables upon which to build nutrient criteria. f. Water Quality Patterns Because MPCA is proposing ecoregion-nutrient criteria, the agency stresses the importance of knowing the ranges of TP levels, Chl-a concentrations, and SD data, both within and among ecoregions. To determine these ranges, MPCA analyzed data from Minnesota’s reference database and from MPCA’s and U.S. EPA’s water quality assessment databases. MPCA determined the 75th percentile of TP concentrations, Chl-a levels, and SD for reference lakes within each ecoregion and for special lake classes within the respective ecoregions. Likewise, MPCA calculated typical conditions for the assessment databases by considering the 25th and 75th percentiles for each ecoregion and lake class (Heiskary and Wilson 2005). g. Candidate Threshold Conditions A threshold can be defined as the concentration at which an effect, such as eutrophication or biological impairment, begins to occur. U.S. EPA’s technical guidance manual (2000a) suggests that states and authorized tribes establish reference conditions, examine the historical record, and employ models if necessary to determine candidate threshold conditions. MPCA used these approaches to propose candidate threshold values for TP levels, Chl-a concentrations, and SD for each ecoregion and lake class. Below is a brief description of a few of the numerous studies undertaken by MPCA. Additional approaches and more detailed information can be found in Heiskary and Wilson (2005). (1) Carlson’s Trophic State Index (TSI) Using Carlson’s TSI (Carlson 1977), MPCA estimated the trophic status of the lakes in the reference database. This TSI relies on the interrelatedness of the SD measurements, TP concentrations, and Chl-a levels to estimate the trophic status of lakes from one or more of the variables. The TSI calculations indicated the following trophic status for the reference lakes in the four ecoregions:
• NLF ecoregion -- mesotrophic to mildly eutrophic; • CHF ecoregion -- eutrophic; • WCP ecoregion -- eutrophic to hypereutrophic; • NGP ecoregion -- hypereutrophic (Heiskary and Wilson 2005).
(2) Historical Reconstruction of In-lake Phosphorus To estimate the historical conditions of Minnesota’s lakes, sediment cores from some Minnesota lakes were collected, sectioned, and dated. Diatoms within the cores were identified and
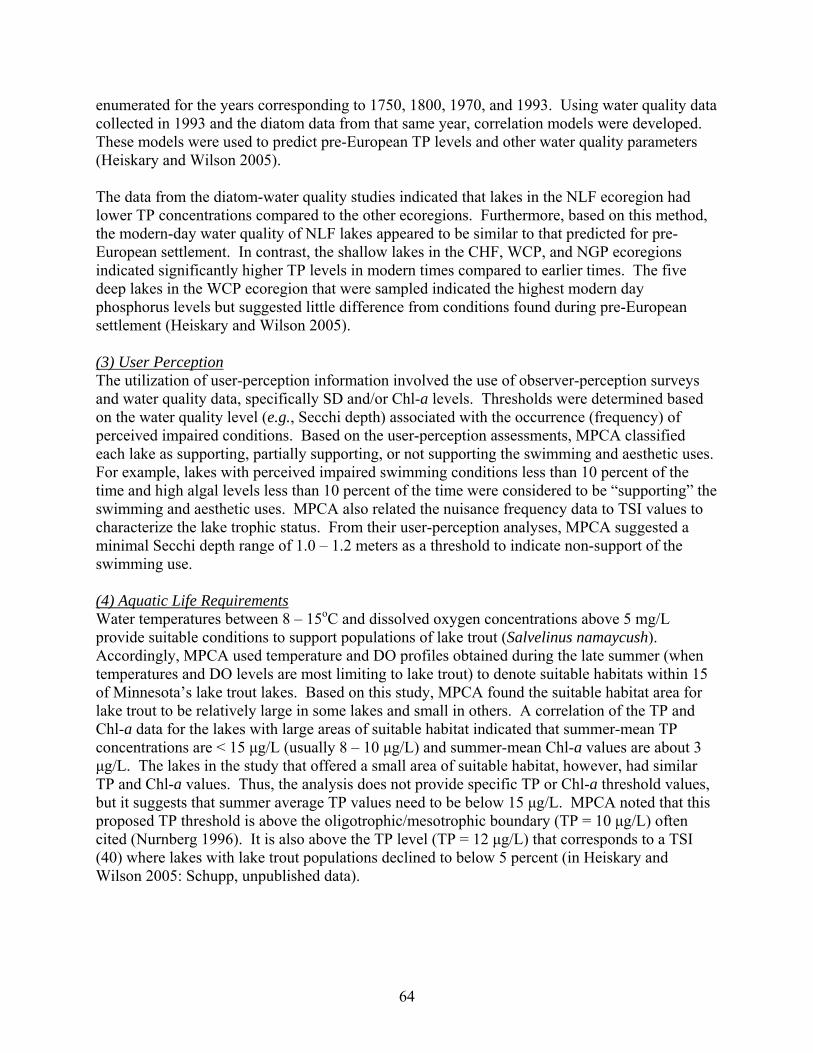
64
enumerated for the years corresponding to 1750, 1800, 1970, and 1993. Using water quality data collected in 1993 and the diatom data from that same year, correlation models were developed. These models were used to predict pre-European TP levels and other water quality parameters (Heiskary and Wilson 2005). The data from the diatom-water quality studies indicated that lakes in the NLF ecoregion had lower TP concentrations compared to the other ecoregions. Furthermore, based on this method, the modern-day water quality of NLF lakes appeared to be similar to that predicted for pre-European settlement. In contrast, the shallow lakes in the CHF, WCP, and NGP ecoregions indicated significantly higher TP levels in modern times compared to earlier times. The five deep lakes in the WCP ecoregion that were sampled indicated the highest modern day phosphorus levels but suggested little difference from conditions found during pre-European settlement (Heiskary and Wilson 2005). (3) User Perception The utilization of user-perception information involved the use of observer-perception surveys and water quality data, specifically SD and/or Chl-a levels. Thresholds were determined based on the water quality level (e.g., Secchi depth) associated with the occurrence (frequency) of perceived impaired conditions. Based on the user-perception assessments, MPCA classified each lake as supporting, partially supporting, or not supporting the swimming and aesthetic uses. For example, lakes with perceived impaired swimming conditions less than 10 percent of the time and high algal levels less than 10 percent of the time were considered to be “supporting” the swimming and aesthetic uses. MPCA also related the nuisance frequency data to TSI values to characterize the lake trophic status. From their user-perception analyses, MPCA suggested a minimal Secchi depth range of 1.0 – 1.2 meters as a threshold to indicate non-support of the swimming use. (4) Aquatic Life Requirements Water temperatures between 8 – 15oC and dissolved oxygen concentrations above 5 mg/L provide suitable conditions to support populations of lake trout (Salvelinus namaycush). Accordingly, MPCA used temperature and DO profiles obtained during the late summer (when temperatures and DO levels are most limiting to lake trout) to denote suitable habitats within 15 of Minnesota’s lake trout lakes. Based on this study, MPCA found the suitable habitat area for lake trout to be relatively large in some lakes and small in others. A correlation of the TP and Chl-a data for the lakes with large areas of suitable habitat indicated that summer-mean TP concentrations are < 15 μg/L (usually 8 – 10 μg/L) and summer-mean Chl-a values are about 3 μg/L. The lakes in the study that offered a small area of suitable habitat, however, had similar TP and Chl-a values. Thus, the analysis does not provide specific TP or Chl-a threshold values, but it suggests that summer average TP values need to be below 15 μg/L. MPCA noted that this proposed TP threshold is above the oligotrophic/mesotrophic boundary (TP = 10 μg/L) often cited (Nurnberg 1996). It is also above the TP level (TP = 12 μg/L) that corresponds to a TSI (40) where lakes with lake trout populations declined to below 5 percent (in Heiskary and Wilson 2005: Schupp, unpublished data).
65
h. Proposed Nutrient Criteria MPCA is proposing that summer threshold values for TP, Chl-a, and SD (based on the average for the growing season) be used as criteria. In order for the eutrophication standard to be exceeded, both the causal variable (TP) and one of the response variables (either Chl-a or Secchi depth) would need to be exceeded. MPCA is also recommending that site-specific criteria be developed for reservoirs, water supply lakes, and other special circumstances. For example, lake-specific criteria could be developed for lakes not meeting the criteria because of natural causes (based on lake-specific monitoring data and other relevant information). An antidegradation rule is also proposed to protect the water quality of lakes that meet the criteria from being degraded to a lower level of quality (MPCA 2007). MPCA’s proposed threshold values for TP, Chl-a, and SD were chosen based on a weight of evidence and information derived from the various analyses described in Heiskary and Wilson (2005). The TP thresholds were established first. Research used in developing TP guidance criteria for Minnesota’s lakes (Heiskary and Wilson 1988) was prominently considered when establishing the currently proposed TP thresholds. The Chl-a and SD thresholds were derived from their relationship with TP and each other, user-perception information, and various regression equations. MPCA considered an abundance of information, including, but not limited to, the following (Heiskary and Wilson 2005):
• 75th percentile of TP data in the reference lake population; • 25th and 50th percentiles of TP data in MPCA’s assessed lake population; • 25th and 50th percentiles of TP data in U.S. EPA’s aggregated ecoregions that contain
Minnesota’s lakes; • 75th percentile of TP data predicted for lakes prior to European settlement; • 75th percentile of Chl-a and SD data in the reference lake population; • 25th and 50th percentiles of Chl-a and SD data in MPCA’s assessed lake population; • 25th and 50th percentiles of Chl-a and SD data in U.S. EPA’s aggregated ecoregions that
contain Minnesota’s lakes; • TP, Chl-a, and SD associations from Carlson’s TSI; • User perceptions compared to SD and Chl-a data; • Most sensitive sub-uses; • For coldwater fisheries: Interrelationships among TP, Chl-a, SD, and hypolimnetic;
oxygen depletion based on the literature and data from assessed lake trout lakes; • For coolwater fisheries: Conditions required to maintain stream trout fisheries,
metalimnion oxygen concentrations; • For warmwater fisheries: Relationship among lake trophic state (expressed as TSI) and
community shifts in species; • For shallow lakes: TP, Chl-a, and SD measurements compared to rooted macrophytes; • Relevant scientific literature.
The proposed thresholds for each ecoregion and lake class are described below and shown in Table III-4: Northern Lakes and Forests (NLF) ecoregion Some lakes in the NLF ecoregion support natural populations of lake trout; others are managed to support stream trout; and some are not able to support trout fisheries. Thus, the
66
most sensitive sub-uses for this ecoregion were identified as coldwater fisheries for lake trout lakes, coolwater fisheries for stream trout lakes, and primary contact for the remaining lakes in the ecoregion. No separate lake class was established for shallow lakes in the NLF ecoregion because the differences among the trophic status (based on TP concentrations) for deep and shallow lakes in this ecoregion were not significant. North Central Hardwood Forest (CHF) ecoregion The CHF ecoregion has no lakes that support natural populations of lake trout and only a few lakes that are managed for stream trout. The most sensitive sub-uses for CHF therefore include support of coolwater fisheries for those lakes that are managed for stream trout fisheries and aquatic recreation (primary contact). A separate class was established in the CHF ecoregion for shallow lakes. MPCA states that its main goal for establishing nutrient criteria for shallow lakes is “to allow for a healthy and diverse population of macrophytes and to minimize the chance for a shift to algal-dominated conditions” (Heiskary and Wilson 2005, p. 118). Western Corn Belt Plains (WCP) and Northern Glaciated Plains (NGP) ecoregions The WCB and NGP ecoregions were considered as one region for the purpose of proposing eutrophication criteria because these two ecoregions share similar characteristics in watershed land use, lake morphometry, water quality, aquatic ecology, and user perception. Neither lake trout lakes nor stream trout lakes are located in these two ecoregions so no special lake class was needed to protect these uses. Therefore, the most sensitive sub-use for the WCB and NGP ecoregions is aquatic recreation. The WCP ecoregion has several deep lakes for which criteria are being proposed; however, most of the lakes in these two ecoregions are shallow. Because the reference lakes for these two ecoregions indicate eutrophic or hypereutrophic conditions, MPCA is proposing a “partial support” of the aquatic recreational use. The goal for meeting this partial support is to reduce the frequency and severity of nuisance algal blooms (Heiskary and Wilson 1989, Heiskary and Wilson 2005). In addition to proposing criteria, MPCA has also described its monitoring strategy for assessment compliance. Monitoring for compliance will occur during the growing season (about June through September). Four to eight monitoring events are to occur during this period for each monitored lake, with the resulting data being averaged over the entire growing season. Standard physical and chemical monitoring data will be collected, including TP concentrations, Chl-a levels, and Secchi depth. Oxygen and temperature profiles will be taken to assess the stratification status and to provide information about the amount of oxygen in the metalimnion and hypolimnion. For natural lakes, samples will be taken at one or more mid-lake sites. Reservoirs sampling will be site specific with most samples likely collected near the dam. Monitoring data obtained by MPCA will be supplemented with SD measurements and user-perception surveys collected by volunteers in the state’s Citizen Lake Monitoring Program. For 303(d) listing purposes, at least 12 paired data points (either: [1] TP and Chl-a or [2] TP and SD) are required (Heiskary and Wilson 2005).
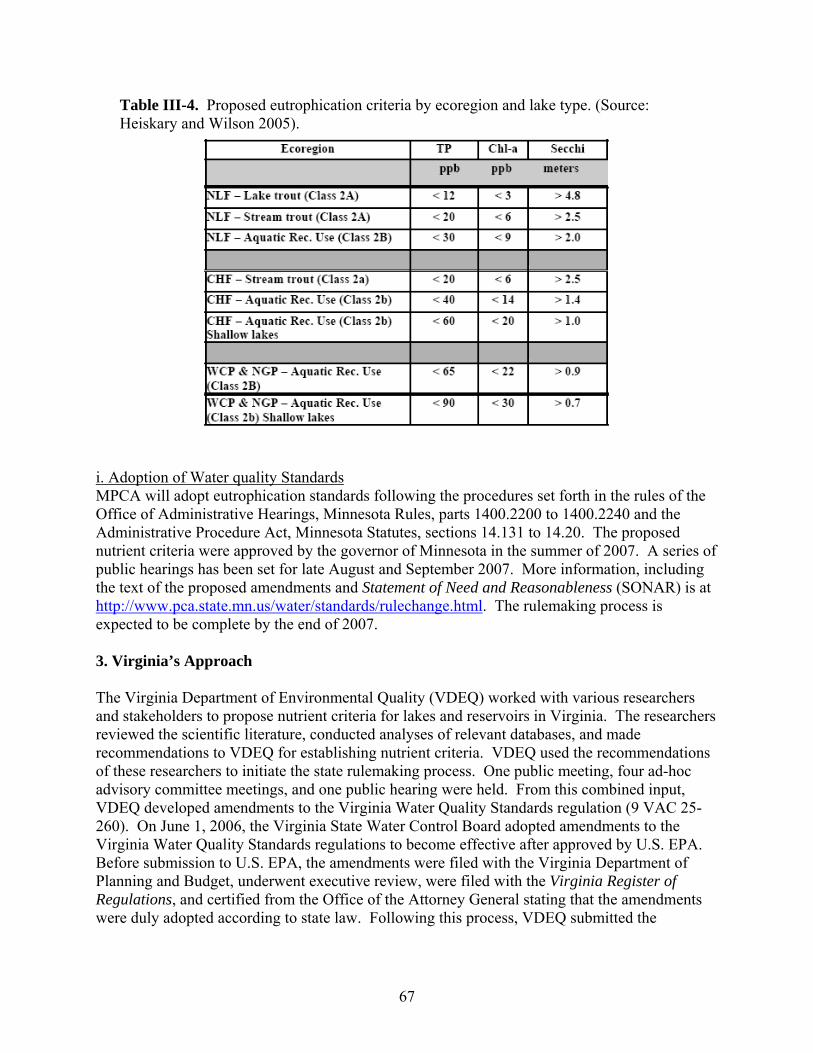
67
Table III-4. Proposed eutrophication criteria by ecoregion and lake type. (Source: Heiskary and Wilson 2005).
i. Adoption of Water quality Standards MPCA will adopt eutrophication standards following the procedures set forth in the rules of the Office of Administrative Hearings, Minnesota Rules, parts 1400.2200 to 1400.2240 and the Administrative Procedure Act, Minnesota Statutes, sections 14.131 to 14.20. The proposed nutrient criteria were approved by the governor of Minnesota in the summer of 2007. A series of public hearings has been set for late August and September 2007. More information, including the text of the proposed amendments and Statement of Need and Reasonableness (SONAR) is at http://www.pca.state.mn.us/water/standards/rulechange.html. The rulemaking process is expected to be complete by the end of 2007. 3. Virginia’s Approach The Virginia Department of Environmental Quality (VDEQ) worked with various researchers and stakeholders to propose nutrient criteria for lakes and reservoirs in Virginia. The researchers reviewed the scientific literature, conducted analyses of relevant databases, and made recommendations to VDEQ for establishing nutrient criteria. VDEQ used the recommendations of these researchers to initiate the state rulemaking process. One public meeting, four ad-hoc advisory committee meetings, and one public hearing were held. From this combined input, VDEQ developed amendments to the Virginia Water Quality Standards regulation (9 VAC 25-260). On June 1, 2006, the Virginia State Water Control Board adopted amendments to the Virginia Water Quality Standards regulations to become effective after approved by U.S. EPA. Before submission to U.S. EPA, the amendments were filed with the Virginia Department of Planning and Budget, underwent executive review, were filed with the Virginia Register of Regulations, and certified from the Office of the Attorney General stating that the amendments were duly adopted according to state law. Following this process, VDEQ submitted the
68
amendments to U.S. EPA on January 3, 2007. Approval from U.S. EPA was granted in July 2007. The proposed criteria are currently under review for public comment (August 2007). The approach used to propose nutrient criteria in Virginia is described below. a. Designated Uses to Protect As part of the criteria development process, VDEQ sought the advice of an interdisciplinary research team known as the Academic Advisory Committee (AAC). The AAC adopted the position that the primary goal underlying the development of nutrient criteria is the support of designated uses of water. This approach meets the intent of the Clean Water Act and U.S. EPA requirements. In Virginia, all state waters have the following designated uses: “recreational uses, e.g., swimming and boating; the propagation and growth of a balanced, indigenous population of aquatic life, including game fish, which might reasonably be expected to inhabit them; wildlife; and the production of edible and marketable natural resources, e.g., fish and shellfish.” (9 VAC 25-260). There are also special criteria (e.g., iron and manganese concentrations) for public water supply reservoirs to maintain acceptable taste, odor, and aesthetic quality at the drinking water intake (9 VAC 25-260). The AAC chose the support of recreational fisheries as the primary use to be protected. The population status of fish species sought by recreational anglers was considered to be an appropriate indicator for supporting both recreational and aquatic life support uses because such fish species are usually the top predators within the system and thus depend on an adequate supply of lower level aquatic organisms to survive. The AAC decided that developing criteria to protect the swimming use would be extremely subjective because the criteria would need to be based on user perception, which tends to depend on the quality of the water to which the user is accustomed (see Section II-E). Furthermore, water supply managers commented that they could manage algal levels higher than those identified to protect recreational fisheries. Therefore, the nutrient criteria proposed by the AAC to protect recreational fisheries is believed to also protect the water supply designate use. b. Lakes/Reservoirs Classification The two natural lakes in Virginia, Mountain Lake in southwest Virginia and Lake Drummond within the Great Dismal Swamp of southeast Virginia, were separated for criteria development from the reservoirs. Lake-specific criteria were developed for the two natural lakes. The AAC classified the reservoirs monitored by VDEQ according to the type of recreational fishery it could support: coldwater, coolwater, or warmwater fisheries. A special “fertilized fishery” classification was given to reservoirs that are fertilized for increased fish production. The coldwater fisheries of Virginia’s public reservoirs include mostly small (<100 acres) systems managed for trout. Some reservoirs, generally large reservoirs (> 500 acres), are managed for a combination of coolwater (e.g., striped bass, walleye) and warmwater (sunfish, largemouth bass, catfish) species (but were classified as coolwater fisheries). Reservoirs managed solely for warmwater fisheries range from large systems (primarily in eastern Virginia) to ponds (and thus not considered in the rulemaking process). The Virginia Department of Game and Inland Fisheries (VDGIF) owns several small reservoirs that are managed (e.g., fertilized) to support sportfishing.
69
Ecoregional criteria were developed for 116 constructed reservoirs. The ecoregions used in this process correlate with the aggregate nutrient ecoregions delineated by U.S. EPA in its nutrient criteria technical guidance (U.S. EPA 2000a). The reservoirs in Virginia belong to U.S. EPA’s aggregate nutrient ecoregions 9, 11, and 14. c. Candidate Variables Phytoplankton are the dominant primary producers in Virginia’s natural lakes and in almost all of the constructed reservoirs. Phytoplankton are also the direct cause of most nutrient-related designated use impairments. Because chlorophyll-a concentrations are an easily monitored proxy for algal biomass, the AAC recommended that concentrations of chlorophyll-a should be the basis for establishing nutrient-related criteria. Furthermore, correlations between chlorophyll-a concentrations and recreational fisheries status have been documented (e.g., Schupp and Wilson 1993; see Section II-D). Chlorophyll concentrations can also indicate taste, odor, and/or toxicity effects that arise from algal blooms in reservoirs used as drinking water sources and reductions in water column transparency that diminish swimming and other recreational uses during algal blooms. Therefore, the recommendation to use chlorophyll-a levels was based on a review of the literature and the collective judgment of the AAC. When algicides are applied to reservoirs to control taste and odor issues associated with certain algae however, chlorophyll-a concentration cannot accurately indicate the status of eutrophication. Therefore, the AAC also recommended that total phosphorus (TP) concentrations be used as candidate nutrient criteria for reservoirs when algicide are used. Studies of natural lakes have shown close associations between TP levels and algal biomass (e.g., Dillon and Rigler 1974; Rast et al. 1983). The AAC did not recommend nitrogen criteria because some nuisance, bloom-forming cyanobacteria are nitrogen fixers. Reductions of nitrogen without reductions in phosphorous could increase the likelihood of stimulating blooms of N-fixing primary producers. Furthermore, Secchi depth was not considered an appropriate candidate criterion for determining nutrient over-enrichment in reservoirs because water transparency is often affected by inorganic turbidity in impoundments (e.g., Jones and Knowlton 1993, Knowlton and Jones 1993). Empiric relationships between fisheries productivity (as measured by fish harvest, production, or biomass) and both primary production and phosphorus concentration have been developed and published for regional and global sets of lakes. Correlations between primary production and fisheries productivity are highly positive, the former explaining (r2) 67 – 84% of the latter (Melack 1976, Oglesby 1977, Liang et al. 1981, Jones and Hoyer 1982, Downing et al. 1990). Correlations between total phosphorus (TP) concentration and fisheries productivity are similarly strong (51 – 84%) (Hanson and Leggett 1982, Jones and Hoyer 1982, Downing et al. 1990, Ney et al. 1990). d. Proposed Nutrient Criteria (1) Natural Lakes For the two natural lakes, Mountain Lake and Lake Drummond, the VDEQ worked directly with the researchers most knowledgeable about these lakes. Using the literature, data from the lakes,
70
and best professional judgment, lake-specific criteria were developed. Proposed nutrient criteria levels for Mountain Lake include: chlorophyll-a < 6 μg/L at a depth of 6 meters and orthophosphate-P < 8 μg/L at a depth of one meter or less. The proposed criteria for Lake Drummond was set at 35 μg/L for chlorophyll-a and 40 μg/L for total phosphorus at a depth of one meter or less (9 VAC 25-260-310). (2) Reservoirs Virginia has 116 constructed reservoirs for which VDEQ proposed nutrient criteria. These reservoirs include those for which VDEQ has previously monitored, currently is monitoring, or will be monitoring in the upcoming assessment cycle. For these constructed water bodies, VDEQ worked with the AAC in developing an approach that is acceptable to stakeholders, the State Water Control Board and U.S. EPA. The AAC reviewed the published literature for sportfish species found in Virginia’s reservoirs (see Section II-D) and used these values as supplementary data. The criteria were proposed using an assessment of the fishery status and water quality information from reservoirs that support the best fisheries in Virginia. (i.) Literature Values4 -- Coldwater Fisheries: The goal for Virginia’s reservoirs that support coldwater fisheries is to provide production levels that promote the growth of trout populations and protects an oxygenated hypolimnion during thermal stratification (protects trout habitat). The literature by Schupp and Wilson (1993), Elliott et al. (1996), and Johnston et al. (1999) indicates that Chl-a levels at or below 6 µg/L and TP levels at or below 10 µg/L would be adequate to sustain trout habitat and promote trout growth. -- Coolwater Fisheries: Virginia’s coolwater sportfish species prefer water temperatures in the range of 19oC – 28oC (Coutant 1985, Hokanson 1990, Kilpatrick 2003) and include striped bass, hybrid striped bass (white bass x striped bass), and walleye. These species tend to be limited to the metalimnion/hypolimnion of the downlake region near the dam in Virginia reservoirs (Ney 1988, Kilpatrick 2003). These species grow poorly under oligotrophic conditions, preferring mesotrophic waters that support a large supply of forage fishes (e.g., gizzard shad, threadfin shad) (Ney 1988, Schupp and Wilson 1993, Anderson 2001, Bremigan and Stein 2001, and Maceina 2001). Based on the reviewed literature, coolwater fisheries can be expected to prosper in systems where Chl-a ≤ 15 μg/L and TP >10 μg/L. -- Warmwater Fisheries: Warmwater sportfish include the sunfish family (Centrarchidae) and catfishes. Because catfish have higher temperature and lower dissolved oxygen (DO) tolerances than centrarchids, the AAC focused on conditions that support sunfishes (bluegill, redear, redbreast, and pumpkinseed), black and white crappie, smallmouth bass, and largemouth bass. Centrarchids are littoral and epilimnetic fishes that do not require an oxygenated hypolimnion as summer habitat. Thus, centrarchid populations tend to be food-limited rather than habitat-limited. Higher levels of nutrients tend to correlate with more biomass of centrarchids. In fact, small lakes that support centrarchid fisheries are often fertilized at least annually. Based on the reviewed literature (Schupp and Wilson 1993, Bachmann et al. 1996, Maceina et al. 1996, Maceina 2001), warmwater fisheries are expected to thrive where Chl-a is 20 – 40 µg/L and TP ≤ 50 µg/L. 4 This section was written by J.J. Ney. Modifications have been made from the original source, Zipper et al. (2005).
71
(ii.) Water quality and Fishery-Status Data As part of VDEQ’s routine lake monitoring, water samples are collected from one meter or less within the lacustrine portion of each sampled reservoir between April 1 and October 31 (one sample per month). Following a procedure that is analogous to U.S. EPA’s approach, the April to October monitoring period was divided into four components for each reservoir. A 90th percentile for Chl-a and a median (50th percentile) value for TP were then calculated for each of the four periods. The median of these respective values was then used to obtain a 90th percentile value for Chl-a and a median concentration for TP for each monitored reservoir. The 90th percentile for Chl-a was chosen based on input from stakeholders and the VDEQ ad-hoc advisory committee. This percentile was used in an attempt to reflect the maximum chlorophyll-a concentrations that occur during conditions favorable to algal growth. The “maximum” chlorophyll-a concentration was considered to be a more appropriate basis for criteria development than the median chlorophyll-a values because the maximum algal biomass levels are most likely to cause extreme DO depletions. Consequently, extreme DO depletions will have the greatest influence on fish populations. For phosphorus levels, the typical reservoir condition was desired. Therefore, a median TP concentration was used. Concurrent with the analysis of the VDEQ monitoring data, the recreational fishery status was assessed for each reservoir. Biologists from the VDGIF rated the recreational fishery status on a scale of 1 (poor) to 5 (excellent): 1 = poor (anglers would be advised to avoid such reservoirs); 2 = fair (anglers would be advised to not expect much in the way of fishing success); 3 = average (the reservoir supports adequate fishery); 4 = good (the reservoir is recommended for fishing); and 5 = excellent (the reservoir is highly recommended for fishing). Graphs were developed for reservoirs within a given ecoregion from which both a fishery status had been obtained and water quality values were known. First, for each reservoir, the 90th percentile Chl-a value (x-axis) was plotted against its respective fishery status (y-axis), and second, the median TP value (x-axis) was graphed in comparison to the fishery status (y-axis). These graphs were then used to select optimum chlorophyll-a and TP values that will sustain good-to-excellent recreational fisheries (fishery status 4 and 5) for each fishery type (e.g., coolwater, warmwater) within the three different aggregate nutrient ecoregions in Virginia (ecoregion 9, 11, and 14). (iii.) Use of Best Professional Judgment The AAC used the scientific literature concerning algal and nutrient influences on fisheries in association with the results of the water quality-fishery status analysis to propose nutrient criteria for reservoirs in Virginia. The final recommended criteria to support viable recreational fisheries are summarized in Table III-5. Within fisheries, individual species respond differently to particular levels of primary production. For example, although black crappie and white crappie are both warmwater fish, black crappie populations thrive at chlorophyll-a levels of ~20 µg/L and TP ~60 µg/L whereas white crappie do best under hypereutrophic conditions (chlorophyll-a ~60 µg/L; TP ~100 µg/L)
72
(Schupp and Wilson 1993). Acknowledging the uncertainties of setting numeric limits to support an entire fishery therefore, VDEQ wrote the proposed regulations so that exceedances of the criteria would initiate a fishery assessment by the Virginia Department of Game and Inland Fisheries. The purpose of the VDGIF assessment is to determine whether or not the recreational fishery for the reservoir in question is being supported. Furthermore, the regulations call for reservoir-specific criteria to be developed if needed. Table III-5. Final candidate criteria to accommodate fishery recreation and protect aquatic life.
Fishery Type
Warm-water
Cool-water
Cold-water (trout)
Managed / Fertilized
Warm-water
Cool-water
Cold-water (trout)
Managed / Fertilized
Eco-region
- - - - - - - - Chl-a (μg/L)a- - - - - - - - -
- - - - - - - - TP (μg/L)b- - - - - - - - -
11 35 25 10 40 20 10 9 35 25 60 40 30 40 14 60 25 40 20
a Chl-a are 90th percentile values representative of the April – October period. b TP are the median values representative of the April – October period.
e. Adoption of Water quality Standards Using the AAC recommendations and the input from stakeholders and the ad-hoc advisory committee, the VDEQ developed amendments to the Virginia Water Quality Standards regulation (9 VAC 25-260) by adding new numerical and narrative criteria to protect the designated uses of lakes and reservoirs from nutrient impacts. In July 2007, the U.S. EPA approved the proposed criteria. The amendments are currently (August 2007) available for public comment, and the rulemaking process is expected to be complete in fall 2007. The proposed nutrient criteria amendments include:
• Numeric chlorophyll-a and phosphorus criteria for Virginia’s two natural lakes and 116 listed reservoirs (phosphorus applies only in reservoirs treated with algicides);
• A procedure for confirmation of use impairments in reservoirs when nutrient criteria are exceeded (based on the status of the fishery);
• A provision for the development of site-specific criteria for reservoirs where the numeric criteria are exceeded but the designated uses of the water body are being attained (waters are considered impaired until the site-specific criteria are adopted and become effective);
• An allowance for site-specific modifications to the criteria if the specified nutrient criteria do not protect downstream waters.
4. Arizona’s Approach The Arizona Department of Environmental Quality (ADEQ) worked with a contractor to develop a “translator” approach to interpret Arizona’s narrative nutrient criteria. Translators are calculations used to better relate a measurable numeric value to a narrative criteria. A trophic index is an example of a statistical translator. It can be used to relate concentrations of nitrogen
73
and phosphorus to direct indicators of eutrophication, such as chlorophyll-a concentrations. The use of translators is supported by U.S. EPA in Nutrient Criteria Technical Guidance Manual: Lakes and Reservoirs (2000a). ADEQ is proposing a “narrative nutrient implementation matrix” to explain (or translate) whether or not its current narrative nutrient criteria are being met. Arizona’s current narrative nutrient criteria states:
A surface water shall be free from pollutants in amounts or combination that…cause the growth of algae or aquatic plants that inhibit or prohibit the habitation, growth, or propagation of other aquatic life or that impair recreational uses…(Arizona Administrative Code R18-11-108(A)(7)).
The contractor developed a matrix of numeric targets for lake and reservoir water quality parameters that are expected to support various designated uses. A weight-of-evidence protocol will be used to interpret the narrative nutrient criteria by systematically comparing monitoring data with the targets. The numeric targets were selected based on a review of the scientific literature, statistical analyses of water quality data from Arizona’s lakes and reservoirs, and a trophic state index developed specifically for Arizona’s lakes and reservoirs (ADEQ 2005). This proposed approach has the advantage of linking water quality targets with the attainment of specific designated uses (Malcolm Pirnie 2005). Below is an overview of the approach. a. Literature Review The contractor first conducted a review of the scientific and lake management literature, specifically focusing on whether or not certain levels of nutrient-related parameters (e.g., Chl-a, TP, etc.) support various designated uses (e.g., recreation, fisheries and aquatic life support, and public water supply). The literature review also included studies that identify numeric values that reflect use impairment. This work is summarized in Table III-6 (Malcolm Pirnie 2005). The literature review included research specific to Arizona’s lakes and reservoirs as well as studies from other states, the federal government, and outside the U.S. For example, Arizona used the fisheries literature review developed by Virginia to link the fishery status to Chl-a levels (see Section II-D and this section, Virginia’s Approach). As another example, recommendations made by the World Health Organization (WHO) were included to protect human health from excessive levels of cyanobacteria. Specifically the WHO recommends cyanobacterial levels ≤ 20,000 cells/mL to protect against irritative or allergenic health effects (Chorus and Bartuam 1999 in Malcolm Pirnie 2005). Furthermore, an analysis of Arizona’s lakes and reservoirs concluded that cyanobacterial levels exceeding 20,000 cells/mL were more likely when Chl-a levels exceeded 10 – 15 μg/L and when TN exceeded 1.5 – 1.7 mg/L (Malcolm Pirnie 2005). b. Designated Uses to Protect ADEQ considered the following designated uses as likely to be impacted by excessive nutrient concentrations: domestic water source (DWS), aquatic life and wildlife (A&W), and recreation. For the narrative criteria translation process, the recreation use included full-body contact (FBC) and partial-body contact (PBC) but did not include fishing. Protection of recreational fisheries was included within the aquatic life and wildlife use and was subdivided into protecting warmwater fisheries and coldwater fisheries (ADEQ 2005).
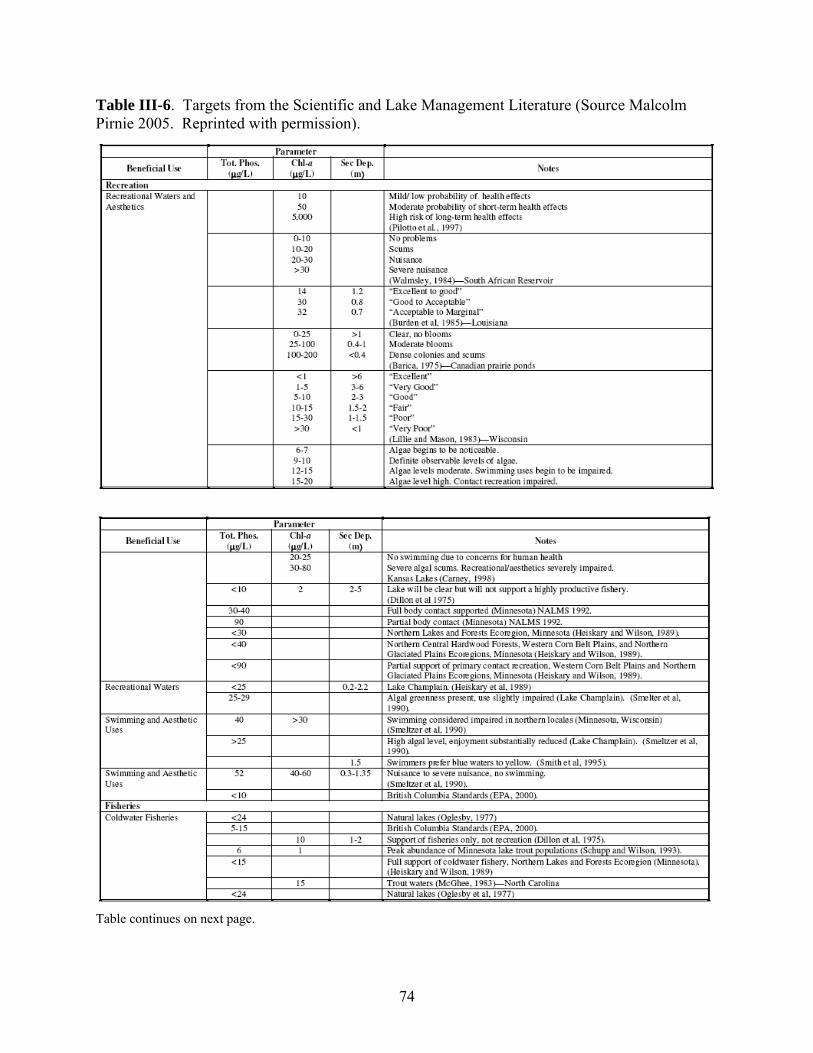
74
Table III-6. Targets from the Scientific and Lake Management Literature (Source Malcolm Pirnie 2005. Reprinted with permission).
Table continues on next page.
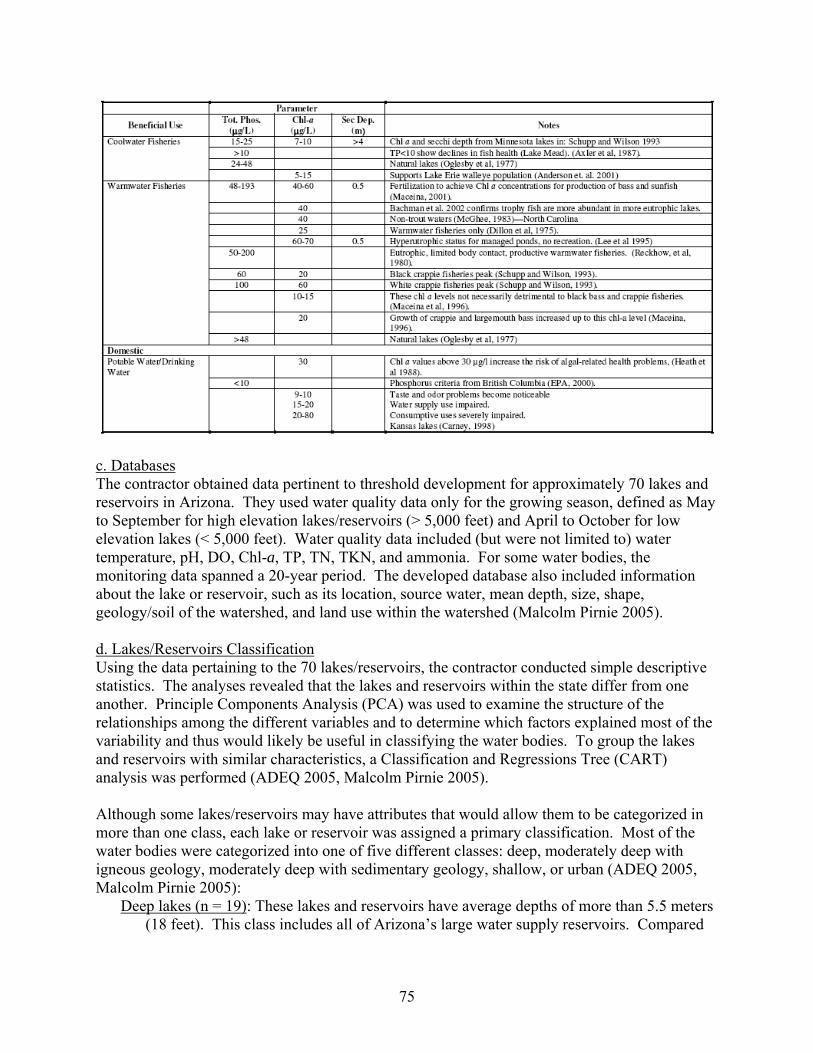
75
c. Databases The contractor obtained data pertinent to threshold development for approximately 70 lakes and reservoirs in Arizona. They used water quality data only for the growing season, defined as May to September for high elevation lakes/reservoirs (> 5,000 feet) and April to October for low elevation lakes (< 5,000 feet). Water quality data included (but were not limited to) water temperature, pH, DO, Chl-a, TP, TN, TKN, and ammonia. For some water bodies, the monitoring data spanned a 20-year period. The developed database also included information about the lake or reservoir, such as its location, source water, mean depth, size, shape, geology/soil of the watershed, and land use within the watershed (Malcolm Pirnie 2005). d. Lakes/Reservoirs Classification Using the data pertaining to the 70 lakes/reservoirs, the contractor conducted simple descriptive statistics. The analyses revealed that the lakes and reservoirs within the state differ from one another. Principle Components Analysis (PCA) was used to examine the structure of the relationships among the different variables and to determine which factors explained most of the variability and thus would likely be useful in classifying the water bodies. To group the lakes and reservoirs with similar characteristics, a Classification and Regressions Tree (CART) analysis was performed (ADEQ 2005, Malcolm Pirnie 2005). Although some lakes/reservoirs may have attributes that would allow them to be categorized in more than one class, each lake or reservoir was assigned a primary classification. Most of the water bodies were categorized into one of five different classes: deep, moderately deep with igneous geology, moderately deep with sedimentary geology, shallow, or urban (ADEQ 2005, Malcolm Pirnie 2005):
Deep lakes (n = 19): These lakes and reservoirs have average depths of more than 5.5 meters (18 feet). This class includes all of Arizona’s large water supply reservoirs. Compared
76
to most lakes and reservoirs in Arizona, this class tends to have low nutrient concentrations and low chlorophyll-a values.
Moderately-deep lakes with igneous geology (n = 23): Lakes and reservoirs of this class have average depths between 3 to 5.5 meters and are located in watersheds dominated by igneous rock. These lakes and reservoirs are managed primarily for fishing and recreation. Compared to moderately deep lakes and reservoirs in watersheds dominated by sedimentary rock, these waters are more turbid so have shallower Secchi depth readings.
Moderately-deep lakes with sedimentary geology (n = 8): Lakes and reservoirs of this class have average depths of 3 to 5.5 meters and are situated in watersheds dominated by sedimentary rock. This class is primarily managed for fishing and recreation.
Shallow lakes (n = 12): These lakes and reservoirs have average depths of less than 3 meters and a maximum depth of less than 4 meters. Because the lakes and reservoirs of this class may be dominated by macrophytes (instead of phytoplankton), they tend to have higher Secchi depth readings and low to moderate levels of Chl-a compared to many other lakes and reservoirs in Arizona.
Urban lakes (n = 7): These are specialty lakes in that they meet the definition of shallow lakes but are located within an urban setting. These lakes and reservoirs tend to have relatively high nutrient concentrations, particularly those that receive reclaimed water. These waters are not generally used for either water supply or full-body contact, but some are used for partial-body contact. Also, the aquatic life and wildlife use for the urban class is limited to protecting “put and take fisheries.”
Four lakes and reservoirs in the study did not fall into any of the above categories so were classified as “other” (Malcolm Pirnie 2005). The “other” classification would cover, for example, the few ephemeral natural lakes with an average depth of less than one meter and the lakes/reservoirs that are effluent dependent. Arizona may need to develop site-specific narrative nutrient criteria for both of these groups (ADEQ 2005). e. Candidate Variables Because most nutrient-related use restrictions result from blooms of algae or extensive growths of aquatic plants, the contractor recommended response variables as the primary candidate variables. Selection of these variables was based on the assumption that excess growth of algae or aquatic plants indicates excessive amounts of available nutrients in the water. Nutrient concentrations from the analysis of grab samples were not considered the best candidate variables because factors other than nutrients (such as hydraulic residence time, light availability, grazers, etc.) affect primary production (Malcolm Pirnie 2005). Thus, ADEQ chose chlorophyll-a concentrations for phytoplankton dominated waters and percent plant cover for macrophyte dominated waters as the primary candidate variables (ADEQ 2005). Secchi depth, another response variable, was also recommended for assessing the attainment of the designated uses. For Arizona’s lakes and reservoirs, Secchi depth was found to be correlated with Chl-a (r2 = 0.34). Likewise, nutrient concentrations were included as secondary candidate variables because data from Arizona’s lakes and reservoirs revealed significant correlations with Chl-a and TP (r2 = 0.25), TN (r2 = 0.25), and TKN (r2 = 0.52) (Malcolm Pirnie 2005).
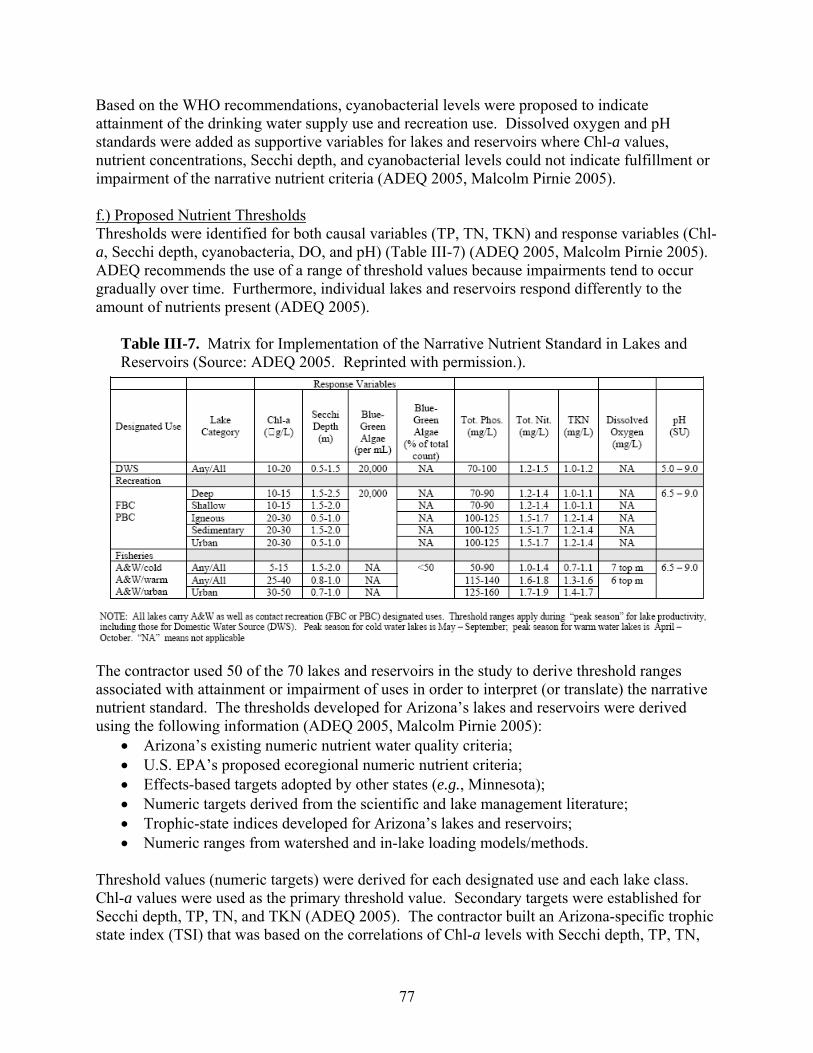
77
Based on the WHO recommendations, cyanobacterial levels were proposed to indicate attainment of the drinking water supply use and recreation use. Dissolved oxygen and pH standards were added as supportive variables for lakes and reservoirs where Chl-a values, nutrient concentrations, Secchi depth, and cyanobacterial levels could not indicate fulfillment or impairment of the narrative nutrient criteria (ADEQ 2005, Malcolm Pirnie 2005). f.) Proposed Nutrient Thresholds Thresholds were identified for both causal variables (TP, TN, TKN) and response variables (Chl-a, Secchi depth, cyanobacteria, DO, and pH) (Table III-7) (ADEQ 2005, Malcolm Pirnie 2005). ADEQ recommends the use of a range of threshold values because impairments tend to occur gradually over time. Furthermore, individual lakes and reservoirs respond differently to the amount of nutrients present (ADEQ 2005).
Table III-7. Matrix for Implementation of the Narrative Nutrient Standard in Lakes and Reservoirs (Source: ADEQ 2005. Reprinted with permission.).
The contractor used 50 of the 70 lakes and reservoirs in the study to derive threshold ranges associated with attainment or impairment of uses in order to interpret (or translate) the narrative nutrient standard. The thresholds developed for Arizona’s lakes and reservoirs were derived using the following information (ADEQ 2005, Malcolm Pirnie 2005):
• Arizona’s existing numeric nutrient water quality criteria; • U.S. EPA’s proposed ecoregional numeric nutrient criteria; • Effects-based targets adopted by other states (e.g., Minnesota); • Numeric targets derived from the scientific and lake management literature; • Trophic-state indices developed for Arizona’s lakes and reservoirs; • Numeric ranges from watershed and in-lake loading models/methods.
Threshold values (numeric targets) were derived for each designated use and each lake class. Chl-a values were used as the primary threshold value. Secondary targets were established for Secchi depth, TP, TN, and TKN (ADEQ 2005). The contractor built an Arizona-specific trophic state index (TSI) that was based on the correlations of Chl-a levels with Secchi depth, TP, TN,
78
and TKN concentrations. Using this TSI, targets were set for Secchi depth and nutrients that would be expected to maintain specific levels of Chl-a in Arizona’s lakes and reservoirs (Malcolm Pirnie 2005). (1) Water Supply Use To protect the water supply use, the contractor proposed Chl-a threshold values that are primarily based on information from the scientific and lake-management literature. Studies reported in the literature suggest that taste and odor problems can become noticeable at Chl-a levels as low as 10 μg/L, and that water supply uses can be impaired at 20 – 30 μg/L for Chl-a (in Malcolm Pirnie 2005: Heath et al. 1988, Carney 1998, U.S. EPA 2000a). (2) Recreational Use To protect the recreational use, the contractor suggested threshold values based on findings in the literature and the water quality characteristics of Arizona’s different lake classes (deep, shallow, igneous, sedimentary, and urban). Although user-perception surveys were not incorporated in the target-setting process, the contractor suggests that users would object to noticeable degradation of water quality. Thus, the contractor proposed Chl-a targets that would meet the state’s antidegradation policy. Based on monitoring data from Arizona’s lakes and reservoirs, deep and shallow lakes/reservoirs were given lower targets for Chl-a than were moderately deep water bodies with igneous geology or sedimentary geology, and urban lakes/reservoirs. Secondly, because the recreational use includes full-body and partial-body contact, the contractor also proposed a cyanobacterial level that is expected to protect against allergenic health effects (Malcolm Pirnie 2005). (3) Fisheries Use The contractor relied on the scientific and lake/reservoir management literature to select possible Chl-a targets to protect the fisheries use. For example, the literature suggests that Chl-a values of 15 μg/L would likely impair coldwater fisheries (McGhee 1983 in Malcolm Pirnie 2005). Because the literature shows that warmwater fisheries can thrive at higher Chl-a levels, these waters were given higher targets, 25 – 40 μg/L. Likewise, because urban lakes and reservoirs need only to protect “put and take fisheries,” the Chl-a targets for these waters, 30 – 50 μg/L, were even higher. Target ranges for Secchi depth were calculated from the Arizona TSI. The contractor also proposed a cyanobacterial count of less than 50 percent of the total algal count to prevent cyanobacterial dominance and a dissolved oxygen concentration for the top meter of water (Malcolm Pirnie 2005). ADEQ (2005) intends to use the threshold values assigned by the contractor and a weight-of-evidence process to assess excessive algal or aquatic plant growth. For phytoplankton dominated lakes and reservoirs, chlorophyll-a concentrations are given the highest weight because they indicate the relative algal biomass. Cyanobacteria levels have the second highest weight because they can be linked to human health concerns. Secchi depth thresholds receive a lower weighting because Secchi depth values may be influenced by sediment and water color and thus must be evaluated along with suspended sediment data. For macrophyte dominated lakes and reservoirs, areal coverage of submerged aquatic vegetation is given the highest weight, and dissolved oxygen fluctuations in the photic zone are used as supplemental information (ADEQ 2005).
79
To determine use attainment, water samples collected during the growing season (warmwater: April – October; coldwater: May – September) are to be analyzed. As currently proposed, use attainment will be granted when the seasonal means fall below the lower threshold value (upper threshold for Secchi depth). Impairment will be assigned when there are at least two exceedances within a two-year to five-year assessment period (ADEQ 2005). The recommended approaches for determining exceedances rely on the developed matrix (Table III-7) and the following (ADEQ 2005):
For phytoplankton dominated lakes and reservoirs: • Mean Chl-a value exceeds upper threshold range • Mean Chl-a value is within the threshold range, and the mean cyanobacterial level
(count/mL or % of total count) is at or above the assigned threshold level • Mean Chl-a value is within the threshold and additional evidence indicates nutrient-
related impairments (e.g., other parameters exceeded: TP, TN, TKN, Secchi depth, DO, and/or pH; additionally, fish kills associated with nutrient-related causes such as low DO levels or high ammonia concentrations)
For macrophytic dominated lakes and reservoirs (mean depth ≤ 4 m): • Submerged aquatic vegetation exceeds 50% of the areal extent of the lake bottom and
there is greater than 5 mg/L range in DO measurements taken from the photic zone in a 24-hour period.
Lakes and reservoirs where neither attainment nor impairment can be determined from the process above will undergo additional study to determine its listing status. Additional information — such as records of algal blooms, fish kills, poor fishery status, as well as taste and odor problems — will be used (ADEQ 2005). g. Adoption of water quality standards The proposed approach to determine compliance with the narrative nutrient criteria is currently (June 2007) in draft form. Arizona expects to finalize this implementation protocol by fall 2007 and begin using the standards in fall or winter 2007. 5. An Alternative Approach An alternative method to developing nutrient criteria is being investigated as a dissertation project by Melissa Kenney at Duke University. In a paper published in the proceedings from the National Water Research Institute’s First Annual Graduate Fellowship Research Conference, Kenney (2007) takes issue with the two most common approaches — use of ecoregion reference lakes and use of expert panels that rely on best professional judgment — for not statistically linking nutrient criteria to the designated use and for not separating scientific information from judgment decisions. Kenney (2007) proposes an alternative approach that (1) uses a statistical model to predict which nutrient-related parameters most likely indicate attainment of the designated use, and (2) predicts the criteria level that would maximize environmental protection while minimizing costs. This approach is currently (2007) being applied to lakes and reservoirs in North Carolina. The first part of the proposed alternative method uses structural equation modeling (SEM) to identify the eutrophication-related variable(s) that are most predictive of designated use
80
attainment (Reckhow et al. 2005, Kenney 2007). Thus, SEM is used to determine which parameters to incorporate into the nutrient criteria development process. SEM uses both water quality data and expert elicitation data. The water quality data is used to describe the eutrophication processes. To link eutrophication to designated use attainment, expert elicitation was used to quantify designated use attainment. Expert elicitation is a method used to systematically obtain subjective judgments from experts. First, the modelers identify the designated uses that could potentially be impacted by nutrients, and then they interview knowledgeable state officials and/or university scientists familiar with the water body or water bodies about eutrophication and designated use attainment. The responses to the interviews are quantified on a categorical scale. Through SEM, the resulting elicitation-categorical data are linked to available water quality data to determine which parameters are most predictive of attainment of the designated use (Reckhow et al. 2005, Kenney 2007). The second component of this alternative approach is referred to as nutrient criteria utility analysis. This analysis provides concrete recommendations to decision makers, based on their value judgments, to set a criterion level. The purpose is to help decision makers choose a criterion level that will find the optimal tradeoff level between maximizing environmental protection and minimizing costs. This analysis relies on the tradeoff decisions of multiple decision makers for meeting various environmental and societal objectives. In this application, utility analysis uses a modeling method called multiattribute utility analysis to determine the criterion level that maximizes the utility for one or a group of decision makers (Kenney 2007). For the study of 132 North Carolina lakes and reservoirs, water quality data and expert elicitation data were obtained, and SEM was used to link the water quality data to eutrophication and designed uses. Separate models were developed to test two distinct designated uses (primary and secondary contact recreation). Models were also created to analyze ecoregion-specific data and pooled data from across the state. In total, more than 350 models were developed to evaluate the variables most predictive of the assigned designated uses. Two models consistently gave acceptable results. One of these models indicates that total phosphorus (TP) is the best predictor of use attainment whereas the other model shows that total inorganic nitrogen (TIN) is the best parameter on which to base nutrient criteria. The researchers recommend using TP as the variable to assess use support for the lakes and reservoirs in North Carolina. They base this decision on the results of the modeling, the judgment of the experts that the lakes and reservoirs of North Carolina are phosphorus limited, and the fact that TP data are available for most monitored lakes and reservoirs in North Carolina. The nutrient criteria utility analysis component of the study is currently underway. Depending on the outcome of this research, this method may provide an alternative approach for states and tribes to use in developing nutrient criteria (Kenney 2007).
81
REFERENCES Adams, S.M. and C.T. Hackney. 1992. Ecological processes in Southeastern United States aquatic ecosystems. Pages 3–17 in C.T. Hackney, S.M. Adams, and W.H. Martin (editors). Biodiversity of the Southeastern United States. John Wiley & Sons, Inc., New York, NY. Adams, S.M., B.L. Kimmel, and G.R. Ploskey. 1983. Sources of organic matter for reservoir fish production: a trophic-dynamic analysis. Canadian Journal of Fisheries and Aquatic Sciences 40: 1480–1495. Alam, M.K. and D.P. Glecker. 1994. Predicting sportfish abundance along lake trophic gradients. Proceedings of the Annual Conference of the Southeastern Association of Fish and Wildlife Agencies 48:555–563. Anderson, R.M., B.F. Hobbs, J.F. Koonce, and A.B. Locci. 2001. Using decision analysis to choose phosphorus targets for Lake Erie. Environmental Management 27(2): 235–252. APHA (American Public Health Association). 1998. Standard Methods for the Examination of Water and Wastewater. Twentieth Edition. 1325 pp. Arizona Department of Environmental Quality (ADEQ). 2005. Narrative Nutrient Standard for Lakes and Reservoirs Implementation Procedures. Arizona Department of Environmental Quality Water Quality Division. October 2005. http://www.azdeq.gov/environ/water/standards/download/nutdoc.pdf (accessed June 8, 2007). Axler, R, P. Vaux, and L. Paulson. 1989. Bottom-up improvement of a bottomed out fishery: the Lake Mead fertilization project. 32nd Conference on Great Lakes Research. p. 24. Bachmann, R.W., C.A. Horsburgh, M.V. Hoyer, L.K. Matzraza, and D.E. Canfield, Jr. 2002. Relations between trophic state indicators and plant biomass in Florida lakes. Hydrobiologia 470: 219–234. Bachmann, R.W., B.L. Jones, D.D. Fox, M. Hoyer, L.A. Bull, and D.E. Canfield, Jr. 1996. Relations between trophic state indicators and fish in Florida (USA) lakes. Canadian Journal of Fisheries and Aquatic Sciences 53: 842–855. Baker, L.A. 1996. Lakes and Reservoirs. Pages 9.1–9.59 in L.W. Mays (editor). Water Resources Handbook. McGraw-Hill, New York, NY. Barica, J. 1975. Summerkill risk in prairie ponds and possibilities of its prediction. Journal Fisheries Research Board of Canada 32: 1283–1288. Barica, J. 1990. Seasonal variability of N:P ratios in eutrophic lakes. Hydrobiologia 191: 97–103.
82
Baxter, R.M. 1977. Environmental effects of dams and impoundments. Annual Review of Ecology and Systematics 8: 255–283. Bennett, G.W. 1962. Management of Artificial Lakes and Ponds. Reinhold Publishing, New York, NY. 283 pp. Beutel, M.W. and A.J. Horne. 1999. A review of the effects of hypolimnetic oxygenation on lake and reservoir water quality. Lake and Reservoir Management. 4: 285–297. Blomqvist, P., A. Pettersson, and P. Hyenstrand. 1994. Ammonium-nitrogen: A key regulatory factor causing dominance of non-nitrogen-fixing cyanobacteria in aquatic systems. Archiv für Hydrobiologie 132: 141–164. Bowling, L.C. and P.D. Baker. 1996. Major cyanobacterial bloom in the Barwon-Darling River, Australia, in 1991, and underlying limnological conditions. Marine and Freshwater Research 47: 643–657. Brashares, E. 1985. Estimating the Instream Value of Lake Water Quality in Southeast Michigan. Ph.D. Dissertation, University of Michigan. Bremigan, M.T. and R.A. Stein. 2001. Variable gizzard shad recruitment with reservoir productivity: causes and implications for classifying systems. Ecological Applications 11: 1425–1437. Brezonik, P.L. 1984. Trophic state indices: rationale for multivariate approaches. Pages 441–445 in Lake and Reservoir Management. EPA 440/5/84-001. U.S. Environmental Protection Agency, Washington, DC. Brönmark, C. and L.A. Hansson. 2005. The Biology of Lakes and Ponds. Second Edition. Oxford University Press Inc., New York, NY. 285 pp. Brook, A.J. and J. Rzoska. 1954. The influence of the Gebel Aulia Dam on the development of Nile plankton. The Journal of Animal Ecology 23:101–115. Brown, H.W. 1974. Handbook of the Effects of Temperature on Some North American Fishes. American Electric Power Service Corporation, Canton, OH. 383 pp. Brown, C.D., M.V. Hoyer, R.W. Bachmann, and D.E. Canfield, Jr. 2000. Nutrient-chlorophyll relationships: an evaluation of empiric nutrient-chlorophyll models using Florida and north-temperate lakes. Canadian Journal of Fisheries and Aquatic Sciences 57(8): 1574–1583. Brylinsky, M. 1980. Estimating the productivity of lakes and reservoirs. Pages 411–453 in E.D. Le Cren and R.H. Lowe-McConnell (editors). The Functioning of Freshwater Ecosystems. Cambridge University Press, London, England.
83
Burden, D.G., R.F. Malone, and J. Geaghen. 1985. Development of a condition index for Louisiana lakes. Pages 68–73 in Lake Reservoir Manage.— Practical Applic. Proc 4th Annu. Conf. Int. Symp. NALMS, McAfee, NJ, 16–19 Oct. 1984. Canfield, D.E. 1983. Prediction of chlorophyll a concentrations Florida lakes: The importance of phosphorus and nitrogen. Water Resources Bulletin 19: 255–262. Canfield, D. and R. Bachmann. 1981. Prediction of total phosphorus concentrations, chlorophyll a, and Secchi depths in natural and artificial lakes. Canadian Journal of Fisheries and Aquatic Sciences 38: 414–423. Carlson, R.E. 1977. A trophic state index for lakes. Limnology and Oceanography 22: 361–369. Carlson, R.E. and J. Simpson. 1996. A Coordinator’s Guide to Volunteer Lake Monitoring Methods. North American Lake Management Society. 96 pp. Carney, C.E. 1998. A Primer on Lake Eutrophication and Related Pollution Problems. Kansas Department of Health and Environment, Bureau of Environmental Field Services. 30 pp. CDC (Centers for Disease Control). 2004. About Cyanobacteria. http://www.cdc.gov/hab/cyanobacteria/about.htm or http://www.cdc.gov/hab/cyanobacteria/pdfs/about.pdf (accessed July 2, 2007). Chorus, I. and J. Bartram. 1999. Toxic Cyanobacteria in Water. World Health Organization, London, U.K. 416 pp. Cole, G.A. 1994. Textbook of Limnology. Fourth Edition. Waveland Press, Inc., Prospect Heights, IL. 412 pp. Cole, T.M. and H.H. Hannan. 1990. Dissolved oxygen dynamics. Pages 71–107in K.W. Thornton, B.L. Kimmel, and F.E. Payne (editors). Reservoir Limnology: Ecological Perspectives. John Wiley & Sons, Inc., New York, NY. Cooke, G.D. and R.E. Carlson. 1989. Reservoir Management for Water Quality and THM Precursor Control. Awwa Research Foundation and American Water Works Association, Denver, CO. 387 pp. Cooke, G.D., E.B. Welch, S.A. Peterson, and P.R. Newroth. 1993. Restoration and Management of Lakes and Reservoirs. Second Edition. Lewis Publishers, Ann Arbor, MI. Correll, D.L. 1998. The role of phosphorous in the eutrophication of receiving waters: a review. Journal of Environmental Quality 27: 261–266. Coutant, C.C. 1963. Stream plankton above and below Green Lane Reservoir. Proceedings of the Pennsylvania Academy of Sciences 37: 122–126.
84
Coutant, C.C. 1985. Striped bass, temperature, and dissolved oxygen: a speculative assessment for environmental risk. Transactions of the American Fisheries Society 114: 31–61. Cowell, B.C. 1970. The influence of plankton discharges from an upstream reservoir on standing crops in a Missouri River reservoir. Limnology and Oceanography 15: 427–441. Crisman, T.L. 1992 Natural lakes of the southeastern United states: Origin, structure, and function. Pages 475–538 in C.T. Hackney, S.M. Adams, and W.H. Marin (editors). Biodiversity of the Southeastern United States: Aquatic Communities. John Wiley & Sons, Inc., New York, NY. Dickman, M. 1969. Some effects of lake renewal on phytoplankton productivity and species composition. Limnology and Oceanography 14: 660–666. Dillon, P.J. and F.H. Rigler. 1974. The phosphorus-chlorophyll relationship in lakes. Limnology and Oceanography 19: 767–773. Dillon, P.J. and F.H. Rigler. 1975. A simple method for predicting the capacity of a lake for development based on lake tropic status. Journal Fisheries Research Board of Canada 32: 1519–1531. Dodds, W.K., K.R. Johnson, and J.C. Priscu. 1989. Simultaneous nitrogen and phosphorous deficiency in natural phytoplankton assemblages: theory, empirical evidence, and implications for lake management. Lake and Reservoir Management 5: 21–26. Dokulil, M.T. and K. Teubner. 2000. Cyanobacterial dominance in lakes. Hydrobiologia 438: 1–12. Downing, J.A., C. Plante, and S. Lalonde. 1990. Fish production correlated with primary productivity, not the morphoedaphic index. Canadian Journal of Fisheries and Aquatic Sciences 47: 1929–1936. Downing, J.A., S.B. Watson, and E. McCauley. 2001. Predicting cyanobacteria dominance in lakes. Canadian Journal of Fisheries and Aquatic Sciences 58: 1905–1908. Duffy, P.D., J.D. Schreiber, D.C. McClurkin, and L.L. McDowell. 1978. Aqueous and sediment phase phosphorus yields from five southern pine watershed. Journal of Environmental Quality 7: 45–50. Ekman-Ekebom, M. M. Kauppi, K Sivonen, M. Niemi and L. Lepistö. 1992. Toxic cyanobacteria in some Finnish lakes. Environmental Toxicology and Water Quality 7: 201–213. Elliott, J.M., J.M. Fletcher, J.A. Elliott, P.R. Cubby, and E. Baroudy. 1996. Changes in the population density of pelagic salmonids in relation to changes in lake enrichment of Lake Widemere (northwest England). Ecology of Freshwater Fish: 5:153–162.
85
Elser, J.J., E. R. Marzolf, and C.R. Goldman. 1990. Phosphorus and nitrogen limitation of phytoplankton growth in the freshwaters of North America: A review and critique of experimental enrichments. Canadian Journal of Fisheries and Aquatic Sciences 47: 1468–1477. Fast, A.W. and M.W. Lorenzen. 1976. Synoptic survey hypolimnetic aeration. American Society of Civil Engineers, Sanitary Engineering Division 102: 1161–1173. Flett, R.J., D. Schindler, and R. Hamilton, 1980 . Nitrogen fixation in Canadian Precambrian Shield lakes. Canadian Journal of Fisheries and Aquatic Sciences 37: 494–505. Ford, DE. 1990. Reservoir transport processes. Pages 15–41 in K.W. Thornton, B.L. Kimmel, F.E. Payne (editors). Reservoir Limnology: Ecological Perspectives. John Wiley & Sons, Inc., New York, NY: Frans, L.M., A.J. Paulson, R.L. Huffman, and S.N. Osbourne. 2006. Surface-Water Quality in Rivers and Drainage Basins Discharging to the Southern Part of Hood Canal, Mason and Kitsap Counties, Washington, 2004. U.S. Geological Survey Scientific Investigations Report 2006-5073. http://pubs.usgs.gov/sir/2006/5073/ (accessed February 5, 2007). Frick, E.A., G.R. Buell, and E.E. Hopkins. 1996. Nutrient Sources and Analysis of Nutrient Water-Quality Data, Apalachicola-Chattahoochee-Flint River Basin, Georgia, Alabama, and Florida, 1972-90. U.S. Geological Survey Water-Resources Investigations Report 96-4101. 120 pp. http://pubs.usgs.gov/wri/wri96-4101/ (accessed February 5, 2007). Gächter, R. and B. Muller. 2003. Why the phosphorus retention of lakes does not necessarily depend on the oxygen supply to their sediment surface. Limnology and Oceanography 48(2): 929–933. Garrison, P.J. and D.R. Knauer. Long-term evaluation of three alum-treated lakes. Pages 513–518 in Lake and Reservoir Management, Proceedings of the Third Annual Conference of the North American Lake Management Society. EPA 440/5/84-001. U.S. Environmental Protection Agency, Washington, DC. Gibbs, J.P., J. Halstead, K.J. Boyle, and J.-C. Huang. 2002. An hedonic analysis of the effects of lake water clarity on New Hampshire lakefront properties. Agricultural and Resource Economics Review 21(1): 39–46. Gloss, S.P., L.M. Mayer, and D.E. Kidd. 1980. Advective control of nutrient dynamics in the epilimnion of a large reservoir. Limnology and Oceanography 25: 219–228. Gloss, S.P., R.C. Reynolds, L.M. Mayer, and D.E. Kidd. 1981. Reservoir influences on salinity and nutrient fluxes in the arid Colorado River basin. Pages 1618–1629 in H. G. Stefan (editor). Symposium on Surface Water Impoundments. American Society of Civil Engineers, New York, NY.
86
Gophen, M., V.H. Smith, A. Nishri, and S.T. Threlkeld. 1999. Nitrogen deficiency, phosphorus sufficiency, and the invasion of Lake Kinneret, Israel, by the N2-fixing cyanobacterium Aphanizomenon ovalisporum. Aquatic Sciences 61: 293–306. Grimard Y. and H.G. Jones. 1982. Trophic upsurge in new reservoirs: A model for total phosphorus concentrations. Canadian Journal of Fisheries and Aquatic Sciences 39: 1473–1483. Hammerton, D. 1972. The Nile River — a case history. Pages 171–214 in R.T. Oglesby, C.A. Carlson, and J.A. McCann. River Ecology and Man. Academic Press, New York, NY. Hannan, H.H., D. Barrows, and D.C. Whitenberg. 1981. The trophic status of a deep-storage reservoir in central Texas. Pages 425–434 in H.G. Stefan (editor). Proceedings of the Symposium on Surface Water Impoundments. American Society of Civil Engineers, New York, NY. Hanson, J.M. and W.C. Leggett. 1982. Empirical prediction of fish biomass and yield. Canadian Journal of Fisheries and Aquatic Sciences 39: 257–263. Heath, R.G., M.C. Steynberg, R. Guglielmi, and A.L. Maritz. 1998. The implications of point source phosphorus management to potable water treatment. Water Science and Technology 37(2): 343–350. Hecky, R.E. and P. Kilham. 1988. Nutrient limitation of phytoplankton in freshwater and marine environments: A review of recent evidence on the effects of enrichment. Limnology and Oceanography 33(4, part 2): 796–822. Heinemann, H.G., R.F. Holt, and D.L. Rausch. 1973. Sediment and nutrient research on selected corn belt reservoirs. Pages 381–386 in W.C. Ackermann, G.F. White, and E.B. Worthington (editors). Man-made Lakes: Their Problems and Environmental Effects. Geophysical Monograph Series 17, American Geophysical Union, Washington, DC. Heiskary, S.A. and W.W. Walker. 1988. Developing phosphorus criteria for Minnesota Lakes. Lake and Reservoir Management 4:1–9. Heiskary, S. and C.B. Wilson. 1988. Minnesota Lake Water Quality Assessment Report: First Edition. Minnesota Pollution Control Agency, St. Paul, MN. Heiskary, S.A. and C.B. Wilson. 1989. The regional nature of lake water quality across Minnesota: An analysis for improving resource management. The Journal of the Minnesota Academy of Science 55(1): 72–77. Heiskary, S.A, and C.B. Wilson. 2005. Minnesota Lake Water Quality Assessment Report: Developing Nutrient Criteria. Third Edition. September 2005. Minnesota Pollution Control Agency, St. Paul, MN. 176 pp. http://www.pca.state.mn.us/water/lakequality.html#reports (accessed June 29, 2007).
87
Hellstrom, T. 1996. An empirical study of nitrogen dynamics in lakes. Water Environment Research 68: 55–65. Higgins, J.M., W.L. Poppe, and M.L. Iwanski. 1981. Eutrophication analysis of TVA reservoirs. Pages 404–412 in H.G. Stefan (editor). Proceedings of the Symposium on Surface Water Impoundments. American Society of Civil Engineers, New York, NY. Hokanson, K.E.F. 1990. Sources of Variation in the Measurement of Temperature Requirements of Freshwater Fishes. USEPA Environmental Research Lab, Duluth, MN. Horne, A.J. and C.R. Goldman. 1994. Limnology. McGraw-Hill, Inc., New York, NY. Hoyer, M.V., C.D. Brown, and D.E. Canfield, Jr. 2004. Relations between water chemistry and water quality as defined by lake users in Florida. Lake and Reservoir Management 20(3): 240–248. Huber, W.C., P.L. Brezonik, J.P. Heaney, R.E. Dickinson, S.D. Preston, D.S. Dwornik, and M.A. DeMaio. 1982. A Classification of Florid Lakes, Publication No. 72. Water Resources Research Center, University of Florida, Gainesville, FL. Hutchinson, G.E. 1957. A Treatise on Limnology Vol. 1 Geography, Physics, and Chemistry. John Wiley & Sons, New York, NY. Hyenstrand, P., P. Blomqvist, and A. Pettersson. 1998. Factors determining cyanobacterial success in aquatic systems — a literature review. Archiv für Hydrobiologie Special Issues Advances in Limnology 51: 41–62. Hynes, H.B.N. 1970. The Ecology of Running Waters. University of Toronto Press, Toronto, Canada. 555 pp. Jensen, J.P., E. Jeppesen, E.K. Olrik, and P. Kristensen. 1994. Impact of nutrients and physical factors on the shift from cyanobacterial to chlorophyte dominance in shallow Danish lakes. Canadian Journal of Fisheries and Aquatic Sciences 51: 1692–1699. Johnston, N.T. M.D. Stamford, K.I. Ashley, K. Tsumura. 1999. Responses of rainbow trout (Oncorhynchus mykiss) and their prey to inorganic fertilization of an oligotrophic montane lake. Canadian Journal of Fisheries and Aquatic Sciences 56(6): 1011–1025. Jones, J.R. and R.W. Bachmann. 1976. Predictions of phosphorus and chlorophyll levels in lakes. Journal / Water Pollution Control Federation 48: 2176–2182. Jones, J.R. and M.V. Hoyer. 1982. Sportfish harvest predicted by summer chlorophyll-a concentrations in Midwest lakes and reservoirs. Transactions of the American Fisheries Society 111: 176–179. Jones, J.R. and M.F. Knowlton. 1993. Limnology of Missouri reservoirs: An analysis of
88
regional patterns. Lake and Reservoir Management 8: 17–30. Jones, J.R., M.F. Knowlton, D.V. Obrecht, and E.A. Cook. 2004. Importance of landscape variables and morphology on nutrients in Missouri reservoirs. Canadian Journal of Fisheries and Aquatic Sciences 61: 1503–1512. Kalff, J. 2002. Limnology: Inland Water Ecosystems. Prentice Hall, Upper Saddle River, NJ. Kennedy, R.H. 2001. Considerations for establishing nutrient criteria for reservoirs. Journal of Lake and Reservoir Management 17(3): 175–187. Kennedy, R.H. and G.D. Cooke. 1982. Control of lake phosphorus with aluminum sulfate: dose determination and application techniques. Water Resources Bulletin 18: 389–395. Kennedy, R.H. and W.W. Walker. 1990. Reservoir nutrient dynamics. Pages 109–131 in K.W. Thornton, B.L. Kimmel, F.E. Payne (editors). Reservoir Limnology: Ecological Perspectives. John Wiley & Sons, Inc., New York, NY. Kennedy, R.H., K.W. Thornton, and J.H. Carroll. 1981. Suspended sediment gradients in Lake Red Rock. Pages 1318–1328 in H.G. Stefan (editor). Proceedings of the Symposium on Surface Water Impoundments. American Society of Civil Engineers, New York, NY. Kenney, M.A. 2007. Which nutrient criteria should states and tribes choose to determine water body impairment? Using science and judgment to inform decision-making. Pages 1–6 in: National Water Research Institute First Annual Graduate Fellowship Research Conference Proceedings. April 13, 2007. Orange, CA. Kilpatrick, J.M. 2003. Habitat use, movements, and exploitation of striped bass and hybrid striped bass in Claytor Lake, Virginia. M.S. thesis, Virginia Polytechnic Institute and State University, Blacksburg, VA. 313 pp. Kimmel, B.L. and A.W. Groeger. 1984. Factors controlling primary production in lakes and reservoirs: a perspective. Page 277–281 in Proceedings of the North American Lake Management Society. EPA 440/5/84-001. United States Environmental Protection Agency, Washington, DC. 604 pp. Kimmel, B.L. and O.T. Lind. 1972. Factors affecting phytoplankton production in a eutrophic reservoir. Archiv für Hydrobiologie 71: 124–141. Kimmel, B.L., O.T. Lind, and L.J. Paulson. 1990. Pages 133–193 in K.W. Thornton, B.L. Kimmel, F.E. Payne (editors). Reservoir Limnology: Ecological Perspectives. John Wiley & Sons, Inc., New York, NY. Klemer, A.R. and A.E. Konopka. 1989. Causes and consequences of blue-green algal (cyanobacterial) blooms. Lake and Reservoir Management 5: 9–19.
89
Knowlton, M.F., J.R. Jones. 1993. Testing models of chlorophyll and transparency for Midwest lakes and reservoirs. Lake and Reservoir Management 8: 13–16. Köhler, J. 1993. Growth, production and losses of phytoplankton in the lowland Rivre Spree. I. Population dynamics. Journal of Plankton Research 15: 335–349. Köhler, J. 1994. Origin and succession of phytoplankton in a river-lake system (Spree, Germany). Hydrobiologia 289: 73–83. Kratzer, C.R. and P.L. Brezonik. 1981. A Carlson-type trophic state index for nitrogen in Florida lakes. Water Resources Bulletin 17: 713–715. Krysel, C., E.M. Boyer, C. Parson, and P. Welle. 2003. Lakeshore Property Values and Water Quality: Evidence from Property Sales in the Mississippi Headwaters Region. Legislative Commission on Minnesota Resources, May 2003. Lee, G.F., A. Jones-Lee, and W. Rast. 1995. Alternative Approaches for Trophic State Classification for Water Quality Management, Parts I and II: (I: Suitability of Existing Trophic State Classification Systems and II: Application of Vollenweider-OECD Eutrophication Modeling Approach). Report of G. Fred Lee & Associates, El Macero, CA. Leidy, G.R. and R.M. Jenkins. 1977. The Development of Fishery Compartments and Population Rate Coefficients for Use in Reservoir Ecosystem Modeling, Contract Rep. Y-77-1. Prepared by the National Reservoir Research Program, U.S. Fish and Wildlife Service for the U.S. Corps of Engineers. Waterways Experiment Station, Vicksburg, MS. Leopold, L.B., M.G. Wolman, and J.P. Miller. 1964. Fluvial Processes in Geomorphology. Freeman, San Francisco, CA. Liang, Y., J.M. Melack, and J. Wang. 1981. Primary production and fish yields in Chinese ponds and lakes. Transactions of the American Fisheries Society 110: 346–350. Lillie, R.A., and J.W. Mason. 1983. Limnological characteristics of Wisconsin lakes. Technical Bulletin 138. Department of Natural. Resources, Madison, WI. Lind, O.T. 1971. The organic matter budget of a central Texas reservoir Pages 193–202 in G.E. Hall (editor). Reservoir Fisheries and Limnology. American Fisheries Society, Washington, DC. Lind, O.T. 1979. Reservoir eutrophication: Factors governing primary production. Tech Compl. Rept. Proj. B-210-TEX. Office of Water Research and Technology, U.S. Department of Interior. Lindemann, R.L. 1942. The trophic-dynamic aspect of ecology. Ecology 23:399–418. Maceina, M.J. 2001. Trophic state and fish in Alabama reservoirs. LakeLine. 21(3): 16–19.
90
Maceina, M.J., D.R. Bayne, A.S. Hendricks, W.C. Reeves, W.P. Black, and V.J. Dicenzo. 1996. Compatibility between water clarity and quality black bass and crappie fisheries in Alabama. Pages 296–305 in L.E. Miranda and D.R. DeVries (editors). Multidimensional Approaches to Reservoir Fisheries Management. American Fisheries Society Symposium 16. Malcolm Pirnie. 2005. Potential Nutrient-Related Targets for Lakes and Reservoirs in Arizona. Report submitted to the Arizona Department of Environmental Quality. 1761-107. April 2005. Malcolm Pirnie, Phoenix, AZ. Martin, J.L. and S.C. McCutcheon. 1999. Hydrodynamics and Transport for Water Quality Modeling. CRC Press, Inc., Boca Raton, FL. 794 pp. Matthews, R., M. Hilles, and G. Pelletier. 2002. Determining trophic state in Lake Whatcom, Washington, a soft water lake exhibiting seasonal nitrogen limitation. Hydrobiologia 468: 107–121. McCallister, D.L. and T.J. Logan. 1978. Phosphate adsorption-desorption characteristics of soils and bottom sediments in the Maumee River basin of Ohio. Journal of Environmental Quality 7: 87–92. McCauley, E., J.A. Downing, and S. Watson. 1989. Sigmoid relationships among nutrients and chlorophyll among lakes. Canadian Journal of Fisheries and Aquatic Sciences 46: 1171–1175. McGhee, R.F. 1983. Experiences in developing a chlorophyll a standard in the Southeast to protect lakes, reservoirs, and estuaries. Pages 163–165 in Lake Restoration, Protection, and Management, Proc. 2nd Annual Conf. NALMS, 26–29 Oct 1982, Vancouver, BC. EPA 440/5-83-001. McQueen, D.J. and D.R.S. Lean. 1986 . Hypolimnetic aeration: An overview. Water Pollution Research Journal of Canada 21: 205–217. Melack, J.M. 1976. Primary productivity and fish yields in tropical lakes. Transactions of the American Fisheries Society 105: 757–580. Michael, H.J., K.J. Boyle, and R. Bouchard. 1996. Water Quality Affects Property Prices: A Case Study of Selected Maine Lakes. Maine Agricultural and Forest Experiment Station, Misc. Report 398. University of Maine, February 1996. Michael, H.J., K.J. Boyle, and R. Bouchard. 2000. Does the measurement of environmental quality affect implicit prices estimated from hedonic models. Land Economics 76(2): 283–298. Moore, L. and K. Thornton (editors). 1988. Lake and Reservoir Restoration Guidance Manual. USEPA. EPA 440/5-88-002. First Edition. OWRS, EPA 440/5-88-002. United States Environmental Protection Agency, Office of Water, Washington, DC.
91
Morris, D.P. and W.M. Lewis. 1986. Phytoplankton nutrient limitation in Colorado mountain lakes. Freshwater Biology 20: 315–327. Morris, G.I., and J. Fan. 1998. Reservoir Sedimentation Handbook: Design and Management of Dams, Reservoirs, and Watersheds for Sustainable Use. McGraw-Hill, New York, NY. Moss, B., H. Balls, I. Booker, K. Manson, and M. Timms. 1984. The River Bure, U.K.: patterns of change in chemistry and phytoplankton in a slow-flowing fertile river. Verhandlungen - Internationale Vereinigung fuer Theoretische und Angewandte Limnologie 22. pp. 1959–1964. MPCA (Minnesota Pollution Control Agency). Water Quality Standards. http://www.pca.state.mn.us/water/standards/index.html (accessed July 3, 2007). NC DENR (North Carolina Department of Environment and Natural Resources). 2006. North Carolina Water Quality Assessment and Impairment Waters List (2006 Integrated 305(b) and 303(d) Report). NC DENR, Division of Water Quality, Raleigh, NC. http://h2o.enr.state.nc.us/tmdl/General_303d.htm (accessed February 5, 2007 NC WRRI (North Carolina Water Resources Research Institute). 2001. The chlorophyll a standard: A primer. Water Resources Research Institute News of the University of North Carolina 328: 8–10. http://www.ncsu.edu/wrri/news/wrrinews.html or http://www.ncsu.edu/wrri/news/WRRINews_328.pdf (accessed July 2, 2007). Ney, J.J. 1988. The Smith Mountain Lake Fishery: Factors Affecting Major Sport and Forage Fish Populations. Report to the Virginia Department of Wildlife and Inland Fisheries. Richmond, VA. 294 pp. Ney, J.J. 1996. Oligotrophication and its discontents: effects of reduced nutrient loading on reservoir fisheries. American Fisheries Society Symposium 16, Bethesda, MD. Ney, J.J. C.M. Moore, M.S. Tisa, J.J. Yurk, and R.J. Neves. 1990. Factors affecting the sport fishery in a multiple-use Virginia reservoir. Lake and Reservoir Management 6: 21–32. Nordin, R., K. Ashley, and P. Law. 1995. Hypolimnetic aeration of St. Mary Lake, British Columbia, Canada (abstract). Lake and Reservoir Management 11: 176. North American Lake Management Society (NALMS). 1992. Developing Eutrophication Standards for Lakes and Reservoirs. A Report Prepared by the Lake Standards Subcommittee. May 1992. North American Lake Management Society, Alachua, FL. 51 pp. Northcote, T.G., F.R. Pick, D.B. Fillion, and S.P. Salter. 2005. Interaction of nutrients and turbidity in the control of phytoplankton in a large western Canadian lake prior to major watershed impoundments. Lake and Reservoir Management 21(3): 261–276.
92
Nurnberg, G. K. 1996. Trophic state of clear and colored, soft-and hardwater lakes with special consideration of nutrients, anoxia, phytoplankton and fish. Lake and Reservoir Management 12(4): 432–447. O’Brien, W.J. 1975. Factors limiting primary productivity in turbid Kansas reservoirs. Tech. Compl. Rept. Proj. A-0520-KAN, Office of Water Research and Tech., U.S. Department of Interior. 34 pp. Oglesby, R.T. 1977. Relationship of fish yield to lake phytoplankton standing crop, production and morphoedaphic factors. Journal Fisheries Research Board of Canada 34: 2271–9. Oglesby, R.T., J.H. Leach, and J. Forney. 1987. Potential Stizostedion yield as a function of chlorophyll concentration with special reference to Lake Erie. Canadian Journal of Fisheries and Aquatic Sciences 44(Suppl. 2): 166–170. Omernik, J.M. 1987. Ecoregions of the conterminous United States. Annals of the Association of American Geographers. 77(1): 118–125. Ostrofsky, M.L. and H.C. Duthie. 1980. Trophic upsurge and the relationship between phytoplankton biomass and productivity in Smallwood Reservoir, Canada. Canadian Journal of Botany 58: 1174–1180. Pastorok, R..A., T.C. Ginn, and M.W. Lorenzen. 1981 Evaluation of Aeration/Circulation as a Lake Restoration Technique. EPA-600/3-81-014. U.S. Environmental Protection Agency, Environmental Research Lab, Washington, DC. Pastorok, R.A., M.W. Lorenzen, and T.C. Ginn. 1982. Environmental aspects of artificial aeration and oxygenation of reservoirs: A review of theory, techniques, and experiences. Technical Report E-82-3. U.S. Army Engineering Waterways Experiment Station, Vicksburg, MS. 192 pp. Peterson, S.A. 1981. Sediment Removal as a Lake Restoration Technique. EPA 600/3-81-013. U.S. Environmental Protection Agency, Corvallis Environmental Research Lab, Corvallis, OR Petts, G.E. 1984. Impounded Rivers, Perspectives for Ecological Management. John Wiley and Sons, New York, NY. Pilotto, L.S., R.M. Douglas, M.D. Burch, S. Cameron, M. Beers, G.R. Rouch, P. Robinson, M. Kirk, C.T. Cowie, S. Hardiman, C. Moore, and R.G. Attewell. 1997. Health effects of recreational exposure to cyanobacteria (blue-green) during recreational water-related activities. Aust. N. Zealand J. Public Health, 21: 562–566. Placke, J.F. 1983. Trophic Status Evaluation of TVA Reservoirs, Rep. No. TVA/ONR/WR-83-7. Chattanooga: Office of Natural Resources, Division of Natural Resource Operations, Tennessee Valley Authority. 105 pp.
93
Placke, J.F. and W.L. Poppe. 1980. Eutrophication Analysis of Nickajack and Chickamauga Reservoirs. Technical Report. Tennessee Valley Authority, Chattanooga, TN. 105 pp. Poor, P.J., K.J. Boyle, L.O. Taylor and R. Bouchard. 2001. Water clarity in hedonic property value models. Land Economics 77(4): 482–493. Prairie, Y.T., C.M. Duarte, and J. Kalff. 1989. Unifying nutrient-chlorophyll relationships in lakes. Canadian Journal of Fisheries and Aquatic Sciences 46: 1176–1182. Preisendorfer, R.W. 1986. Eyeball optic of natural waters: Secchi disk science. NOAA Tech. Memo. ERL PMEL 67. NTIS PB86 224060/AS. 90 pp. Priscu, J.C., J. Verdium, and J.E. Deacon. 1981. The fate of biogenic suspensoids in a desert reservoir. Pages 1657–1667 in H.G. Stefen (editor). Proceedings of the Symposium on Surface Water Impoundments. American Society of Civil Engineers, New York, NY. Prygiel, J. and M. Leitao. 1994. Cyanophycean blooms in the reservoir of Val Joly (northern France) and their development in downstream rivers. Hydrobiologia 289: 85–96. Rast, W., R.A. Jones, and G.F. Lee. 1983. Predictive capability of U.S. OECD phosphorus loading-eutrophication response models. Journal of the Water Pollution Control Federation 55: 990–1003. Rawson, D.S. 1955. Morphometry as a dominant factor in the productivity of large lakes. Verh. Int. Ver. Limnol. 12: 164–175. Reckhow, K.H. 1988. Empirical models for trophic state in southeastern U.S. lakes and reservoirs. Water Research Bulletin 24: 723–734. Reckhow, K.H., and J.T. Simpson. 1980. A procedure using modeling and error analysis for the prediction of lake phosphorus concentration from land use information. Canadian Journal of Fisheries and Aquatic Sciences 37: 1439–1448. Reckhow, K.H., G.B. Arhonditsis, M.A. Kenny, L. Hauser, J. Tribo, C. Wu, K.J. Elcock, L.J. Steinberg, C.A. Stow, and S.J. Mc Bride. 2005. A predictive approach to nutrient criteria. Environmental Science & Technology 39(9): 2913–2919. Redfield, A.C. 1934. On the proportions of organic derivations in sea water and their relation to the composition of plankton. Pages 177–192 in R.J. Daniel (editor). James Johnson Memorial Volume. University Press of Liverpool. Reynolds, C.S. 1994. The long, the short and the stalled: on the attributes of phytoplankton selected by physical mixing in lakes and rivers. Hydrobiologia 289: 9–21. Reynolds, C.S. and J.-P. Descy. 1996. The production, biomass and structure of phytoplankton in large rivers. Archiv fuer Hydrobiologie Supplementband 113: 161–187.
94
Reynolds, C.S., J.-P. Descy, and J. Padisák. 1994. Are phytoplankton dynamics in rivers so different from those in shallow lakes? Hydrobiologia 289: 1–7. Round, F.E. 1981. The Ecology of Algae. Cambridge University Press, Cambridge. 653 pp. Ryding, S.-O. and W. Rast. 1989. The control of eutrophication of lakes and reservoirs. Man and the Biosphere Series, United Nations Educational Scientific and Cultural Organization. Paris, France. 314 pp. Schindler, D.W. 1974. Eutrophication and recovery in experimental lakes: Implications for lake management. Science 184: 897–899. Schindler, D.W. 1977. Evolution of phosphorus limitations in lakes. Science 195: 260–262. Schindler, D.W. 1978. Factors regulating phytoplankton production and standing crop in the world’s freshwaters. Limnology and Oceanography 23(3): 478–486. Schreiber, J.D. and D.L. Rausch. 1979. Suspended sediment-phosphorus relationships for the inflow and outflow of a flood detention reservoir. Journal of Environmental Quality 8: 510–514. Schupp, D., and B. Wilson. 1993. Developing lake goals for water quality and fisheries. LakeLine 13(4): 18–21. Sharpley, A.N. and J.K. Syers. 1979. Phosphorus inputs into a stream draining an agricultural watershed. II: Amounts contributed and relative significance of runoff types. Water, Air, and Soil Pollution 11: 417–428. Sharpley, A.N., S.J. Smith, R.G. Menzel, W. A. Berg, and O.R. Jones. 1987. Precipitation and water quality in the Southern Plains. NALMS Proceedings in Lake and Reservoir Management Vol. 3, 379–384. Shiel, R.J. and K.F. Walker. 1984. Zooplankton of regulated and unregulated rivers: The Murray-Darling river system, Australia. Pages 263–270 in A. Lillehammer and S.J. Saltveir (editors). Regulated Rivers. University of Oslo. Smeltzer, E., and S.A. Heiskary. 1990. Analysis and applications of lake user survey data. Lake and Reservoir Management 6(1): 109–118. Smith, D.G. and R.J. Davies-Colley. 1992. Perception of water clarity and colour in terms of suitability for recreational use. Journal of Environmental Management 36: 225–235. Smith, D.G. and J.A. Perrone. 1996. Laboratory experiments to investigate human sensitivity to changes in water clarity. Journal of Environmental Management 48: 139–154.
95
Smith, D.G., A.M. Cragg, and G.F. Croker. 1991. Water clarity criteria for bathing waters based on user perceptions. Journal of Environmental Management 33: 285–299. Smith, D.G., G.F. Croker, and K. McFarlane. 1995. Human perception of water appearance: clarity and colour for bathing and aesthetics. New Zealand Journal of Marine and Freshwater Research 29: 29–43. Smith, R.L. 1986. Elements of Ecology. Second Edition. Harper & Row, Publishers, Inc., New York, NY. 677 pp. Smith, V.H. 1982. The nitrogen and phosphorus dependence of algal biomass in lakes: An empirical and theoretical analysis. Limnology and Oceanography 27: 1101–1112. Smith, V.H. 1983. Low nitrogen to phosphorus ratios favor dominance by blue-green algae in lake phytoplankton. Science 221: 669–671. Smith, V.H. 1986. Light and nutrient effects on relative biomass of blue green algae in lake phytoplankton. Canadian Journal of Fisheries and Aquatic Sciences 43: 148–153. Smith, V.H. 1990. Effects of nutrients and non-algal turbidity on blue-green algal biomass in four North Carolina reservoirs. Lake and Reservoir Management 6: 125–131. Smith, V.H. and J. Shapiro. 1981. Chlorophyll-phosphorus relations in individual lakes: Their importance to lake restoration strategies. Environmental Science and Technology 15: 444–451. Smith, V.H., V.J. Bierman, B.L. Jones, and K.E. Havens. 1995. Historical trends in the Lake Okeechobee ecosystem. IV. Nitrogen:phosphorous ratios, cyanobacterial biomass, and nitrogen fixation potential. Arch. Hydrobiol. Monogr. Beitr. 107: 69–86. Smith, D.G., G.F. Croker, and K. McFarlane. 1995. Human perception of water appearance — clarity and colour for bathing and aesthetics. New Zealand Journal of Marine and Freshwater Research 29: 29–43. Søballe D.M. and B.L. Kimmel. 1987. A large scale comparison of factors influencing phytoplankton abundance in lakes, rivers, and impoundments. Ecology 68: 1943–1954. Søballe, D.M., B.L. Kimmel, R.H. Kennedy, and R.F. Gaugush. 1992. Reservoirs. Pages 421–474 in C.T. Hackney, S.M. Adams, and W.H. Marin (editors). Biodiversity of the Southeastern United States: Aquatic Communities. John Wiley & Sons, Inc., New York, NY. 779 pp. Stefan, H.G. and M.J. Hanson. 1981. Phosphorus recycling in five shallow lakes. American Society of Civil Engineers (ASCE) Environmental Engineering Division 107: 714–730. Stroud, R.H. and R.G. Martin. 1973. The influence of reservoir discharge location on the water quality, biology, and sport fisheries of reservoirs and tailwaters. Pages 540–558 in W.C. Ackermann, G.F. White, and E.B. Worthington (editors). Man-Made Lakes: Their Problems and
96
Environmental Effects. Geogphys. Monogr. No. 17. American Geophysical Union, Washington, DC. Suttle, C.A. and P.J. Harrison. 1988. Ammonium and phosphate uptake rates, N:P supply ratios, and evidence for N and P limitation in some oligotrophic lakes. Limnology and Oceanography 33: 186–202. Synder, E.B. and G.W. Minshall. 2005. An energy budget for the Kootenai River, Idaho (USA), with application for management of the Kootenai white sturgeon, Acipenser transmontanus. Aquatic Sciences 67: 472–485. Synder, E.B., C.T. Robinson, S.R. Rushforth and G.W. Minshall. 2002. Patterns in periphyton accrual and diatom assemblage structure across a heterogeneous landscape. Canadian Journal of Fisheries and Aquatic Sciences 59: 564–577. Talling, J.F. and J. Rzoska. 1967. The development of plankton in relation to hydrological regime in the Blue Nile. Journal of Ecology 55: 637–662. Thornton, K.W. 1990a. Perspectives on reservoir limnology. Pages 1–13 in K.W. Thornton, B.L. Kimmel, F.E. Payne (editors). Reservoir Limnology: Ecological Perspectives. John Wiley & Sons, Inc., New York, NY: Thornton, K.W. 1990b. Sedimentary Processes. Pages 43–69 in K.W. Thornton, B.L. Kimmel, F.E. Payne (editors). Reservoir Limnology: Ecological Perspectives. John Wiley & Sons, Inc., New York, NY: Thornton, K.W., B.L. Kimmel, and F.E. Payne (editors). 1990. Reservoir Limnology: Ecological Perspectives. John Wiley & Sons, Inc., New York, NY. U.S. EPA (U.S. Environmental Protection Agency). 1993. Guidance Specifying Management Measures for Sources of Nonpoint Pollution in Coastal Waters (Chapter 6: Management Measures for Hydromodification: Channelization and Channel Modification, Dams, and Stream bank and Shoreline Erosion). EPA 840-B-92-002. January 1993. http://www.epa.gov/nps/MMGI/ (accessed July 3, 2007). U.S. EPA. 2000a. Nutrient Criteria Technical Guidance Manual: Lakes and Reservoirs. EPA-822-B-00-002. Office of Water, Washington, DC. http://www.epa.gov/waterscience/criteria/nutrient/guidance/lakes/index.html (accessed July 3, 2007). U.S. EPA. 2000b. Ambient Water Quality Criteria Recommendations Information Supporting the Development of State and Tribal Nutrient Criteria for Lakes and Reservoirs in Nutrient Ecoregion II. December 2000. EPA-822-B-00-007. Office of Water, Washington, DC. http://www.epa.gov/waterscience/criteria/nutrient/ecoregions/lakes/index.html (access July 3, 2007).
97
U.S. EPA. 2000c. Ambient Water Quality Criteria Recommendations Information Supporting the Development of State and Tribal Nutrient Criteria for Lakes and Reservoirs in Nutrient Ecoregion VI. December 2000. EPA 822-B-00-008. Office of Water, Washington, DC. http://www.epa.gov/waterscience/criteria/nutrient/ecoregions/lakes/index.html (accessed July 3, 2007). U.S. EPA. 2000d. Ambient Water Quality Criteria Recommendations Information Supporting the Development of State and Tribal Nutrient Criteria for Lakes and Reservoirs in Nutrient Ecoregion VII. December 2000. EPA 822-B-00-009. Office of Water, Washington, DC. http://www.epa.gov/waterscience/criteria/nutrient/ecoregions/lakes/index.html (accessed July 3, 2007). U.S. EPA. 2000e. Ambient Water Quality Criteria Recommendations Information Supporting the Development of State and Tribal Nutrient Criteria for Lakes and Reservoirs in Nutrient Ecoregion VIII. December 2000. EPA 822-B-00-010. Office of Water, Washington, DC. http://www.epa.gov/waterscience/criteria/nutrient/ecoregions/lakes/index.html (accessed July 3, 2007). U.S. EPA. 2000f. Ambient Water Quality Criteria Recommendations Information Supporting the Development of State and Tribal Nutrient Criteria for Lakes and Reservoirs in Nutrient Ecoregion XI. December 2000. EPA 822-B-00-012. Office of Water, Washington, DC. http://www.epa.gov/waterscience/criteria/nutrient/ecoregions/lakes/index.html (accessed July 3, 2007). U.S. EPA. 2000g. Ambient Water Quality Criteria Recommendations Information Supporting the Development of State and Tribal Nutrient Criteria for Lakes and Reservoirs in Nutrient Ecoregion XII. December 2000. EPA 822-B-00-013. Office of Water, Washington, DC. http://www.epa.gov/waterscience/criteria/nutrient/ecoregions/lakes/index.html (accessed July 3, 2007). U.S. EPA. 2000h. Ambient Water Quality Criteria Recommendations Information Supporting the Development of State and Tribal Nutrient Criteria for Lakes and Reservoirs in Nutrient Ecoregion XIII. December 2000. EPA 822-B-00-014. Office of Water, Washington, DC. http://www.epa.gov/waterscience/criteria/nutrient/ecoregions/lakes/index.html (accessed July 3, 2007). U.S. EPA. 2001a. Ambient Water Quality Criteria Recommendations Information Supporting the Development of State and Tribal Nutrient Criteria for Lakes and Reservoirs in Nutrient Ecoregion III. December 2001. EPA 822-B-01-008. Office of Water, Washington, DC. http://www.epa.gov/waterscience/criteria/nutrient/ecoregions/lakes/index.html (accessed July 3, 2007). U.S. EPA. 2001b. Ambient Water Quality Criteria Recommendations Information Supporting the Development of State and Tribal Nutrient Criteria for Lakes and Reservoirs in Nutrient Ecoregion IV. December 2001. EPA 822-B-01-009. Office of Water, Washington, DC.
98
http://www.epa.gov/waterscience/criteria/nutrient/ecoregions/lakes/index.html (accessed July 3, 2007). U.S. EPA. 2001c. Ambient Water Quality Criteria Recommendations Information Supporting the Development of State and Tribal Nutrient Criteria for Lakes and Reservoirs in Nutrient Ecoregion V. December 2001. EPA-822-B-01-010. Office of Water, Washington, DC. http://www.epa.gov/waterscience/criteria/nutrient/ecoregions/lakes/index.html (accessed July 3, 2007). U.S. EPA. 2001d. Ambient Water Quality Criteria Recommendations Information Supporting the Development of State and Tribal Nutrient Criteria for Lakes and Reservoirs in Nutrient Ecoregion IX. December 2001. EPA 822-B-00-011. Office of Water, Washington, DC. http://www.epa.gov/waterscience/criteria/nutrient/ecoregions/lakes/index.html (accessed July 3, 2007). U.S. EPA. 2001e. Ambient Water Quality Criteria Recommendations Information Supporting the Development of State and Tribal Nutrient Criteria for Lakes and Reservoirs in Nutrient Ecoregion XIV. December 2001. EPA 822-B-01-011. Office of Water, Washington, DC. http://www.epa.gov/waterscience/criteria/nutrient/ecoregions/lakes/index.html (accessed July 3, 2007). U.S. EPA. 2002. National Water Quality Inventory 2000 Report. August 2002. EPA-841-R-02-001. Office of Water, Washington, DC. www.epa.gov/305b (accessed July 3, 2007). U.S. EPA. 2003a. Survey of States, Tribes, and Territories Nutrient Standards. Office of Water, United States Environmental Protection Agency, Washington, DC. U.S. EPA. 2003b. Water on Tap: What You Need to Know. EPA 816-K-03-007. October 2003. Office of Water. 32 pp. http://www.epa.gov/safewater/wot/index.html. (accessed July 3, 2007). VDEQ (Virginia Department of Environmental Quality). 2004. 2004 Water Quality Assessment Guidance Manual. http://www.deq.virginia.gov/waterguidance/pdf/042006.pdf (accessed July 3, 2007). VDEQ. 2006. Final 2006 305(b)/303(d) Water Quality Assessment Integrated Report (Appendix A – Roanoke River Basin). http://www.deq.state.va.us/wqa/ir2006.html (accessed July 3, 2007). VDEQ, Virginia Department of Environmental Quality. 2004. Final 2004 305(b)/303(d) Water Quality Assessment Integrated Report. http://www.deq.state.va.us/wqa/ir2004.html (accessed February 5, 2007). VDEQ, Virginia Department of Environmental Quality. 2006. Final 2006 305(b)/303(d) Water Quality Assessment Integrated Report (Appendix A – Roanoke River Basin). http://www.deq.state.va.us/wqa/ir2006.html (accessed February 5, 2007).
99
Vollenweider, R.A. 1969. Scientific fundamentals of the eutrophication of lakes and flowing waters, with particular reference to nitrogen and phosphorus as factors in eutrophication. Org. Econ. Coop. Dev. Tech. Rep. DAS/CS1/68.27: 159 pp. Walker, W.W., Jr. 1981. Empirical Methods for Predicting Eutrophication in Impoundments, Report 1, Phase I. Data Base Development. Tech. Rep. E-81-0. EWQOS, U.S. Army Corps of Engineers, Vicksburg, MS. Walker, W.W., Jr. 1982. An empirical analysis of phosphorus, nitrogen, and turbidity effects on reservoir chlorophyll-a levels. Canadian Water Resources Journal 7: 88–108. Walker, W.W. Jr. 1984. Empirical predication of chlorophyll in reservoirs. Pages 292–297 in U.S. Environmental Protection Agency. Lake and Reservoir Management. EPA 440/5/84-001. Washington, DC. Walker, W.W. Jr. 1985. Empirical Methods for Predicting Eutrophication in Impoundments, Rep. 3, Phase II. Model Refinements. Tech. Rep. E-81-9. U.S. Army Engineer Waterways Experiment Station, Vicksburg, MS. Walmsley, R.D. 1984. A chlorophyll-a trophic status classification system for South African impoundments. Journal of Environmental Quality 13: 97–104. Ward, J.V. 1976. Comparative limnology of differentially regulated sections of a Colorado mountain river. Archiv für Hydrobiologie 78: 319–342. Ward, J.V. and J.A. Standford (editors). 1979. The Ecology of Regulated Streams. Plenum, New York, NY. Ward, J.V. and J.A. Standford. 1981. Tailwater biota: ecological response to enviromental alterations. Pages 1516–1525 in H.G. Stefan (editor). Symposium on Surface Water Impoundments. American Society of Civil Engineers, New York, NY. Wetzel, R.G. 1990. Reservoir ecosystems: conclusions and speculations. Pages.227–238 in K.W. Thornton, B.L. Kimmel, F.E. Payne (editors). Reservoir Limnology: Ecological Perspectives. John Wiley & Sons, Inc., New York, NY: Wetzel, R. G. 1975. Limnology. W.B. Saunders Company. Philadelphia, PA. Wetzel, R.G. 1983. Limnology. W.B. Saunders, Philadelphia, PA. 743 pp. Wetzel, R.G. 2001. Limnology of Lake and River Ecosystems. Third Edition. Academic Press, San Diego, CA. 1006 pp. Wiley, M.J., R.W. Gorden, S.W. Waite, and T. Powless. 1984. The relationship between aquatic macrophytes and sport fish production in Illinois ponds: a simple model. North
100
American Journal of Fisheries Management 4: 111–118. Wrenn, W.B. and T.D. Forsythe. 1979. Effects of temperature on production and yield of juvenile walleyes in experimental ecosystems. Pages 66–73 in R.L. Kendall (editor). Selected Coolwater Fishes of North America. American Fisheries Society, Special Publication 11. Wright, J.C. 1967. Effects of impoundments on productivity, water chemistry, and heat budgets of rivers. Pages 188–189 in Reservoir Fishery Resources. Special Publication of the American Fisheries. Society, Washington, DC. Young, W.C., H.H. Hannan, and J.W. Tatum. 1972. The physicochemcial limnology of a stretch of the Guadalupe River, Texas, with five mainstream impoundments. Hydrobiologia 40: 297–319. Yurk, J.J. and J.J. Ney. 1989. Phosphorus-fish community relationships in southern Appalachian reservoirs: Can lakes be too clean for fish? Lake and Reservoir Management 5: 83–90. Zipper, C.E., E.F. Benfield, T.A. Dillaha III, T. J. Grizzard, Jr., C.H. Hershner, Jr., H.I. Kator, W.-S. Lung, J.J. Ney, L.A. Shabman, E.P. Smith, L.A. Smock, J.L. Walker, E.R. Yagow, and T. Younos. 2004. Report of the Academic Advisory Committee to Virginia Department of Environmental Quality — Freshwater Nutrient Criteria. July 20, 2004. Virginia Water Resources Research Center, Blacksburg, VA. 77 pp. http://www.deq.virginia.gov/wqs/rule.html; http://www.deq.virginia.gov/wqs/pdf/AAC04report.pdf; or http://www.vwrrc.vt.edu/publications/publications.htm. Zipper, C.E., J.J. Ney, L.A. Smock, E.P. Smith, J.C. Little, P.A. Bukaveckas, G.R. Yagow, J.L. Walker, and T. Younos. 2005. Issues Related to Freshwater Nutrient Criteria for Lakes and Reservoirs in Virginia. Virginia Water Resources Research Center, Blacksburg, VA. 97 pp. http://www.vwrrc.vt.edu/publications/publications.htm.