Embed Size (px)
Citation preview
Journal of Food Composition and Analysis 22 (2009) 494–502
Critical Review
Nutrients, bioactive non-nutrients and anti-nutrients in potatoes
Barbara Burlingame *, Beatrice Mouille, Ruth Charrondiere
Food and Agriculture Organization of the United Nations, viale delle Terme di Caracalla, 00153 Rome, Italy
A R T I C L E I N F O
Article history:
Received 29 September 2009
Accepted 29 September 2009
Keywords:
Solanum spp.
Potato
Variety
Wild species
Biodiversity
Cultivar differences
Nutrient composition
Plant genetic diversity
Micronutrients
Bioactive non-nutrients
Anti-nutrients
Antioxidant composition
Food composition
Food analysis
A B S T R A C T
Globally, potatoes account for only about 2% of the food energy supply, yet they are the predominant
staple for many countries. In developed countries, potatoes account for 540 kJ (130 kcal) per person per
day, while in developing countries, it is only 170 kJ (42 kcal) per person per day. In addition to energy,
which is derived almost entirely from their carbohydrate content, many varieties of potatoes contribute
nutritionally important amounts of dietary fibre (up to 3.3%), ascorbic acid (up to 42 mg/100 g),
potassium (up to 693.8 mg/100 g), total carotenoids (up to 2700 mcg/100 g), and antioxidant phenols
such as chlorogenic acid (up to 1570 mcg/100 g) and its polymers, and anti-nutrients such as a-solanine
(0.001–47.2 mg/100 g); and lesser amounts of protein (0.85–4.2%), amino acids, other minerals and
vitamins, and other beneficial and harmful bioactive components. Nutrient content depends on a
number of factors, with variety being among the most important. Potato biodiversity is vast, with more
than 4000 known varieties. Most belong to the species Solanum tuberosum, but another 10 species are
cultivated and 200 wild species have been identified. Modern agricultural practices and climate change
are contributing to the loss of potato biodiversity, and thus the loss of the genes coding for nutrient
biosynthetic pathways. Knowledge of differences in nutrient composition of potatoes related to their
genetic diversity will help guide strategies that may contribute to reducing biodiversity loss and
improving food and nutrition security.
� 2009 Published by Elsevier Inc.
Contents lists available at ScienceDirect
Journal of Food Composition and Analysis
journa l homepage: www.e lsev ier .com/ locate / j fca
1. Introduction
Potato biodiversity is vast: approximately 5000 varieties ofpotatoes are known. Most cultivated varieties belong to the speciesSolanum tuberosum. However, about 10 other Solanum species arecultivated, and 200 wild species have been recorded. Conventionalagriculture and climate change may threaten the survival of thesewild relatives: it is forecast that as many as 12% will becomeextinct as their growing conditions deteriorate. If climate changesdrastically, the area where wild potatoes grow naturally could bereduced by as much as 70% (FAO, 2008).
According to the latest FAOSTAT statistics (FAO, 2009a),potatoes account for only about 2% of the world’s dietary energysupply. As a staple food, potatoes are less important globally thanrice, wheat and maize, which account for 20%, 18% and 5%,respectively. During the past 50 years, potato production andconsumption has been rather steady. FAOSTAT reports continue toincrease around the world. Potatoes have a more dominant place inthe diets of people in developed countries than those in developingcountries. Averaged across the world, potatoes account for only170 kJ (41 kcal) per person per day for the developing world, yet
* Corresponding author. Tel.: +39 06 570 53728.
E-mail address: [email protected] (B. Burlingame).
0889-1575/$ – see front matter � 2009 Published by Elsevier Inc.
doi:10.1016/j.jfca.2009.09.001
the number is 540 kJ (130 kcal) for developed world. Countries inthe Commonwealth of Independent States (CIS) rely most heavilyon potatoes for their energy intakes, with Belarus topping the list at1250 kJ (300 kcal) per person per day. Seven other CIS (Common-wealth of Independent States) countries and Portugal followclosely behind, each averaging more than 840 kJ (200 kcal) perperson per day from potatoes.
Potatoes are the subject of many popular culture conceptions andmisconceptions. At various times in recent history, they have had thereputation of being nutritionally both ‘‘bad’’ and ‘‘good’’. During itsphase of having a nutritionally bad reputation, potatoes weremarked as being ‘‘fattening’’ and contributing to diabetes, obesityand its co-morbidities. Many more campaigns have promotedpotatoes as good, including the famous, ‘‘Potatoes are not fattening’’campaign of the United Kingdom, ‘‘Goodness Unearthed’’ and‘‘Healthy MR. POTATO HEAD’’ campaign of the US potato industry(US Potato Board, 2009a, 2009b), the ‘‘Spudtacular Show’’ and‘‘Baked Potato Campaign’’ of New Zealand (HEHA, 2009).
The food components most frequently highlighted in nutrientcontent claims are energy, e.g. ‘‘one medium-sized potato has 110calories’’; fat, e.g. ‘‘100% fat free; saturated fat, trans fatty acids, andcholesterol, e.g. ‘‘fat free’’’, ‘‘0 grams trans fat’’, no cholesterol;sodium, e.g. ‘‘salt free’’. Other nutrients frequently declared arepotassium, fibre, Vitamin C, B6 and various antioxidants (US PotatoBoard, 2009c).
B. Burlingame et al. / Journal of Food Composition and Analysis 22 (2009) 494–502 495
Rarely are varieties differentiated in nutrient declarations orcontent claims, yet there are well-known content differences.Under the Codex Alimentarius food labelling guidelines for‘‘source’’ and ‘‘good source’’ of nutrients (Codex Alimentarius,2007), some varieties would qualify for the claims, while otherswould not. The purpose of this review is to examine the literatureon potato composition at the level of the genetic resource andcompile the data illustrating that the vast existing biodiversity ofpotatoes also reflects vast differences in nutrient content.
2. Methods
2.1. Compilation of nutrient composition data of potatoes by variety
A thorough literature search was performed to gather existinginformation on nutrient composition of potatoes by variety. Whilemany environmental, agricultural and post-harvest factors such asclimate, fertilizer use, maturity at harvest, storage, processing andpreparation influence the nutrient content, this review focusesmainly on the measured differences among varieties. However, theinfluence of variety cannot be assured for many of the data.National Food Composition tables were searched, as were nutritionand agriculture journals. In most food composition data resources,part (flesh, flesh + peel) and state (e.g. cooked or raw) are generallyreported, but varietal name is often missing.
Differences in water content will likely account for many of thedifferences in nutrient content, because values are present on a per100 g basis, fresh weight, unless otherwise noted.
2.2. Nutrient identification—methods and expressions
Among the different data sources, significant differenceswere encountered in the data expressions and conversionfactors. Therefore it was necessary to standardize these datafor making comparisons. For example, nitrogen to proteinconversion factors are mostly standardized as 6.25 for potatoes,some researchers have suggested numbers as low as 5.7 and ashigh as 7.5 (Vigue and Li, 1975; Desborough and Weiser, 1974).The variation in units used to calculate micronutrient composi-tion was extensive. Some of the units encountered were mg/g,g and mg/100 g, mg/kg, mg/100 kg, % dmb, ppm and %. All nutri-ents were standardized to g, mg, or mcg per 100 g fresh weight,unless otherwise noted. Differences in the data reported in thispaper and those found in the source materials result from theserecalculations.
3. Results and discussion
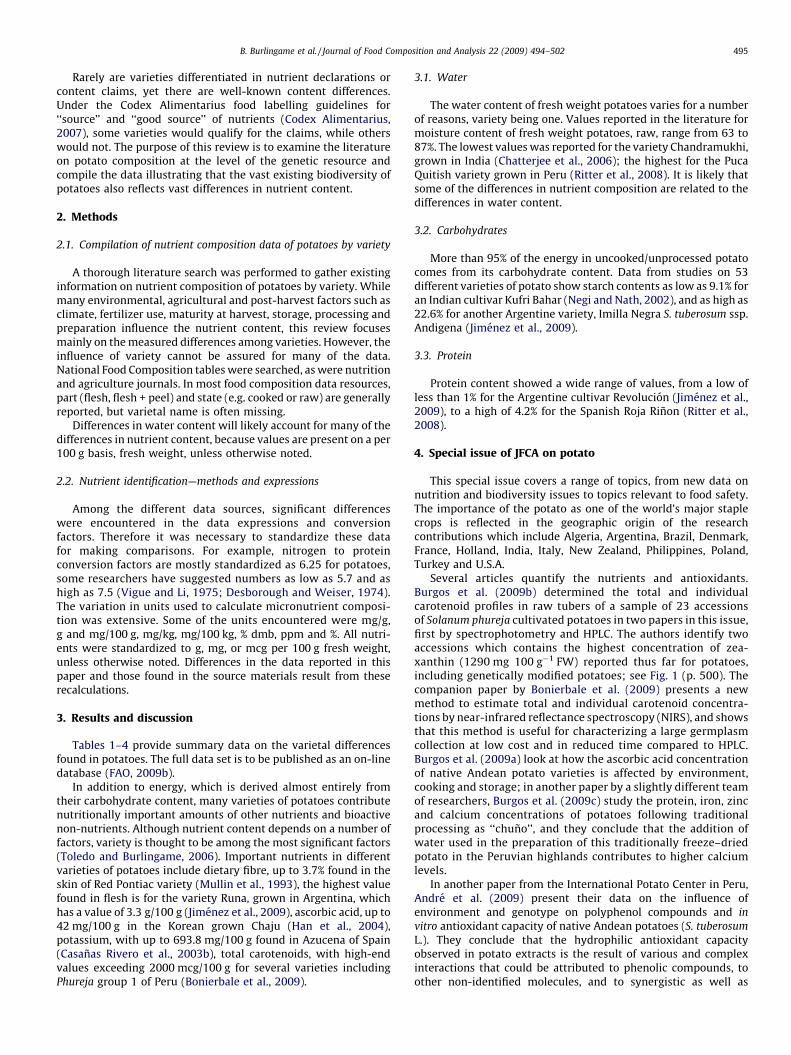
Tables 1–4 provide summary data on the varietal differencesfound in potatoes. The full data set is to be published as an on-linedatabase (FAO, 2009b).
In addition to energy, which is derived almost entirely fromtheir carbohydrate content, many varieties of potatoes contributenutritionally important amounts of other nutrients and bioactivenon-nutrients. Although nutrient content depends on a number offactors, variety is thought to be among the most significant factors(Toledo and Burlingame, 2006). Important nutrients in differentvarieties of potatoes include dietary fibre, up to 3.7% found in theskin of Red Pontiac variety (Mullin et al., 1993), the highest valuefound in flesh is for the variety Runa, grown in Argentina, whichhas a value of 3.3 g/100 g (Jimenez et al., 2009), ascorbic acid, up to42 mg/100 g in the Korean grown Chaju (Han et al., 2004),potassium, with up to 693.8 mg/100 g found in Azucena of Spain(Casanas Rivero et al., 2003b), total carotenoids, with high-endvalues exceeding 2000 mcg/100 g for several varieties includingPhureja group 1 of Peru (Bonierbale et al., 2009).
3.1. Water
The water content of fresh weight potatoes varies for a numberof reasons, variety being one. Values reported in the literature formoisture content of fresh weight potatoes, raw, range from 63 to87%. The lowest values was reported for the variety Chandramukhi,grown in India (Chatterjee et al., 2006); the highest for the PucaQuitish variety grown in Peru (Ritter et al., 2008). It is likely thatsome of the differences in nutrient composition are related to thedifferences in water content.
3.2. Carbohydrates
More than 95% of the energy in uncooked/unprocessed potatocomes from its carbohydrate content. Data from studies on 53different varieties of potato show starch contents as low as 9.1% foran Indian cultivar Kufri Bahar (Negi and Nath, 2002), and as high as22.6% for another Argentine variety, Imilla Negra S. tuberosum ssp.Andigena (Jimenez et al., 2009).
3.3. Protein
Protein content showed a wide range of values, from a low ofless than 1% for the Argentine cultivar Revolucion (Jimenez et al.,2009), to a high of 4.2% for the Spanish Roja Rinon (Ritter et al.,2008).
4. Special issue of JFCA on potato
This special issue covers a range of topics, from new data onnutrition and biodiversity issues to topics relevant to food safety.The importance of the potato as one of the world’s major staplecrops is reflected in the geographic origin of the researchcontributions which include Algeria, Argentina, Brazil, Denmark,France, Holland, India, Italy, New Zealand, Philippines, Poland,Turkey and U.S.A.
Several articles quantify the nutrients and antioxidants.Burgos et al. (2009b) determined the total and individualcarotenoid profiles in raw tubers of a sample of 23 accessionsof Solanum phureja cultivated potatoes in two papers in this issue,first by spectrophotometry and HPLC. The authors identify twoaccessions which contains the highest concentration of zea-xanthin (1290 mg 100 g�1 FW) reported thus far for potatoes,including genetically modified potatoes; see Fig. 1 (p. 500). Thecompanion paper by Bonierbale et al. (2009) presents a newmethod to estimate total and individual carotenoid concentra-tions by near-infrared reflectance spectroscopy (NIRS), and showsthat this method is useful for characterizing a large germplasmcollection at low cost and in reduced time compared to HPLC.Burgos et al. (2009a) look at how the ascorbic acid concentrationof native Andean potato varieties is affected by environment,cooking and storage; in another paper by a slightly different teamof researchers, Burgos et al. (2009c) study the protein, iron, zincand calcium concentrations of potatoes following traditionalprocessing as ‘‘chuno’’, and they conclude that the addition ofwater used in the preparation of this traditionally freeze–driedpotato in the Peruvian highlands contributes to higher calciumlevels.
In another paper from the International Potato Center in Peru,Andre et al. (2009) present their data on the influence ofenvironment and genotype on polyphenol compounds and in
vitro antioxidant capacity of native Andean potatoes (S. tuberosum
L.). They conclude that the hydrophilic antioxidant capacityobserved in potato extracts is the result of various and complexinteractions that could be attributed to phenolic compounds, toother non-identified molecules, and to synergistic as well as
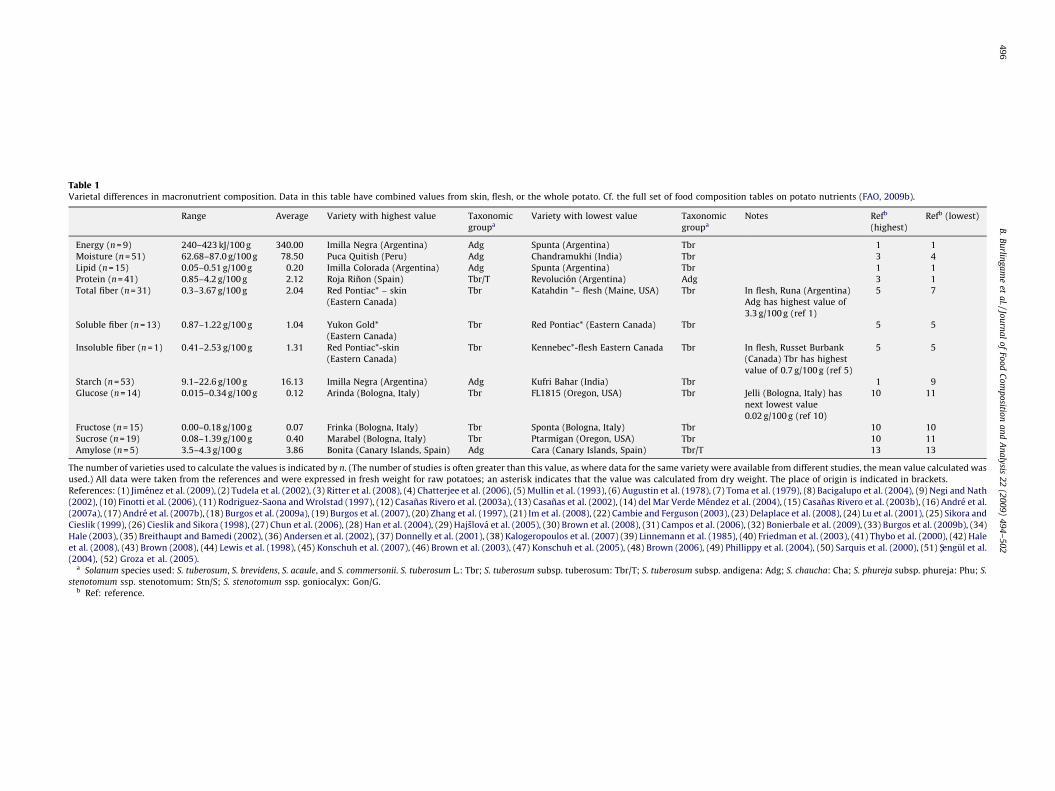
Table 1Varietal differences in macronutrient composition. Data in this table have combined values from skin, flesh, or the whole potato. Cf. the full set of food composition tables on potato nutrients (FAO, 2009b).
Range Average Variety with highest value Taxonomic
groupa
Variety with lowest value Taxonomic
groupa
Notes Refb
(highest)
Refb (lowest)
Energy (n = 9) 240–423 kJ/100 g 340.00 Imilla Negra (Argentina) Adg Spunta (Argentina) Tbr 1 1
Moisture (n = 51) 62.68–87.0 g/100 g 78.50 Puca Quitish (Peru) Adg Chandramukhi (India) Tbr 3 4
Lipid (n = 15) 0.05–0.51 g/100 g 0.20 Imilla Colorada (Argentina) Adg Spunta (Argentina) Tbr 1 1
Protein (n = 41) 0.85–4.2 g/100 g 2.12 Roja Rinon (Spain) Tbr/T Revolucion (Argentina) Adg 3 1
Total fiber (n = 31) 0.3–3.67 g/100 g 2.04 Red Pontiac* – skin
(Eastern Canada)
Tbr Katahdin *– flesh (Maine, USA) Tbr In flesh, Runa (Argentina)
Adg has highest value of
3.3 g/100 g (ref 1)
5 7
Soluble fiber (n = 13) 0.87–1.22 g/100 g 1.04 Yukon Gold*
(Eastern Canada)
Tbr Red Pontiac* (Eastern Canada) Tbr 5 5
Insoluble fiber (n = 1) 0.41–2.53 g/100 g 1.31 Red Pontiac*-skin
(Eastern Canada)
Tbr Kennebec*-flesh Eastern Canada Tbr In flesh, Russet Burbank
(Canada) Tbr has highest
value of 0.7 g/100 g (ref 5)
5 5
Starch (n = 53) 9.1–22.6 g/100 g 16.13 Imilla Negra (Argentina) Adg Kufri Bahar (India) Tbr 1 9
Glucose (n = 14) 0.015–0.34 g/100 g 0.12 Arinda (Bologna, Italy) Tbr FL1815 (Oregon, USA) Tbr Jelli (Bologna, Italy) has
next lowest value
0.02 g/100 g (ref 10)
10 11
Fructose (n = 15) 0.00–0.18 g/100 g 0.07 Frinka (Bologna, Italy) Tbr Sponta (Bologna, Italy) Tbr 10 10
Sucrose (n = 19) 0.08–1.39 g/100 g 0.40 Marabel (Bologna, Italy) Tbr Ptarmigan (Oregon, USA) Tbr 10 11
Amylose (n = 5) 3.5–4.3 g/100 g 3.86 Bonita (Canary Islands, Spain) Adg Cara (Canary Islands, Spain) Tbr/T 13 13
The number of varieties used to calculate the values is indicated by n. (The number of studies is often greater than this value, as where data for the same variety were available from different studies, the mean value calculated was
used.) All data were taken from the references and were expressed in fresh weight for raw potatoes; an asterisk indicates that the value was calculated from dry weight. The place of origin is indicated in brackets.
References: (1) Jimenez et al. (2009), (2) Tudela et al. (2002), (3) Ritter et al. (2008), (4) Chatterjee et al. (2006), (5) Mullin et al. (1993), (6) Augustin et al. (1978), (7) Toma et al. (1979), (8) Bacigalupo et al. (2004), (9) Negi and Nath
(2002), (10) Finotti et al. (2006), (11) Rodriguez-Saona and Wrolstad (1997), (12) Casanas Rivero et al. (2003a), (13) Casanas et al. (2002), (14) del Mar Verde Mendez et al. (2004), (15) Casanas Rivero et al. (2003b), (16) Andre et al.
(2007a), (17) Andre et al. (2007b), (18) Burgos et al. (2009a), (19) Burgos et al. (2007), (20) Zhang et al. (1997), (21) Im et al. (2008), (22) Cambie and Ferguson (2003), (23) Delaplace et al. (2008), (24) Lu et al. (2001), (25) Sikora and
Cieslik (1999), (26) Cieslik and Sikora (1998), (27) Chun et al. (2006), (28) Han et al. (2004), (29) Hajslova et al. (2005), (30) Brown et al. (2008), (31) Campos et al. (2006), (32) Bonierbale et al. (2009), (33) Burgos et al. (2009b), (34)
Hale (2003), (35) Breithaupt and Bamedi (2002), (36) Andersen et al. (2002), (37) Donnelly et al. (2001), (38) Kalogeropoulos et al. (2007) (39) Linnemann et al. (1985), (40) Friedman et al. (2003), (41) Thybo et al. (2000), (42) Hale
et al. (2008), (43) Brown (2008), (44) Lewis et al. (1998), (45) Konschuh et al. (2007), (46) Brown et al. (2003), (47) Konschuh et al. (2005), (48) Brown (2006), (49) Phillippy et al. (2004), (50) Sarquis et al. (2000), (51) Sengul et al.
(2004), (52) Groza et al. (2005).a Solanum species used: S. tuberosum, S. brevidens, S. acaule, and S. commersonii. S. tuberosum L.: Tbr; S. tuberosum subsp. tuberosum: Tbr/T; S. tuberosum subsp. andigena: Adg; S. chaucha: Cha; S. phureja subsp. phureja: Phu; S.
stenotomum ssp. stenotomum: Stn/S; S. stenotomum ssp. goniocalyx: Gon/G.b Ref: reference.
B.
Bu
rling
am
eet
al./Jo
urn
al
of
Foo
dC
om
po
sition
an
dA
na
lysis
22
(20
09
)4
94
–5
02
49
6
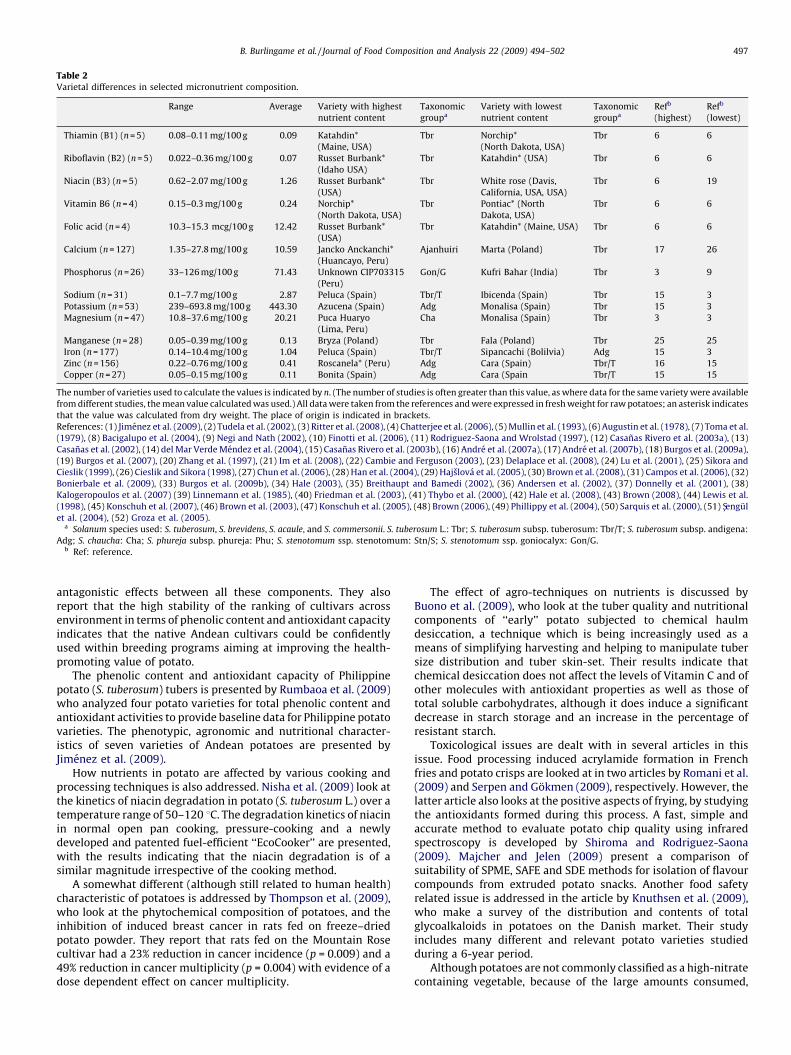
Table 2Varietal differences in selected micronutrient composition.
Range Average Variety with highest
nutrient content
Taxonomic
groupa
Variety with lowest
nutrient content
Taxonomic
groupa
Refb
(highest)
Refb
(lowest)
Thiamin (B1) (n = 5) 0.08–0.11 mg/100 g 0.09 Katahdin*
(Maine, USA)
Tbr Norchip*
(North Dakota, USA)
Tbr 6 6
Riboflavin (B2) (n = 5) 0.022–0.36 mg/100 g 0.07 Russet Burbank*
(Idaho USA)
Tbr Katahdin* (USA) Tbr 6 6
Niacin (B3) (n = 5) 0.62–2.07 mg/100 g 1.26 Russet Burbank*
(USA)
Tbr White rose (Davis,
California, USA, USA)
Tbr 6 19
Vitamin B6 (n = 4) 0.15–0.3 mg/100 g 0.24 Norchip*
(North Dakota, USA)
Tbr Pontiac* (North
Dakota, USA)
Tbr 6 6
Folic acid (n = 4) 10.3–15.3 mcg/100 g 12.42 Russet Burbank*
(USA)
Tbr Katahdin* (Maine, USA) Tbr 6 6
Calcium (n = 127) 1.35–27.8 mg/100 g 10.59 Jancko Anckanchi*
(Huancayo, Peru)
Ajanhuiri Marta (Poland) Tbr 17 26
Phosphorus (n = 26) 33–126 mg/100 g 71.43 Unknown CIP703315
(Peru)
Gon/G Kufri Bahar (India) Tbr 3 9
Sodium (n = 31) 0.1–7.7 mg/100 g 2.87 Peluca (Spain) Tbr/T Ibicenda (Spain) Tbr 15 3
Potassium (n = 53) 239–693.8 mg/100 g 443.30 Azucena (Spain) Adg Monalisa (Spain) Tbr 15 3
Magnesium (n = 47) 10.8–37.6 mg/100 g 20.21 Puca Huaryo
(Lima, Peru)
Cha Monalisa (Spain) Tbr 3 3
Manganese (n = 28) 0.05–0.39 mg/100 g 0.13 Bryza (Poland) Tbr Fala (Poland) Tbr 25 25
Iron (n = 177) 0.14–10.4 mg/100 g 1.04 Peluca (Spain) Tbr/T Sipancachi (Bolilvia) Adg 15 3
Zinc (n = 156) 0.22–0.76 mg/100 g 0.41 Roscanela* (Peru) Adg Cara (Spain) Tbr/T 16 15
Copper (n = 27) 0.05–0.15 mg/100 g 0.11 Bonita (Spain) Adg Cara (Spain Tbr/T 15 15
The number of varieties used to calculate the values is indicated by n. (The number of studies is often greater than this value, as where data for the same variety were available
from different studies, the mean value calculated was used.) All data were taken from the references and were expressed in fresh weight for raw potatoes; an asterisk indicates
that the value was calculated from dry weight. The place of origin is indicated in brackets.
References: (1) Jimenez et al. (2009), (2) Tudela et al. (2002), (3) Ritter et al. (2008), (4) Chatterjee et al. (2006), (5) Mullin et al. (1993), (6) Augustin et al. (1978), (7) Toma et al.
(1979), (8) Bacigalupo et al. (2004), (9) Negi and Nath (2002), (10) Finotti et al. (2006), (11) Rodriguez-Saona and Wrolstad (1997), (12) Casanas Rivero et al. (2003a), (13)
Casanas et al. (2002), (14) del Mar Verde Mendez et al. (2004), (15) Casanas Rivero et al. (2003b), (16) Andre et al. (2007a), (17) Andre et al. (2007b), (18) Burgos et al. (2009a),
(19) Burgos et al. (2007), (20) Zhang et al. (1997), (21) Im et al. (2008), (22) Cambie and Ferguson (2003), (23) Delaplace et al. (2008), (24) Lu et al. (2001), (25) Sikora and
Cieslik (1999), (26) Cieslik and Sikora (1998), (27) Chun et al. (2006), (28) Han et al. (2004), (29) Hajslova et al. (2005), (30) Brown et al. (2008), (31) Campos et al. (2006), (32)
Bonierbale et al. (2009), (33) Burgos et al. (2009b), (34) Hale (2003), (35) Breithaupt and Bamedi (2002), (36) Andersen et al. (2002), (37) Donnelly et al. (2001), (38)
Kalogeropoulos et al. (2007) (39) Linnemann et al. (1985), (40) Friedman et al. (2003), (41) Thybo et al. (2000), (42) Hale et al. (2008), (43) Brown (2008), (44) Lewis et al.
(1998), (45) Konschuh et al. (2007), (46) Brown et al. (2003), (47) Konschuh et al. (2005), (48) Brown (2006), (49) Phillippy et al. (2004), (50) Sarquis et al. (2000), (51) Sengul
et al. (2004), (52) Groza et al. (2005).a Solanum species used: S. tuberosum, S. brevidens, S. acaule, and S. commersonii. S. tuberosum L.: Tbr; S. tuberosum subsp. tuberosum: Tbr/T; S. tuberosum subsp. andigena:
Adg; S. chaucha: Cha; S. phureja subsp. phureja: Phu; S. stenotomum ssp. stenotomum: Stn/S; S. stenotomum ssp. goniocalyx: Gon/G.b Ref: reference.
B. Burlingame et al. / Journal of Food Composition and Analysis 22 (2009) 494–502 497
antagonistic effects between all these components. They alsoreport that the high stability of the ranking of cultivars acrossenvironment in terms of phenolic content and antioxidant capacityindicates that the native Andean cultivars could be confidentlyused within breeding programs aiming at improving the health-promoting value of potato.
The phenolic content and antioxidant capacity of Philippinepotato (S. tuberosum) tubers is presented by Rumbaoa et al. (2009)who analyzed four potato varieties for total phenolic content andantioxidant activities to provide baseline data for Philippine potatovarieties. The phenotypic, agronomic and nutritional character-istics of seven varieties of Andean potatoes are presented byJimenez et al. (2009).
How nutrients in potato are affected by various cooking andprocessing techniques is also addressed. Nisha et al. (2009) look atthe kinetics of niacin degradation in potato (S. tuberosum L.) over atemperature range of 50–120 8C. The degradation kinetics of niacinin normal open pan cooking, pressure-cooking and a newlydeveloped and patented fuel-efficient ‘‘EcoCooker’’ are presented,with the results indicating that the niacin degradation is of asimilar magnitude irrespective of the cooking method.
A somewhat different (although still related to human health)characteristic of potatoes is addressed by Thompson et al. (2009),who look at the phytochemical composition of potatoes, and theinhibition of induced breast cancer in rats fed on freeze–driedpotato powder. They report that rats fed on the Mountain Rosecultivar had a 23% reduction in cancer incidence (p = 0.009) and a49% reduction in cancer multiplicity (p = 0.004) with evidence of adose dependent effect on cancer multiplicity.
The effect of agro-techniques on nutrients is discussed byBuono et al. (2009), who look at the tuber quality and nutritionalcomponents of ‘‘early’’ potato subjected to chemical haulmdesiccation, a technique which is being increasingly used as ameans of simplifying harvesting and helping to manipulate tubersize distribution and tuber skin-set. Their results indicate thatchemical desiccation does not affect the levels of Vitamin C and ofother molecules with antioxidant properties as well as those oftotal soluble carbohydrates, although it does induce a significantdecrease in starch storage and an increase in the percentage ofresistant starch.
Toxicological issues are dealt with in several articles in thisissue. Food processing induced acrylamide formation in Frenchfries and potato crisps are looked at in two articles by Romani et al.(2009) and Serpen and Gokmen (2009), respectively. However, thelatter article also looks at the positive aspects of frying, by studyingthe antioxidants formed during this process. A fast, simple andaccurate method to evaluate potato chip quality using infraredspectroscopy is developed by Shiroma and Rodriguez-Saona(2009). Majcher and Jelen (2009) present a comparison ofsuitability of SPME, SAFE and SDE methods for isolation of flavourcompounds from extruded potato snacks. Another food safetyrelated issue is addressed in the article by Knuthsen et al. (2009),who make a survey of the distribution and contents of totalglycoalkaloids in potatoes on the Danish market. Their studyincludes many different and relevant potato varieties studiedduring a 6-year period.
Although potatoes are not commonly classified as a high-nitratecontaining vegetable, because of the large amounts consumed,
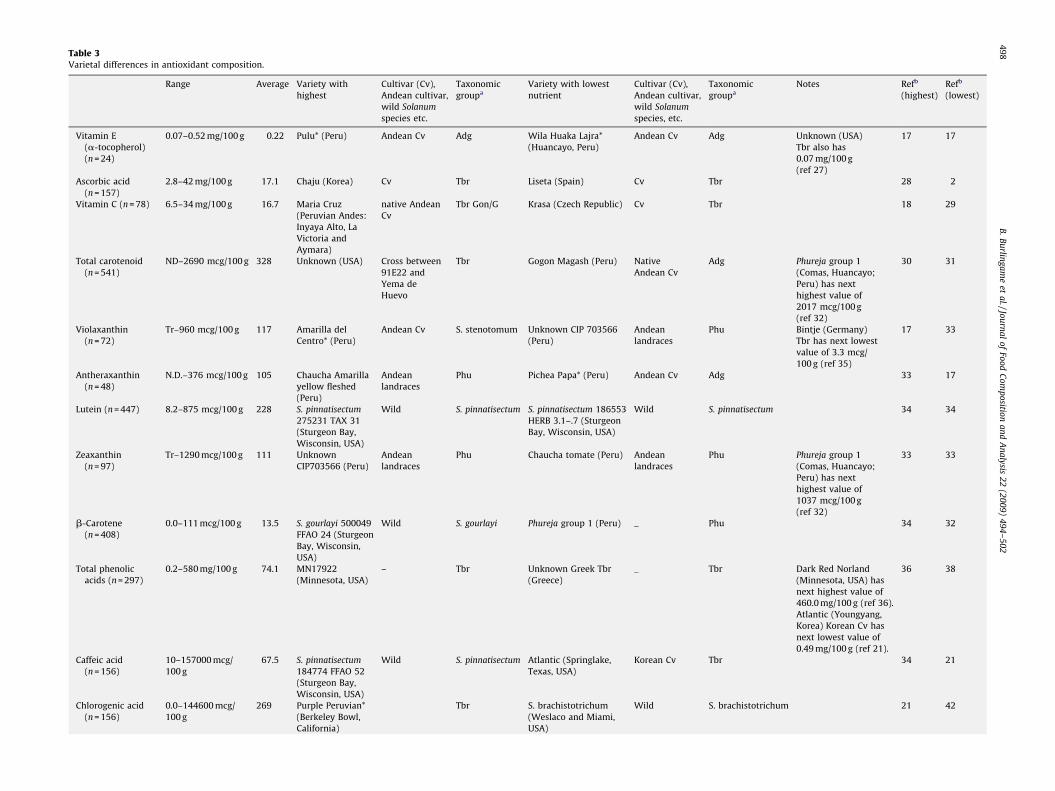
Table 3Varietal differences in antioxidant composition.
Range Average Variety with
highest
Cultivar (Cv),
Andean cultivar,
wild Solanum
species etc.
Taxonomic
groupa
Variety with lowest
nutrient
Cultivar (Cv),
Andean cultivar,
wild Solanum
species, etc.
Taxonomic
groupa
Notes Refb
(highest)
Refb
(lowest)
Vitamin E
(a-tocopherol)
(n = 24)
0.07–0.52 mg/100 g 0.22 Pulu* (Peru) Andean Cv Adg Wila Huaka Lajra*
(Huancayo, Peru)
Andean Cv Adg Unknown (USA)
Tbr also has
0.07 mg/100 g
(ref 27)
17 17
Ascorbic acid
(n = 157)
2.8–42 mg/100 g 17.1 Chaju (Korea) Cv Tbr Liseta (Spain) Cv Tbr 28 2
Vitamin C (n = 78) 6.5–34 mg/100 g 16.7 Maria Cruz
(Peruvian Andes:
Inyaya Alto, La
Victoria and
Aymara)
native Andean
Cv
Tbr Gon/G Krasa (Czech Republic) Cv Tbr 18 29
Total carotenoid
(n = 541)
ND–2690 mcg/100 g 328 Unknown (USA) Cross between
91E22 and
Yema de
Huevo
Tbr Gogon Magash (Peru) Native
Andean Cv
Adg Phureja group 1
(Comas, Huancayo;
Peru) has next
highest value of
2017 mcg/100 g
(ref 32)
30 31
Violaxanthin
(n = 72)
Tr–960 mcg/100 g 117 Amarilla del
Centro* (Peru)
Andean Cv S. stenotomum Unknown CIP 703566
(Peru)
Andean
landraces
Phu Bintje (Germany)
Tbr has next lowest
value of 3.3 mcg/
100 g (ref 35)
17 33
Antheraxanthin
(n = 48)
N.D.–376 mcg/100 g 105 Chaucha Amarilla
yellow fleshed
(Peru)
Andean
landraces
Phu Pichea Papa* (Peru) Andean Cv Adg 33 17
Lutein (n = 447) 8.2–875 mcg/100 g 228 S. pinnatisectum
275231 TAX 31
(Sturgeon Bay,
Wisconsin, USA)
Wild S. pinnatisectum S. pinnatisectum 186553
HERB 3.1–.7 (Sturgeon
Bay, Wisconsin, USA)
Wild S. pinnatisectum 34 34
Zeaxanthin
(n = 97)
Tr–1290 mcg/100 g 111 Unknown
CIP703566 (Peru)
Andean
landraces
Phu Chaucha tomate (Peru) Andean
landraces
Phu Phureja group 1
(Comas, Huancayo;
Peru) has next
highest value of
1037 mcg/100 g
(ref 32)
33 33
b-Carotene
(n = 408)
0.0–111 mcg/100 g 13.5 S. gourlayi 500049
FFAO 24 (Sturgeon
Bay, Wisconsin,
USA)
Wild S. gourlayi Phureja group 1 (Peru) _ Phu 34 32
Total phenolic
acids (n = 297)
0.2–580 mg/100 g 74.1 MN17922
(Minnesota, USA)
– Tbr Unknown Greek Tbr
(Greece)
_ Tbr Dark Red Norland
(Minnesota, USA) has
next highest value of
460.0 mg/100 g (ref 36).
Atlantic (Youngyang,
Korea) Korean Cv has
next lowest value of
0.49 mg/100 g (ref 21).
36 38
Caffeic acid
(n = 156)
10–157000 mcg/
100 g
67.5 S. pinnatisectum
184774 FFAO 52
(Sturgeon Bay,
Wisconsin, USA)
Wild S. pinnatisectum Atlantic (Springlake,
Texas, USA)
Korean Cv Tbr 34 21
Chlorogenic acid
(n = 156)
0.0–144600 mcg/
100 g
269 Purple Peruvian*
(Berkeley Bowl,
California)
Tbr S. brachistotrichum
(Weslaco and Miami,
USA)
Wild S. brachistotrichum 21 42
B.
Bu
rling
am
eet
al./Jo
urn
al
of
Foo
dC
om
po
sition
an
dA
na
lysis
22
(20
09
)4
94
–5
02
49
8
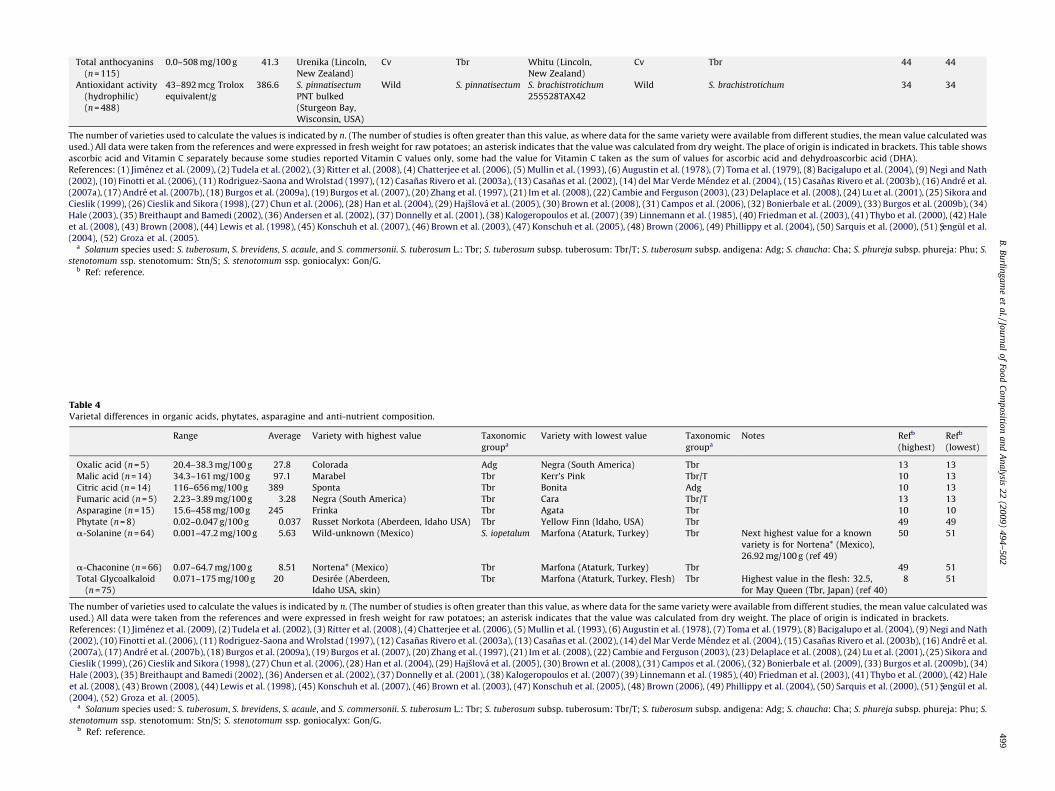
Total anthocyanins
(n = 115)
0.0–508 mg/100 g 41.3 Urenika (Lincoln,
New Zealand)
Cv Tbr Whitu (Lincoln,
New Zealand)
Cv Tbr 44 44
Antioxidant activity
(hydrophilic)
(n = 488)
43–892 mcg Trolox
equivalent/g
386.6 S. pinnatisectum
PNT bulked
(Sturgeon Bay,
Wisconsin, USA)
Wild S. pinnatisectum S. brachistrotichum
255528TAX42
Wild S. brachistrotichum 34 34
The number of varieties used to calculate the values is indicated by n. (The number of studies is often greater than this value, as where data for the same variety were available from different studies, the mean value calculated was
used.) All data were taken from the references and were expressed in fresh weight for raw potatoes; an asterisk indicates that the value was calculated from dry weight. The place of origin is indicated in brackets. This table shows
ascorbic acid and Vitamin C separately because some studies reported Vitamin C values only, some had the value for Vitamin C taken as the sum of values for ascorbic acid and dehydroascorbic acid (DHA).
References: (1) Jimenez et al. (2009), (2) Tudela et al. (2002), (3) Ritter et al. (2008), (4) Chatterjee et al. (2006), (5) Mullin et al. (1993), (6) Augustin et al. (1978), (7) Toma et al. (1979), (8) Bacigalupo et al. (2004), (9) Negi and Nath
(2002), (10) Finotti et al. (2006), (11) Rodriguez-Saona and Wrolstad (1997), (12) Casanas Rivero et al. (2003a), (13) Casanas et al. (2002), (14) del Mar Verde Mendez et al. (2004), (15) Casanas Rivero et al. (2003b), (16) Andre et al.
(2007a), (17) Andre et al. (2007b), (18) Burgos et al. (2009a), (19) Burgos et al. (2007), (20) Zhang et al. (1997), (21) Im et al. (2008), (22) Cambie and Ferguson (2003), (23) Delaplace et al. (2008), (24) Lu et al. (2001), (25) Sikora and
Cieslik (1999), (26) Cieslik and Sikora (1998), (27) Chun et al. (2006), (28) Han et al. (2004), (29) Hajslova et al. (2005), (30) Brown et al. (2008), (31) Campos et al. (2006), (32) Bonierbale et al. (2009), (33) Burgos et al. (2009b), (34)
Hale (2003), (35) Breithaupt and Bamedi (2002), (36) Andersen et al. (2002), (37) Donnelly et al. (2001), (38) Kalogeropoulos et al. (2007) (39) Linnemann et al. (1985), (40) Friedman et al. (2003), (41) Thybo et al. (2000), (42) Hale
et al. (2008), (43) Brown (2008), (44) Lewis et al. (1998), (45) Konschuh et al. (2007), (46) Brown et al. (2003), (47) Konschuh et al. (2005), (48) Brown (2006), (49) Phillippy et al. (2004), (50) Sarquis et al. (2000), (51) Sengul et al.
(2004), (52) Groza et al. (2005).a Solanum species used: S. tuberosum, S. brevidens, S. acaule, and S. commersonii. S. tuberosum L.: Tbr; S. tuberosum subsp. tuberosum: Tbr/T; S. tuberosum subsp. andigena: Adg; S. chaucha: Cha; S. phureja subsp. phureja: Phu; S.
stenotomum ssp. stenotomum: Stn/S; S. stenotomum ssp. goniocalyx: Gon/G.b Ref: reference.
Table 4Varietal differences in organic acids, phytates, asparagine and anti-nutrient composition.
Range Average Variety with highest value Taxonomic
groupa
Variety with lowest value Taxonomic
groupa
Notes Refb
(highest)
Refb
(lowest)
Oxalic acid (n = 5) 20.4–38.3 mg/100 g 27.8 Colorada Adg Negra (South America) Tbr 13 13
Malic acid (n = 14) 34.3–161 mg/100 g 97.1 Marabel Tbr Kerr’s Pink Tbr/T 10 13
Citric acid (n = 14) 116–656 mg/100 g 389 Sponta Tbr Bonita Adg 10 13
Fumaric acid (n = 5) 2.23–3.89 mg/100 g 3.28 Negra (South America) Tbr Cara Tbr/T 13 13
Asparagine (n = 15) 15.6–458 mg/100 g 245 Frinka Tbr Agata Tbr 10 10
Phytate (n = 8) 0.02–0.047 g/100 g 0.037 Russet Norkota (Aberdeen, Idaho USA) Tbr Yellow Finn (Idaho, USA) Tbr 49 49
a-Solanine (n = 64) 0.001–47.2 mg/100 g 5.63 Wild-unknown (Mexico) S. iopetalum Marfona (Ataturk, Turkey) Tbr Next highest value for a known
variety is for Nortena* (Mexico),
26.92 mg/100 g (ref 49)
50 51
a-Chaconine (n = 66) 0.07–64.7 mg/100 g 8.51 Nortena* (Mexico) Tbr Marfona (Ataturk, Turkey) Tbr 49 51
Total Glycoalkaloid
(n = 75)
0.071–175 mg/100 g 20 Desiree (Aberdeen,
Idaho USA, skin)
Tbr Marfona (Ataturk, Turkey, Flesh) Tbr Highest value in the flesh: 32.5,
for May Queen (Tbr, Japan) (ref 40)
8 51
The number of varieties used to calculate the values is indicated by n. (The number of studies is often greater than this value, as where data for the same variety were available from different studies, the mean value calculated was
used.) All data were taken from the references and were expressed in fresh weight for raw potatoes; an asterisk indicates that the value was calculated from dry weight. The place of origin is indicated in brackets.
References: (1) Jimenez et al. (2009), (2) Tudela et al. (2002), (3) Ritter et al. (2008), (4) Chatterjee et al. (2006), (5) Mullin et al. (1993), (6) Augustin et al. (1978), (7) Toma et al. (1979), (8) Bacigalupo et al. (2004), (9) Negi and Nath
(2002), (10) Finotti et al. (2006), (11) Rodriguez-Saona and Wrolstad (1997), (12) Casanas Rivero et al. (2003a), (13) Casanas et al. (2002), (14) del Mar Verde Mendez et al. (2004), (15) Casanas Rivero et al. (2003b), (16) Andre et al.
(2007a), (17) Andre et al. (2007b), (18) Burgos et al. (2009a), (19) Burgos et al. (2007), (20) Zhang et al. (1997), (21) Im et al. (2008), (22) Cambie and Ferguson (2003), (23) Delaplace et al. (2008), (24) Lu et al. (2001), (25) Sikora and
Cieslik (1999), (26) Cieslik and Sikora (1998), (27) Chun et al. (2006), (28) Han et al. (2004), (29) Hajslova et al. (2005), (30) Brown et al. (2008), (31) Campos et al. (2006), (32) Bonierbale et al. (2009), (33) Burgos et al. (2009b), (34)
Hale (2003), (35) Breithaupt and Bamedi (2002), (36) Andersen et al. (2002), (37) Donnelly et al. (2001), (38) Kalogeropoulos et al. (2007) (39) Linnemann et al. (1985), (40) Friedman et al. (2003), (41) Thybo et al. (2000), (42) Hale
et al. (2008), (43) Brown (2008), (44) Lewis et al. (1998), (45) Konschuh et al. (2007), (46) Brown et al. (2003), (47) Konschuh et al. (2005), (48) Brown (2006), (49) Phillippy et al. (2004), (50) Sarquis et al. (2000), (51) Sengul et al.
(2004), (52) Groza et al. (2005).a Solanum species used: S. tuberosum, S. brevidens, S. acaule, and S. commersonii. S. tuberosum L.: Tbr; S. tuberosum subsp. tuberosum: Tbr/T; S. tuberosum subsp. andigena: Adg; S. chaucha: Cha; S. phureja subsp. phureja: Phu; S.
stenotomum ssp. stenotomum: Stn/S; S. stenotomum ssp. goniocalyx: Gon/G.b Ref: reference.
B.
Bu
rling
am
eet
al./Jo
urn
al
of
Foo
dC
om
po
sition
an
dA
na
lysis
22
(20
09
)4
94
–5
02
49
9
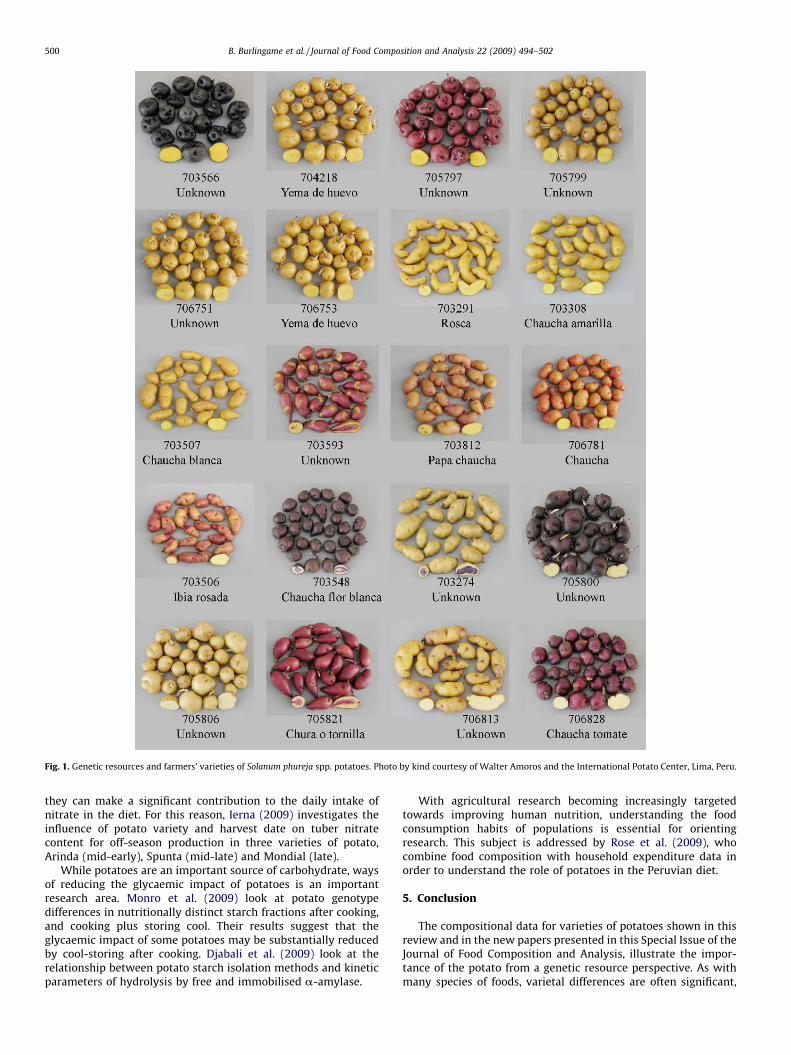
Fig. 1. Genetic resources and farmers’ varieties of Solanum phureja spp. potatoes. Photo by kind courtesy of Walter Amoros and the International Potato Center, Lima, Peru.
B. Burlingame et al. / Journal of Food Composition and Analysis 22 (2009) 494–502500
they can make a significant contribution to the daily intake ofnitrate in the diet. For this reason, Ierna (2009) investigates theinfluence of potato variety and harvest date on tuber nitratecontent for off-season production in three varieties of potato,Arinda (mid-early), Spunta (mid-late) and Mondial (late).
While potatoes are an important source of carbohydrate, waysof reducing the glycaemic impact of potatoes is an importantresearch area. Monro et al. (2009) look at potato genotypedifferences in nutritionally distinct starch fractions after cooking,and cooking plus storing cool. Their results suggest that theglycaemic impact of some potatoes may be substantially reducedby cool-storing after cooking. Djabali et al. (2009) look at therelationship between potato starch isolation methods and kineticparameters of hydrolysis by free and immobilised a-amylase.
With agricultural research becoming increasingly targetedtowards improving human nutrition, understanding the foodconsumption habits of populations is essential for orientingresearch. This subject is addressed by Rose et al. (2009), whocombine food composition with household expenditure data inorder to understand the role of potatoes in the Peruvian diet.
5. Conclusion
The compositional data for varieties of potatoes shown in thisreview and in the new papers presented in this Special Issue of theJournal of Food Composition and Analysis, illustrate the impor-tance of the potato from a genetic resource perspective. As withmany species of foods, varietal differences are often significant,
B. Burlingame et al. / Journal of Food Composition and Analysis 22 (2009) 494–502 501
making a compelling case for food composition databases andother sources of nutrient data, to be conscientious in developingsampling strategies, in documenting the food sample, and inreporting compositional data at the level of the variety. Thisapproach was adopted by the International Rice Commission (IRC),as follows (FAO, 2002):
� Existing biodiversity of rice varieties and their nutritionalcomposition need to be explored before engaging in transgenics.� Nutrient content needs to be among the criteria in cultivar
promotion.� Cultivar-specific nutrient analysis and data dissemination should
be systematically undertaken.
These endorsements by the IRC represent a useful model that can beused for all food crops, including potatoes. When nutritionallysignificant differences within the species are recognized, then it isclear that the potato is actually many different hidden treasures.
References
Andersen, A.W., Tong, C.B.S., Kruege, D.E., 2002. Comparison of periderm color andanthocyanins of four red potato varieties. American Journal of Potato Research79, 249–253.
Andre, C.M., Ghislain, M., Bertin, P., Oufir, M., del Rosario Herrera, M., Hoffmann, L.,Hausman, J.F., Larondelle, Y., Evers, D., 2007a. Andean potato cultivars (Solanumtuberosum L.) as a source of antioxidant and mineral micronutrients. Journal ofagricultural and food chemistry 55 (2), 366–378.
Andre, C.M., Oufir, M., Guignard, C., Hoffmann, L., Hausman, J.F., Evers, D., Laron-delle, Y., 2007b. Antioxidant profiling of native Andean potato tubers (Solanumtuberosum L.) reveals cultivars with high levels of b-carotene, a-tocopherol,chlorogenic acid, and petanin. Journal of agricultural and food chemistry 55(26), 10839–10849.
Andre, C.M., Oufir, M., Hoffmann, L., Hausman, J.-F., Rogez, H., Larondelle, Y., Evers,D., 2009. Influence of environment and genotype on polyphenol compoundsand in vitro antioxidant capacity of native Andean potatoes (Solanum tuberosumL.). Journal of Food Composition and Analysis 22, 517–524.
Augustin, J., Johnson, S.R., Teitzel, C., True, R.H., Hogan, J.M., Toma, R.B., Shaw, R.L.,Deutsch, R.M., 1978. Changes in nutrient composition of potatoes during homepreparation: II. Vitamins. American Potato Journal 55, 653–662.
Bacigalupo, M.A., Longhi, R., Meroni, G., 2004. Alpha-solanine and alpha-chaconineglycoalkaloid assay in Solanum tuberosum extracts by liposomes and time-resolved fluorescence. Journal of Food Composition and Analysis 17, 665–673.
Bonierbale, M., Gruneberg, W., Amoros, W., Burgos, G., Salas, E., Porras, E., Felde, T.,2009. Total and individual carotenoid profiles in Solanum phureja cultivatedpotatoes: II. Development and application of near-infrared reflectance spectro-scopy (NIRS) calibrations for germplasm characterization. Journal of FoodComposition and Analysis 22, 509–516.
Breithaupt, D.E., Bamedi, A., 2002. Carotenoids and carotenoid esters in potatoes(Solanum tuberosum L.): new insights into an ancient vegetable. Journal ofagricultural and food chemistry 50 (24), 7175–7181.
Brown, C.R., Durst, R.W., Wrolstad, R., De Jong, W., 2008. Variability of phytonutrientcontent of potato in relation to growing location and cooking method. PotatoResearch 51, 259–270.
Brown, C.R., 2006. Anthocyanin and carotenoid contents in potato: breeding for thespecialty market. Proceedings of Idaho Winter Commodity Schools 39, 157–163.
Brown, C.R., Culley, D., Yang, C., Navarre, D.A., February 4–6, 2003. Breeding potatowith high carotenoid content. In: Proceedings Washington State Potato con-ference, Moses Lake, WA, pp. 23–26.
Brown, C.R., 2008. Breeding for phytonutrient enhancement of potato. AmericanJournal of Potato Research 85, 298–307.
Buono, V., Paradiso, A., Serio, F., Gonnella, M., De Gara, L., Santamaria, P., 2009.Tuber quality and nutritional components of ‘‘early’’ potato subjected tochemical haulm desiccation. Journal of Food Composition and Analysis 22,556–562.
Burgos, G., Amoros, W., Morote, M., Stangoulis, J., Bonierbale, M., 2007. Iron and zincconcentration of native Andean potato cultivars from a human nutritionperspective. Journal of the Science of Food and Agriculture 87, 668–675.
Burgos, G., Auqui, S., Amoros, W., Salas, E., Bonierbale, M., 2009a. Ascorbic acidconcentration of native Andean potato varieties as affected by environment,cooking and storage. Journal of Food Composition and Analysis 22, 533–538.
Burgos, G., Salas, E., Amoros, W., Auqui, M., Munoa, L., Kimura, M., Bonierbale, M.,2009b. Total and individual carotenoid profiles Solanum phureja cultivatedpotatoes: I. Concentrations and relationships as determined by spectrophoto-metry and HPLC. Journal of Food Composition and Analysis 22, 503–508.
Burgos, G., de Haan, S., Salas, E., Bonierbale, M., 2009c. Protein, iron, zinc andcalcium concentrations of potatoes following traditional processing as chuno.Journal of Food Composition and Analysis 22, 617–619.
Cambie, R.C., Ferguson, L.R., 2003. Potential functional foods in the traditional Maoridiet. Mutation Research 523–524, 109–117.
Campos, D., Noratto, G., Chirinos, R., Arbizu, C., Roca, W., Cisneros-Zevallos, l., 2006.Antioxidant capacity and secondary metabolites in four species of Andean tubercrops: native potato (Solanum sp.), mashua (Tropaeolum tuberosum Ruiz &Pavon), Oca (Oxalis tuberosa Molina) and ulluco (Ullucus tuberosus Caldas).Journal of the Science of Food and Agriculture 86, 1481–1488.
Casanas Rivero, R., Rodrıguez Rodrıguez, E., Dıaz Romero, C., 2003a. Effects ofcurrent storage conditions on nutrient retention in several varieties of potatoesfrom Tenerife. Food Chemistry 80, 445–450.
Casanas Rivero, R., Suarez Hernanuez, P., Rodrıguez Rodrıguez, E.M., Darias Martın,J., Dıaz Romero, C., 2003b. Mineral concentrations in cultivars of potatoes. FoodChemistry 83, 247–325.
Casanas Rivero, R., Gonzalez, M., Rodrıguez, E., Marrero, A., Dıaz, C., 2002. Chemo-metric Studies of Chemical Compounds in Five Cultivars of Potatoes fromTenerife. Journal of agricultural and food chemistry 50 (7), 2076–2082.
Chatterjee, C., Gopal, R., Dube, B.K., 2006. Impact of iron stress on biomass, yield,metabolism and quality of potato (Solanum tuberosum L.). Scientia Horticulturae108, 1–6.
Chun, J., Lee, J., Ye, L., Exler, J., Eitenmiller, R.R., 2006. Tocopherol and tocotrienolcontents of raw and processed fruits and vegetables in the United States diet.Journal of Food Composition and Analysis 19, 196–204.
Cieslik, E., Sikora, E., 1998. Correlation between the levels of nitrates and nitrites andthe contents of potassium, calcium and magnesium in potato tubers. FoodChemistry (4), 525–528.
Codex Alimentarius, 2007. Food Labeling, 5th edition. WHO and FAO, Rome, ftp://ftp.fao.org/codex/Publications/Booklets/Labelling/Labelling_2007_EN.pdf.Accessed 2009-09-09.
del Mar Verde Mendez, C., Rodrıguez Delgado, M.A., Rodrıguez Rodrıguez, E.M., DıazRomero, C., 2004. Content of free phenolic compounds in cultivars of potatoesharvested in Tenerife (Canary Islands). Journal of agricultural and food chem-istry 52 (5), 1323–1327.
Delaplace, P., Rojas-Beltran, J., Frettinger, P., du Jardin, P., Fauconnier, M.L., 2008.Oxylipin profile and antioxidant status of potato tubers during extendedstorage at room temperature. Plant Physiology and Biochemistry 46 (12),1077–1084.
Desborough, S.L., Weiser, C.J., 1974. Improving potato protein. I. Evaluation ofselection techniques. American Potato Journal 51, 185–196.
Djabali, D., Belhaneche, N., Nadjemi, B., Dulong, V., Picton, L., 2009. Relationshipbetween potato starch isolation methods and kinetic parametersof hydrolysisby free and immobilised a-amylase on alginate (from Laminaria digitata algae).Journal of Food Composition and Analysis 22, 563–570.
Donnelly, A., Lawson, T., Craigon, J., Black, C.R., Colls, J.J., Landon, G., 2001. Effects ofelevated CO2 and O3 on tuber quality in potato (Solanum tuberosum L.). Agri-culture, Ecosystems & Environment 87, 273–285.
FAO, 2002. Report of the International Rice Commission 20th Session (23–26 July2002, Bangkok), FAO, Rome.
FAO, 2008. Potato and Biodiversity. International Year of the Potato. http://www.potato2008.org/en/potato/biodiversity.html (Accessed 2009/02/01).
FAO, 2009a. FAO Statistical Databases, Supply Utilization Accounts. http://faostat.fao.org/ (Accessed 2009/02/01).
FAO, 2009b. Food composition database of potato varieties (http://www.fao.org/infoods/index_en.stm).
Finotti, E., Bertone, A., Vivanti, V., 2006. Balance between nutrients and anti-nutrients in nine Italian potato cultivars. Food Chemistry 99, 698–701.
Friedman, M., Roitman, J.N., Kozukue, N., 2003. Glycoalkaloid and calysteginecontents of eight potato cultivars. Journal of Agricultural and Food Chemistry51 (10), 2964–2973.
Groza, H.I., Bowen, B.D., Kichefski, D., Peloquin, S.J., Stevenson, W.R., Bussan, A.J.,Jiang, J., 2005. Millennium russet: a dual purpose russet potato variety. Amer-ican Journal of Potato Research 82, 211–219.
Hajslova, J., Schulzova, V., Slanina, P., Janne, K., Hellenas, K.E., Anderssonet, C.H.,2005. Quality of organically and conventionally grown potatoes: four-yearstudy of micronutrients, metals, secondary metabolites, enzymic browningand organoleptic properties. Food additives and contaminants 22, 514–534.
Hale, A.L., 2003. Screening potato genotypes for antioxidant activity, identificationof the responsible compounds, and differentiating Russet Norkotah strainsusing aflp and microsatellite marker analysis. PhD Thesis, Dissertation TexasA&M University, USA. http://repository.tamu.edu/handle/1969.1/1602.
Hale, A.L., Reddivari, L., Nzaramba, M.N., Bamberg, J.B., Miller Jr., J.C., 2008. Inter-specific variability for antioxidant activity and phenolic content among Solanumspecies. American Journal of Potato Research 85, 332–341.
Han, J.S., Kozukue, N., Young, K.S., Lee, K.R., Friedman, M., 2004. Distribution ofascorbic acid in potato tubers and in home-processed and commercial potatofoods. Journal of Agricultural and Food Chemistry 52 (21), 6516–6521.
HEHA, 2009. Healthy eating–healthy action. New Zealand Ministry of Health. http://www.heha.org.nz/content/716/new-baked-potato-campaign/ (Accessed 2009-08-08).
Ierna, A., 2009. Influence of harvest date on nitrate contents of three potato varietiesfor off-season production. Journal of Food Composition and Analysis 22, 551–555.
Im, H.W., Suh, B.S., Lee, S.U., Kozukue, N., Ohnisi-Kameyama, M., Levin, C.E., Fried-man, M., 2008. Analysis of phenolic compounds by high-performance liquidchromatography and liquid chromatography/mass spectrometry in potatoplant flowers, leaves, stems, and tubers and in home-processed potatoes.Journal of Agricultural and Food Chemistry 56 (9), 3341–3349.
Jimenez, M.E., Rossi, A.M., Samman, N.C., 2009. Phenotypic, agronomic, nutritionalcharacteristics of seven varieties of Andean potatoes. Journal of Food Composi-tion and Analysis 22, 613–616.
B. Burlingame et al. / Journal of Food Composition and Analysis 22 (2009) 494–502502
Kalogeropoulos, N., Mylona, A., Chiou, A., Ioannou, M.S., Andrikopoulos, N.K., 2007.Retention and distribution of natural antioxidants (a-tocopherol, polyphenolsand terpenic acids) after shallow frying of vegetables in virgin olive oil. LWT –Food Science and Technology 40, 1008–1017.
Konschuh, M., McAllister, T., Dalpe, S., Lewis, T., Driedger, D., Janssen, N., Chen, Q.,2005. Assessment of carotenoid content of yellow-fleshed potato varietiesgrown in Alberta to determine potential nutritional benefits. Government ofAlberta, Agiculture and Rural Development. Project 2004-08.
Konschuh, M., McAllister, T., Driedger, D., 2007. Lutein content of yellow-fleshedpotatoes grown in Alberta. Retrieved 01 July 2009 from http://www1.agric.gov.ab.ca/$department/deptdocs.nsf/all/opp11915/ (‘‘Follow link for the final ver-sion of the report’’).
Knuthsen, P., Jensen, U., Schmidt, B., Larsen, I.K., 2009. Glycoalkaloids in potatoes:content of glycoalkaloids in potatoes for consumption. Jornal of Food Composi-tion and Analysis 22, 577–581.
Lewis, C.E., Walkel, J.R.L., Lancaster, J.E., Sutton, K.H., 1998. Determination of antho-cyanins, flavonoids and phenolic acids in potatoes. I: Coloured cultivars ofSolanum tuberosum L. Journal of The Science of Food and Agriculture 77, 45–57.
Linnemann, A.R., van Es, A., Hartmans, K.J., 1985. Changes in the content of L-ascorbic acid, glucose, fructose, sucrose and total glycoalkaloids in potatoes (cv.Bintje) stored at 7, 16 and 28 8C. Potato Research 28, 271–278.
Lu, W.H., Haynes, K., Wiley, E., Clevidence, B., 2001. Carotenoid content and color indiploid potatoes. Journal of the American Society for Horticultural Science 126,722–726.
Majcher, M., Jelen, H.H., 2009. Comparison of suitability of SPME, SAFE and SDEmethods for isolation of flavour compounds from extruded potato snacks.Journal of Food Composition and Analysis 22, 606–612.
Monro, J., Mishra, S., Blandford, E., Anderson, J., Genet, G., 2009. Potato genotypedifferences in nutritionally distinct starch fractions after cooking, and cookingplus storing cool. Journal of Food Composition and Analysis 22, 539–545.
Mullin, W.J., Wolynetz, M.S., Emery, J.P., Brooks, L., 1993. The effect of variety,growing location, and storage on the dietary fiber content of potatoes. Journal ofFood Composition and Analysis 6, 316–323.
Negi, P.S, Nath, N., 2002. Effect of partial dehydration on quality of canned potatoes.European Food Research and Technology 215, 231–234.
Nisha, P., Singhal, R.S., Pandit, A.B., 2009. A study on degradation kinetics of niacin inpotato (Solanum tuberosum L.). Journal of Food Composition and Analysis 22,620–624.
Phillippy, B.Q., Lin, M., Rasco, B., 2004. Analysis of phytate in raw and cookedpotatoes. Journal of Food Composition and Analysis 17, 217–226.
Ritter, E., Barandalla, L., Lopez, R., Ruiz de Galarreta, J.I., 2008. Exploitation of exotic,cultivated solanum germplasm for breeding and commercial purposes. PotatoResearch 51, 301–311.
Rodriguez-Saona, L.E., Wrolstad, R.E., 1997. Influence of potato composition on chipcolor quality. American Potato Journal 74, 87–106.
Romani, S., Bacchiocca, M., Rocculi, P., Dalla Rosa, M., 2009. Influence of fryingconditions on acrylamide content and other quality characteristics of Frenchfries. Journal of Food Composition and Analysis 22, 582–588.
Rose, D., Burgos, G., Bonierbale, M., Thiele, G., 2009. Understanding the role ofpotatoes in the Peruvian diet: An approach that combines food composition
with household expenditure data. Journal of Food Composition and Analysis 22,525–532.
Rumbaoa, R.G.O., Cornago, D.F., Geronimo, I.M., 2009. Phenolic content and anti-oxidant capacity of Philippine potato (Solanum tuberosum) tubers. Journal ofFood Composition and Analysis 22, 546–550.
Sarquis, J.I., Coria, N.A., Aguilar, I., Rivera, A., 2000. Glycoalkaloid content insolanum species and hybrids from a breeding program for resistance to lateblight (Phytophthora infestans). American Journal of Potato Research 77,295–302.
Sengul, M., Keles, F., Keles, M.S., 2004. The effect of storage conditions (temperature,light, time) and variety on the glycoalkaloid content of potato tubers andsprouts. Food Control 15 (2004), 281–286.
Serpen, A., Gokmen, V., 2009. Evaluation of the Maillard reaction in potato crisps byacrylamide, antioxidant capacity and color. Journal of Food Composition andAnalysis 22, 589–595.
Shiroma, C., Rodriguez-Saona, L., 2009. Application of NIR and MIR spectroscopy inquality control of potato chips. Journal of Food Composition and Analysis 22,596–605.
Sikora, E., Cieslik, E., 1999. Correlation between the levels of nitrates and nitrites andthe contents of iron, copper and manganese in potato tubers. Food Chemistry67, 301–304.
Thompson, M.D., Thompson, H.J., McGinley, J.N., Neil, E.S., Rush, D.K., Holm, D.G.,Stushnoff, C., 2009. Functional food characteristics of potato cultivars (Solanumtuberosum L.): phytochemical composition and inhibition of 1-methyl-1-nitro-sourea induced breast cancer in rats. Journal of Food Composition and Analysis22, 571–576.
Thybo, A.K., Bechmann, I.E., Martens, M., Engelsen, S.B., 2000. Prediction of sensorytexture of cooked potatoes using uniaxial compression, near infrared spectro-scopy and low field 1H NMR spectroscopy. Lebensmittel-Wissenschaft und-Technologie 33, 103–111.
Toledo, A., Burlingame, B., 2006. Biodiversity and nutrition: a common path towardglobal food security and sustainable development. Journal of Food Compositionand Analysis 19 (6-7), 477–483.
Toma, R., Augustin, J., True, R.H., Hogan, J.M., Shaw, R.L., 1979. Changes in thenutrient composition of potatoes during home preparation. I. Proximate com-position. American Potato Journal 639–645.
Tudela, J.A., Espın, J.C., Gil, M.I., 2002. Vitamin C retention in fresh-cut potatoes.Postharvest Biology and Technology 26, 75–84.
US Potato Board, 2009a. Goodness Unearthed. http://www.healthypotato.com/mediaDetail.php?id=19 (Accessed 2009/08/01).
US Potato Board, 2009b. Healthy Mr Potato Head. http://www.uspotatoes.com/310potatohead.html (Accessed 2009/08/01).
US Potato Board, 2009c. Talking about Potato Nutrition. http://www.uspotatoes.com/downloads/USPB_Nutrition_Messages.pdf (Accessed 2009-08-01).
Vigue, J., Li, P.H., 1975. Correlation between methods to determine the proteincontent of potato tubers. Horticultural Science 10, 625–627.
Zhang, L., Porter, G.A., Bushway, R.J., 1997. Ascorbic acid and glycoalkaloidcontent of Atlantic and Superior potato tubers as affected by supplementalirrigation and soil amendments. American Journal of Potato Research 74 (5),285–304.