Embed Size (px)
Citation preview
G E O S C I E N C E A U S T R A L I A
Ralf R. Haese, Emma J. Murray and Luke Wallace
APPLYING GEOSCIENCE TO AUSTR ALIA’S MOST IMPORTANT CHALLENGES
Record
2009/19
Nutrient sources, water quality and
biogeochemical processes in the
Coorong, South Australia
GeoCat # 68643
Nutrient sources, water quality, and biogeochemical processes in the Coorong, South Australia GEOSCIENCE AUSTRALIA RECORD 2009/19 by Ralf R. Haese1, Emma J. Murray1 and Luke Wallace1
1. Marine and Coastal Environment Group, Geoscience Australia, GPO Box 378, Canberra ACT 2601
Department of Resources, Energy & Tourism Minister for Resources, Energy & Tourism: The Hon. Martin Ferguson, AM MP Secretary: Mr John Pierce Geoscience Australia Chief Executive Officer: Dr Neil Williams PSM © Commonwealth of Australia, 2009 This work is copyright. Apart from any fair dealings for the purpose of study, research, criticism, or review, as permitted under the Copyright Act 1968, no part may be reproduced by any process without written permission. Copyright is the responsibility of the Chief Executive Officer, Geoscience Australia. Requests and enquiries should be directed to the Chief Executive Officer, Geoscience Australia, GPO Box 378 Canberra ACT 2601. Geoscience Australia has tried to make the information in this product as accurate as possible. However, it does not guarantee that the information is totally accurate or complete. Therefore, you should not solely rely on this information when making a commercial decision. ISSN 1448-2177 ISBN 978-1-921498-78-7 (web) 978-1-921498-79-4 (print) GeoCat # 68643 Bibliographic reference: Haese, R.R, Murray, E.J., and Wallace, L. 2009. Nutrient sources, water quality, and biogeochemical processes in the Coorong, South Australia. Geoscience Australia Record 2009/19, Commonwealth Government, Canberra, 32pp.
Cover photographs: Large photo: Water sampling in the Coorong Small photos (from left to right): Tubeworm colonies building carbonate concretions Groundwater seepage meters in shallow water Tufa concretions
Nutrient sources, water quality, and biogeochemical processes in the Coorong, South Australia
iii
Contents Contents ............................................................................................................................................. iii Foreword ............................................................................................................................................iv Acknowledgements .............................................................................................................................v Executive Summary...........................................................................................................................vi 1. ................................................................................................................................1 Introduction
1.1. Hydrogeology of the Coorong and Lower Lakes Region ..........................................................4 2. .....................................................................................................6 Methods and Sampling Sites
2.1. Sampling sites and times............................................................................................................6 2.2. Measurements of groundwater discharge and the hydraulic head .............................................6 2.3. Measurements of benthic nutrient (NH , NO , PO , Si) and gas (O , DIC) fluxes4
+x 4
3-2 ..............6
2.4. Measurements of photosynthesis rates in the water column ......................................................7 2.5. Analysis of nutrients, gases, and salinity ...................................................................................7
3. .........................................................................................................................................8 Results3.1. Field observations related to groundwater discharge.................................................................8 3.2. Nutrients associated with groundwater discharge....................................................................11 3.3. Water quality in the lagoon......................................................................................................12
3.3.1. Salinity ..............................................................................................................................12 3.3.2. Nutrients............................................................................................................................13 3.3.3. Alkalinity ..........................................................................................................................16
3.4. Syringe incubations..................................................................................................................19 3.5. Benthic chamber incubations ...................................................................................................22
4. ....................................................................................................26 Discussion and Conclusions4.1. Water quality............................................................................................................................26 4.2. Nutrient dynamics....................................................................................................................27
5. References.................................................................................................................................30
Nutrient sources, water quality, and biogeochemical processes in the Coorong, South Australia
Foreword The environmental assets of the Coorong, Lower Lakes and Murray Mouth (CLLAMM) region in South Australia are currently under threat as a result of ongoing changes in the hydrological regime of the River Murray, at the end of the Murray-Darling Basin. While a number of initiatives are underway to halt or reverse this environmental decline, rehabilitation efforts are hampered by the lack of knowledge about the links between flows and ecological responses in the system. The CLLAMM program is a collaborative research effort that aims to produce a decision-support framework for environmental flow management for the region. This involves research to understand the links between the key ecosystem drivers for the region (such as water level and salinity) and key ecological processes (generation of bird habitat, fish recruitment, etc). A second step involves the development of tools to predict how ecological communities respond to manipulations of the “management levers” for environmental flows in the region. These levers include flow releases from upstream reservoirs and the Upper South-East Drainage scheme, and dredging of the Murray Mouth. The framework aims to evaluate the environmental trade-offs for different scenarios of manipulation of management levers, as well as different future climate scenarios for the Murray-Darling Basin. One of the most challenging tasks in the development of the framework is predicting the response of ecological communities to future changes in environmental conditions in the CLLAMM region. This report by Geoscience Australia contributes to a better understanding of how the recycling of nutrients promotes the production of food resources for key fish and bird species in the Coorong. This work is done in collaboration with the CLLAMMecology Research Cluster, a partnership between CSIRO, the University of Adelaide, Flinders University and SARDI Aquatic Sciences to study ecological responses to environmental change in the Coorong. Additional reports relevant from the CLLAMM program and the CLLAMMecology Research Cluster can be found can be found at: http://www.csiro.au/partnerships/CLL AMMecologyCluster.html
iv
Nutrient sources, water quality, and biogeochemical processes in the Coorong, South Australia
Acknowledgements We are grateful for the smooth logistical and field support by Matthew Carey and the meticulous nutrient sample analysis by Ed Czobik from the Department of Environment and Climate Change, NSW. Janice Trafford and Chris Hepplewhite also provided support in the field and undertook important sample analysis at Geoscience Australia. We very much thank Lynda Radke for pore water studies, which remain inconclusive to date and require further investigations before publication. Last but not least, we want to thank Sébastien Lamontagne from CSIRO Land and Water for providing a seamless collaboration between the CLLAMMecology cluster, CSIRO, and Geoscience Australia. Sébastien Lamontagne (CSIRO) and Graham Logan (Geoscience Australia) are thanked for providing a critical review of this report.
v
Nutrient sources, water quality, and biogeochemical processes in the Coorong, South Australia
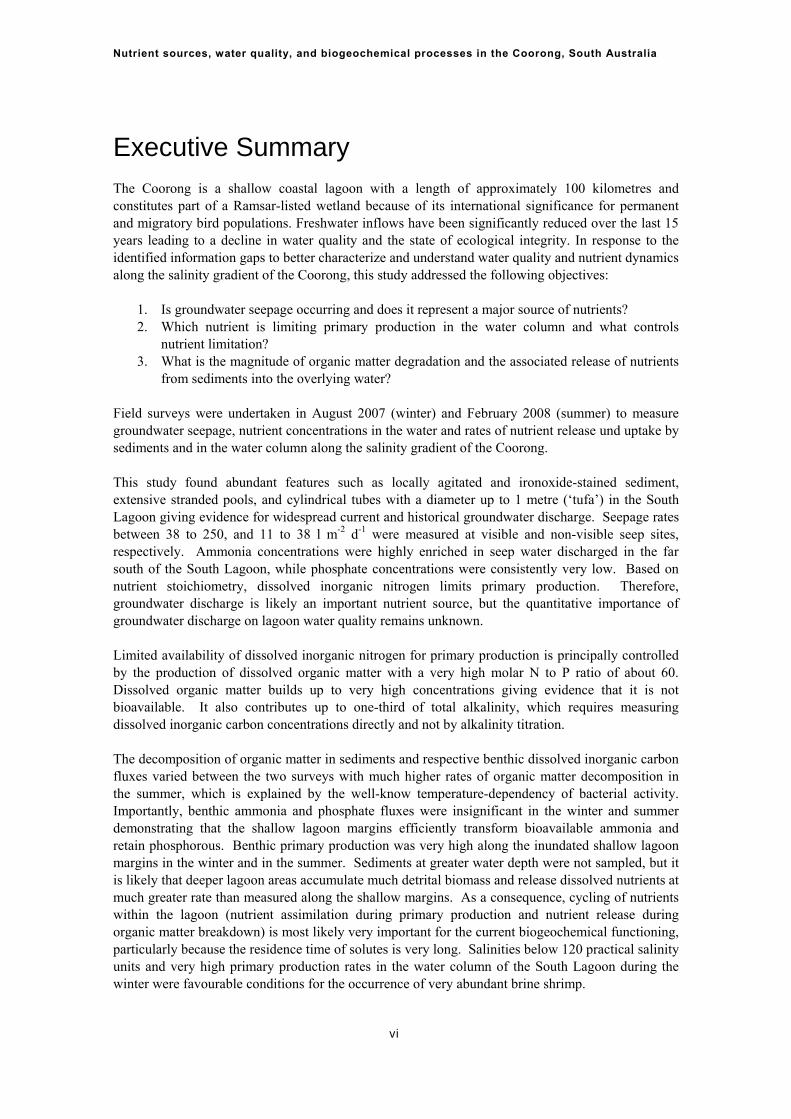
Executive Summary The Coorong is a shallow coastal lagoon with a length of approximately 100 kilometres and constitutes part of a Ramsar-listed wetland because of its international significance for permanent and migratory bird populations. Freshwater inflows have been significantly reduced over the last 15 years leading to a decline in water quality and the state of ecological integrity. In response to the identified information gaps to better characterize and understand water quality and nutrient dynamics along the salinity gradient of the Coorong, this study addressed the following objectives:
1. Is groundwater seepage occurring and does it represent a major source of nutrients? 2. Which nutrient is limiting primary production in the water column and what controls
nutrient limitation? 3. What is the magnitude of organic matter degradation and the associated release of nutrients
from sediments into the overlying water? Field surveys were undertaken in August 2007 (winter) and February 2008 (summer) to measure groundwater seepage, nutrient concentrations in the water and rates of nutrient release und uptake by sediments and in the water column along the salinity gradient of the Coorong. This study found abundant features such as locally agitated and ironoxide-stained sediment, extensive stranded pools, and cylindrical tubes with a diameter up to 1 metre (‘tufa’) in the South Lagoon giving evidence for widespread current and historical groundwater discharge. Seepage rates between 38 to 250, and 11 to 38 l m-2 d-1 were measured at visible and non-visible seep sites, respectively. Ammonia concentrations were highly enriched in seep water discharged in the far south of the South Lagoon, while phosphate concentrations were consistently very low. Based on nutrient stoichiometry, dissolved inorganic nitrogen limits primary production. Therefore, groundwater discharge is likely an important nutrient source, but the quantitative importance of groundwater discharge on lagoon water quality remains unknown. Limited availability of dissolved inorganic nitrogen for primary production is principally controlled by the production of dissolved organic matter with a very high molar N to P ratio of about 60. Dissolved organic matter builds up to very high concentrations giving evidence that it is not bioavailable. It also contributes up to one-third of total alkalinity, which requires measuring dissolved inorganic carbon concentrations directly and not by alkalinity titration. The decomposition of organic matter in sediments and respective benthic dissolved inorganic carbon fluxes varied between the two surveys with much higher rates of organic matter decomposition in the summer, which is explained by the well-know temperature-dependency of bacterial activity. Importantly, benthic ammonia and phosphate fluxes were insignificant in the winter and summer demonstrating that the shallow lagoon margins efficiently transform bioavailable ammonia and retain phosphorous. Benthic primary production was very high along the inundated shallow lagoon margins in the winter and in the summer. Sediments at greater water depth were not sampled, but it is likely that deeper lagoon areas accumulate much detrital biomass and release dissolved nutrients at much greater rate than measured along the shallow margins. As a consequence, cycling of nutrients within the lagoon (nutrient assimilation during primary production and nutrient release during organic matter breakdown) is most likely very important for the current biogeochemical functioning, particularly because the residence time of solutes is very long. Salinities below 120 practical salinity units and very high primary production rates in the water column of the South Lagoon during the winter were favourable conditions for the occurrence of very abundant brine shrimp.
vi
1
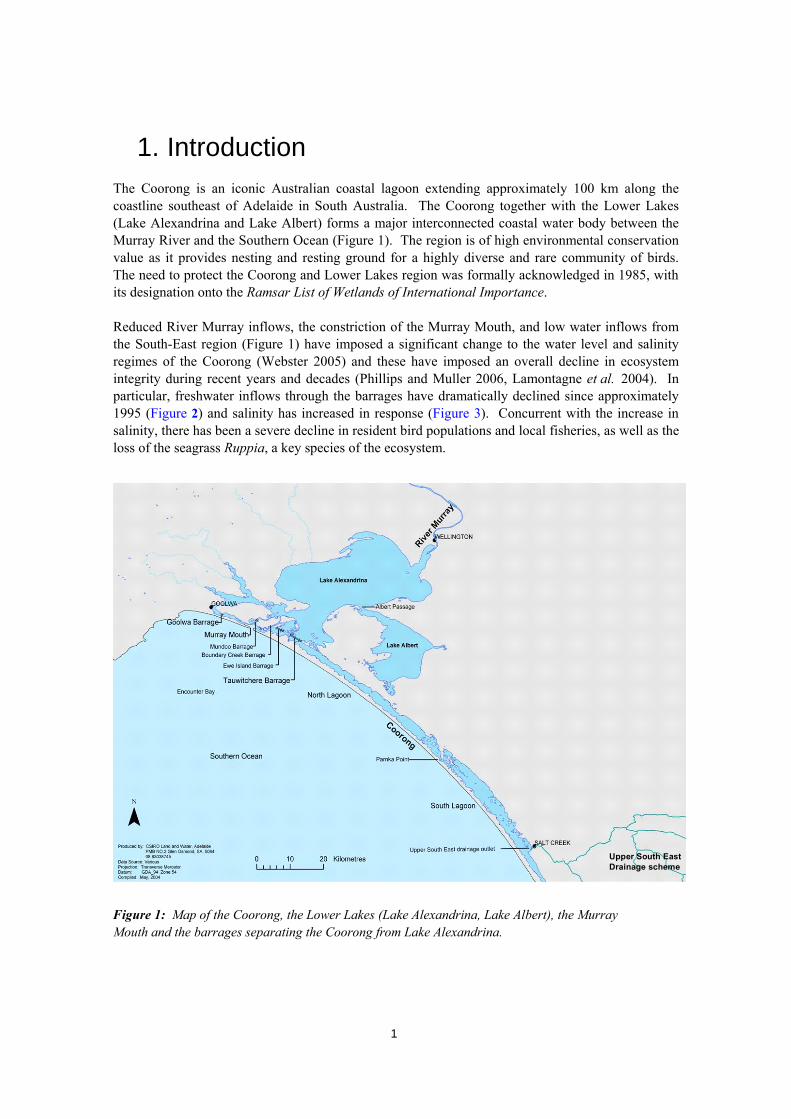
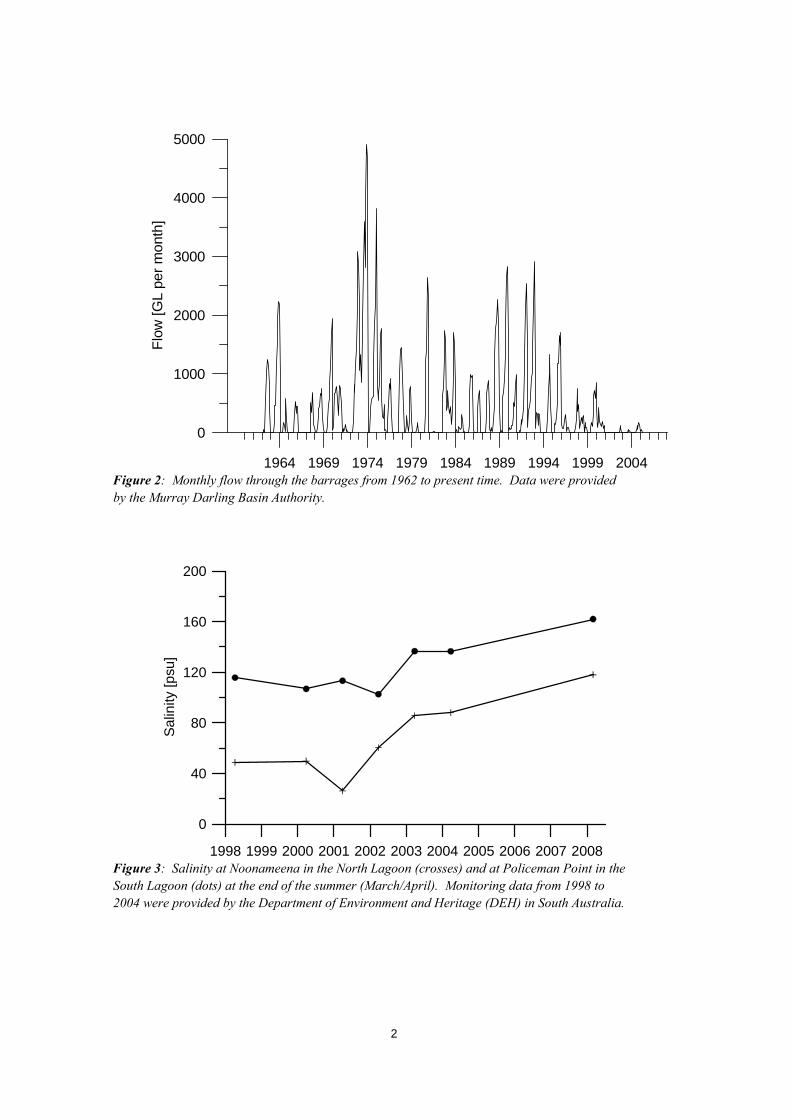
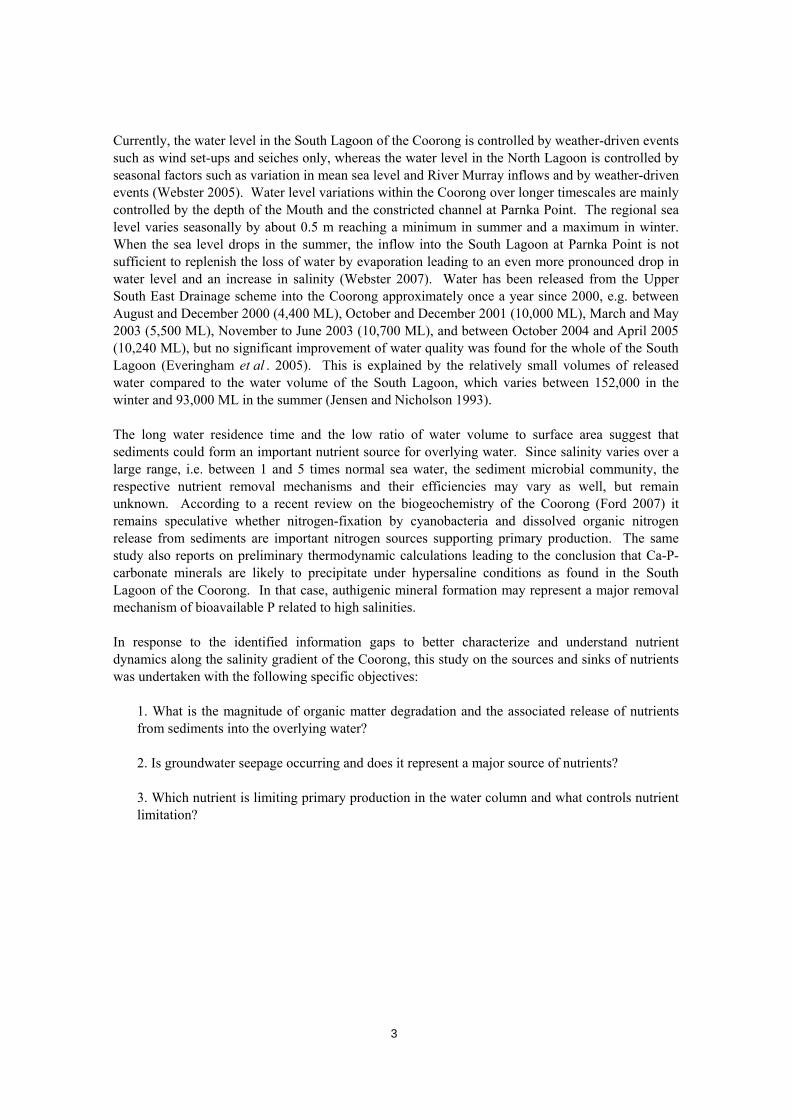
1. Introduction The Coorong is an iconic Australian coastal lagoon extending approximately 100 km along the coastline southeast of Adelaide in South Australia. The Coorong together with the Lower Lakes (Lake Alexandrina and Lake Albert) forms a major interconnected coastal water body between the Murray River and the Southern Ocean (Figure 1). The region is of high environmental conservation value as it provides nesting and resting ground for a highly diverse and rare community of birds. The need to protect the Coorong and Lower Lakes region was formally acknowledged in 1985, with its designation onto the Ramsar List of Wetlands of International Importance. Reduced River Murray inflows, the constriction of the Murray Mouth, and low water inflows from the South-East region (Figure 1) have imposed a significant change to the water level and salinity regimes of the Coorong (Webster 2005) and these have imposed an overall decline in ecosystem integrity during recent years and decades (Phillips and Muller 2006, Lamontagne et al. 2004). In particular, freshwater inflows through the barrages have dramatically declined since approximately 1995 (Figure 2) and salinity has increased in response (Figure 3). Concurrent with the increase in salinity, there has been a severe decline in resident bird populations and local fisheries, as well as the loss of the seagrass Ruppia, a key species of the ecosystem.
Upper South EastDrainage schemeUpper South EastDrainage scheme
Figure 1: Map of the Coorong, the Lower Lakes (Lake Alexandrina, Lake Albert), the Murray Mouth and the barrages separating the Coorong from Lake Alexandrina.
1964 1969 1974 1979 1984 1989 1994 1999 2004
0
1000
2000
3000
4000
5000F
low
[GL p
er
mont
h]
Figure 2: Monthly flow through the barrages from 1962 to present time. Data were provided by the Murray Darling Basin Authority.
1998 1999 2000 2001 2002 2003 2004 2005 2006 2007 2008
0
40
80
120
160
200
Sal
inity
[p
su]
Figure 3: Salinity at Noonameena in the North Lagoon (crosses) and at Policeman Point in the South Lagoon (dots) at the end of the summer (March/April). Monitoring data from 1998 to 2004 were provided by the Department of Environment and Heritage (DEH) in South Australia.
2
Currently, the water level in the South Lagoon of the Coorong is controlled by weather-driven events such as wind set-ups and seiches only, whereas the water level in the North Lagoon is controlled by seasonal factors such as variation in mean sea level and River Murray inflows and by weather-driven events (Webster 2005). Water level variations within the Coorong over longer timescales are mainly controlled by the depth of the Mouth and the constricted channel at Parnka Point. The regional sea level varies seasonally by about 0.5 m reaching a minimum in summer and a maximum in winter. When the sea level drops in the summer, the inflow into the South Lagoon at Parnka Point is not sufficient to replenish the loss of water by evaporation leading to an even more pronounced drop in water level and an increase in salinity (Webster 2007). Water has been released from the Upper South East Drainage scheme into the Coorong approximately once a year since 2000, e.g. between August and December 2000 (4,400 ML), October and December 2001 (10,000 ML), March and May 2003 (5,500 ML), November to June 2003 (10,700 ML), and between October 2004 and April 2005 (10,240 ML), but no significant improvement of water quality was found for the whole of the South Lagoon (Everingham et al . 2005). This is explained by the relatively small volumes of released water compared to the water volume of the South Lagoon, which varies between 152,000 in the winter and 93,000 ML in the summer (Jensen and Nicholson 1993). The long water residence time and the low ratio of water volume to surface area suggest that sediments could form an important nutrient source for overlying water. Since salinity varies over a large range, i.e. between 1 and 5 times normal sea water, the sediment microbial community, the respective nutrient removal mechanisms and their efficiencies may vary as well, but remain unknown. According to a recent review on the biogeochemistry of the Coorong (Ford 2007) it remains speculative whether nitrogen-fixation by cyanobacteria and dissolved organic nitrogen release from sediments are important nitrogen sources supporting primary production. The same study also reports on preliminary thermodynamic calculations leading to the conclusion that Ca-P-carbonate minerals are likely to precipitate under hypersaline conditions as found in the South Lagoon of the Coorong. In that case, authigenic mineral formation may represent a major removal mechanism of bioavailable P related to high salinities. In response to the identified information gaps to better characterize and understand nutrient dynamics along the salinity gradient of the Coorong, this study on the sources and sinks of nutrients was undertaken with the following specific objectives:
1. What is the magnitude of organic matter degradation and the associated release of nutrients from sediments into the overlying water? 2. Is groundwater seepage occurring and does it represent a major source of nutrients? 3. Which nutrient is limiting primary production in the water column and what controls nutrient limitation?
3
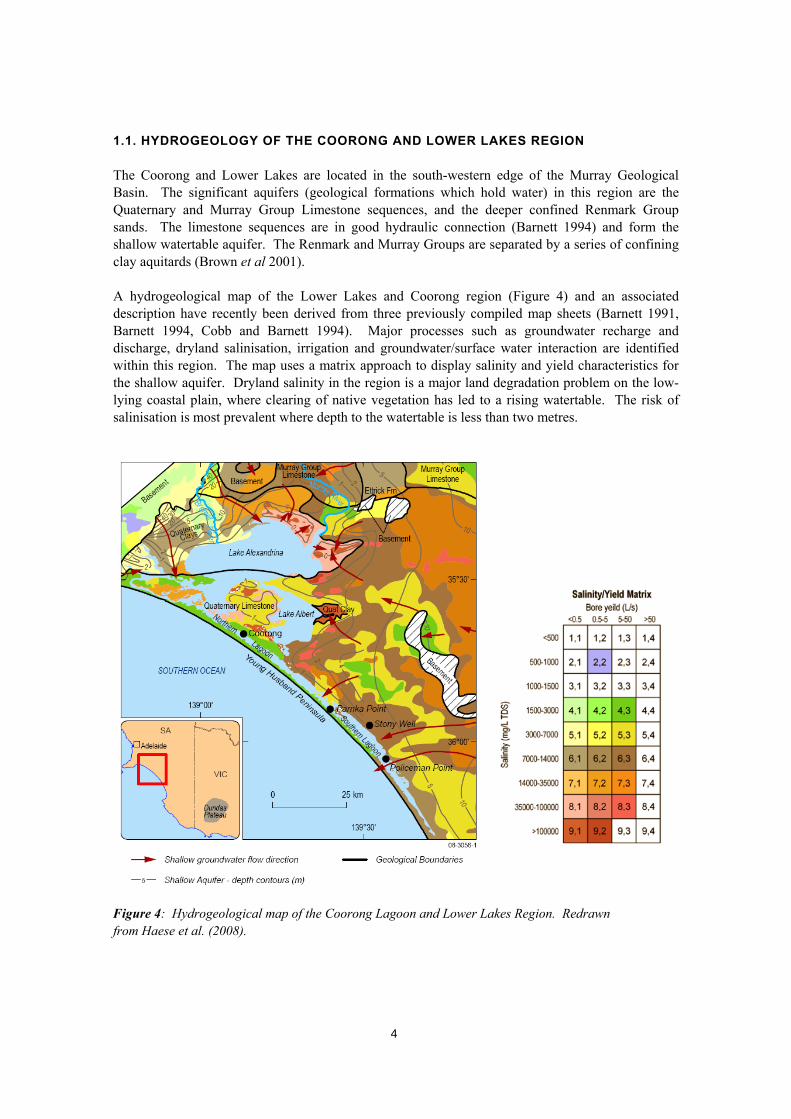
1.1. HYDROGEOLOGY OF THE COORONG AND LOWER LAKES REGION The Coorong and Lower Lakes are located in the south-western edge of the Murray Geological Basin. The significant aquifers (geological formations which hold water) in this region are the Quaternary and Murray Group Limestone sequences, and the deeper confined Renmark Group sands. The limestone sequences are in good hydraulic connection (Barnett 1994) and form the shallow watertable aquifer. The Renmark and Murray Groups are separated by a series of confining clay aquitards (Brown et al 2001). A hydrogeological map of the Lower Lakes and Coorong region (Figure 4) and an associated description have recently been derived from three previously compiled map sheets (Barnett 1991, Barnett 1994, Cobb and Barnett 1994). Major processes such as groundwater recharge and discharge, dryland salinisation, irrigation and groundwater/surface water interaction are identified within this region. The map uses a matrix approach to display salinity and yield characteristics for the shallow aquifer. Dryland salinity in the region is a major land degradation problem on the low-lying coastal plain, where clearing of native vegetation has led to a rising watertable. The risk of salinisation is most prevalent where depth to the watertable is less than two metres.
Figure 4: Hydrogeological map of the Coorong Lagoon and Lower Lakes Region. Redrawn from Haese et al. (2008).
4
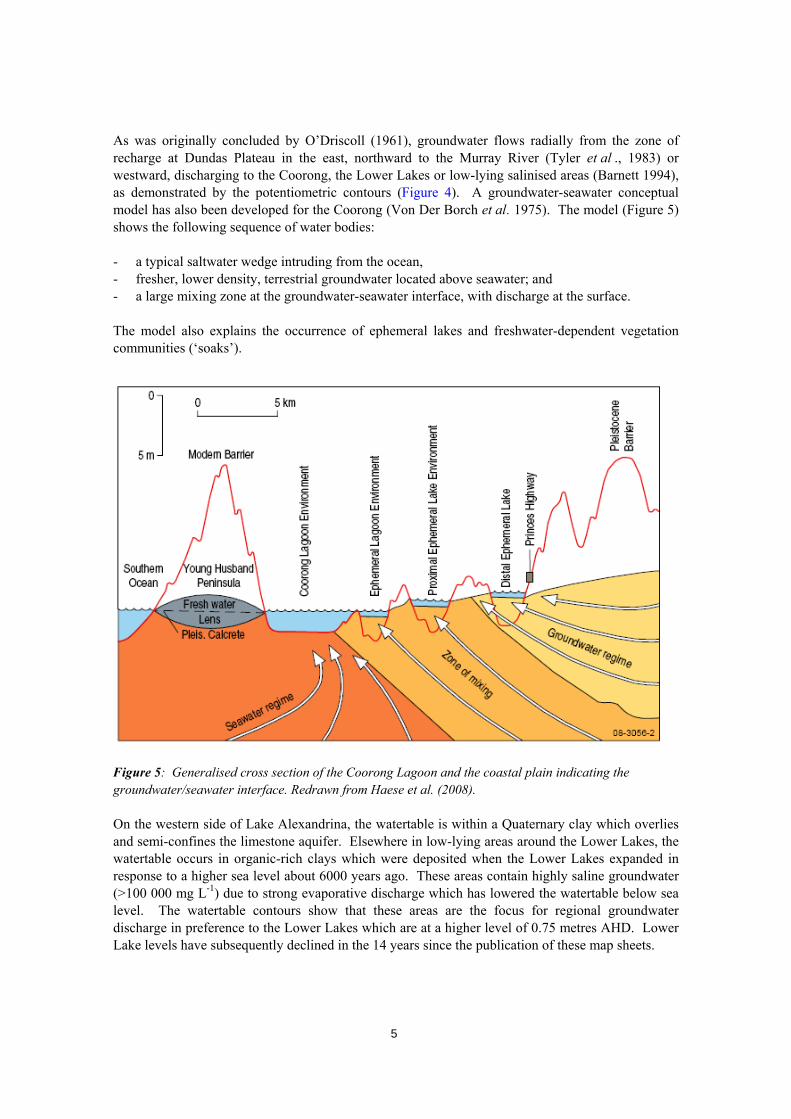
As was originally concluded by O’Driscoll (1961), groundwater flows radially from the zone of recharge at Dundas Plateau in the east, northward to the Murray River (Tyler et al ., 1983) or westward, discharging to the Coorong, the Lower Lakes or low-lying salinised areas (Barnett 1994), as demonstrated by the potentiometric contours (Figure 4). A groundwater-seawater conceptual model has also been developed for the Coorong (Von Der Borch et al. 1975). The model (Figure 5) shows the following sequence of water bodies: - a typical saltwater wedge intruding from the ocean, - fresher, lower density, terrestrial groundwater located above seawater; and - a large mixing zone at the groundwater-seawater interface, with discharge at the surface. The model also explains the occurrence of ephemeral lakes and freshwater-dependent vegetation communities (‘soaks’).
Figure 5: Generalised cross section of the Coorong Lagoon and the coastal plain indicating the groundwater/seawater interface. Redrawn from Haese et al. (2008). On the western side of Lake Alexandrina, the watertable is within a Quaternary clay which overlies and semi-confines the limestone aquifer. Elsewhere in low-lying areas around the Lower Lakes, the watertable occurs in organic-rich clays which were deposited when the Lower Lakes expanded in response to a higher sea level about 6000 years ago. These areas contain highly saline groundwater (>100 000 mg L-1) due to strong evaporative discharge which has lowered the watertable below sea level. The watertable contours show that these areas are the focus for regional groundwater discharge in preference to the Lower Lakes which are at a higher level of 0.75 metres AHD. Lower Lake levels have subsequently declined in the 14 years since the publication of these map sheets.
5
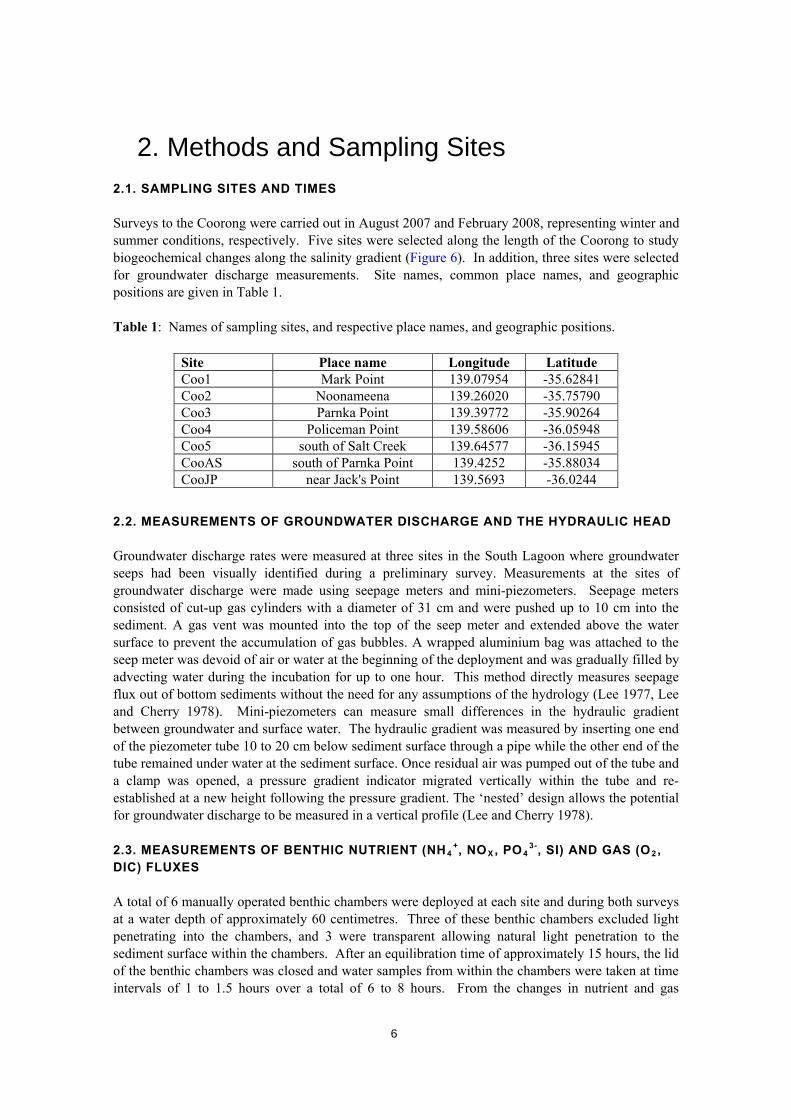
2. Methods and Sampling Sites 2.1. SAMPLING SITES AND TIMES Surveys to the Coorong were carried out in August 2007 and February 2008, representing winter and summer conditions, respectively. Five sites were selected along the length of the Coorong to study biogeochemical changes along the salinity gradient (Figure 6). In addition, three sites were selected for groundwater discharge measurements. Site names, common place names, and geographic positions are given in Table 1. Table 1: Names of sampling sites, and respective place names, and geographic positions.
Site Place name Longitude Latitude Coo1 Mark Point 139.07954 -35.62841 Coo2 Noonameena 139.26020 -35.75790 Coo3 Parnka Point 139.39772 -35.90264 Coo4 Policeman Point 139.58606 -36.05948 Coo5 south of Salt Creek 139.64577 -36.15945 CooAS south of Parnka Point 139.4252 -35.88034 CooJP near Jack's Point 139.5693 -36.0244
2.2. MEASUREMENTS OF GROUNDWATER DISCHARGE AND THE HYDRAULIC HEAD Groundwater discharge rates were measured at three sites in the South Lagoon where groundwater seeps had been visually identified during a preliminary survey. Measurements at the sites of groundwater discharge were made using seepage meters and mini-piezometers. Seepage meters consisted of cut-up gas cylinders with a diameter of 31 cm and were pushed up to 10 cm into the sediment. A gas vent was mounted into the top of the seep meter and extended above the water surface to prevent the accumulation of gas bubbles. A wrapped aluminium bag was attached to the seep meter was devoid of air or water at the beginning of the deployment and was gradually filled by advecting water during the incubation for up to one hour. This method directly measures seepage flux out of bottom sediments without the need for any assumptions of the hydrology (Lee 1977, Lee and Cherry 1978). Mini-piezometers can measure small differences in the hydraulic gradient between groundwater and surface water. The hydraulic gradient was measured by inserting one end of the piezometer tube 10 to 20 cm below sediment surface through a pipe while the other end of the tube remained under water at the sediment surface. Once residual air was pumped out of the tube and a clamp was opened, a pressure gradient indicator migrated vertically within the tube and re-established at a new height following the pressure gradient. The ‘nested’ design allows the potential for groundwater discharge to be measured in a vertical profile (Lee and Cherry 1978). 2.3. MEASUREMENTS OF BENTHIC NUTRIENT (NH4
+, NO X , PO 43-, SI) AND GAS (O2 ,
DIC) FLUXES A total of 6 manually operated benthic chambers were deployed at each site and during both surveys at a water depth of approximately 60 centimetres. Three of these benthic chambers excluded light penetrating into the chambers, and 3 were transparent allowing natural light penetration to the sediment surface within the chambers. After an equilibration time of approximately 15 hours, the lid of the benthic chambers was closed and water samples from within the chambers were taken at time intervals of 1 to 1.5 hours over a total of 6 to 8 hours. From the changes in nutrient and gas
6
concentrations over time, benthic fluxes were calculated accounting for the area and volume of the benthic chamber and the replacement of sample volume with water from the outside. Oxygen concentration within the chamber was continuously recorded by a YSI multi-sensor logger. Probes were calibrated and validated before and after the deployment with air-equilibrated sea water. More detailed information on benthic flux measurements can be found in Haese et al. (2007). 2.4. MEASUREMENTS OF PHOTOSYNTHESIS RATES IN THE WATER COLUMN Gas-tight glass syringes with a volume of 100 ml were filled with in situ lagoon water. Two syringes were wrapped in aluminium foil to keep samples dark during the incubation and two syringes were kept transparent. Samples were incubated in situ at a water depth of about 20 centimetre by attaching the syringes to the benthic chamber frame. Water samples were taken at intervals of 1 to 1.5 hours over a total period of 6 to 8 hours for later oxygen (O2) analysis using the membrane inlet mass spectrometer (10 ml sample volume) and dissolved inorganic carbon (DIC) analysis using the DIC analyser (3 ml sample volume). The production/uptake of O2 / DIC during the incubation was used to calculate the rate of photosynthesis in the water column. The derived rate was integrated over a water depth of 60 cm to derive area normalized production/respiration rates, which can be compared to benthic rates of photosynthesis/respiration. 2.5. ANALYSIS OF NUTRIENTS, GASES, AND SALINITY Nutrients were analysed in the laboratory of the Department of Environment and Climate Change, NSW, using an automated flow injection analyser with a spectrophotometer built into a flow-through-cell. Ammonia, nitrate + nitrite, phosphate and silica were analysed according to standard procedures (Grasshoff et al. 1983). Total dissolved inorganic carbon (DIC) was analysed without any sample pre-treatment with the dissolve inorganic carbon analyser (DIC) analyser AS-C3 (Apollo SciTech), which includes an infrared-based CO2 detector (LiCor 7000). Certified sea water was used as a standard (A.G. Dickson, UC San Diego). The precision of the measurements were typically 0.1 %. Oxygen was measured using YSI sondes. Interferences with high salinity was not observed. Salinity was measured by refractometry.
7
3. Results 3.1. FIELD OBSERVATIONS RELATED TO GROUNDWATER DISCHARGE Initial observations related to groundwater discharge were made during the survey in August 2007, and consequently, groundwater discharge features were targeted during the survey in February 2008. The low water levels of the Coorong in February exposed many features, which are inundated during the winter. Carbonate deposits were found to be pervasive along the eastern shore of the Coorong’s South Lagoon (Figure 7). These deposits often take the form of cylindrical tubes (5 to 100 centimetres diameter) commonly known as ‘tufa’ which are indicative of groundwater discharge. The tufa in the Coorong are composed of concentric carbonate laminations millimetres thick, suggesting cyclic accretion. Tufa deposits were found adjacent to the majority of bays and headlands, generally within 100 metres of the shoreline, forming either elongated reefs that parallel the coastline or shelfs that extend from the shore into the lagoon. Stranded pools were also common along the eastern shore of the South Lagoon, and often associated with tufa (Figure 7). As a result of low water levels prevalent during the survey, the main water body of the Coorong was typically tens to hundreds of metres from the shoreline. Stranded pools of water disconnected from the main water body persisted. The pools were typically several metres wide running parallel to the coast line with strings of pools stretching for kilometres. The presence and extent of stranded pools indicate the presence of groundwater discharge even under drought conditions. Visible seeps were observed at several sites within the Coorong’s South Lagoon (Figure 7). Like the tufa and stranded pools, the seeps were located at the edge of the Coorong within 100 m of the shoreline. The seeps were identified by the agitation of sediments as groundwater flowed rapidly upwards, and by the difference in density between surface water and the inflowing groundwater. Individual seeps were several centimetres in diameter and spaced several centimetres to meters apart. Direct measurement of groundwater discharge showed very high seepage rates at visible seep sites (CooAS: 250 l m-2 h-1, Coo5: 38 l m-2 h-1) and high seepage rates at sites where visible seeps were not present (CooJP:11 to 38 l m-2 h-1). Similarly, the hydraulic head was positive at sites CooAS (12.5 cm), CooJP (2.1 cm) and Coo5 (15.5 cm) suggesting that groundwater has the capacity to flow upwards at these sites.
8
Coo1
Coo2
Coo3
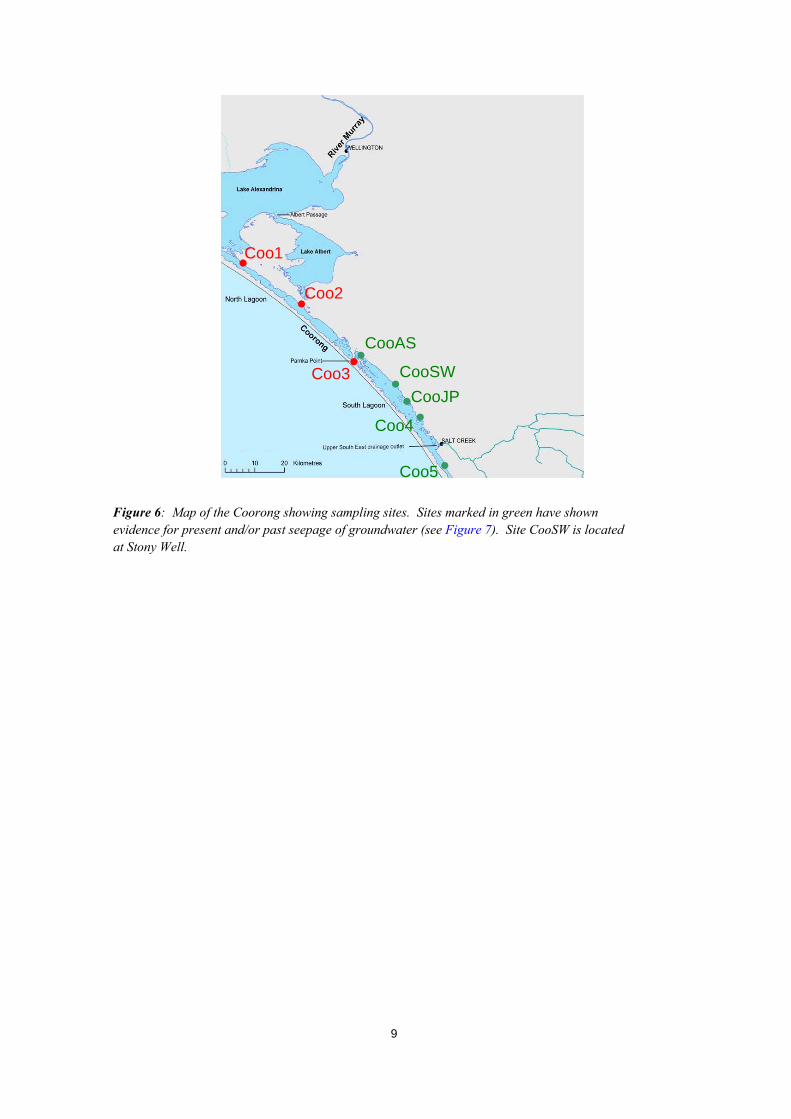
Figure 6: Map of the Coorong showing sampling sites. Sites marked in green have shown evidence for present and/or past seepage of groundwater (see Figure 7). Site CooSW is located at Stony Well.
Coo5
Coo4
CooAS
CooSW
CooJP
Coo1
Coo2
Coo3
Coo5
Coo4
CooAS
CooSW
CooJP
9
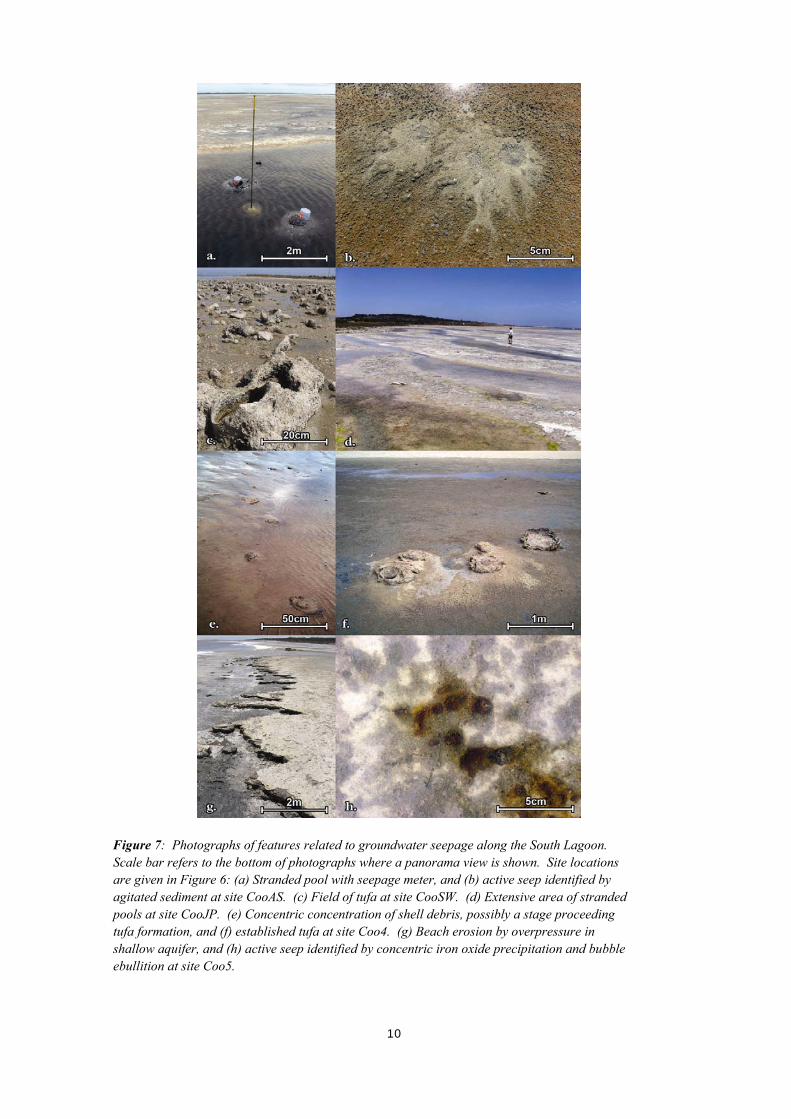
Figure 7: Photographs of features related to groundwater seepage along the South Lagoon. Scale bar refers to the bottom of photographs where a panorama view is shown. Site locations are given in Figure 6: (a) Stranded pool with seepage meter, and (b) active seep identified by agitated sediment at site CooAS. (c) Field of tufa at site CooSW. (d) Extensive area of stranded pools at site CooJP. (e) Concentric concentration of shell debris, possibly a stage proceeding tufa formation, and (f) established tufa at site Coo4. (g) Beach erosion by overpressure in shallow aquifer, and (h) active seep identified by concentric iron oxide precipitation and bubble ebullition at site Coo5.
10
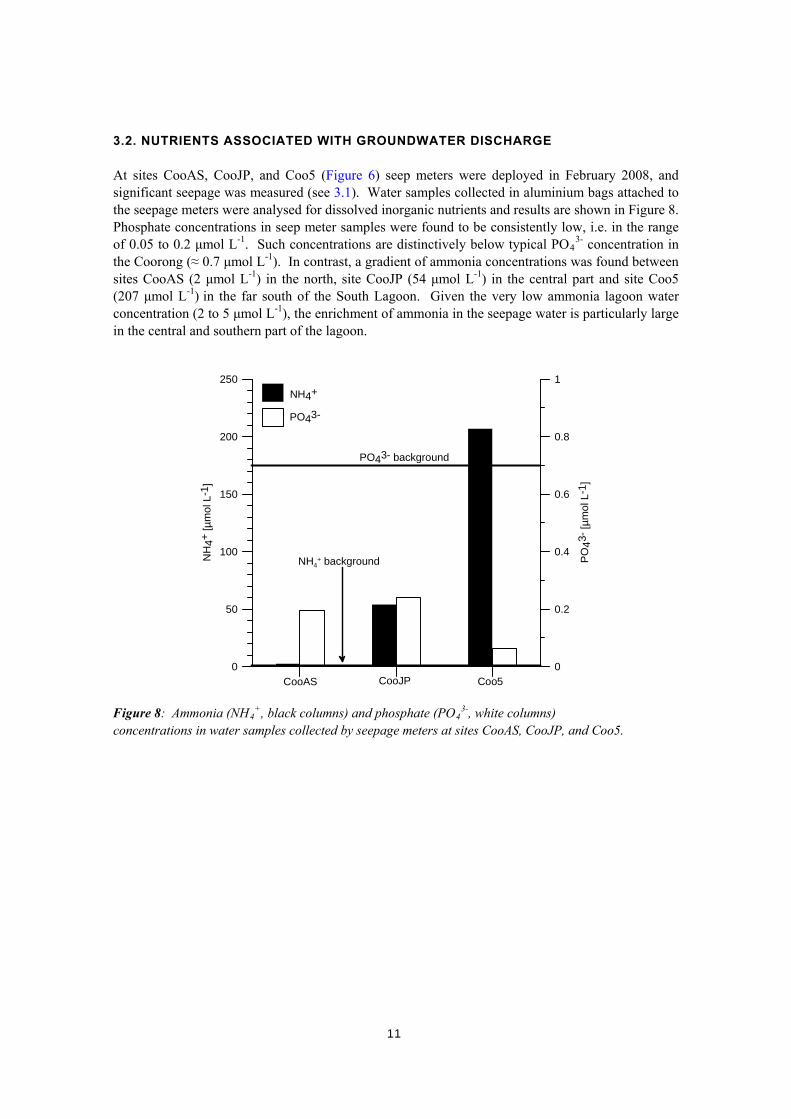
3.2. NUTRIENTS ASSOCIATED WITH GROUNDWATER DISCHARGE At sites CooAS, CooJP, and Coo5 (Figure 6) seep meters were deployed in February 2008, and significant seepage was measured (see 3.1). Water samples collected in aluminium bags attached to the seepage meters were analysed for dissolved inorganic nutrients and results are shown in Figure 8. Phosphate concentrations in seep meter samples were found to be consistently low, i.e. in the range of 0.05 to 0.2 μmol L-1. Such concentrations are distinctively below typical PO4
3- concentration in the Coorong (≈ 0.7 μmol L-1). In contrast, a gradient of ammonia concentrations was found between sites CooAS (2 μmol L-1) in the north, site CooJP (54 μmol L-1) in the central part and site Coo5 (207 μmol L-1) in the far south of the South Lagoon. Given the very low ammonia lagoon water concentration (2 to 5 μmol L-1), the enrichment of ammonia in the seepage water is particularly large in the central and southern part of the lagoon.
0
50
100
150
200
250
NH
4+ [µ
mol L
-1]
0
0.2
0.4
0.6
0.8
1
PO
43-
[µ
mo
l L-1
]
NH4+ background
NH4+
PO43-
PO43- background
CooAS CooJP Coo5
Figure 8: Ammonia (NH4
+, black columns) and phosphate (PO43-, white columns)
concentrations in water samples collected by seepage meters at sites CooAS, CooJP, and Coo5.
11
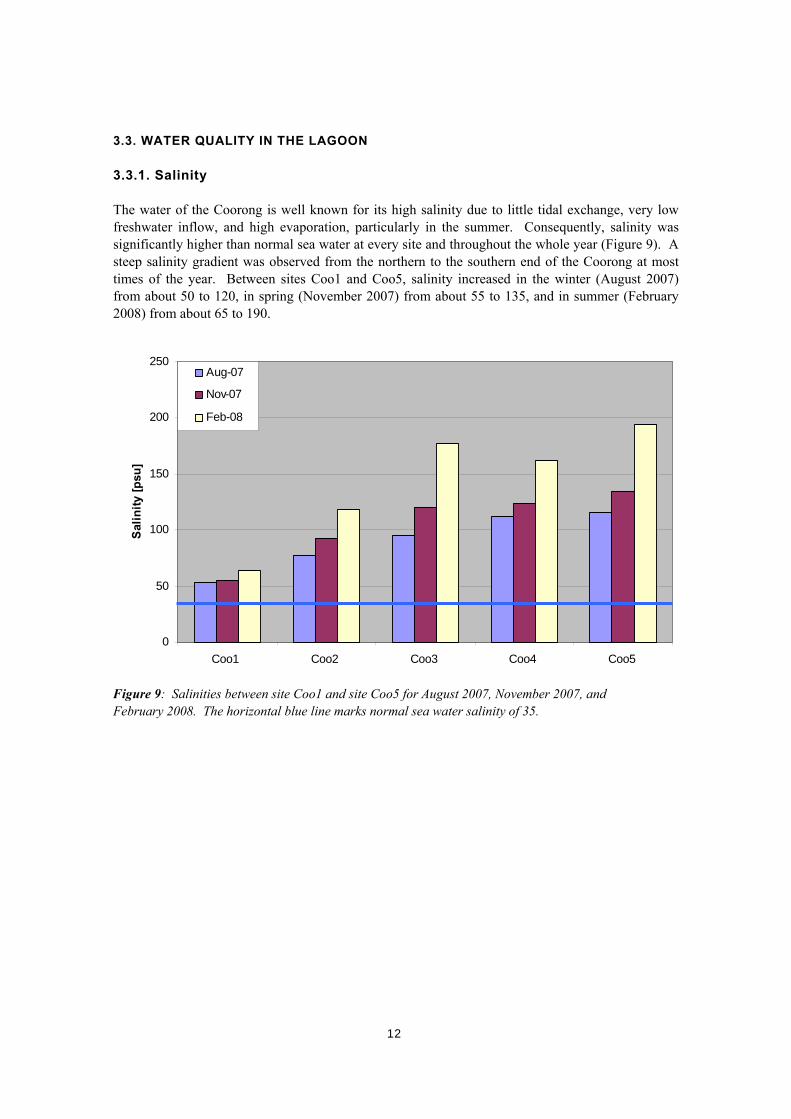
3.3. WATER QUALITY IN THE LAGOON 3.3.1. Salinity The water of the Coorong is well known for its high salinity due to little tidal exchange, very low freshwater inflow, and high evaporation, particularly in the summer. Consequently, salinity was significantly higher than normal sea water at every site and throughout the whole year (Figure 9). A steep salinity gradient was observed from the northern to the southern end of the Coorong at most times of the year. Between sites Coo1 and Coo5, salinity increased in the winter (August 2007) from about 50 to 120, in spring (November 2007) from about 55 to 135, and in summer (February 2008) from about 65 to 190.
0
50
100
150
200
250
Coo1 Coo2 Coo3 Coo4 Coo5
Sal
init
y [p
su]
Aug-07
Nov-07
Feb-08
Figure 9: Salinities between site Coo1 and site Coo5 for August 2007, November 2007, and February 2008. The horizontal blue line marks normal sea water salinity of 35.
12
3.3.2. Nutrients
Nitrogen fractions
0
1000
2000
3000
4000
5000
6000
7000
8000
9000
10000
1 2 3 4 5Sites
N [μ
g/l]
Particulate-N
Dissolved organic N
Dissolved inorganic N
Phosphorous fractions
0
50
100
150
200
250
300
350
400
450
500
1 2 3 4 5Sites
P [μ
g/l]
Particulate-P
Dissolved organic P
Dissolved inorganic P
0
500
1000
1500
2000
2500
3000
1 2 3 4 5Sites
Si
[μg
/l]
0
5
10
15
20
25
30
35
1 2 3 4 5
Sites
mo
lar
N :
P
DIN : DIP
Part-N : Part-P
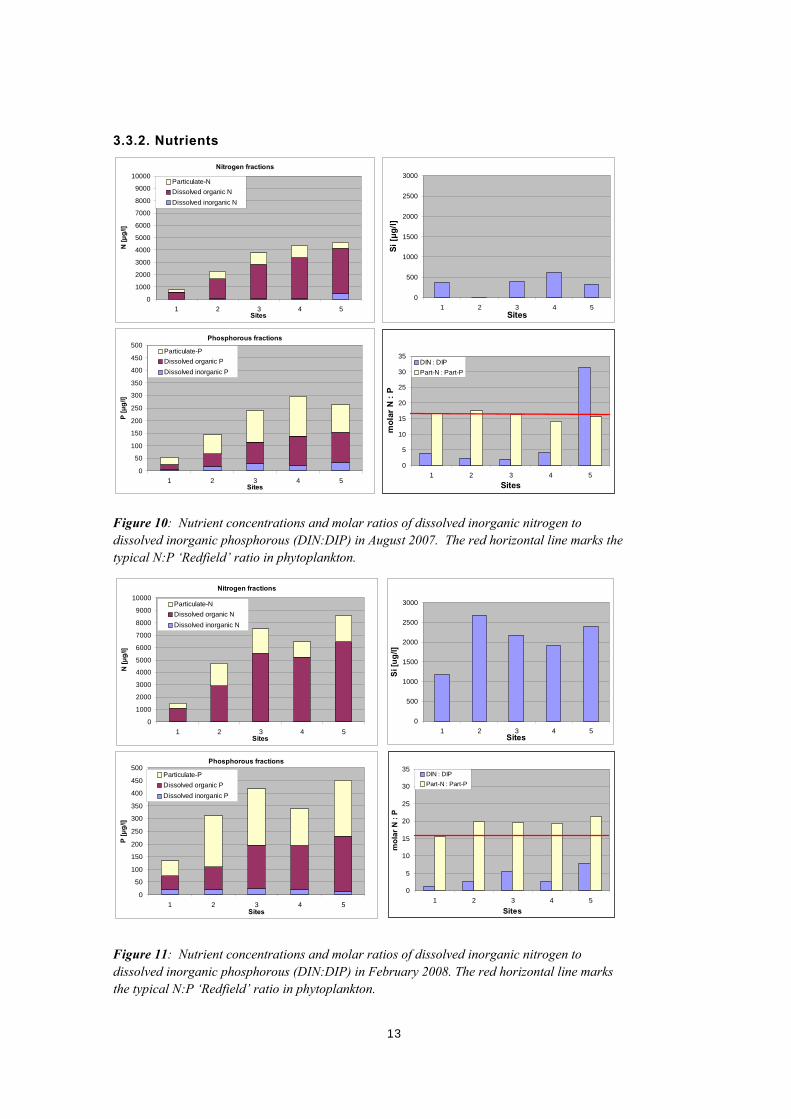
Figure 10: Nutrient concentrations and molar ratios of dissolved inorganic nitrogen to dissolved inorganic phosphorous (DIN:DIP) in August 2007. The red horizontal line marks the typical N:P ‘Redfield’ ratio in phytoplankton.
Nitrogen fractions
0
1000
2000
3000
4000
5000
6000
7000
8000
9000
10000
1 2 3 4 5Sites
N [μ
g/l]
Particulate-N
Dissolved organic N
Dissolved inorganic N
Phosphorous fractions
0
50
100
150
200
250
300
350
400
450
500
1 2 3 4 5Sites
P [μ
g/l]
Particulate-P
Dissolved organic P
Dissolved inorganic P
0
500
1000
1500
2000
2500
3000
1 2 3 4 5Sites
Si [
ug
/l]
0
5
10
15
20
25
30
35
1 2 3 4 5
Sites
mo
lar
N :
P
DIN : DIP
Part-N : Part-P
Figure 11: Nutrient concentrations and molar ratios of dissolved inorganic nitrogen to dissolved inorganic phosphorous (DIN:DIP) in February 2008. The red horizontal line marks the typical N:P ‘Redfield’ ratio in phytoplankton.
13
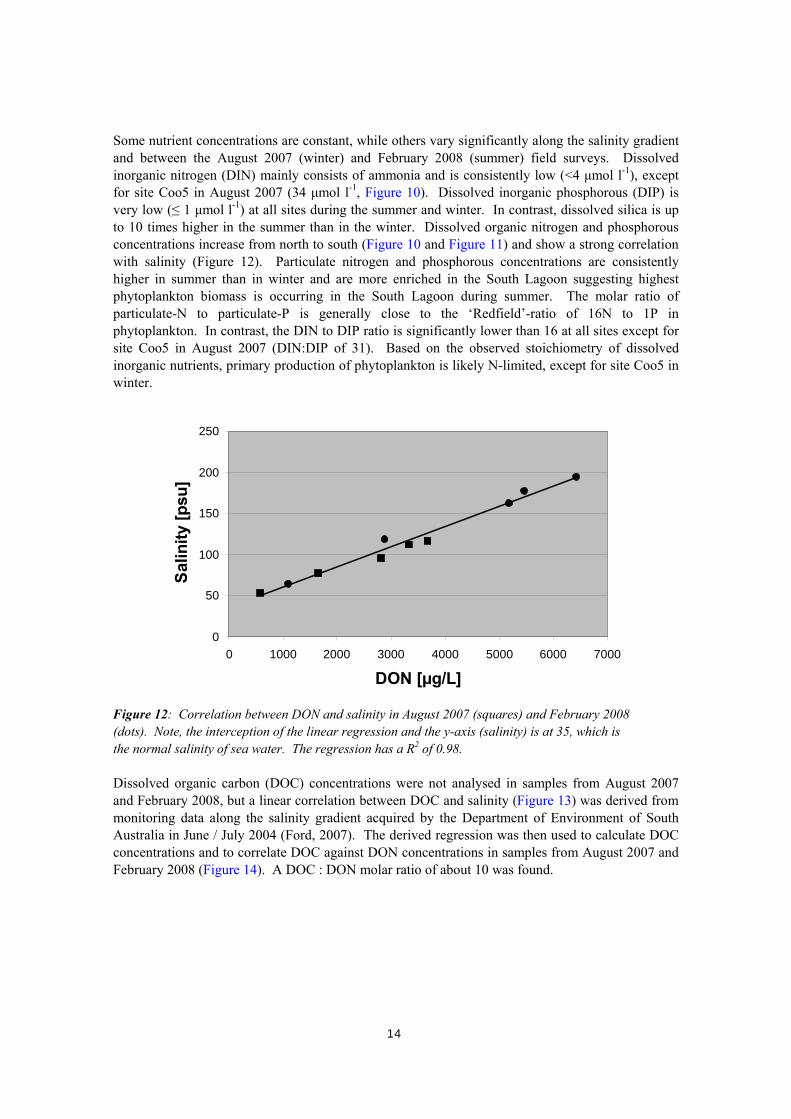
Some nutrient concentrations are constant, while others vary significantly along the salinity gradient and between the August 2007 (winter) and February 2008 (summer) field surveys. Dissolved inorganic nitrogen (DIN) mainly consists of ammonia and is consistently low (<4 μmol l-1), except for site Coo5 in August 2007 (34 μmol l-1, Figure 10). Dissolved inorganic phosphorous (DIP) is very low (≤ 1 μmol l-1) at all sites during the summer and winter. In contrast, dissolved silica is up to 10 times higher in the summer than in the winter. Dissolved organic nitrogen and phosphorous concentrations increase from north to south (Figure 10 and Figure 11) and show a strong correlation with salinity (Figure 12). Particulate nitrogen and phosphorous concentrations are consistently higher in summer than in winter and are more enriched in the South Lagoon suggesting highest phytoplankton biomass is occurring in the South Lagoon during summer. The molar ratio of particulate-N to particulate-P is generally close to the ‘Redfield’-ratio of 16N to 1P in phytoplankton. In contrast, the DIN to DIP ratio is significantly lower than 16 at all sites except for site Coo5 in August 2007 (DIN:DIP of 31). Based on the observed stoichiometry of dissolved inorganic nutrients, primary production of phytoplankton is likely N-limited, except for site Coo5 in winter.
0
50
100
150
200
250
0 1000 2000 3000 4000 5000 6000 7000
DON [μg/L]
Sal
init
y [p
su]
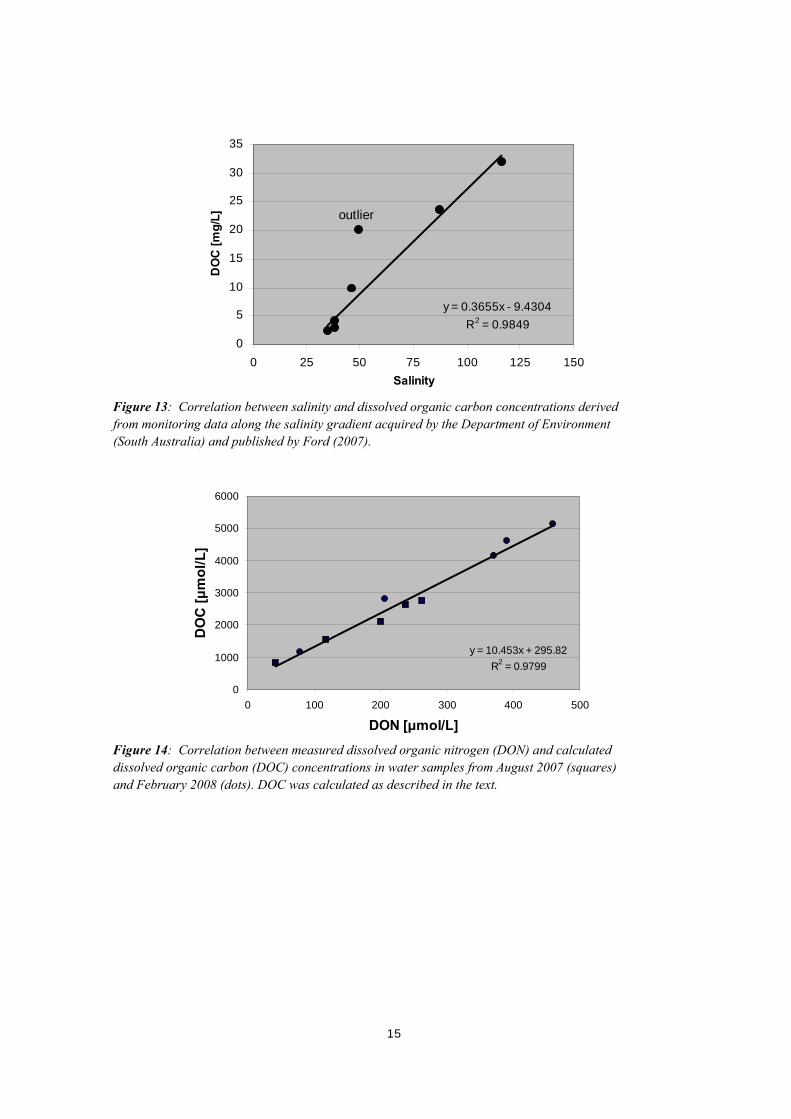
Figure 12: Correlation between DON and salinity in August 2007 (squares) and February 2008 (dots). Note, the interception of the linear regression and the y-axis (salinity) is at 35, which is the normal salinity of sea water. The regression has a R2 of 0.98. Dissolved organic carbon (DOC) concentrations were not analysed in samples from August 2007 and February 2008, but a linear correlation between DOC and salinity (Figure 13) was derived from monitoring data along the salinity gradient acquired by the Department of Environment of South Australia in June / July 2004 (Ford, 2007). The derived regression was then used to calculate DOC concentrations and to correlate DOC against DON concentrations in samples from August 2007 and February 2008 (Figure 14). A DOC : DON molar ratio of about 10 was found.
14
y = 0.3655x - 9.4304
R2 = 0.9849
0
5
10
15
20
25
30
35
0 25 50 75 100 125 150
Salinity
DO
C [
mg
/L] outlier
Figure 13: Correlation between salinity and dissolved organic carbon concentrations derived from monitoring data along the salinity gradient acquired by the Department of Environment South Australia) and published by Ford (2007). (
y = 10.453x + 295.82
R2 = 0.9799
0
1000
2000
3000
4000
5000
6000
0 100 200 300 400 500
DON [μmol/L]
DO
C [μ
mo
l/L
]
Figure 14: Correlation between measured dissolved organic nitrogen (DON) and calculated dissolved organic carbon (DOC) concentrations in water samples from August 2007 (squares) and February 2008 (dots). DOC was calculated as described in the text.
15
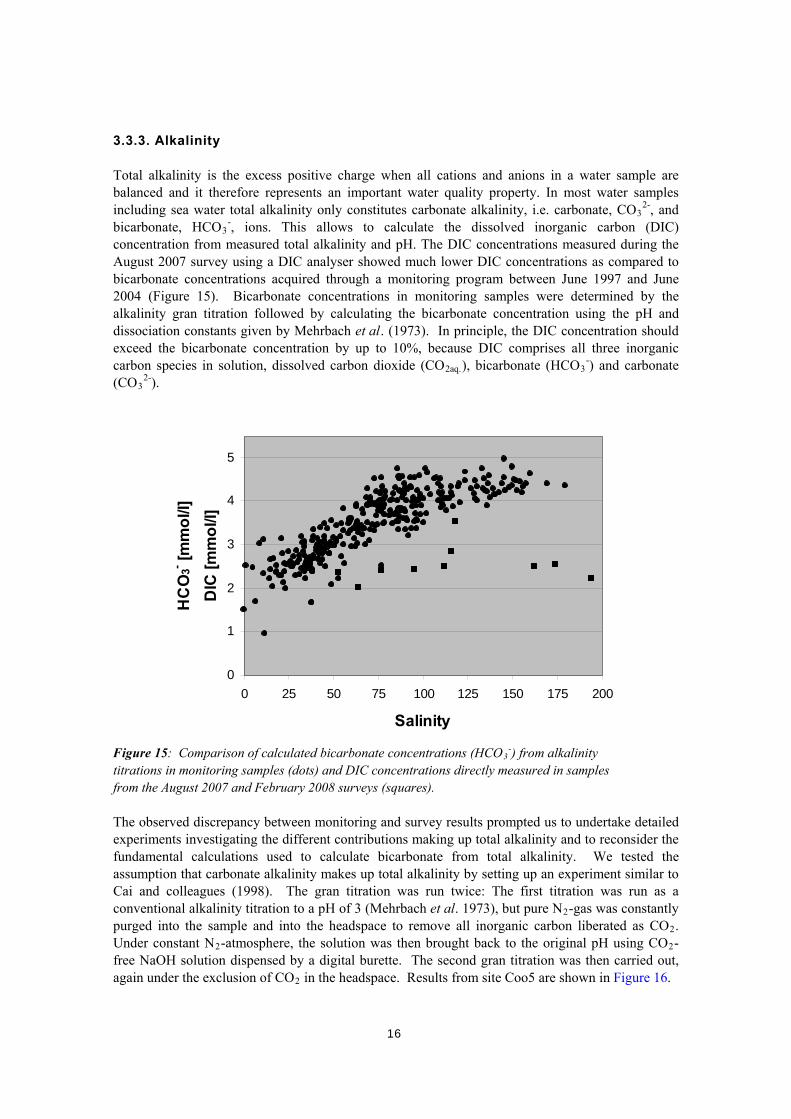
3.3.3. Alkalinity Total alkalinity is the excess positive charge when all cations and anions in a water sample are balanced and it therefore represents an important water quality property. In most water samples including sea water total alkalinity only constitutes carbonate alkalinity, i.e. carbonate, CO3
2-, and bicarbonate, HCO3
-, ions. This allows to calculate the dissolved inorganic carbon (DIC) concentration from measured total alkalinity and pH. The DIC concentrations measured during the August 2007 survey using a DIC analyser showed much lower DIC concentrations as compared to bicarbonate concentrations acquired through a monitoring program between June 1997 and June 2004 (Figure 15). Bicarbonate concentrations in monitoring samples were determined by the alkalinity gran titration followed by calculating the bicarbonate concentration using the pH and dissociation constants given by Mehrbach et al. (1973). In principle, the DIC concentration should exceed the bicarbonate concentration by up to 10%, because DIC comprises all three inorganic carbon species in solution, dissolved carbon dioxide (CO2aq.), bicarbonate (HCO3
-) and carbonate (CO3
2-).
0
1
2
3
4
5
0 25 50 75 100 125 150 175 200
Salinity
HC
O3- [m
mo
l/l]
DIC
[m
mo
l/l]
Figure 15: Comparison of calculated bicarbonate concentrations (HCO3-) from alkalinity
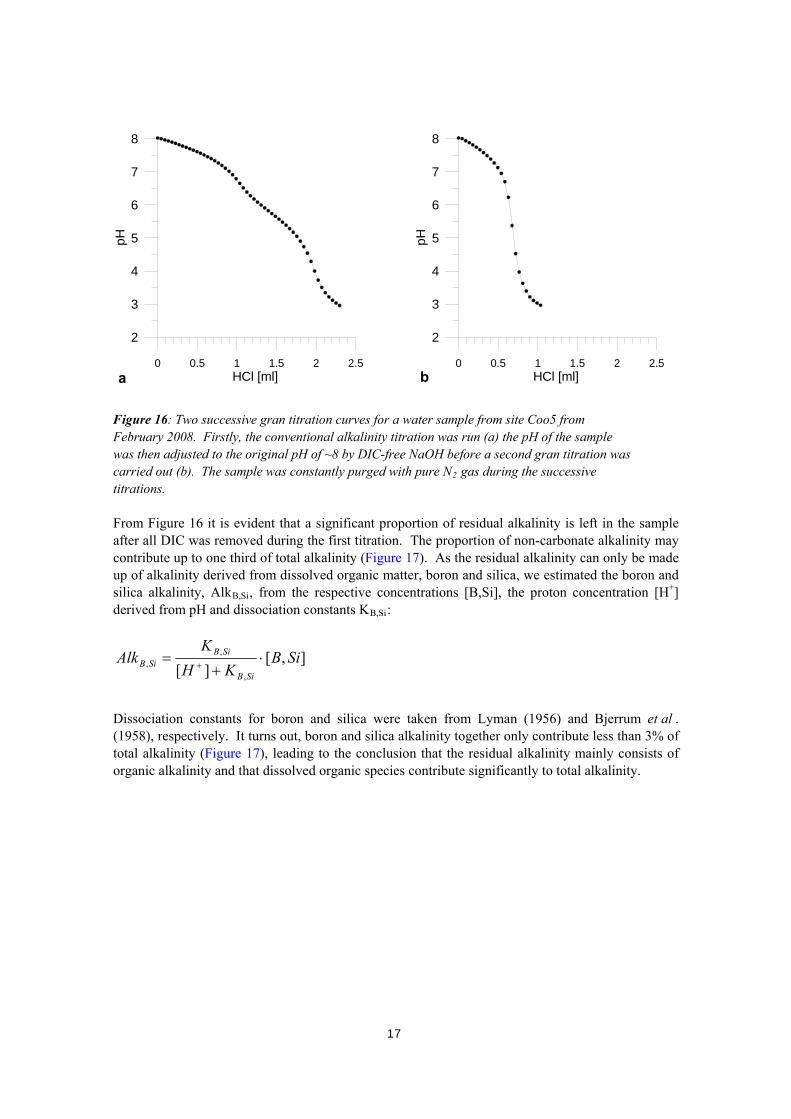
titrations in monitoring samples (dots) and DIC concentrations directly measured in samples from the August 2007 and February 2008 surveys (squares). The observed discrepancy between monitoring and survey results prompted us to undertake detailed experiments investigating the different contributions making up total alkalinity and to reconsider the fundamental calculations used to calculate bicarbonate from total alkalinity. We tested the assumption that carbonate alkalinity makes up total alkalinity by setting up an experiment similar to Cai and colleagues (1998). The gran titration was run twice: The first titration was run as a conventional alkalinity titration to a pH of 3 (Mehrbach et al. 1973), but pure N2-gas was constantly purged into the sample and into the headspace to remove all inorganic carbon liberated as CO2. Under constant N2-atmosphere, the solution was then brought back to the original pH using CO2-free NaOH solution dispensed by a digital burette. The second gran titration was then carried out, again under the exclusion of CO2 in the headspace. Results from site Coo5 are shown in Figure 16.
16
0 0.5 1 1.5 2 2.5HCl [ml]
2
3
4
5
6
7
8
pH
0 0.5 1 1.5 2 2.5HCl [ml]
2
3
4
5
6
7
8
pH
a b
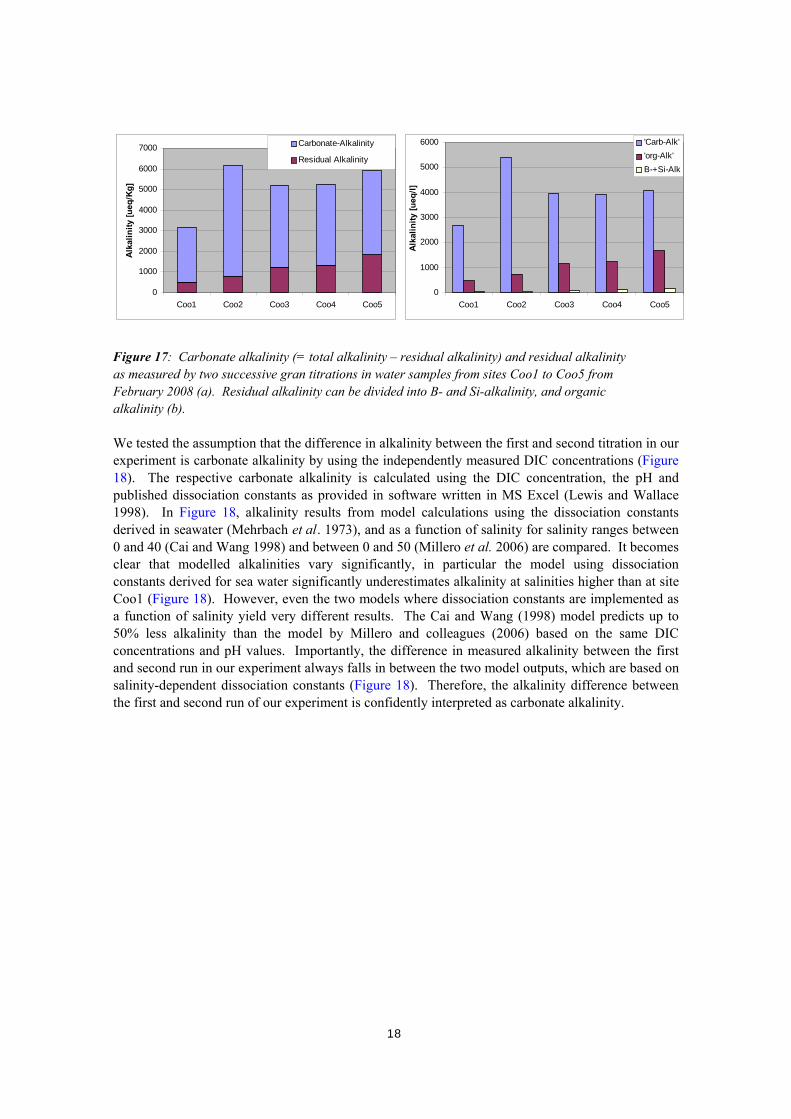
Figure 16: Two successive gran titration curves for a water sample from site Coo5 from February 2008. Firstly, the conventional alkalinity titration was run (a) the pH of the sample was then adjusted to the original pH of ~8 by DIC-free NaOH before a second gran titration was carried out (b). The sample was constantly purged with pure N2 gas during the successive titrations. From Figure 16 it is evident that a significant proportion of residual alkalinity is left in the sample after all DIC was removed during the first titration. The proportion of non-carbonate alkalinity may contribute up to one third of total alkalinity (Figure 17). As the residual alkalinity can only be made up of alkalinity derived from dissolved organic matter, boron and silica, we estimated the boron and silica alkalinity, AlkB,Si, from the respective concentrations [B,Si], the proton concentration [H+] derived from pH and dissociation constants KB,Si:
],[][ ,
,, SiB
KHK
AlkSiB
SiBSiB
Dissociation constants for boron and silica were taken from Lyman (1956) and Bjerrum et al . (1958), respectively. It turns out, boron and silica alkalinity together only contribute less than 3% of total alkalinity (Figure 17), leading to the conclusion that the residual alkalinity mainly consists of organic alkalinity and that dissolved organic species contribute significantly to total alkalinity.
17
0
1000
2000
3000
4000
5000
6000
Coo1 Coo2 Coo3 Coo4 Coo5
Alk
alin
ity
[ueq
/l]
'Carb-Alk'
'org-Alk'
B-+Si-Alk
0
1000
2000
3000
4000
5000
6000
7000
Coo1 Coo2 Coo3 Coo4 Coo5
Alk
alin
ity
[ueq
/Kg
]
Carbonate-Alkalinity
Residual Alkalinity
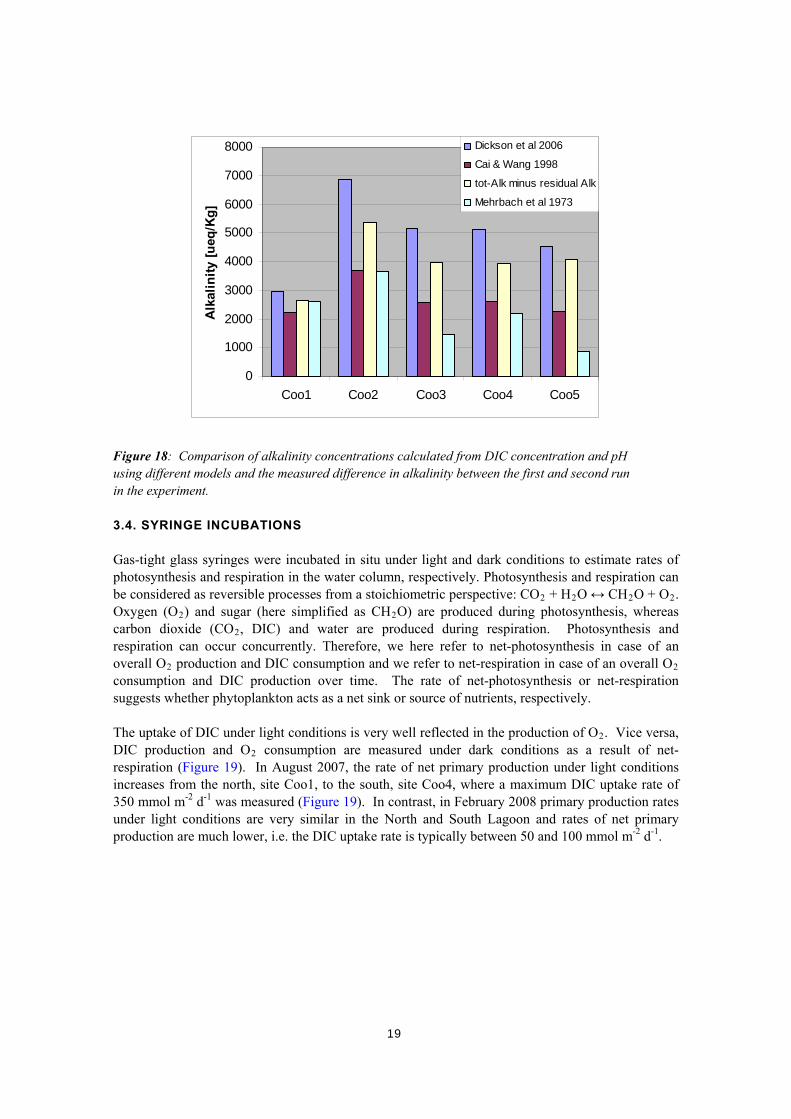
Figure 17: Carbonate alkalinity (= total alkalinity – residual alkalinity) and residual alkalinity as measured by two successive gran titrations in water samples from sites Coo1 to Coo5 from February 2008 (a). Residual alkalinity can be divided into B- and Si-alkalinity, and organic alkalinity (b). We tested the assumption that the difference in alkalinity between the first and second titration in our experiment is carbonate alkalinity by using the independently measured DIC concentrations (Figure 18). The respective carbonate alkalinity is calculated using the DIC concentration, the pH and published dissociation constants as provided in software written in MS Excel (Lewis and Wallace 1998). In Figure 18, alkalinity results from model calculations using the dissociation constants derived in seawater (Mehrbach et al. 1973), and as a function of salinity for salinity ranges between 0 and 40 (Cai and Wang 1998) and between 0 and 50 (Millero et al. 2006) are compared. It becomes clear that modelled alkalinities vary significantly, in particular the model using dissociation constants derived for sea water significantly underestimates alkalinity at salinities higher than at site Coo1 (Figure 18). However, even the two models where dissociation constants are implemented as a function of salinity yield very different results. The Cai and Wang (1998) model predicts up to 50% less alkalinity than the model by Millero and colleagues (2006) based on the same DIC concentrations and pH values. Importantly, the difference in measured alkalinity between the first and second run in our experiment always falls in between the two model outputs, which are based on salinity-dependent dissociation constants (Figure 18). Therefore, the alkalinity difference between the first and second run of our experiment is confidently interpreted as carbonate alkalinity.
18
0
1000
2000
3000
4000
5000
6000
7000
8000
Coo1 Coo2 Coo3 Coo4 Coo5
Alk
alin
ity
[ueq
/Kg
]
Dickson et al 2006
Cai & Wang 1998
tot-Alk minus residual Alk
Mehrbach et al 1973
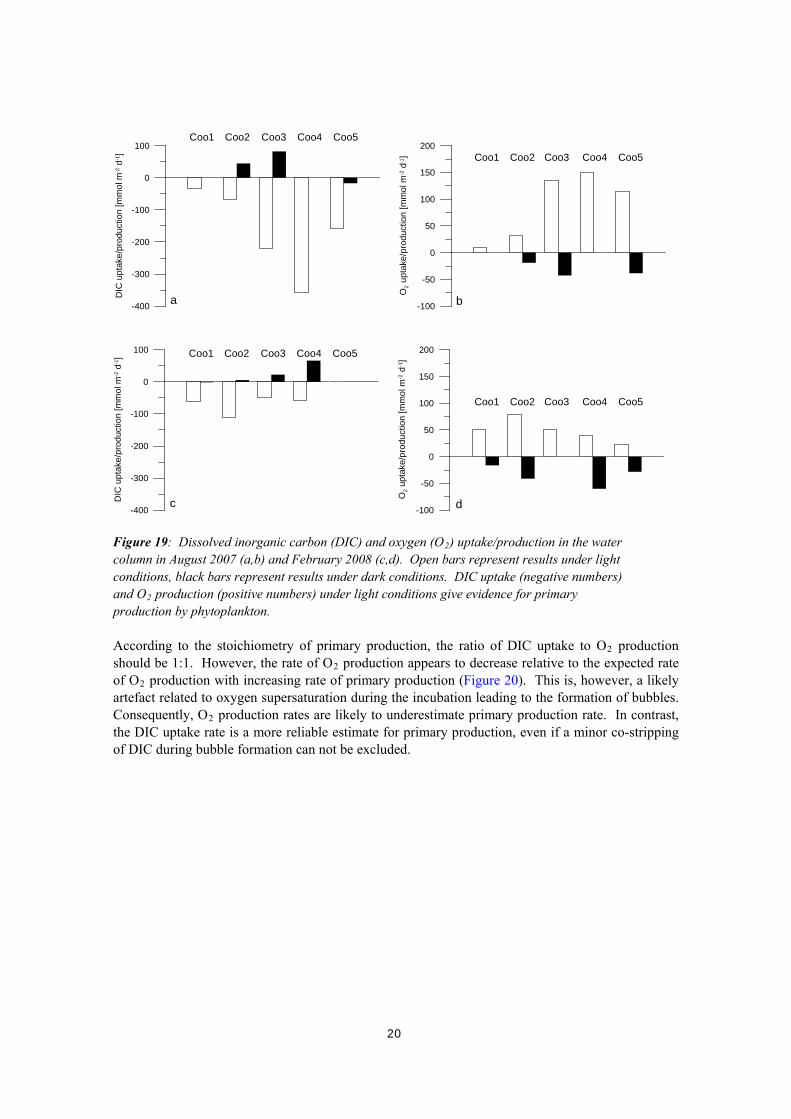
Figure 18: Comparison of alkalinity concentrations calculated from DIC concentration and pH using different models and the measured difference in alkalinity between the first and second run in the experiment. 3.4. SYRINGE INCUBATIONS Gas-tight glass syringes were incubated in situ under light and dark conditions to estimate rates of photosynthesis and respiration in the water column, respectively. Photosynthesis and respiration can be considered as reversible processes from a stoichiometric perspective: CO2 + H2O ↔ CH2O + O2. Oxygen (O2) and sugar (here simplified as CH2O) are produced during photosynthesis, whereas carbon dioxide (CO2, DIC) and water are produced during respiration. Photosynthesis and respiration can occur concurrently. Therefore, we here refer to net-photosynthesis in case of an overall O2 production and DIC consumption and we refer to net-respiration in case of an overall O2 consumption and DIC production over time. The rate of net-photosynthesis or net-respiration suggests whether phytoplankton acts as a net sink or source of nutrients, respectively. The uptake of DIC under light conditions is very well reflected in the production of O2. Vice versa, DIC production and O2 consumption are measured under dark conditions as a result of net-respiration (Figure 19). In August 2007, the rate of net primary production under light conditions increases from the north, site Coo1, to the south, site Coo4, where a maximum DIC uptake rate of 350 mmol m-2 d-1 was measured (Figure 19). In contrast, in February 2008 primary production rates under light conditions are very similar in the North and South Lagoon and rates of net primary production are much lower, i.e. the DIC uptake rate is typically between 50 and 100 mmol m-2 d-1.
19
-400
-300
-200
-100
0
100
DIC
up
take
/pro
duct
ion
[mm
ol m
-2 d
-1]
-100
-50
0
50
100
150
200
O2
upta
ke/p
rodu
ctio
n [m
mo
l m-2 d
-1]
a b
-400
-300
-200
-100
0
100
DIC
up
take
/pro
duc
tion
[mm
ol m
-2 d
-1]
-100
-50
0
50
100
150
200
O2
upta
ke/p
rodu
ctio
n [m
mo
l m-2 d
-1]
c d
Coo1 Coo2 Coo3 Coo4 Coo5
Coo1 Coo2 Coo3 Coo4 Coo5
Coo1 Coo2 Coo3 Coo4 Coo5
Coo1 Coo2 Coo3 Coo4 Coo5
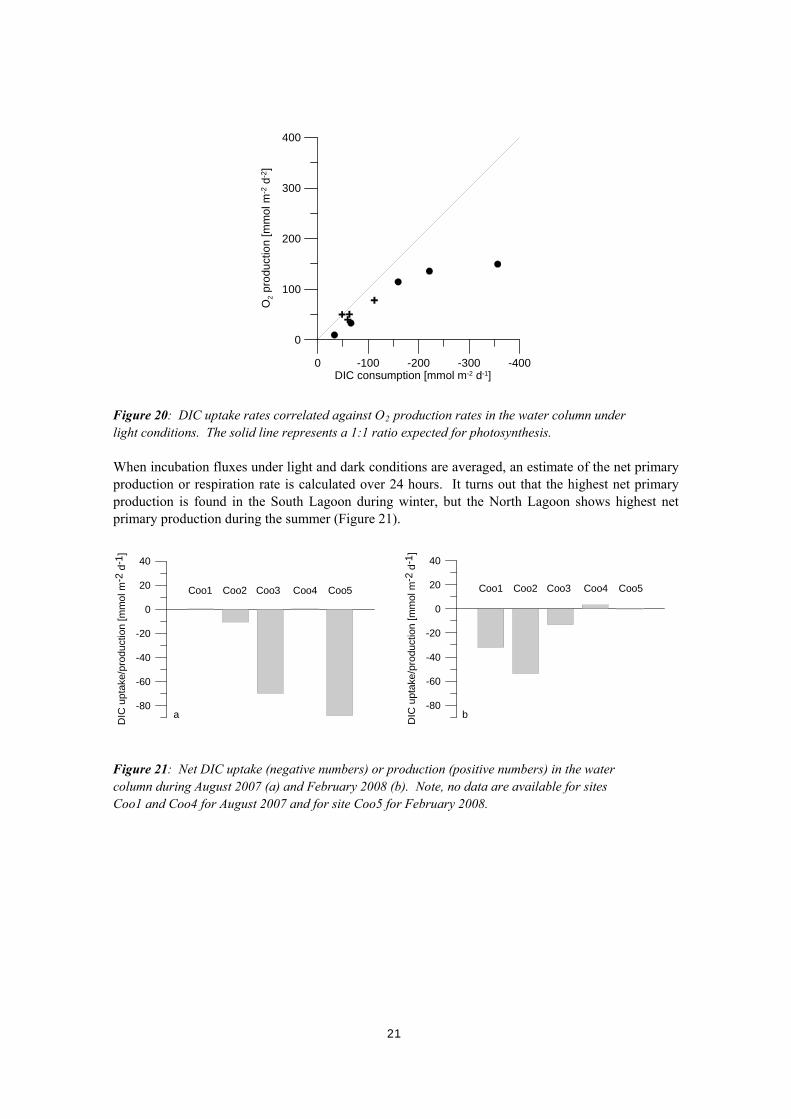
Figure 19: Dissolved inorganic carbon (DIC) and oxygen (O2) uptake/production in the water column in August 2007 (a,b) and February 2008 (c,d). Open bars represent results under light conditions, black bars represent results under dark conditions. DIC uptake (negative numbers) and O2 production (positive numbers) under light conditions give evidence for primary production by phytoplankton. According to the stoichiometry of primary production, the ratio of DIC uptake to O2 production should be 1:1. However, the rate of O2 production appears to decrease relative to the expected rate of O2 production with increasing rate of primary production (Figure 20). This is, however, a likely artefact related to oxygen supersaturation during the incubation leading to the formation of bubbles. Consequently, O2 production rates are likely to underestimate primary production rate. In contrast, the DIC uptake rate is a more reliable estimate for primary production, even if a minor co-stripping of DIC during bubble formation can not be excluded.
20
0 -100 -200 -300 -400DIC consumption [mmol m-2 d-1]
0
100
200
300
400
O2 p
rodu
ctio
n [m
mol
m-2
d-2
]
Figure 20: DIC uptake rates correlated against O2 production rates in the water column under light conditions. The solid line represents a 1:1 ratio expected for photosynthesis. When incubation fluxes under light and dark conditions are averaged, an estimate of the net primary production or respiration rate is calculated over 24 hours. It turns out that the highest net primary production is found in the South Lagoon during winter, but the North Lagoon shows highest net primary production during the summer (Figure 21).
-80
-60
-40
-20
0
20
40
DIC
up
take
/pro
duct
ion
[mm
ol m
-2 d
-1]
-80
-60
-40
-20
0
20
40
DIC
upt
ake/
prod
uctio
n [m
mol
m-2
d-1
]
Coo1 Coo2 Coo3 Coo4 Coo5 Coo1 Coo2 Coo3 Coo4 Coo5
a b
Figure 21: Net DIC uptake (negative numbers) or production (positive numbers) in the water column during August 2007 (a) and February 2008 (b). Note, no data are available for sites Coo1 and Coo4 for August 2007 and for site Coo5 for February 2008.
21
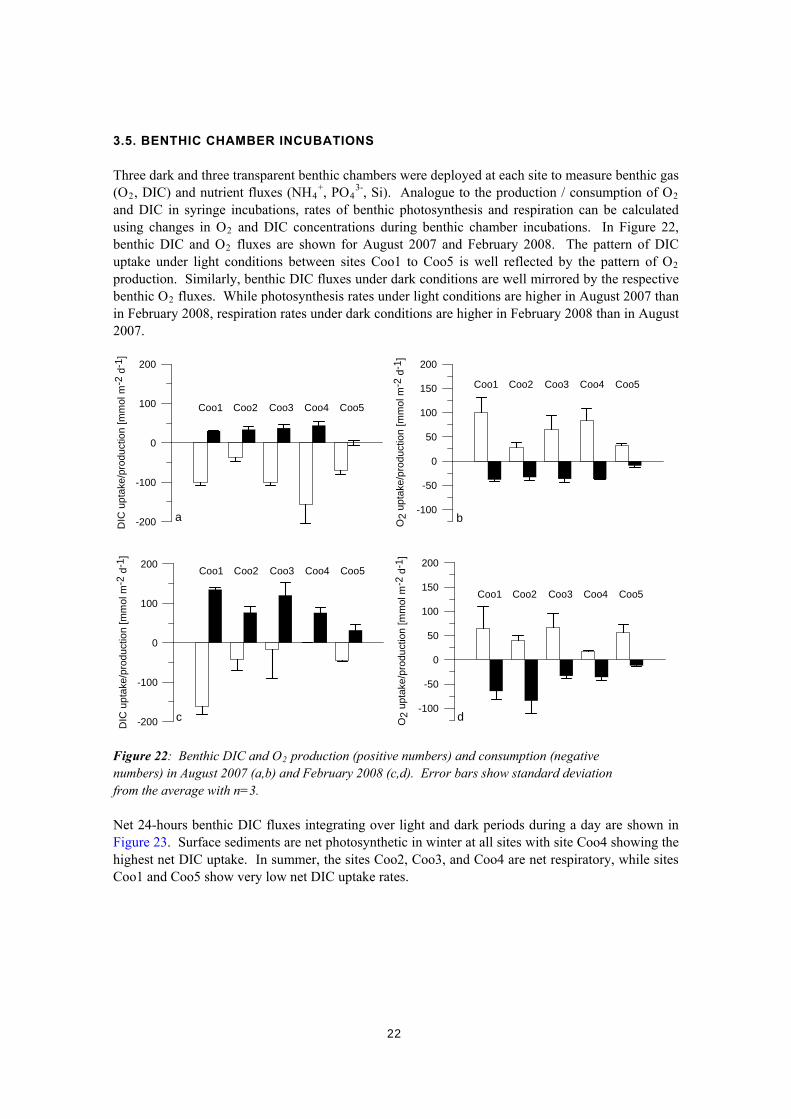
3.5. BENTHIC CHAMBER INCUBATIONS Three dark and three transparent benthic chambers were deployed at each site to measure benthic gas (O2, DIC) and nutrient fluxes (NH4
+, PO43-, Si). Analogue to the production / consumption of O2
and DIC in syringe incubations, rates of benthic photosynthesis and respiration can be calculated using changes in O2 and DIC concentrations during benthic chamber incubations. In Figure 22, benthic DIC and O2 fluxes are shown for August 2007 and February 2008. The pattern of DIC uptake under light conditions between sites Coo1 to Coo5 is well reflected by the pattern of O2 production. Similarly, benthic DIC fluxes under dark conditions are well mirrored by the respective benthic O2 fluxes. While photosynthesis rates under light conditions are higher in August 2007 than in February 2008, respiration rates under dark conditions are higher in February 2008 than in August 2007.
-200
-100
0
100
200
DIC
up
take
/pro
duct
ion
[mm
ol m
-2 d
-1]
-100
-50
0
50
100
150
200
O2
up
take
/pro
duc
tion
[mm
ol m
-2 d
-1]
a b
-100
-50
0
50
100
150
200
O2
upt
ake/
pro
duct
ion
[mm
ol m
-2 d
-1]
d-200
-100
0
100
200
DIC
up
take
/pro
duct
ion
[mm
ol m
-2 d
-1]
c
Coo1 Coo2 Coo3 Coo4 Coo5
Coo1 Coo2 Coo3 Coo4 Coo5
Coo1 Coo2 Coo3 Coo4 Coo5
Coo1 Coo2 Coo3 Coo4 Coo5
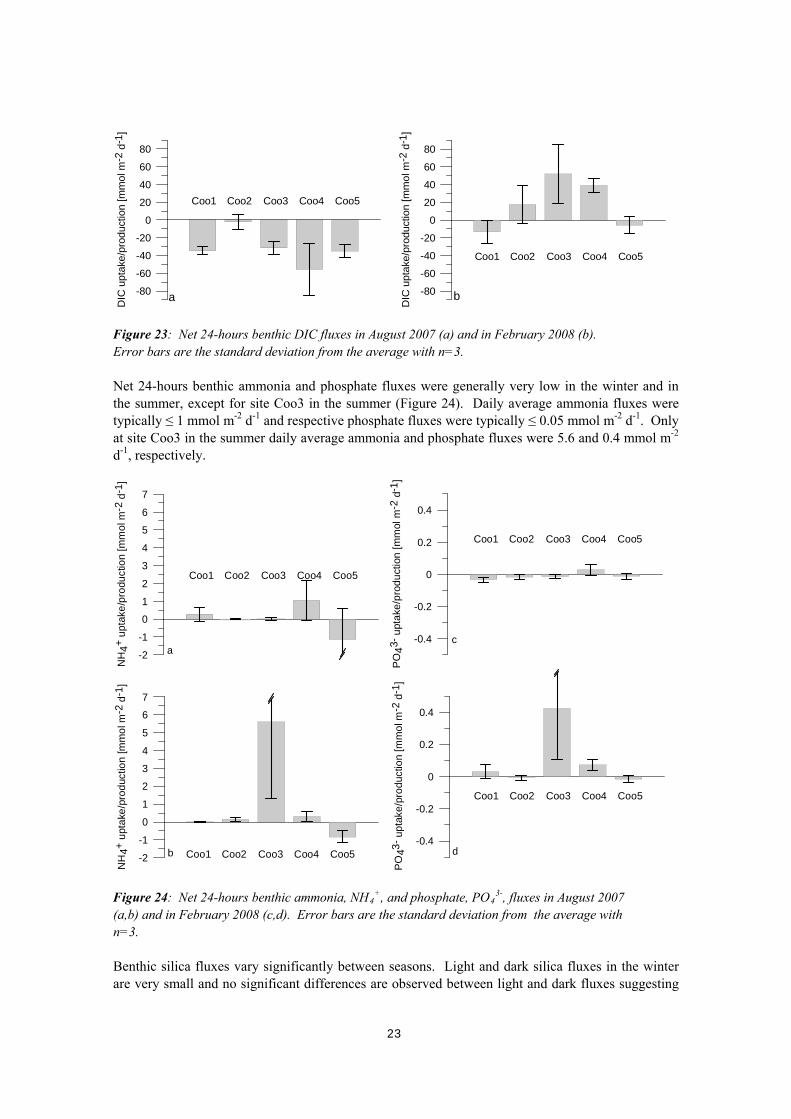
Figure 22: Benthic DIC and O2 production (positive numbers) and consumption (negative numbers) in August 2007 (a,b) and February 2008 (c,d). Error bars show standard deviation from the average with n=3. Net 24-hours benthic DIC fluxes integrating over light and dark periods during a day are shown in Figure 23. Surface sediments are net photosynthetic in winter at all sites with site Coo4 showing the highest net DIC uptake. In summer, the sites Coo2, Coo3, and Coo4 are net respiratory, while sites Coo1 and Coo5 show very low net DIC uptake rates.
22
-80
-60
-40
-20
0
20
40
60
80
DIC
upta
ke/p
roduc
tion
[mm
ol m
-2 d
-1]
a b-80
-60
-40
-20
0
20
40
60
80
DIC
upta
ke/p
roduc
tion
[mm
ol m
-2 d
-1]
Coo1 Coo2 Coo3 Coo4 Coo5
Coo1 Coo2 Coo3 Coo4 Coo5
Figure 23: Net 24-hours benthic DIC fluxes in August 2007 (a) and in February 2008 (b). Error bars are the standard deviation from the average with n=3. Net 24-hours benthic ammonia and phosphate fluxes were generally very low in the winter and in the summer, except for site Coo3 in the summer (Figure 24). Daily average ammonia fluxes were typically ≤ 1 mmol m-2 d-1 and respective phosphate fluxes were typically ≤ 0.05 mmol m-2 d-1. Only at site Coo3 in the summer daily average ammonia and phosphate fluxes were 5.6 and 0.4 mmol m-2 d-1, respectively.
-2
-1
0
1
2
3
4
5
6
7
NH
4+
up
take
/pro
duct
ion
[mm
ol m
-2 d
-1]
a
b-2
-1
0
1
2
3
4
5
6
7
NH
4+ u
pta
ke/p
rod
uctio
n [m
mo
l m-2
d-1
]
c
-0.4
-0.2
0
0.2
0.4
PO
43-
upta
ke/p
rod
uctio
n [m
mo
l m-2
d-1
]
d
Coo1 Coo2 Coo3 Coo4 Coo5
-0.4
-0.2
0
0.2
0.4
PO
43-
upt
ake
/pro
du
ctio
n [
mm
ol m
-2 d
-1]
Coo1 Coo2 Coo3 Coo4 Coo5
Coo1 Coo2 Coo3 Coo4 Coo5
Coo1 Coo2 Coo3 Coo4 Coo5
Figure 24: Net 24-hours benthic ammonia, NH4
+, and phosphate, PO43-, fluxes in August 2007
(a,b) and in February 2008 (c,d). Error bars are the standard deviation from the average with n=3. Benthic silica fluxes vary significantly between seasons. Light and dark silica fluxes in the winter are very small and no significant differences are observed between light and dark fluxes suggesting
23
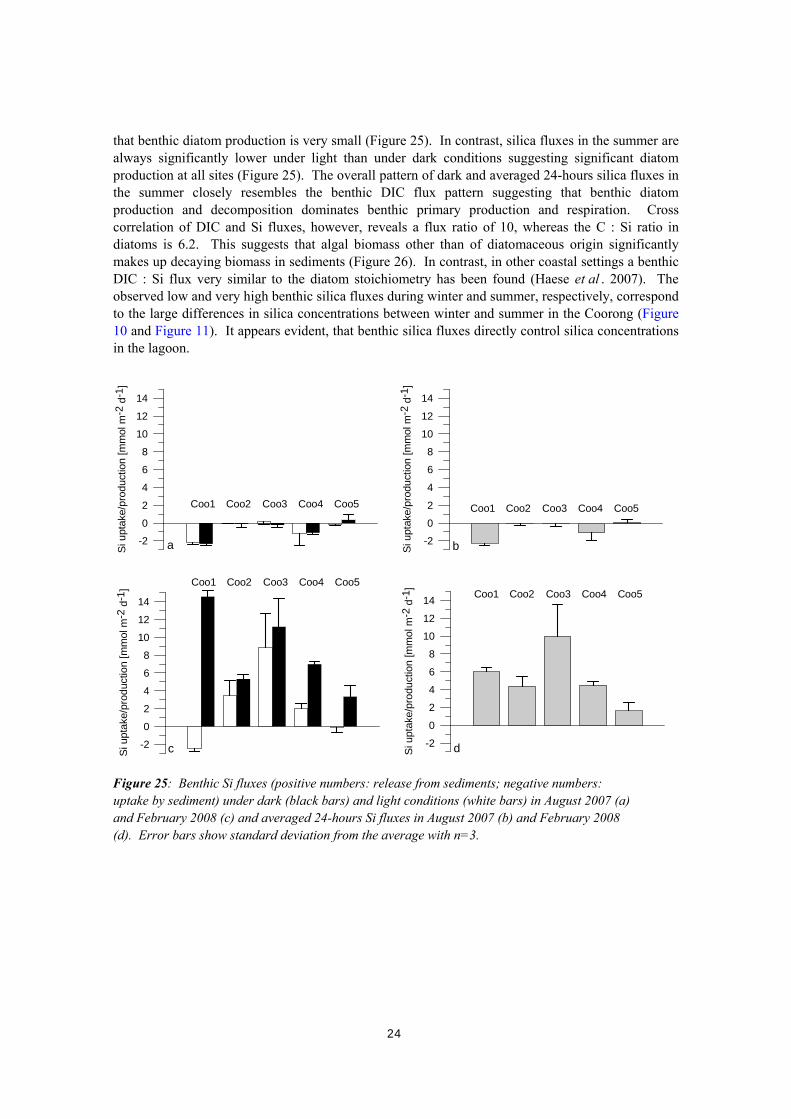
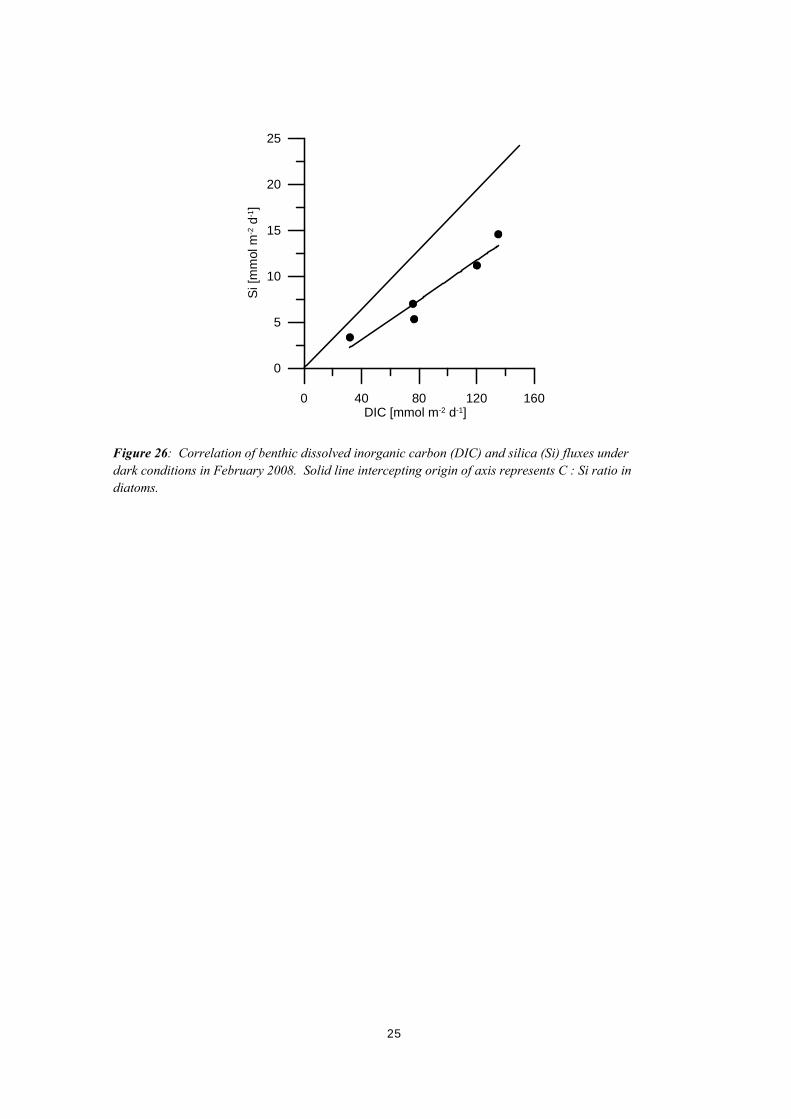
that benthic diatom production is very small (Figure 25). In contrast, silica fluxes in the summer are always significantly lower under light than under dark conditions suggesting significant diatom production at all sites (Figure 25). The overall pattern of dark and averaged 24-hours silica fluxes in the summer closely resembles the benthic DIC flux pattern suggesting that benthic diatom production and decomposition dominates benthic primary production and respiration. Cross correlation of DIC and Si fluxes, however, reveals a flux ratio of 10, whereas the C : Si ratio in diatoms is 6.2. This suggests that algal biomass other than of diatomaceous origin significantly makes up decaying biomass in sediments (Figure 26). In contrast, in other coastal settings a benthic DIC : Si flux very similar to the diatom stoichiometry has been found (Haese et al . 2007). The observed low and very high benthic silica fluxes during winter and summer, respectively, correspond to the large differences in silica concentrations between winter and summer in the Coorong (Figure 10 and Figure 11). It appears evident, that benthic silica fluxes directly control silica concentrations in the lagoon.
-2
0
2
4
6
8
10
12
14
Si u
ptak
e/pro
duct
ion
[mm
ol m
-2 d
-1]
-2
0
2
4
6
8
10
12
14S
i upt
ake/p
rodu
ctio
n [m
mol
m-2
d-1
]
a b
-2
0
2
4
6
8
10
12
14
Si u
ptak
e/pro
duct
ion
[mm
ol m
-2 d
-1]
d-2
0
2
4
6
8
10
12
14
Si u
pta
ke/p
rod
uctio
n [m
mol m
-2 d
-1]
c
Coo1 Coo2 Coo3 Coo4 Coo5 Coo1 Coo2 Coo3 Coo4 Coo5
Coo1 Coo2 Coo3 Coo4 Coo5Coo1 Coo2 Coo3 Coo4 Coo5
Figure 25: Benthic Si fluxes (positive numbers: release from sediments; negative numbers: uptake by sediment) under dark (black bars) and light conditions (white bars) in August 2007 (a) and February 2008 (c) and averaged 24-hours Si fluxes in August 2007 (b) and February 2008 (d). Error bars show standard deviation from the average with n=3.
24
0 40 80 120DIC [mmol m-2 d-1]
160
0
5
10
15
20
25
Si [
mm
ol m
-2 d
-1]
Figure 26: Correlation of benthic dissolved inorganic carbon (DIC) and silica (Si) fluxes under dark conditions in February 2008. Solid line intercepting origin of axis represents C : Si ratio in diatoms.
25
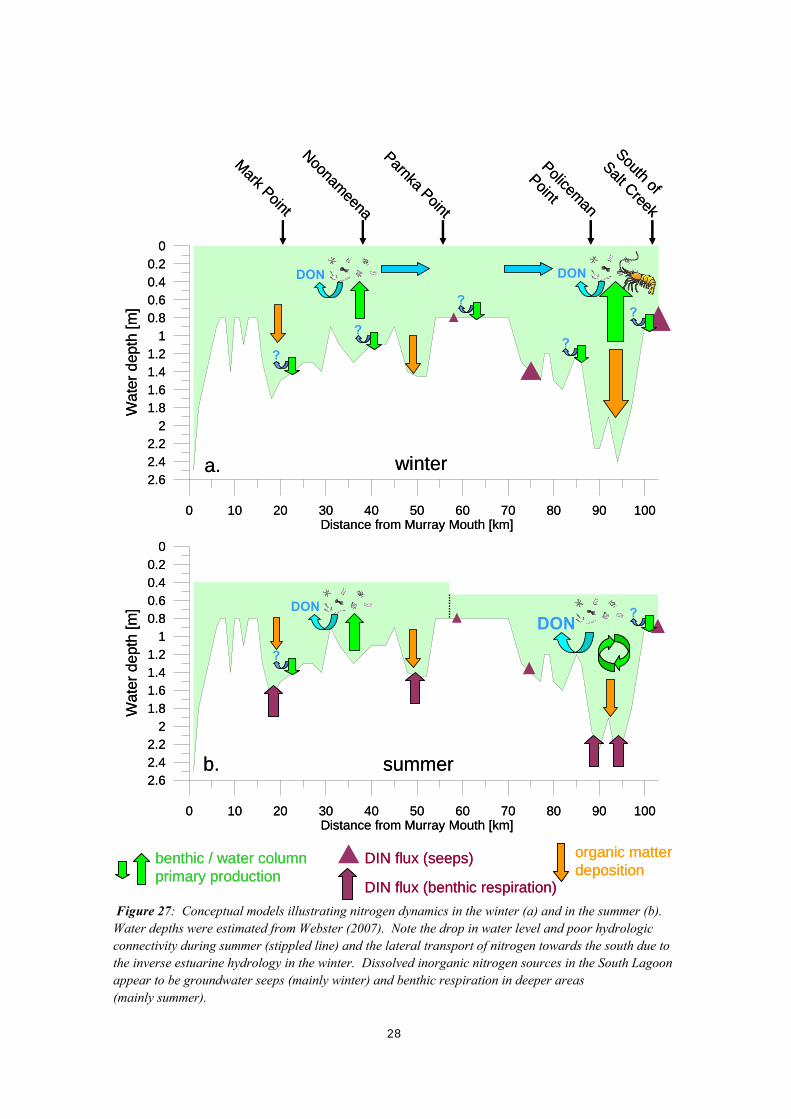
4. Discussion and Conclusions The following discussion identifies key aspects of nutrient distribution and related biogeochemical processes in the Coorong. Algal production rate (primary production) was found to be primarily nitrogen-limited. Consequently, conceptual diagrams were developed describing nitrogen dynamics during winter and summer. The conceptual diagrams are found at the end of this section in Figure 27. 4.1. WATER QUALITY Water quality varies distinctively between the most northern sampling site at Mark Point and the southern end of the Coorong near Salt Creek. A steep salinity gradient is found between the northern and southern end of the Coorong at all times, which reflects the net evaporation and increase in water residence time towards the south. The steepest salinity gradient is found at the end of the summer with maximum salinities close to 200. Dissolved and particulate nutrient distribution also varies distinctively from north to south and between seasons. Only dissolved inorganic nitrogen (ammonia, nitrate, nitrite) and dissolved inorganic phosphorous concentrations are consistently very low, i.e. below 4 and 1 μmol L-1, respectively. Only site Coo5, south of Salt Creek, had an exceptionally high ammonia concentration of 34 μmol L-1 in the winter. Based on nutrient stoichiometry in the water column, it is concluded that primary production is predominantly nitrogen limited. Only the far south was likely phosphorous limited during the winter. Particulate nitrogen to particulate phosphorous concentration ratios are consistently close to the Redfield ratio suggesting that primarily algal biomass contributes to nitrogen and phosphorous in the suspended matter. The water volume of the South Lagoon in the summer is only about two thirds of the winter volume (Jensen and Nicholson 1993), because of a seasonal drop in the oceanic water level, poor hydrologic connectivity between the North and South Lagoon (Figure 27), no significant freshwater inflow, and the high evaporation during the summer. In the absence of any nutrient sources and sinks, nutrient concentrations should therefore be about one third higher in the summer than in the winter. This is indeed found for total phosphorous, however, total nitrogen concentrations are about twice, and silica concentrations are about 5 times higher in the summer than in the winter. This suggests that internal sources add significant amounts of nitrogen and silica to the South Lagoon particularly during the summer. Dissolved organic matter contributes the largest nitrogen and phosphorous fractions and correlates linearly with salinity. The molar C : N : P ratio of dissolved organic matter is approximately 650 : 65 : 1. The accumulation of dissolved organic matter with a particularly high N : P ratio is the likely cause for the deficiency in nitrogen in the dissolved inorganic fraction. The latter fraction is typically regarded as the bioavailable fraction for primary production. Our results show that the dissolved organic matter concentration correlates linearly with salinity and contributes significantly to the total alkalinity. Furthermore, published salinity dependent dissociation constants of the carbonate equilibrium vary greatly. This leads to large differences in calculated dissolved inorganic carbon concentrations using measured total alkalinity concentrations and pH. Given the significant contribution of organic alkalinity to total alkalinity and the large discrepancies in calculated dissolved inorganic carbon concentrations using total alkalinity and pH data, it is strongly recommended to measure dissolved inorganic carbon directly (see 2.4). In line
26
with other studies showing significant organic alkalinity in coastal water bodies with restricted circulation and high dissolved organic carbon concentrations (Hernádez-Ayon et al. 2007) we infer that the respective dissolved organic matter is produced by microalgae (Figure 27). Note however, that the reported organic alkalinity in natural waters does not exceed 200 μmol kg-1 (Hernádez-Ayon et al . 2007), whereas our results show organic alkalinity concentrations of up to 1600 μmol kg-1. Such large enrichment is likely related to the high algal productivity and the long water residence time in the Coorong, which also explains the good correlation between organic alkalinity and salinity. In light of the quantitatively important production of dissolved organic matter we recognize that primary production rates derived from dissolved inorganic carbon uptake rates measured in syringe incubations are likely overestimated. A fraction of dissolved inorganic matter taken up by microalgae is likely not used to form biomass, but converted and released as dissolved organic matter. However, given the low respiration rates in the water column and the build-up of high dissolved organic matter concentrations, the produced dissolved organic matter is most likely not fuelling the microbial loop (eg Anderson and Ducklow 2001). The latter would lead to a gross overestimate of primary production rates using our method, but this is here not the case. 4.2. NUTRIENT DYNAMICS Nutrient dynamics within the Coorong are discussed here by addressing relationships and dependencies between nutrient sources such as river and groundwater discharge, the uptake of nutrients by benthic and water column primary production and nutrient loss through outflow to the ocean or retention in sediments. This ‘holistic’ view builds on measured state variables and process rates, but also includes informed assumptions where possible. Nutrient dynamics are conceptually illustrated in Figure 27. Rates of primary production in the water column showed a steep north to south gradient in the winter reaching maximum 24-hours net DIC uptake rates of about 90 mmol m-2 d-1 in the far south, which is classified as ‘eutrophic’ (Nixon 1995). In summer, primary production in the water column was distinctively lower and reached maximum 24-hours net DIC uptake rates of about 50 mmol m-2 d-1 in the central part of the North Lagoon, which is considered to be ‘mesotrophic’ (Nixon 1995). Concurrently, we observed exceptionally high ammonia concentrations in the far south during the winter, most likely fuelling primary production. Groundwater discharge and respective nutrient fluxes at seeps were only measured during the summer, but revealed up to 200 times higher ammonia concentrations in seep fluids compared to ambient lagoon water. It appears likely that high groundwater discharge enriched in ammonia leads to the ammonia anomaly in the South Lagoon during the winter, which then in turn leads to very high rates of primary production (Figure 27). High rates of primary production with concurrent salinities below 150 may form favourable conditions for brine shrimp, which have only been observed in great abundances during winter and spring (Figure 27). Even though we are lacking quantitative data on brine shrimp, it appears possible that brine shrimp have a top-down control on phytoplankton during the winter. The balance between benthic photosynthesis and respiration changed from net photosynthesis during the winter to net respiration during the summer at a whole lagoon scale (Figure 27). This change is likely related to the strong control of temperature on rates of respiration. Arnosti and colleagues (1998) found a two-fold increase in the rate of aerobic respiration and a six-fold increase in the sulfate reduction rate when temperatures were raised from about 15 to 25ºC in coastal sediments from temperate Europe.
27
28
0 10 20 30 40 50 60 70 80 90 100Distance from Murray Mouth [km]
2.62.42.2
21.81.61.41.2
10.80.60.40.2
0
Wate
r dep
th [m
]
Mark Point
Noonameena
ParnkaPoint
Policeman
Point
South of
Salt Creek
0 10 20 30 40 50 60 70 80 90 100Distance from Murray Mouth [km]
2.62.42.2
21.81.61.41.2
10.80.60.40.2
0
Wate
r dep
th [m
]
DON
?
??
?
?
DON
DON
a.
b.
winter
summer
?
?
DON
benthic / water columnprimary production
DIN flux (seeps)
DIN flux (benthic respiration)
organic matterdeposition
0 10 20 30 40 50 60 70 80 90 100Distance from Murray Mouth [km]
2.62.42.2
21.81.61.41.2
10.80.60.40.2
0
Wate
r dep
th [m
]
Mark Point
Noonameena
ParnkaPoint
Policeman
Point
South of
Salt Creek
0 10 20 30 40 50 60 70 80 90 100Distance from Murray Mouth [km]
2.62.42.2
21.81.61.41.2
10.80.60.40.2
0
Wate
r dep
th [m
]
DON
?
??
?
?
DON
DON
a.
b.
winter
summer
?
?
DON
benthic / water columnprimary production
DIN flux (seeps)
DIN flux (benthic respiration)
organic matterdeposition
Figure 27: Conceptual models illustrating nitrogen dynamics in the winter (a) and in the summer (b). Water depths were estimated from Webster (2007). Note the drop in water level and poor hydrologic connectivity during summer (stippled line) and the lateral transport of nitrogen towards the south due to the inverse estuarine hydrology in the winter. Dissolved inorganic nitrogen sources in the South Lagoon appear to be groundwater seeps (mainly winter) and benthic respiration in deeper areas (mainly summer).
Given the moderate to high net primary production rates at all times in the water column of the Coorong, sediment respiration rates were found to be surprisingly low. This is possibly related to the selection of sampling sites for benthic flux studies. All sampling sites were approximately at a water depth of 60 centimetres and accessed by walking into the lagoon. The wave action in such shallow water typically does not allow fine sediments including particulate organic matter to settle permanently. In contrast, organic matter may accumulate rapidly in deep water areas, which we did not sample (Figure 27). It is therefore likely that benthic respiration measured at the five sites underestimates total benthic respiration at a whole system scale. Importantly, inorganic nutrient fluxes were exceptionally low relative to the dissolved inorganic carbon fluxes, except for site Coo3 in the summer. This means that dissolved inorganic nitrogen and phosphorous, which are mobilised in sediments by organic matter break-down are converted into non-biologically available fractions. This could either be through the formation of di-nitrogen gas or dissolved organic matter (Figure 27) or effective retention in sediments in particular by adsorption/precipitation of phosphorous. Irrespective of the underlying process, it is concluded that shallow water sediments do not serve as a major source of bioavailable nitrogen or phosphorous. This study has delivered important information on nutrient distribution, control mechanisms on the bioavailability of nutrients and rates of primary production in the water column as well as benthic nutrient fluxes in shallow margin sediments along the salinity gradient. However, water quality scenario simulations supporting the development of management plans will require a more comprehensive and quantitative understanding of nutrient dynamics in the Coorong. We recommend focusing future studies on the following questions:
1. How important are currently groundwater seeps for water quality in the Coorong? Has groundwater seepage changed with land development?
2. Are deep areas in the Coorong high sediment and biomass accumulation sites? Are benthic nutrient fluxes significantly higher in deep areas compared to shallow margins?
3. What are the chemical conditions, in particular salinity, for mineral precipitation and co-precipitation of phosphorous?
The first two questions are pertinent for the development of nutrient budgets based on experimental field data, which are critical for the calibration and validation of numeric models used in scenario simulations. The third question addresses a gap in our biogeochemical process understanding, which is particularly critical for our capability to project water quality in an increasingly saline environment.
29
5. References Anderson, T.R. and Ducklow, H.W. (2001) Microbial loop carbon cycling in ocean environments
studied using a simple steady-state model. Aquatic Microbial Ecology 26, 37-49. Arnosti, C., Jørgensen, B.B., Sagemann, J. and Thamdrup, B. (1998) Temperature dependence of
microbial degradation of organic matter in marine sediments: polysaccharide hydrolysis, oxygen consumption, and sulfate reduction. Marine Ecology Progress Series 165, 59-70.
Barnett, S.R. (1991) Pinnaroo Hydrogeological Map (1:250 000 scale). Australian Geological
Survey Organisation. Barnett, S.R. (1994) Adelaide-Barker Hydrogeological Map (1:250 000 scale).
Australian Geological Survey Organisation. Bjerrum, J., Schwarzenbach, G., and Sillén, L.G. (1958) Stability constants. Part II.
Inorganic ligands. The Chemical Society, London. 131 pp. Brown, K.G., Love, A. and Harrington, G. (2001) Vertical groundwater recharge to the Tertiary
confined sand aquifer, South East, South Australia. Report DWR 2001/002. Department for Water Resources.
Cai, W.-J. and Wang, Y. (1998) The chemistry, fluxes and sources of carbon dioxide in the estuarine
waters of the Satilla and Altamaha Rivers, Georgia. Limnology a nd Oceanography 43, 657-668.
Cai, W.-J., Wang, Y. and Hodson, R.E. (1998) Acid-base properties of dissolved organic matter in
estuarine waters of Georgia, USA. Geochimica Cosmochimica Acta 62, 473-483. Cobb, M.A. and Barnett, S.R. (1994) Naracoote Hydrogeological Map (1:250 000 scale).
Australian Geological Survey Organisation. Everingham, P., Fisher, G., Jones, R. and Nicholson, B. (2005) Coorong water quality assessment.
Deptartment of Water, Land and Biodiversity Conservation, South Australia. Ford, P.W. (2007) Biogeochemistry of the Coorong. Review and identification of future research
requirements. Water for a Healthy Country National Research Flagship, CSIRO Report Series, Canberra.
Grasshoff, K., Ehrhardt, M. and Kremling, K. (1983) Methods of seawater analysis. Verlag Chemie,
Weinheim. Haese, R.R., Murray, E., Smith, C., Smith, J. and Heggie, D.T. (2007) Diatoms control nutrient
dynamics in a temperate, wave-dominated estuary (southeast Australia). Limnology a nd Oceanography 52, 2686-2700.
Haese, R.R., Gow, L., Wallace, L. and Brodie, R.S. (2008) Identifying groundwater discharge in the
Coorong (South Australia). AusgeoNews 91, 1-6.
30
Hernández-Ayon, M. J., Zirino, A., Dickson, A.G., Camiro-Vargas, T. and Valenzuela-Espinoza, E. (2007) Estimating the contribution of organic bases from microalgae to the titration alkalinity in coastal seawaters. Limnology and Oceanography: Methods 5, 225-232.
Jensen, A. and Nicholson, C. (1993) Conservation value of the Coorong ecosystem. Department of
Environment and Land Management, Adelaide, South Australia. Lamontagne, S., McEwan, K., Webster, I., Ford, P., Leaney, F. and Walker, G. (2004). Coorong,
Lower Lakes and Murray Mouth. Knowledge gaps and knowledge needs for delivering better ecological outcomes. Water for a Healthy Country National Research Flagship CSIRO Report Series, Canberra.
Lee, D.R. (1977) A device for measuring seepage flux in lakes and estuaries. Limnology an d
Oceanography 22, 140-147. Lee, D. R. and Cherry, J.A. (1978) A field exercise on groundwater flow using seepage meters and
mini-piezometers. Journal of Geological Education 27, 6-10. Lewis, E. and Wallace, D.W.R..(1998) MS Excel Program Developed for CO2 System Calculations.
ORNL/CDIAC-105. Carbon Dioxide Information Analysis Center, Oak Ridge National Laboratory, U.S. Department of Energy, Oak Ridge, Tennessee.
Lyman, J. (1956) Buffer mechanism of sea water. Ph.D. Thesis, University of California, Los
Angeles. 196 pp. Mehrbach, C., Culberson, C.H., Hawley, J.E. and Pytkowitcz, R.M. (1973). Measurement of the
apparent dissociation constants of carbonic acid in seawater at atmospheric pressure. Limnology and Oceanography 18, 897-907.
Millero, F.J., Graham, T.B., Huang, F., Bustos-Serrano, H. and Pierrot, D. (2006) Dissociation
constants of carbonic acid in seawater as a function of salinity and temperature. Marine Chemistry 100, 80-94.
Nixon, S.W. (1995) Coastal marine eutrophication: A definition, social causes, and future concerns.
Ophelia 41, 199-219. Phillips, W., Muller, K. (2006) Ecological character of the Coorong, Lakes Alexandrina and Albert
wetland of international importance. Department for Environment and Heritage, Adelaide, South Australian.
O'Driscoll, E.P.D. (1961) The hydrology of the Murray Basin Province of South Australia.
Department of Mines, South Australia Geological Survey Bulletin 35 (1,2). Tyler, M.J., Twidale, C.R., Ling, J.K. and Holmes, J.W. (1983) Natural history of the South East.
Royal Society of South Australia. Von der Borch, C.C., Lock, D. and Schwebel, D. (1975) Ground-water formation of dolomite in the
Coorong region of South Australia. Geology 3, 283-285.
31

32
Webster, I.T. (2005) An overview of the hydrodynamics of the Coorong and Murray Mouth. Water for a Healthy Country National Research Flagship. CSIRO Report Series, Canberra.
Webster, I.T. (2007) Hydrodynamic modelling of the Coorong. Water for a Healthy Country
National Research Flagship, CSIRO Report Series, Canberra.