Embed Size (px)
Citation preview
1234567890123456789012345678901212345678901234567890123456789012123456789012345678901234567890121234567812345678901234567890123456789012123456789012345678901234567890121234567890123456789012345678901212345678123456789012345678901234567890121234567890123456789012345678901212345678901234567890123456789012123456781234567890123456789012345678901212345678901234567890123456789012123456789012345678901234567890121234567812345678901234567890123456789012123456789012345678901234567890121234567890123456789012345678901212345678123456789012345678901234567890121234567890123456789012345678901212345678901234567890123456789012123456781234567890123456789012345678901212345678901234567890123456789012123456789012345678901234567890121234567812345678901234567890123456789012123456789012345678901234567890121234567890123456789012345678901212345678123456789012345678901234567890121234567890123456789012345678901212345678901234567890123456789012123456781234567890123456789012345678901212345678901234567890123456789012123456789012345678901234567890121234567812345678901234567890123456789012123456789012345678901234567890121234567890123456789012345678901212345678123456789012345678901234567890121234567890123456789012345678901212345678901234567890123456789012123456781234567890123456789012345678901212345678901234567890123456789012123456789012345678901234567890121234567812345678901234567890123456789012123456789012345678901234567890121234567890123456789012345678901212345678123456789012345678901234567890121234567890123456789012345678901212345678901234567890123456789012123456781234567890123456789012345678901212345678901234567890123456789012123456789012345678901234567890121234567812345678901234567890123456789012123456789012345678901234567890121234567890123456789012345678901212345678123456789012345678901234567890121234567890123456789012345678901212345678901234567890123456789012123456781234567890123456789012345678901212345678901234567890123456789012123456789012345678901234567890121234567812345678901234567890123456789012123456789012345678901234567890121234567890123456789012345678901212345678123456789012345678901234567890121234567890123456789012345678901212345678901234567890123456789012123456781234567890123456789012345678901212345678901234567890123456789012123456789012345678901234567890121234567812345678901234567890123456789012123456789012345678901234567890121234567890123456789012345678901212345678123456789012345678901234567890121234567890123456789012345678901212345678901234567890123456789012123456781234567890123456789012345678901212345678901234567890123456789012123456789012345678901234567890121234567812345678901234567890123456789012123456789012345678901234567890121234567890123456789012345678901212345678123456789012345678901234567890121234567890123456789012345678901212345678901234567890123456789012123456781234567890123456789012345678901212345678901234567890123456789012123456789012345678901234567890121234567812345678901234567890123456789012123456789012345678901234567890121234567890123456789012345678901212345678123456789012345678901234567890121234567890123456789012345678901212345678901234567890123456789012123456781234567890123456789012345678901212345678901234567890123456789012123456789012345678901234567890121234567812345678901234567890123456789012123456789012345678901234567890121234567890123456789012345678901212345678123456789012345678901234567890121234567890123456789012345678901212345678901234567890123456789012123456781234567890123456789012345678901212345678901234567890123456789012123456789012345678901234567890121234567812345678901234567890123456789012123456789012345678901234567890121234567890123456789012345678901212345678
Nutrient Recommendationsfor Field Crops in
Vermont
123456789012345678901234567890121234567890123456789012345678901212345678901234567890123456789012123456789012345678901234567890121234567890123456789012345678901212123456789012345678901234567890121234567890123456789012345678901212345678901234567890123456789012123456789012345678901234567890121234567890123456789012345678901212123456789012345678901234567890121234567890123456789012345678901212345678901234567890123456789012123456789012345678901234567890121234567890123456789012345678901212123456789012345678901234567890121234567890123456789012345678901212345678901234567890123456789012123456789012345678901234567890121234567890123456789012345678901212123456789012345678901234567890121234567890123456789012345678901212345678901234567890123456789012123456789012345678901234567890121234567890123456789012345678901212123456789012345678901234567890121234567890123456789012345678901212345678901234567890123456789012123456789012345678901234567890121234567890123456789012345678901212123456789012345678901234567890121234567890123456789012345678901212345678901234567890123456789012123456789012345678901234567890121234567890123456789012345678901212123456789012345678901234567890121234567890123456789012345678901212345678901234567890123456789012123456789012345678901234567890121234567890123456789012345678901212123456789012345678901234567890121234567890123456789012345678901212345678901234567890123456789012123456789012345678901234567890121234567890123456789012345678901212123456789012345678901234567890121234567890123456789012345678901212345678901234567890123456789012123456789012345678901234567890121234567890123456789012345678901212123456789012345678901234567890121234567890123456789012345678901212345678901234567890123456789012123456789012345678901234567890121234567890123456789012345678901212123456789012345678901234567890121234567890123456789012345678901212345678901234567890123456789012123456789012345678901234567890121234567890123456789012345678901212123456789012345678901234567890121234567890123456789012345678901212345678901234567890123456789012123456789012345678901234567890121234567890123456789012345678901212123456789012345678901234567890121234567890123456789012345678901212345678901234567890123456789012123456789012345678901234567890121234567890123456789012345678901212123456789012345678901234567890121234567890123456789012345678901212345678901234567890123456789012123456789012345678901234567890121234567890123456789012345678901212123456789012345678901234567890121234567890123456789012345678901212345678901234567890123456789012123456789012345678901234567890121234567890123456789012345678901212123456789012345678901234567890121234567890123456789012345678901212345678901234567890123456789012123456789012345678901234567890121234567890123456789012345678901212123456789012345678901234567890121234567890123456789012345678901212345678901234567890123456789012123456789012345678901234567890121234567890123456789012345678901212123456789012345678901234567890121234567890123456789012345678901212345678901234567890123456789012123456789012345678901234567890121234567890123456789012345678901212123456789012345678901234567890121234567890123456789012345678901212345678901234567890123456789012123456789012345678901234567890121234567890123456789012345678901212123456789012345678901234567890121234567890123456789012345678901212345678901234567890123456789012123456789012345678901234567890121234567890123456789012345678901212123456789012345678901234567890121234567890123456789012345678901212345678901234567890123456789012123456789012345678901234567890121234567890123456789012345678901212123456789012345678901234567890121234567890123456789012345678901212345678901234567890123456789012123456789012345678901234567890121234567890123456789012345678901212123456789012345678901234567890121234567890123456789012345678901212345678901234567890123456789012123456789012345678901234567890121234567890123456789012345678901212
123456789012345678901234567890121234567890123456789012345678901212345678901234567890123456789012123456781234567890123456789012345678901212345678901234567890123456789012123456789012345678901234567890121234567812345678901234567890123456789012123456789012345678901234567890121234567890123456789012345678901212345678123456789012345678901234567890121234567890123456789012345678901212345678901234567890123456789012123456781234567890123456789012345678901212345678901234567890123456789012123456789012345678901234567890121234567812345678901234567890123456789012123456789012345678901234567890121234567890123456789012345678901212345678123456789012345678901234567890121234567890123456789012345678901212345678901234567890123456789012123456781234567890123456789012345678901212345678901234567890123456789012123456789012345678901234567890121234567812345678901234567890123456789012123456789012345678901234567890121234567890123456789012345678901212345678123456789012345678901234567890121234567890123456789012345678901212345678901234567890123456789012123456781234567890123456789012345678901212345678901234567890123456789012123456789012345678901234567890121234567812345678901234567890123456789012123456789012345678901234567890121234567890123456789012345678901212345678123456789012345678901234567890121234567890123456789012345678901212345678901234567890123456789012123456781234567890123456789012345678901212345678901234567890123456789012123456789012345678901234567890121234567812345678901234567890123456789012123456789012345678901234567890121234567890123456789012345678901212345678123456789012345678901234567890121234567890123456789012345678901212345678901234567890123456789012123456781234567890123456789012345678901212345678901234567890123456789012123456789012345678901234567890121234567812345678901234567890123456789012123456789012345678901234567890121234567890123456789012345678901212345678
123456789012345678901234567890121234567890123456789012345678901212345678901234567890123456789012123456789012345678901234567890121234567890123456789012345678901212123456789012345678901234567890121234567890123456789012345678901212345678901234567890123456789012123456789012345678901234567890121234567890123456789012345678901212123456789012345678901234567890121234567890123456789012345678901212345678901234567890123456789012123456789012345678901234567890121234567890123456789012345678901212123456789012345678901234567890121234567890123456789012345678901212345678901234567890123456789012123456789012345678901234567890121234567890123456789012345678901212123456789012345678901234567890121234567890123456789012345678901212345678901234567890123456789012123456789012345678901234567890121234567890123456789012345678901212123456789012345678901234567890121234567890123456789012345678901212345678901234567890123456789012123456789012345678901234567890121234567890123456789012345678901212123456789012345678901234567890121234567890123456789012345678901212345678901234567890123456789012123456789012345678901234567890121234567890123456789012345678901212123456789012345678901234567890121234567890123456789012345678901212345678901234567890123456789012123456789012345678901234567890121234567890123456789012345678901212123456789012345678901234567890121234567890123456789012345678901212345678901234567890123456789012123456789012345678901234567890121234567890123456789012345678901212123456789012345678901234567890121234567890123456789012345678901212345678901234567890123456789012123456789012345678901234567890121234567890123456789012345678901212123456789012345678901234567890121234567890123456789012345678901212345678901234567890123456789012123456789012345678901234567890121234567890123456789012345678901212123456789012345678901234567890121234567890123456789012345678901212345678901234567890123456789012123456789012345678901234567890121234567890123456789012345678901212123456789012345678901234567890121234567890123456789012345678901212345678901234567890123456789012123456789012345678901234567890121234567890123456789012345678901212123456789012345678901234567890121234567890123456789012345678901212345678901234567890123456789012123456789012345678901234567890121234567890123456789012345678901212123456789012345678901234567890121234567890123456789012345678901212345678901234567890123456789012123456789012345678901234567890121234567890123456789012345678901212123456789012345678901234567890121234567890123456789012345678901212345678901234567890123456789012123456789012345678901234567890121234567890123456789012345678901212123456789012345678901234567890121234567890123456789012345678901212345678901234567890123456789012123456789012345678901234567890121234567890123456789012345678901212123456789012345678901234567890121234567890123456789012345678901212345678901234567890123456789012123456789012345678901234567890121234567890123456789012345678901212123456789012345678901234567890121234567890123456789012345678901212345678901234567890123456789012123456789012345678901234567890121234567890123456789012345678901212123456789012345678901234567890121234567890123456789012345678901212345678901234567890123456789012123456789012345678901234567890121234567890123456789012345678901212123456789012345678901234567890121234567890123456789012345678901212345678901234567890123456789012123456789012345678901234567890121234567890123456789012345678901212123456789012345678901234567890121234567890123456789012345678901212345678901234567890123456789012123456789012345678901234567890121234567890123456789012345678901212
Revised March 2004

Introduction ................................................................................................................................................... 1 Frequency of Soil Sampling..................................................................................................................... 1 Soil Test Levels for Phosphorus and Potassium................................................................................... 1
Aglime ............................................................................................................................................................. 2
Nitrogen .......................................................................................................................................................... 3 Nitrogen for Annual Crops ..................................................................................................................... 3 Credit for Previous Crop .................................................................................................................... 4 Pre-sidedress Soil Nitrate Test (PSNT) for Corn ............................................................................. 5 Nitrogen for Perennial Forages............................................................................................................... 5 Establishment (Seeding Down) ......................................................................................................... 5 Topdressing .......................................................................................................................................... 6
Phosphorus .................................................................................................................................................... 7 Reserve Phosphorus ................................................................................................................................. 8 Phosphorus Index to Assess Runoff Potential ...................................................................................... 9
Potassium ....................................................................................................................................................... 9
Secondary and Micronutrients ................................................................................................................... 9 Magnesium Recommendation—All Crops ........................................................................................... 9 Zinc for Corn ............................................................................................................................................. 9 Boron on Perennial Legume Forages ................................................................................................... 10
Nutrient Credits from Manure ................................................................................................................. 11 Nutrient Content ..................................................................................................................................... 11 Availability of Ammonium Nitrogen................................................................................................... 12 Availability of Organic Nitrogen ..........................................................................................................13 Other Nutrients ....................................................................................................................................... 14
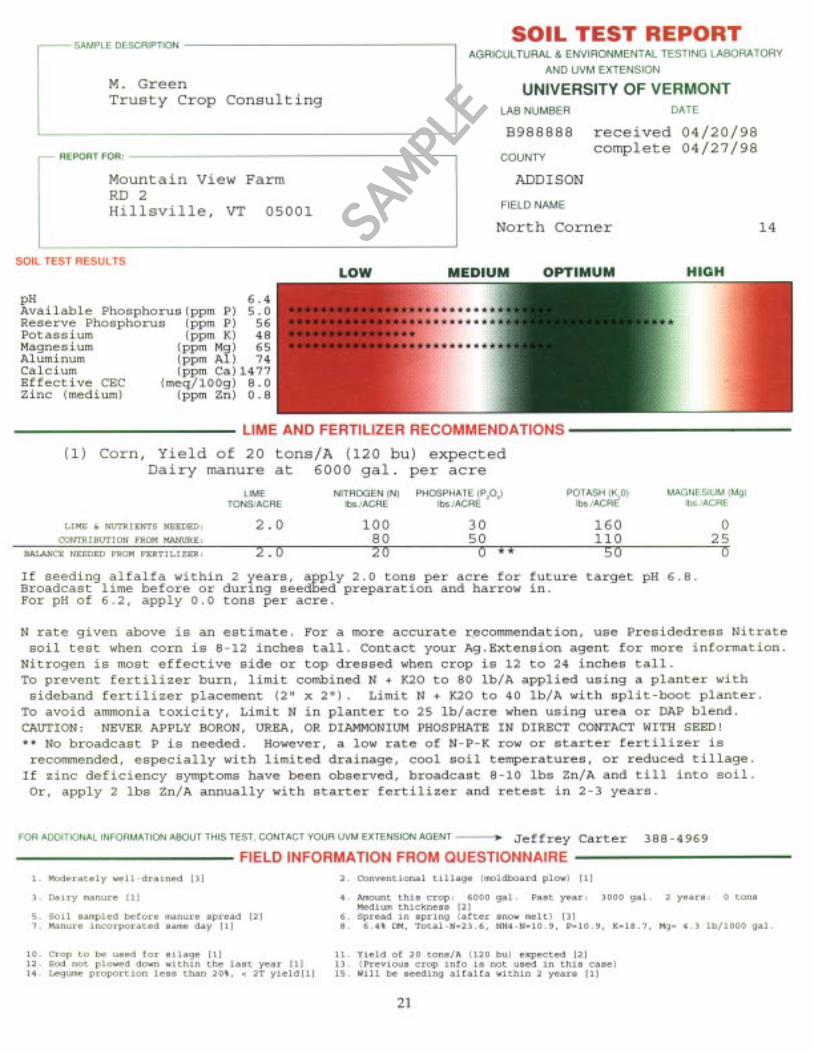
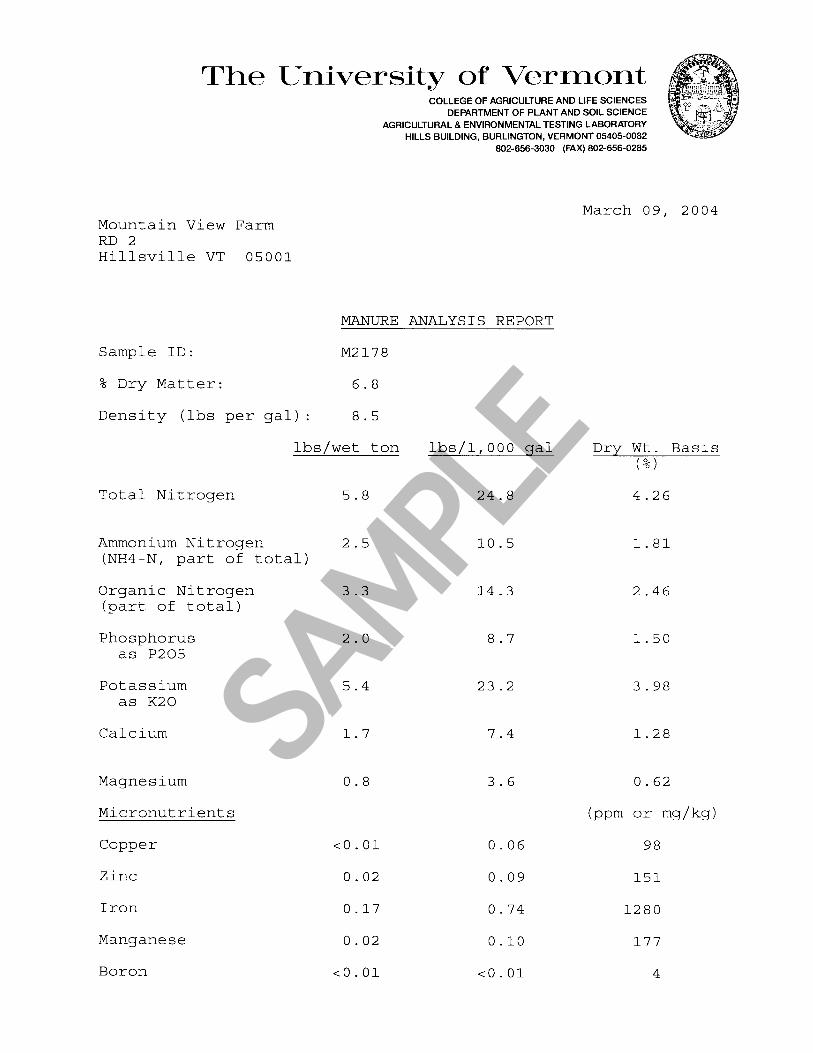
Appendix ...................................................................................................................................................... 16 Soil Testing Lab Methods ......................................................................................................................16 Soil Test Categories Expressed in Alternative Units ..........................................................................16 Conversion Factors for Soil Test Units .................................................................................................16 Crop Nutrient Removal .........................................................................................................................17 Fertilizer Nutrient Sources .................................................................................................................... 17 Field Information Questionnaire ..........................................................................................................19 Sample Soil Test Report .........................................................................................................................21 Sample Manure Analysis Report ..........................................................................................................22
References .................................................................................................................................................... 23
Table of Contents
1. Soil test categories ............................................................................................................................................. 2
2. Interpretation of soil test categories ............................................................................................................... 2
3. Aglime requirement based on soil pH, reactive Al, and target pH ........................................................... 3
4. Recommended nitrogen rates for annual crops (without credit for manure or previous crop) ........... 4
5. Nitrogen credits for previous crops ............................................................................................................... 4
6. Recommended nitrogen rates for corn based on the Pre-sidedress Soil Nitrate Test (PSNT) ............... 5
7. Recommended nitrogen rates for establishment of perennial legume or grass forages ........................ 6
8. Recommended nitrogen rates for grass and grass-legume hay and perennial forages ......................... 6
9. Recommended base phosphorus rates .......................................................................................................... 7
10. Phosphorus rate adjustments for crops other than corn and perennial forages ..................................... 8
11. Recommended potassium rates for field crops .......................................................................................... 10
12. Zinc recommendations for corn .................................................................................................................... 11
13. Boron recommendations for perennial forages ........................................................................................... 11
14. Typical values for total nutrient content of manure .................................................................................. 12
15. Availability of ammonium nitrogen from spring- or summer-applied manure ................................... 14
16. Availability of ammonium nitrogen from fall-applied manure ............................................................... 15
17. Availability of organic nitrogen from manure applied in current and past years ................................ 15
18. Vermont soil test categories expressed as pounds per acre in elemental form ..................................... 16
19. Typical crop nutrient removal....................................................................................................................... 17
20. Nutrient content and other properties of fertilizer materials .................................................................. 18
1. Forms of manure nitrogen .............................................................................................................................. 12
2. Loss and resultant availability relative to fertilizer N of ammonium nitrogen from manure as afunction of manure dry matter content and time after spreading ............................................................ 13
List of Tables
List of Figures
Nutrient Recommendations forField Crops in Vermont
By Bill Jokela, Fred Magdoff, Rich Bartlett, Sid Bosworth, and Don Ross
Plant and Soil Science DepartmentUniversity of Vermont
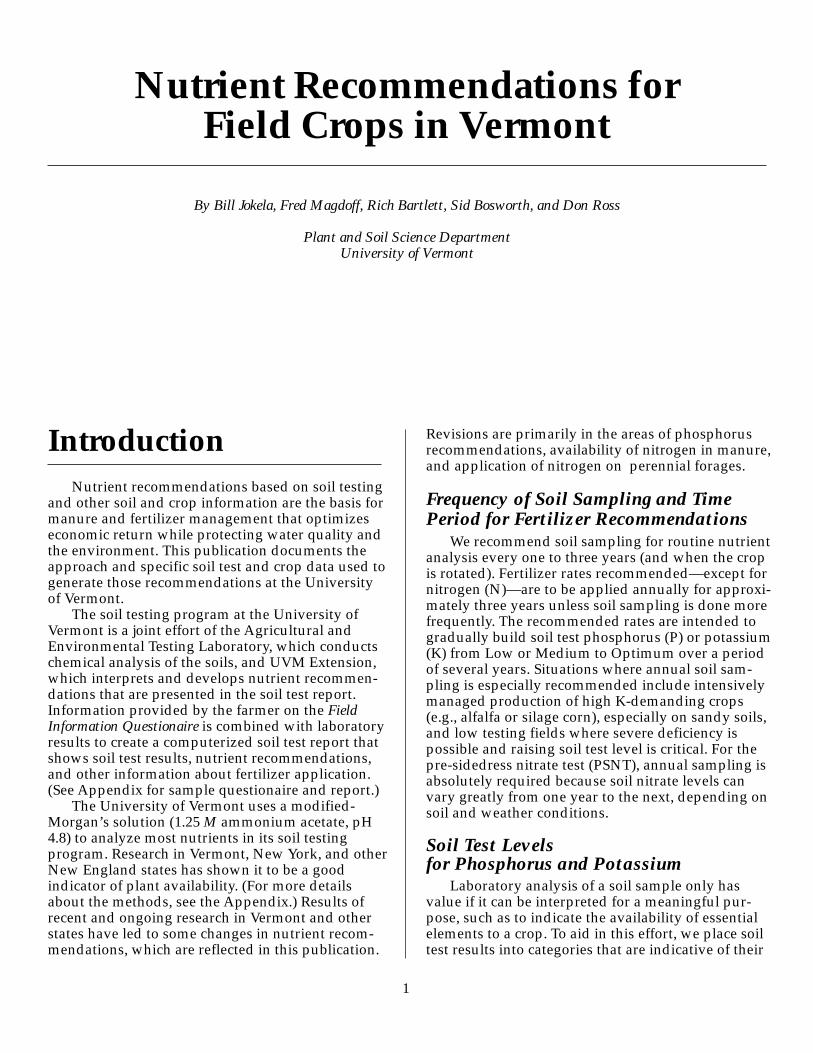
IntroductionNutrient recommendations based on soil testing
and other soil and crop information are the basis formanure and fertilizer management that optimizeseconomic return while protecting water quality andthe environment. This publication documents theapproach and specific soil test and crop data used togenerate those recommendations at the Universityof Vermont.
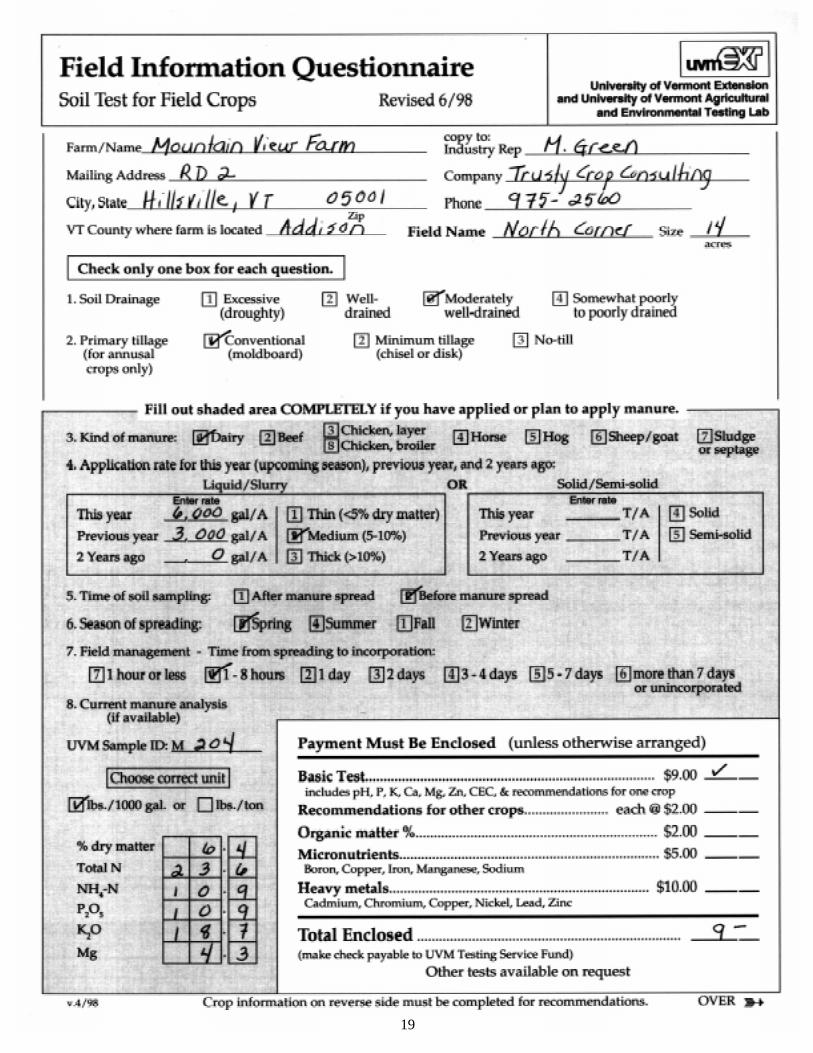
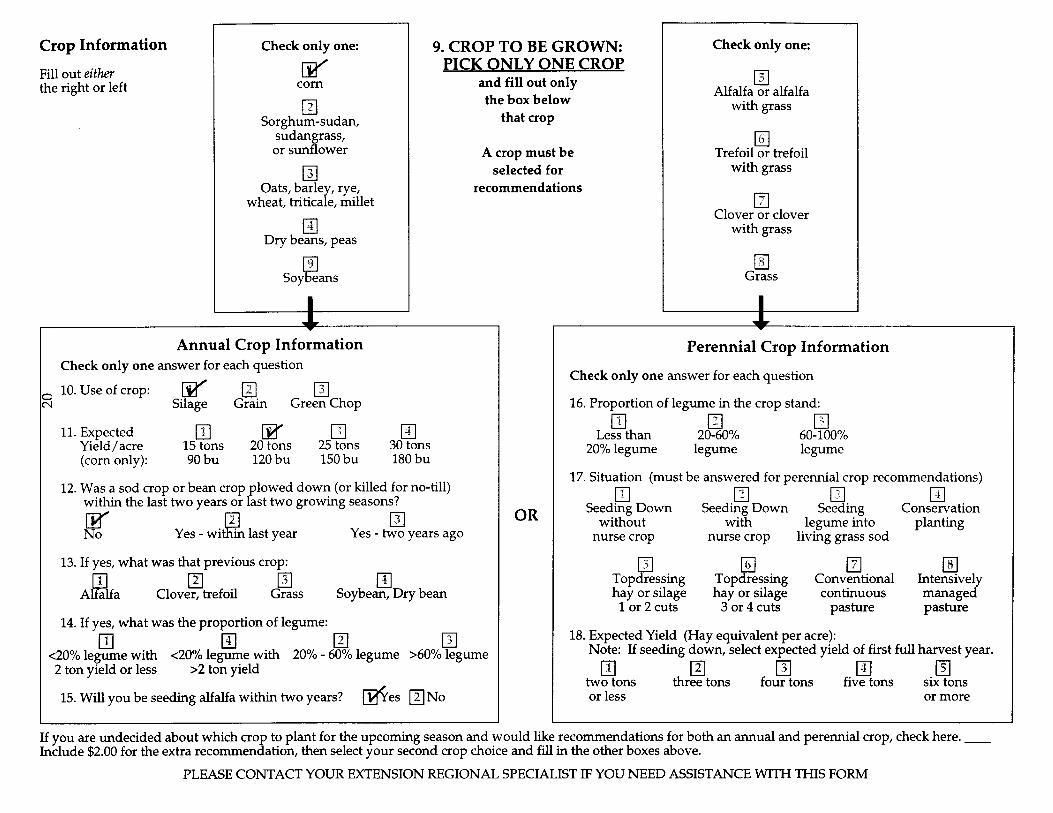
The soil testing program at the University ofVermont is a joint effort of the Agricultural andEnvironmental Testing Laboratory, which conductschemical analysis of the soils, and UVM Extension,which interprets and develops nutrient recommen-dations that are presented in the soil test report.Information provided by the farmer on the FieldInformation Questionaire is combined with laboratoryresults to create a computerized soil test report thatshows soil test results, nutrient recommendations,and other information about fertilizer application.(See Appendix for sample questionaire and report.)
The University of Vermont uses a modified-Morgan’s solution (1.25 M ammonium acetate, pH4.8) to analyze most nutrients in its soil testingprogram. Research in Vermont, New York, and otherNew England states has shown it to be a goodindicator of plant availability. (For more detailsabout the methods, see the Appendix.) Results ofrecent and ongoing research in Vermont and otherstates have led to some changes in nutrient recom-mendations, which are reflected in this publication.
Revisions are primarily in the areas of phosphorusrecommendations, availability of nitrogen in manure,and application of nitrogen on perennial forages.
Frequency of Soil Sampling and TimePeriod for Fertilizer Recommendations
We recommend soil sampling for routine nutrientanalysis every one to three years (and when the cropis rotated). Fertilizer rates recommended—except fornitrogen (N)—are to be applied annually for approxi-mately three years unless soil sampling is done morefrequently. The recommended rates are intended togradually build soil test phosphorus (P) or potassium(K) from Low or Medium to Optimum over a periodof several years. Situations where annual soil sam-pling is especially recommended include intensivelymanaged production of high K-demanding crops(e.g., alfalfa or silage corn), especially on sandy soils,and low testing fields where severe deficiency ispossible and raising soil test level is critical. For thepre-sidedress nitrate test (PSNT), annual sampling isabsolutely required because soil nitrate levels canvary greatly from one year to the next, depending onsoil and weather conditions.
Soil Test Levelsfor Phosphorus and Potassium
Laboratory analysis of a soil sample only hasvalue if it can be interpreted for a meaningful pur-pose, such as to indicate the availability of essentialelements to a crop. To aid in this effort, we place soiltest results into categories that are indicative of their
1
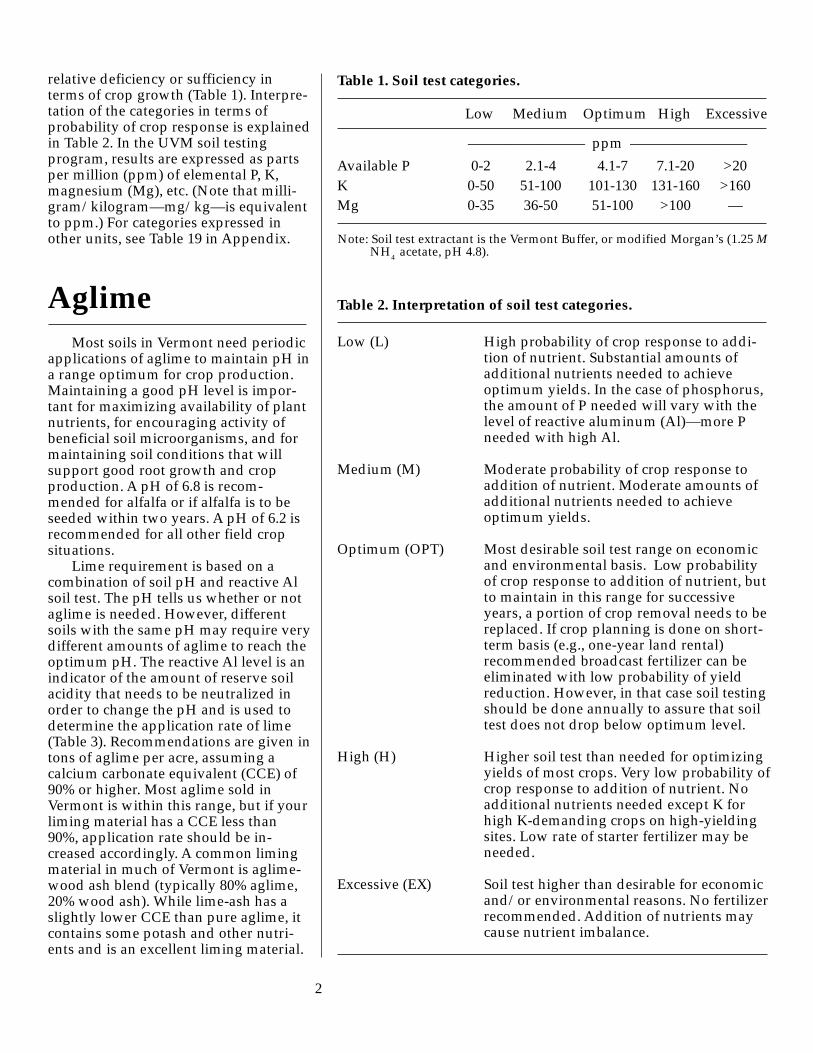
relative deficiency or sufficiency interms of crop growth (Table 1). Interpre-tation of the categories in terms ofprobability of crop response is explainedin Table 2. In the UVM soil testingprogram, results are expressed as partsper million (ppm) of elemental P, K,magnesium (Mg), etc. (Note that milli-gram/kilogram—mg/kg—is equivalentto ppm.) For categories expressed inother units, see Table 19 in Appendix.
AglimeMost soils in Vermont need periodic
applications of aglime to maintain pH ina range optimum for crop production.Maintaining a good pH level is impor-tant for maximizing availability of plantnutrients, for encouraging activity ofbeneficial soil microorganisms, and formaintaining soil conditions that willsupport good root growth and cropproduction. A pH of 6.8 is recom-mended for alfalfa or if alfalfa is to beseeded within two years. A pH of 6.2 isrecommended for all other field cropsituations.
Lime requirement is based on acombination of soil pH and reactive Alsoil test. The pH tells us whether or notaglime is needed. However, differentsoils with the same pH may require verydifferent amounts of aglime to reach theoptimum pH. The reactive Al level is anindicator of the amount of reserve soilacidity that needs to be neutralized inorder to change the pH and is used todetermine the application rate of lime(Table 3). Recommendations are given intons of aglime per acre, assuming acalcium carbonate equivalent (CCE) of90% or higher. Most aglime sold inVermont is within this range, but if yourliming material has a CCE less than90%, application rate should be in-creased accordingly. A common limingmaterial in much of Vermont is aglime-wood ash blend (typically 80% aglime,20% wood ash). While lime-ash has aslightly lower CCE than pure aglime, itcontains some potash and other nutri-ents and is an excellent liming material.
Table 2. Interpretation of soil test categories.
Low (L) High probability of crop response to addi-tion of nutrient. Substantial amounts ofadditional nutrients needed to achieveoptimum yields. In the case of phosphorus,the amount of P needed will vary with thelevel of reactive aluminum (Al)—more Pneeded with high Al.
Medium (M) Moderate probability of crop response toaddition of nutrient. Moderate amounts ofadditional nutrients needed to achieveoptimum yields.
Optimum (OPT) Most desirable soil test range on economicand environmental basis. Low probabilityof crop response to addition of nutrient, butto maintain in this range for successiveyears, a portion of crop removal needs to bereplaced. If crop planning is done on short-term basis (e.g., one-year land rental)recommended broadcast fertilizer can beeliminated with low probability of yieldreduction. However, in that case soil testingshould be done annually to assure that soiltest does not drop below optimum level.
High (H) Higher soil test than needed for optimizingyields of most crops. Very low probability ofcrop response to addition of nutrient. Noadditional nutrients needed except K forhigh K-demanding crops on high-yieldingsites. Low rate of starter fertilizer may beneeded.
Excessive (EX) Soil test higher than desirable for economicand/or environmental reasons. No fertilizerrecommended. Addition of nutrients maycause nutrient imbalance.
2
Table 1. Soil test categories.
Low Medium Optimum High Excessive
Available P 0-2 2.1-4 4.1-7 7.1-20 >20K 0-50 51-100 101-130 131-160 >160Mg 0-35 36-50 51-100 >100 —
Note: Soil test extractant is the Vermont Buffer, or modified Morgan’s (1.25 M NH4
acetate, pH 4.8).
———————— ppm ————————
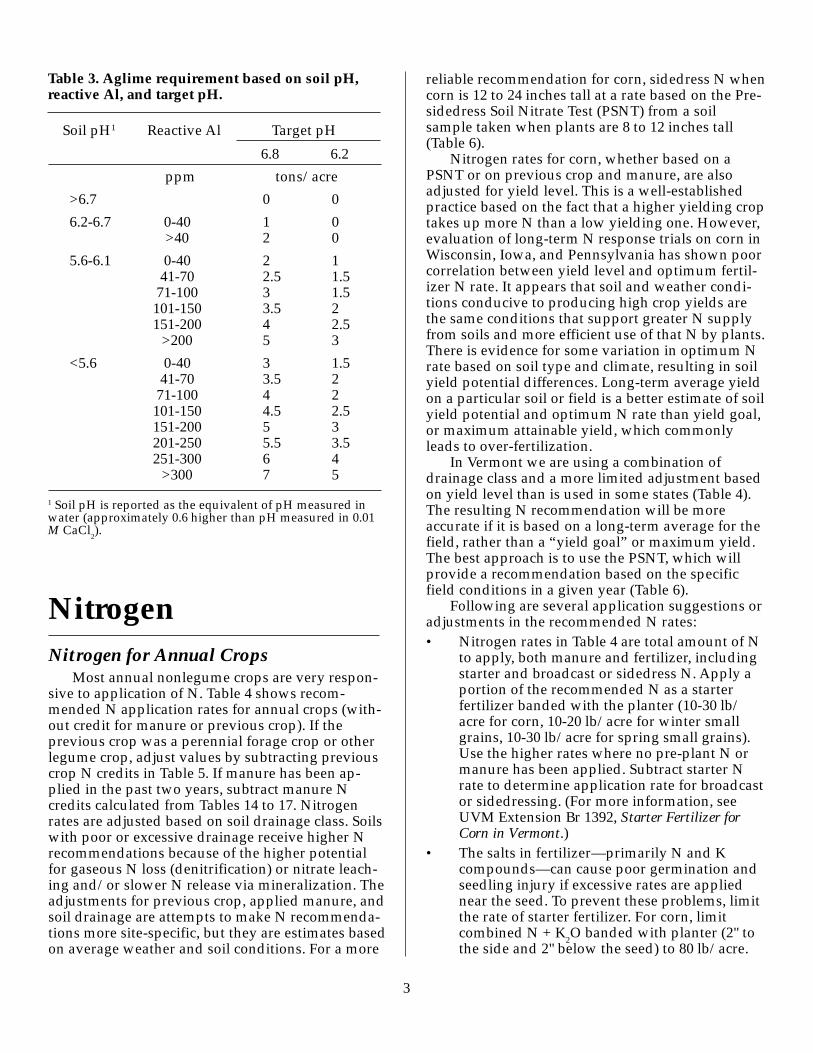
Table 3. Aglime requirement based on soil pH,reactive Al, and target pH.
NitrogenNitrogen for Annual Crops
Most annual nonlegume crops are very respon-sive to application of N. Table 4 shows recom-mended N application rates for annual crops (with-out credit for manure or previous crop). If theprevious crop was a perennial forage crop or otherlegume crop, adjust values by subtracting previouscrop N credits in Table 5. If manure has been ap-plied in the past two years, subtract manure Ncredits calculated from Tables 14 to 17. Nitrogenrates are adjusted based on soil drainage class. Soilswith poor or excessive drainage receive higher Nrecommendations because of the higher potentialfor gaseous N loss (denitrification) or nitrate leach-ing and/or slower N release via mineralization. Theadjustments for previous crop, applied manure, andsoil drainage are attempts to make N recommenda-tions more site-specific, but they are estimates basedon average weather and soil conditions. For a more
reliable recommendation for corn, sidedress N whencorn is 12 to 24 inches tall at a rate based on the Pre-sidedress Soil Nitrate Test (PSNT) from a soilsample taken when plants are 8 to 12 inches tall(Table 6).
Nitrogen rates for corn, whether based on aPSNT or on previous crop and manure, are alsoadjusted for yield level. This is a well-establishedpractice based on the fact that a higher yielding croptakes up more N than a low yielding one. However,evaluation of long-term N response trials on corn inWisconsin, Iowa, and Pennsylvania has shown poorcorrelation between yield level and optimum fertil-izer N rate. It appears that soil and weather condi-tions conducive to producing high crop yields arethe same conditions that support greater N supplyfrom soils and more efficient use of that N by plants.There is evidence for some variation in optimum Nrate based on soil type and climate, resulting in soilyield potential differences. Long-term average yieldon a particular soil or field is a better estimate of soilyield potential and optimum N rate than yield goal,or maximum attainable yield, which commonlyleads to over-fertilization.
In Vermont we are using a combination ofdrainage class and a more limited adjustment basedon yield level than is used in some states (Table 4).The resulting N recommendation will be moreaccurate if it is based on a long-term average for thefield, rather than a “yield goal” or maximum yield.The best approach is to use the PSNT, which willprovide a recommendation based on the specificfield conditions in a given year (Table 6).
Following are several application suggestions oradjustments in the recommended N rates:• Nitrogen rates in Table 4 are total amount of N
to apply, both manure and fertilizer, includingstarter and broadcast or sidedress N. Apply aportion of the recommended N as a starterfertilizer banded with the planter (10-30 lb/acre for corn, 10-20 lb/acre for winter smallgrains, 10-30 lb/acre for spring small grains).Use the higher rates where no pre-plant N ormanure has been applied. Subtract starter Nrate to determine application rate for broadcastor sidedressing. (For more information, seeUVM Extension Br 1392, Starter Fertilizer forCorn in Vermont.)
• The salts in fertilizer—primarily N and Kcompounds—can cause poor germination andseedling injury if excessive rates are appliednear the seed. To prevent these problems, limitthe rate of starter fertilizer. For corn, limitcombined N + K
2O banded with planter (2" to
the side and 2" below the seed) to 80 lb/acre.
3
Soil pH1 Reactive Al Target pH
6.8 6.2
ppm tons/acre
>6.7 0 0
6.2-6.7 0-40 1 0>40 2 0
5.6-6.1 0-40 2 141-70 2.5 1.5
71-100 3 1.5101-150 3.5 2151-200 4 2.5
>200 5 3
<5.6 0-40 3 1.541-70 3.5 2
71-100 4 2101-150 4.5 2.5151-200 5 3201-250 5.5 3.5251-300 6 4
>300 7 5
Soil pH1
1 Soil pH is reported as the equivalent of pH measured inwater (approximately 0.6 higher than pH measured in 0.01M CaCl
2).
For small grains, limit combined N + K2O
applied with the grain drill to 40 lb/acre.• For no-till corn, add 30 lb/acre to above rates
to account for slower N mineralization and/orgreater N losses under no-till conditions.
• For corn grown on sandy, excessively drainedsoils without manure, split nitrogen into pre-plant and/or starter (50 or more lb/acre) withthe remainder applied as a sidedress.
• For small grains on fields where lodging tendsto be a problem, reduce N rates by 20 lb/acre.
• Soybeans properly inoculated with N-fixingbacteria seldom respond to N fertilizer. Inocu-late with fresh, viable bacteria just beforeplanting. If soybeans have not been grown onthe field previously, triple the rate of inoculant.
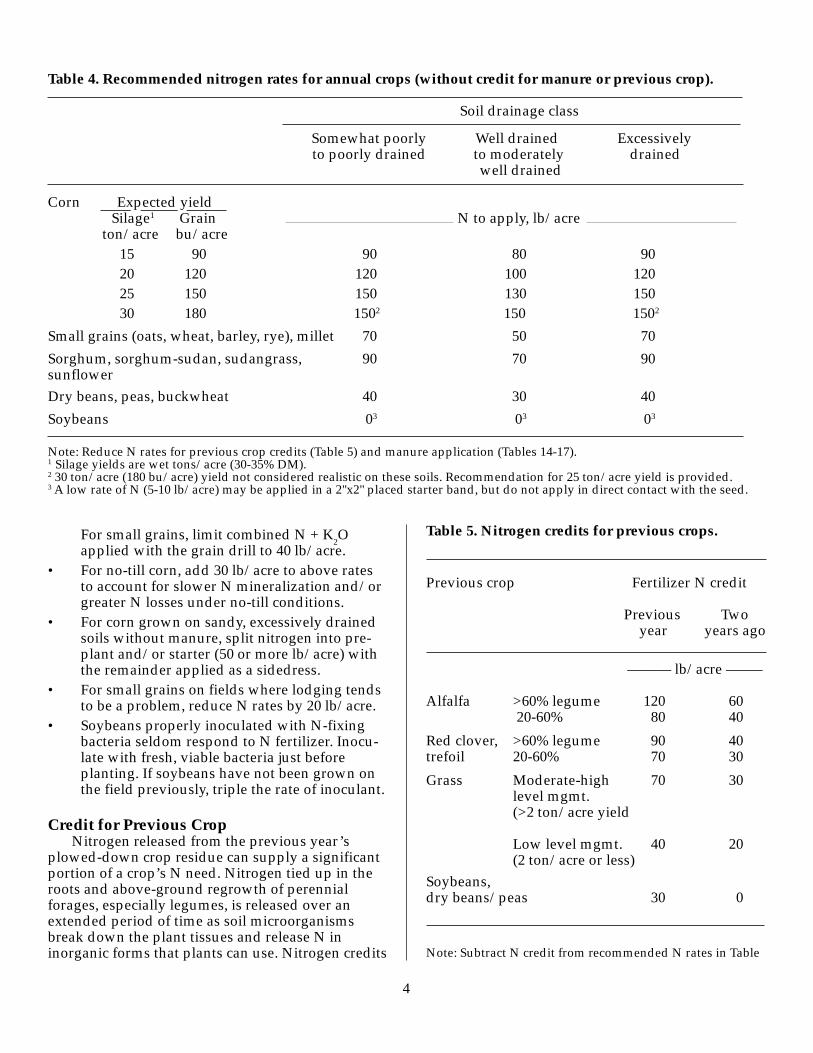
Credit for Previous CropNitrogen released from the previous year’s
plowed-down crop residue can supply a significantportion of a crop’s N need. Nitrogen tied up in theroots and above-ground regrowth of perennialforages, especially legumes, is released over anextended period of time as soil microorganismsbreak down the plant tissues and release N ininorganic forms that plants can use. Nitrogen credits
4
Table 5. Nitrogen credits for previous crops.
Previous crop Fertilizer N credit
Previous Two year years ago
——–– lb/acre ––—–
Alfalfa >60% legume 120 60 20-60% 80 40
Red clover, >60% legume 90 40trefoil 20-60% 70 30
Grass Moderate-high 70 30level mgmt.(>2 ton/acre yield
Low level mgmt. 40 20(2 ton/acre or less)
Soybeans,dry beans/peas 30 0
Note: Subtract N credit from recommended N rates in Table
Table 4. Recommended nitrogen rates for annual crops (without credit for manure or previous crop).
Soil drainage class
Somewhat poorly Well drained Excessively to poorly drained to moderately drained
well drained
Corn Expected yieldSilage1 Grain N to apply, lb/acre
ton/acre bu/acre15 90 90 80 9020 120 120 100 12025 150 150 130 15030 180 1502 150 1502
Small grains (oats, wheat, barley, rye), millet 70 50 70
Sorghum, sorghum-sudan, sudangrass, 90 70 90sunflowerDry beans, peas, buckwheat 40 30 40
Soybeans 03 03 03
Note: Reduce N rates for previous crop credits (Table 5) and manure application (Tables 14-17).1 Silage yields are wet tons/acre (30-35% DM).2 30 ton/acre (180 bu/acre) yield not considered realistic on these soils. Recommendation for 25 ton/acre yield is provided.3 A low rate of N (5-10 lb/acre) may be applied in a 2"x2" placed starter band, but do not apply in direct contact with the seed.
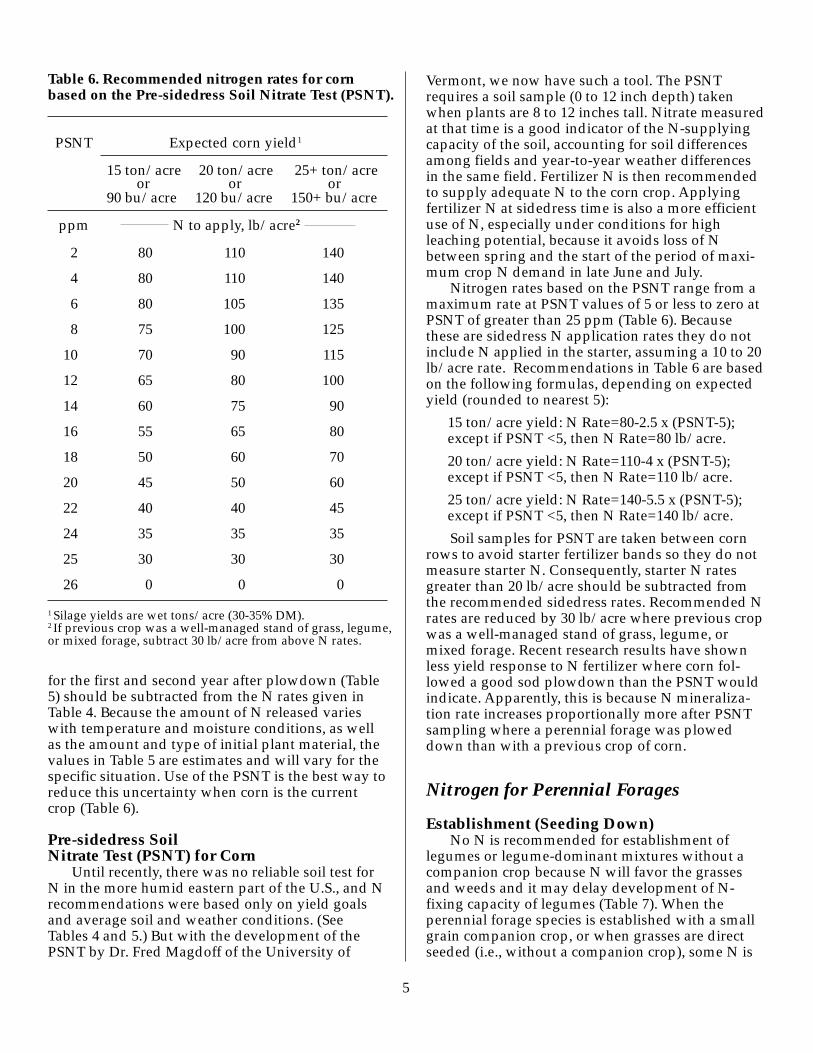
Table 6. Recommended nitrogen rates for cornbased on the Pre-sidedress Soil Nitrate Test (PSNT).
PSNT Expected corn yield1
15 ton/acre 20 ton/acre 25+ ton/acre
90 bu/acre 120 bu/acre 150+ bu/acre
ppm N to apply, lb/acre2
2 80 110 140
4 80 110 140
6 80 105 135
8 75 100 125
10 70 90 115
12 65 80 100
14 60 75 90
16 55 65 80
18 50 60 70
20 45 50 60
22 40 40 45
24 35 35 35
25 30 30 30
26 0 0 0
1 Silage yields are wet tons/acre (30-35% DM).2 If previous crop was a well-managed stand of grass, legume,or mixed forage, subtract 30 lb/acre from above N rates.
for the first and second year after plowdown (Table5) should be subtracted from the N rates given inTable 4. Because the amount of N released varieswith temperature and moisture conditions, as wellas the amount and type of initial plant material, thevalues in Table 5 are estimates and will vary for thespecific situation. Use of the PSNT is the best way toreduce this uncertainty when corn is the currentcrop (Table 6).
Pre-sidedress SoilNitrate Test (PSNT) for Corn
Until recently, there was no reliable soil test forN in the more humid eastern part of the U.S., and Nrecommendations were based only on yield goalsand average soil and weather conditions. (SeeTables 4 and 5.) But with the development of thePSNT by Dr. Fred Magdoff of the University of
5
Vermont, we now have such a tool. The PSNTrequires a soil sample (0 to 12 inch depth) takenwhen plants are 8 to 12 inches tall. Nitrate measuredat that time is a good indicator of the N-supplyingcapacity of the soil, accounting for soil differencesamong fields and year-to-year weather differencesin the same field. Fertilizer N is then recommendedto supply adequate N to the corn crop. Applyingfertilizer N at sidedress time is also a more efficientuse of N, especially under conditions for highleaching potential, because it avoids loss of Nbetween spring and the start of the period of maxi-mum crop N demand in late June and July.
Nitrogen rates based on the PSNT range from amaximum rate at PSNT values of 5 or less to zero atPSNT of greater than 25 ppm (Table 6). Becausethese are sidedress N application rates they do notinclude N applied in the starter, assuming a 10 to 20lb/acre rate. Recommendations in Table 6 are basedon the following formulas, depending on expectedyield (rounded to nearest 5):
15 ton/acre yield: N Rate=80-2.5 x (PSNT-5);except if PSNT <5, then N Rate=80 lb/acre.
20 ton/acre yield: N Rate=110-4 x (PSNT-5);except if PSNT <5, then N Rate=110 lb/acre.
25 ton/acre yield: N Rate=140-5.5 x (PSNT-5);except if PSNT <5, then N Rate=140 lb/acre.
Soil samples for PSNT are taken between cornrows to avoid starter fertilizer bands so they do notmeasure starter N. Consequently, starter N ratesgreater than 20 lb/acre should be subtracted fromthe recommended sidedress rates. Recommended Nrates are reduced by 30 lb/acre where previous cropwas a well-managed stand of grass, legume, ormixed forage. Recent research results have shownless yield response to N fertilizer where corn fol-lowed a good sod plowdown than the PSNT wouldindicate. Apparently, this is because N mineraliza-tion rate increases proportionally more after PSNTsampling where a perennial forage was ploweddown than with a previous crop of corn.
Nitrogen for Perennial Forages
Establishment (Seeding Down)No N is recommended for establishment of
legumes or legume-dominant mixtures without acompanion crop because N will favor the grassesand weeds and it may delay development of N-fixing capacity of legumes (Table 7). When theperennial forage species is established with a smallgrain companion crop, or when grasses are directseeded (i.e., without a companion crop), some N is
or or or

Table 8. Recommended nitrogen rates for perennial grass and grass-legume forages.
Nitrogen to apply
Per application Total per year
N, lb/acreGrass (<20% legume)1
Hay, high level mgmt. (5+ ton/acre) 50-75 200 Hay, medium level (3-4 ton/acre) 50 150 Hay, l ow level mgmt. (2 ton/acre) 40-50 100 Pasture, intensively managed 50 100 Pasture, low-level management 50 50 Conservation planting 40 40
Legume-grass mix (20-60% legume) Hay harvest 40 40 Pasture 0 0 Conservation planting 0 0
needed to support adequate growth. The higher Nrate for direct-seeded grasses is for spring seedingto support a grass harvest later in the season. Nitro-gen rate when a companion crop is used must belimited to avoid excessive competition, or evenlodging, from the small grain.
TopdressingEstablished grass forage species generally show
consistent and large yield increases from applicationof N fertilizer. Economic responses can be obtainedfrom application of as much as 200 lb N/acre onwell-managed, high-yielding stands (three- or four-cut system, adequate P and K fertility, etc.). (See
6
Table 7. Recommended nitrogen rates for estab-lishment of perennial legume or grass forages.
Companion Legumes, Grassesor nurse crop legume-grass
–––– N to apply, lb/acre ––––
None 0 501,2
Small grain 30 302
1 For late-summer seeding, reduce to 30 lb/acre.2 If a second grass harvest is expected, make a secondapplication of 40-50 lb N/acre after first harvest.
Table 8.) For lower level management or yieldpotential situations, less N is recommended. Be-cause of the potential for leaching and other losses,N should be split into multiple applications of 40to 75 lb/acre each. An optimum schedule is toapply N before significant regrowth occurs for eachcrop to be harvested—in early spring and after first,second, and (if a fourth cut will be made) thirdharvest. The higher rate should be applied in earlyspring when growth (and N response) potential isthe greatest.
If manure is to be applied (or has been applied),reduce fertilizer amounts to account for nutrientcontributions from manure (Tables 14 to 17). Whilemanure can provide significant N for a grass crop,volatile losses of N as ammonia can be quite highfrom surface-applied manure. Consequently, bestyields are usually obtained if manure is supple-mented with fertilizer N.
Mixed stands with less than 20% legume shouldbe fertilized as grass unless legumes are beingencouraged, in which case a reduced rate should beapplied in early spring. Stands with higher legumeamounts (20 to 60%) may benefit from an earlyspring topdress of about 40 lb/acre, and in somecases (20 to 40% legume) from a second applicationlater in the season. No N is recommended for haystands where legumes are dominant (>60%), be-cause N is supplied by N-fixing bacteria.
1 Yields are dry hay equivalent (12-15% moisture). One ton dry hay is equivalent to 2.5 tons haylage (65% moisture).

7
PhosphorusPhosphorus recommendations for agronomic crops in
Vermont are based on a combination of the available P soil test(P extracted with Modified Morgan’s solution) and reactive Al
(Al in the same extractant). Researchresults from Vermont, New York, andother states support an available P soiltest critical level of approximately 4ppm, which means that economic yieldincreases from the addition of P fertilizerare unlikely on soils testing above thatlevel. Little or no P fertilizer is recom-mended for a soil testing higher than 4ppm (Table 9). Reactive Al is an indicatorof a soil’s ability to fix, or tie up, addedphosphorus. Thus, low P-testing soilswith high aluminum levels requiregreater amounts of added P to providean adequate P supply to the crop andto raise soil test P. The recommendedP fertilizer rates are expected to raisesoil test P to the critical level in 4 to 6years.
Recommended P application rates forsoils testing Low or Medium (4 ppm orless) are determined as follows:
1) Determine base P rate from availableP and reactive aluminum (Al) soiltests using the following equation:P
2O
5 to apply (lb/acre) =
[(Al+36) x (4 - Avail P)]/3.(See Table 9 for P rates for selectedsoil test levels).
2) Adjust these phosphorus rates forspecific crops by adding or subtract-ing amounts given in Table 10.Results are rounded to nearest 5 lb/acre.
3) Apply maximum and minimumlimits, as follows: Maximum recom-mended rate = 120 lb P
2O
5/acre. If
Available P test = Low, then minimum= 60 lb P
2O
5/acre. If Available P test =
Medium, then minimum = 40 lbP
2O
5/acre.
The adjustments in Table 10 arebased on crop management factors andrelative crop needs. For example, more Pis recommended for seeding down aperennial forage than for topdressingbecause the tillage in preparation forestablishment gives an opportunity tomix P fertilizer throughout the plowlayer. Phosphorus that is tilled in is moreefficiently taken up by the plant rootsystem than P topdressed on the surface;it is also less susceptible to loss in surfacerunoff.
Table 9. Recommended base phosphorus rates for selectedavailable P and Al test values. (Adjust for specific crop basedon Table 10.)
Note: Table shows selected values within each category. Recommended Papplication rates are based on the equation in the text at right.
1 The recommended rate (20 to 30 lb P2O5/acre) is best applied as starter/row fertilizer at planting for corn or broadcast as a blend with othernutrients as a topdress on perennial hay forages.
2 A low rate of starter fertilizer (10 to 20 lb P2O5/acre) is recommended,especially under conditions of early planting, limited drainage, or conser-vation tillage.
10 60 60 40 40 20 0 0
20 65 60 40 40 20 0 0
30 75 55 40 40 20 0 0
40 90 65 40 40 20 0 0
50 100 70 45 40 20 0 0
60 110 80 50 40 20 0 0
70 120 90 55 40 30 0 0
80 120 95 60 40 30 0 0
90 120 105 65 40 30 0 0
100 120 115 70 40 30 0 0
110 120 120 75 40 30 0 0
120 120 120 80 40 30 0 0
130 120 120 85 40 30 0 0
140 120 120 90 40 30 0 0
150 120 120 95 40 30 0 0
160 120 120 100 40 30 0 0
170 120 120 105 40 30 0 0
180 120 120 110 40 30 0 0
190 120 120 115 40 30 0 0
200 120 120 120 40 30 0 0
Reactive Available P soil test Al Low Medium Optimum1 High2 Excessive
ppm 0.5 1.5 2.5 3.5 4.1-7 7.1-20 >20
ppm P2O
5 to apply, lb/acre
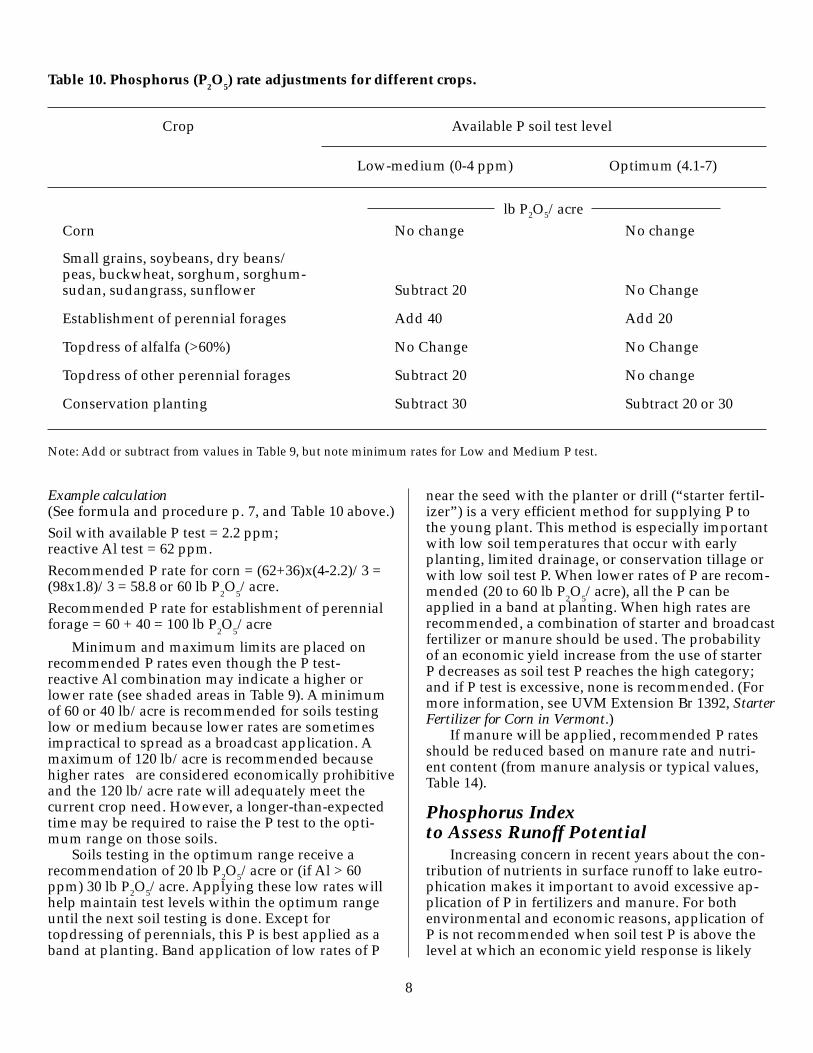
Example calculation(See formula and procedure p. 7, and Table 10 above.)Soil with available P test = 2.2 ppm;reactive Al test = 62 ppm.Recommended P rate for corn = (62+36)x(4-2.2)/3 =(98x1.8)/3 = 58.8 or 60 lb P
2O
5/acre.
Recommended P rate for establishment of perennialforage = 60 + 40 = 100 lb P
2O
5/acre
Minimum and maximum limits are placed onrecommended P rates even though the P test-reactive Al combination may indicate a higher orlower rate (see shaded areas in Table 9). A minimumof 60 or 40 lb/acre is recommended for soils testinglow or medium because lower rates are sometimesimpractical to spread as a broadcast application. Amaximum of 120 lb/acre is recommended becausehigher rates are considered economically prohibitiveand the 120 lb/acre rate will adequately meet thecurrent crop need. However, a longer-than-expectedtime may be required to raise the P test to the opti-mum range on those soils.
Soils testing in the optimum range receive arecommendation of 20 lb P2O5/acre or (if Al > 60ppm) 30 lb P2O5/acre. Applying these low rates willhelp maintain test levels within the optimum rangeuntil the next soil testing is done. Except fortopdressing of perennials, this P is best applied as aband at planting. Band application of low rates of P
near the seed with the planter or drill (“starter fertil-izer”) is a very efficient method for supplying P tothe young plant. This method is especially importantwith low soil temperatures that occur with earlyplanting, limited drainage, or conservation tillage orwith low soil test P. When lower rates of P are recom-mended (20 to 60 lb P
2O
5/acre), all the P can be
applied in a band at planting. When high rates arerecommended, a combination of starter and broadcastfertilizer or manure should be used. The probabilityof an economic yield increase from the use of starterP decreases as soil test P reaches the high category;and if P test is excessive, none is recommended. (Formore information, see UVM Extension Br 1392, StarterFertilizer for Corn in Vermont.)
If manure will be applied, recommended P ratesshould be reduced based on manure rate and nutri-ent content (from manure analysis or typical values,Table 14).
Table 10. Phosphorus (P2O
5) rate adjustments for different crops.
Crop Available P soil test level
Low-medium (0-4 ppm) Optimum (4.1-7)
lb P2O5/acreCorn No change No change
Small grains, soybeans, dry beans/peas, buckwheat, sorghum, sorghum-sudan, sudangrass, sunflower Subtract 20 No Change
Establishment of perennial forages Add 40 Add 20
Topdress of alfalfa (>60%) No Change No Change
Topdress of other perennial forages Subtract 20 No change
Conservation planting Subtract 30 Subtract 20 or 30
Note: Add or subtract from values in Table 9, but note minimum rates for Low and Medium P test.
8
Phosphorus Indexto Assess Runoff Potential
Increasing concern in recent years about the con-tribution of nutrients in surface runoff to lake eutro-phication makes it important to avoid excessive ap-plication of P in fertilizers and manure. For bothenvironmental and economic reasons, application ofP is not recommended when soil test P is above thelevel at which an economic yield response is likely

9
(Table 9). However, assessment of the potential for Prunoff loss from an agricultural field requires evalu-ation of a number of factors, of which soil test P isonly one. The Phosphorus Index was developed as atool to combine various soil and management fac-tors into an index that can serve as a managementtool as part of the nutrient management planningprocess. The revised P Index for Vermont uses sev-eral parameters, including erosion, soil hydrologicgroup, P soil test, rate and method of P application,and buffer characteristics, to estimate the potentialfor runoff of phosphorus from a given field. The re-sults of the P Index calculation for each field are ex-pressed as an index (0 to 100+) and are assigned alow, medium, high, or very high rating. Recom-mended management practices for each categorycan then be used as a guide to prioritize fields andto determine those on which P application shouldbe limited or additional conservation practicesimplemented. The 2004 version of the Vermont PIndex can be downloaded from the Web at: http://pss.uvm.edu/vtcrops/?Page=nutrientmanure.html#Phosphorus
injury to seedlings. Lower establishment-year yieldsmean lower K uptake, as well.
A portion of the K recommended for corn (10 to20 lb K
2O/acre) should be banded with the planter,
especially on low- and medium-testing soils. (Formore information, see UVM Extension Br 1392,Starter Fertilizer for Corn in Vermont.)
If manure will be applied, recommended K ratesshould be reduced based on manure rate and nutri-ent content (from manure analysis or typical values,Table 14).
PotassiumPlant-available soil K is primarily in the ex-
changeable form; that is, it is adsorbed to organicmatter and clay surfaces but can be readily ex-changed with ions in soil solution and taken up byplants. It is exchangeable K that is measured by theModified Morgan’s extractant (NH
4 acetate, pH 4.8).
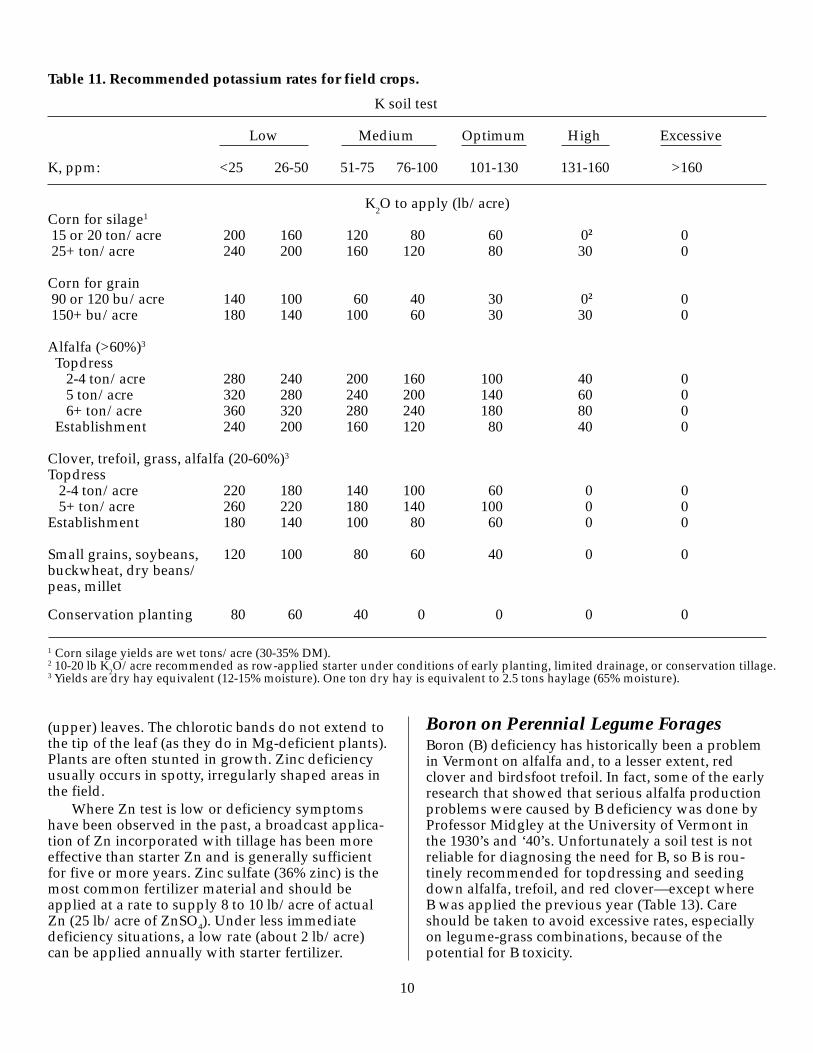
The rate of potash recommended is based on soiltest K level and on crop need, as determined by croptype and yield level (Table 11). Recommended Krates for low-testing soils are quite high, especiallyfor corn silage and perennial forages in which thewhole plant is harvested. Even for soils in theoptimum range, a substantial amount of potash isrecommended because soils can be more quicklydepleted of K than of P.
Potassium rates for corn silage and hay foragesare adjusted based on yield level and on whethercorn is harvested for silage or grain because thesefactors affect plant uptake and removal of K. Lesspotash is recommended for grass forage than forlegumes because the fibrous rooting system ofgrasses is more efficient at scavenging for K than isthe tap root system of legumes. In the case of alegume-grass mix, an adequate K supply is impor-tant to maintain the competitiveness of the legumesrelative to the grasses. Less potash is recommendedfor establishment of a perennial forage than fortopdressing to minimize any possible fertilizer
Secondaryand MicronutrientsMagnesium Recommendation - All Crops
Magnesium can be deficient on some Vermontsoils. Because the available form of both Mg and K isa cation (positively charged ion), there is competitionbetween the two for plant uptake. As a result, Mgdeficiency is more likely to occur on high K-testingsoils. Therefore, we have different recommendationsfor two situations—those with K test lower andhigher than 200 ppm. For the higher K-testing soils,Mg critical level and recommended rate are adjustedfor the K test level.
Situation 1: K soil test is 200 ppm or less. Mg soil test of 50 ppm is considered adequate. Mg recommendation, lb/acre = 100 - (2 x Mg soil test)
Situation 2: K soil test is greater than 200 ppm. Mg recommendation, lb/acre = (0.6 x K test) - (2 x Mg soil test).
Zinc for CornZinc (Zn) deficiency is not a consistent problem
in Vermont, but it has caused serious productionproblems, primarily in corn, in some fields in someyears. The Zn soil test provides a guide for Znfertilizer need, but is best combined with fieldobservations (Table 12). Zinc deficiency is morelikely on fields with no recent manure application oron soils with very high soil test P (or excessive Papplication), low organic matter, or relatively highpH (approaching 7 or higher). Weather conditionsare also a factor—with problems more likely undercool spring conditions. Zinc deficiency symptomsgenerally appear in young corn (6-12 inches tall) asinterveinal chlorosis (light color between veins) orwide bands on either side of the midrib of younger
(upper) leaves. The chlorotic bands do not extend tothe tip of the leaf (as they do in Mg-deficient plants).Plants are often stunted in growth. Zinc deficiencyusually occurs in spotty, irregularly shaped areas inthe field.
Where Zn test is low or deficiency symptomshave been observed in the past, a broadcast applica-tion of Zn incorporated with tillage has been moreeffective than starter Zn and is generally sufficientfor five or more years. Zinc sulfate (36% zinc) is themost common fertilizer material and should beapplied at a rate to supply 8 to 10 lb/acre of actualZn (25 lb/acre of ZnSO4). Under less immediatedeficiency situations, a low rate (about 2 lb/acre)can be applied annually with starter fertilizer.
10
Table 11. Recommended potassium rates for field crops.
K soil test
Low Medium Optimum High Excessive
K, ppm: <25 26-50 51-75 76-100 101-130 131-160 >160
K2O to apply (lb/acre)
Corn for silage1
15 or 20 ton/acre 200 160 120 80 60 02 0 25+ ton/acre 240 200 160 120 80 30 0
Corn for grain 90 or 120 bu/acre 140 100 60 40 30 02 0 150+ bu/acre 180 140 100 60 30 30 0
Alfalfa (>60%)3
Topdress 2-4 ton/acre 280 240 200 160 100 40 0 5 ton/acre 320 280 240 200 140 60 0 6+ ton/acre 360 320 280 240 180 80 0 Establishment 240 200 160 120 80 40 0
Clover, trefoil, grass, alfalfa (20-60%)3
Topdress 2-4 ton/acre 220 180 140 100 60 0 0 5+ ton/acre 260 220 180 140 100 0 0Establishment 180 140 100 80 60 0 0
Small grains, soybeans, 120 100 80 60 40 0 0buckwheat, dry beans/peas, millet
1 Corn silage yields are wet tons/acre (30-35% DM).2 10-20 lb K
2O/acre recommended as row-applied starter under conditions of early planting, limited drainage, or conservation tillage.
3 Yields are dry hay equivalent (12-15% moisture). One ton dry hay is equivalent to 2.5 tons haylage (65% moisture).
Boron on Perennial Legume ForagesBoron (B) deficiency has historically been a problemin Vermont on alfalfa and, to a lesser extent, redclover and birdsfoot trefoil. In fact, some of the earlyresearch that showed that serious alfalfa productionproblems were caused by B deficiency was done byProfessor Midgley at the University of Vermont inthe 1930’s and ‘40’s. Unfortunately a soil test is notreliable for diagnosing the need for B, so B is rou-tinely recommended for topdressing and seedingdown alfalfa, trefoil, and red clover—except whereB was applied the previous year (Table 13). Careshould be taken to avoid excessive rates, especiallyon legume-grass combinations, because of thepotential for B toxicity.
Conservation planting 80 60 40 0 0 0 0
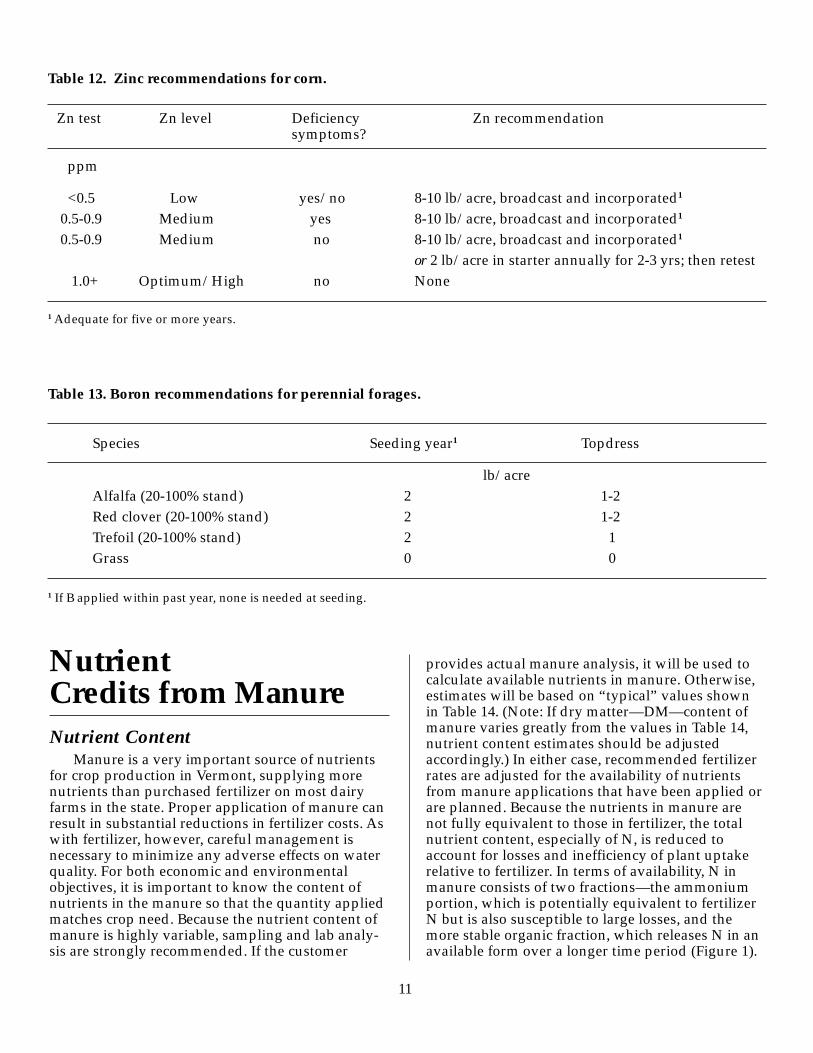
Table 12. Zinc recommendations for corn.
11
NutrientCredits from ManureNutrient Content
Manure is a very important source of nutrientsfor crop production in Vermont, supplying morenutrients than purchased fertilizer on most dairyfarms in the state. Proper application of manure canresult in substantial reductions in fertilizer costs. Aswith fertilizer, however, careful management isnecessary to minimize any adverse effects on waterquality. For both economic and environmentalobjectives, it is important to know the content ofnutrients in the manure so that the quantity appliedmatches crop need. Because the nutrient content ofmanure is highly variable, sampling and lab analy-sis are strongly recommended. If the customer
Zn test Zn level Deficiency Zn recommendationsymptoms?
ppm
<0.5 Low yes/no 8-10 lb/acre, broadcast and incorporated1
0.5-0.9 Medium yes 8-10 lb/acre, broadcast and incorporated1
0.5-0.9 Medium no 8-10 lb/acre, broadcast and incorporated1
or 2 lb/acre in starter annually for 2-3 yrs; then retest 1.0+ Optimum/High no None
1 Adequate for five or more years.
Table 13. Boron recommendations for perennial forages.
provides actual manure analysis, it will be used tocalculate available nutrients in manure. Otherwise,estimates will be based on “typical” values shownin Table 14. (Note: If dry matter—DM—content ofmanure varies greatly from the values in Table 14,nutrient content estimates should be adjustedaccordingly.) In either case, recommended fertilizerrates are adjusted for the availability of nutrientsfrom manure applications that have been applied orare planned. Because the nutrients in manure arenot fully equivalent to those in fertilizer, the totalnutrient content, especially of N, is reduced toaccount for losses and inefficiency of plant uptakerelative to fertilizer. In terms of availability, N inmanure consists of two fractions—the ammoniumportion, which is potentially equivalent to fertilizerN but is also susceptible to large losses, and themore stable organic fraction, which releases N in anavailable form over a longer time period (Figure 1).
Species Seeding year1 Topdress
lb/acreAlfalfa (20-100% stand) 2 1-2Red clover (20-100% stand) 2 1-2Trefoil (20-100% stand) 2 1Grass 0 0
1 If B applied within past year, none is needed at seeding.
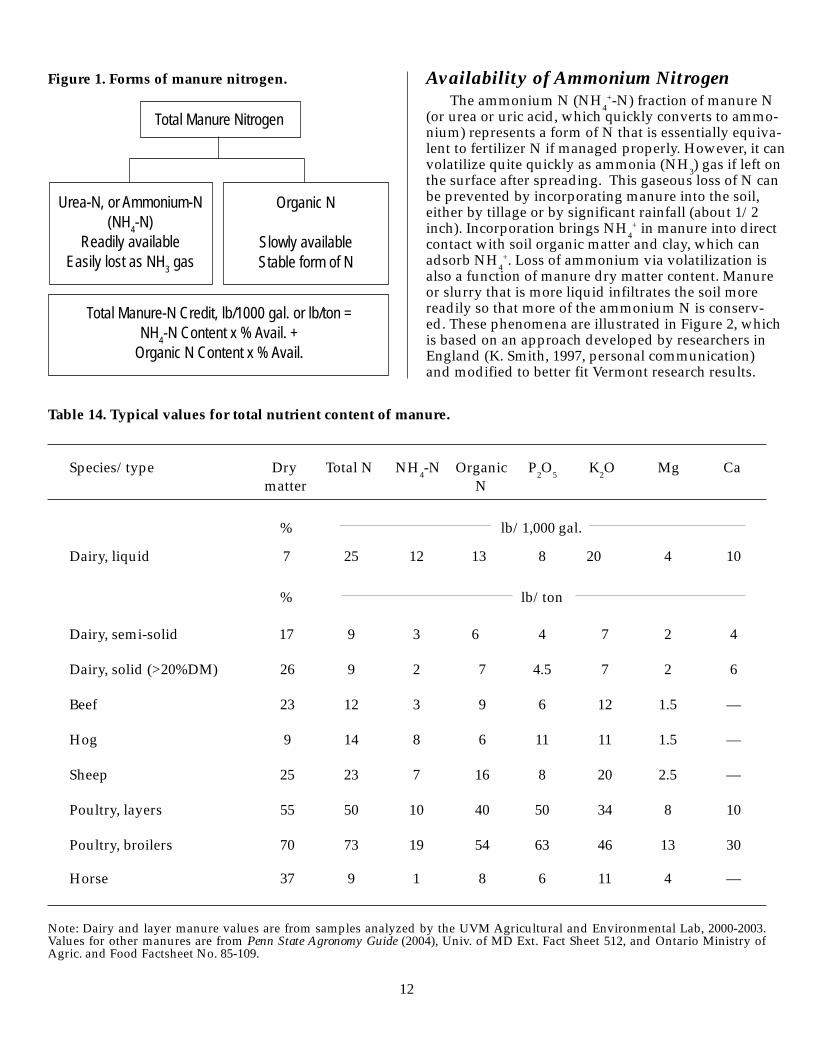
Species/type Dry Total N NH4-N Organic P
2O
5 K
2O Mg Ca
matter N
% lb/1,000 gal.
Dairy, liquid 7 25 12 13 8 20 4 10
% lb/ton
Dairy, semi-solid 17 9 3 6 4 7 2 4
Dairy, solid (>20%DM) 26 9 2 7 4.5 7 2 6
Beef 23 12 3 9 6 12 1.5 —
Hog 9 14 8 6 11 11 1.5 —
Sheep 25 23 7 16 8 20 2.5 —
Poultry, layers 55 50 10 40 50 34 8 10
Poultry, broilers 70 73 19 54 63 46 13 30
Horse 37 9 1 8 6 11 4 —
Figure 1. Forms of manure nitrogen.
Total Manure Nitrogen
Urea-N, or Ammonium-N(NH4-N)
Readily availableEasily lost as NH
3 gas
Organic N
Slowly availableStable form of N
Note: Dairy and layer manure values are from samples analyzed by the UVM Agricultural and Environmental Lab, 2000-2003.Values for other manures are from Penn State Agronomy Guide (2004), Univ. of MD Ext. Fact Sheet 512, and Ontario Ministry ofAgric. and Food Factsheet No. 85-109.
12
Availability of Ammonium NitrogenThe ammonium N (NH
4+-N) fraction of manure N
(or urea or uric acid, which quickly converts to ammo-nium) represents a form of N that is essentially equiva-lent to fertilizer N if managed properly. However, it canvolatilize quite quickly as ammonia (NH
3) gas if left on
the surface after spreading. This gaseous loss of N canbe prevented by incorporating manure into the soil,either by tillage or by significant rainfall (about 1/2inch). Incorporation brings NH
4+ in manure into direct
contact with soil organic matter and clay, which canadsorb NH
4+. Loss of ammonium via volatilization is
also a function of manure dry matter content. Manureor slurry that is more liquid infiltrates the soil morereadily so that more of the ammonium N is conserv-ed. These phenomena are illustrated in Figure 2, whichis based on an approach developed by researchers inEngland (K. Smith, 1997, personal communication)and modified to better fit Vermont research results.
Table 14. Typical values for total nutrient content of manure.
Total Manure-N Credit, lb/1000 gal. or lb/ton =NH4-N Content x % Avail. +
Organic N Content x % Avail.

Values for NH4
+-N availability of spring-appliednon-poultry manures are based on the followingformulas:• Liquid manure: %N availability =
100 - [(20 + 5xDM) x (days /(days+0.3))],where DM ranges from 4% to 12%.
• Semi-solid manure: same as liquid manure,using 12% DM in formula.
• Solid manure:% N availability = 100 - 90 [days / (days+1.2)].
• If time to incorporation is >7 days (ornonincorporated), %N availability = 60, 40, 20,and 10% for thin, medium, thick (or semi-solid),and solid manure. (See Table 15.)If the farmer provides a value for % DM (same
as % solids) of manure (from analysis or reliableestimate), then an estimate of N availability will begiven based on the above formulas and the specificDM content. If a DM content is not given, thenavailability of ammonium-N in manure will bebased on approximate values from different catego-ries of DM content—thin (0-5%), medium (5-10%),and thick (>10%) liquid manure, semi-solid manure,or solid (>20% DM) manure (Tables 15 or 16).Availability for the three liquid manure categoriesare calculated using DM percentages of 4, 8, and 12.Semi-solid is treated as “thick liquid,” using a DMvalue of 12%. If manure is applied in the fall, esti-mates of NH
4+-N availability are reduced to 40% of
spring-applied manure to account for overwinteringlosses due to leaching, denitrification, and runoff(Table 16). Values in Tables 15 and 16 have beenrounded to the nearest 5%.
Figure 2. Loss (left) and resultant availability relative to fertilizer N (right) of ammonium N from manure asa function of manure dry matter content and time after spreading.
Availability of Organic NitrogenOrganic N is the manure N fraction that is part
of large organic compounds, a form that can not betaken up directly by crop plants. But as microor-ganisms utilize these carbon compounds to deriveenergy, some of the N is mineralized, or released, asammonium and is available for plants. While thegreatest portion is mineralized in the first season,the process continues at a slower rate for one ormore additional years and is affected by severalfactors (Table 17). Because mineralization is carriedout primarily by aerobic bacteria, the rate is re-duced in poorly drained soils compared to well-drained (well-aerated) soils. Large amounts ofhigh-carbon bedding material (as indicated by highDM content, greater than 20%) decrease the netrelease of N because more of the inorganic Nmineralized is immobilized, or utilized directly bythe soil microbes to supply their N needs. AvailableN values for manure left on the soil surface, as inperennial forages and no-till corn, are reduced (byapproximately a third) to account for slower miner-alization of organic N that is not mixed with thesoil (Table 17).
Availability of N from composted manure hasnot been well researched in Vermont or the region.It is expected to be less than uncomposted manurebecause most of the available N has been either lostto volatilization or immobilized during the com-posting process. Penn State (Agronomy Guide, 2004)uses a first-year availability of 10% of the total N,with 5% and 2% availability in the second and thirdyears after application.
13
% N
H4-
N lo
ss
Manure NH4-N loss Manure NH4-N availability
% a
vaila
bilit
y
Days after spreading Days after spreading

Time to Dairy cattle or other livestock Poultry incorporationby tillage or rain Liquid or slurry Solid
Thin Medium Thick or(<5% DM) (5-10% DM) semi-solid (> 20% DM)
(>10% DM)
% available
Immediate/1 hr 95 95 90 95 95
<8 hr 80 70 60 80 90
1 day 70 55 40 60 85
2 days 65 50 30 45 80
3-4 days 65 45 25 35 70
5-7 days 60 40 25 25 60
>7 days 60 40 20 10 50 (or non- incorporated)
Other NutrientsThe approach for estimating the availability of
other nutrients in manure is much less complex.Potassium in the plant cell (and, thus, in manure) isnot tied up in complex organic compounds but ex-ists in the K+ ionic form. Therefore, it is equivalentin availability to K in fertilizers. Phosphorus in ma-nure is a combination of organic and inorganic com-pounds and is sometimes considered less plant-
14
Table 15. Availability of ammonium nitrogen from spring- or summer-applied manure (% fertilizerN equivalent).
available than fertilizer P. However, manure P is notas readily tied up in unavailable forms in the soil assoluble P fertilizers. Consequently, manure and fer-tilizer are very similar in building soil P and supply-ing crop needs. In the current Vermont program weconsider manure P equivalent to fertilizer. Manurealso contributes significant amounts of magnesium,calcium, sulfur, and various micronutrients for cropgrowth.

Time to Dairy cattle or other livestock Poultryincorporationby tillage or rain Liquid or slurry Solid
Thin Medium Thick or (<5% DM) (5-10% DM) semi-solid (> 20% DM)
(>10% DM)
% available
Immediate/1 hr 40 35 35 40 40
<8 hr 30 25 25 30 35
1 day 30 25 15 25 35
2 days 25 20 10 20 30
3-4 days 25 20 10 15 25
5-7 days 25 15 10 10 25
>7 days 25 15 10 0 20(or non-incorporated)
Table 16. Availability of ammonium nitrogen from fall-applied manure (% fertilizer N equivalent).
15
Table 17. Availability (% fertilizer N equivalent) of organic N from manure applied in current and past years.
Current year 1 year ago 2 years ago
Dry matter Soil drainage Tilled Surface
% % available
20 or less Well to moderately 36 24 12 5well drained
Somewhat poorly to 24 16 10 4poorly drained
>20 Well to moderately 30 20 12 5well drained
Somewhat poorly to 20 14 10 4poorly drained

16
Table 18. Vermont soil test categories expressed as pounds per acre (lb/acre, or pp2m) in elemental form.
Low Medium Optimum High Excessive
lb/acre
Available P 0-4 4-7 8-15 16-40 > 40
K 0-100 101-200 201-260 261-325 >325
Mg 0-70 71-100 101-200 >200 —
AppendixSoil Testing Lab Methods
Soil samples that come to the lab are assigned alab number and a subsample is dried overnight at130 degrees F in a large oven. The soil is then putthrough a 2 mm sieve to remove coarse fragments.All of the available nutrients are measured in anextract of this sample. Four milliliters (mL) of soil(about 1 tsp) is shaken for 15 minutes with 20 mL ofmodified-Morgan’s solution (1.25 M ammoniumacetate at pH 4.8). The original Morgan’s extract wasdeveloped at the University of Connecticut in the1940’s. The modified- Morgan’s solution, whichimproves the extract’s ability to remove potassiumfrom fine textured soils, was developed in the 1960’sby Dr. J. McIntosh at the University of Vermont.While our extraction process is similar to thesemethods, we use more modern methods for thedetermination of the nutrients in the extract. Cal-cium, K, Mg, Zn, and Al are measured on an ICP, ananalytical instrument capable of accurately deter-mining many elements simultaneously. We still runP by visible spectroscopy—basically adding chemi-cals to make a blue P compound and measuring theintensity of blue with an analytical instrument.
Reserve P is determined in a separate extract by thesame blue method. This extraction uses the modi-fied-Morgan’s solution with added fluoride, whichremoves some of the “fixed”—or reserve—P fromthe soil samples.
Soil pH is measured in 10 mL of a weak calciumchloride “salt” solution (0.01 M), using 5 mL of soil.Using a weak salt ensures a more accurate readingwith less seasonal fluctuation. This pH readingaverages 0.6 pH units less than a pH measured inwater and we adjust our “salt” pH readings up-wards to be comparable with results from otherlabs. Organic matter is determined by “weight-loss-on-ignition.” A dry, weighed sample of soil isbrought to 700 degrees F until all the soil organicmatter is burned off. After reweighing, % organicmatter is calculated from the weight loss.
Soil Test CategoriesExpressed in Alternative Units
Soil test results can be expressed in differentunits. The UVM lab reports results as parts permillion (ppm), but some labs use units of poundsper acre (lb/acre). Multiply ppm by 2 to get lb/acre,assuming the soil plow layer weighs 2 millionpounds. See Table 18 for UVM soil test categoriesexpressed as lb/acre.
• ppm x 2 = lb/acre in plow layer• P
2O
5 x .44 = P (phosphorus, elemental form)
• P x 2.27 = P2O
5
• lb P2O
5/acre x .22 = ppm P
• ppm P x 4.6 = lb P2O
5/acre
• K2O x .83 = K (potassium, elemental form)
• K x 1.2 = K2O
• lb K2O/acre x .42 = ppm K
• ppm K x 2.4 = lb K2O/acre
Conversion Factors for Soil Test Units
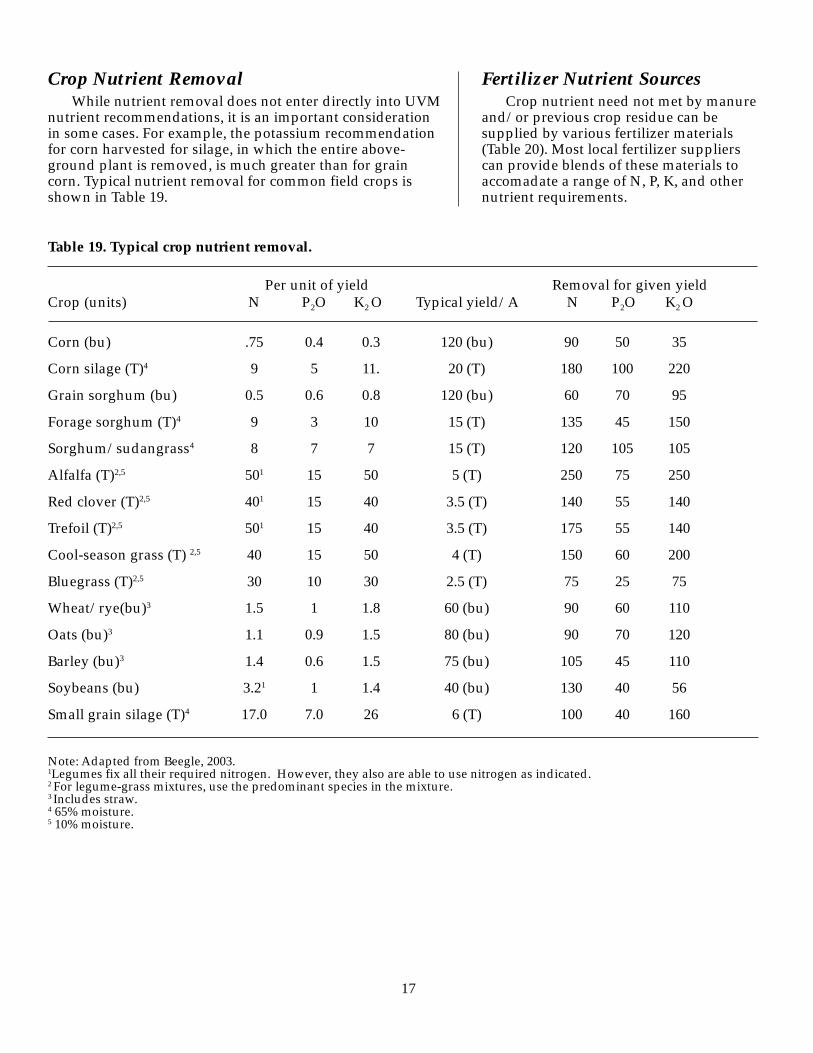
Crop (units) N P2O K2 O Typical yield/A N P2O K2 O
Corn (bu) .75 0.4 0.3 120 (bu) 90 50 35
Corn silage (T)4 9 5 11. 20 (T) 180 100 220
Grain sorghum (bu) 0.5 0.6 0.8 120 (bu) 60 70 95
Forage sorghum (T)4 9 3 10 15 (T) 135 45 150
Sorghum/sudangrass4 8 7 7 15 (T) 120 105 105
Alfalfa (T)2,5 501 15 50 5 (T) 250 75 250
Red clover (T)2,5 401 15 40 3.5 (T) 140 55 140
Trefoil (T)2,5 501 15 40 3.5 (T) 175 55 140
Cool-season grass (T) 2,5 40 15 50 4 (T) 150 60 200
Bluegrass (T)2,5 30 10 30 2.5 (T) 75 25 75
Wheat/rye(bu)3 1.5 1 1.8 60 (bu) 90 60 110
Oats (bu)3 1.1 0.9 1.5 80 (bu) 90 70 120
Barley (bu)3 1.4 0.6 1.5 75 (bu) 105 45 110
Soybeans (bu) 3.21 1 1.4 40 (bu) 130 40 56
Small grain silage (T)4 17.0 7.0 26 6 (T) 100 40 160
17
Per unit of yield Removal for given yield
Table 19. Typical crop nutrient removal.
Note: Adapted from Beegle, 2003.1Legumes fix all their required nitrogen. However, they also are able to use nitrogen as indicated.2 For legume-grass mixtures, use the predominant species in the mixture.3 Includes straw.4 65% moisture.5 10% moisture.
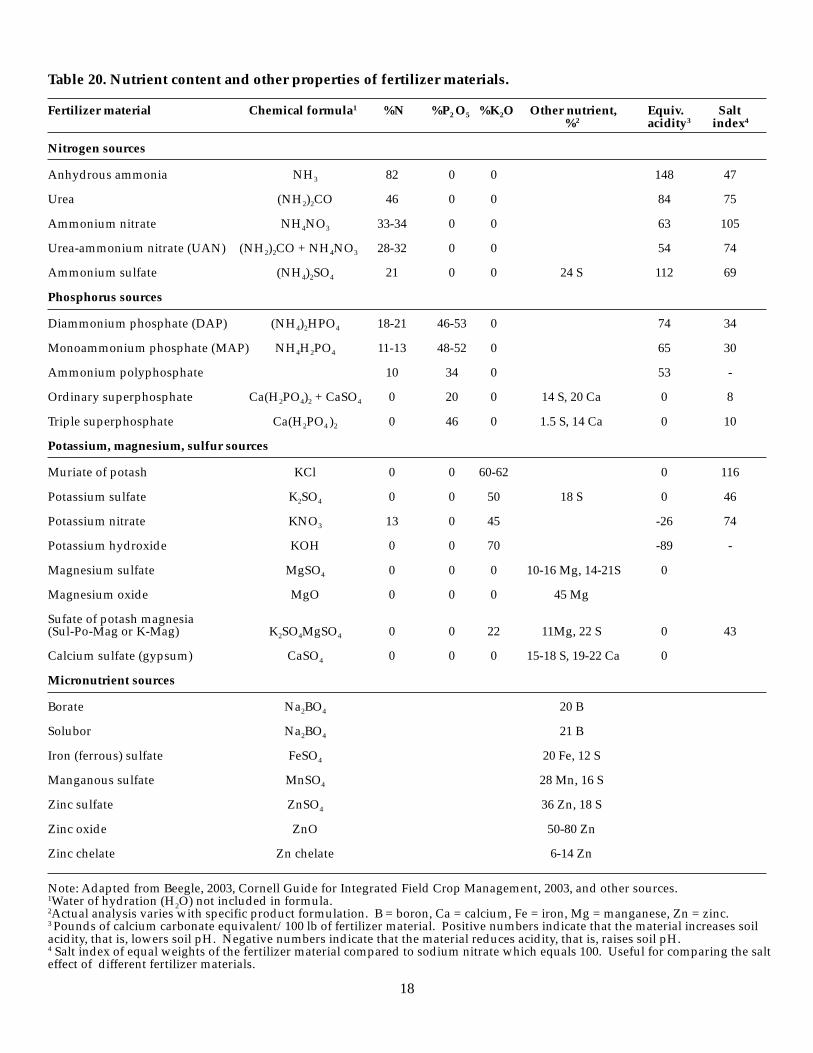
Fertilizer Nutrient SourcesCrop nutrient need not met by manure
and/or previous crop residue can besupplied by various fertilizer materials(Table 20). Most local fertilizer supplierscan provide blends of these materials toaccomadate a range of N, P, K, and othernutrient requirements.
Crop Nutrient RemovalWhile nutrient removal does not enter directly into UVM
nutrient recommendations, it is an important considerationin some cases. For example, the potassium recommendationfor corn harvested for silage, in which the entire above-ground plant is removed, is much greater than for graincorn. Typical nutrient removal for common field crops isshown in Table 19.
18
Fertilizer material Chemical formula1 %N %P2 O5 %K2O Other nutrient, Equiv. Salt %2 acidity3 index4
Nitrogen sources
Anhydrous ammonia NH3 82 0 0 148 47
Urea (NH2)2CO 46 0 0 84 75
Ammonium nitrate NH4NO3 33-34 0 0 63 105
Urea-ammonium nitrate (UAN) (NH2)2CO + NH4NO3 28-32 0 0 54 74
Ammonium sulfate (NH4)2SO4 21 0 0 24 S 112 69
Phosphorus sources
Diammonium phosphate (DAP) (NH4)2HPO4 18-21 46-53 0 74 34
Monoammonium phosphate (MAP) NH4H2PO4 11-13 48-52 0 65 30
Ammonium polyphosphate 10 34 0 53 -
Ordinary superphosphate Ca(H2PO4)2 + CaSO4 0 20 0 14 S, 20 Ca 0 8
Triple superphosphate Ca(H2PO4 )2 0 46 0 1.5 S, 14 Ca 0 10
Potassium, magnesium, sulfur sources
Muriate of potash KCl 0 0 60-62 0 116
Potassium sulfate K2SO4 0 0 50 18 S 0 46
Potassium nitrate KNO3 13 0 45 -26 74
Potassium hydroxide KOH 0 0 70 -89 -
Magnesium sulfate MgSO4 0 0 0 10-16 Mg, 14-21S 0
Magnesium oxide MgO 0 0 0 45 Mg
Sufate of potash magnesia(Sul-Po-Mag or K-Mag) K2SO4MgSO4 0 0 22 11Mg, 22 S 0 43
Calcium sulfate (gypsum) CaSO4 0 0 0 15-18 S, 19-22 Ca 0
Micronutrient sources
Borate Na2BO4 20 B
Solubor Na2BO4 21 B
Iron (ferrous) sulfate FeSO4 20 Fe, 12 S
Manganous sulfate MnSO4 28 Mn, 16 S
Zinc sulfate ZnSO4 36 Zn, 18 S
Zinc oxide ZnO 50-80 Zn
Zinc chelate Zn chelate 6-14 Zn
Table 20. Nutrient content and other properties of fertilizer materials.
Note: Adapted from Beegle, 2003, Cornell Guide for Integrated Field Crop Management, 2003, and other sources.1Water of hydration (H2O) not included in formula.2Actual analysis varies with specific product formulation. B = boron, Ca = calcium, Fe = iron, Mg = manganese, Zn = zinc.3 Pounds of calcium carbonate equivalent/100 lb of fertilizer material. Positive numbers indicate that the material increases soilacidity, that is, lowers soil pH. Negative numbers indicate that the material reduces acidity, that is, raises soil pH.4 Salt index of equal weights of the fertilizer material compared to sodium nitrate which equals 100. Useful for comparing the salteffect of different fertilizer materials.
19
SAMPL
E
SAMPL
E
SAMPL
E
SAMPL
E
SAMPL
E
SAMP
LE
SAMP
LE
SAMP
LE
SAMP
LE
SAMP
LE

23
ReferencesBandel, V. A. 1989. Using manure to cut fertilizercosts. Fact Sheet 512. Coop. Ext. Serv., Univ. ofMaryland, College Park, MD.
Beegle, D. B. 2003. Soil fertility management. Part 1Section 2. In The Agronomy Guide 2004. ThePennsylvania State University, University Park, PA.http://agguide.agronomy.psu.edu/CM/Sec2/Sec2toc.html
Cherney, J.H. (Ed.). 2003. Cornell Guide forIntegrated Field Crop Management—2004. #125RFCCornell Coop. Ext., Cornell Univ., Ithaca, NY.
Fraser, H. 1985. Manure characteristics. FactsheetOrder No. 85-109. Ontario Ministry of Food andAgric.
Jokela, B. 2001. Starter fertilizer for corn in Vermont.Br. 1392. Univ. of Vermont Extension, Burlington,VT.
Klausner, S.D. 1997. Nutrient management: cropproduction and water quality. NRAES-101. NRAES,Coop. Extension, Cornell Univ., Ithaca, NY.
Visit UVM Extension on the World Wide Web at <http://ctr.uvm.edu/ext/> Printed on recycled paper
Editing and design by Communication and Technology Resources, University of Vermont Extension
Br. 1390 Revised March 2004 $2.50 [P&H: $1.75]Issued in furtherance of Cooperative Extension Work Acts of May 8 and June 30, 1914, in cooperation with the United States Department of Agriculture.Lawrence K. Forcier, Director, University of Vermont Extension, Burlington, Vermont. UVM Extension and U.S. Department of Agriculture, cooperating, offereducation and employment to everyone without regard to race, color, national origin, gender, religion, age, disability, political beliefs, sexual orientation, andmarital or familial status. 3C-03/04-UPMC