Embed Size (px)
Citation preview
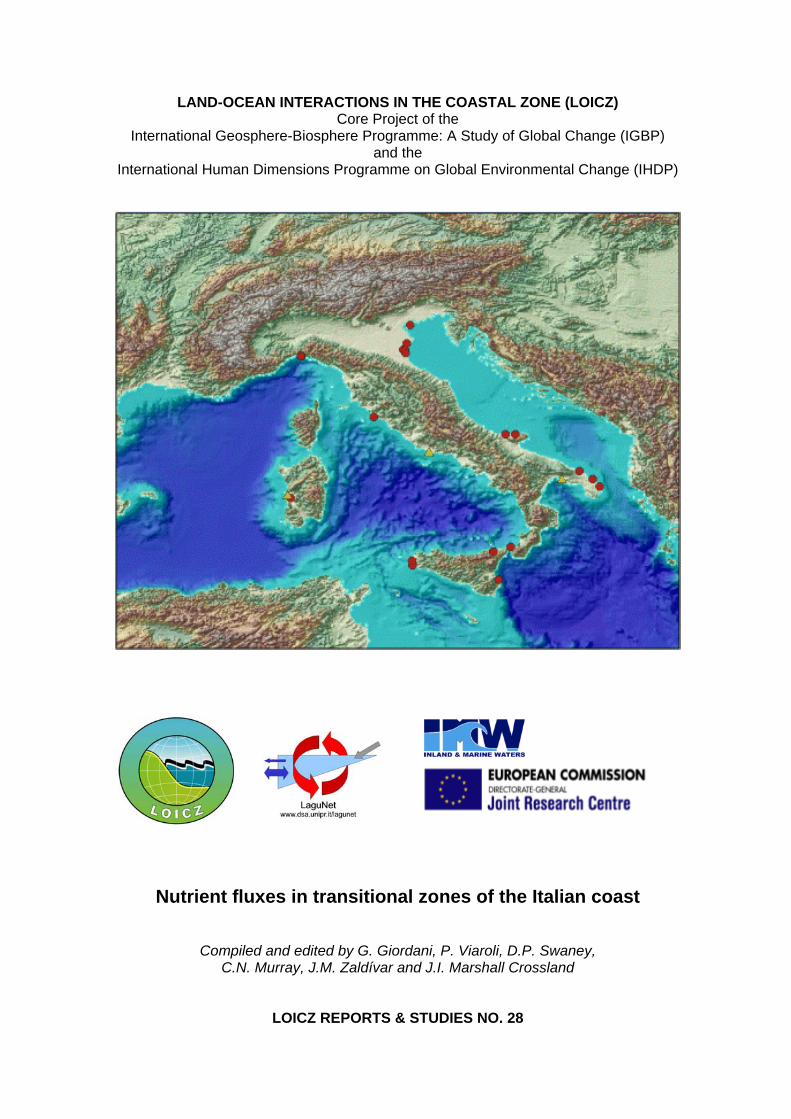
LAND-OCEAN INTERACTIONS IN THE COASTAL ZONE (LOICZ) Core Project of the
International Geosphere-Biosphere Programme: A Study of Global Change (IGBP) and the
International Human Dimensions Programme on Global Environmental Change (IHDP)
Nutrient fluxes in transitional zones of the Italian coast
Compiled and edited by G. Giordani, P. Viaroli, D.P. Swaney, C.N. Murray, J.M. Zaldívar and J.I. Marshall Crossland
LOICZ REPORTS & STUDIES NO. 28
TABLE OF CONTENTS 1. OVERVIEW OF WORKSHOP AND BUDGETS RESULTS 2. NORTH-EASTERN ITALIAN COASTAL SYSTEMS
2.1 Lagoon of Venice – Gianpiero Cossarini, Chiara Castellani, Andrea Barbanti, Alberto Giulio Bernstein, Giovanni Cecconi, Flaviano Collavini, Stefano Guerzoni, Laura Montobbio, Roberto Pastres, Sandro Rabitti, Giorgio Socal, Cosimo Solidoro, Marina Vazzoler and Luca Zaggia
2.2 Sacca di Goro – Martina Austoni, Gianmarco Giordani, Giuseppe Castaldelli, Josè Manuel Zaldívar, Dimitar Marinov and Pierluigi Viaroli
2.3 Pialassa Baiona Lagoon, Ravenna – Massimo Ponti, Saverio Giaquinta and Marco Abbiati
3. SOUTH-EASTERN ITALIAN COASTAL SYSTEMS
3.1 Lagoon of Lesina – Elena Manini, Paolo Breber, Raffaele D’Adamo, Federico Spagnoli and Roberto Danovaro
3.2 Lagoon of Varano – Elena Manini, Paolo Breber, Raffaele D’Adamo, Federico Spagnoli and Roberto Danovaro
3.3 Torre Guaceto wetland – Alessandro Pomes, Ilaria Cappello, Luigi Palmisano, Maurizio Pinna, Giuseppe Calò, Roccaldo Tinelli, Alessandro Ciccolella and Alberto Basset.
3.4 Torre Guaceto Bay – Luigi Palmisano, Alessandro Pomes, Ilaria Cappello and Alberto Basset
3.5 Acquatina Lake – Ilaria Cappello, Luigi Palmisano, Alessandro Pomes, Maria Rosaria Vadrucci and Alberto Basset
4. COASTAL SYSTEMS OF SICILY AND SARDINIA
4.1 Rada di Augusta, eastern coast of Sicily – Filippo Azzaro, Maurizio Azzaro, Alessandro Bergamasco and Salvatore Giacobbe
4.2 Capo Feto marshland, south-west Sicily– Giuseppe Pernice, Ignazio Patti, Vincenzo Maccarrone and Francesca Apollo
4.3 Stagnone di Marsala Lagoon, western Sicily – Sebastiano Calvo, Giuseppe Ciraolo, Goffredo La Loggia, Antonio Mazzola, Agostino Tomasello and Salvatrice Vizzini
4.4 Marinello coastal system, north-eastern Sicily – Marcella Leonardi, Filippo Azzaro, Maurizio Azzaro, Alessandro Bergamasco and Franco Decembrini
4.5 Ganzirri Lake, north-eastern Sicily – Alessandro Bergamasco, Maurizio Azzaro, Giuseppina Pulicanò, Giuseppina Cortese and Marilena Sanfilippo
4.6 S’Ena Arrubia Lagoon, western Sardinia – Felicina Trebini, Bachisio Mario Padedda, Giulia Ceccherelli and Nicola Sechi
5. COASTAL SYSTEMS OF THE TYRRHENIAN SEA (WEST COAST)
5.1 Lagoon of Orbetello, Tuscany – Paola Gennaro, Mauro Lenzi and Salvatore Porrello
6. COASTAL SYSTEMS OF GENOA AND THE LIGURIAN COAST
6.1 Ligurian Coast (Gulf of Genoa) – Paolo Povero, Nicoletta Ruggieri, Cristina Misic, Michela Castellano, Paola Rivaro, Osvaldo Conio, Ezio Derqui and Mauro Fabiano
6.2 Port of Genoa: Old Port, Multedo Oil Terminal and Voltri Container Terminal – Paolo Povero, Nicoletta Ruggieri, Cristina Misic, Michela Castellano, Paola Rivaro, Osvaldo Conio, Ezio Derqui, Stefania Maggi and Mauro Fabiano
Page
1
18 18
29
41
49 49
55
59
69
75
80 80
85
91
95
103
111
118 118
123 123
128
i
7. REFERENCES APPENDICES
Appendix I List of Participants and Authors contributing to this Report Appendix II Workshop Report Appendix III Creation of a Southern European Lagoon Observational Network Appendix IV A proposal of a Typology for Mediterranean transitional waters Appendix V List of acronyms
Page 136
143 143 148 150 152 157
ii
Nutrient fluxes in transitional zones of the Italian coast
compiled and edited by
Gianmarco Giordani & Pierluigi Viaroli Department of Environmental Sciences, University of Parma, Italy
Dennis P. Swaney
Boyce Thompson Institute for Plant Research and Department of Ecology and Evolutionary Biology, Cornell University
Ithaca, NY, USA
Nicholas Murray & José Manuel Zaldivar Comenges Institute for the Environment and Sustainability, Joint Research Centre, Ispra, Italy
and
Janet I. Marshall Crossland
LOICZ International Project Office Texel, The Netherlands
LOICZ REPORTS & STUDIES NO. 28
Published in the Netherlands, 2005 by: LOICZ International Project Office Royal Netherlands Institute for Sea Research P.O. Box 59 1790 AB Den Burg - Texel The Netherlands Email: [email protected] The Land-Ocean Interactions in the Coastal Zone Project is a Core Project of the International Geosphere-Biosphere Programme: A Study Of Global Change (IGBP) and the International Human Dimensions Programme on Global Environmental Change (IHDP), of the International Council of Scientific Unions (ICSU). The LOICZ IPO is financially supported through the Netherlands Organisation for Scientific Research (NWO) by: the Ministry of Education, Culture and Science (OCW); the National Institute for Coastal and Marine Management of the Ministry of Transport, Public Works and Water Management (V&W RIKZ); the Netherlands Ministry of Housing, Spatial Planning and the Environment (VROM), and the Royal Netherlands Institute for Sea Research (NIOZ). This report and allied workshops are contributions to the LOICZ biogeochemical budgeting and modeling core project which started with global assessments under the name “United Nations Environment Programme project: The Role of the Coastal Ocean in the Disturbed and Undisturbed Nutrient and Carbon Cycles (Project Number GF 1100-99-07), financially supported by the Global Environment Facility (GEF) and implemented by IGBP-LOICZ. This core project is being continued as work in progress into LOICZ II and the study presented has been co-supported by the European Commission (Joint Research Centre, Ispra, Italy). COPYRIGHT © 2005, Land-Ocean Interactions in the Coastal Zone Core Project of the IGBP and the IHDP. Reproduction of this publication for educational or other, non-commercial purposes is authorized
without prior permission from the copyright holder. Reproduction for resale or other purposes is prohibited without the prior, written permission of
the copyright holder.
Citation: G. Giordani, P. Viaroli, D.P. Swaney, C.N. Murray, J.M. Zaldívar and J.I. Marshall Crossland. 2005. Nutrient fluxes in transitional zones of the Italian coast. LOICZ Reports & Studies No. 28, ii+157 pages, LOICZ, Texel, the Netherlands.
ISSN: 1383 4304 Cover: The cover shows an image of Italy (GTOPO30 elevation map, courtesy Professor S.V. Smith),
with the budgeted estuaries indicated. Disclaimer: The designations employed and the presentation of the material contained in this report do not
imply the expression of any opinion whatsoever on the part of LOICZ or the IGBP and the IHDP concerning the legal status of any state, territory, city or area, or concerning the delimitations of their frontiers or boundaries. This report contains the views expressed by the authors and may not necessarily reflect the views of the IGBP and the IHDP.
_________________________________ The LOICZ Reports and Studies Series is published and distributed free of charge to scientists involved in global change research in coastal areas.
41
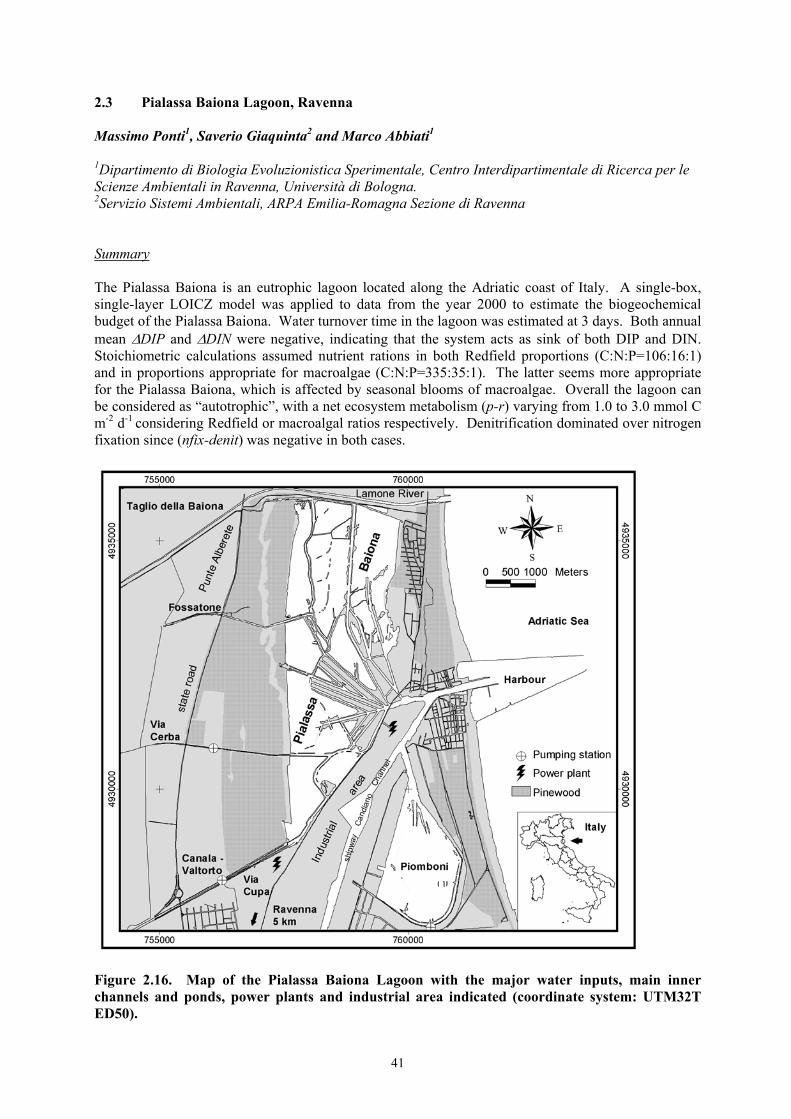
2.3 Pialassa Baiona Lagoon, Ravenna Massimo Ponti1, Saverio Giaquinta2 and Marco Abbiati1 1Dipartimento di Biologia Evoluzionistica Sperimentale, Centro Interdipartimentale di Ricerca per le Scienze Ambientali in Ravenna, Università di Bologna. 2Servizio Sistemi Ambientali, ARPA Emilia-Romagna Sezione di Ravenna Summary The Pialassa Baiona is an eutrophic lagoon located along the Adriatic coast of Italy. A single-box, single-layer LOICZ model was applied to data from the year 2000 to estimate the biogeochemical budget of the Pialassa Baiona. Water turnover time in the lagoon was estimated at 3 days. Both annual mean ∆DIP and ∆DIN were negative, indicating that the system acts as sink of both DIP and DIN. Stoichiometric calculations assumed nutrient rations in both Redfield proportions (C:N:P=106:16:1) and in proportions appropriate for macroalgae (C:N:P=335:35:1). The latter seems more appropriate for the Pialassa Baiona, which is affected by seasonal blooms of macroalgae. Overall the lagoon can be considered as “autotrophic”, with a net ecosystem metabolism (p-r) varying from 1.0 to 3.0 mmol C m-2 d-1 considering Redfield or macroalgal ratios respectively. Denitrification dominated over nitrogen fixation since (nfix-denit) was negative in both cases.
Figure 2.16. Map of the Pialassa Baiona Lagoon with the major water inputs, main inner channels and ponds, power plants and industrial area indicated (coordinate system: UTM32T ED50).
42
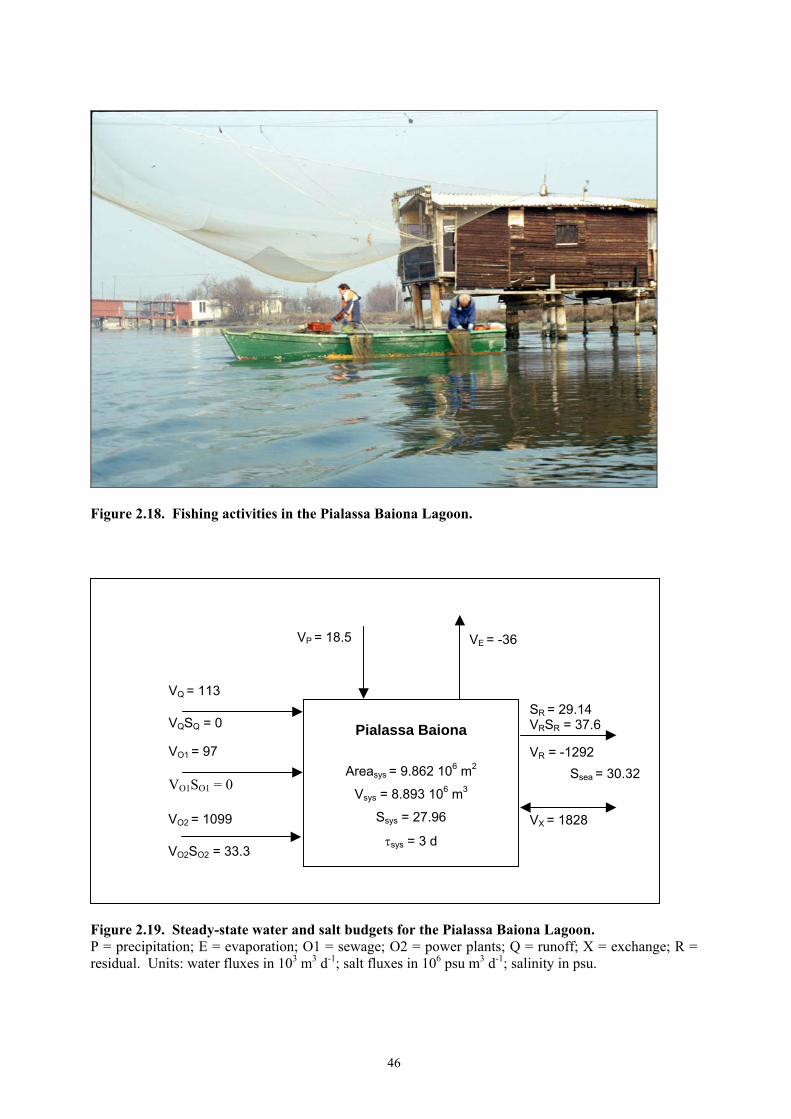
Study area description The Pialassa Baiona Lagoon is located along the northern Adriatic Italian coast, between Ravenna Harbour and the mouth of the Lamone River (44.47°-44.53°N 12.24°-12.27°E, European Datum 1950; Figures 2.16 and 2.17). Artificial embankments divide the lagoon into several shallow water ponds connected by channels. Water exchange of some ponds is controlled by adjustable dams. The inner channels converge into a main channel connected to the sea through the shipway Candiano Channel (Ravenna Harbour). Total area is 11.80 km2, including the embankments. The average depth varies from 0.5 m in the shallow areas to 3 m in the channels with a tidal range varying from 0.3 to 1 m, excluding extreme events. Tides cause large variations in water levels and vast shallow areas emerge during low tides. On average, the water covers an area of 9.862x10⁶ m2 and the total water volume is approximately 8.893x10⁶ m3, shared equally between ponds and channels. The climate of the region is mediterranean with a continental influence. Precipitation is approximately 600 mm per year, with late spring and autumn peaks. The lagoon receives freshwater inputs from five main channels (Figure 2.16). Taglio della Baiona and Fossatone collect the water released from the wet woodland Punte Alberete originated from Lamone River. Via Cerba, Canala – Valtorto and Via Cupa drain a watershed of 264 km2, including urban (9%) and agricultural (87%) areas. The water flow in two channels is controlled by pumping stations. Furthermore, the lagoon receives freshwater inputs from treatment plants of urban and industrial wastewater and also saltwater inputs from two power plants that draw water as coolant from the Candiano Channel to the lagoon. Sewage treatment facilities and power plants are located in the last part of Via Cupa channel and along the south side of the lagoon. The lagoon is characterized by large areas of muddy bottom with variable proportions of clay/silt and organic matter. A pinewood stretches all along the western edge of the lagoon. Sandy sediments are abundant close to the relict dunes. The dunes are covered with halophile vegetation of Salicornia and Arthrocnemum. Embankments are covered with halophile herbaceous vegetation such as Agropyron pungens, with submerged meadows of Ruppia cirrhosa and Potamogeton pectinatus. There are reedbeds of Phragmites australis, marginal areas with Juncus maritimus and J. acutus wet meadows (Corbetta 1990; Corticelli et al. 1999). The most abundant species in the phytoplankton is the diatom Skeletonema costatum. Diatoms prevail from autumn to spring while the abundance of dinoflagellates rises in summer. Occasionally blooms of diatoms or cyanobacteria occur. The lagoon is affected by anthropogenic eutrophication, which causes extensive growth of seaweeds, especially the chlorophyceans Ulva, Enteromorpha and the rhodophyceans Gracilaria. Macroalgal growth and phytoplankton blooms are responsible for the events of anoxia and dystrophy that occasionally occur in summer (Boni 1990). The prevalent human activities in the area include recreational and professional fishing, mollusc harvesting (mainly of the Manila clam, Tapes philippinarum), hunting, hiking and canoeing (Figure 2.18). Following the LOICZ guidelines (Gordon et al. 1996), an annual single-box, single-layer model was applied to the data collected in the year 2000. A single box model was adopted despite the apparent complexity of the Pialassa Baiona lagoon because the inner dynamics of water and nutrients are not well defined. Meteorological data for the study period were supplied by the Regional Agency for Environmental Protection (ARPA Emilia-Romagna 2001). Flux of potential evaporation was estimated by Hargreaves’ equation (Hargreaves 1975) as recommended by Shuttleworth (1993). Data concerning freshwater flow and nutrient concentration were obtained from Angelini and Strumìa (1994) and Giaquinta (2001). Direct measures of flows and nutrient concentrations were compared to theoretical loads based on watershed characteristics (e.g., surface, inhabitants, human activities, industrial plants), load coefficients and rainfall. Measured and theoretical loads were in good agreement. Salinity and nutrient concentrations of adjacent coastal waters were obtained from the annual report of the Struttura Oceanografica Daphne (ARPA Emilia-Romagna 2001). Salinity and
43
nutrient concentrations of the system were provided by the Department of Public Health of the Local Health Service Agency (AUSL, Ravenna). Water and salt balance Water inputs and outputs are summarized in Table 2.25. The main freshwater input is due to runoff from the watershed. Its volume is comparable to the sewage inputs. The contribution of the channels is reported in Table 2.26 while the different types of sewage are reported in Table 2.27. Groundwater flow was negligible compared to the other freshwater inputs and was assumed to be zero in the budget. Direct precipitation during the study period was estimated to be 574 mm, equivalent to 18.5x10³ m3 d-1 over the whole area. Evaporative loss is about twice the inflow from direct precipitation. A high unidirectional input of saltwater was provided by cooling water from two power plants. To balance the water inputs a net water output of 1292x103 m3 d-1 to the sea was calculated (VR). Table 2.25. Mean flow (V) and salinity (S) of the different water sources.
Sources V (103 m3 d-1) S (psu) Runoff 113 0 Sewages 97 0 Atmosphere 18.5 0 Evaporation -36 0 Power plants 1,099 30.32 System 27.96 Sea (residual) -1292 29.14 Sea (exchange) 1828 Sea 30.32
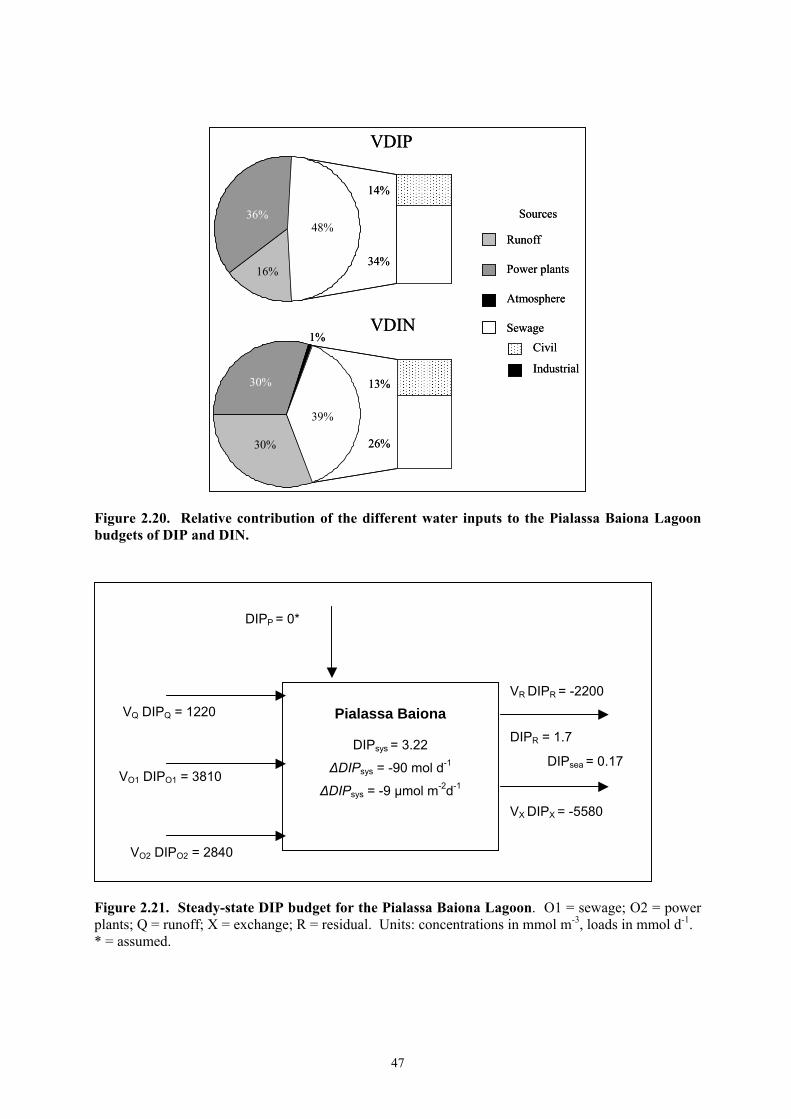
In the lagoon, the salinity varies from 0 psu in areas close to the pinewood to 37 psu in the areas with reduced water exchange during the summer. Average salinity during the study period, taking into account the water volumes of the different areas, was about 27.96 psu. Salinity of the seawater in front of the lagoon is low (average during study the period 30.32 psu) due to the Po River influence. Salinity of the saltwater provided by the power plant was assumed equal to seawater. Using the salinity gradient between the lagoon system and the sea and other inputs of saltwater, the exchange flux (VX) was calculated at 1,828x103 m3 d-1 and the estimated average water residence time was about 3 days (Figure 2.19). This average time does not consider the water circulation within the ponds and channels; water turnover time is much longer in areas with reduced water exchange and only a tidal cycle (about 12 hours) in the main channels. Budgets of non-conservative materials The relative contributions of the various water flows providing loads of dissolved phosphorus and nitrogen as runoff and sewage are reported in Tables 2.26 and 2.27 respectively. All the estimated loads of dissolved inorganic phosphorus (DIP) and nitrogen (DIN) to the system are summarized in Table 2.28. DIP balance Sewage represents the main phosphorus input, followed by cooling water from power plants and then by runoff from the watershed (Figure 2.20). Atmospheric phosphorus inputs were assumed to be zero as no data on dry and wet deposition were available. The net phosphorus budget (∆DIP) was low and reached values of -9 µmol m-2 d-1, equivalent to -90 mol d-1 overall (Figure 2.19). Negative ∆DIP indicates that the lagoon acts as a net sink of DIP.
44
Table 2.26 Mean runoff (V; 103 m3 d-1) and nutrients flow (VDIP, VDIN; mol d-1) from western channels, excluding sewages located in the last part of Via Cupa channel. * approximated to the closest 10 mol d-1 step.
Channels V VDIP VDIN Taglio della Baiona 9 49 277 Fossatone 9 29 1215 Via Cerba 18 65 3016 Canala/Valtorto 26 244 12309 Via Cupa 51 830 39836 Total 113 1220* 56650*
Table 2.27 Mean sewage flow (V; 103 m3 d-1) and nutrient loads (VDIP, VDIN; mol d-1) from treatment plants of urban, industrial and cottage wastewaters. * approximated to the closest 10 mol d-1 step.
Sewage V VDIP VDIN Civil (treated) 47 1130 24043 Industrial (treated) 49 2660 47986 Fishing cottage ~ 0 18 195 Total 97 3810* 72220*
Table 2.28 Average nutrient concentrations (DIP, DIN; mmol m-3) and loads (VDIP, VDIN; mol d-1) for the various sources. According to the LOICZ guidelines, residual sea DIP and DIN concentrations are assumed as average between sea and lagoon concentrations. * approximated to the closest 10 mol d-1 step.
Sources DIP DIN VDIP VDIN Runoff 10.74 499.87 1220 56650 Sewage 39.38 746.78 3810 72220 Atmosphere 0 97.00 0 1790 Evaporation 0 0 0 0 Power plants 2.58 49.97 2840 54920 Sea (residual) 1.70 35.07 -2200 -45300 Sea (exchange) -5580 -46820 Lagoon system 3.22 47.88 Sea 0.17 22.26
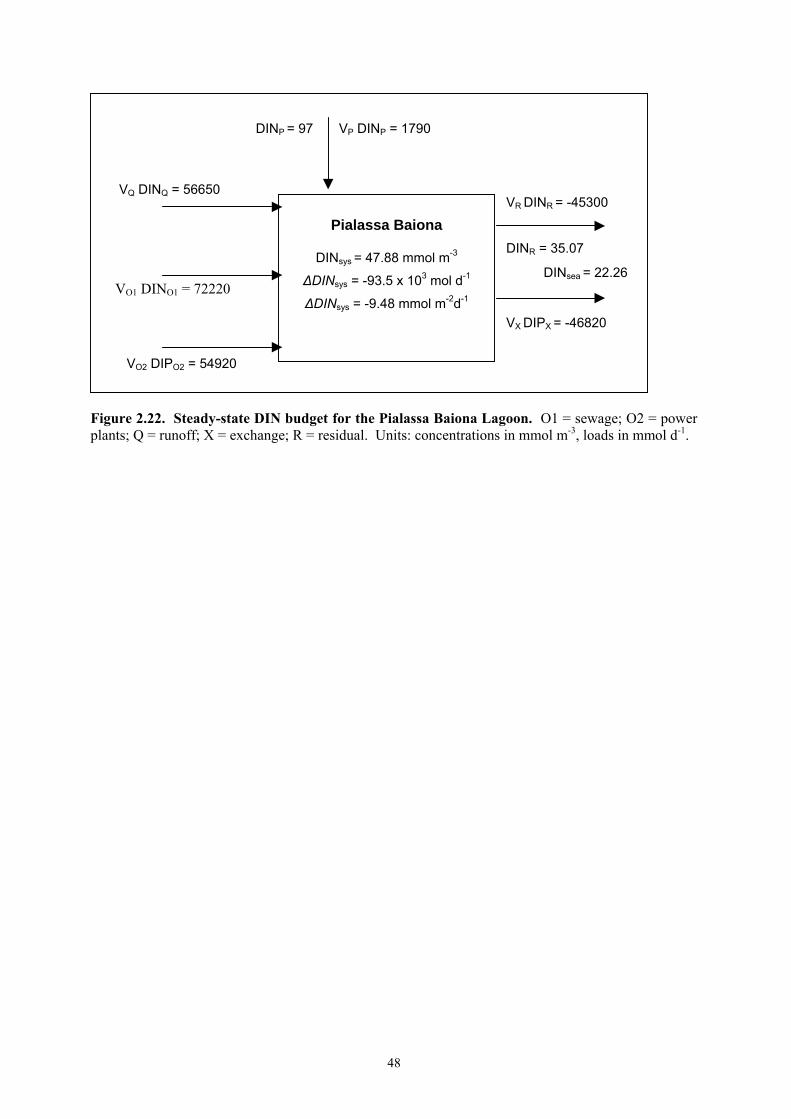
DIN balance Sewage is also the main nitrogen input, followed by runoff from the watershed and cooling water from power plants (Figure 2.20). Atmospheric nitrogen inputs were estimated from the average DIN concentration in the rainwater (97 mmol m-3) reported by Mosello (1993). The net nitrogen budget (∆DIN) was high and reached values of -9.48 mmol m-2 d-1 equivalent to -93,500 mol d-1 (Figure 2.21). Negative ∆DIN indicates that the lagoon acts as a net sink of DIN. Despite the function of the lagoon as a sink of DIP and DIN, a surplus of nutrient terrestrial inputs is exported to the sea. These flows can be estimated by summing residual and exchange flows reported in Table 2.28. Overall, the exports accounts for 7,780 mol d-1 of DIP and 92,120 mol d-1 of DIN, corresponding to 88 tonnes y-1 and 472 tonnes y-1, respectively. These values agree with estimates on theoretical bases by Marchetti and Verna (1992) for the contribution to the northern Adriatic eutrophication from the whole Candiano basin (including the harbour channels, the connected small Piomboni Lagoon and their watersheds).
45
Stoichiometric calculations of aspects of net system metabolism On an annual basis and in accordance with the assumptions of the model, the lagoon can be considered an autotrophic system because the negative ∆DIP values calculated can be considered as an estimate of net DIP assimilation associated with organic matter production. This production could be related to the development of dense beds of floating macroalgae during the summertime and the recurring phytoplankton blooms. To consider these phenomena, both the phytoplankton Redfield ratio (C:N:P=106:16:1) and the ratio for macroalgae (C:N:P=335:35:1) reported by Atkinson and Smith (1983) were used in the stoichiometric calculations (Table 2.29). Under these assumptions the net ecosystem metabolism (NEM) can be estimated to be in the range between 0.97 and 3.06 mmol C m-2 d-1, depending on whether calculations are based on phytoplankton or macroalgae as dominant primary producers. The latter seems more appropriate for the Pialassa Baiona, which is affected by seasonal blooms of macroalgae, especially in the south side of the lagoon due to the location of the major nutrient inputs. Table 2.29. Results of the stoichiometric calculations (mmol m-2 d-1).
Hypothesis NEM ∆DINexp (nfix-denit) Phytoplankton 0.97 -0.15 -9.33 Macroalgae 3.06 -0.32 -9.16
The difference between the observed and expected ∆DIN, based on the N:P ratio, was considered to be the net ecosystem nitrogen fixation minus denitrification (nfix-denit). Negative values using either phytoplankton or macroalgae nutrient ratios suggest that denitrification losses dominate over nitrogen fixation inputs (Table 2.29). The relatively high values obtained can be explained by high benthic respiration rates. However, these results should be considered with caution since they not take into account the heterogeneity of the lagoon system.
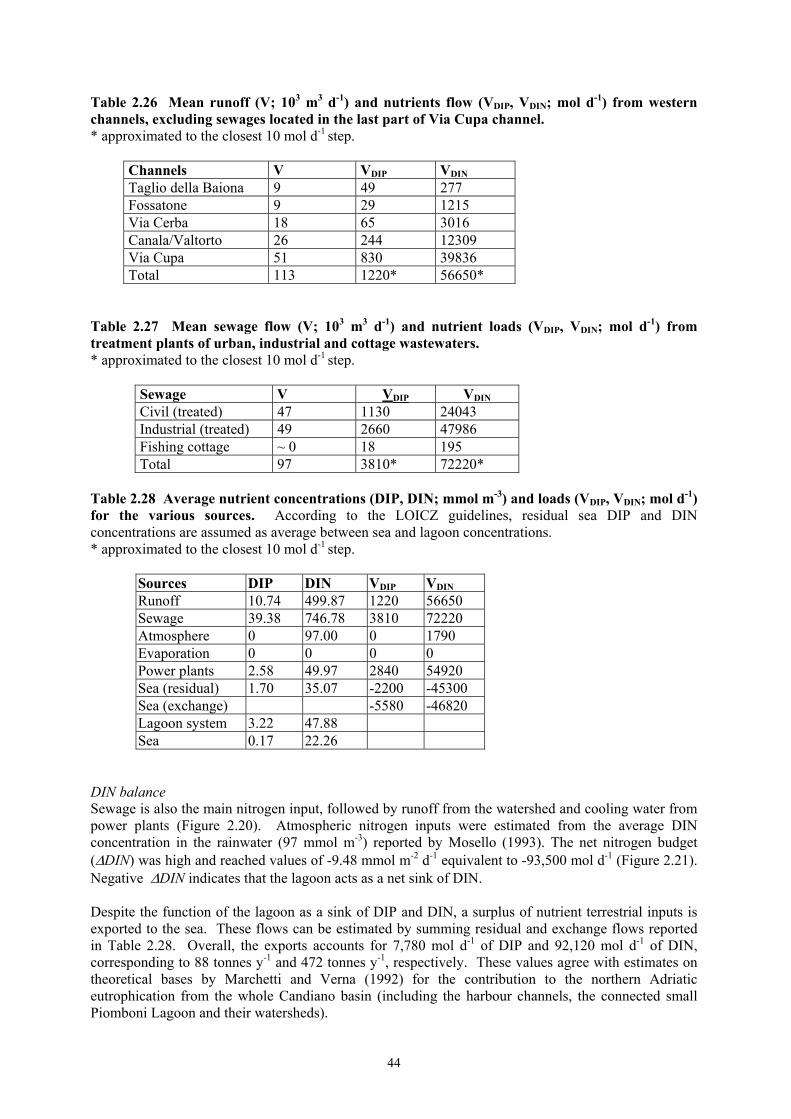
Figure 2.17. View of the Pialassa Baiona Lagoon (photo by Biserni).
46
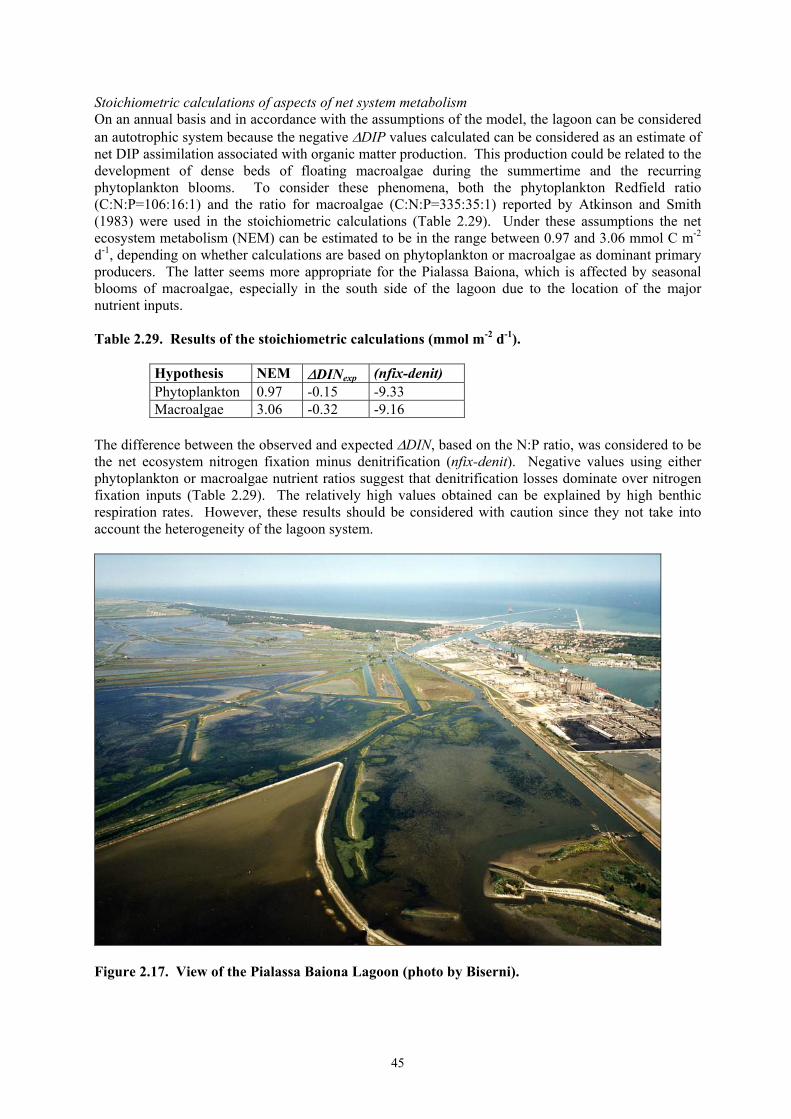
Figure 2.18. Fishing activities in the Pialassa Baiona Lagoon.
Figure 2.19. Steady-state water and salt budgets for the Pialassa Baiona Lagoon. P = precipitation; E = evaporation; O1 = sewage; O2 = power plants; Q = runoff; X = exchange; R = residual. Units: water fluxes in 103 m3 d-1; salt fluxes in 106 psu m3 d-1; salinity in psu.
VX = 1828
Ssea = 30.32
Pialassa Baiona
Areasys = 9.862 106 m2
Vsys = 8.893 106 m3
Ssys = 27.96
τsys = 3 d
VP = 18.5
VQ = 113 VQSQ = 0
SR = 29.14 VRSR = 37.6 VR = -1292 VO1 = 97
VO1SO1 = 0
VE = -36
VO2 = 1099 VO2SO2 = 33.3
47
Runoff
Power plants
Atmosphere
Civil
Industrial
VDIP
VDIN Sewage
Sources48%
16%
36%
14%
34%
39%
30%
1%
30% 13%
26%
Runoff
Power plants
Atmosphere
Civil
Industrial
VDIP
VDIN Sewage
Sources48%
16%
36%
14%
34%
39%
30%
1%
30% 13%
26%
Figure 2.20. Relative contribution of the different water inputs to the Pialassa Baiona Lagoon budgets of DIP and DIN.
Figure 2.21. Steady-state DIP budget for the Pialassa Baiona Lagoon. O1 = sewage; O2 = power plants; Q = runoff; X = exchange; R = residual. Units: concentrations in mmol m-3, loads in mmol d-1. * = assumed.
Pialassa Baiona
DIPsys = 3.22
∆DIPsys = -90 mol d-1
∆DIPsys = -9 µmol m-2d-1
DIPP = 0*
VQ DIPQ = 1220
VR DIPR = -2200 DIPR = 1.7
VO1 DIPO1 = 3810
VX DIPX = -5580
DIPsea = 0.17
VO2 DIPO2 = 2840
48
Figure 2.22. Steady-state DIN budget for the Pialassa Baiona Lagoon. O1 = sewage; O2 = power plants; Q = runoff; X = exchange; R = residual. Units: concentrations in mmol m-3, loads in mmol d-1.
Pialassa Baiona
DINsys = 47.88 mmol m-3
∆DINsys = -93.5 x 10³ mol d-1
∆DINsys = -9.48 mmol m-2d-1
DINP = 97 VP DINP = 1790
VQ DINQ = 56650 VR DINR = -45300 DINR = 35.07
VO1 DINO1 = 72220
VX DIPX = -46820
DINsea = 22.26
VO2 DIPO2 = 54920


![Ecohidrology and Nutrient Fluxes in Forest Ecosystems of … · 2017. 12. 19. · temperate forest with an extraordinary genetic, phytogeographic and ecological significance [13]](https://img.pdfslide.us/doc/110x75/60f75c7dc8bf3871b87ff9c9/ecohidrology-and-nutrient-fluxes-in-forest-ecosystems-of-2017-12-19-temperate.jpg)