Embed Size (px)
Citation preview
Nutrient Attenuation in Chesapeake Bay Watershed Onsite Wastewater Treatment Systems - Final Report
August 2016
PRESENTED TO PRESENTED BY
US Environmental Protection Agency
Chesapeake Bay Program Office
Prepared by:
Victor D’Amato
with:
Lewis Linker, Ning Zhou , David Wood
Chesapeake Bay Program Office
Scott Ator, John Brakebill, Andrew Sekellick
United States Geological Survey (USGS)
Chesapeake Bay Onsite Wastewater Nutrient Attenuation Expert Review Panel
Steven Berkowitz, North Carolina Dept. of Health and
Human Services
Tom Boekeloo, New York State Dept. of Environ.
Conservation
Jay Conta, Virginia Tech/Virginia Dept. of Health
Marcia Degen, Virginia Dept. of Health
Judy Denver, United States Geological Survey
Joshua Flatley, Maryland Dept. of Environ. Protection
John Galbraith, Virginia Tech
Barry Glotfelty, Frederick County (MD) Health Department
Robert Goo, US EPA - Office of Watersheds, Oceans and
Wetlands
Jack Hayes, Delaware Dept. of Natural Resources and
Environmental Control
George Heufelder, Barnstable County (MA) Department of
Health and Environment
Dave Montali, West Virginia Department of Environmental
Protection
Michael O'Driscoll, East Carolina University/Duke
University
David Radcliffe, University of Georgia
Eberhard Roeder, Florida Department of Health
Robert Siegrist, Colorado School of Mines
Nutrient Attenuation in Onsite Wastewater Treatment Systems - Final Report August 2016
i
ACKNOWLEDGEMENTS
Other contributors and former panelists:
Rob Adler, US EPA - Region 1 (retired)
Jim Anderson, University of Minnesota
Jason Baumgartner, Delaware Dept. of Natural Resources and Environmental Control
John Diehl, Pennsylvania Department of Environmental Protection (retired)
Paul Finnell, US Department of Agriculture
Mengistu Geza, Colorado School of Mines
Kristina Heinemann, US EPA - Region 2
Charles Humphrey, East Carolina University
Nick Hong, Pennsylvania Department of Environmental Protection
Joyce Hudson, US EPA - Office of Wastewater Management (retired)
Ruth Izraeli, US EPA - Region 2
Jim Kreissl, Tetra Tech
David Lindbo, US Department of Agriculture
Andrew J. Maupin, Idaho Dept. of Environ. Quality
Kevin McLeary, Pennsylvania Department of Environmental Protection
Randy Miles, University of Missouri
Ross Mandel, Interstate Commission on the Potomac River Basin
Jeff Moeller, Water Environment Research Foundation
Rich Piluk, Anne Arundel County (MD) Health Department
Sushama Pradhan, North Carolina Department of Health and Human Services
Jay Prager, Maryland Department of Environment (retired)
Carol Ptacek, University of Waterloo
Eric Regensburger, Montana Department of Environmental Quality
David Sample, Virginia Tech
Durrelle Scott, Virginia Tech
Ivan Valiela, Cornell University
Janice Vollero, Pennsylvania Department of Environmental Protection
Kang Xia, Virginia Tech
Dedicated to the memory of James F. Kreissl, friend and colleague, for his 40 years of contributions to the
wastewater management field. Jim had the rare ability to integrate engineering, scientific, technical, policy, and
even political considerations into strategies for protecting and restoring water quality.
ii
EXECUTIVE SUMMARY
The Chesapeake Bay Program (CBP) authorized an Expert Panel to review the available science and provide
recommendations on how to factor nutrient attenuation into Chesapeake Bay TMDL onsite wastewater treatment
system (OWTS) load estimates. The Panel primarily addressed total nitrogen (TN) reductions (as opposed to
phosphorus reductions) due to time and resource limitations, and therefore no recommendations about
phosphorus attenuation in OWTS is presented in this report. Specifically, the Panel considered whether and how
spatially differentiated improvements should be made to the CBP’s current assumptions of a consistent 20
percent TN reduction (from a starting septic tank effluent baseline load of 5 kg/cap/year) in the soil treatment unit
and an additional 60 percent attenuation of TN load between the system and modeled stream reach.
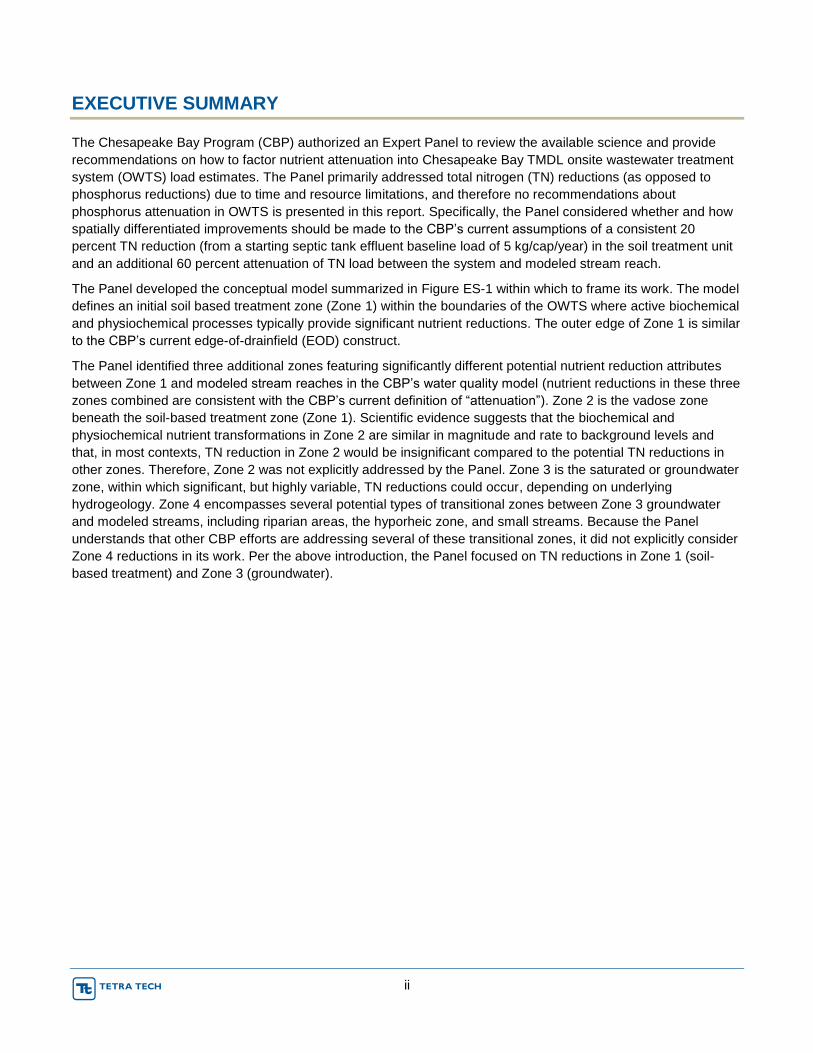
The Panel developed the conceptual model summarized in Figure ES-1 within which to frame its work. The model
defines an initial soil based treatment zone (Zone 1) within the boundaries of the OWTS where active biochemical
and physiochemical processes typically provide significant nutrient reductions. The outer edge of Zone 1 is similar
to the CBP’s current edge-of-drainfield (EOD) construct.
The Panel identified three additional zones featuring significantly different potential nutrient reduction attributes
between Zone 1 and modeled stream reaches in the CBP’s water quality model (nutrient reductions in these three
zones combined are consistent with the CBP’s current definition of “attenuation”). Zone 2 is the vadose zone
beneath the soil-based treatment zone (Zone 1). Scientific evidence suggests that the biochemical and
physiochemical nutrient transformations in Zone 2 are similar in magnitude and rate to background levels and
that, in most contexts, TN reduction in Zone 2 would be insignificant compared to the potential TN reductions in
other zones. Therefore, Zone 2 was not explicitly addressed by the Panel. Zone 3 is the saturated or groundwater
zone, within which significant, but highly variable, TN reductions could occur, depending on underlying
hydrogeology. Zone 4 encompasses several potential types of transitional zones between Zone 3 groundwater
and modeled streams, including riparian areas, the hyporheic zone, and small streams. Because the Panel
understands that other CBP efforts are addressing several of these transitional zones, it did not explicitly consider
Zone 4 reductions in its work. Per the above introduction, the Panel focused on TN reductions in Zone 1 (soil-
based treatment) and Zone 3 (groundwater).
iii
Figure ES-1. Onsite Wastewater Treatment and Attenuation Zones
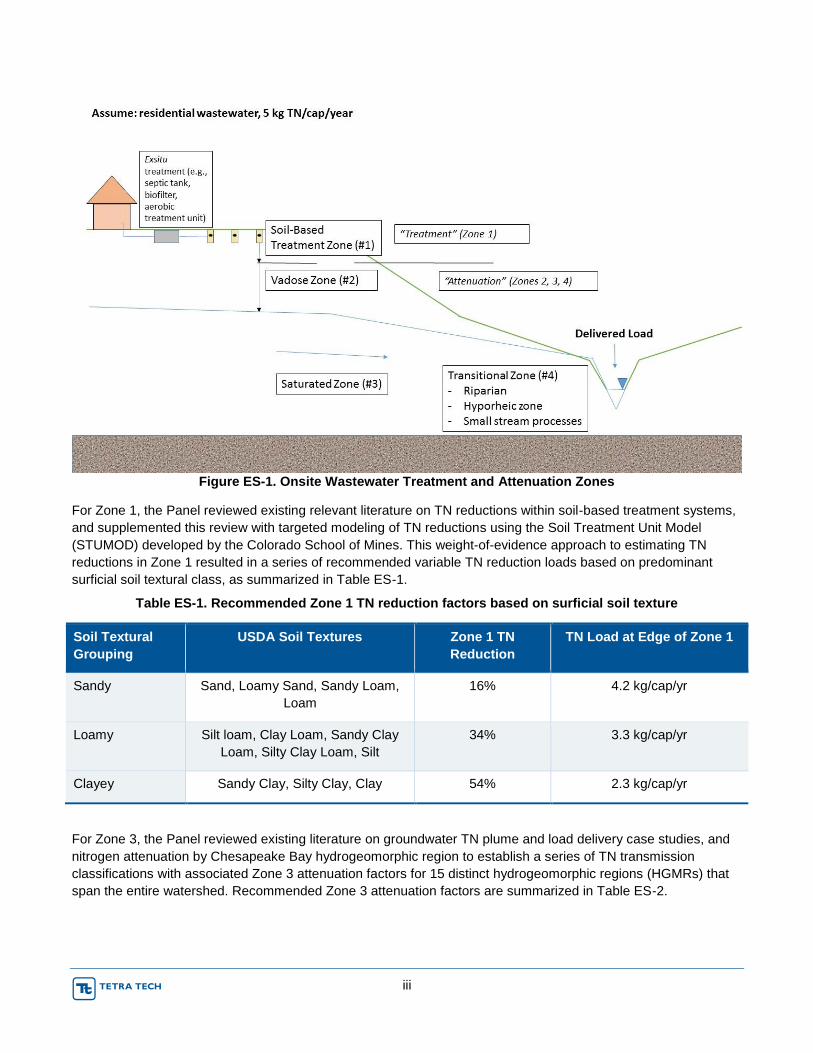
For Zone 1, the Panel reviewed existing relevant literature on TN reductions within soil-based treatment systems,
and supplemented this review with targeted modeling of TN reductions using the Soil Treatment Unit Model
(STUMOD) developed by the Colorado School of Mines. This weight-of-evidence approach to estimating TN
reductions in Zone 1 resulted in a series of recommended variable TN reduction loads based on predominant
surficial soil textural class, as summarized in Table ES-1.
Table ES-1. Recommended Zone 1 TN reduction factors based on surficial soil texture
Soil Textural
Grouping
USDA Soil Textures Zone 1 TN
Reduction
TN Load at Edge of Zone 1
Sandy Sand, Loamy Sand, Sandy Loam,
Loam
16% 4.2 kg/cap/yr
Loamy Silt loam, Clay Loam, Sandy Clay
Loam, Silty Clay Loam, Silt
34% 3.3 kg/cap/yr
Clayey Sandy Clay, Silty Clay, Clay 54% 2.3 kg/cap/yr
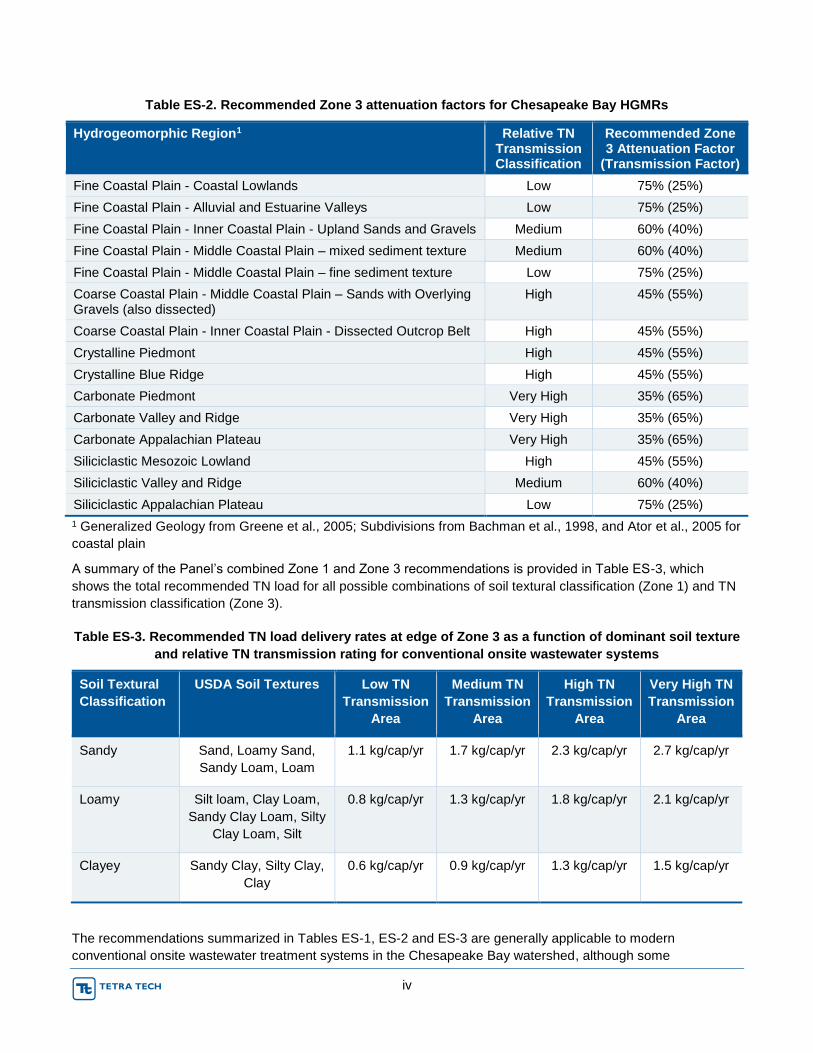
For Zone 3, the Panel reviewed existing literature on groundwater TN plume and load delivery case studies, and
nitrogen attenuation by Chesapeake Bay hydrogeomorphic region to establish a series of TN transmission
classifications with associated Zone 3 attenuation factors for 15 distinct hydrogeomorphic regions (HGMRs) that
span the entire watershed. Recommended Zone 3 attenuation factors are summarized in Table ES-2.
iv
Table ES-2. Recommended Zone 3 attenuation factors for Chesapeake Bay HGMRs
Hydrogeomorphic Region1 Relative TN Transmission Classification
Recommended Zone 3 Attenuation Factor
(Transmission Factor)
Fine Coastal Plain - Coastal Lowlands Low 75% (25%)
Fine Coastal Plain - Alluvial and Estuarine Valleys Low 75% (25%)
Fine Coastal Plain - Inner Coastal Plain - Upland Sands and Gravels Medium 60% (40%)
Fine Coastal Plain - Middle Coastal Plain – mixed sediment texture Medium 60% (40%)
Fine Coastal Plain - Middle Coastal Plain – fine sediment texture Low 75% (25%)
Coarse Coastal Plain - Middle Coastal Plain – Sands with Overlying Gravels (also dissected)
High 45% (55%)
Coarse Coastal Plain - Inner Coastal Plain - Dissected Outcrop Belt High 45% (55%)
Crystalline Piedmont High 45% (55%)
Crystalline Blue Ridge High 45% (55%)
Carbonate Piedmont Very High 35% (65%)
Carbonate Valley and Ridge Very High 35% (65%)
Carbonate Appalachian Plateau Very High 35% (65%)
Siliciclastic Mesozoic Lowland High 45% (55%)
Siliciclastic Valley and Ridge Medium 60% (40%)
Siliciclastic Appalachian Plateau Low 75% (25%)
1 Generalized Geology from Greene et al., 2005; Subdivisions from Bachman et al., 1998, and Ator et al., 2005 for
coastal plain
A summary of the Panel’s combined Zone 1 and Zone 3 recommendations is provided in Table ES-3, which
shows the total recommended TN load for all possible combinations of soil textural classification (Zone 1) and TN
transmission classification (Zone 3).
Table ES-3. Recommended TN load delivery rates at edge of Zone 3 as a function of dominant soil texture
and relative TN transmission rating for conventional onsite wastewater systems
Soil Textural
Classification
USDA Soil Textures Low TN
Transmission
Area
Medium TN
Transmission
Area
High TN
Transmission
Area
Very High TN
Transmission
Area
Sandy Sand, Loamy Sand,
Sandy Loam, Loam
1.1 kg/cap/yr 1.7 kg/cap/yr 2.3 kg/cap/yr 2.7 kg/cap/yr
Loamy Silt loam, Clay Loam,
Sandy Clay Loam, Silty
Clay Loam, Silt
0.8 kg/cap/yr 1.3 kg/cap/yr 1.8 kg/cap/yr 2.1 kg/cap/yr
Clayey Sandy Clay, Silty Clay,
Clay
0.6 kg/cap/yr 0.9 kg/cap/yr 1.3 kg/cap/yr 1.5 kg/cap/yr
The recommendations summarized in Tables ES-1, ES-2 and ES-3 are generally applicable to modern
conventional onsite wastewater treatment systems in the Chesapeake Bay watershed, although some
v
conservatism was built into Zone 1 estimates to account for OWTS performing suboptimally. However, the Panel
did not explicitly discriminate between modern systems and legacy systems (those installed before modern
standards that emphasize treatment in the soil rather than focusing on effluent disposal) in this report.
Numerous factors can have an impact on nutrient reductions associated with onsite systems. The Panel and CBP
cannot define with confidence the full suite of factors that affect nutrient reductions, nor determine how those
factors vary from system to system and site to site. Accordingly, the findings and recommendations should
generally be taken to represent “average” systems within the specified context (i.e., surficial soil texture for Zone
1, hydrogeomorphic region for Zone 3), but care should be taken when using the findings to draw inferences
about specific individual systems or in areas known to include an unusually high percentage of legacy or
malfunctioning systems.
Based on these and other limitations of the Panel’s work (which was constrained by significant data limitations),
future CBP efforts should focus on the following.
1. Improving understanding of the factors affecting nutrient processing by conducting additional, deeper
literature and existing data reviews and by collecting new empirical and modeling data, including
collecting more data about existing systems and sites within the Chesapeake Bay watershed.
2. Addressing phosphorus treatment and attenuation.
3. Explicitly differentiating between conventional OWTS, and malfunctioning and legacy systems. Reducing
malfunctions and upgrading legacy systems could be considered as future BMPs.
4. The time distribution of load delivery including understanding long-term system lags that might impact
nutrient loading dynamics, short-term nutrient load delivery dynamics (e.g., how does load delivery relate
to baseflow and stormflow conditions), and travel time with respect to Zone 3 TN load reduction
estimates.
More detailed recommendations for future efforts are provided in the report.
Nutrient Attenuation in Onsite Wastewater Treatment Systems - Final Report August 2016
vi
TABLE OF CONTENTS
1.0 INTRODUCTION ..................................................................................................................................................1
1.1 Background ....................................................................................................................................................1
1.2 Current and Future Chesapeake Bay Model Approach .................................................................................2
1.3 Proposed Mechanistic Approach ...................................................................................................................3
1.3.1 Soil-Based Treatment Zone (Zone 1) ...................................................................................................5
1.3.2 Vadose Zone (Zone 2) ..........................................................................................................................5
1.3.3 Groundwater Zone (Zone 3) .................................................................................................................6
1.3.4 Transitional Zone (Zone 4) ...................................................................................................................6
1.4 Challenges and Limitations ............................................................................................................................7
2.0 METHODS ............................................................................................................................................................9
2.1 Weight of Evidence Approach ........................................................................................................................9
2.2 Mathematical Modeling ..................................................................................................................................9
2.2.1 STUMOD ..............................................................................................................................................9
2.2.2 SPARROW ........................................................................................................................................ 10
2.3 Physiography .............................................................................................................................................. 10
3.0 RESULTS AND DISCUSSION .......................................................................................................................... 12
3.1 Soil-Based Treatment Zone (Zone 1) ......................................................................................................... 12
3.1.1 Introduction ........................................................................................................................................ 12
3.1.2 Procedure .......................................................................................................................................... 12
3.1.3 Results ............................................................................................................................................... 13
3.2 Groundwater Zone (Zone 3) ....................................................................................................................... 22
3.2.1 Introduction ........................................................................................................................................ 22
3.2.2 Procedures ........................................................................................................................................ 23
3.2.3 Results ............................................................................................................................................... 24
3.3 Supplemental SPARROW Runs ................................................................................................................. 35
4.0 CONCLUSIONS AND RECOMMENDATIONS ................................................................................................ 36
4.1 Additional Recommendations ..................................................................................................................... 38
4.1.1 Expert Panel Activities ....................................................................................................................... 39
4.1.2 Other Research Activities: Subwatershed Assessments .................................................................. 40
5.0 REFERENCES .................................................................................................................................................. 41
Nutrient Attenuation in Onsite Wastewater Treatment Systems - Final Report August 2016
vii
LIST OF TABLES
Table 1. Parameters associated with Equation 1 .......................................................................................................5 Table 2. STUMOD results for conventional systems with a water table at 60 cm and 100 percent of the design
hydraulic loading rate............................................................................................................................................... 14 Table 3. STUMOD results for conventional systems with a water table at 60 cm and 50 percent of the design
hydraulic loading rate............................................................................................................................................... 16 Table 4. STUMOD results for conventional systems with a water table at 30 cm and 100 percent of the design
hydraulic loading rate............................................................................................................................................... 17 Table 5. STUMOD results for conventional systems with a water table at 30 cm and 50 percent of the design
hydraulic loading rate............................................................................................................................................... 18 Table 6. Summary of STUMOD outputs for Zone 1 in a conventional system with various combinations of
treatment depth and loading rate (recommended TN reduction factors shaded) ................................................... 19 Table 7. 2002 Chesapeake Bay onsite system loads by USDA soil texture group for three potential Zone 1
calculation methods (spatially variable rates use the TN reduction rates from Table 2, 60 cm/100%) .................. 20 Table 8. Average 1985-2005 Chesapeake Bay onsite system loads by USDA soil texture group for three potential
Zone 1 calculation methods (spatially variable rates use the TN reduction rates from Table 2, 60 cm/100%) ...... 21 Table 9. Nitrogen Delivery Factors for Onsite Systems in Maryland ....................................................................... 22 Table 10. Estimated nitrate reduction in the surficial hydrogeomorphic regions ..................................................... 32 Table 11. Recommended edge of Zone 1 TN load as a function of dominant soil texture for conventional onsite
wastewater systems ................................................................................................................................................ 36 Table 12. Recommended Zone 3 attenuation factors for Chesapeake Bay HGMRs ............................................. 37 Table 13. Recommended TN load delivery rates at edge of Zone 3 as a function of dominant soil texture and
relative TN transmission rating for conventional onsite wastewater systems ......................................................... 38 Table 14. Summary of nitrogen reduction efficiency and mass loading rates for different components and zones
relevant to a soil-based onsite wastewater system ................................................................................................. 38 Table 15. Nitrogen Delivery Factors for Onsite Systems in Maryland ..................................................................... 44 Table 16. TN Loads for North Carolina Piedmont BMP Crediting Program (all loads are annual averages) ......... 44
LIST OF FIGURES
Figure 1. Current Conceptual Model of Nitrogen Loadings to Streams from Conventional Onsite Wastewater
Systems as used by the Chesapeake Bay Program (Phase 5.2) ..............................................................................2 Figure 2. Onsite Wastewater Treatment and Attenuation Zones ...............................................................................3 Figure 3. Nutrient Transformations associated with Treatment and Attenuation Zones (from Siegrist and Geza,
2014) ...........................................................................................................................................................................4 Figure 4. Chesapeake Bay Watershed Physiography, left, (Andrews, 2008) and Hydrogeomorphology, right
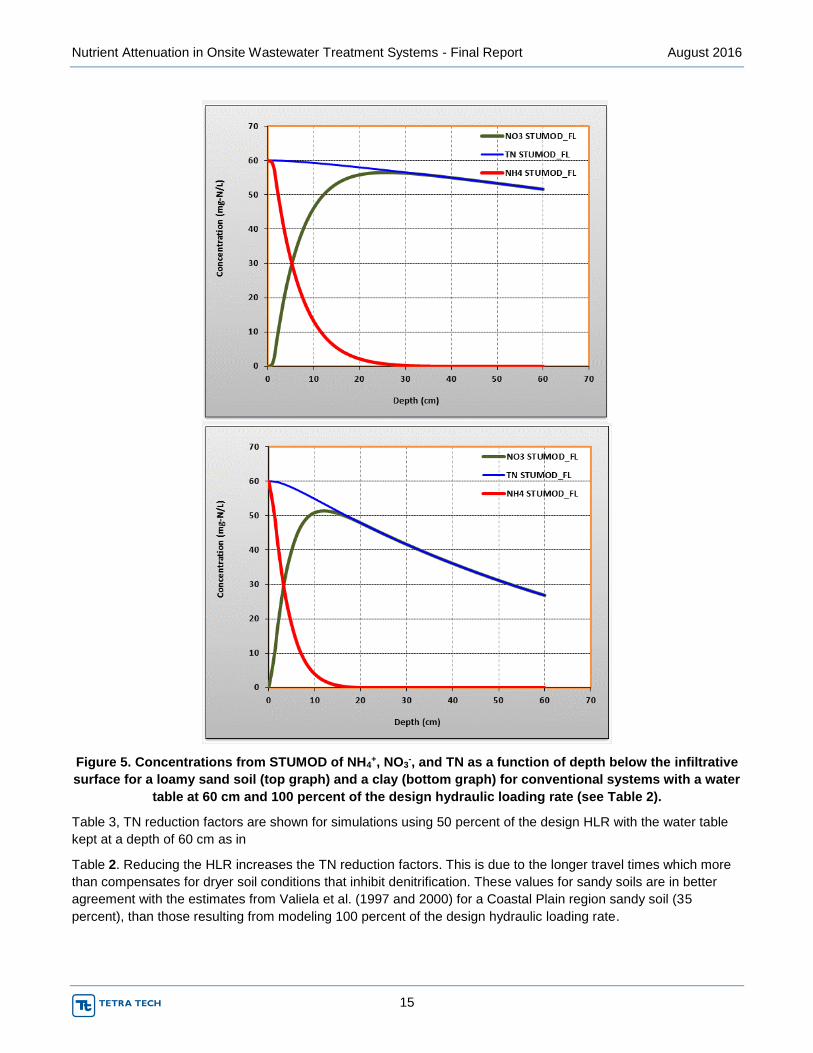
(Bachman et al., 1998). ........................................................................................................................................... 11 Figure 5. Concentrations from STUMOD of NH4
+, NO3-, and TN as a function of depth below the infiltrative surface
for a loamy sand soil (top graph) and a clay (bottom graph) for conventional systems with a water table at 60 cm
and 100 percent of the design hydraulic loading rate (see Table 2). ...................................................................... 15 Figure 6. Concentrations from STUMOD of NH4+, NO3-, and TN as a function of depth below the infiltrative
surface for a silt soil for a conventional system with a water table at 30 cm and 100 percent of the design
hydraulic loading rate (see Table 4) ........................................................................................................................ 17 Figure 7. Measured groundwater TDN concentration versus distance from the soil-based treatment system at a
residential OWTS site adjacent to the Pamlico River Estuary, Washington, North Carolina. Black dots are from a
literature review by Valiela et al., 1997. Figure is modified from O’Driscoll et al., 2014. ........................................ 23 Figure 8. Hydrogeomorphic regions according to Bachman et al. (1998) ............................................................... 25 Figure 9. Hydrogeomorphic refinement of Coastal Plain by Ator et al. (2005) ........................................................ 26
Nutrient Attenuation in Onsite Wastewater Treatment Systems - Final Report August 2016
viii
Figure 10. Results of assessment of likelihood exceeding threshold concentrations of nitrate in shallow
groundwater in the mid-Atlantic region (Greene et al., 2005 Figures 11A, 11C, and 11E).The likelihood includes
both the presence of sources and the vulnerability of the groundwater. A threshold = 1 mg/L; C threshold = 3
mg/L; E threshold = 10 mg/L ................................................................................................................................... 29 Figure 11. Probability (%) of oxic groundwater at a 30 m depth to the top of the open interval for groundwater in
the Chesapeake Bay watershed. (Figure 2 of Tesoriero et al., 2015) ..................................................................... 30
APPENDICES
APPENDIX A. OTHER ATTENUATION APPROACHES REVIEWED .................................................................. 44
Nutrient Attenuation in Onsite Wastewater Treatment Systems - Final Report August 2016
ix
ACRONYMS/ABBREVIATIONS
Acronyms/Abbreviations Definition
BMP Best Management Practices
BOD Biochemical Oxygen Demand
C Carbon
CBP Chesapeake Bay Program
CI Chloride
DO Dissolved Oxygen
EOD Edge-of-drainfield
HLR Hydraulic Loading Rate
HGMR Hydrogeomorphic Region
NAWQA National Water Quality Assessment Program
NH4+ Ammonia
NO3- Nitrate
ORP Oxidation-Reduction Potential
OWTS Onsite Wastewater Treatment Systems
P Phosphorus
SPARROW Spatially Referenced Regression on Watershed Attributes
STE Septic Tank Effluent
STUMOD Soil Treatment Unit Model
TDN Total Dissolved Nitrogen
The Panel The Chesapeake Bay Onsite Wastewater Nutrient Attenuation Expert Review Panel
TKN Total Kjeldahl Nitrogen
TMDL Total Maximum Daily Load
TN Total Nitrogen
TP Total Phosphorus
USDA United States Department of Agriculture
USGS United States Geological Survey
Zone 1 Soil-Based Treatment Zone
Zone 2 Vadose Zone/Deep Unsaturated Zone
Zone 3 Groundwater Zone
Zone 4 Transitional Zone
Nutrient Attenuation in Onsite Wastewater Treatment Systems - Final Report August 2016
1
1.0 INTRODUCTION
1.1 BACKGROUND
The Chesapeake Bay Onsite Wastewater Nutrient Attenuation Expert Review Panel (the Panel) was convened by
the Chesapeake Bay Program (CBP) Office in June 2014 and coordinated via conference call approximately
monthly through June 2015. The Panel held an in-person meeting in July 2015 and convened via conference call
again in July and August 2016 to prepare this draft final report.
The main charge for the Panel was to review available science on how to factor nutrient attenuation into
Chesapeake Bay TMDL onsite wastewater treatment system load estimates and BMP efficiency factors. For the
purposes of this Panel, “attenuation” was defined by the CBP as the reduction in wastewater-derived nitrogen and
phosphorus between the onsite wastewater treatment systems (boundaries of the soil-based treatment system or
“drainfield”) and modeled surface waters. However, as described in the report, in addition to attenuation as
defined by the CBP, the Panel addressed soil-based treatment within (beneath) the soil-based treatment system
itself given its importance in overall nutrient load delivery and its potential spatial variability.
In its charge by the CBP, the Panel was specifically requested to:
Determine whether the Bay TMDL model can be improved by using attenuation rates that vary based on
soil, site and system characteristics, rather than the constant 60 percent total nitrogen (TN) attenuation
rate currently used.
Determine whether the currently used 100 percent removal of total phosphorus (TP) from onsite
wastewater system effluents is warranted, whether it should be changed, or whether TP removal should
be variable based on site/system characteristics. (Note that the Panel did not take up the question of TP
removal at this time, instead deciding to focus on TN removal which was determined by Panel consensus
to be both a more significant onsite wastewater source to the Bay and complex enough on its own to
warrant the Panel’s focused efforts.)
If it is determined, based on the available science, that the model can be improved, recommend a
methodology or methodologies to be used and specific attenuation rates to be used in different contexts.
The attenuation rate could vary based on:
o Soil texture
o Soil geochemistry
o Soil wetness/water table depth or depth to restrictive horizons
o System proximity to surface waters and surface water-groundwater interactions
o Hydrogeological setting, groundwater recharge, and groundwater residence time
o System age, maintenance, and biomat formation
o Riparian buffers
o Water use, wastewater, and source water chemistry
o Topographic conditions between system and surface water
o Lower order stream miles
o Other factors supported by scientific review
Beyond this specific charge, the Panel was asked to:
Document data needs for supporting revisions to currently used or recommended nutrient attenuation
rates.
Recommend procedures for reporting, tracking and verifying the recommended credits, as practical,
recognizing that such recommendations are not required for Phase 6 modeling since attenuation is not
dependent upon management actions of the partnership. The model is designed to track progress
achieved by the Partnership’s management actions (e.g., BMPs installed, WWTP upgrades). The
Nutrient Attenuation in Onsite Wastewater Treatment Systems - Final Report August 2016
2
attenuation rate is seen by the model as a background condition, rather than a management action, and
thus does not need to be “reported, tracked and verified” by the states like BMPs do.
Critically analyze any unintended consequence associated with the methodolog(ies) and potential for
double or over-counting of nutrient reduction credit.
1.2 CURRENT AND FUTURE CHESAPEAKE BAY MODEL APPROACH
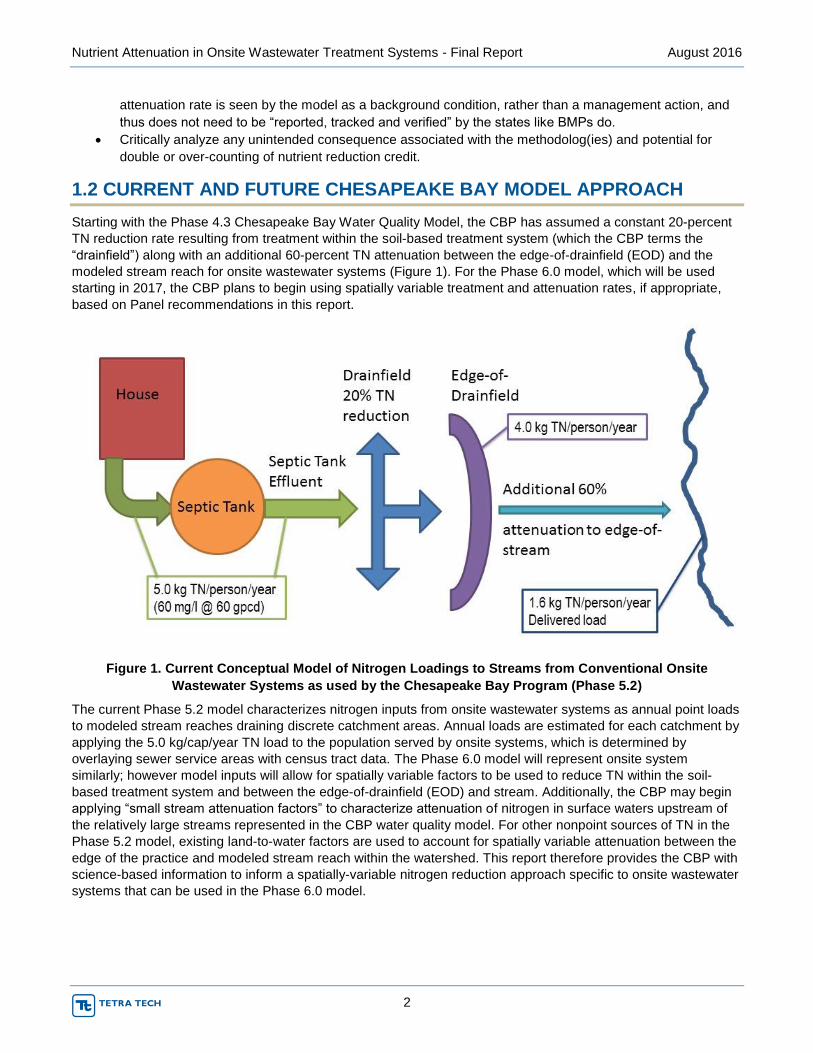
Starting with the Phase 4.3 Chesapeake Bay Water Quality Model, the CBP has assumed a constant 20-percent
TN reduction rate resulting from treatment within the soil-based treatment system (which the CBP terms the
“drainfield”) along with an additional 60-percent TN attenuation between the edge-of-drainfield (EOD) and the
modeled stream reach for onsite wastewater systems (Figure 1). For the Phase 6.0 model, which will be used
starting in 2017, the CBP plans to begin using spatially variable treatment and attenuation rates, if appropriate,
based on Panel recommendations in this report.
Figure 1. Current Conceptual Model of Nitrogen Loadings to Streams from Conventional Onsite
Wastewater Systems as used by the Chesapeake Bay Program (Phase 5.2)
The current Phase 5.2 model characterizes nitrogen inputs from onsite wastewater systems as annual point loads
to modeled stream reaches draining discrete catchment areas. Annual loads are estimated for each catchment by
applying the 5.0 kg/cap/year TN load to the population served by onsite systems, which is determined by
overlaying sewer service areas with census tract data. The Phase 6.0 model will represent onsite system
similarly; however model inputs will allow for spatially variable factors to be used to reduce TN within the soil-
based treatment system and between the edge-of-drainfield (EOD) and stream. Additionally, the CBP may begin
applying “small stream attenuation factors” to characterize attenuation of nitrogen in surface waters upstream of
the relatively large streams represented in the CBP water quality model. For other nonpoint sources of TN in the
Phase 5.2 model, existing land-to-water factors are used to account for spatially variable attenuation between the
edge of the practice and modeled stream reach within the watershed. This report therefore provides the CBP with
science-based information to inform a spatially-variable nitrogen reduction approach specific to onsite wastewater
systems that can be used in the Phase 6.0 model.
Nutrient Attenuation in Onsite Wastewater Treatment Systems - Final Report August 2016
3
1.3 PROPOSED MECHANISTIC APPROACH
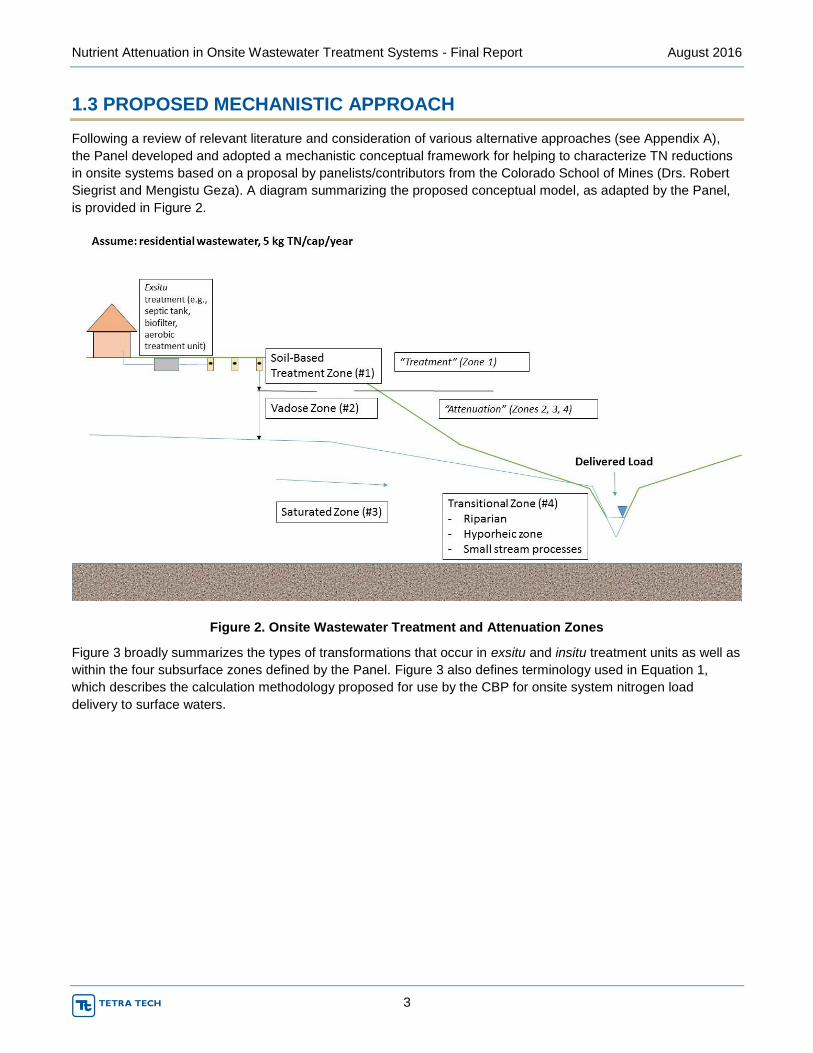
Following a review of relevant literature and consideration of various alternative approaches (see Appendix A),
the Panel developed and adopted a mechanistic conceptual framework for helping to characterize TN reductions
in onsite systems based on a proposal by panelists/contributors from the Colorado School of Mines (Drs. Robert
Siegrist and Mengistu Geza). A diagram summarizing the proposed conceptual model, as adapted by the Panel,
is provided in Figure 2.
Figure 2. Onsite Wastewater Treatment and Attenuation Zones
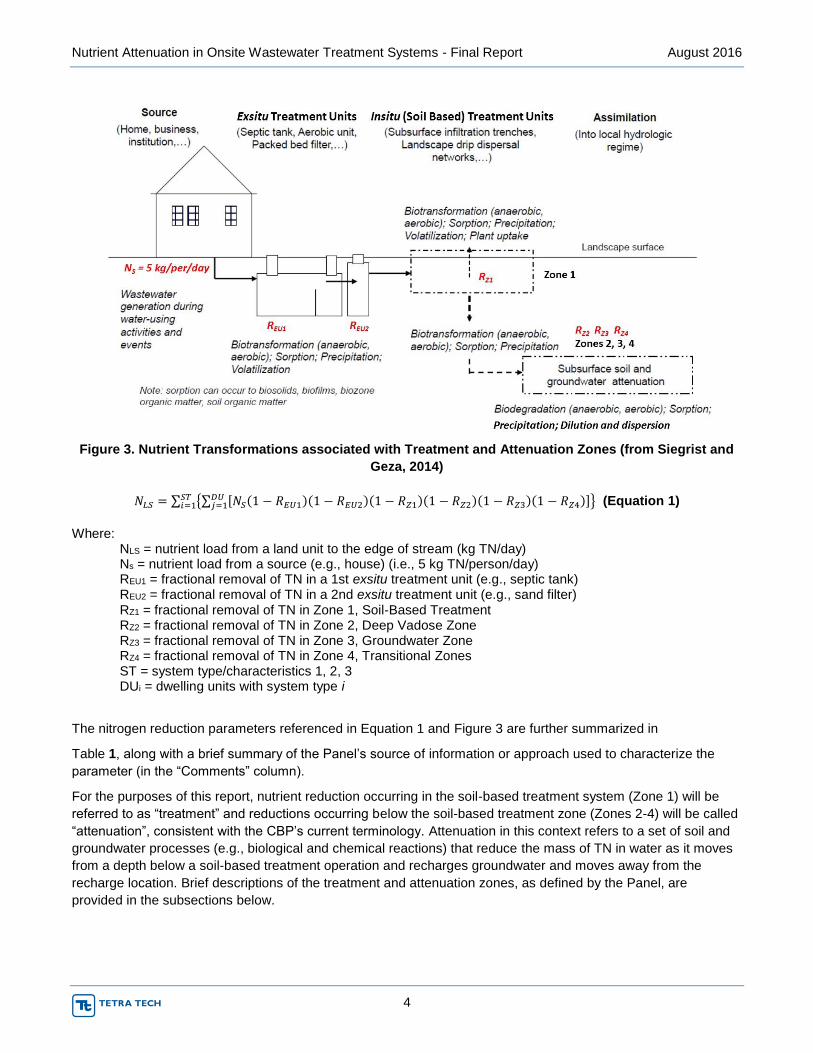
Figure 3 broadly summarizes the types of transformations that occur in exsitu and insitu treatment units as well as
within the four subsurface zones defined by the Panel. Figure 3 also defines terminology used in Equation 1,
which describes the calculation methodology proposed for use by the CBP for onsite system nitrogen load
delivery to surface waters.
Nutrient Attenuation in Onsite Wastewater Treatment Systems - Final Report August 2016
4
Figure 3. Nutrient Transformations associated with Treatment and Attenuation Zones (from Siegrist and
Geza, 2014)
𝑁𝐿𝑆 = ∑ {∑ [𝑁𝑆(1 − 𝑅𝐸𝑈1)(1 − 𝑅𝐸𝑈2)(1 − 𝑅𝑍1)(1 − 𝑅𝑍2)(1 − 𝑅𝑍3)(1 − 𝑅𝑍4)]𝐷𝑈𝑗=1 }𝑆𝑇
𝑖=1 (Equation 1)
Where:
NLS = nutrient load from a land unit to the edge of stream (kg TN/day) Ns = nutrient load from a source (e.g., house) (i.e., 5 kg TN/person/day) REU1 = fractional removal of TN in a 1st exsitu treatment unit (e.g., septic tank) REU2 = fractional removal of TN in a 2nd exsitu treatment unit (e.g., sand filter) RZ1 = fractional removal of TN in Zone 1, Soil-Based Treatment RZ2 = fractional removal of TN in Zone 2, Deep Vadose Zone RZ3 = fractional removal of TN in Zone 3, Groundwater Zone RZ4 = fractional removal of TN in Zone 4, Transitional Zones ST = system type/characteristics 1, 2, 3 DUi = dwelling units with system type i
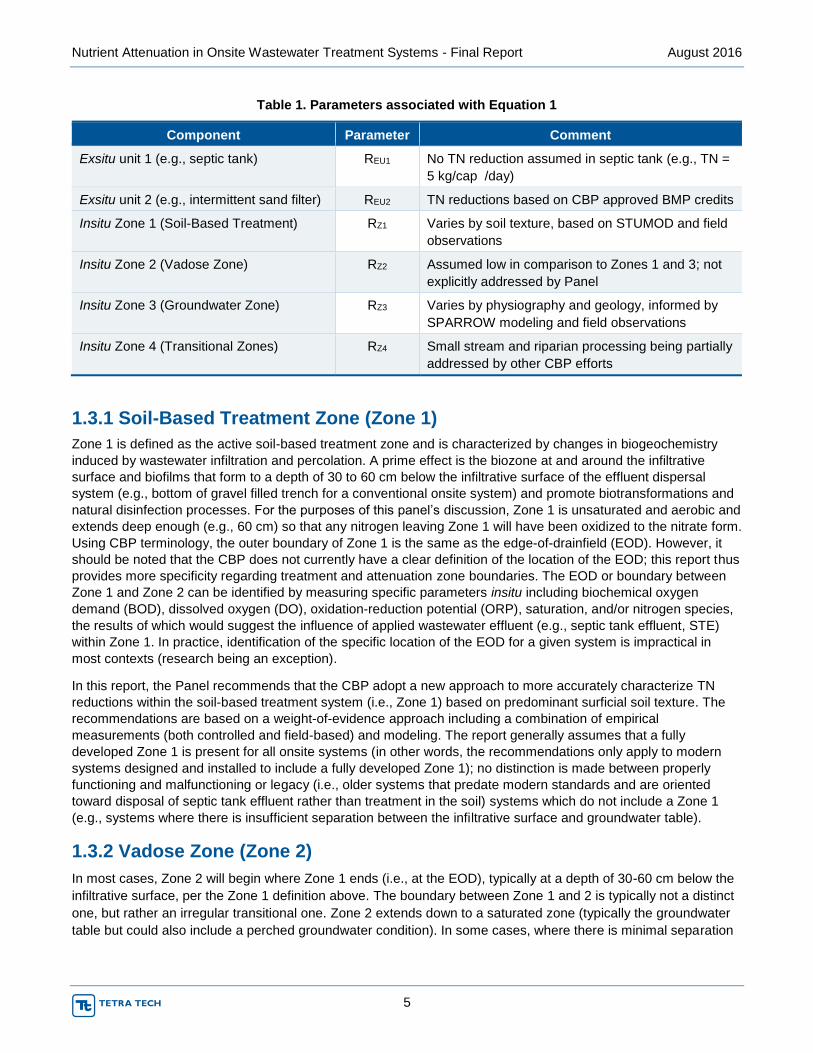
The nitrogen reduction parameters referenced in Equation 1 and Figure 3 are further summarized in
Table 1, along with a brief summary of the Panel’s source of information or approach used to characterize the
parameter (in the “Comments” column).
For the purposes of this report, nutrient reduction occurring in the soil-based treatment system (Zone 1) will be
referred to as “treatment” and reductions occurring below the soil-based treatment zone (Zones 2-4) will be called
“attenuation”, consistent with the CBP’s current terminology. Attenuation in this context refers to a set of soil and
groundwater processes (e.g., biological and chemical reactions) that reduce the mass of TN in water as it moves
from a depth below a soil-based treatment operation and recharges groundwater and moves away from the
recharge location. Brief descriptions of the treatment and attenuation zones, as defined by the Panel, are
provided in the subsections below.
Nutrient Attenuation in Onsite Wastewater Treatment Systems - Final Report August 2016
5
Table 1. Parameters associated with Equation 1
Component Parameter Comment
Exsitu unit 1 (e.g., septic tank) REU1 No TN reduction assumed in septic tank (e.g., TN =
5 kg/cap /day)
Exsitu unit 2 (e.g., intermittent sand filter) REU2 TN reductions based on CBP approved BMP credits
Insitu Zone 1 (Soil-Based Treatment) RZ1 Varies by soil texture, based on STUMOD and field
observations
Insitu Zone 2 (Vadose Zone) RZ2 Assumed low in comparison to Zones 1 and 3; not
explicitly addressed by Panel
Insitu Zone 3 (Groundwater Zone) RZ3 Varies by physiography and geology, informed by
SPARROW modeling and field observations
Insitu Zone 4 (Transitional Zones) RZ4 Small stream and riparian processing being partially
addressed by other CBP efforts
1.3.1 Soil-Based Treatment Zone (Zone 1)
Zone 1 is defined as the active soil-based treatment zone and is characterized by changes in biogeochemistry
induced by wastewater infiltration and percolation. A prime effect is the biozone at and around the infiltrative
surface and biofilms that form to a depth of 30 to 60 cm below the infiltrative surface of the effluent dispersal
system (e.g., bottom of gravel filled trench for a conventional onsite system) and promote biotransformations and
natural disinfection processes. For the purposes of this panel’s discussion, Zone 1 is unsaturated and aerobic and
extends deep enough (e.g., 60 cm) so that any nitrogen leaving Zone 1 will have been oxidized to the nitrate form.
Using CBP terminology, the outer boundary of Zone 1 is the same as the edge-of-drainfield (EOD). However, it
should be noted that the CBP does not currently have a clear definition of the location of the EOD; this report thus
provides more specificity regarding treatment and attenuation zone boundaries. The EOD or boundary between
Zone 1 and Zone 2 can be identified by measuring specific parameters insitu including biochemical oxygen
demand (BOD), dissolved oxygen (DO), oxidation-reduction potential (ORP), saturation, and/or nitrogen species,
the results of which would suggest the influence of applied wastewater effluent (e.g., septic tank effluent, STE)
within Zone 1. In practice, identification of the specific location of the EOD for a given system is impractical in
most contexts (research being an exception).
In this report, the Panel recommends that the CBP adopt a new approach to more accurately characterize TN
reductions within the soil-based treatment system (i.e., Zone 1) based on predominant surficial soil texture. The
recommendations are based on a weight-of-evidence approach including a combination of empirical
measurements (both controlled and field-based) and modeling. The report generally assumes that a fully
developed Zone 1 is present for all onsite systems (in other words, the recommendations only apply to modern
systems designed and installed to include a fully developed Zone 1); no distinction is made between properly
functioning and malfunctioning or legacy (i.e., older systems that predate modern standards and are oriented
toward disposal of septic tank effluent rather than treatment in the soil) systems which do not include a Zone 1
(e.g., systems where there is insufficient separation between the infiltrative surface and groundwater table).
1.3.2 Vadose Zone (Zone 2)
In most cases, Zone 2 will begin where Zone 1 ends (i.e., at the EOD), typically at a depth of 30-60 cm below the
infiltrative surface, per the Zone 1 definition above. The boundary between Zone 1 and 2 is typically not a distinct
one, but rather an irregular transitional one. Zone 2 extends down to a saturated zone (typically the groundwater
table but could also include a perched groundwater condition). In some cases, where there is minimal separation
Nutrient Attenuation in Onsite Wastewater Treatment Systems - Final Report August 2016
6
between the infiltrative surface and groundwater, Zone 1 will directly border Zone 3 and a Zone 2 will not be
present.
Zone 2 is characterized as an unsaturated zone beneath the soil-based treatment system where insitu conditions
are relatively unaffected by the addition of effluent. In other words, in contrast to Zone 1, in Zone 2 BOD, DO,
ORP and other biochemical indicators of active treatment would be similar to background conditions at a similar
depth in the subsurface.
The Panel recognized that, in general, TN reductions would be slow in Zone 2 versus other zones, owing to
typically oxic conditions, and low levels of carbon and associated biological activity relative to Zone 1.
Accordingly, the Panel assumed that in most cases Zone 2 TN reduction will be insignificant versus TN reductions
in other zones. Additionally, it was recognized that it would be particularly difficult to represent Zone 2 spatially, as
basic characteristics upon which TN reductions could be estimated, like Zone 2 depth and effluent travel time,
could vary substantially over small areas. The Panel has not provided specific recommendations for
characterizing TN reduction in Zone 2, although future CBP work could include identifying those conditions that
may suggest significant Zone 2 TN reductions and recommending procedures for quantifying expected TN
reductions. Additionally, although TP was not quantitatively addressed by the Panel, it was recognized that TP
could be effectively removed (often near 100% except in areas with coarse sandy soils or where phosphorus
sorption sites in the soils have been exhausted as a result of historical land uses), primarily by sorption and
precipitation, during unsaturated flow through Zone 2.
1.3.3 Groundwater Zone (Zone 3)
Zone 3 coincides with the natural or mounded groundwater table beneath the soil-based treatment system.
Conceptually, it is assumed that the wastewater effluent that infiltrates into the soil percolates downward under
gravity (although lateral flow underneath soil-based treatment systems is also common depending on site
conditions) through Zones 1 and 2 (if present) and enters Zone 3. Within Zone 3, flow is mostly horizontal toward
an outlet (e.g., stream). Accordingly, Zone 3 reductions are often expressed as a function of the product of a TN
decay rate and travel time. The decay rate is a function of conditions in the groundwater, in particular oxygen-
reduction-potential and organic carbon content, while the travel time is a function of site-specific conditions and
groundwater hydrology (specifically distance, water table slope, and transmissivity).
In this report, the Panel recommends an approach to predict TN reduction in Zone 3 in the context of watershed
scale settings as a function of physiographic region and geological conditions. The approach identifies regions in
which the current modeling approach are likely to either over- or underestimate the contribution by onsite systems
and recommends specific TN attenuation factors for different hydrogeomorphic regions.
1.3.4 Transitional Zone (Zone 4)
Zone 4 includes any of several transitional areas between saturated (groundwater) flow and the modeled stream
reach. This can include floodplain and riparian areas, the hyporheic zone within the streambed, and nutrient
processing in small streams (upstream of the modeled stream reach).
The Panel acknowledges, as confirmed by their literature review, that Zone 4 TN reductions can be substantial
(e.g., 50 percent or more). However, the Panel also understands that certain Zone 4 TN reductions are otherwise
being addressed by the CBP, so no specific recommendations are provided herein, although this could be the
focus of future Panel work if needed to supplement the ongoing CBP efforts in Zone 4. Specifically, the Panel
understands that Greg Noe with United States Geological Survey (USGS) is looking at nutrient losses in
floodplains, that the CBP’s Scenario Builder tool will factor in losses through riparian zones and that USGS’
SPARROW model includes small stream to river (including hyporheic zone) processing.
Nutrient Attenuation in Onsite Wastewater Treatment Systems - Final Report August 2016
7
1.4 CHALLENGES AND LIMITATIONS
The Panel acknowledges that there are limitations associated with the findings and recommendations presented
in this final report. Quantifying and predicting individual source and cumulative effects in environmental systems is
inherently difficult due to source variabilities and physical and chemical heterogeneities; this is true for many
contexts including agricultural impacts, contaminated land impacts, etc., as it is for the onsite wastewater sector.
Within the onsite wastewater field, measuring nutrient load delivery from onsite wastewater systems to surface
waters is exceptionally difficult (e.g., compared to point source measurements); therefore, reliable data is limited.
Even more difficult is generalizing nutrient load delivery given the relative paucity of data compared with the large
number of potentially important controlling variables (e.g., geology, soils, slope, hydrology, vegetation, installation
depth, effluent characteristics).
Accordingly, the Panel has taken the approach of making incremental - small, but significant - progress in
improving the representation of onsite systems in the Phase 6.0 and future CBP water quality models. The Panel
believes that the recommendations provided in this report are well supported by the available science, particularly
considering their application to informing revised average, baseline conditions represented in the model.
Nevertheless, much additional work could be done to both refine and expand the Panel’s findings and
recommendations in the future.
Most importantly, readers of this report should be aware of the limitations of its findings and recommendations
and use them accordingly. General limitations include those listed below (more specific caveats are provided
within the discussion in subsequent sections, as appropriate).
The onsite system input data currently used by the CPB includes a combination of systems for which little
characterization data exist (note that the accuracy of this input data was not confirmed by the Panel). The
population of onsite systems therefore includes systems implemented in accordance with modern
standards as well as legacy systems. The nutrient reduction performance of modern versus legacy
systems may differ significantly. The Panel and CBP have not explicitly discriminated between modern
and legacy systems in this report. The Panel’s approach presumes that a functioning Zone 1 is present,
which applies best to systems implemented in accordance with modern standards. However, the
reviewed literature also includes examples of older existing systems for which this is not the case (e.g.,
Reay, 2004).
In addition to legacy systems, the Panel has given no specific consideration to otherwise non-compliant
or malfunctioning systems (i.e., Panel recommendations generally assume that systems are performing
as designed). Addressing legacy systems or malfunctioning systems could be considered as a future
BMP to achieve additional nutrient reductions. However, just as it is important to recognize that the
findings and recommendations in this report may not apply to legacy or malfunctioning systems, readers
should be careful not to assume that such systems deliver large nutrient loads to surface waters without
appropriate supporting information. The characteristics of malfunctioning systems (e.g., type of
malfunction, duration of malfunction, topography) and specific installation context for legacy systems is
extremely important for estimating the associated nutrient load delivery profile (which could vary from 100
percent TN reduction to 100 percent TN delivery) and it is virtually impossible to generalize on this issue.
Numerous factors can have an impact on nutrient reductions associated with onsite systems. The Panel
and CBP cannot define with confidence the full suite of factors that affect nutrient reductions, nor
determine how those factors vary from system to system and site to site. Accordingly, the findings and
recommendations should generally be taken to represent “average” systems within the specified context
(i.e., surficial soil texture for Zone 1, physiographic region for Zone 3), but care should be taken when
using the findings to draw inferences about specific individual systems. There is variability in how CBP
jurisdictions define “conventional systems” (the Panel’s baseline) and their implementation standards.
The Panel’s findings and recommendations assume that such definitions will continue to be relevant and
Nutrient Attenuation in Onsite Wastewater Treatment Systems - Final Report August 2016
8
that modern conventional systems being installed within Chesapeake Bay watershed jurisdictions will
generally function in accordance with the Panel’s mechanistic model.
The Panel and CBP have not addressed the time distribution of load delivery as a function of storm
events - a high proportion of the net load could come during a few storm events that create saturated soil
conditions, stormwater runoff, or high groundwater flows and mounding. This potential time distribution
could be a factor in the development of a future BMP addressing legacy systems or malfunctioning
systems, as suggested above. The Panel’s conceptual model for functioning, conventional systems
predicts that onsite systems nutrient load contributions will be relatively more important during baseflow
conditions that are dominated by groundwater flow, and less important when surface runoff carries
nitrogen load from other sources with it. The Panel had only limited opportunity to receive feedback from
results of applying its recommendations in a multi-year averaged modeling environment. Assessment and
modeling efforts that distinguish between hydrologic conditions could improve the identification of
subwatersheds in which the relative TN contribution from onsite wastewater treatment systems (OWTS) is
relatively large.
Nutrient Attenuation in Onsite Wastewater Treatment Systems - Final Report August 2016
9
2.0 METHODS
2.1 WEIGHT OF EVIDENCE APPROACH
The Panel membership included and was informed by leading researchers and practitioners focused on nutrient
processing in onsite wastewater systems and attenuation between the systems and receiving waters. The Panel
membership and contributors included soil scientists, engineers, geologists, hydrologists, modelers and other
environmental scientists. The group brought an extensive amount of knowledge, including experience with both
the literature and tools available to estimate nutrient load delivery associated with onsite systems. The Panel
recognized the limitations in the state-of-knowledge and the need to consider multiple sources of information and
lines of evidence in support of their findings and recommendations. The Panel also recognized that these
recommendations were intended to apply mainly to the representation of baseline conditions in the CBP water
quality model; therefore, the assessment focused on characterizing average conditions (while identifying
performance ranges, where applicable).
The Panel’s work included three main steps:
1. Developing the conceptual framework for evaluating and communicating nutrient removal in onsite
systems (introduced in Section 1.3).
2. Literature review. Specific literature findings are described in the corresponding Zone 1 and 3 write-ups in
Section 3.
3. Modeling, which was used to corroborate findings from the literature. The main models used are
generically described in the subsections below and modeling details are provided in the corresponding
Zone 1 and 3 write-ups in Section 3.
2.2 MATHEMATICAL MODELING
There are a variety of mathematical models available, but the Panel chose to use STUMOD and SPARROW
given their unique relevance to this effort. Specifically, STUMOD is a site-scale mechanistic fate and transport
model for estimating soil-based treatment system (i.e., Zone 1) performance. SPARROW is a watershed-scale
regression model (which does not explicitly consider fate and transport processes), calibrated to the Chesapeake
Bay water quality monitoring network. Although SPARROW was used to inform both the Zone 1 and Zone 3 TN
reduction estimates, the application of the two models was in most respects complementary.
2.2.1 STUMOD
STUMOD (Soil Treatment Unit Model), developed by the Colorado School of Mines, is a spreadsheet model that
uses analytical solutions to simulate the steady state distribution of water content, ammonium concentration, and
nitrate concentration in the unsaturated zone beneath an OWTS (Geza et al., 2013). It is a one-dimensional
model of the treatment zone with the model space extending in the vertical direction from the infiltrative surface of
the OWTS (trench bottom for a conventional system) to some depth below the infiltrative surface. The bottom
boundary condition can be a water table at a specific depth or a deep water table that has no effect on water
contents in the model space. STUMOD uses the Rosetta database (Schaap and Leij, 1998) which has average
soil hydraulic properties for the 12 USDA soil textural classes.
STUMOD calculates nitrogen species concentrations and the fraction of TN reaching a specified soil depth. Input
data include parameters for hydraulics and nutrient transport and transformation. An analytical solution is used to
calculate the profile of pressure based on Darcy’s equation and the relationships between suction head,
unsaturated hydraulic conductivity, and soil moisture. Chemical transport is based on simplification of the
advection–dispersion equation.
Nutrient Attenuation in Onsite Wastewater Treatment Systems - Final Report August 2016
10
STUMOD estimates treatment performance with depth based on user-specified input, but enables the user
flexibility for input of soil hydraulic parameters, loading rate, water table depth, and soil treatment parameters.
STUMOD is relatively sophisticated with respect to the soil hydraulic and treatment processes, and can be
calibrated to site-specific data. STUMOD incorporates the same nitrification/denitrification equations used in the
HYDRUS model, which are built into a spreadsheet, thus allowing users with no previous modeling knowledge to
evaluate likely soil treatment unit performance (McCray et al., 2010).
The spreadsheet implementation requires simplification of OWTS operating conditions (e.g., constant loading
rate, one-dimensional infiltration and treatment, etc.) and input parameters which include operational parameters
(effluent concentrations, loading rates) and parameters for nutrient transformation (sorption, first order nitrification
and denitrification rates). STUMOD is relatively simple to use but accounts for important processes such as
ammonium sorption, nitrification, and denitrification. Instead of explicitly tracking oxygen and redox conditions,
STUMOD accounts for the effect of soil moisture content (a surrogate for redox conditions) on nitrification and
denitrification reactions. The model has provisions to handle the influence of temperature and organic carbon
content on nitrogen transformation.
STUMOD, informed by the results of field studies, was used to help develop estimates and associated
recommendations for soil-based treatment of TN in Zone 1, and is described in more detail in Section 3.1.
2.2.2 SPARROW
SPARROW (Spatially Referenced Regression on Watershed Attributes) is a modeling tool developed by the
USGS for the regional interpretation of water-quality monitoring data (USGS, 2016). The model relates in-stream
water-quality measurements to spatially referenced characteristics of watersheds, including contaminant sources
and factors influencing terrestrial and aquatic transport. SPARROW empirically estimates the origin and fate of
contaminants in river networks and quantifies uncertainties in model predictions.
SPARROW has been used to provide empirical estimates of the sources, fate, and transport of total nitrogen (TN)
and total phosphorus (TP) in the Chesapeake Bay watershed, and the mean annual TN and TP flux to the Bay
and in each of 80,579 nontidal tributary stream reaches (Ator et al., 2011). Effective and efficient nutrient
management at the regional scale in support of Chesapeake Bay restoration requires a comprehensive
understanding of the sources, fate, and transport of nitrogen and phosphorus in the watershed, which is only
available through regional models. The current models, Chesapeake Bay nutrient SPARROW models, version 4
(CBTN_v4 and CBTP_v4), were constructed at a finer spatial resolution than previous SPARROW models for the
Chesapeake Bay watershed (versions 1, 2, and 3), and include an updated timeframe and modified sources and
other explanatory terms.
USGS supported the Panel by developing and interpreting multiple SPARROW model runs to inform proposed
Panel findings and recommendations and gain insights into significant spatial variables that could be the focus of
future CBP or Panel efforts. Specific procedures and results are presented in Section 3.3.
2.3 PHYSIOGRAPHY
Nutrient attenuation (in Zone 3 in particular) was evaluated to account for Chesapeake Bay physiographic
characteristics and associated hydrogeomorphology (Figure 4). The movement of effluent from onsite systems to
surface waters typically includes transport (and, potentially, associated nitrogen attenuation) within the
groundwater flow which is often strongly related to underlying geological characteristics. Although soils and
subsurface characteristics may vary within a physiographic region and even within a given site, such a macro-
scale physiographic assessment is appropriate for characterizing average, baseline nutrient transport in a
watershed context.
Physiographic provinces in the Chesapeake Bay Watershed have been delineated and characterized based on
data derived from USGS and modified by the CBP GIS Team and include five physiographic regions categorized
Nutrient Attenuation in Onsite Wastewater Treatment Systems - Final Report August 2016
11
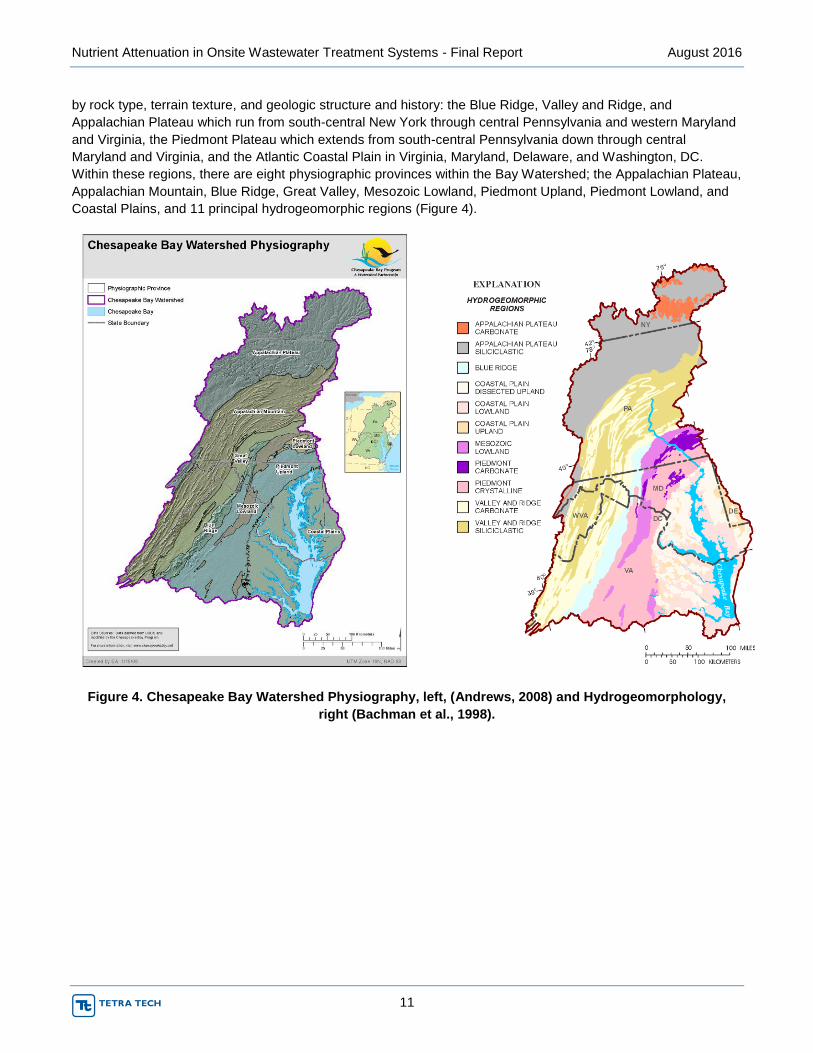
by rock type, terrain texture, and geologic structure and history: the Blue Ridge, Valley and Ridge, and
Appalachian Plateau which run from south-central New York through central Pennsylvania and western Maryland
and Virginia, the Piedmont Plateau which extends from south-central Pennsylvania down through central
Maryland and Virginia, and the Atlantic Coastal Plain in Virginia, Maryland, Delaware, and Washington, DC.
Within these regions, there are eight physiographic provinces within the Bay Watershed; the Appalachian Plateau,
Appalachian Mountain, Blue Ridge, Great Valley, Mesozoic Lowland, Piedmont Upland, Piedmont Lowland, and
Coastal Plains, and 11 principal hydrogeomorphic regions (Figure 4).
Figure 4. Chesapeake Bay Watershed Physiography, left, (Andrews, 2008) and Hydrogeomorphology,
right (Bachman et al., 1998).
Nutrient Attenuation in Onsite Wastewater Treatment Systems - Final Report August 2016
12
3.0 RESULTS AND DISCUSSION
Detailed discussions of the Panel’s work to estimate TN reduction in Zones 1 and 3 are provided in the two
sections that follow (Sections 3.1 and 3.2). A third section (Section 3.3) is included to report the results of
SPARROW testing used to supplement the focused Zone 1 and 3 efforts. These sections largely stand on their
own, and an overall summary of recommended spatially-variable TN reductions and loads is provided in Section
4.
3.1 SOIL-BASED TREATMENT ZONE (ZONE 1)
3.1.1 Introduction
In an effort to identify empirical data on TN reduction within the soil treatment zone, the Panel reviewed the
literature study by McCray et al. (2008), which includes data about nitrogen reduction in soils. This study includes
a review of over 120 sources and 25 publications containing information on 84 experiments were found suitable
for data analysis. Not all of the sources identified the soil textural class, but of those that did, most of the studies
were done on sandy soils (47 experiments in sands, 4 in loamy sands, and 12 in sandy loams). The data showed
a clear reduction in TN concentration with depth but there was a lot of scatter in the data (203 data points).
Models have been used to interpret data from field experiments and run scenarios for which field experiments do
not exist. Bradshaw et al. (2013) calibrated a two-dimensional HYDRUS model (Šimůnek et al., 2011) using soil
pressure head data and TN and chloride (Cl) data measured in a field experiment described in a separate paper
on the same study (Bradshaw and Radcliffe, 2013). The HYDRUS model is a finite element numerical model that
simulates transient water, solute, and heat flow in the unsaturated zone. Measurements were made in the soil-
based treatment system of a conventional OWTS installed in a clay soil in the Piedmont region of Georgia. The
hydraulic loading rate, 2.4 cm/day, was higher than the recommended rate for a clay soil. A TN chain model was
developed with water content dependent first-order transformation rates for nitrification and denitrification. The
overall predicted soil pressure heads and solute concentrations were similar to data collected from the field
experiment. The model predicted 52 percent TN removal in the system (between the septic tank and the deepest
soil depth which was 90 cm below the trench bottom and 162 cm below the soil surface). Nearly all of the removal
was from denitrification; plant uptake and change in TN storage accounted for 5 percent or less of the nitrogen
loss.
Radcliffe and Bradshaw (2013) used the HYDRUS model developed in the Piedmont clay experiment described
above to estimate TN treatment for all 12 United States Department of Agriculture (USDA) soil textural classes
using two years of weather data from the field experiment. The hydraulic loading rates varied from 4 cm/day for
the Group-I (sandy) soils to 1 cm/day for the Group-IV (clayey) soils. It was assumed that the STE TN was all in
the form of NH4+ at a concentration of 47.4 mg/L. TN treatment varied widely among soils with denitrification
losses ranging from 1 percent in the Group-I sand class to 75 percent in the Group-IV sandy clay class. Leaching
losses were inversely related to denitrification losses, ranging from 97 percent in the sand class to 27 percent in
the sandy clay class. Plant uptake and soil storage accounted for 5 percent or less of the TN losses.
3.1.2 Procedure
The Panel’s objective was to develop Zone 1 TN reduction factors for a conventional system for different soil
textural classes (it is intended that the Onsite Wastewater BMP Panel will recommend TN reduction factors for
systems using advanced nitrogen pretreatment as a BMP).
STUMOD was used to calculate the TN reduction factors based on values for model input parameters that were
relevant to the CBP (Geza et al., 2013). The Panel assumed that STUMOD would accurately predict the
differences between soil textural classes, but not necessarily the absolute values for soil TN reductions. However,
Nutrient Attenuation in Onsite Wastewater Treatment Systems - Final Report August 2016
13
with consideration of factors such as loading rate and water table depth, and comparison with relevant empirical
data, the Panel was able to estimate Zone 1 TN reduction rates with confidence. The simulations applied to a
conventional system comprised of a set of aggregate-filled trenches that was installed at a suitable site. STUMOD
runs for the conventional systems used input concentrations at the infiltrative surface of 60 mg/L NH4+ and 0 mg/L
NO3-, which are representative of STE generated at houses and residential sources and consistent with current
CBP assumptions.
STUMOD assumes that there are two sources of carbon (C): C from the STE and naturally occurring soil C. The
user specifies the C content in the STE in terms of the BOD5 concentration (Co STE). The default value is 200
mg/L. STUMOD assumes a ratio of BOD5:STE C ratio of 8:1 so the default value of 200 mg/L BOD5 is converted
internally to a STE C concentration of 25 mg/L. Exponential decay functions are used to distribute the C with
depth below the infiltrative surface for both STE and soil C. Exponents, α0 for the natural soil C and α1 and α2 for
the STE C, control the rate of decay. The default values are α0 = 5 (fast decay) and α1 and α2 =0.1 (slow decay).
The default values are based on the expected behavior of carbon in the soil and field observations on degradation
of carbon in the unsaturated zone with depth.
STUMOD can be run with or without plant uptake of TN and water. The Panel used the model without plant
uptake based on the view of Valiela et al. (1997 and 2000) that only denitrification represents a loss to the system
(however, it is recognized that systems can be designed to optimize vegetative uptake and nutrient harvesting,
perhaps as a system BMP). STUMOD assumes that C is distributed below the infiltrative surface using an
exponential depth decay function. The model requires an estimate of the average soil temperature. Since the
Chesapeake Bay watershed lies in both the mesic and thermic soil temperature regions, 15°C was used as an
average of the mesic (11.5°C) and thermic (18.5°C) regions according to the NRCS map of soil temperatures for
the U.S. (NRCS, 2015). Version v2 of STUMOD (Geza 2010) was used.
The hydraulic loading rate (HLR) must be specified in STUMOD. HLRs suggested by Lindbo et al. (2007) who
combined soil textural classes into 4 groups were used for the STUMOD runs. One set of runs were conducted
assuming 100 percent of the design HLR. In another set of runs, the HLR was lowered to 50 percent of the design
rate to simulate loading rate conditions that normally occur due to typical occupancy and water use
characteristics. Two different depths for the water table were tested: 60 cm below the infiltrative surface to
simulate conditions for most states that require a 2-foot separation between the infiltrative surface and the
seasonal high water table, and 30 cm below the infiltrative surface for states that allow a 1-foot separation. The 1-
foot separation runs might also be viewed as representing legacy systems in states that currently require a 2-foot
separation. The Zone 1 treatment zone extended 60 cm below the infiltrative surface with the water table at 60 cm
and the treatment zone was 30 cm with the water table at 30 cm. The default values for the C function were used
in these runs.
3.1.3 Results
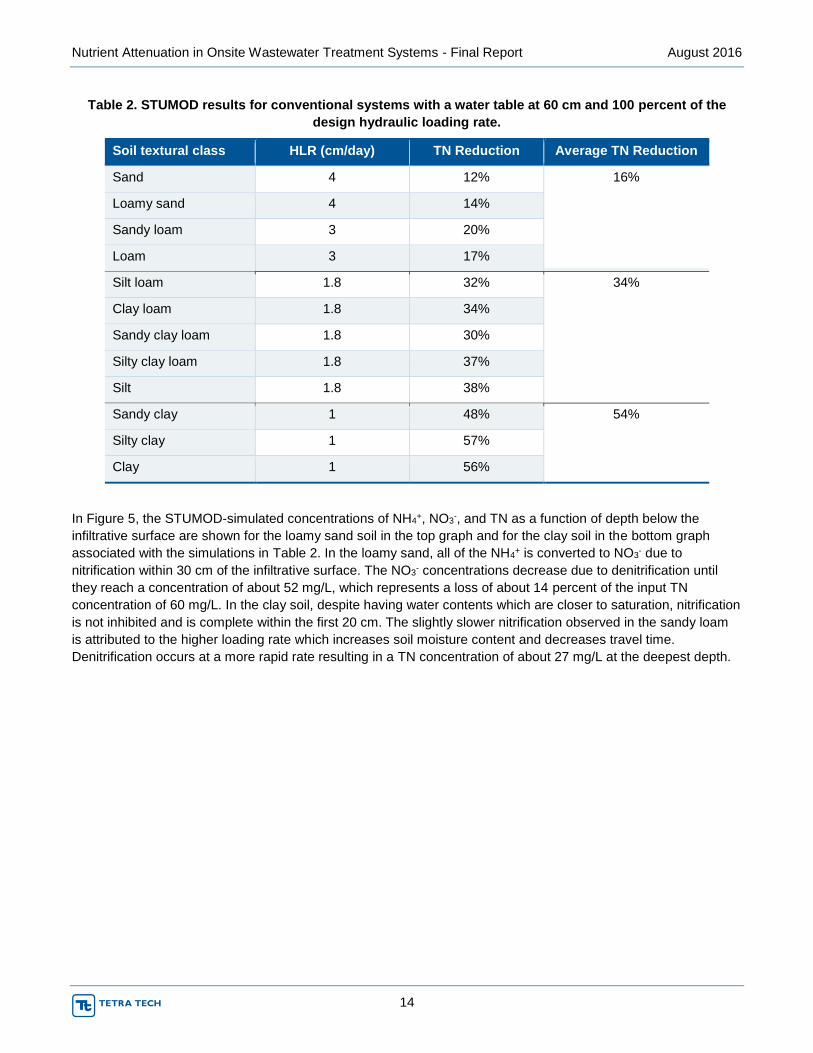
The TN reduction factors for a conventional system with a water table at 60 cm using a hydraulic loading rate 100
percent of the design rate are shown in Table 2. The soils are listed in the order of increasing clay content (i.e.,
from coarse to fine textures). The TN reduction rates ranged from 12 percent in the sand textural class to 57
percent in the silty clay textural class. The results were sensitive to temperature (using a higher average soil
temperature increased the TN reduction factors). The soils were categorized into three groups with average TN
reduction factors of 16 percent for sand, loamy sand, sandy loam, and loam soils (“sandy” texture); 34 percent for
silt loam, clay loam, sandy clay loam, silty clay loam, and silt soils (“loamy” texture); and 54 percent for sandy
clay, silty clay, and clay soils (“clayey” texture). The values for sandy soils are lower than the estimates of 35 to
46 percent developed by Valiela et al. (1997 and 2000) for a sandy Coastal Plain region soil based on a literature
review. They are in agreement with the study by Bradshaw et al. (2013) which estimated an TN reduction factor of
52 percent for a clayey Piedmont region soil that received a high hydraulic loading rate (2.4 cm/day); the
recommended rate in Georgia for a clay is 2 cm/day (Radcliffe and West, 2009).
Nutrient Attenuation in Onsite Wastewater Treatment Systems - Final Report August 2016
14
Table 2. STUMOD results for conventional systems with a water table at 60 cm and 100 percent of the
design hydraulic loading rate.
Soil textural class HLR (cm/day) TN Reduction Average TN Reduction
Sand 4 12% 16%
Loamy sand 4 14%
Sandy loam 3 20%
Loam 3 17%
Silt loam 1.8 32% 34%
Clay loam 1.8 34%
Sandy clay loam 1.8 30%
Silty clay loam 1.8 37%
Silt 1.8 38%
Sandy clay 1 48% 54%
Silty clay 1 57%
Clay 1 56%
In Figure 5, the STUMOD-simulated concentrations of NH4+, NO3
-, and TN as a function of depth below the
infiltrative surface are shown for the loamy sand soil in the top graph and for the clay soil in the bottom graph
associated with the simulations in Table 2. In the loamy sand, all of the NH4+ is converted to NO3
- due to
nitrification within 30 cm of the infiltrative surface. The NO3- concentrations decrease due to denitrification until
they reach a concentration of about 52 mg/L, which represents a loss of about 14 percent of the input TN
concentration of 60 mg/L. In the clay soil, despite having water contents which are closer to saturation, nitrification
is not inhibited and is complete within the first 20 cm. The slightly slower nitrification observed in the sandy loam
is attributed to the higher loading rate which increases soil moisture content and decreases travel time.
Denitrification occurs at a more rapid rate resulting in a TN concentration of about 27 mg/L at the deepest depth.
Nutrient Attenuation in Onsite Wastewater Treatment Systems - Final Report August 2016
15
Figure 5. Concentrations from STUMOD of NH4+, NO3
-, and TN as a function of depth below the infiltrative
surface for a loamy sand soil (top graph) and a clay (bottom graph) for conventional systems with a water
table at 60 cm and 100 percent of the design hydraulic loading rate (see Table 2).
Table 3, TN reduction factors are shown for simulations using 50 percent of the design HLR with the water table
kept at a depth of 60 cm as in
Table 2. Reducing the HLR increases the TN reduction factors. This is due to the longer travel times which more
than compensates for dryer soil conditions that inhibit denitrification. These values for sandy soils are in better
agreement with the estimates from Valiela et al. (1997 and 2000) for a Coastal Plain region sandy soil (35
percent), than those resulting from modeling 100 percent of the design hydraulic loading rate.
Nutrient Attenuation in Onsite Wastewater Treatment Systems - Final Report August 2016
16
Table 3. STUMOD results for conventional systems with a water table at 60 cm and 50 percent of the
design hydraulic loading rate.
Soil textural class HLR (cm/day) TN Reduction Average TN Reduction
Sand 2 23% 31%
Loamy sand 2 27%
Sandy loam 1.5 37%
Loam 1.5 37%
Silt loam 0.9 59% 59%
Clay loam 0.9 58%
Sandy clay loam 0.9 52%
Silty clay loam 0.9 63%
Silt 0.9 64%
Sandy clay 0.5 75% 80%
Silty clay 0.5 83%
Clay 0.5 81%
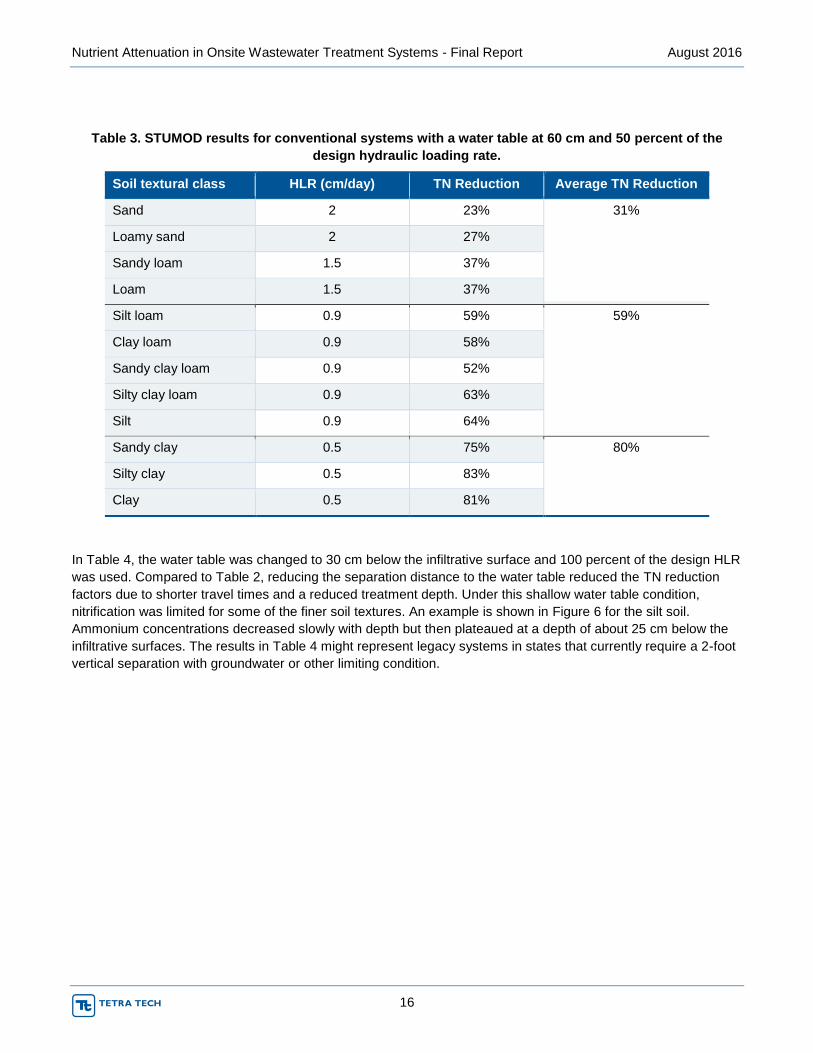
In Table 4, the water table was changed to 30 cm below the infiltrative surface and 100 percent of the design HLR
was used. Compared to Table 2, reducing the separation distance to the water table reduced the TN reduction
factors due to shorter travel times and a reduced treatment depth. Under this shallow water table condition,
nitrification was limited for some of the finer soil textures. An example is shown in Figure 6 for the silt soil.
Ammonium concentrations decreased slowly with depth but then plateaued at a depth of about 25 cm below the
infiltrative surfaces. The results in Table 4 might represent legacy systems in states that currently require a 2-foot
vertical separation with groundwater or other limiting condition.
Nutrient Attenuation in Onsite Wastewater Treatment Systems - Final Report August 2016
17
Table 4. STUMOD results for conventional systems with a water table at 30 cm and 100 percent of the
design hydraulic loading rate.
Soil textural class HLR (cm/day) TN Reduction Average TN Reduction
Sand 4 6% 7%
Loamy sand 4 7%
Sandy loam 3 9%
Loam 3 4%
Silt loam 1.8 7% 11%
Clay loam 1.8 14%
Sandy clay loam 1.8 13%
Silty clay loam 1.8 11%
Silt 1.8 12%
Sandy clay 1 24% 29%
Silty clay 1 32%
Clay 1 30%
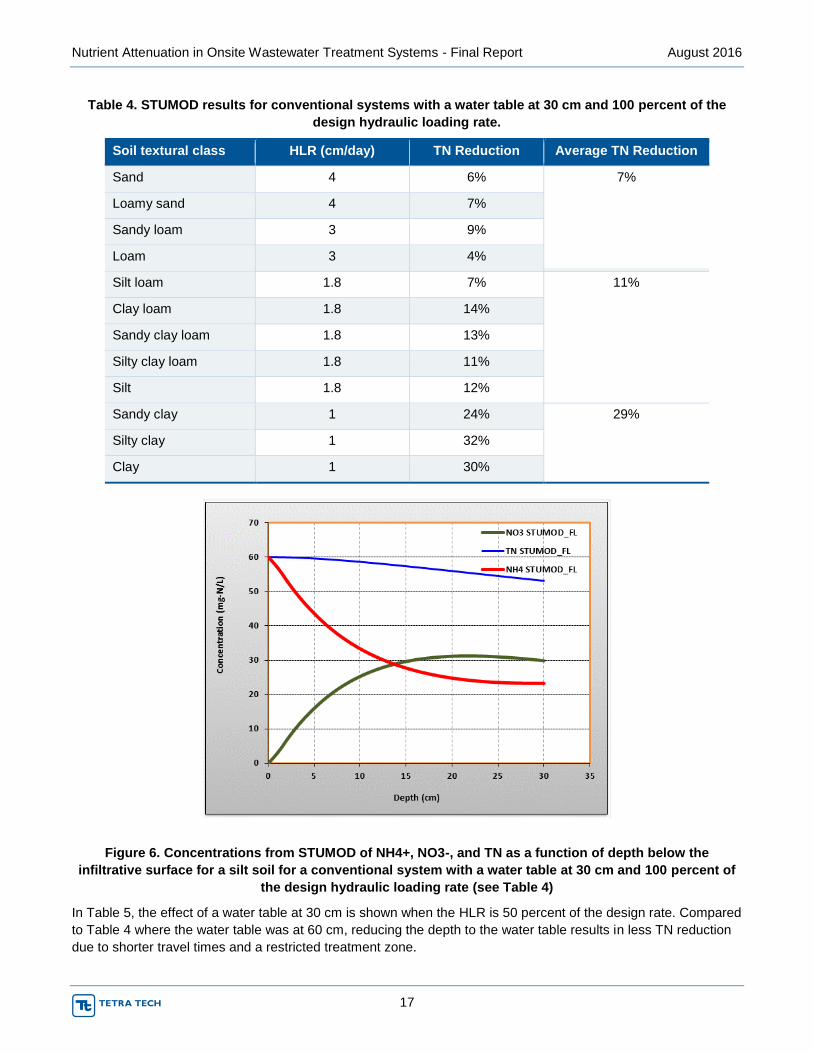
Figure 6. Concentrations from STUMOD of NH4+, NO3-, and TN as a function of depth below the
infiltrative surface for a silt soil for a conventional system with a water table at 30 cm and 100 percent of
the design hydraulic loading rate (see Table 4)
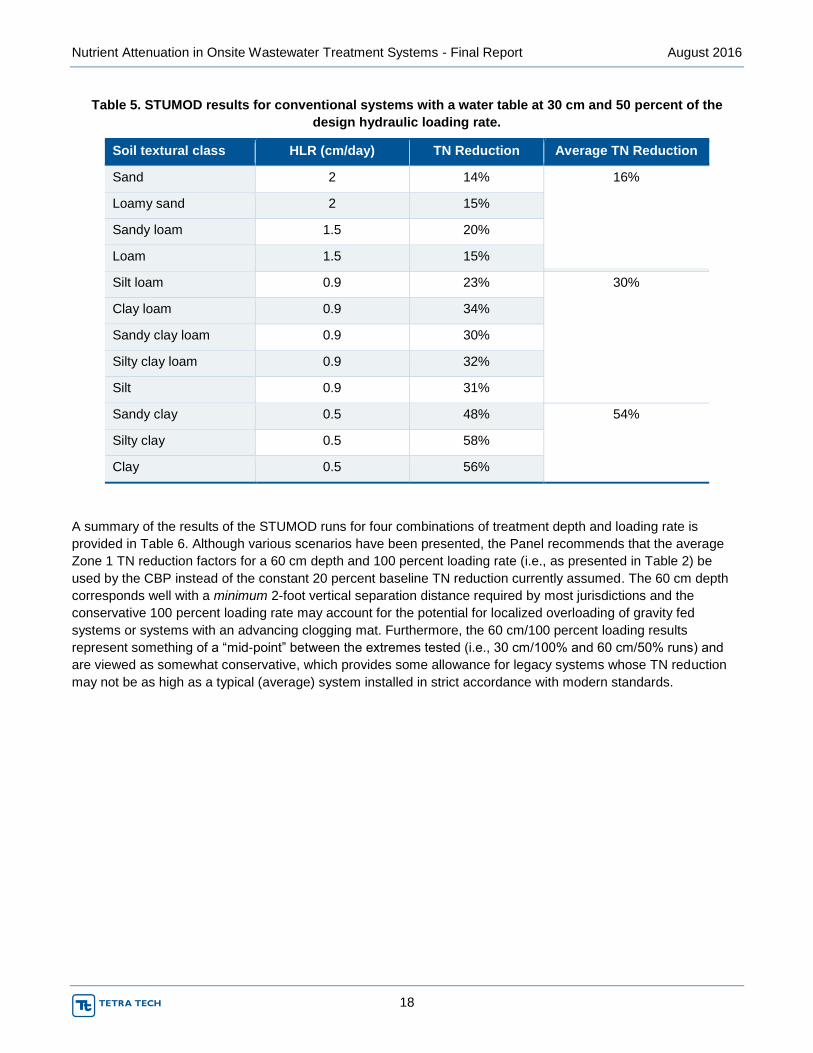
In Table 5, the effect of a water table at 30 cm is shown when the HLR is 50 percent of the design rate. Compared
to Table 4 where the water table was at 60 cm, reducing the depth to the water table results in less TN reduction
due to shorter travel times and a restricted treatment zone.
Nutrient Attenuation in Onsite Wastewater Treatment Systems - Final Report August 2016
18
Table 5. STUMOD results for conventional systems with a water table at 30 cm and 50 percent of the
design hydraulic loading rate.
Soil textural class HLR (cm/day) TN Reduction Average TN Reduction
Sand 2 14% 16%
Loamy sand 2 15%
Sandy loam 1.5 20%
Loam 1.5 15%
Silt loam 0.9 23% 30%
Clay loam 0.9 34%
Sandy clay loam 0.9 30%
Silty clay loam 0.9 32%
Silt 0.9 31%
Sandy clay 0.5 48% 54%
Silty clay 0.5 58%
Clay 0.5 56%
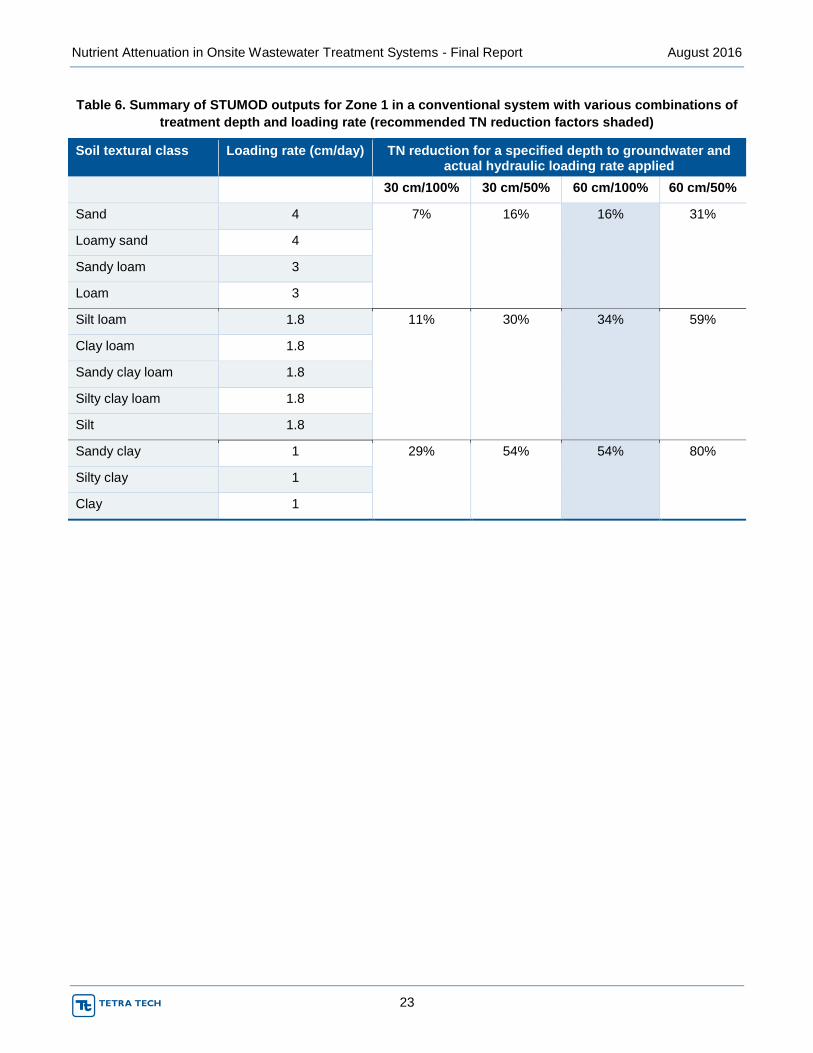
A summary of the results of the STUMOD runs for four combinations of treatment depth and loading rate is
provided in Table 6. Although various scenarios have been presented, the Panel recommends that the average
Zone 1 TN reduction factors for a 60 cm depth and 100 percent loading rate (i.e., as presented in Table 2) be
used by the CBP instead of the constant 20 percent baseline TN reduction currently assumed. The 60 cm depth
corresponds well with a minimum 2-foot vertical separation distance required by most jurisdictions and the
conservative 100 percent loading rate may account for the potential for localized overloading of gravity fed
systems or systems with an advancing clogging mat. Furthermore, the 60 cm/100 percent loading results
represent something of a “mid-point” between the extremes tested (i.e., 30 cm/100% and 60 cm/50% runs) and
are viewed as somewhat conservative, which provides some allowance for legacy systems whose TN reduction
may not be as high as a typical (average) system installed in strict accordance with modern standards.

Nutrient Attenuation in Onsite Wastewater Treatment Systems - Final Report August 2016
19
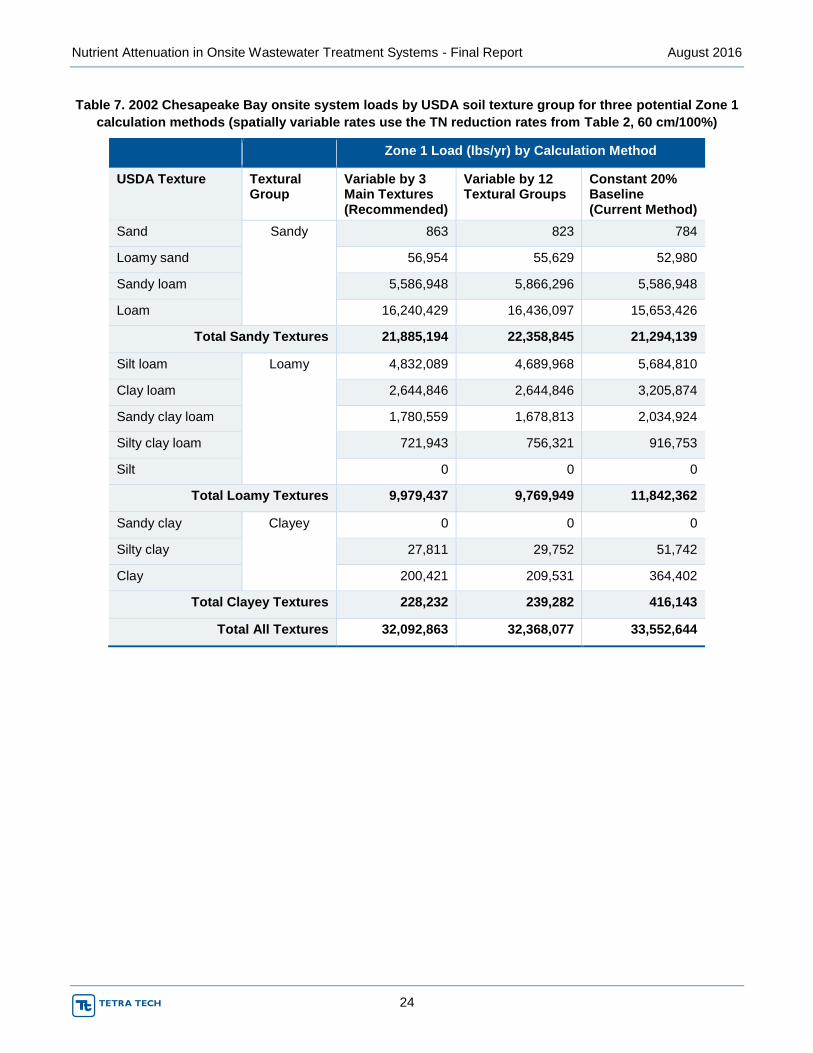
Table 7 and

Nutrient Attenuation in Onsite Wastewater Treatment Systems - Final Report August 2016
20
Table 8 provide comparisons of calculated Zone 1 onsite system TN loads between the recommended spatially
variable method (using 3 main soil texture classes) and the currently-used 20 percent reduction watershed-wide,
for two different time periods (2002 and 1985-2005 annual average). A column is also provided to show how
varying spatially among all 12 USDA soil texture classes would affect the onsite wastewater TN load calculations.
For both the 2002 loads (

Nutrient Attenuation in Onsite Wastewater Treatment Systems - Final Report August 2016
21
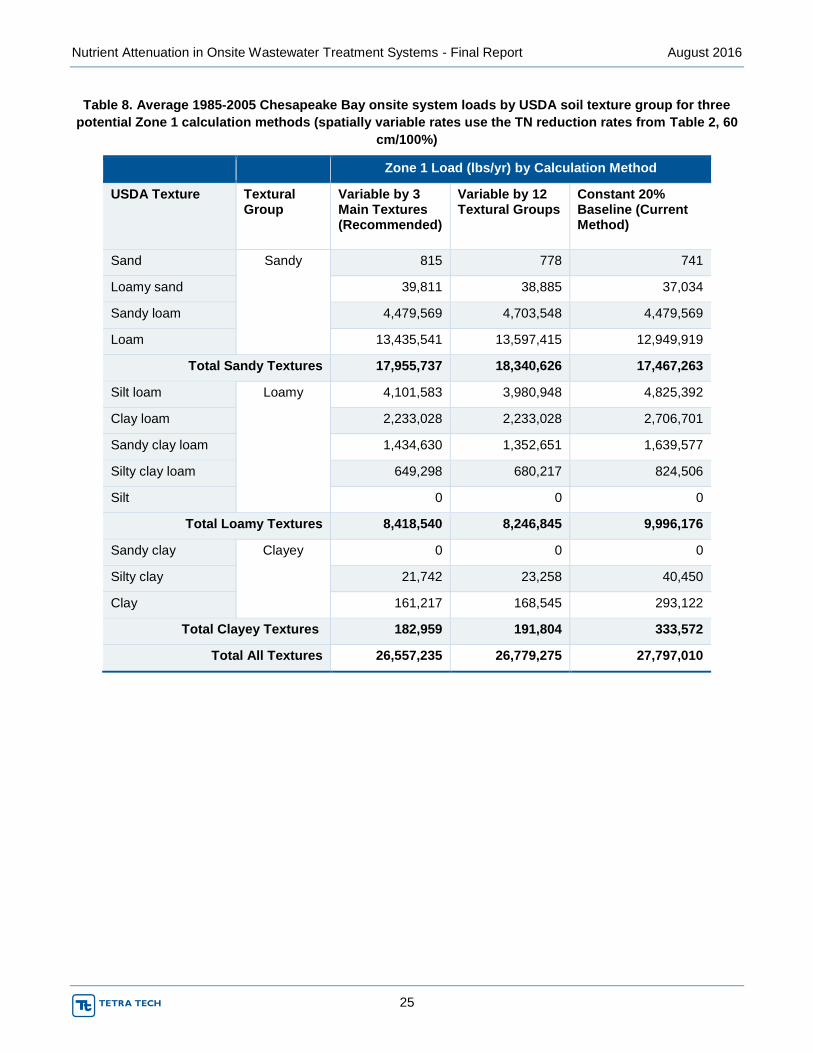
Table 7) and 1985-2005 average annual loads (

Nutrient Attenuation in Onsite Wastewater Treatment Systems - Final Report August 2016
22
Table 8), the recommended change to spatially variable TN reduction rates results in a total onsite sector load
decrease of approximately 4 percent. The load reduction is greater for more finely textured soils (16 percent for
loamy soils and 45 percent for clayey soils) since the difference between the recommended TN reduction factors
and currently-used factor becomes greater. The total load associated with sandy soils increases modestly (~3
percent) under the recommended change.
Nutrient Attenuation in Onsite Wastewater Treatment Systems - Final Report August 2016
23
Table 6. Summary of STUMOD outputs for Zone 1 in a conventional system with various combinations of
treatment depth and loading rate (recommended TN reduction factors shaded)
Soil textural class Loading rate (cm/day) TN reduction for a specified depth to groundwater and actual hydraulic loading rate applied
30 cm/100% 30 cm/50% 60 cm/100% 60 cm/50%
Sand 4 7%
16%
16% 31%
Loamy sand 4
Sandy loam 3
Loam 3
Silt loam 1.8 11%
30%
34% 59%
Clay loam 1.8
Sandy clay loam 1.8
Silty clay loam 1.8
Silt 1.8
Sandy clay 1 29%
54%
54% 80%
Silty clay 1
Clay 1
Nutrient Attenuation in Onsite Wastewater Treatment Systems - Final Report August 2016
24
Table 7. 2002 Chesapeake Bay onsite system loads by USDA soil texture group for three potential Zone 1
calculation methods (spatially variable rates use the TN reduction rates from Table 2, 60 cm/100%)
Zone 1 Load (lbs/yr) by Calculation Method
USDA Texture Textural Group
Variable by 3 Main Textures (Recommended)
Variable by 12 Textural Groups
Constant 20% Baseline (Current Method)
Sand Sandy
863 823 784
Loamy sand 56,954 55,629 52,980
Sandy loam 5,586,948 5,866,296 5,586,948
Loam 16,240,429 16,436,097 15,653,426
Total Sandy Textures 21,885,194 22,358,845 21,294,139
Silt loam Loamy 4,832,089 4,689,968 5,684,810
Clay loam 2,644,846 2,644,846 3,205,874
Sandy clay loam 1,780,559 1,678,813 2,034,924
Silty clay loam 721,943 756,321 916,753
Silt 0 0 0
Total Loamy Textures 9,979,437 9,769,949 11,842,362
Sandy clay Clayey 0 0 0
Silty clay 27,811 29,752 51,742
Clay 200,421 209,531 364,402
Total Clayey Textures 228,232 239,282 416,143
Total All Textures 32,092,863 32,368,077 33,552,644
Nutrient Attenuation in Onsite Wastewater Treatment Systems - Final Report August 2016
25
Table 8. Average 1985-2005 Chesapeake Bay onsite system loads by USDA soil texture group for three
potential Zone 1 calculation methods (spatially variable rates use the TN reduction rates from Table 2, 60
cm/100%)
Zone 1 Load (lbs/yr) by Calculation Method
USDA Texture Textural Group
Variable by 3 Main Textures (Recommended)
Variable by 12 Textural Groups
Constant 20% Baseline (Current Method)
Sand Sandy 815 778 741
Loamy sand 39,811 38,885 37,034
Sandy loam 4,479,569 4,703,548 4,479,569
Loam 13,435,541 13,597,415 12,949,919
Total Sandy Textures 17,955,737 18,340,626 17,467,263
Silt loam Loamy 4,101,583 3,980,948 4,825,392
Clay loam 2,233,028 2,233,028 2,706,701
Sandy clay loam 1,434,630 1,352,651 1,639,577
Silty clay loam 649,298 680,217 824,506
Silt 0 0 0
Total Loamy Textures 8,418,540 8,246,845 9,996,176
Sandy clay Clayey 0 0 0
Silty clay 21,742 23,258 40,450
Clay 161,217 168,545 293,122
Total Clayey Textures 182,959 191,804 333,572
Total All Textures 26,557,235 26,779,275 27,797,010
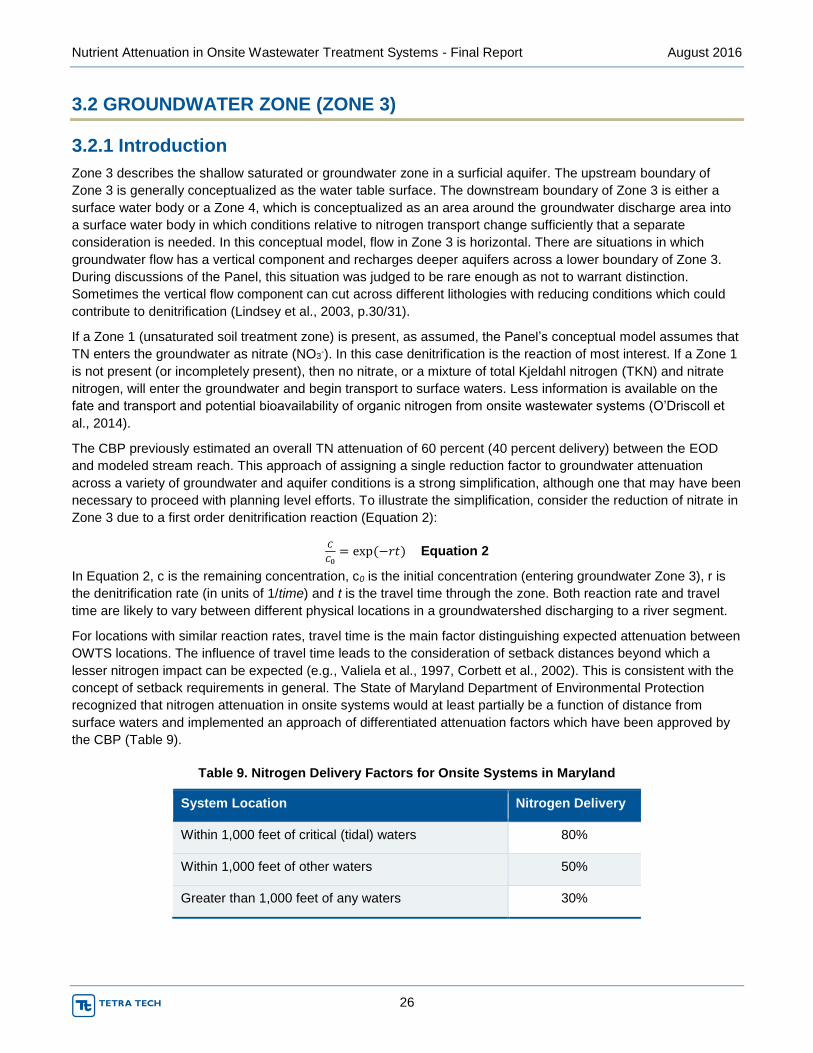
Nutrient Attenuation in Onsite Wastewater Treatment Systems - Final Report August 2016
26
3.2 GROUNDWATER ZONE (ZONE 3)
3.2.1 Introduction
Zone 3 describes the shallow saturated or groundwater zone in a surficial aquifer. The upstream boundary of
Zone 3 is generally conceptualized as the water table surface. The downstream boundary of Zone 3 is either a
surface water body or a Zone 4, which is conceptualized as an area around the groundwater discharge area into
a surface water body in which conditions relative to nitrogen transport change sufficiently that a separate
consideration is needed. In this conceptual model, flow in Zone 3 is horizontal. There are situations in which
groundwater flow has a vertical component and recharges deeper aquifers across a lower boundary of Zone 3.
During discussions of the Panel, this situation was judged to be rare enough as not to warrant distinction.
Sometimes the vertical flow component can cut across different lithologies with reducing conditions which could
contribute to denitrification (Lindsey et al., 2003, p.30/31).
If a Zone 1 (unsaturated soil treatment zone) is present, as assumed, the Panel’s conceptual model assumes that
TN enters the groundwater as nitrate (NO3-). In this case denitrification is the reaction of most interest. If a Zone 1
is not present (or incompletely present), then no nitrate, or a mixture of total Kjeldahl nitrogen (TKN) and nitrate
nitrogen, will enter the groundwater and begin transport to surface waters. Less information is available on the
fate and transport and potential bioavailability of organic nitrogen from onsite wastewater systems (O’Driscoll et
al., 2014).
The CBP previously estimated an overall TN attenuation of 60 percent (40 percent delivery) between the EOD
and modeled stream reach. This approach of assigning a single reduction factor to groundwater attenuation
across a variety of groundwater and aquifer conditions is a strong simplification, although one that may have been
necessary to proceed with planning level efforts. To illustrate the simplification, consider the reduction of nitrate in
Zone 3 due to a first order denitrification reaction (Equation 2):
𝐶
𝐶0= exp(−𝑟𝑡) Equation 2
In Equation 2, c is the remaining concentration, c0 is the initial concentration (entering groundwater Zone 3), r is
the denitrification rate (in units of 1/time) and t is the travel time through the zone. Both reaction rate and travel
time are likely to vary between different physical locations in a groundwatershed discharging to a river segment.
For locations with similar reaction rates, travel time is the main factor distinguishing expected attenuation between
OWTS locations. The influence of travel time leads to the consideration of setback distances beyond which a
lesser nitrogen impact can be expected (e.g., Valiela et al., 1997, Corbett et al., 2002). This is consistent with the
concept of setback requirements in general. The State of Maryland Department of Environmental Protection
recognized that nitrogen attenuation in onsite systems would at least partially be a function of distance from
surface waters and implemented an approach of differentiated attenuation factors which have been approved by
the CBP (Table 9).
Table 9. Nitrogen Delivery Factors for Onsite Systems in Maryland
System Location Nitrogen Delivery
Within 1,000 feet of critical (tidal) waters 80%
Within 1,000 feet of other waters 50%
Greater than 1,000 feet of any waters 30%
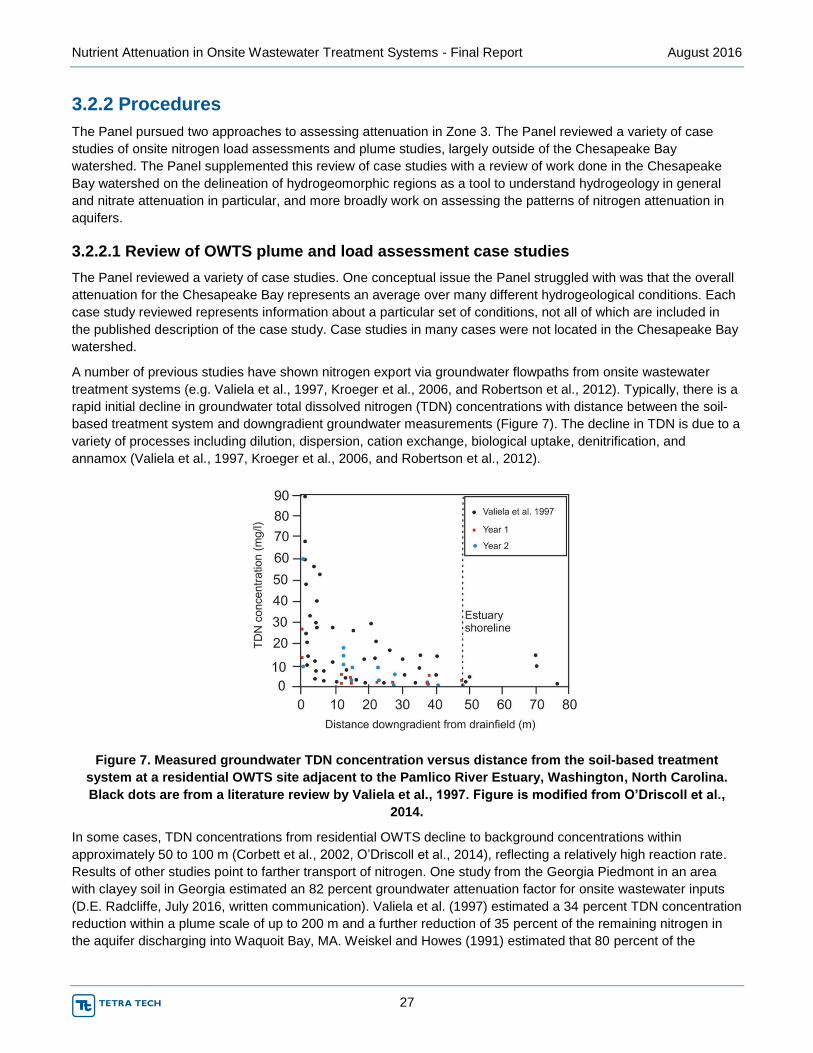
Nutrient Attenuation in Onsite Wastewater Treatment Systems - Final Report August 2016
27
3.2.2 Procedures
The Panel pursued two approaches to assessing attenuation in Zone 3. The Panel reviewed a variety of case
studies of onsite nitrogen load assessments and plume studies, largely outside of the Chesapeake Bay
watershed. The Panel supplemented this review of case studies with a review of work done in the Chesapeake
Bay watershed on the delineation of hydrogeomorphic regions as a tool to understand hydrogeology in general
and nitrate attenuation in particular, and more broadly work on assessing the patterns of nitrogen attenuation in
aquifers.
3.2.2.1 Review of OWTS plume and load assessment case studies
The Panel reviewed a variety of case studies. One conceptual issue the Panel struggled with was that the overall
attenuation for the Chesapeake Bay represents an average over many different hydrogeological conditions. Each
case study reviewed represents information about a particular set of conditions, not all of which are included in
the published description of the case study. Case studies in many cases were not located in the Chesapeake Bay
watershed.
A number of previous studies have shown nitrogen export via groundwater flowpaths from onsite wastewater
treatment systems (e.g. Valiela et al., 1997, Kroeger et al., 2006, and Robertson et al., 2012). Typically, there is a
rapid initial decline in groundwater total dissolved nitrogen (TDN) concentrations with distance between the soil-
based treatment system and downgradient groundwater measurements (Figure 7). The decline in TDN is due to a
variety of processes including dilution, dispersion, cation exchange, biological uptake, denitrification, and
annamox (Valiela et al., 1997, Kroeger et al., 2006, and Robertson et al., 2012).
Figure 7. Measured groundwater TDN concentration versus distance from the soil-based treatment
system at a residential OWTS site adjacent to the Pamlico River Estuary, Washington, North Carolina.
Black dots are from a literature review by Valiela et al., 1997. Figure is modified from O’Driscoll et al.,
2014.
In some cases, TDN concentrations from residential OWTS decline to background concentrations within
approximately 50 to 100 m (Corbett et al., 2002, O’Driscoll et al., 2014), reflecting a relatively high reaction rate.
Results of other studies point to farther transport of nitrogen. One study from the Georgia Piedmont in an area
with clayey soil in Georgia estimated an 82 percent groundwater attenuation factor for onsite wastewater inputs
(D.E. Radcliffe, July 2016, written communication). Valiela et al. (1997) estimated a 34 percent TDN concentration
reduction within a plume scale of up to 200 m and a further reduction of 35 percent of the remaining nitrogen in
the aquifer discharging into Waquoit Bay, MA. Weiskel and Howes (1991) estimated that 80 percent of the
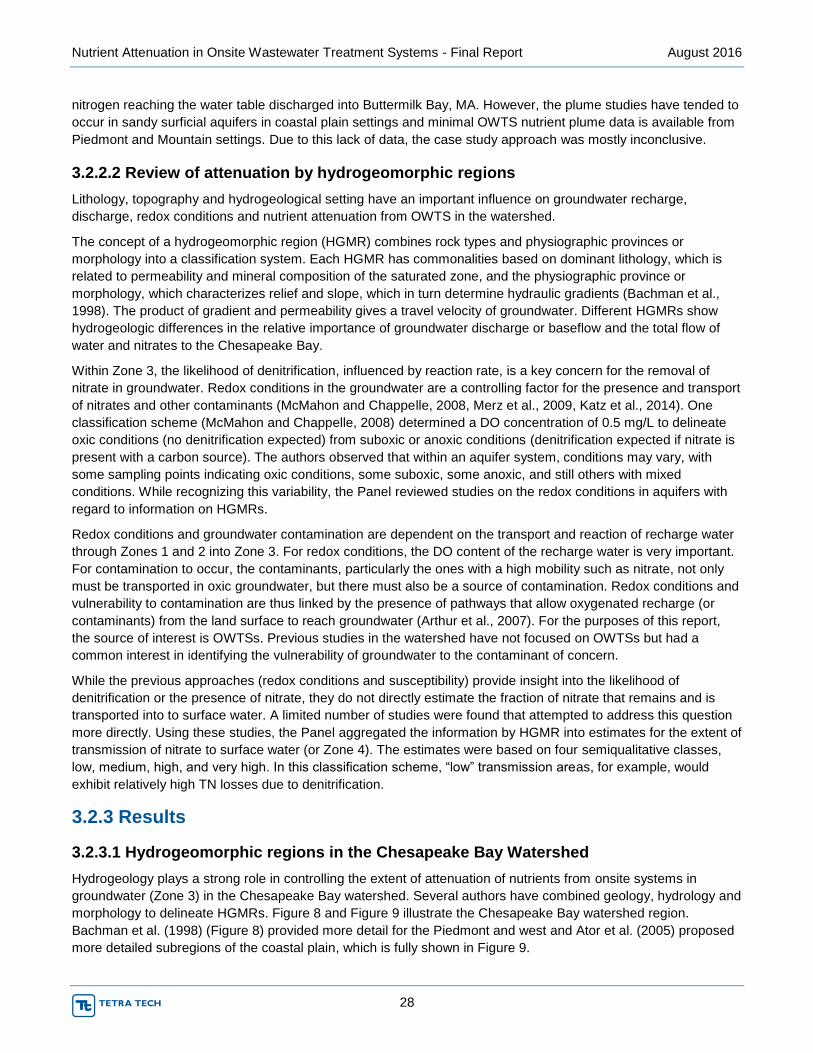
Nutrient Attenuation in Onsite Wastewater Treatment Systems - Final Report August 2016
28
nitrogen reaching the water table discharged into Buttermilk Bay, MA. However, the plume studies have tended to
occur in sandy surficial aquifers in coastal plain settings and minimal OWTS nutrient plume data is available from
Piedmont and Mountain settings. Due to this lack of data, the case study approach was mostly inconclusive.
3.2.2.2 Review of attenuation by hydrogeomorphic regions
Lithology, topography and hydrogeological setting have an important influence on groundwater recharge,
discharge, redox conditions and nutrient attenuation from OWTS in the watershed.
The concept of a hydrogeomorphic region (HGMR) combines rock types and physiographic provinces or
morphology into a classification system. Each HGMR has commonalities based on dominant lithology, which is
related to permeability and mineral composition of the saturated zone, and the physiographic province or
morphology, which characterizes relief and slope, which in turn determine hydraulic gradients (Bachman et al.,
1998). The product of gradient and permeability gives a travel velocity of groundwater. Different HGMRs show
hydrogeologic differences in the relative importance of groundwater discharge or baseflow and the total flow of
water and nitrates to the Chesapeake Bay.
Within Zone 3, the likelihood of denitrification, influenced by reaction rate, is a key concern for the removal of
nitrate in groundwater. Redox conditions in the groundwater are a controlling factor for the presence and transport
of nitrates and other contaminants (McMahon and Chappelle, 2008, Merz et al., 2009, Katz et al., 2014). One
classification scheme (McMahon and Chappelle, 2008) determined a DO concentration of 0.5 mg/L to delineate
oxic conditions (no denitrification expected) from suboxic or anoxic conditions (denitrification expected if nitrate is
present with a carbon source). The authors observed that within an aquifer system, conditions may vary, with
some sampling points indicating oxic conditions, some suboxic, some anoxic, and still others with mixed
conditions. While recognizing this variability, the Panel reviewed studies on the redox conditions in aquifers with
regard to information on HGMRs.
Redox conditions and groundwater contamination are dependent on the transport and reaction of recharge water
through Zones 1 and 2 into Zone 3. For redox conditions, the DO content of the recharge water is very important.
For contamination to occur, the contaminants, particularly the ones with a high mobility such as nitrate, not only
must be transported in oxic groundwater, but there must also be a source of contamination. Redox conditions and
vulnerability to contamination are thus linked by the presence of pathways that allow oxygenated recharge (or
contaminants) from the land surface to reach groundwater (Arthur et al., 2007). For the purposes of this report,
the source of interest is OWTSs. Previous studies in the watershed have not focused on OWTSs but had a
common interest in identifying the vulnerability of groundwater to the contaminant of concern.
While the previous approaches (redox conditions and susceptibility) provide insight into the likelihood of
denitrification or the presence of nitrate, they do not directly estimate the fraction of nitrate that remains and is
transported into to surface water. A limited number of studies were found that attempted to address this question
more directly. Using these studies, the Panel aggregated the information by HGMR into estimates for the extent of
transmission of nitrate to surface water (or Zone 4). The estimates were based on four semiqualitative classes,
low, medium, high, and very high. In this classification scheme, “low” transmission areas, for example, would
exhibit relatively high TN losses due to denitrification.
3.2.3 Results
3.2.3.1 Hydrogeomorphic regions in the Chesapeake Bay Watershed
Hydrogeology plays a strong role in controlling the extent of attenuation of nutrients from onsite systems in
groundwater (Zone 3) in the Chesapeake Bay watershed. Several authors have combined geology, hydrology and
morphology to delineate HGMRs. Figure 8 and Figure 9 illustrate the Chesapeake Bay watershed region.
Bachman et al. (1998) (Figure 8) provided more detail for the Piedmont and west and Ator et al. (2005) proposed
more detailed subregions of the coastal plain, which is fully shown in Figure 9.
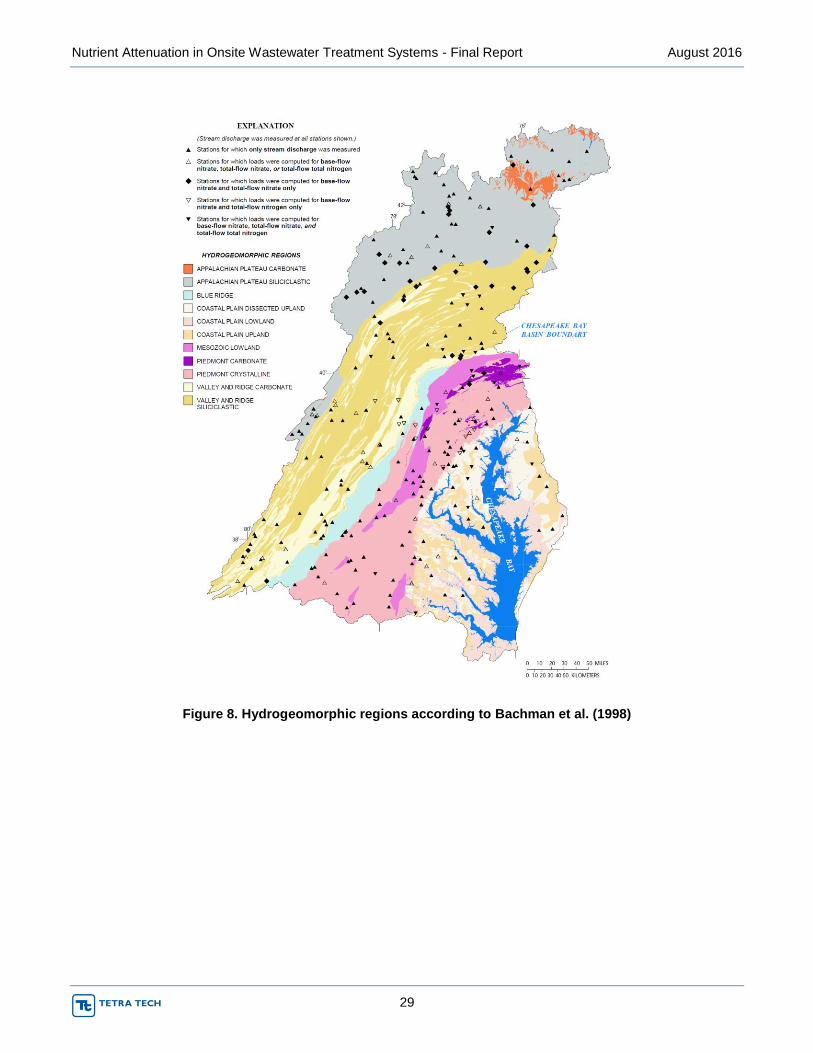
Nutrient Attenuation in Onsite Wastewater Treatment Systems - Final Report August 2016
29
Figure 8. Hydrogeomorphic regions according to Bachman et al. (1998)
Nutrient Attenuation in Onsite Wastewater Treatment Systems - Final Report August 2016
30
Figure 9. Hydrogeomorphic refinement of Coastal Plain by Ator et al. (2005)
The following summaries of HGMRs described by Greene et al. (2005) are based largely on that source, Lindsey
et al. (2014), and Denver, et al. (2014).
Depending on land use, hydrogeology, and source characteristics, carbonate-rock aquifers are often highly
susceptible to contamination because they have features such as sinkholes and conduits that allow rapid
infiltration and transport of water through the groundwater system (Lindsey et al., 2014). They also are commonly
overlain by large flat areas well suited for agricultural, urban, and suburban development. In the Chesapeake Bay
watershed, carbonate-rock aquifers are found in the Piedmont, Blue Ridge, Valley and Ridge, and northern
Appalachian Plateau physiographic provinces. Groundwater age was reported to be less than 20 years in 75
percent of wells sampled in Valley and Ridge carbonate-rock aquifers. All of the water in the carbonate-rock
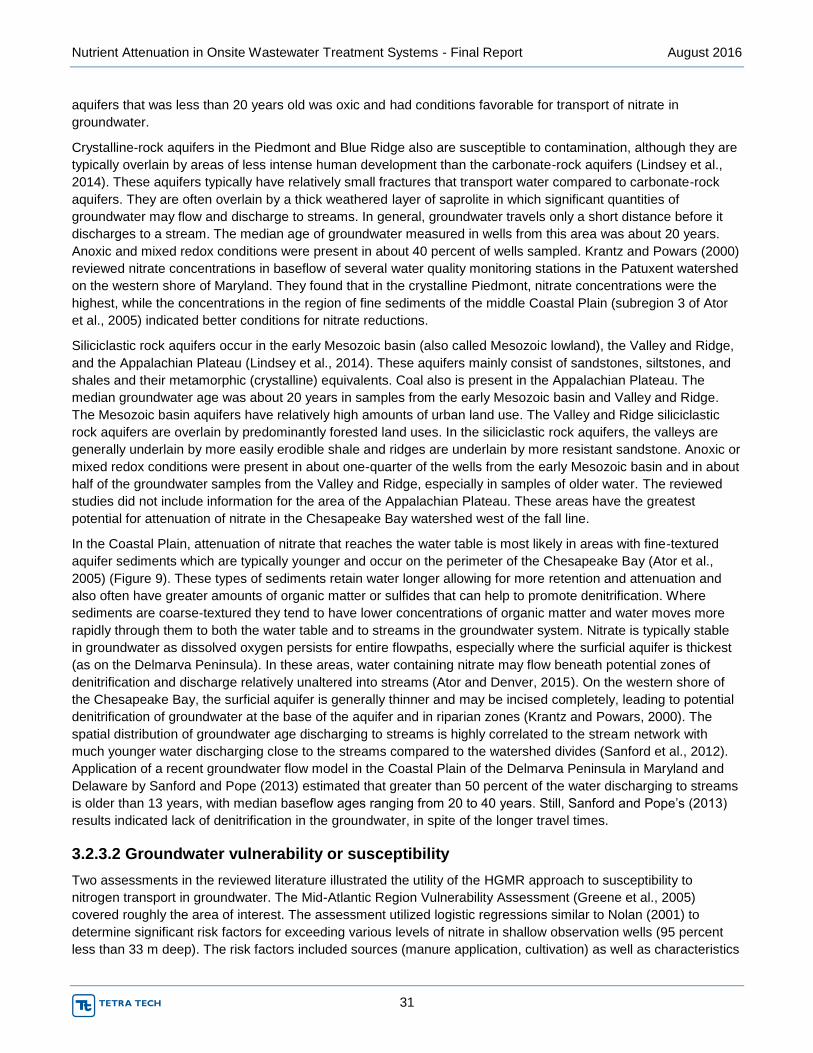
Nutrient Attenuation in Onsite Wastewater Treatment Systems - Final Report August 2016
31
aquifers that was less than 20 years old was oxic and had conditions favorable for transport of nitrate in
groundwater.
Crystalline-rock aquifers in the Piedmont and Blue Ridge also are susceptible to contamination, although they are
typically overlain by areas of less intense human development than the carbonate-rock aquifers (Lindsey et al.,
2014). These aquifers typically have relatively small fractures that transport water compared to carbonate-rock
aquifers. They are often overlain by a thick weathered layer of saprolite in which significant quantities of
groundwater may flow and discharge to streams. In general, groundwater travels only a short distance before it
discharges to a stream. The median age of groundwater measured in wells from this area was about 20 years.
Anoxic and mixed redox conditions were present in about 40 percent of wells sampled. Krantz and Powars (2000)
reviewed nitrate concentrations in baseflow of several water quality monitoring stations in the Patuxent watershed
on the western shore of Maryland. They found that in the crystalline Piedmont, nitrate concentrations were the
highest, while the concentrations in the region of fine sediments of the middle Coastal Plain (subregion 3 of Ator
et al., 2005) indicated better conditions for nitrate reductions.
Siliciclastic rock aquifers occur in the early Mesozoic basin (also called Mesozoic lowland), the Valley and Ridge,
and the Appalachian Plateau (Lindsey et al., 2014). These aquifers mainly consist of sandstones, siltstones, and
shales and their metamorphic (crystalline) equivalents. Coal also is present in the Appalachian Plateau. The
median groundwater age was about 20 years in samples from the early Mesozoic basin and Valley and Ridge.
The Mesozoic basin aquifers have relatively high amounts of urban land use. The Valley and Ridge siliciclastic
rock aquifers are overlain by predominantly forested land uses. In the siliciclastic rock aquifers, the valleys are
generally underlain by more easily erodible shale and ridges are underlain by more resistant sandstone. Anoxic or
mixed redox conditions were present in about one-quarter of the wells from the early Mesozoic basin and in about
half of the groundwater samples from the Valley and Ridge, especially in samples of older water. The reviewed
studies did not include information for the area of the Appalachian Plateau. These areas have the greatest
potential for attenuation of nitrate in the Chesapeake Bay watershed west of the fall line.
In the Coastal Plain, attenuation of nitrate that reaches the water table is most likely in areas with fine-textured
aquifer sediments which are typically younger and occur on the perimeter of the Chesapeake Bay (Ator et al.,
2005) (Figure 9). These types of sediments retain water longer allowing for more retention and attenuation and
also often have greater amounts of organic matter or sulfides that can help to promote denitrification. Where
sediments are coarse-textured they tend to have lower concentrations of organic matter and water moves more
rapidly through them to both the water table and to streams in the groundwater system. Nitrate is typically stable
in groundwater as dissolved oxygen persists for entire flowpaths, especially where the surficial aquifer is thickest
(as on the Delmarva Peninsula). In these areas, water containing nitrate may flow beneath potential zones of
denitrification and discharge relatively unaltered into streams (Ator and Denver, 2015). On the western shore of
the Chesapeake Bay, the surficial aquifer is generally thinner and may be incised completely, leading to potential
denitrification of groundwater at the base of the aquifer and in riparian zones (Krantz and Powars, 2000). The
spatial distribution of groundwater age discharging to streams is highly correlated to the stream network with
much younger water discharging close to the streams compared to the watershed divides (Sanford et al., 2012).
Application of a recent groundwater flow model in the Coastal Plain of the Delmarva Peninsula in Maryland and
Delaware by Sanford and Pope (2013) estimated that greater than 50 percent of the water discharging to streams
is older than 13 years, with median baseflow ages ranging from 20 to 40 years. Still, Sanford and Pope’s (2013)
results indicated lack of denitrification in the groundwater, in spite of the longer travel times.
3.2.3.2 Groundwater vulnerability or susceptibility
Two assessments in the reviewed literature illustrated the utility of the HGMR approach to susceptibility to
nitrogen transport in groundwater. The Mid-Atlantic Region Vulnerability Assessment (Greene et al., 2005)
covered roughly the area of interest. The assessment utilized logistic regressions similar to Nolan (2001) to
determine significant risk factors for exceeding various levels of nitrate in shallow observation wells (95 percent
less than 33 m deep). The risk factors included sources (manure application, cultivation) as well as characteristics
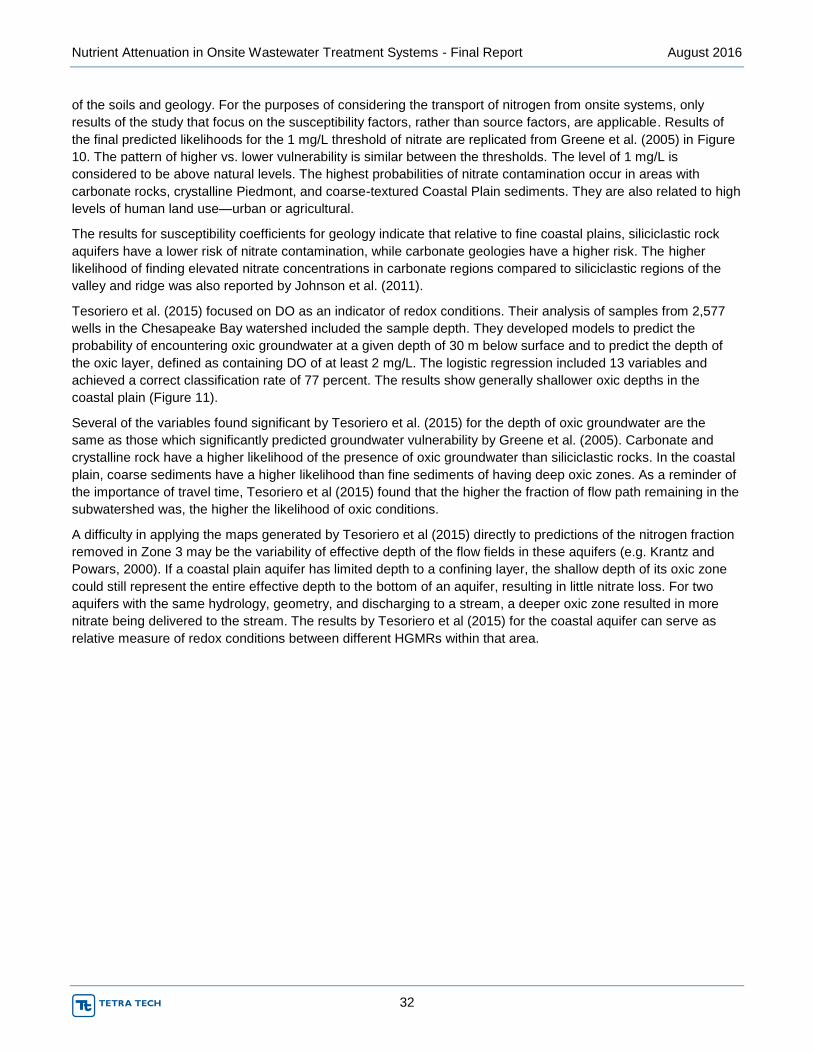
Nutrient Attenuation in Onsite Wastewater Treatment Systems - Final Report August 2016
32
of the soils and geology. For the purposes of considering the transport of nitrogen from onsite systems, only
results of the study that focus on the susceptibility factors, rather than source factors, are applicable. Results of
the final predicted likelihoods for the 1 mg/L threshold of nitrate are replicated from Greene et al. (2005) in Figure
10. The pattern of higher vs. lower vulnerability is similar between the thresholds. The level of 1 mg/L is
considered to be above natural levels. The highest probabilities of nitrate contamination occur in areas with
carbonate rocks, crystalline Piedmont, and coarse-textured Coastal Plain sediments. They are also related to high
levels of human land use—urban or agricultural.
The results for susceptibility coefficients for geology indicate that relative to fine coastal plains, siliciclastic rock
aquifers have a lower risk of nitrate contamination, while carbonate geologies have a higher risk. The higher
likelihood of finding elevated nitrate concentrations in carbonate regions compared to siliciclastic regions of the
valley and ridge was also reported by Johnson et al. (2011).
Tesoriero et al. (2015) focused on DO as an indicator of redox conditions. Their analysis of samples from 2,577
wells in the Chesapeake Bay watershed included the sample depth. They developed models to predict the
probability of encountering oxic groundwater at a given depth of 30 m below surface and to predict the depth of
the oxic layer, defined as containing DO of at least 2 mg/L. The logistic regression included 13 variables and
achieved a correct classification rate of 77 percent. The results show generally shallower oxic depths in the
coastal plain (Figure 11).
Several of the variables found significant by Tesoriero et al. (2015) for the depth of oxic groundwater are the
same as those which significantly predicted groundwater vulnerability by Greene et al. (2005). Carbonate and
crystalline rock have a higher likelihood of the presence of oxic groundwater than siliciclastic rocks. In the coastal
plain, coarse sediments have a higher likelihood than fine sediments of having deep oxic zones. As a reminder of
the importance of travel time, Tesoriero et al (2015) found that the higher the fraction of flow path remaining in the
subwatershed was, the higher the likelihood of oxic conditions.
A difficulty in applying the maps generated by Tesoriero et al (2015) directly to predictions of the nitrogen fraction
removed in Zone 3 may be the variability of effective depth of the flow fields in these aquifers (e.g. Krantz and
Powars, 2000). If a coastal plain aquifer has limited depth to a confining layer, the shallow depth of its oxic zone
could still represent the entire effective depth to the bottom of an aquifer, resulting in little nitrate loss. For two
aquifers with the same hydrology, geometry, and discharging to a stream, a deeper oxic zone resulted in more
nitrate being delivered to the stream. The results by Tesoriero et al (2015) for the coastal aquifer can serve as
relative measure of redox conditions between different HGMRs within that area.
Nutrient Attenuation in Onsite Wastewater Treatment Systems - Final Report August 2016
33
Figure 10. Results of assessment of likelihood exceeding threshold concentrations of nitrate in shallow
groundwater in the mid-Atlantic region (Greene et al., 2005 Figures 11A, 11C, and 11E).The likelihood
includes both the presence of sources and the vulnerability of the groundwater. A threshold = 1 mg/L; C
threshold = 3 mg/L; E threshold = 10 mg/L
Nutrient Attenuation in Onsite Wastewater Treatment Systems - Final Report August 2016
34
Figure 11. Probability (%) of oxic groundwater at a 30 m depth to the top of the open interval for
groundwater in the Chesapeake Bay watershed. (Figure 2 of Tesoriero et al., 2015)
3.2.3.3 Direct estimates of nitrate reduction in groundwater
Complementary to the question of how likely it is to find nitrate in groundwater that then discharges into streams,
some researchers have looked at how much of the nitrate that enters groundwater is then denitrified. The
approach to this question consists of a comparison of the dissolved inorganic nitrogen species, in particular, the
remaining nitrate concentrations versus the excess dissolved nitrogen gas as a denitrification end product
(Heffernan et al., 2012, Hinkle and Tesoriero, 2014). Sometimes this information is combined with groundwater
age estimates to approximate a denitrification rate (Tesoriero and Puckett, 2011).
Hinkle and Tesoriero (2014) reviewed a data set of 877 samples from shallow groundwater of principal aquifers of
the 48 contiguous States. The patterns were similar to the redox pattern found by McMahon and Chapelle (2008).
In addition, they found that groundwater age had a strong effect on the extent of denitrification. They developed
classification tree schemes to assess the controlling factors for the extent of denitrification in aquifers (“high” >50
percent, “medium” 10-50 percent, “low” <10 percent of original nitrate denitrified). The few samples with a medium
denitrification classification did not fit well in either classification tree, but overall an 87 percent accuracy of correct
classification was reached for the explanatory classification tree and about 80 percent for the smaller sample
Nutrient Attenuation in Onsite Wastewater Treatment Systems - Final Report August 2016
35
predictive classification tree. The explanatory classification tree was based on redox indicators, such as DO
concentrations and iron. DO concentrations of 1.93 mg/L and 0.96 mg/L were two of the nodes. These
concentrations are higher than those from the delineation used by McMahon and Chapelle (2008). A predictive
classification tree was based on seasonal high water table, groundwater age, and a broad grouping of geology.
Seasonal high water table deeper than 1.83 m (6 ft) was a strong predictor for little denitrification. For seasonal
high water tables between 1.27 m (4 ft) and 1.83 m, a groundwater age of 30 years distinguished groundwater
with little denitrification from groundwater with much denitrification. For shallower groundwater, a groundwater age
younger than 10 years still predicted little denitrification. Shallower and older groundwater in eastern sand and
gravel and glacial aquifers showed high denitrification, while western sand and gravel aquifers as well as
fractured rock and karst aquifers showed little denitrification.
Puckett et al. (2011) summarized nitrate concentrations, water sample ages, and denitrification, and then
compared them to estimated nitrogen application rates to the land surface. These data allowed an estimation of
the fraction of nitrogen applied to the surface that had been recharging the groundwater (combined effect of
Zones 1 through 3). For the five Mid-Atlantic sites included in the study, this fraction ranged from 4.5 percent to
36.9 percent (their Table S1), and the first order denitrification rate ranged from 0 to 0.11 per year. For 333 (of
424) oxic (DO concentrations > 0.5 mg/L) samples, the median concentration of excess nitrogen as an indicator of
denitrification was zero, indicating little to no denitrification under such conditions.
Detailed studies in four watersheds, one each from four HGMRs (upper Coastal Plain, Valley and Ridge
carbonate, Valley and Ridge siliciclastic, and Piedmont) found variability of excess nitrogen within watersheds that
appeared bimodal, either all nitrate had been denitrified or nearly none (Lindsey et al., 2003). Lindsey, et al.
(2003) estimated that in the more western regions of the Chesapeake Bay watershed, predominantly in the
Piedmont and the Valley and Ridge physiographic provinces, 75 percent of the water discharging via the
groundwater system (in contrast to interflow and surface runoff, which account for about 50 percent) is younger
than 13 years, with a large proportion younger than five years.
3.2.3.4 Recommended classification scheme for reduction factors
The Panel extended the review of case studies with a review of work done in the Chesapeake Bay watershed on
the characterization of nitrogen attenuation in HGMRs. This resulted in the conclusion that spatial variability of
nitrate transmission follows patterns that should be considered in load assessments. Table 10 incorporates the
HGMR scheme of Greene et al. (2005) and amends it, mainly by the Coastal Plain subdivisions by Ator (2005).
These refinements stem from additional studies that assessed the redox conditions and nitrate contamination of
shallow groundwater. The numerical values for recommended attenuation (and transmission) factors associated
with the hydrogeomorphic regions provide an estimate for the relative magnitude of nitrate transport.
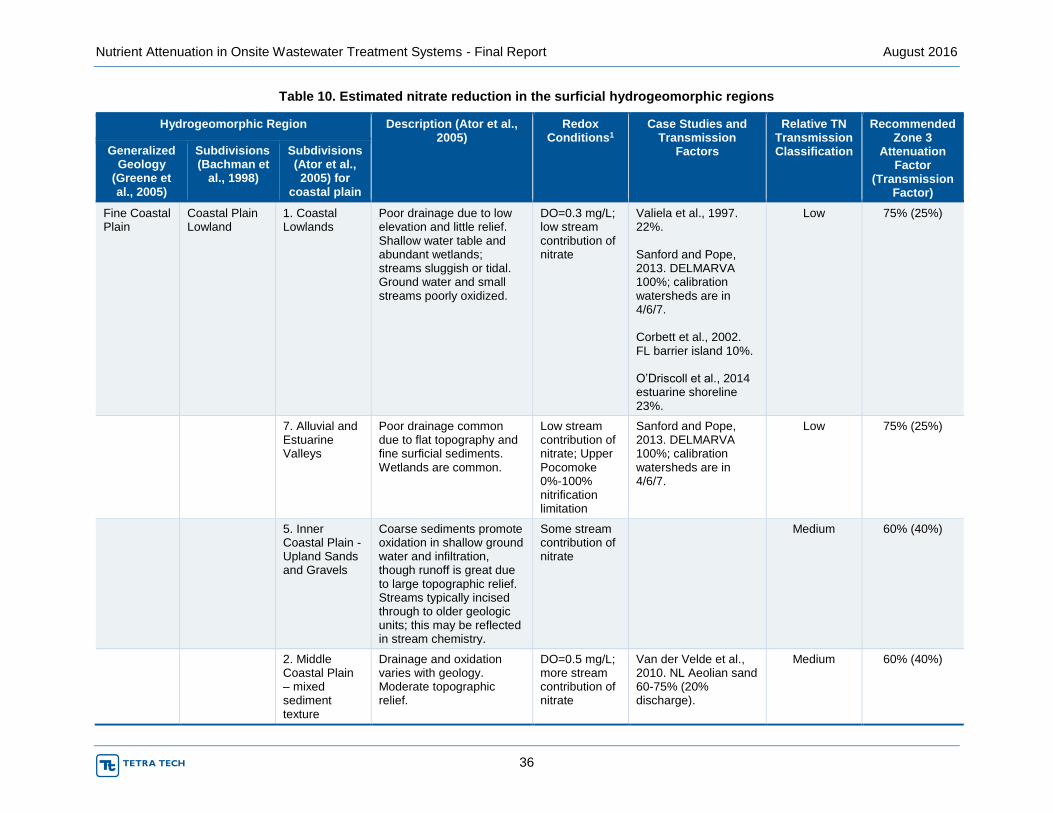
Nutrient Attenuation in Onsite Wastewater Treatment Systems - Final Report August 2016
36
Table 10. Estimated nitrate reduction in the surficial hydrogeomorphic regions
Hydrogeomorphic Region Description (Ator et al., 2005)
Redox Conditions1
Case Studies and Transmission
Factors
Relative TN Transmission Classification
Recommended Zone 3
Attenuation Factor
(Transmission Factor)
Generalized Geology
(Greene et al., 2005)
Subdivisions (Bachman et
al., 1998)
Subdivisions (Ator et al., 2005) for
coastal plain
Fine Coastal Plain
Coastal Plain Lowland
1. Coastal Lowlands
Poor drainage due to low elevation and little relief. Shallow water table and abundant wetlands; streams sluggish or tidal. Ground water and small streams poorly oxidized.
DO=0.3 mg/L; low stream contribution of nitrate
Valiela et al., 1997. 22%. Sanford and Pope, 2013. DELMARVA 100%; calibration watersheds are in 4/6/7. Corbett et al., 2002. FL barrier island 10%. O’Driscoll et al., 2014 estuarine shoreline 23%.
Low 75% (25%)
7. Alluvial and Estuarine Valleys
Poor drainage common due to flat topography and fine surficial sediments. Wetlands are common.
Low stream contribution of nitrate; Upper Pocomoke 0%-100% nitrification limitation
Sanford and Pope, 2013. DELMARVA 100%; calibration watersheds are in 4/6/7.
Low 75% (25%)
5. Inner Coastal Plain - Upland Sands and Gravels
Coarse sediments promote oxidation in shallow ground water and infiltration, though runoff is great due to large topographic relief. Streams typically incised through to older geologic units; this may be reflected in stream chemistry.
Some stream contribution of nitrate
Medium 60% (40%)
2. Middle Coastal Plain – mixed sediment texture
Drainage and oxidation varies with geology. Moderate topographic relief.
DO=0.5 mg/L; more stream contribution of nitrate
Van der Velde et al., 2010. NL Aeolian sand 60-75% (20% discharge).
Medium 60% (40%)
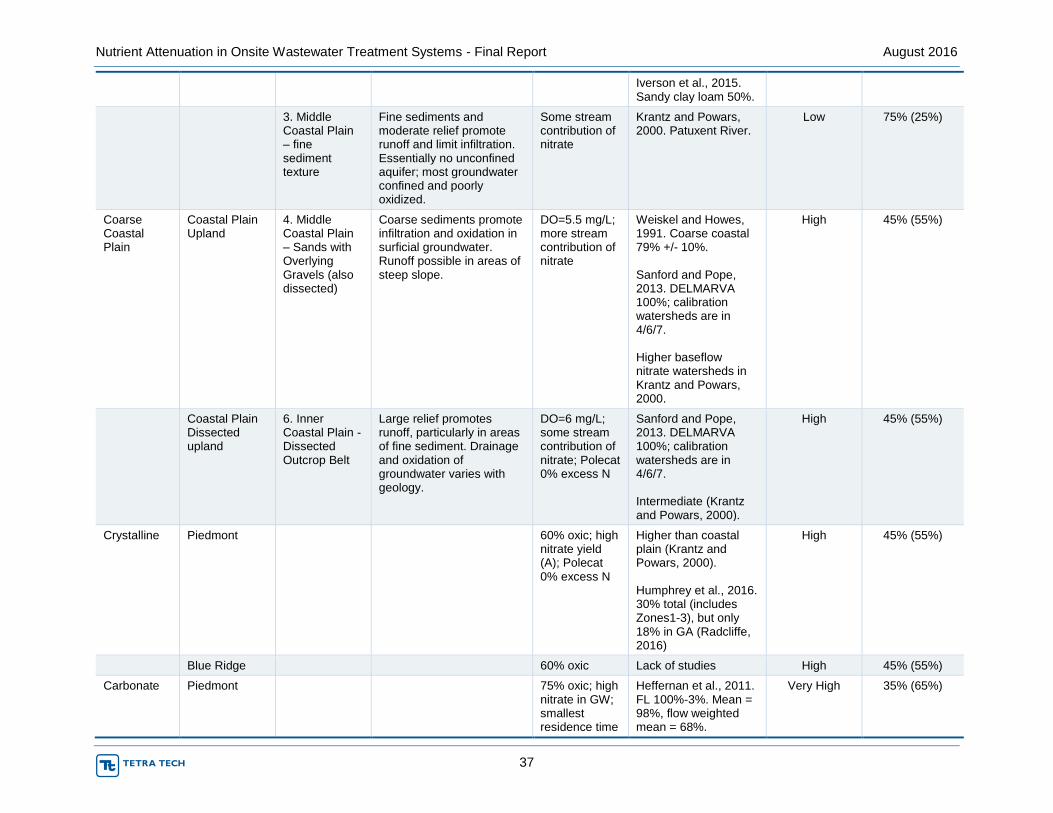
Nutrient Attenuation in Onsite Wastewater Treatment Systems - Final Report August 2016
37
Iverson et al., 2015. Sandy clay loam 50%.
3. Middle Coastal Plain – fine sediment texture
Fine sediments and moderate relief promote runoff and limit infiltration. Essentially no unconfined aquifer; most groundwater confined and poorly oxidized.
Some stream contribution of nitrate
Krantz and Powars, 2000. Patuxent River.
Low 75% (25%)
Coarse Coastal Plain
Coastal Plain Upland
4. Middle Coastal Plain – Sands with Overlying Gravels (also dissected)
Coarse sediments promote infiltration and oxidation in surficial groundwater. Runoff possible in areas of steep slope.
DO=5.5 mg/L; more stream contribution of nitrate
Weiskel and Howes, 1991. Coarse coastal 79% +/- 10%. Sanford and Pope, 2013. DELMARVA 100%; calibration watersheds are in 4/6/7. Higher baseflow nitrate watersheds in Krantz and Powars, 2000.
High 45% (55%)
Coastal Plain Dissected upland
6. Inner Coastal Plain - Dissected Outcrop Belt
Large relief promotes runoff, particularly in areas of fine sediment. Drainage and oxidation of groundwater varies with geology.
DO=6 mg/L; some stream contribution of nitrate; Polecat 0% excess N
Sanford and Pope, 2013. DELMARVA 100%; calibration watersheds are in 4/6/7. Intermediate (Krantz and Powars, 2000).
High 45% (55%)
Crystalline Piedmont 60% oxic; high nitrate yield (A); Polecat 0% excess N
Higher than coastal plain (Krantz and Powars, 2000). Humphrey et al., 2016. 30% total (includes Zones1-3), but only 18% in GA (Radcliffe, 2016)
High 45% (55%)
Blue Ridge 60% oxic Lack of studies High 45% (55%)
Carbonate Piedmont 75% oxic; high nitrate in GW; smallest residence time
Heffernan et al., 2011. FL 100%-3%. Mean = 98%, flow weighted mean = 68%.
Very High 35% (65%)
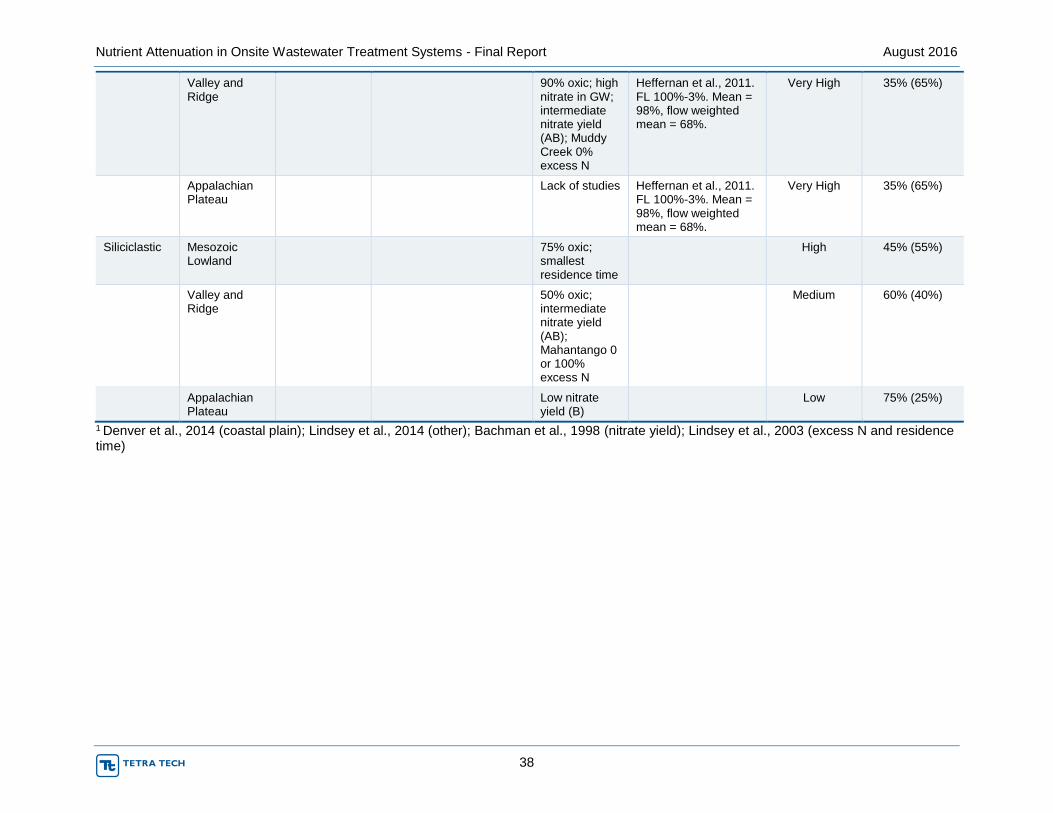
Nutrient Attenuation in Onsite Wastewater Treatment Systems - Final Report August 2016
38
Valley and Ridge
90% oxic; high nitrate in GW; intermediate nitrate yield (AB); Muddy Creek 0% excess N
Heffernan et al., 2011. FL 100%-3%. Mean = 98%, flow weighted mean = 68%.
Very High 35% (65%)
Appalachian Plateau
Lack of studies Heffernan et al., 2011. FL 100%-3%. Mean = 98%, flow weighted mean = 68%.
Very High 35% (65%)
Siliciclastic Mesozoic Lowland
75% oxic; smallest residence time
High 45% (55%)
Valley and Ridge
50% oxic; intermediate nitrate yield (AB); Mahantango 0 or 100% excess N
Medium 60% (40%)
Appalachian Plateau
Low nitrate yield (B)
Low 75% (25%)
1 Denver et al., 2014 (coastal plain); Lindsey et al., 2014 (other); Bachman et al., 1998 (nitrate yield); Lindsey et al., 2003 (excess N and residence time)

Nutrient Attenuation in Onsite Wastewater Treatment Systems - Final Report August 2016
39
3.3 SUPPLEMENTAL SPARROW RUNS
Placeholder for USGS input
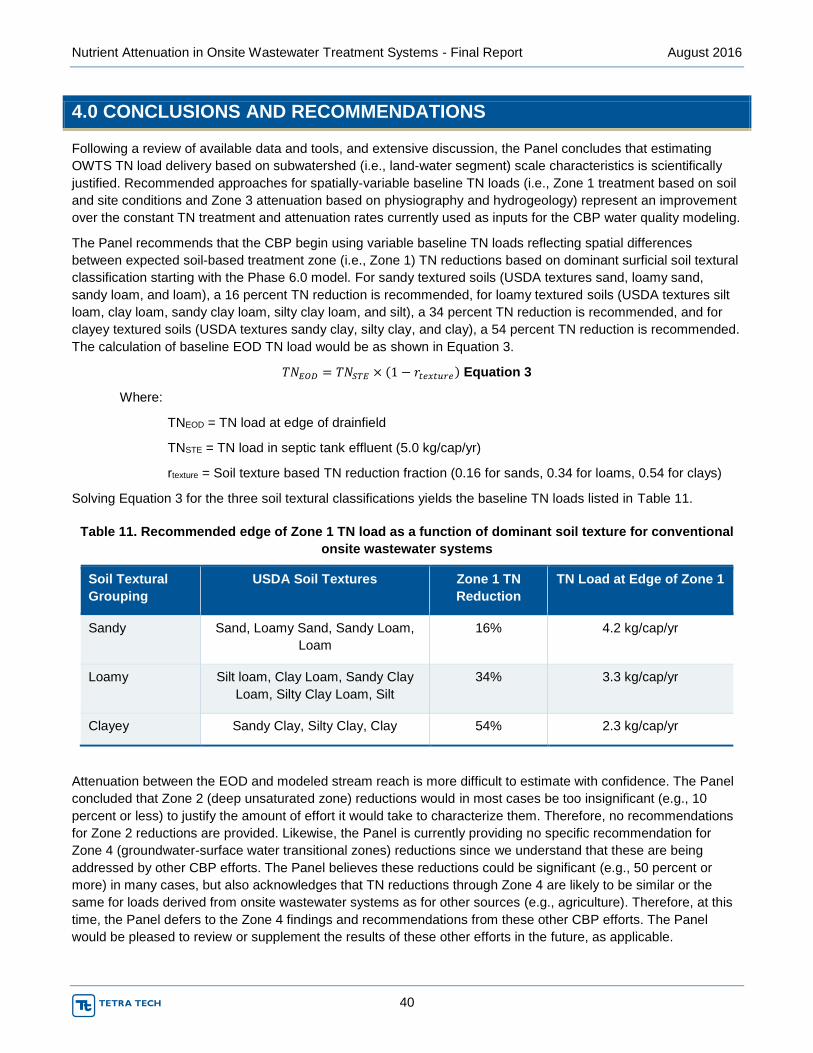
Nutrient Attenuation in Onsite Wastewater Treatment Systems - Final Report August 2016
40
4.0 CONCLUSIONS AND RECOMMENDATIONS
Following a review of available data and tools, and extensive discussion, the Panel concludes that estimating
OWTS TN load delivery based on subwatershed (i.e., land-water segment) scale characteristics is scientifically
justified. Recommended approaches for spatially-variable baseline TN loads (i.e., Zone 1 treatment based on soil
and site conditions and Zone 3 attenuation based on physiography and hydrogeology) represent an improvement
over the constant TN treatment and attenuation rates currently used as inputs for the CBP water quality modeling.
The Panel recommends that the CBP begin using variable baseline TN loads reflecting spatial differences
between expected soil-based treatment zone (i.e., Zone 1) TN reductions based on dominant surficial soil textural
classification starting with the Phase 6.0 model. For sandy textured soils (USDA textures sand, loamy sand,
sandy loam, and loam), a 16 percent TN reduction is recommended, for loamy textured soils (USDA textures silt
loam, clay loam, sandy clay loam, silty clay loam, and silt), a 34 percent TN reduction is recommended, and for
clayey textured soils (USDA textures sandy clay, silty clay, and clay), a 54 percent TN reduction is recommended.
The calculation of baseline EOD TN load would be as shown in Equation 3.
𝑇𝑁𝐸𝑂𝐷 = 𝑇𝑁𝑆𝑇𝐸 × (1 − 𝑟𝑡𝑒𝑥𝑡𝑢𝑟𝑒) Equation 3
Where:
TNEOD = TN load at edge of drainfield
TNSTE = TN load in septic tank effluent (5.0 kg/cap/yr)
rtexture = Soil texture based TN reduction fraction (0.16 for sands, 0.34 for loams, 0.54 for clays)
Solving Equation 3 for the three soil textural classifications yields the baseline TN loads listed in Table 11.
Table 11. Recommended edge of Zone 1 TN load as a function of dominant soil texture for conventional
onsite wastewater systems
Soil Textural
Grouping
USDA Soil Textures Zone 1 TN
Reduction
TN Load at Edge of Zone 1
Sandy Sand, Loamy Sand, Sandy Loam,
Loam
16% 4.2 kg/cap/yr
Loamy Silt loam, Clay Loam, Sandy Clay
Loam, Silty Clay Loam, Silt
34% 3.3 kg/cap/yr
Clayey Sandy Clay, Silty Clay, Clay 54% 2.3 kg/cap/yr
Attenuation between the EOD and modeled stream reach is more difficult to estimate with confidence. The Panel
concluded that Zone 2 (deep unsaturated zone) reductions would in most cases be too insignificant (e.g., 10
percent or less) to justify the amount of effort it would take to characterize them. Therefore, no recommendations
for Zone 2 reductions are provided. Likewise, the Panel is currently providing no specific recommendation for
Zone 4 (groundwater-surface water transitional zones) reductions since we understand that these are being
addressed by other CBP efforts. The Panel believes these reductions could be significant (e.g., 50 percent or
more) in many cases, but also acknowledges that TN reductions through Zone 4 are likely to be similar or the
same for loads derived from onsite wastewater systems as for other sources (e.g., agriculture). Therefore, at this
time, the Panel defers to the Zone 4 findings and recommendations from these other CBP efforts. The Panel
would be pleased to review or supplement the results of these other efforts in the future, as applicable.
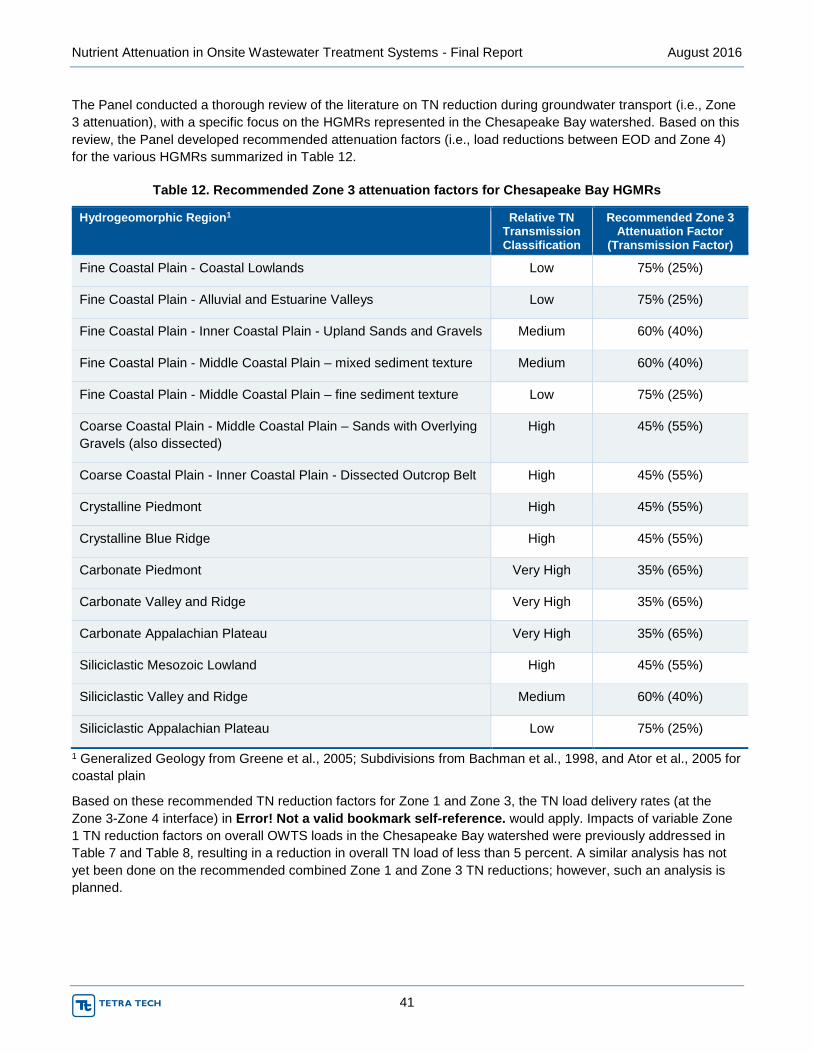
Nutrient Attenuation in Onsite Wastewater Treatment Systems - Final Report August 2016
41
The Panel conducted a thorough review of the literature on TN reduction during groundwater transport (i.e., Zone
3 attenuation), with a specific focus on the HGMRs represented in the Chesapeake Bay watershed. Based on this
review, the Panel developed recommended attenuation factors (i.e., load reductions between EOD and Zone 4)
for the various HGMRs summarized in Table 12.
Table 12. Recommended Zone 3 attenuation factors for Chesapeake Bay HGMRs
Hydrogeomorphic Region1 Relative TN Transmission Classification
Recommended Zone 3 Attenuation Factor
(Transmission Factor)
Fine Coastal Plain - Coastal Lowlands Low 75% (25%)
Fine Coastal Plain - Alluvial and Estuarine Valleys Low 75% (25%)
Fine Coastal Plain - Inner Coastal Plain - Upland Sands and Gravels Medium 60% (40%)
Fine Coastal Plain - Middle Coastal Plain – mixed sediment texture Medium 60% (40%)
Fine Coastal Plain - Middle Coastal Plain – fine sediment texture Low 75% (25%)
Coarse Coastal Plain - Middle Coastal Plain – Sands with Overlying
Gravels (also dissected)
High 45% (55%)
Coarse Coastal Plain - Inner Coastal Plain - Dissected Outcrop Belt High 45% (55%)
Crystalline Piedmont High 45% (55%)
Crystalline Blue Ridge High 45% (55%)
Carbonate Piedmont Very High 35% (65%)
Carbonate Valley and Ridge Very High 35% (65%)
Carbonate Appalachian Plateau Very High 35% (65%)
Siliciclastic Mesozoic Lowland High 45% (55%)
Siliciclastic Valley and Ridge Medium 60% (40%)
Siliciclastic Appalachian Plateau Low 75% (25%)
1 Generalized Geology from Greene et al., 2005; Subdivisions from Bachman et al., 1998, and Ator et al., 2005 for
coastal plain
Based on these recommended TN reduction factors for Zone 1 and Zone 3, the TN load delivery rates (at the
Zone 3-Zone 4 interface) in Error! Not a valid bookmark self-reference. would apply. Impacts of variable Zone
1 TN reduction factors on overall OWTS loads in the Chesapeake Bay watershed were previously addressed in
Table 7 and Table 8, resulting in a reduction in overall TN load of less than 5 percent. A similar analysis has not
yet been done on the recommended combined Zone 1 and Zone 3 TN reductions; however, such an analysis is
planned.
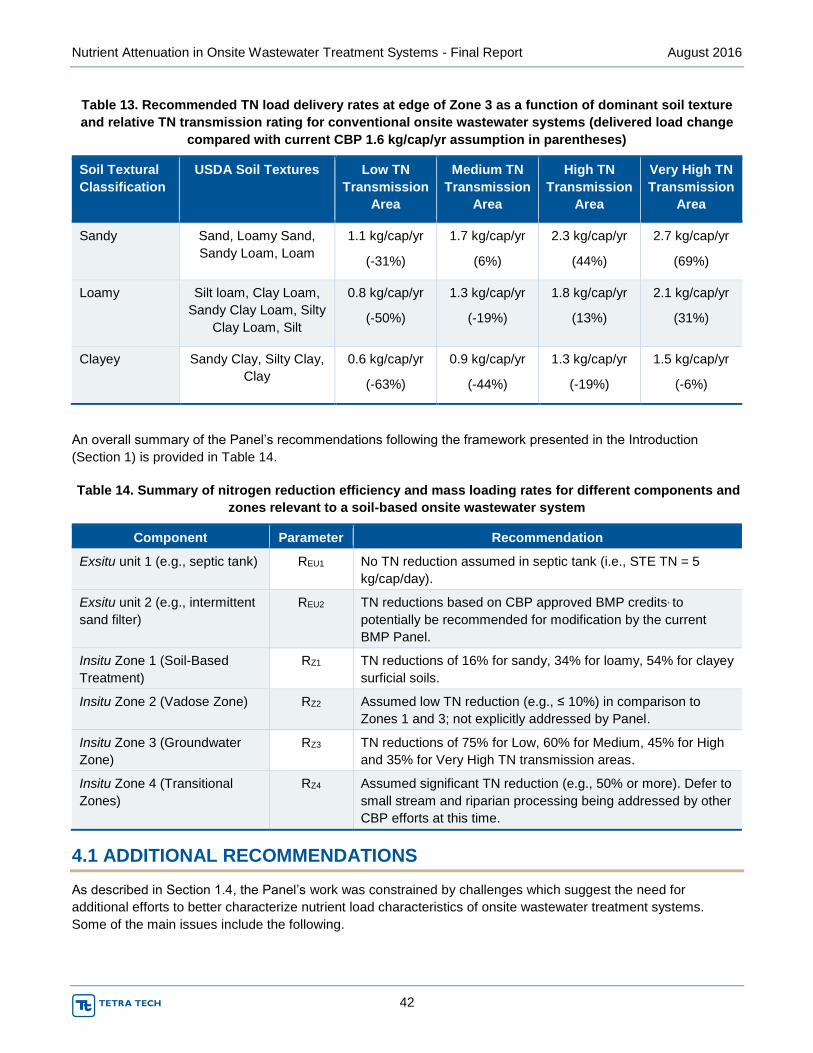
Nutrient Attenuation in Onsite Wastewater Treatment Systems - Final Report August 2016
42
Table 13. Recommended TN load delivery rates at edge of Zone 3 as a function of dominant soil texture
and relative TN transmission rating for conventional onsite wastewater systems (delivered load change
compared with current CBP 1.6 kg/cap/yr assumption in parentheses)
Soil Textural
Classification
USDA Soil Textures Low TN
Transmission
Area
Medium TN
Transmission
Area
High TN
Transmission
Area
Very High TN
Transmission
Area
Sandy Sand, Loamy Sand,
Sandy Loam, Loam
1.1 kg/cap/yr
(-31%)
1.7 kg/cap/yr
(6%)
2.3 kg/cap/yr
(44%)
2.7 kg/cap/yr
(69%)
Loamy Silt loam, Clay Loam,
Sandy Clay Loam, Silty
Clay Loam, Silt
0.8 kg/cap/yr
(-50%)
1.3 kg/cap/yr
(-19%)
1.8 kg/cap/yr
(13%)
2.1 kg/cap/yr
(31%)
Clayey Sandy Clay, Silty Clay,
Clay
0.6 kg/cap/yr
(-63%)
0.9 kg/cap/yr
(-44%)
1.3 kg/cap/yr
(-19%)
1.5 kg/cap/yr
(-6%)
An overall summary of the Panel’s recommendations following the framework presented in the Introduction
(Section 1) is provided in Table 14.
Table 14. Summary of nitrogen reduction efficiency and mass loading rates for different components and
zones relevant to a soil-based onsite wastewater system
Component Parameter Recommendation
Exsitu unit 1 (e.g., septic tank) REU1 No TN reduction assumed in septic tank (i.e., STE TN = 5
kg/cap/day).
Exsitu unit 2 (e.g., intermittent
sand filter)
REU2 TN reductions based on CBP approved BMP credits, to
potentially be recommended for modification by the current
BMP Panel.
Insitu Zone 1 (Soil-Based
Treatment)
RZ1 TN reductions of 16% for sandy, 34% for loamy, 54% for clayey
surficial soils.
Insitu Zone 2 (Vadose Zone) RZ2 Assumed low TN reduction (e.g., ≤ 10%) in comparison to
Zones 1 and 3; not explicitly addressed by Panel.
Insitu Zone 3 (Groundwater
Zone)
RZ3 TN reductions of 75% for Low, 60% for Medium, 45% for High
and 35% for Very High TN transmission areas.
Insitu Zone 4 (Transitional
Zones)
RZ4 Assumed significant TN reduction (e.g., 50% or more). Defer to
small stream and riparian processing being addressed by other
CBP efforts at this time.
4.1 ADDITIONAL RECOMMENDATIONS
As described in Section 1.4, the Panel’s work was constrained by challenges which suggest the need for
additional efforts to better characterize nutrient load characteristics of onsite wastewater treatment systems.
Some of the main issues include the following.
Nutrient Attenuation in Onsite Wastewater Treatment Systems - Final Report August 2016
43
1. Nutrient transformations in the subsurface are inherently difficult to characterize. There are a lot of
potentially significant controlling variables and a relative lack of data to adequately characterize systems
and sites. Improving understanding of the factors affecting nutrient processing can be addressed by
additional, deeper literature and existing data review and by collecting new empirical and modeling data.
Information about existing systems and sites within the Chesapeake Bay watershed can largely be
addressed by mining existing data and processing it accordingly, although new information gathering may
also be warranted.
2. Information on phosphorus treatment and attenuation was requested in the original Panel charge,
however the Panel did not have the time or resources to address it. Phosphorus reductions could be
addressed through a reconvening of the Panel. This effort may produce system and site characterization
data (as referenced in #1 above) that could also inform refinement of the TN reduction recommendations
presented in this report.
3. Malfunctioning and legacy systems are not explicitly differentiated in the Panel’s findings and
recommendations, but could and should be addressed. Improvements to these systems (reducing
malfunctions, upgrading legacy systems) could be considered as a future BMP (perhaps a programmatic
BMP for reducing malfunction rates).
4. The time distribution of load delivery is an issue that the Panel discussed and recognizes as potentially
important. There are several questions associated with this issue: 1. What are the long-term system lags
that might impact nutrient loading dynamics? In other words, how long will it take to realize nutrient loads
(and load reductions) from OWTSs and are there nutrient load delivery lags in other sources that might
distort OWTS load estimates? 2. What are the short-term nutrient load delivery dynamics (e.g., how does
load delivery relate to baseflow and stormflow conditions) and how might these inform improved load
characterization and effective management strategies? 3. Can travel time (distance between system and
surface water) be more explicitly represented in Zone 3 TN load reduction estimates?
These four main issues are described in more detail in two main subsections below: activities that the Panel could
address and activities that could be addressed through other CBP-supported research.
4.1.1 Expert Panel Activities
4.1.1.1 Phosphorus
Future work should consider phosphorus transport. There is some evidence that in sandy soils phosphate from
onsite systems can be transported with groundwater (e.g. Humphrey et al. 2014, Humphrey et al. 2015), and the
potential for wastewater-related phosphorus inputs to Chesapeake Bay surface waters should be evaluated.
Additionally, future efforts should consider the implications and effects of P sorption capacity in soils vis-à-vis
historical land uses and nutrient delivery lag times due to sorption/desorption processes.
4.1.1.2 Malfunctioning and legacy systems
The Panel and CBP have not explicitly discriminated between modern and legacy systems in this report. The
Panel should address and document legacy and malfunctioning systems, tighten its definition of conventional
systems including addressing variations among states and local jurisdictions (e.g., gravelless chamber systems
versus conventional gravel-filled trench systems), and provide recommendations about how to handle these
systems in the model and potentially as part of a BMP. The potential time distribution of load delivery as a
function of storm events could be a factor in the development of a future BMP addressing legacy systems or
malfunctioning systems.
4.1.1.3 Additional modeling
Although the results of the supplemental Zone 1 SPARROW runs were inconclusive, SPARROW could be rerun
without using Zone 1 effluent values as inputs, but instead creating a new variable for Zone 1 soil type and
Nutrient Attenuation in Onsite Wastewater Treatment Systems - Final Report August 2016
44
allowing the model to make predictions. Further work could be conducted to explore the statistical significance in
SPARROW outputs when explicitly differentiating between well-drained and poorly-drained soils.
With regard to Zone 3, the Panel should explore reasons behind the difference in SPARROW delivery factors and
statistical measures for OWTS loads averaged over different time periods. Does this result suggest a
transmission delay for nitrogen from OWTS or perhaps the influence of other land uses or sources, or is it just an
artifact of the OWTS loads having increased over time (e.g., as the result of additional development)? With
groundwater travel times often in the tens of years (but variable) there is a possibility that loads attributed to
OWTS actually stem from previous land uses. Since SPARROW does not produce temporal data, we may need
to try some other models in the future to test these issues. For groundwater transportation, MODFLOW may be
able to inform potential lag issues.
Additional SPARROW testing could shed light on the differences between the Georgia and North Carolina
Piedmont data and the SPARROW results, which may have as its explanation another land use or source.
An evaluation of the spatial distribution of OWTS loads versus the 181 calibration sites for SPARROW could
improve understanding of potential data limitations and how they might affect SPARROW analyses. For example,
for the outer coastal plain there are no or very few observations that can serve to compare attenuation estimates
to model results.
The sensitivity of SPARROW to changes in the distribution and magnitude of other source loads could be tested
to strengthen understanding of the model’s utility and limitations.
4.1.2 Other Research Activities: Subwatershed Assessments
Targeted watershed assessments could be used to reassess OWTS nutrient transmission factors, like the studies
reported for Georgia and North Carolina. Using the results of previous and current modeling, the CBP could
identify areas (possibly in different hydrogeomorphic regions) in which OWTS are a substantial fraction of nitrogen
load and support subwatershed studies in these areas.
As mentioned in the Zone 3 write-up, there are limited detailed wastewater plume studies in the Chesapeake Bay
watershed. Future work should therefore aim to better understand the nutrient concentrations and attenuation for
OWTS in the 15 hydrogeomorphic settings documented in the Chesapeake Bay watershed. More information is
needed to understand how much nutrient attenuation varies over space and time in the watershed and how
groundwater and surface water systems interact in the various hydrogeomorphic settings. Intensively monitored
(surface water, groundwater, soil water, residential water use) research sites in the 15 hydrogeomorphic settings
would help to fill a gap in data and understanding.
With detailed soils, water table, residential water use, evapotranspiration, and wastewater and groundwater
quality data, it is possible to consider onsite systems as point sources and using a GIS approach to estimate
watershed-scale nitrogen and phosphorus exports. It would be helpful to select pilot subwatersheds in different
hydrogeomorphic settings and construct detailed water and nutrient budgets to help elucidate interactions
between the water and nutrient cycles. With new technologies in water metering and water quality sensors, a
more comprehensive understanding of how nutrient treatment varies with household water use, wastewater
quality, microbial activity, subsurface residence time, proximity to surface water, water table depth, soils
characteristics, and meteorological conditions could be developed.
In portions of the watershed with shallow water tables, it is possible that geophysical (Humphrey et al. 2013) or
remote sensing approaches could provide useful information on system performance and nutrient attenuation in
the subsurface. As nutrient concentrations tend to decline with distance from the soil-based treatment system,
sites closest to surface waters might be prioritized for further study.
Nutrient Attenuation in Onsite Wastewater Treatment Systems - Final Report August 2016
45
5.0 REFERENCES
Andrews, E. 2008. Map: Chesapeake Bay Watershed Physiography.
http://www.chesapeakebay.net/maps/map/chesapeake_bay_watershed_physiography. Accessed August 15,
2016.
Arthur, J.D., H.A.R. Wood, A.E. Baker, J.R. Cichon, and G.L. Raines. 2007. Development and Implementation of
a Bayesian-based Aquifer Vulnerability Assessment in Florida: Natural Resources Research Journal, v.16, no. 2,
p. 93-107.
Ator, S.W., J.M. Denver, D.E. Krantz, W.L. Newell, and S.K. Martucci. 2005. A Surficial Hydrogeologic
Framework for the Mid-Atlantic Coastal Plain. Professional Paper 1680.
http://pubs.er.usgs.gov/publication/pp1680
Ator, S.W., J.W. Brakebill, and J.D. Blomquist. 2011. Sources, fate, and transport of nitrogen and phosphorus in
the Chesapeake Bay watershed—An empirical model: U.S. Geological Survey Scientific Investigations Report
2011–5167, 27 p. (Also available at http://pubs.usgs.gov/sir/2011/5167/)
Ator, S.W. and J.M. Denver. 2015. Understanding nutrients in the Chesapeake Bay watershed and implications
for management and restoration—the Eastern Shore. U.S. Geological Survey Circular 1406, 72 p.
Bachman, L.J., B.D. Lindsey, J.W. Brakebill, and D.S. Powars. 1998. Ground-water discharge and base-flow
nitrate loads to non-tidal stream, and their relation to a hydrogeomorphic classification of the Chesapeake Bay
watershed, Middle Atlantic Coast: USGS WRIR 98-4059.
Baker, A.E., J.R. Cichon. 2009. FLORIDA AQUIFER VULNERABILITY ASSESSMENT (FAVA II); Prepared for
the Florida Department of Environmental Protection by Advanced GeoSpatial Inc. September 2009
Bradshaw, J.K., D.E. Radcliffe. 2013. Nitrogen fate and transport in a conventional onsite wastewater treatment
system installed in a clay soil: Experimental results. Vadose Zone Journal. doi:10.2136/vzj2012.0149.
Bradshaw, J.K., D.E. Radcliffe, J. Šimůnek, A. Wunsch, and J. McCray. 2013. Nitrogen fate and transport in a
conventional onsite wastewater treatment system installed in a clay soil: A nitrogen chain model. Vadose Zone
Journal. doi:10.2136/vzj2012.0150.
Denver, J.M., S.W. Ator, J.M. Fischer, D.C. Harned, C. Schubert, Z. Szabo. 2014. Water quality in the Northern
Atlantic Coastal Plain surficial aquifer system, Delaware, Maryland, New Jersey, New York, North Carolina, and
Virginia, 1998-2009. USGS Circular 1353.
Geza, M.N. 2010. Soil Treatment Unit Model (STUMOD) Public Release Version 2, July 2010, developed by Dr.
Mengistu Nisrani Geza, Colorado School of Mines. http://www.ndwrcdp.org/research_project_DEC1R06A.asp.
Geza, M.N., K. Lowe, and J. McCray. 2013. STUMOD – A tool for predicting fate and transport of nitrogen in soil
treatment units. Environmental Modeling & Assessment, 19(3), 243-256.
Greene, E.A., A.E. LaMotte, and K. Cullinan. 2005. Ground-water vulnerability to nitrate contamination at multiple
thresholds in the Mid-Atlantic region using spatial probability models: USGS SRI 2004-5118.
Heffernan, J.B., A.R. Albertin, M.L. Fork, B.G. Katz, and M.J. Cohen. 2011. Denitrification and inference of
nitrogen sources in the karstic Floridan Aquifer. Biogeosciences Discuss., 8, 10247–10294, 2011
doi:10.5194/bgd-8-10247-2011
Hinkle, S.R., A.J. Tesoriero 2014. Nitrogen speciation and trends, and prediction of denitrification extent, in
shallow US groundwater. Journal of Hydrology 509 (2014) 343–353
Nutrient Attenuation in Onsite Wastewater Treatment Systems - Final Report August 2016
46
Humphrey, C., J. Jernigan, G. Iverson, B. Serozi, M. O’Driscoll, S. Pradhan, and E. Bean. 2016. Field evaluation
of nitrogen treatment by conventional and single-pass sand filter onsite wastewater systems in the North Carolina
Piedmont. Water, Air, and Soil Pollution 227:255.
Humphrey, C., O’Driscoll, M., Mallinson, D., and Hardison, S. Geophysical and water quality characterization of
on-site wastewater plumes. North Carolina Water Resources Research Institute Report. 86 p.
Humphrey, C., O'Driscoll, M., Deal, N., and Lindbo, D. 2014. Fate and transport of phosphate from an on-site
wastewater system in Beaufort County, North Carolina. Journal of Environmental Health 76(6):28-33
Humphrey, C., Anderson-Evans, E., O’Driscoll, M., Manda, A., and Iverson, G. 2015. Comparison of phosphorus
concentrations in Coastal Plain watersheds served by onsite wastewater treatment systems and a municipal
sewer treatment system. Water, Air, and Soil Pollution 226:1-18.
Iverson, G., M.A. O’Driscoll, C.P. Humphrey, A.K. Manda, and E. Anderson-Evans. 2015. Wastewater nitrogen
contributions to Coastal Plain watersheds, NC, USA. Water, Air and Soil Pollution. doi:10.1007/sll270-015-2574-4
Johnson, G.C., T.M. Zimmerman, B.D. Lindsey, and E.L. Gross. 2011. Factors affecting groundwater quality in
the Valley and Ridge aquifers, eastern United States, 1993-2002: U.S. Geological Survey Scientific Investigations
Report 2011–5115, 70 p.
Katz, B.G. M.P. Berndt, and C.A. Crandall. 2014. Factors affecting the movement and persistence of nitrate and
pesticides in the surficial and upper Floridan aquifers in two agricultural areas in the southeastern United States.
Environmental Earth DOI: 10.1007/s12665-01302657-8
Krantz, D.E. and D.S. Powars. 2000. Hydrogeologic setting and potential for denitrification in groundwater,
Coastal Plain of Southern Maryland. U.S. Geological Survey WRI Report 00-4051, 19 p.
Lindbo, D.L., J. Lynn, K. Neal, G. Young, and A. Amoozegar. 2007. Applying soil morphology to long term
acceptance rate determination. In K. Mancl (ed.). Eleventh individual and small community sewage systems
conference proceedings, Warwick, RI, 20-24 October, 2007, ASABE Publication 701P1107, St Joseph, MI.
Lindsey, B.D., S.W. Phillips, C.A. Donnelly, G.K. Speiran, L.N. Plummer, J.K. Bohlke, M.J. Focazio, W.C. Burton,
and E. Busenberg. 2003. Residence times and nitrate transport in ground water discharging to streams in the
Chesapeake Bay Watershed. Water-Resources Investigations Report 2003-4035
Lindsey, D.B., T.M. Zimmerman, M.J. Chapman, C.A. Cravotta III, and Z. Szabo, 2014. The quality of our Nation’s
waters. Water quality in the Principal Aquifers of the Piedmont, Blue Ridge, and Valley and Ridge regions, eastern
United States, 1993-2009: U.S. Geological Survey Circular 1354 (http://dx.doi.org/10.3133/cir1354.pdf
McCray, J., K. Lowe, M. Geza, J. Drewes, S. Roberts, A. Wunsch, D. Radcliffe, J. Amador, J. Atoyan, T. Boving,
D. Kalen, and G. Loomis. 2008. Development of quantitative tools to determine the expected performance of unit
processes in wastewater soil treatment units: Literature review. Report no. DEC1R06. Water Environmental
Research Foundation, Alexandria, VA.
McCray J.E., M. Geza M., K.S. Lowe, et al. 2010. Quantitative Tools to Determine the Expected Performance of
Wastewater Soil Treatment Units. Water Environ. Res. Foundation, DEC1R06. 474 p.
http://www.ndwrcdp.org/research_project_DEC1R06A.asp
McMahon, P.B., and F.H. Chapelle. 2008. Redox Processes and Water Quality of Selected Principal Aquifer
Systems. GROUND WATER Vol. 46, No. 2 (pages 259–271)
Merz, C., J. Steidl, R. Dannowski. 2009. Parameterization and regionalization of redox based denitrification for
GIS-embedded nitrate transport modeling in Pleistocene aquifer systems. Environmental Geology October 2009,
Volume 58, Issue 7, pp 1587-1599
Nutrient Attenuation in Onsite Wastewater Treatment Systems - Final Report August 2016
47
Nolan, B.T. 2001. Relating nitrogen sources and aquifer susceptibility to nitrate in shallow groundwater of the
United States. Ground Water Vol 39(2) 290-299
NRCS. 2015. Soil temperature regimes of the contiguous United States. Natural Resource Conservation Service.
Online at http://www.nrcs.usda.gov/wps/portal/nrcs/detail/soils/use/maps/?cid=nrcs142p2_053998 (verified
6/21/2015).
O’Driscoll, M., C. Humphrey, N. Deal, D. Lindbo, and M. Zarate-Bermudez. 2014. Meteorological influences on
nitrogen dynamics of a coastal onsite wastewater treatment system. Journal of Environmental Quality 43(6):1873-
1885.
Puckett, L.J., A.J. Tesoriero, N.M. Dubrovsky. 2011. Nitrogen Contamination of Surficial Aquifers--A Growing
Legacy. Environ. Sci. Technol. 2011, 45, 839–844
Radcliffe, D.E., and L.T. West. 2009. Design hydraulic loading rates for onsite wastewater systems. Vadose Zone
J. 8:64-74.
Reay, W.G. 2004. Septic Tank Impacts on Groundwater Quality and Nearshore Sediment Nutrient Flux.
Groundwater 42 (7): 1079-1089.
Sanford, W.E., and J.P. Pope. 2013. Quantifying Groundwater’s Role in Delaying Improvements to Chesapeake
Bay Water Quality. Environ. Sci. Technol. 2013, 47, 13330−13338; dx.doi.org/10.1021/es401334k
Schaap, M.G., and F.J. Leij. 1998. Database-related accuracy and uncertainty of pedotransfer functions. Soil Sci.
163:765-779.
Šimůnek, J., M.Th. Van Genuchten, and M. Šejna. 2011. The HYDRUS software package for simulating two- and
three-dimensional movement of water, heat, and multiple solutes in variably-saturated media. Version 2.0,
Technical manual. PC Progress, Prague, Czech Republic.
State of Idaho. 2014. Onsite System Surface Water Separation Distance Determination Guidance Modeling
Phosphorus in the Environment as the Critical Constituent. State of Idaho Department of Environmental Quality
Technical Services Division. June 2014.
Tesoriero, A.J., and L.J. Puckett. 2011. O2 reduction and denitrification rates in shallow aquifers. WATER
RESOURCES RESEARCH, VOL. 47, W12522, doi:10.1029/2011WR010471
Tesoriero, A.J., S. Terziotti, and D.B. Abrams. 2015. Predicting Redox Conditions in Groundwater at a Regional
Scale. Environ. Sci. Technol. 49, 9657−9664. DOI: 10.1021/acs.est.5b01869
Tetra Tech. 2013. North Carolina Piedmont Nutrient Load Reducing Measures Technical Report. Prepared for
Piedmont Triad Regional Council, NC Division of Water Quality, Nutrient Science Advisory Board BMP
Subcommittee. Tetra Tech. September 2013.
USGS. 2016. SPARROW Surface Water-Quality Modeling. United States Geological Survey (USGS).
http://water.usgs.gov/nawqa/sparrow/. Accessed August 15, 2016.
van der Velde, Y., G.H. de Rooij, J.C. Rozemeijer, F.C. van Geer, and H.P. Broers. 2010. Nitrate response of a
lowland catchment: On the relation between stream concentration and travel time distribution dynamics. WATER
RESOURCES RESEARCH, VOL. 46, W11534, doi:10.1029/2010WR009105, 2010
Weiskel, P.K. and B.L. Howes. 1991. Quantifying dissolved nitrogen flux through a coastal watershed. Water
Resources Research 21: 2929-2939
Valiela, I., G. Collins, J. Kremer, K. Lajtha, M. Geist, B. Seely, J. Brawley, and C.H. Sham. 1997. Nitrogen loading
from coastal watersheds to receiving estuaries: New method and application. Ecological Applications 7:358-380.
Valiela, I., M. Geist, J. McClelland, and G. Tomaksy. 2000. Nitrogen loading from watersheds to estuaries:
verification of the Waquoit Bay Nitrogen Loading Model. Biogeochemistry 49:277-293.
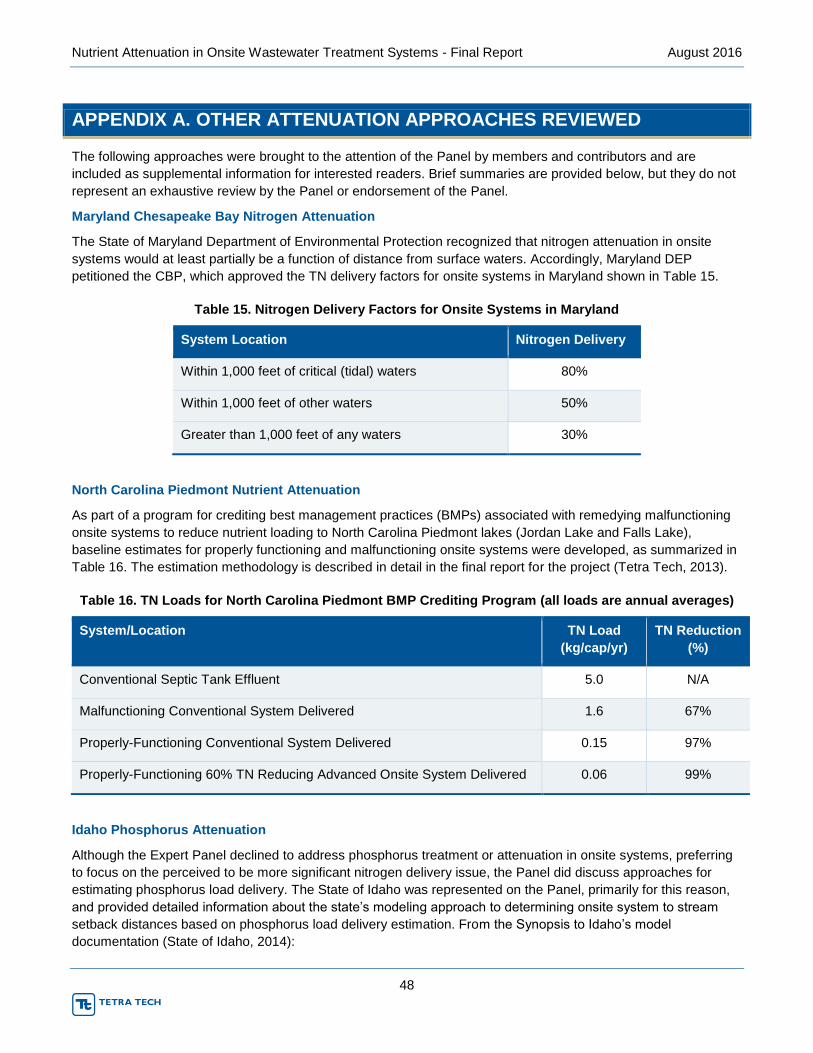
Nutrient Attenuation in Onsite Wastewater Treatment Systems - Final Report August 2016
48
APPENDIX A. OTHER ATTENUATION APPROACHES REVIEWED
The following approaches were brought to the attention of the Panel by members and contributors and are
included as supplemental information for interested readers. Brief summaries are provided below, but they do not
represent an exhaustive review by the Panel or endorsement of the Panel.
Maryland Chesapeake Bay Nitrogen Attenuation
The State of Maryland Department of Environmental Protection recognized that nitrogen attenuation in onsite
systems would at least partially be a function of distance from surface waters. Accordingly, Maryland DEP
petitioned the CBP, which approved the TN delivery factors for onsite systems in Maryland shown in Table 15.
Table 15. Nitrogen Delivery Factors for Onsite Systems in Maryland
System Location Nitrogen Delivery
Within 1,000 feet of critical (tidal) waters 80%
Within 1,000 feet of other waters 50%
Greater than 1,000 feet of any waters 30%
North Carolina Piedmont Nutrient Attenuation
As part of a program for crediting best management practices (BMPs) associated with remedying malfunctioning
onsite systems to reduce nutrient loading to North Carolina Piedmont lakes (Jordan Lake and Falls Lake),
baseline estimates for properly functioning and malfunctioning onsite systems were developed, as summarized in
Table 16. The estimation methodology is described in detail in the final report for the project (Tetra Tech, 2013).
Table 16. TN Loads for North Carolina Piedmont BMP Crediting Program (all loads are annual averages)
System/Location TN Load
(kg/cap/yr)
TN Reduction
(%)
Conventional Septic Tank Effluent 5.0 N/A
Malfunctioning Conventional System Delivered 1.6 67%
Properly-Functioning Conventional System Delivered 0.15 97%
Properly-Functioning 60% TN Reducing Advanced Onsite System Delivered 0.06 99%
Idaho Phosphorus Attenuation
Although the Expert Panel declined to address phosphorus treatment or attenuation in onsite systems, preferring
to focus on the perceived to be more significant nitrogen delivery issue, the Panel did discuss approaches for
estimating phosphorus load delivery. The State of Idaho was represented on the Panel, primarily for this reason,
and provided detailed information about the state’s modeling approach to determining onsite system to stream
setback distances based on phosphorus load delivery estimation. From the Synopsis to Idaho’s model
documentation (State of Idaho, 2014):
Nutrient Attenuation in Onsite Wastewater Treatment Systems - Final Report August 2016
49
The Phosphorus-Based Onsite Separation Determination Model (POSDM) is a technical and scientific
means to determine separation distances from surface water for domestic subsurface sewage disposal
(SSD) systems. This software tool takes into account effluent quality, drainfield characteristics, aquifer
characteristics, ground water quality, and surface water body characteristics to calculate an appropriate
separation distance from surface water. The model only addresses phosphorus (P) as the constituent of
concern. Prior to using this model, landowners and/or their consultants must consider other wastewater
constituents, such as nitrate and pathogens, and obtain a determination from the Idaho Department of
Environmental Quality (DEQ) that the other wastewater constituents are deemed insignificant.
The model consists of three stages corresponding to the effluent (and thus the contaminate transport)
flow path:
1. Effluent application to the drainfield and soil sorption (removal) of P from effluent
2. Mixing of percolate discharging from the drainfield with ground water, and the subsequent
transport along the ground water flow path
3. Mixing of ground water discharging into the receiving surface water body.
The first stage of the model predicts how much P can be sorbed to the soils beneath the distribution field
before the soil P sorption capacity is fully utilized. The model also estimates the P concentration and
volume of percolate discharging to ground water. The higher the P fixing capacity of the soil, the longer
the site can be utilized.
The second stage of the model predicts resulting P concentrations as ground water and percolate from
the drainfield mix. As ground water travels downgradient from the drainfield, P concentrations change
both with distance and depth.
The resulting P concentration in ground water as it encounters a surface water body is used for the third
stage of the model. The third stage of the model consists of estimating the resulting P impacts to the
surface water body as ground water discharges into, and mixes with, the surface water body.
Several possible compliance points can be considered with this model. These include (a) a drainfield site
life based on the P sorption capacity of the soils; (b) a maximum P concentration of percolate discharging
from the drainfield; (c) a maximum ground water P concentration a specified distance downgradient of the
drainfield; (d) a mass discharge amount into a surface water body; or (e) a maximum P concentration in a
surface water body after mixing with discharging ground water.
The POSDM design is a series of user-friendly spreadsheets where the required information can be
easily entered, and determination of appropriate separation distances to surface water calculated and
clearly displayed. The theory behind the model is complex. Consequently, parameter selection and model
use should only be pursued by environmental professionals (such as a professional engineer or
geologist) with expertise in environmental system modeling.