Embed Size (px)
DESCRIPTION
Â
Citation preview
NURSING HOMES
Private Investment Homes Sometimes Differed from Others in Deficiencies, Staffing, and Financial Performance
Report to Congressional Requesters
July 2011
GAO-11-571
United States Government Accountability Office
GAO
United States Government Accountability Office
Highlights of GAO-11-571, a report to congressional requesters
July 2011
NURSING HOMES Private Investment Homes Sometimes Differed from Others in Deficiencies, Staffing, and Financial Performance
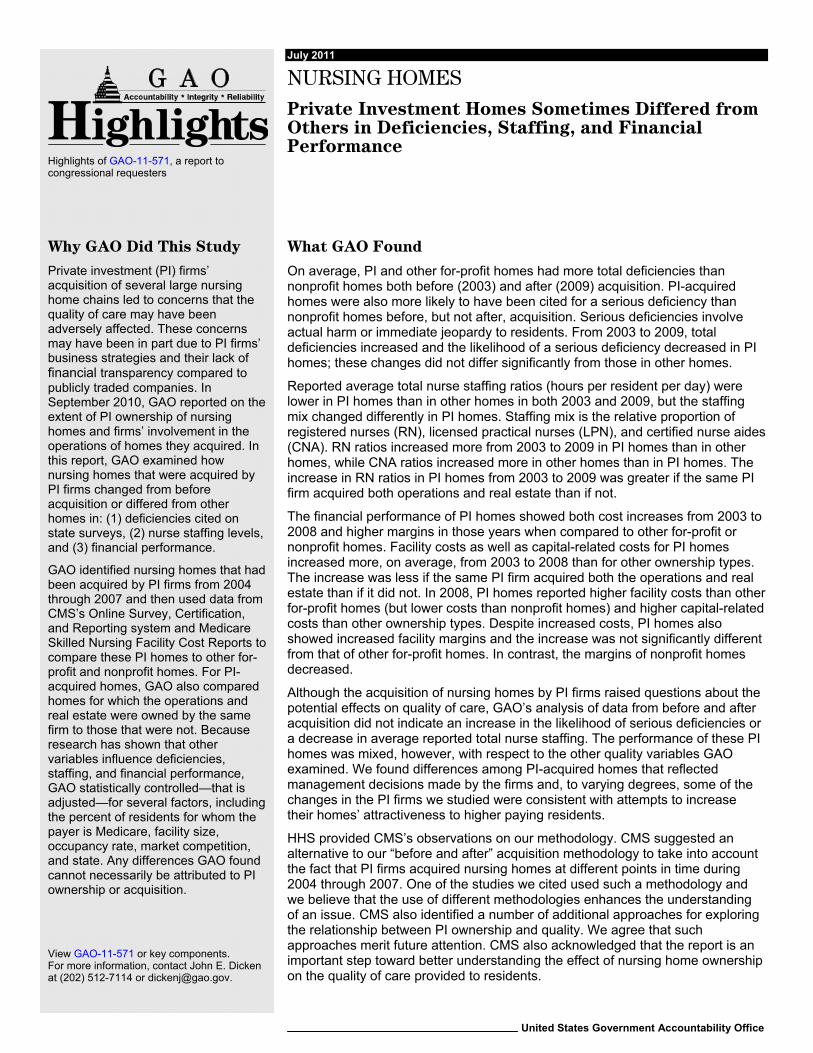
Why GAO Did This Study
Private investment (PI) firms’ acquisition of several large nursing home chains led to concerns that the quality of care may have been adversely affected. These concerns may have been in part due to PI firms’ business strategies and their lack of financial transparency compared to publicly traded companies. In September 2010, GAO reported on the extent of PI ownership of nursing homes and firms’ involvement in the operations of homes they acquired. In this report, GAO examined how nursing homes that were acquired by PI firms changed from before acquisition or differed from other homes in: (1) deficiencies cited on state surveys, (2) nurse staffing levels, and (3) financial performance.
GAO identified nursing homes that had been acquired by PI firms from 2004 through 2007 and then used data from CMS’s Online Survey, Certification, and Reporting system and Medicare Skilled Nursing Facility Cost Reports to compare these PI homes to other for-profit and nonprofit homes. For PI-acquired homes, GAO also compared homes for which the operations and real estate were owned by the same firm to those that were not. Because research has shown that other variables influence deficiencies, staffing, and financial performance, GAO statistically controlled—that is adjusted—for several factors, including the percent of residents for whom the payer is Medicare, facility size, occupancy rate, market competition, and state. Any differences GAO found cannot necessarily be attributed to PI ownership or acquisition.
What GAO Found
On average, PI and other for-profit homes had more total deficiencies than nonprofit homes both before (2003) and after (2009) acquisition. PI-acquired homes were also more likely to have been cited for a serious deficiency than nonprofit homes before, but not after, acquisition. Serious deficiencies involve actual harm or immediate jeopardy to residents. From 2003 to 2009, total deficiencies increased and the likelihood of a serious deficiency decreased in PI homes; these changes did not differ significantly from those in other homes.
Reported average total nurse staffing ratios (hours per resident per day) were lower in PI homes than in other homes in both 2003 and 2009, but the staffing mix changed differently in PI homes. Staffing mix is the relative proportion of registered nurses (RN), licensed practical nurses (LPN), and certified nurse aides (CNA). RN ratios increased more from 2003 to 2009 in PI homes than in other homes, while CNA ratios increased more in other homes than in PI homes. The increase in RN ratios in PI homes from 2003 to 2009 was greater if the same PI firm acquired both operations and real estate than if not.
The financial performance of PI homes showed both cost increases from 2003 to 2008 and higher margins in those years when compared to other for-profit or nonprofit homes. Facility costs as well as capital-related costs for PI homes increased more, on average, from 2003 to 2008 than for other ownership types. The increase was less if the same PI firm acquired both the operations and real estate than if it did not. In 2008, PI homes reported higher facility costs than other for-profit homes (but lower costs than nonprofit homes) and higher capital-related costs than other ownership types. Despite increased costs, PI homes also showed increased facility margins and the increase was not significantly different from that of other for-profit homes. In contrast, the margins of nonprofit homes decreased.
Although the acquisition of nursing homes by PI firms raised questions about the potential effects on quality of care, GAO’s analysis of data from before and after acquisition did not indicate an increase in the likelihood of serious deficiencies or a decrease in average reported total nurse staffing. The performance of these PI homes was mixed, however, with respect to the other quality variables GAO examined. We found differences among PI-acquired homes that reflected management decisions made by the firms and, to varying degrees, some of the changes in the PI firms we studied were consistent with attempts to increase their homes’ attractiveness to higher paying residents.
HHS provided CMS’s observations on our methodology. CMS suggested an alternative to our “before and after” acquisition methodology to take into account the fact that PI firms acquired nursing homes at different points in time during 2004 through 2007. One of the studies we cited used such a methodology and we believe that the use of different methodologies enhances the understanding of an issue. CMS also identified a number of additional approaches for exploring the relationship between PI ownership and quality. We agree that such approaches merit future attention. CMS also acknowledged that the report is an important step toward better understanding the effect of nursing home ownership on the quality of care provided to residents.
View GAO-11-571 or key components. For more information, contact John E. Dicken at (202) 512-7114 or [email protected].
Page i GAO-11-571 Private Investment Nursing Home Ownership
Letter 1
Background 7 PI Homes Had More Total Deficiencies than Nonprofit Homes and
Were More Likely to Have Had a Serious Deficiency Before but Not After Acquisition 16
Reported Total Nurse Staffing Ratios Were Lower in PI Homes, but Reported RN Ratios Increased More in PI Homes than Other Homes 20
PI Homes’ Financial Performance Showed Cost Increases and Higher Facility Margins Compared to Other Homes 27
Concluding Observations 35 Agency Comments and Our Evaluation 36
Appendix I Scope and Methodology 40
Appendix II Comments from the Department of Health and Human Services 62
Appendix III GAO Contact and Staff Acknowledgments 65
Related GAO Products 66
Tables
Table 1: Scope and Severity of Deficiencies Identified during Nursing Home Surveys 43
Table 2: Variables Included in Our Datasets 48 Table 3: Unadjusted Average Reported RN Ratios (Hours per
Resident per Day) 51 Table 4: Results of Analysis of Reported RN Ratios Using a Panel
Model without Adjusting for Control Variables 52 Table 5: Results of Analysis of Reported RN Ratios Using a Panel
Model When Adjusting for Control Variables 53 Table 6: Differences in Deficiencies, Nurse Staffing Ratios, and
Financial Performance Identified in Comparisons of Adjusted Data 55
Contents

Page ii GAO-11-571 Private Investment Nursing Home Ownership
Figures
Figure 1: Total Deficiencies in PI, Other For-Profit, and Nonprofit Homes, 2003 and 2009 17
Figure 2: Serious Deficiencies in PI, Other For-Profit, and Nonprofit Homes, 2003 and 2009 19
Figure 3: Total Reported Nurse Staffing Ratios for PI, Other For- Profit, and Nonprofit Homes, 2003 and 2009 21
Figure 4: RN Ratios Reported for PI, Other For-Profit, and Nonprofit Homes, 2003 and 2009 23
Figure 5: RN Ratios for Homes for which the Same PI Firm Acquired Both the Operations and the Real Estate Compared to Homes for which the Same PI Firm Did Not Acquire Both, 2003 and 2009 24
Figure 6: CNA Ratios Reported for PI, Other For-Profit, and Nonprofit Homes, 2003 and 2009 26
Figure 7: Facility Costs per Resident Day for PI, Other For-Profit, and Nonprofit Homes, 2003 and 2008 28
Figure 8: Facility Costs per Resident Day for Homes for which the Same PI Firm Acquired Both the Operations and the Real Estate Compared to Homes for which the Same PI Firm Did Not Acquire Both, 2003 and 2008 29
Figure 9: Capital-Related Costs per Resident Day for PI, Other For- Profit, and Nonprofit Homes, 2003 and 2008 31
Figure 10: Capital-Related Costs per Resident Day for Homes for which the Same PI Firm Acquired Both the Operations and the Real Estate Compared to Homes for which the Same PI Firm Did Not Acquire Both, 2003 and 2008 32
Figure 11: Facility Margins for PI, Other For-Profit, and Nonprofit Homes, 2003 and 2008 34
Page iii GAO-11-571 Private Investment Nursing Home Ownership
Abbreviations CMS Centers for Medicare & Medicaid Services CNA certified nurse aide HHS Department of Health and Human Services LPN licensed practical nurse OSCAR Online Survey, Certification, and Reporting system PI private investment RN registered nurse SNF skilled nursing facility
This is a work of the U.S. government and is not subject to copyright protection in the United States. The published product may be reproduced and distributed in its entirety without further permission from GAO. However, because this work may contain copyrighted images or other material, permission from the copyright holder may be necessary if you wish to reproduce this material separately.
Page 1 GAO-11-571 Private Investment Nursing Home Ownership
United States Government Accountability Office
Washington, DC 20548
July 15, 2011
The Honorable Max Baucus Chairman Committee on Finance United States Senate
The Honorable Charles E. Grassley Ranking Member Committee on the Judiciary United States Senate
The Honorable Pete Stark Ranking Member Subcommittee on Health Committee on Ways and Means House of Representatives
The acquisition by private investment (PI) firms of several large nursing home chains led to congressional and media attention in 2007 stemming from concerns that the quality of resident care may have been adversely affected.1 For example, a 2007 New York Times article reported that PI firms had reduced nursing home costs and increased profitability by cutting registered nurse (RN) staffing.2 These concerns may have been due in part to PI firms’ business strategies and their lack of financial transparency compared to publicly traded companies. PI firms may hold their investments for relatively short time frames while they attempt to improve financial and operating performance. In addition, they may place large levels of debt on the acquired company. Since the ownership interests of PI firms generally are not publicly traded on a stock
1See, for example, Nursing Home Transparency and Improvement, Hearing Before the Special Committee on Aging, U.S. Senate, Nov. 15, 2007, Serial No. 110-17, U.S. Government Printing Office (Washington, D.C.: 2008). In the Hands of Strangers: Are Nursing Home Safeguards Working?, Hearing Before the Subcommittee on Oversight and Investigations, Committee on Energy and Commerce, U.S. House of Representatives, May 15, 2008, Serial No. 110-116, U.S. Government Printing Office (Washington, D.C.: 2008).
2See C. Duhigg, “At Many Homes, More Profit and Less Nursing,” The New York Times (Sept. 23, 2007). Conversely, a subsequent study found little evidence to suggest that nursing home quality worsens significantly following PI acquisition. See D. Stevenson and D. Grabowski, “Private Equity Investment and Nursing Home Care: Is it a Big Deal?” Health Affairs, vol. 27, no. 5 (2008).

Page 2 GAO-11-571 Private Investment Nursing Home Ownership
exchange, the nursing home companies acquired by such firms are not subject to the same federal financial disclosure requirements, making their finances and management less transparent than publicly traded companies.3
Together, the Medicare and Medicaid programs funded about $89 billion for nursing home care for elderly and disabled individuals in 2009.4 Medicaid, which funds about two-thirds of all nursing home resident days, pays for individuals who typically require long-term custodial care, such as help with bathing and toileting. Medicare, which funds about 12 percent of nursing home resident days, pays for individuals who require more intensive skilled care for a relatively short period of time following a hospital stay.5 The Centers for Medicare & Medicaid Services (CMS) oversees both programs and contracts with state survey agencies to conduct inspections, known as standard surveys, and complaint investigations to determine whether nursing homes that participate in the Medicare and Medicaid programs are complying with federal quality standards. State surveyors cite deficiencies when a nursing home is found to be out of compliance with these standards, which include a requirement that homes have sufficient nursing staff. Research has shown both deficiencies and nurse staffing levels to be indicators of the quality of care in nursing homes.6
You asked us to examine the impact of PI ownership on the quality of care provided and on nursing homes’ financial performance. This report builds on our September 2010 report, which addressed the extent of PI
3The Securities and Exchange Commission requires publicly traded companies to disclose financial and other information to the public to inform investment decisions.
4Medicare is the federal health care financing program for the elderly and disabled individuals and individuals with end stage renal disease. Medicaid is the joint federal-state health care financing program for certain categories of low income individuals.
5The Medicare program covers skilled care or rehabilitation in a nursing home for up to 100 days following a medically necessary hospital stay of at least 3 days. While about 3 million individuals received care in a nursing home at some point during 2008, there were approximately 1.5 million nursing home residents on any given day.
6Because deficiencies and nurse staffing are linked with quality of care, CMS uses both measures in its Five-Star Quality Rating System for nursing homes. CMS’s Five-Star System provides an overall quality rating of nursing homes in which every nursing home in the United States is rated from one (much below average) to five (much above average) stars. See GAO, Nursing Homes: CMS’s Special Focus Facility Methodology Should Better Target the Most Poorly Performing Homes, Which Tended to Be Chain Affiliated and For-Profit, GAO-09-689 (Washington, D.C.: Aug. 28, 2009).

Page 3 GAO-11-571 Private Investment Nursing Home Ownership
ownership of nursing homes and the involvement of PI firms in the operations of homes they acquired.7 We reported that PI firms acquired about 1,900 unique nursing homes from 1998 through 2008.8 In this report, we examine how nursing homes that were acquired by PI firms changed from before acquisition or differed from other homes with regard to (1) health deficiencies cited on state surveys, (2) nurse staffing levels, and (3) financial performance.
To determine whether PI-owned nursing homes changed from before acquisition or differed from other nursing homes in deficiencies, nurse staffing levels, or financial performance, we (1) identified nursing homes that had been acquired by PI firms from 2004 through 2007 and (2) compared data from before and after PI acquisition of these homes to data from other for-profit and nonprofit homes.9 The PI homes we studied were acquired by the top 10 PI acquirers of nursing homes we identified in our September 2010 report and were still owned by the same PI firm in 2009.10 We included homes for which a PI firm acquired the operations, the real estate, or both. We obtained data for our outcome variables from CMS: deficiency and nurse staffing data came from CMS’s Online Survey, Certification, and Reporting system (OSCAR) and data regarding financial performance came from Medicare Skilled Nursing Facility (SNF)
7See GAO, Nursing Homes: Complexity of Private Investment Purchases Demonstrates Need for CMS to Improve the Usability and Completeness of Ownership Data, GAO-10-710 (Washington, D.C.: Sept. 30, 2010).
8These PI acquisitions represented about 12 percent of the approximately 16,000 nursing homes that participated in the Medicare and Medicaid programs as of December 2008.
9We chose 2004 through 2007 because these were the years when the greatest number (more than 1,800) of nursing homes was acquired by PI firms. Specifically, 595 nursing homes were acquired by PI firms in 2004, 39 in 2005, 682 in 2006, and 525 in 2007. See GAO-10-710. We excluded (1) nursing homes that were hospital-based or government owned in 2009 because they differed from other homes in important ways, including resident needs and financial performance; (2) homes that were not certified by Medicare in 2009 because almost all homes owned by the PI firms were Medicare-certified; (3) homes for which we did not have data from both before and after our target acquisition period (2004 through 2007); and (4) homes for which extreme values suggested data entry or other reporting errors.
10See GAO-10-710. This report determined the top 10 PI acquirers of nursing homes based on the number of homes purchased by firms from 1998 through 2008. These top 10 PI acquirers accounted for almost 90 percent of nursing homes acquired by PI firms during these 11 years.
Page 4 GAO-11-571 Private Investment Nursing Home Ownership
Cost Reports.11 OSCAR is the only national, uniform data source that contains data on nursing home deficiencies and nurse staffing. Medicare SNF Cost Reports are the only publicly available source of financial data on most Medicare providers.
Deficiencies. We examined total deficiencies and whether there were any “serious” deficiencies using data from both standard surveys and complaint investigations.12 Deficiencies are categorized into levels according to the number of residents potentially or actually affected and the degree of relative harm involved. Serious deficiencies are those at the levels indicating actual harm or immediate jeopardy (actual or potential death or serious injury). As we have noted in prior reports, state surveys may underestimate deficiencies.13
Nurse staffing. We examined the total number of nursing hours per
resident per day (nurse staffing ratios), as well as ratios for each of three types of nursing staff separately—RNs, licensed practical nurses (LPN), and certified nurse aides (CNA). Nurse staffing data are self-reported by nursing homes.
Financial performance. We examined (1) facility costs per resident
day, defined as the total facility costs—including both operating and capital costs—divided by total resident days; (2) capital-related costs per resident day, defined as capital-related costs allocated to nursing home resident care divided by nursing home resident days; and (3) facility margins, defined as the amount of total facility revenues
11A skilled nursing facility (SNF) provides skilled nursing care and participates in the Medicare program. SNFs are required to submit annual cost reports to CMS.
12State surveys evaluate both the quality of care provided to residents—the health portion of the survey—and compliance with federal fire safety standards. Our analysis excluded deficiencies cited during the fire safety portion of surveys.
13See GAO, Nursing Homes: Some Improvement Seen in Understatement of Serious Deficiencies, but Implications for the Longer-Term Trend Are Unclear, GAO-10-434R (Washington, D.C.: Apr. 28, 2010); Nursing Homes: Addressing the Factors Underlying Understatement of Serious Care Problems Requires Sustained CMS and State Commitment, GAO-10-70 (Washington, D.C.: Nov. 24, 2009); and Nursing Homes: Federal Monitoring Surveys Demonstrate Continued Understatement of Serious Care Problems and CMS Oversight Weaknesses, GAO-08-517 (Washington, D.C.: May 9, 2008).
Page 5 GAO-11-571 Private Investment Nursing Home Ownership
exceeding total facility costs, divided by total facility revenues.14 Financial data are self-reported by nursing homes.
Data analyses. To determine whether the PI, other for-profit, and nonprofit homes we studied differed from one another, we analyzed data from two points in time, one before and one after our target acquisition period of 2004 to 2007. In general, we analyzed data from 2003 and 2009 (for deficiencies and staffing) or 2003 and 2008 (for financial performance).15 The 2008 and 2009 data were the latest available, which allowed as much time as possible for any changes associated with PI acquisition to take effect. We included data from before PI acquisition so we could determine whether the post acquisition data reflected preexisting differences. Throughout this report, we refer to the homes that were acquired by PI firms as “PI homes,” even when referring to 2003, which preceded our target acquisition period. We included data from other types of nursing homes so we could determine whether any changes from before to after acquisition reflected changes that occurred regardless of type of ownership. For PI-acquired homes, we also compared homes for which the operations and real estate were owned by the same firm to those that were not. Because research has shown that other variables can influence deficiencies, staffing, and financial performance, we statistically controlled—that is adjusted—for these variables when analyzing our data. This adjustment allowed us to examine data from homes with different types of ownership after neutralizing the effect of these variables. Our control variables included membership in a chain, payer mix (i.e., the percent of residents for whom the payer is Medicare, Medicaid, or another source), facility size (number of beds), occupancy rate, market competition (based on the number of beds in each county), and geographic location (state).16 Payers other than Medicare and Medicaid include private insurance, religious organizations,
14Facility and capital-related costs were adjusted for inflation. Capital-related costs included mortgage payments, rents, depreciation, taxes, and insurance, as well as land and building improvements, including upgrades to equipment.
15Deficiency and staffing data were from the calendar year, whereas financial performance data reflect the provider’s fiscal year. We used financial data from 2008 rather than 2009 because Medicare SNF Cost Report data from 2009 were not available at the time we collected our data.
16Chain affiliation is indicated in OSCAR by a nursing home’s self-reported multi-nursing home (chain) ownership. Multi-nursing home chains are defined as having two or more homes under one owner or operator.
Page 6 GAO-11-571 Private Investment Nursing Home Ownership
the Department of Veterans Affairs, residents who pay for their own care, and others. Unless otherwise specified, all results that we present are based on our adjusted analyses and are statistically significant at the 0.05 level. To provide context, we show the unadjusted values in our figures and also describe the key differences that were significant in our analyses of adjusted data.
In addition, to determine whether there were systematic differences among nursing homes acquired by PI firms from 2004 to 2007 in outcomes we studied, we conducted a series of analyses in which we separately compared each of five PI firms’ homes to all other PI-acquired nursing homes in our study. We restricted our analyses to those PI firms and homes for which we could identify both the PI owner of operations and real estate and those PI firms for which we determined we had data from a sufficient number of homes.17
For three PI firms’ homes, the same PI firm acquired both operations and real estate.
For two PI firms that acquired nursing home operations, a different PI
firm acquired the real estate. In each of five separate analyses, we compared the homes owned by a PI firm to all other PI homes in our larger aggregate analysis, including homes owned by the other firms we studied and any other homes owned by that PI firm (e.g., those for which we could not identify the real estate owner). Again, we adjusted for other variables that can influence deficiencies, staffing, and financial performance. Unless otherwise specified, all results that we present were statistically significant at the 0.05 level in analyses of adjusted data. We also interviewed representatives of PI firms that acquired nursing home operations, real estate, or both, and representatives of companies that operate PI-owned homes and, if their homes were part of our firm level analyses, we discussed the results for their homes.
For all analyses, we excluded nursing homes when extreme values suggested data entry or other reporting errors. We performed data reliability checks on the list of PI homes we compiled and on data we used from OSCAR, Medicare’s Provider of Services, and Medicare SNF
17For several PI firms, these restrictions led us to analyze a subset of all homes owned by the PI firm. As a result, information about homes included in these analyses may not be representative of other homes owned by the PI firm.
Page 7 GAO-11-571 Private Investment Nursing Home Ownership
Cost Reports. We also reviewed relevant documentation and discussed these data sources with knowledgeable officials and industry experts. In addition to our statistical analyses, we reviewed published research on the quality and costs of nursing home care, our prior work on nursing homes, and other relevant documentation. We interviewed officials from CMS and experts on nursing home quality and costs. We reviewed all data for soundness and consistency and determined that they were sufficiently reliable for our purposes.
Limitations. Our analyses have several important limitations. Our findings cannot be generalized beyond the PI-acquired nursing homes we studied, which were limited to only those homes acquired from 2004 to 2007 by the 10 largest PI acquirers of nursing homes. Because they may have been caused by other uncontrolled and unquantified variables, the differences between PI-acquired and other nursing homes that we observed cannot necessarily be attributed to PI ownership and the differences we observed from before to after acquisition cannot necessarily be attributed to PI acquisition. Despite these limitations, our analyses do provide a reasonable basis for comparing deficiencies, nurse staffing, and financial performance of the PI-owned homes we studied to each other and to other types of nursing homes at two points in time.
We conducted this performance audit from January 2010 to July 2011 in accordance with generally accepted government auditing standards. Those standards require that we plan and perform the audit to obtain sufficient, appropriate evidence to provide a reasonable basis for our findings and conclusions based on our audit objectives. We believe that the evidence obtained provides a reasonable basis for our findings and conclusions based on our audit objectives. A more detailed description of our scope and methodology can be found in appendix I.
Over the last decade, nursing home ownership and operating structures have continued to evolve, including an increase in private investment ownership of nursing homes and the development of more complex structures.
Nursing home ownership varies in terms of profit status, level of management involvement, number of homes owned, and whether the real estate of homes is owned or leased.
Profit status. Owners may be for-profit, nonprofit, or government entities; about two-thirds of nursing homes are for-profit businesses. In general, for-profit businesses, which may be publicly traded or
Background
Nursing Home Ownership and Operations
Page 8 GAO-11-571 Private Investment Nursing Home Ownership
privately owned, have a goal of making profits that are distributed among the owners and stockholders. In contrast, a nonprofit entity receives favorable tax status because it may not operate for the benefit of nor distribute revenues to private interests.
Management involvement. Nursing home owners vary in terms of their
involvement in management of the business: they may be the operators, and hold the state license, or they may contract with separate licensed entities to manage the day-to-day operations.
Number of homes owned. Owners or operators may have only one
facility or they may have multiple facilities across one or more states that are part of a chain. Owners or operators may also have multiple chains. According to a study conducted for the Department of Health and Human Services, about half of nursing homes are part of a chain.18
Real estate. Owners or operators do not necessarily own the real
estate where care is delivered, but instead may lease it. The separation of real estate assets from the operations may be done to obtain financing or in an attempt to protect real estate assets from malpractice claims. Furthermore, the owners, leaseholders, and operators may or may not be owned by the same or related entities.
PI firm nursing home ownership. In general, PI firms use a combination of investment capital and debt financing to acquire companies, including nursing home companies, with a goal of making a profit and eventually returning that profit to investors and the firm. As we noted in our prior report, some of the 10 PI firms we studied acquired both the operations and the real estate of nursing home chains while others only acquired the real estate.19 The former firms sit on the chains’ boards of directors and told us that their role is to provide strategic direction rather than directing day-to-day operations. In contrast, PI firms we studied that only purchased real estate do not sit on the nursing home chains’ boards of
18D. Stevenson, D. Grabowski, and L. Coots, Nursing Home Divestiture and Corporate Restructuring: Final Report, a special report prepared at the request of the Department of Health and Human Services (HHS), Assistant Secretary for Planning and Evaluation (December 2006).
19See GAO-10-710.
Page 9 GAO-11-571 Private Investment Nursing Home Ownership
directors.20 Among the PI firms that shared their reasons for investing in the nursing home industry, most cited the increased demand for long-term care due to an aging population. We also reported that the investment time horizons and objectives of PI firms vary. Some PI firms purchased the homes with a planned short-term “exit strategy” and others intended to hold the investment over the long term.21 PI firm managers said they are able to make business improvements that their publicly traded competitors may be less willing to make because they generally are not subject to periodic disclosure requirements about their financial performance and therefore are not tied to producing profits on a quarterly basis. In addition, PI firms have said that they increase the operator’s access to funding that can be used to increase staff wages, enhance operations, or modernize facilities and which ultimately may result in improved quality of care.
PI firm business strategies. PI firms may pursue different business strategies with respect to the types of residents they want to attract and the efficiency of their operations. Researchers have found that some nursing homes may specialize in caring for residents with certain care needs or Medicare residents. Care for such residents may result in higher levels of reimbursement. Indeed, prior to and after acquisition, PI homes we studied had a higher average percentage of residents whose care was reimbursed by Medicare compared to other for-profit and nonprofit homes.22 After acquisition, the percentage of residents in PI homes whose care was paid for by a source other than Medicare or Medicaid was higher on average than in other for-profit homes, but lower than in nonprofit nursing homes.
20However, their lease arrangements with nursing home operators may have the potential to influence the operations of the homes. See GAO-10-70. For example, officials at a PI firm that acquired a nursing home chain commented that leasing arrangements have minimal risk for real estate owners, but when revenues decline, nursing home operators are more likely to cut staff to pay the base rent and to maintain a level of profitability. PI firms we studied that acquired only real estate acknowledged the risk to their investment should the quality of care in the homes decline or one of their operators lose its state license to operate a nursing home. Two of these firms told us that their leases require the operators to maintain certain standards of care and that this requirement is routine in the industry.
21See GAO-10-710. In 2011, two of the PI firms we studied sold the real estate for the chains they had purchased in 2007.
22Although the average percentage of residents whose care was reimbursed by Medicare increased from 2003 to 2009 regardless of type of ownership, this increase was less for PI homes than for other homes. Our analyses of payer mix did not include control variables.

Page 10 GAO-11-571 Private Investment Nursing Home Ownership
Prior to acquisition, the average occupancy rates in PI homes were not significantly different from other homes.23 However, after acquisition in 2009, the average occupancy rates in PI homes were higher than other for-profit homes, although they did not differ significantly from nonprofit homes’ occupancy rates.
The Social Security Act requires all nursing homes that participate in Medicare and Medicaid to undergo periodic assessments of compliance with federal quality standards.24 It also includes certain ownership reporting requirements.25 Under contract with CMS, state survey agencies conduct standard surveys, which occur once a year, on average, and complaint investigations as needed. A standard survey involves a comprehensive assessment of about 200 federal quality standards.26 In contrast, complaint investigations generally focus on a specific allegation regarding resident care or safety made by a resident, family member, or nursing home staff member.27 Deficiencies identified during either standard surveys or complaint investigations are classified in 1 of 12 categories according to their scope (i.e., the number of residents potentially or actually affected) and severity (i.e., the potential for or occurrence of harm to residents). Serious deficiencies indicate care problems that have resulted in actual harm or immediate jeopardy (actual or potential for death or serious injury) for one or more residents.
We, CMS, and other researchers have examined the rates of deficiency citations, by state and among groups of nursing homes, to track trends in the proportion of homes with serious deficiencies and better understand
23Our analyses of occupancy rates did not include control variables.
24Social Security Act §§ 1819 (g) (codified at 42. U.S.C. § 1395i-3(g)), 1919(g) (codified at 42 U.S.C. § 1396r(g)).
25Social Security Act § 1124 (codified at 42 U.S.C. §1320a-3). The enactment of the Patient Protection and Affordable Care Act in March 2010 expanded the ownership and control reporting requirements to improve the transparency of the ownership for Medicare and Medicaid nursing homes. Pub. L. No. 111-148, § 6101, 124 Stat. 119, 699.
26In addition to health standards, the standard survey also includes an assessment of federal fire safety standards.
27See GAO, Nursing Homes: More Reliable Data and Consistent Guidance Would Improve CMS Oversight of State Complaint Investigations, GAO-11-280 (Washington, D.C.: Apr. 7, 2011).
Federal Oversight of Nursing Home Quality
Page 11 GAO-11-571 Private Investment Nursing Home Ownership
recurring care problems.28 Our prior reports identified considerable interstate variation in citations for serious deficiencies on standard surveys and the understatement of serious deficiencies on those surveys.29 Although several studies have shown that for-profit nursing homes generally have a greater number of total deficiency citations than nonprofit homes, others have found no statistical difference in total deficiency citations between for-profit and nonprofit homes.30 Similarly, research that examined differences in the citations for serious deficiencies has not consistently found a difference between for-profit and nonprofit homes.31 One study examined the effect of PI acquisition on total and serious deficiencies; it did not find a significant difference from before to after PI acquisition.32 A different study that examined the impact of ownership of nursing home operations and real estate found that deficiency rates were similar across homes regardless of whether or not ownership was split between different entities.33
28See GAO, Nursing Homes: Despite Increased Oversight, Challenges Remain in Ensuring High-Quality Care and Resident Safety, GAO-06-117 (Washington, D.C.: Dec. 28, 2005).
29See GAO-10-434R, GAO-10-70, and GAO-08-517.
30For example, see M. P. Hillmer, W. P. Wodchis, S. S. Gill, G. M. Anderson, and P. A. Rochon, “Nursing Home Profit Status and Quality of Care: Is There Any Evidence of an Association?” Medical Care Research and Review, vol. 62, no. 2 (April 2005).
31For example, see C. O’Neill, C. Harrington, M. Kitchener, and D. Saliba, “Quality of Care in Nursing Homes: An Analysis of Relationships among Profit, Quality, and Ownership,” Medical Care, vol. 41, no. 12 (2003) and S. Chesteen, B. Helgheim, T. Randall, and D. Wardell, “Comparing Quality of Care in Non-Profit and For-Profit Nursing Homes: A Process Perspective,” Journal of Operations Management, vol. 23, no. 2 (2005).
32D. Stevenson and D. Grabowski.
33D. Stevenson, D. Grabowski, and J. Bramson, Nursing Home Ownership Trends and Their Impact on Quality of Care. HHS, Office of Disability, Aging and Long-Term Care Policy (August 2009).

Page 12 GAO-11-571 Private Investment Nursing Home Ownership
Nursing homes employ three types of nursing staff—RNs, LPNs, and CNAs.34 The responsibilities and salaries of these three types of staff are related to their level of education. The staffing mix—that is, the balance a nursing home maintains among RNs, LPNs, and CNAs—is generally related to the needs of the residents served. For example, a higher proportion of RNs may be employed to meet residents’ needs in homes that serve greater numbers of residents with acute care needs or those with specialty care units (such as units for residents who require ventilators). However, homes may not be able to pursue their ideal staffing mix because of RN shortages in certain geographic areas. High turnover among licensed nurses and CNAs may also affect staffing mix.
Licensed Nurses and Nurse Aides
RNs have at least a 2-year degree and are licensed in a state. Due to their advanced training and ability to provide skilled nursing care, RNs are paid more than other nursing staff. Generally, RNs are responsible for managing residents’ nursing care and performing complex procedures, such as starting intravenous feeding or fluids.
LPNs have a 1-year degree, are also licensed by the state, and typically provide routine bedside care, such as taking vital signs.
CNAs are nurse aides or orderlies who work under the direction of licensed nurses, have at least 75 hours of training, and have passed a competency exam. CNAs’ responsibilities usually include assisting residents with eating, dressing, bathing, and toileting. In a typical nursing home, CNAs have more contact with residents than other nursing staff and provide the greatest number of hours of care per resident per day. CNAs generally are paid less than RNs and LPNs.
Researchers have found that higher total and RN staffing levels are typically associated with higher quality of care as shown by a wide range of indicators, including deficiencies and health outcomes. Lower total nurse staffing levels and lower levels of RN staffing have been linked to higher rates of deficiency citations. In addition, higher total nurse staffing ratios (hours per resident per day), and higher levels of RN staffing in
34In some states, licensed practical nurses (LPN) are known as licensed vocational nurses. We use the term LPN to refer to both LPNs and licensed vocational nurses. In addition to nursing staff, nursing homes employ a variety of other healthcare professionals, including physicians, social workers, physical therapists, and other types of therapists.
Nursing Home Staffing
Page 13 GAO-11-571 Private Investment Nursing Home Ownership
particular, have been associated with better health outcomes (such as fewer cases of pressure ulcers, urinary tract infections, malnutrition, and dehydration) as well as improved residents’ functional status.35 A home’s management of its nurse staffing has the potential to affect the quality of resident care, as well. For example, nursing staff turnover complicates nursing homes’ efforts to train their staff and can contribute to quality problems.
There are no federal minimum standards linking nurse staffing to the number of residents but a number of states have such standards. By statute, nursing homes that participate in Medicare and Medicaid are required to have sufficient nursing staff to provide nursing and related services to allow each resident to attain or maintain the highest practicable physical, mental, and psychosocial well-being.36 In addition to this general requirement, every nursing home must have 24 hours of licensed nurse (RN or LPN) coverage per day, including one RN on duty for at least 8 consecutive hours per day, 7 days per week. In contrast, one researcher reported that, as of 2010, 34 states had established minimum requirements for the number of nurse aide or direct care hours, which ranged from about 0.4 to 3.5 hours per resident per day.37
In 2000, CMS examined the impact of nurse staffing on quality of care in nursing homes.38 CMS concluded that a minimum nurse staffing ratio of 2.75 hours per resident day was needed to maintain quality of care, while also noting a preferred ratio of 3 hours and an optimal ratio of 3.9 hours. For RNs, CMS concluded that the minimum ratio should be 0.2 hours, with a preferred ratio of 0.45 hours. The average acuity of nursing home
35See for example, GAO, Nursing Homes: Quality of Care More Related to Staffing than Spending, GAO-02-431R (Washington, D.C.: June 13, 2002); C. Harrington, “Quality of Care in Nursing Home Organizations: Establishing a Health Services Research Agenda,” Nursing Outlook, vol. 53, no. 6 (2005); Institute of Medicine, Committee on the Work Environment for Nurses and Patient Safety, Keeping Patients Safe: Transforming the Work Environment of Nurses (Washington D.C.: The National Academies Press, 2004); and Institute of Medicine, Committee on Improving Quality in Long-Term Care, Improving the Quality of Long-term Care (Washington D.C.: The National Academies Press, 2001).
3642 U.S.C. § 1395i-3(b).
37C. Harrington, Nursing Home Staffing Standards in State Statutes and Regulations (December 2010).
38Health Care Financing Administration, Appropriateness of Minimum Nurse Staffing Ratios in Nursing Homes, Report to Congress (2000). Prior to July 2001, CMS was known as the Health Care Financing Administration.
Page 14 GAO-11-571 Private Investment Nursing Home Ownership
residents has increased since that report was issued. CMS did not recommend establishing minimum federal nurse-staffing standards, in part because staffing needs vary with residents’ care needs and management or nursing practices (such as training or policies affecting the retention of nursing staff) can influence the quality of care.
Studies of trends in nurse staffing in the last few years have noted an increase in total nurse staffing and in licensed nurse staffing.39 In addition, several studies have shown that for-profit nursing homes generally have lower nurse staffing ratios, and lower RN ratios, than nonprofit homes.40 One study examined the effect of PI ownership on nurse staffing; it found that RN staffing declined after PI acquisition, but this decline had begun prior to acquisition.41 This study also found an increase in CNA staffing after PI acquisition. A different study that examined the impact of ownership of nursing home operations and real estate on nurse staffing found that RN staffing was higher when real estate was owned than when it was leased or when ownership arrangements were mixed.42
Nursing home costs are determined by the mix of residents and the management of a home’s resources to meet its residents’ needs. The costs of caring for any particular nursing home resident vary with the type of services and amount of care needed. Residents who require low-intensity nursing and therapy or custodial care, like the typical Medicaid resident, are less costly, in part because their care needs are not as heavily dependent on the services of licensed nurses. Medicare beneficiaries are typically more costly than Medicaid residents, have shorter stays, and are admitted with the expectation that they will rehabilitate, recover, and return to their residences. A growing share of nursing home residents requires rehabilitation therapies and intensive
39See V. Mor, C. Caswell, S. Littlehale, J. Niemi, and B. Fogel, Changes in the Quality of Nursing Homes in the US: A Review and Data Update (Aug. 15, 2009) and C. Harrington, H. Carrillo, and B. W. Blank, Nursing Facilities, Staffing, Residents and Facility Deficiencies, 2003 Through 2008 (San Francisco, Calif.: Department of Social & Behavioral Sciences, University of California San Francisco, 2009).
40For example, see C. Donoghue, “The Percentage of Beds Designated for Medicaid in American Nursing Homes and Nurse Staffing Ratios,” Journal of Health and Social Policy, vol. 22, no. 1 (2006).
41D. Stevenson and D. Grabowski.
42D. Stevenson, D. Grabowski, and J. Bramson.
Costs of Care and Profitability

Page 15 GAO-11-571 Private Investment Nursing Home Ownership
skilled nursing care, such as parenteral feeding and ventilator care that previously were provided primarily in hospital settings; these residents are more costly because they require more skilled nursing and therapy staff and specialized equipment.
Salaries and labor-related costs for nursing and other staff account for more than half of a nursing home’s operating costs. Therefore a home’s decisions about its staffing mix are a key determinant of the home’s costs. To a lesser extent, the nursing home’s management of its capital assets—buildings, land, and equipment—also influences the home’s costs. New nursing homes and those that have been recently renovated may have additional expenses associated with facility construction and renovation that older buildings do not.
In addition to a home’s occupancy rate, profitability is influenced by several other factors, including payment rates, the mix of residents, and the nursing homes’ management of resources. Medicare’s and 21 states’ Medicaid payment rates are prospectively set per diem amounts that take into account the relative care needs of the resident.43 Under such payment systems, nursing homes have an incentive to provide care at a cost below the payment amount because they can retain any excess revenue not spent providing care. Although Medicare generally pays for the care of the nursing home residents with the most complex care needs, Medicare and private insurance have the highest payment rates for nursing home care and, on average, reimburse homes more than the costs of care. On the other hand, industry representatives perennially express concerns that Medicaid payment rates in many states are so low that they do not cover the costs of providing care. Some nursing homes trying to increase their profitability may focus on reducing their costs, by providing fewer or less expensive services. Other homes trying to increase their profitability may staff their homes and renovate their buildings to attract the better-paying Medicare and private insurance residents that will enhance their revenues or profits. We and the Medicare Payment Advisory Commission have reported that for-profit nursing
43The Medicare prospective payment system also adjusts payments for geographic differences in labor costs.

Page 16 GAO-11-571 Private Investment Nursing Home Ownership
homes have a greater profit on their Medicare line of business than nonprofit homes, on average.44
The relationship between costs, profitability, and quality of care in nursing homes differs depending on how the home’s resources are deployed. A home that increases its nurse staffing or adopts a new technology to improve the quality of care may also reduce its profitability because it increased costs without increasing revenues. However, some expenditures may prevent additional costs or increase revenues and therefore lead to improved profitability. For example, an expense can prevent subsequent, costly care needs, such as when higher levels of RN staffing result in reduced levels of infections. As another example, expenses that boost the attractiveness of the home to better paying residents may also improve the home’s profitability, whether or not such expenses improve the quality of care.
PI homes, like other for-profit homes, had more total deficiencies than nonprofit homes in both 2003 and 2009.45 In 2009, PI homes did not differ significantly from nonprofit homes in the likelihood of a serious deficiency, but in 2003 the likelihood was higher in homes that were subsequently acquired by PI than in nonprofit homes.46 From 2003 to 2009, total deficiencies increased and the likelihood of a serious deficiency decreased in PI homes; the changes in these deficiency measures from 2003 to 2009 in other for-profit and nonprofit homes did not differ significantly from the changes in PI homes.
44See GAO, Skilled Nursing Facilities: Medicare Payments Exceeded Costs for Most but Not All Facilities, GAO-03-183 (Washington, D.C.: Dec. 31, 2002), and Medicare Payment Advisory Commission, Report to the Congress: Medicare Payment Policy (Washington, D.C.: March 2011).
45We analyzed how much more or less the expected incidence rate for total deficiencies is for one type of home when compared to another. In this report, we used the term total deficiencies rather than incidence rates. For more information, see app. I.
46We analyzed odds ratios, that is, we analyzed how much more or less likely the odds are for one or more serious deficiencies to have been cited for one type of home when compared to another. In this report, we used the term likelihood of a serious deficiency rather than odds ratios. For more information, see app. I.
PI Homes Had More Total Deficiencies than Nonprofit Homes and Were More Likely to Have Had a Serious Deficiency Before but Not After Acquisition
Page 17 GAO-11-571 Private Investment Nursing Home Ownership
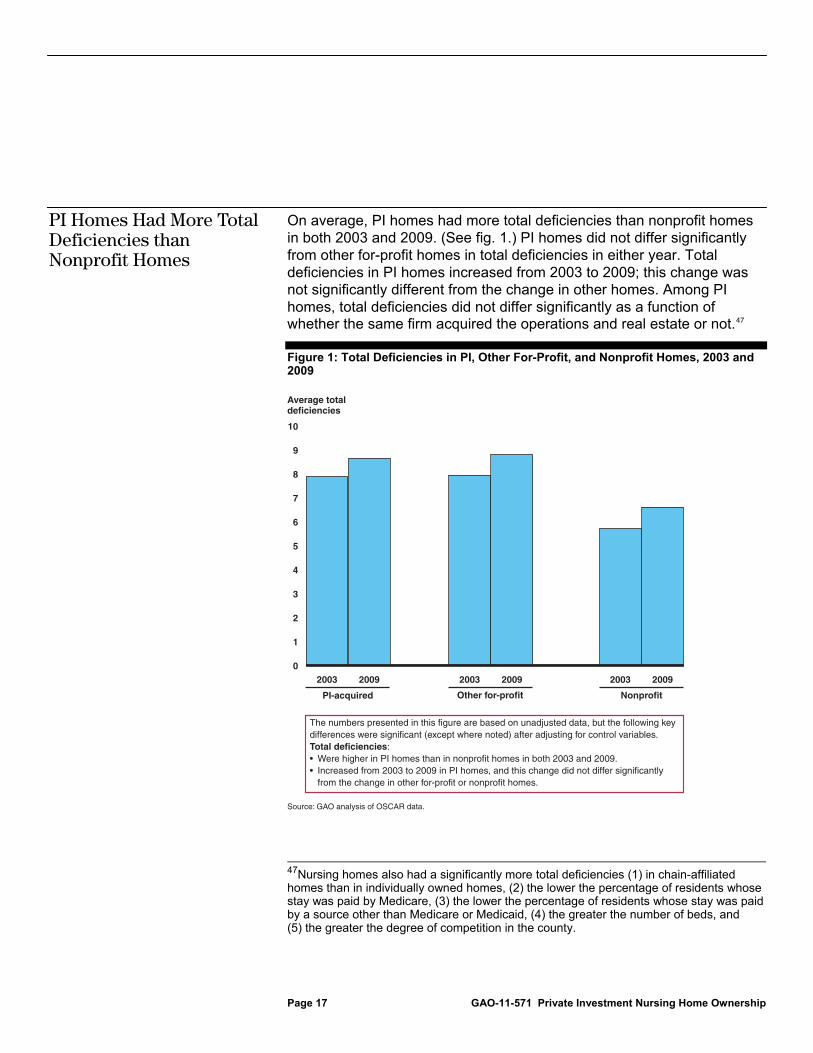
On average, PI homes had more total deficiencies than nonprofit homes in both 2003 and 2009. (See fig. 1.) PI homes did not differ significantly from other for-profit homes in total deficiencies in either year. Total deficiencies in PI homes increased from 2003 to 2009; this change was not significantly different from the change in other homes. Among PI homes, total deficiencies did not differ significantly as a function of whether the same firm acquired the operations and real estate or not.47
Figure 1: Total Deficiencies in PI, Other For-Profit, and Nonprofit Homes, 2003 and 2009
47Nursing homes also had a significantly more total deficiencies (1) in chain-affiliated homes than in individually owned homes, (2) the lower the percentage of residents whose stay was paid by Medicare, (3) the lower the percentage of residents whose stay was paid by a source other than Medicare or Medicaid, (4) the greater the number of beds, and (5) the greater the degree of competition in the county.
PI Homes Had More Total Deficiencies than Nonprofit Homes
0
1
2
3
4
5
6
7
8
9
10
200920032009200320092003
Average totaldeficiencies
PI-acquired
Source: GAO analysis of OSCAR data.
Other for-profit Nonprofit
The numbers presented in this figure are based on unadjusted data, but the following key differences were significant (except where noted) after adjusting for control variables. Total deficiencies:• Were higher in PI homes than in nonprofit homes in both 2003 and 2009.• Increased from 2003 to 2009 in PI homes, and this change did not differ significantly from the change in other for-profit or nonprofit homes.
Page 18 GAO-11-571 Private Investment Nursing Home Ownership
Our examination of total deficiencies in each of five PI firms’ homes indicated some differences between PI firms, but the differences we observed generally existed prior to acquisition and persisted after acquisition. For example, in comparison to other homes acquired by PI firms, total deficiencies were lower in both 2003 and 2009 in homes of one firm and were greater in both years in homes of a second firm.
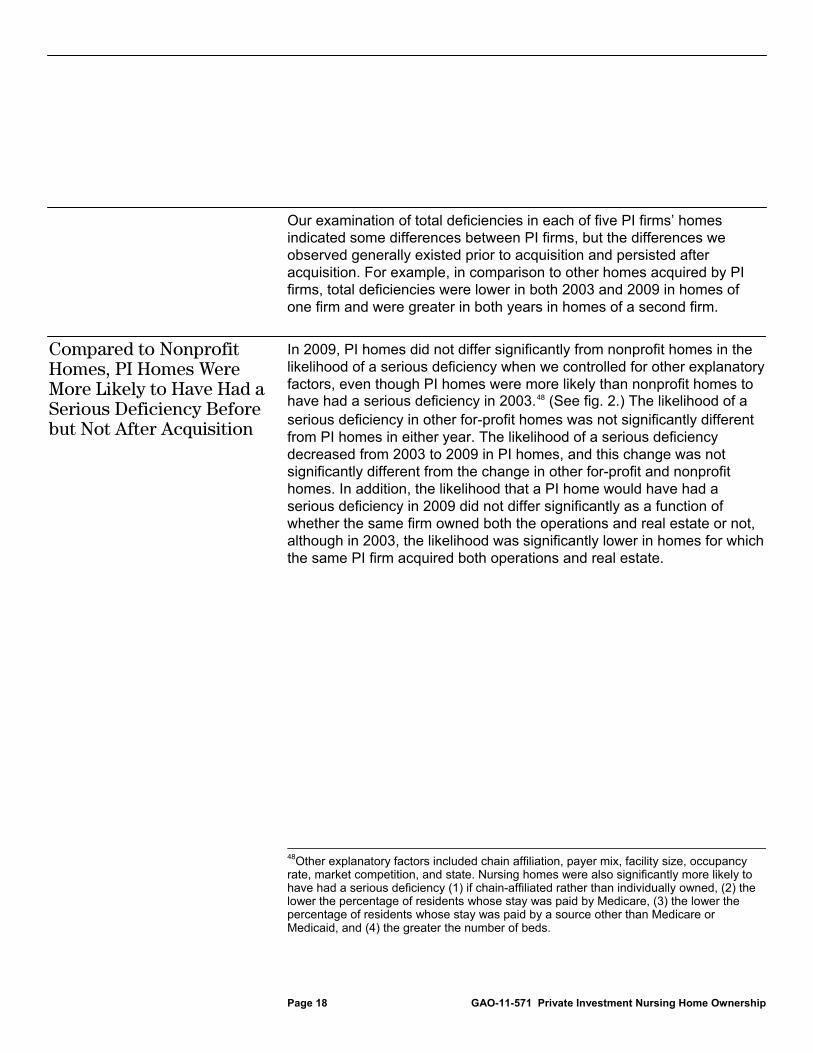
In 2009, PI homes did not differ significantly from nonprofit homes in the likelihood of a serious deficiency when we controlled for other explanatory factors, even though PI homes were more likely than nonprofit homes to have had a serious deficiency in 2003.48 (See fig. 2.) The likelihood of a serious deficiency in other for-profit homes was not significantly different from PI homes in either year. The likelihood of a serious deficiency decreased from 2003 to 2009 in PI homes, and this change was not significantly different from the change in other for-profit and nonprofit homes. In addition, the likelihood that a PI home would have had a serious deficiency in 2009 did not differ significantly as a function of whether the same firm owned both the operations and real estate or not, although in 2003, the likelihood was significantly lower in homes for which the same PI firm acquired both operations and real estate.
48Other explanatory factors included chain affiliation, payer mix, facility size, occupancy rate, market competition, and state. Nursing homes were also significantly more likely to have had a serious deficiency (1) if chain-affiliated rather than individually owned, (2) the lower the percentage of residents whose stay was paid by Medicare, (3) the lower the percentage of residents whose stay was paid by a source other than Medicare or Medicaid, and (4) the greater the number of beds.
Compared to Nonprofit Homes, PI Homes Were More Likely to Have Had a Serious Deficiency Before but Not After Acquisition
Page 19 GAO-11-571 Private Investment Nursing Home Ownership
Figure 2: Serious Deficiencies in PI, Other For-Profit, and Nonprofit Homes, 2003 and 2009
Our examination of serious deficiencies in each of five PI firms’ homes indicated some differences between PI firms, but these differences existed prior to acquisition and persisted after acquisition. In comparison to other homes acquired by PI firms, the likelihood was lower in both 2003 and 2009 in homes of one firm and was greater in both years in homes of a second firm.
0
0.05
0.10
0.15
0.20
0.25
0.30
0.35
200920032009200320092003
Proportion of homeswith a serious deficiency
PI-acquired
Source: GAO analysis of OSCAR data.
Other for-profit Nonprofit
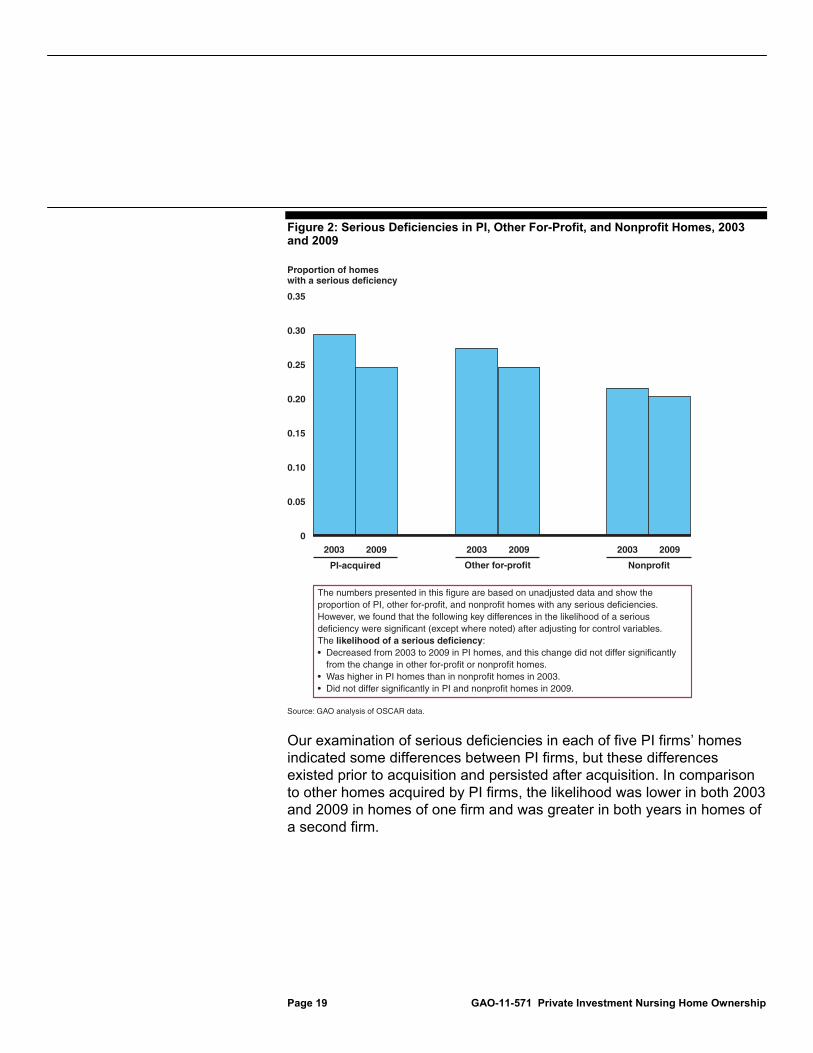
The numbers presented in this figure are based on unadjusted data and show the proportion of PI, other for-profit, and nonprofit homes with any serious deficiencies. However, we found that the following key differences in the likelihood of a serious deficiency were significant (except where noted) after adjusting for control variables.The likelihood of a serious deficiency:• Decreased from 2003 to 2009 in PI homes, and this change did not differ significantly from the change in other for-profit or nonprofit homes.• Was higher in PI homes than in nonprofit homes in 2003.• Did not differ significantly in PI and nonprofit homes in 2009.
Page 20 GAO-11-571 Private Investment Nursing Home Ownership
On average, total reported nurse staffing ratios (hours per resident per day) were lower for PI homes than for other types of homes in both 2003 and 2009, but PI homes’ reported RN ratios—the most skilled component of total nurse staffing—increased more from 2003 to 2009. On average, reported ratios for LPNs—the other type of licensed nurse—also increased from 2003 to 2009 in PI homes; this change was not significantly different from the change from 2003 to 2009 in other for-profit and nonprofit homes. In contrast, reported CNA ratios for PI homes did not change significantly from 2003 to 2009, but increased for other types of homes.
In both 2003 and 2009, PI homes reported lower average total nurse staffing ratios than other types of homes. (See fig. 3.) Average reported total nurse staffing ratios for PI homes increased from 2003 to 2009; this change was not significantly different from either other for-profit or nonprofit homes.49 The unadjusted average total nurse staffing ratios reported in 2009 for each ownership type exceeded the ratio identified as “preferred” by CMS in its 2000 report, but fell short of the level CMS identified as “optimal.”50
49Average reported total nurse staffing ratios were also significantly higher (1) for individually owned homes than chain-affiliated homes, (2) the greater the percentage of residents whose stay was paid by Medicare, (3) the greater the percentage of residents whose stay was paid by a source other than Medicare or Medicaid, (4) the fewer the beds, (5) the lower the occupancy rate, and (6) the greater the degree of competition in the county.
50See CMS Report to Congress (2000). The average acuity of nursing home residents has increased since that report was issued.
Reported Total Nurse Staffing Ratios Were Lower in PI Homes, but Reported RN Ratios Increased More in PI Homes than Other Homes
Average Reported Total Nurse Staffing Ratios Were Lower for PI Homes than Other Homes in Both 2003 and 2009

Page 21 GAO-11-571 Private Investment Nursing Home Ownership
Figure 3: Total Reported Nurse Staffing Ratios for PI, Other For-Profit, and Nonprofit Homes, 2003 and 2009
Our examination of reported average total nurse staffing ratios for each of five PI firms indicated some differences between firms. We found that the change in these ratios from 2003 to 2009 in one PI firm’s homes was not as great as the increase for other PI-acquired homes; in 2009, total nurse staffing ratios for that firm’s homes were lower than for other PI-acquired homes. Representatives of the nursing home operator for homes of this PI firm told us that they had focused on and reduced staff turnover since 2003.
0
0.5
1.0
1.5
2.0
2.5
3.0
3.5
4.0
200920032009200320092003
Average reported total nurse staffing ratio(in hours)
PI-acquired
Source: GAO analysis of OSCAR data.
RN
LPN
CNA
Other for-profit Nonprofit
The numbers presented in this figure are based on unadjusted data, but the following key differences were significant (except where noted) after adjusting for control variables.The average reported total nurse staffing ratio:• Was lower for PI homes than other for-profit and nonprofit homes in both 2003 and 2009.• Increased from 2003 to 2009 in PI homes, and this change did not differ significantly from the change in other for-profit or nonprofit homes.

Page 22 GAO-11-571 Private Investment Nursing Home Ownership
The staffing mix in PI homes—the balance of RNs, LPNs, and CNAs—changed from 2003 to 2009, and the changes in staffing were different in PI homes than in other types of homes. Average reported ratios for RNs (one type of licensed nursing staff) increased more from 2003 to 2009 in PI homes than other types of homes. Average ratios for LPNs (the other type of licensed nursing staff) also increased in PI homes from 2003 to 2009, but the change in PI homes did not differ significantly from the change in other for-profit and nonprofit homes. In contrast, average reported ratios for CNAs (who are not licensed) did not change significantly from 2003 to 2009 for PI homes, but increased for both other types of homes.
RN ratios. In 2009, average reported RN ratios for PI homes were greater than other for-profit homes and were also greater than nonprofit homes, when we controlled for other explanatory factors.51 (See fig. 4.) Average reported RN ratios for PI homes increased from 2003 to 2009, and this increase was greater than the change for both other types of homes. In 2003, average reported RN ratios for PI homes did not differ significantly from other for-profit homes when we controlled for other explanatory factors and were lower than for nonprofit homes. These ratios were greater for nonprofit homes than for other for-profit homes in both 2003 and 2009. The unadjusted average RN ratios reported in 2009 for each ownership type—PI, other for-profit, and nonprofit homes—fell short of the ratios identified as “preferred” by CMS in its 2000 report.52
51We controlled for chain affiliation, payer mix, facility size, occupancy rate, market competition, and state. Average reported RN staffing ratios were significantly higher (1) for individually owned homes than chain-affiliated homes, (2) the greater the percentage of residents whose stay was paid by Medicare, (3) the greater the percentage of residents whose stay was paid by a source other than Medicare or Medicaid, (4) the fewer the beds, (5) the lower the occupancy rate, and (6) the greater the degree of competition in the county.
52See CMS Report to Congress (2000). The average acuity of nursing home residents has increased since that report was issued.
Staffing Mix Changed, with Average Reported RN Ratios Increasing More for PI Homes than Other Homes but CNA Ratios Increasing More for Other Homes than PI Homes

Page 23 GAO-11-571 Private Investment Nursing Home Ownership
Figure 4: RN Ratios Reported for PI, Other For-Profit, and Nonprofit Homes, 2003 and 2009
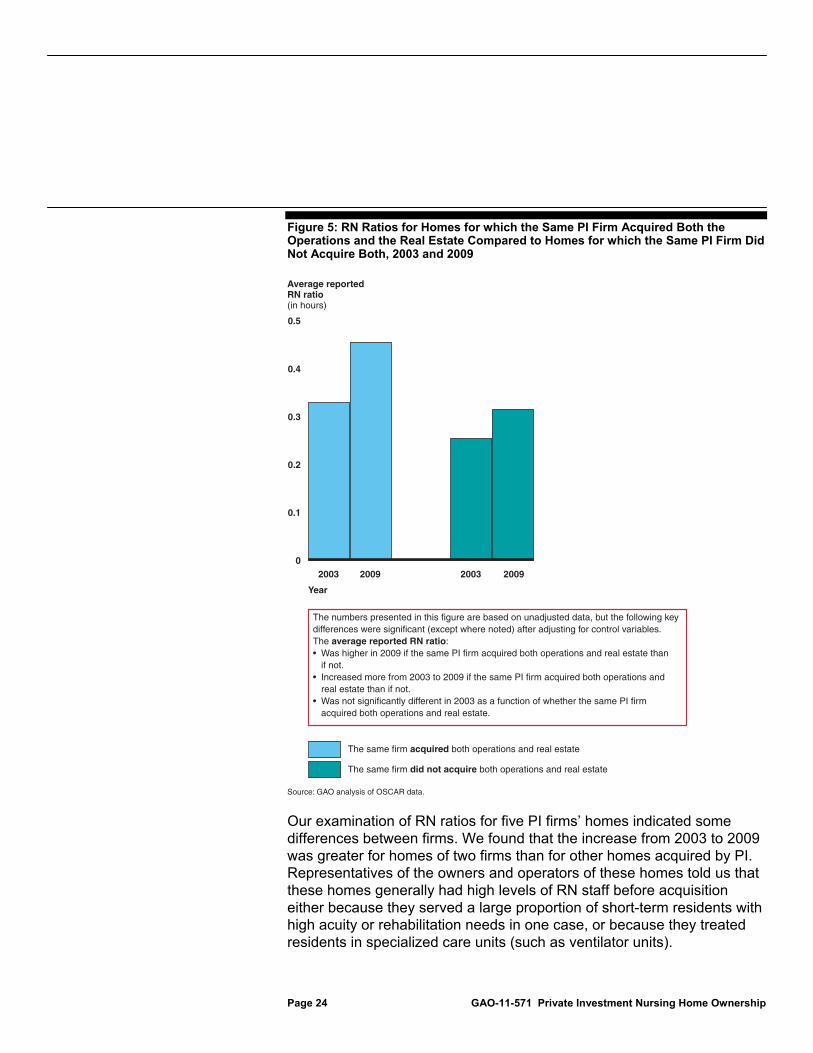
In 2009, average reported RN ratios were higher if the same PI firm acquired both operations and real estate than if not. The increase in these ratios from 2003 to 2009 for PI homes was greater if the same PI firm acquired both operations and real estate than if not. (See fig. 5.) In 2003, average reported RN ratios did not differ significantly as a function of whether the same PI firm acquired both operations and real estate or not when we controlled for other explanatory factors.
0
0.1
0.2
0.3
0.4
0.5
200920032009200320092003
Average reported RN ratio(in hours)
PI-acquired
Source: GAO analysis of OSCAR data.
Other for-profit Nonprofit
The numbers presented in this figure are based on unadjusted data, but the following key differences were significant (except where noted) after adjusting for control variables. The average reported RN ratio:• Was higher for PI homes than other for-profit and nonprofit homes in 2009.• Increased from 2003 to 2009 in PI homes, and increased more in PI homes than other for-profit and nonprofit homes.• Did not differ significantly for PI and other for-profit homes in 2003.• Was lower for PI homes than nonprofit homes in 2003.
Page 24 GAO-11-571 Private Investment Nursing Home Ownership
Figure 5: RN Ratios for Homes for which the Same PI Firm Acquired Both the Operations and the Real Estate Compared to Homes for which the Same PI Firm Did Not Acquire Both, 2003 and 2009
Our examination of RN ratios for five PI firms’ homes indicated some differences between firms. We found that the increase from 2003 to 2009 was greater for homes of two firms than for other homes acquired by PI. Representatives of the owners and operators of these homes told us that these homes generally had high levels of RN staff before acquisition either because they served a large proportion of short-term residents with high acuity or rehabilitation needs in one case, or because they treated residents in specialized care units (such as ventilator units).
0
0.1
0.2
0.3
0.4
2009200320092003
Average reported RN ratio(in hours)
Year
Source: GAO analysis of OSCAR data.
The same firm acquired both operations and real estate
The same firm did not acquire both operations and real estate
0.5
The numbers presented in this figure are based on unadjusted data, but the following key differences were significant (except where noted) after adjusting for control variables. The average reported RN ratio:• Was higher in 2009 if the same PI firm acquired both operations and real estate than if not.• Increased more from 2003 to 2009 if the same PI firm acquired both operations and real estate than if not.• Was not significantly different in 2003 as a function of whether the same PI firm acquired both operations and real estate.
Page 25 GAO-11-571 Private Investment Nursing Home Ownership
Representatives of each firm also said that increasing RN staff was part of an ongoing strategy to expand their capacity to care for such residents. For homes of the third PI firm, the change from 2003 to 2009 in RN ratios was not as great as the increase for other PI homes. This firm’s representatives told us that training can be more important than the number of staff and so they have focused their efforts on training and reducing staff turnover. The change in average reported RN ratios from 2003 to 2009 for two sets of homes for which different PI firms acquired the operations and real estate was less than the increase for other PI homes. The operator of one of these sets of homes told us that they had focused on promoting stable nursing leadership.
LPN ratios. Average reported LPN ratios were lower for PI homes than other homes in both 2003 and 2009 when we controlled for other explanatory factors.53 For PI homes, these ratios increased from 2003 to 2009; this increase was not significantly different than the change for either other type of homes. Among PI homes, LPN ratios did not differ significantly as a function of whether the same firm acquired the operations and real estate or not.
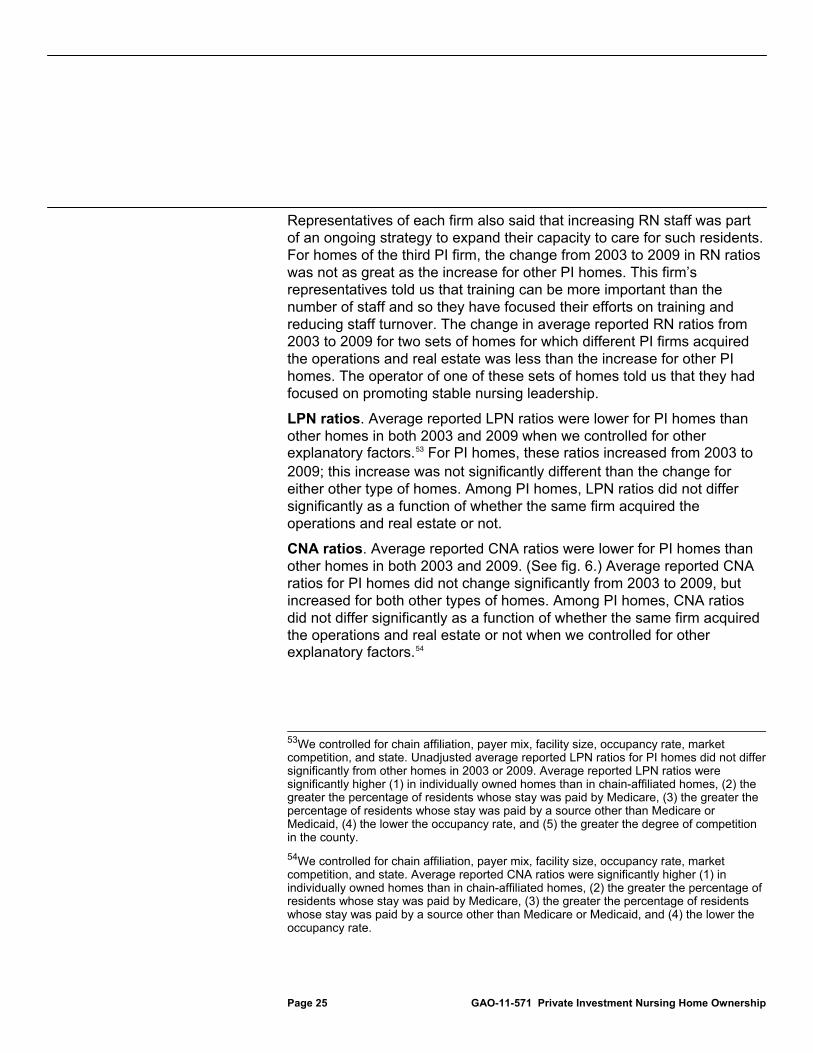
CNA ratios. Average reported CNA ratios were lower for PI homes than other homes in both 2003 and 2009. (See fig. 6.) Average reported CNA ratios for PI homes did not change significantly from 2003 to 2009, but increased for both other types of homes. Among PI homes, CNA ratios did not differ significantly as a function of whether the same firm acquired the operations and real estate or not when we controlled for other explanatory factors.54
53We controlled for chain affiliation, payer mix, facility size, occupancy rate, market competition, and state. Unadjusted average reported LPN ratios for PI homes did not differ significantly from other homes in 2003 or 2009. Average reported LPN ratios were significantly higher (1) in individually owned homes than in chain-affiliated homes, (2) the greater the percentage of residents whose stay was paid by Medicare, (3) the greater the percentage of residents whose stay was paid by a source other than Medicare or Medicaid, (4) the lower the occupancy rate, and (5) the greater the degree of competition in the county.
54We controlled for chain affiliation, payer mix, facility size, occupancy rate, market competition, and state. Average reported CNA ratios were significantly higher (1) in individually owned homes than in chain-affiliated homes, (2) the greater the percentage of residents whose stay was paid by Medicare, (3) the greater the percentage of residents whose stay was paid by a source other than Medicare or Medicaid, and (4) the lower the occupancy rate.
Page 26 GAO-11-571 Private Investment Nursing Home Ownership
Figure 6: CNA Ratios Reported for PI, Other For-Profit, and Nonprofit Homes, 2003 and 2009
Our examination of the CNA ratios for five PI firms’ homes indicated some differences between firms. In comparison to other homes acquired by PI firms, we found that for one set of homes where different PI firms acquired the operations and real estate these ratios were lower in 2009, but did not differ significantly in 2003. For another set of homes where different PI firms acquired the operations and real estate, these ratios were higher in 2009, but did not differ significantly in 2003. Representatives of the operator for the nursing homes with lower CNA ratios in 2009 told us that they had acquired labor-saving technology and focused on reducing turnover. They reported that turnover of nursing staff that provide direct care to residents in their homes had been 90 percent in 2003, but was 59 percent in 2009.
0
0.5
1.0
1.5
2.0
2.5
3.0
200920032009200320092003
Average reportedCNA ratio(in hours)
PI-acquired
Source: GAO analysis of OSCAR data.
Other for-profit Nonprofit
The numbers presented in this figure are based on unadjusted data, but the following key differences were significant (except where noted) after adjusting for control variables. The average reported CNA ratio:• Was lower for PI homes than other for-profit and nonprofit homes in both 2003 and 2009.• Did not change significantly from 2003 to 2009 in PI homes, but increased in other for-profit and nonprofit homes.

Page 27 GAO-11-571 Private Investment Nursing Home Ownership
The financial performance of PI homes showed both cost increases and higher margins when compared to other for-profit or nonprofit homes. Specifically, facility costs per resident day for PI homes increased more, on average, from before acquisition (2003) to after acquisition (2008) than other for-profit and nonprofit homes. Among PI-acquired homes, we observed less of an increase if the same PI firm owned the operations and real estate than if not. The results were similar when we examined capital-related costs, a component of facility costs. Despite increased costs, PI homes also showed increased facility margins but the increase was not significantly different from the change in other for-profit homes. In contrast to PI and other for-profit homes, the margins of nonprofit homes decreased.
Both facility costs per resident day and a component of those costs—capital related costs per resident day—increased in PI homes from 2003 to 2008 and this increase was greater than for other for-profit and nonprofit homes.
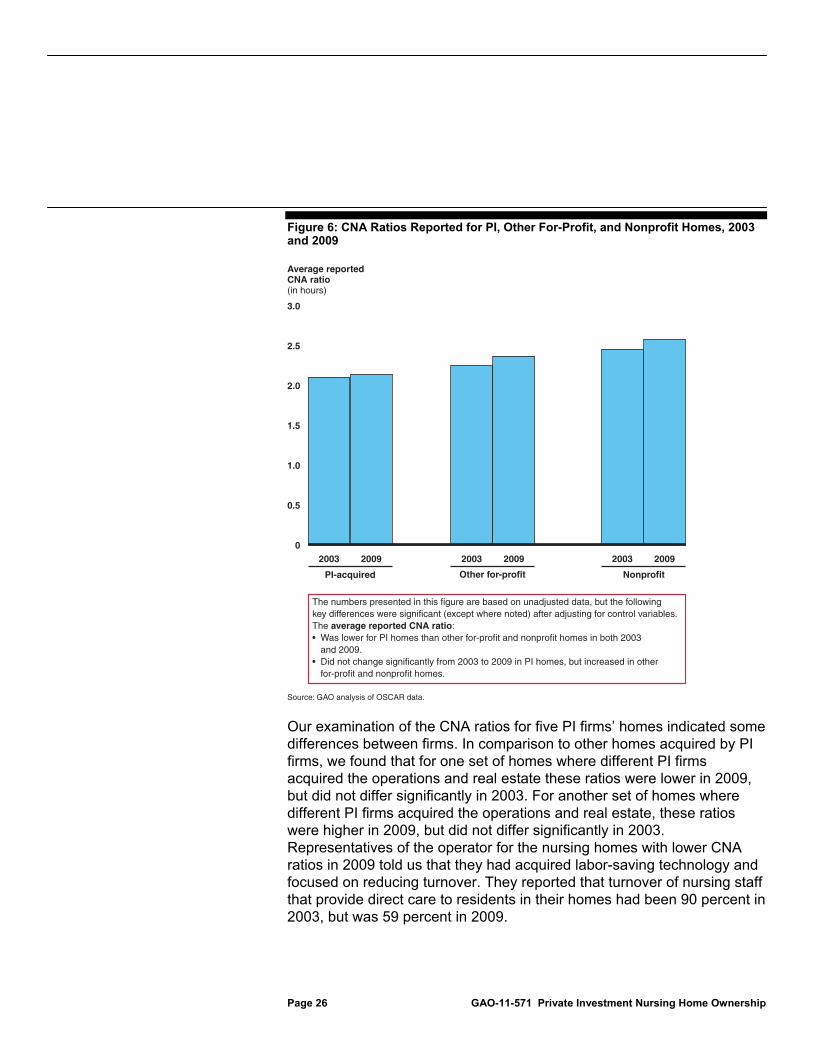
Facility costs. In both 2003 and 2008, PI homes reported lower facility costs per resident day, on average, than nonprofit homes even though these costs increased more in PI homes from 2003 to 2008 than in both nonprofit homes and other for-profit homes. (See fig. 7.) Facility costs include all costs associated with maintaining and operating a nursing home, such as staff salaries, administrative costs, and capital-related costs. While PI homes did not differ significantly from other for-profit homes in 2003 when we controlled for other explanatory factors, they reported higher costs in 2008.55
55We controlled for chain affiliation, payer mix, facility size, occupancy rate, market competition, and state. On average, reported facility costs per resident day were also higher (1) the greater the percentage of residents whose stay was paid by Medicare, (2) the greater the percentage of residents whose stay was paid by a source other than Medicare or Medicaid, (3) the greater the number of beds, and (4) the greater the degree of competition in the county.
PI Homes’ Financial Performance Showed Cost Increases and Higher Facility Margins Compared to Other Homes
Facility Costs, Including Capital-Related Costs, Increased for PI Homes and This Increase Was Greater than for Other Homes
Page 28 GAO-11-571 Private Investment Nursing Home Ownership
Figure 7: Facility Costs per Resident Day for PI, Other For-Profit, and Nonprofit Homes, 2003 and 2008
The increase in facility costs per resident day from 2003 to 2008 was less, on average, if the same PI firm acquired both the operations and real estate than if it did not. (See fig. 8.) While the latter group of homes reported lower costs in 2003, these two groups reported costs in 2008 that did not differ significantly after we controlled for other explanatory factors.
0
50
100
150
200
250
200820032008200320082003
Average facility costs per resident day(in dollars)
PI-acquired
Source: GAO analysis of Medicare SNF cost reports.
Other for-profit Nonprofit
The numbers presented in this figure are based on unadjusted data, but the following key differences were significant (except where noted) after adjusting for control variables. The average facility costs per resident day:• Were lower for PI homes than nonprofit homes in both 2003 and 2008.• Increased from 2003 to 2008 in PI homes, and increased more in PI homes than in other for-profit and nonprofit homes.• Were not significantly different than other for-profit homes in 2003.• Were higher for PI homes than other for-profit homes in 2008.

Page 29 GAO-11-571 Private Investment Nursing Home Ownership
Figure 8: Facility Costs per Resident Day for Homes for which the Same PI Firm Acquired Both the Operations and the Real Estate Compared to Homes for which the Same PI Firm Did Not Acquire Both, 2003 and 2008
Our examination of facility costs for each of five PI firms indicated some differences among firms. In comparison to other homes acquired by PI, the increase in facility costs from 2003 to 2008 was greater in one set of homes where different PI firms owned the operations and real estate but the change was not as great in another PI firm’s homes.
0
50
100
150
200
250
2008200320082003
Average facility costsper resident day(in dollars)
Year
Source: GAO analysis of Medicare SNF cost reports.
The same firm acquired both operations and real estate
The same firm did not acquire both operations and real estate
The numbers presented in this figure are based on unadjusted data, but the following key differences were significant (except where noted) after adjusting for control variables.The average facility costs per resident day:• Increased less from 2003 to 2008 if the same PI firm acquired both operations and real estate than if not.• Were higher in 2003 if the same PI firm acquired both operations and real estate than if not.• Were not significantly different in 2008 as a function of whether the same PI firm acquired both operations and real estate.
Page 30 GAO-11-571 Private Investment Nursing Home Ownership
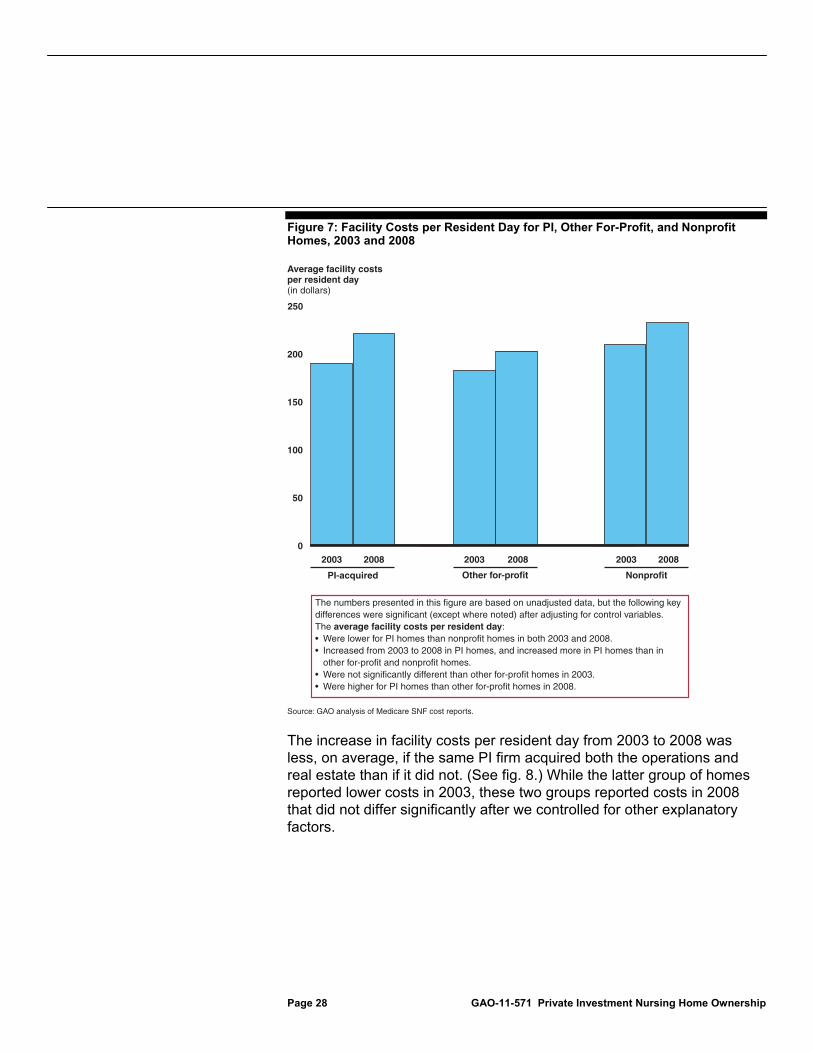
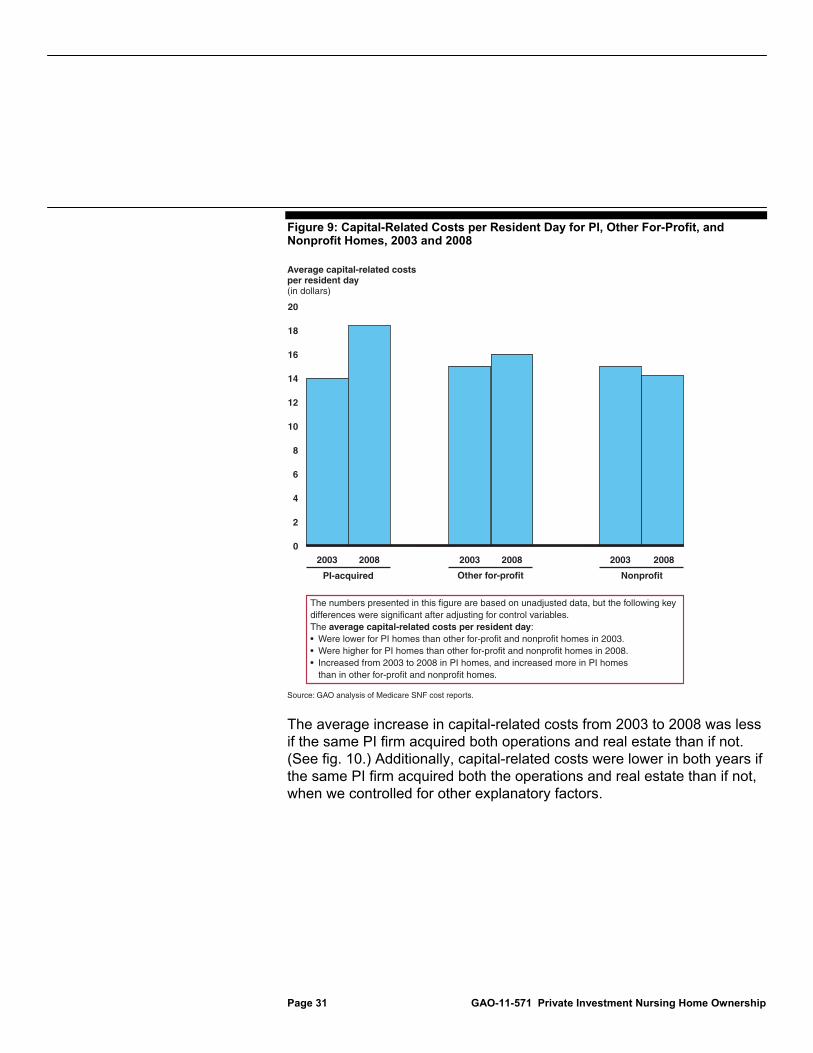
Capital-related costs. Average capital-related costs per resident day in PI homes increased from 2003 to 2008 and this change was greater for PI homes than for other types of homes. (See fig. 9.) Capital-related costs are a component of total facility costs that capture mortgage payments, rents, depreciation, taxes and insurance, as well as land and building improvements, including upgrades to equipment.56 Although capital-related costs were lower in PI homes than in other for-profit and nonprofit homes in 2003 when we controlled for other explanatory factors, they were higher than both other types of homes in 2008.57
56Medicare regulations place certain limits on the calculation of nursing home providers’ capital-related costs. If a provider’s financing costs exceed these limits, the provider’s full financing costs cannot be included in Medicare cost reports. Several of the PI firms in our study made use of financing to acquire their homes. The largest transaction among our firms was a $6.3 billion deal in 2007 of which about $5 billion was financed. In 2011, this PI firm sold its nursing homes’ real estate to a real estate investment trust through a $6.1 billion transaction as well as about 10 percent of the facilities’ operations for about $95 million.
57We controlled for chain affiliation, payer mix, facility size, occupancy rate, market competition, and state. On average, capital-related costs per resident day were also higher (1) in chain affiliated homes than in individually-owned homes, (2) the greater the percentage of residents whose stay was paid by Medicare, (3) the greater the percentage of residents whose stay was paid by a source other than Medicare or Medicaid, (4) the greater the number of beds, (5) the lower the occupancy rate, and (6) the greater the degree of competition in the county.
Page 31 GAO-11-571 Private Investment Nursing Home Ownership
Figure 9: Capital-Related Costs per Resident Day for PI, Other For-Profit, and Nonprofit Homes, 2003 and 2008
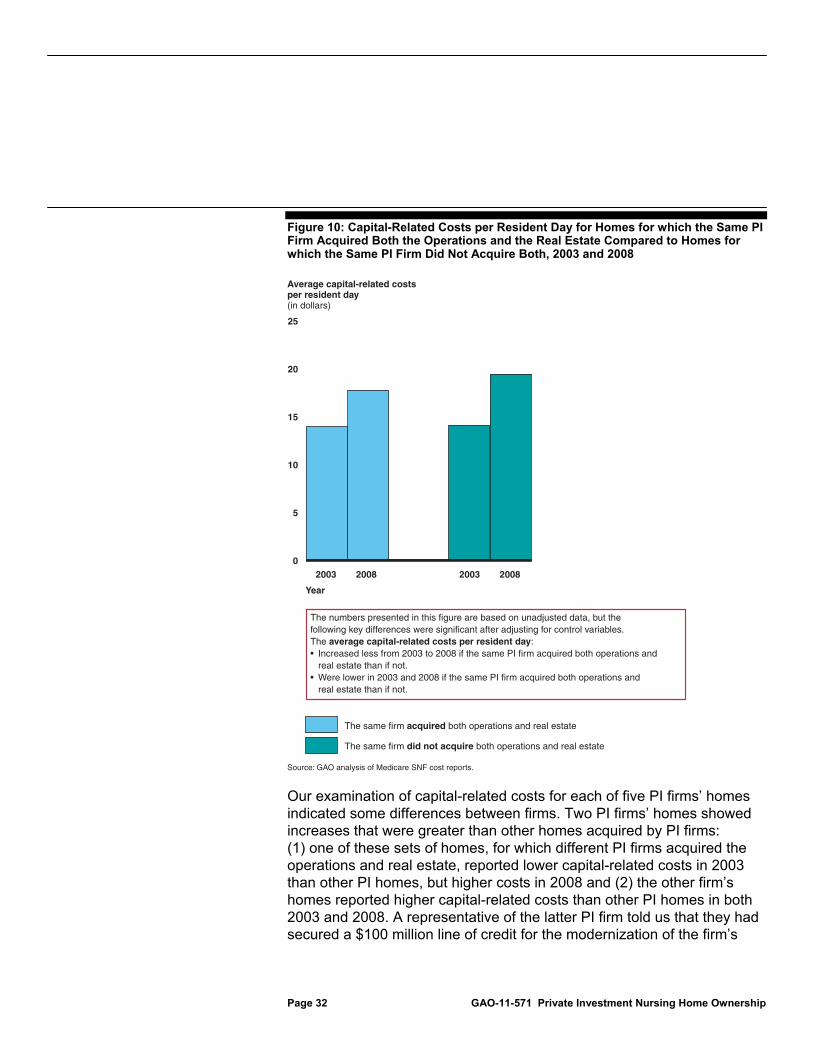
The average increase in capital-related costs from 2003 to 2008 was less if the same PI firm acquired both operations and real estate than if not. (See fig. 10.) Additionally, capital-related costs were lower in both years if the same PI firm acquired both the operations and real estate than if not, when we controlled for other explanatory factors.
0
2
4
6
8
10
12
14
16
18
20
200820032008200320082003
Average capital-related costs per resident day(in dollars)
PI-acquired Other for-profit Nonprofit
Source: GAO analysis of Medicare SNF cost reports.
The numbers presented in this figure are based on unadjusted data, but the following key differences were significant after adjusting for control variables. The average capital-related costs per resident day:• Were lower for PI homes than other for-profit and nonprofit homes in 2003.• Were higher for PI homes than other for-profit and nonprofit homes in 2008.• Increased from 2003 to 2008 in PI homes, and increased more in PI homes than in other for-profit and nonprofit homes.
Page 32 GAO-11-571 Private Investment Nursing Home Ownership
Figure 10: Capital-Related Costs per Resident Day for Homes for which the Same PI Firm Acquired Both the Operations and the Real Estate Compared to Homes for which the Same PI Firm Did Not Acquire Both, 2003 and 2008
Our examination of capital-related costs for each of five PI firms’ homes indicated some differences between firms. Two PI firms’ homes showed increases that were greater than other homes acquired by PI firms: (1) one of these sets of homes, for which different PI firms acquired the operations and real estate, reported lower capital-related costs in 2003 than other PI homes, but higher costs in 2008 and (2) the other firm’s homes reported higher capital-related costs than other PI homes in both 2003 and 2008. A representative of the latter PI firm told us that they had secured a $100 million line of credit for the modernization of the firm’s
0
5
10
15
20
25
2008200320082003
Average capital-related costsper resident day(in dollars)
Year
Source: GAO analysis of Medicare SNF cost reports.
The same firm acquired both operations and real estate
The same firm did not acquire both operations and real estate
The numbers presented in this figure are based on unadjusted data, but thefollowing key differences were significant after adjusting for control variables.The average capital-related costs per resident day:• Increased less from 2003 to 2008 if the same PI firm acquired both operations and real estate than if not.• Were lower in 2003 and 2008 if the same PI firm acquired both operations and real estate than if not.
Page 33 GAO-11-571 Private Investment Nursing Home Ownership
nursing homes. Investment in the homes had been ongoing prior to acquisition, this representative said, but the homes’ access to capital had increased after acquisition. In contrast, the change in capital-related costs for the remaining three firms’ homes was not as great as the increase in other PI homes. Two of these three firms’ homes reported lower capital-related costs in both 2003 and 2008. Representatives from a nursing home chain owned by one of these firms commented that the majority of investments were in staffing. They noted that, in contrast, their peers had invested in their own facilities to attract the highest paying residents. Representatives from another firm that owned nursing home real estate, but not operations commented that, depending on the resident population served and the location of the home, renovations aimed at attracting more acute (and higher paying) residents may not pay off. For example, homes in a rural area might not be able to attract the appropriate staff and mix of residents to make renovations aimed at treating more acute-care residents worth the costs. However, they told us that these older, rural homes still effectively serve a segment of the market despite the lower level of capital investment.
Facility margins for PI homes were, on average, higher in 2003 and 2008 than for other for-profit and nonprofit homes.58 (See fig. 11.) Facility margins in PI homes increased from 2003 to 2008; this increase was not significantly different from the average change for other for-profit homes, but was greater than the change in margins for nonprofit homes. In fact, facility margins for nonprofit homes decreased from 2003 to 2008. The increase in facility margins among PI homes from 2003 to 2008 was not significantly different, on average, if the same PI firm acquired both the homes’ operations and the real estate than if it did not. However, facility margins for the former were, on average, higher both in 2003 and 2008.59
58Facility margins are the amount of total facility revenues exceeding total facility costs, divided by total facility revenues. Medicare regulations place certain limits on the calculation of nursing home providers’ capital-related costs. If a provider’s financing costs exceed these limits the provider’s full financing costs cannot be reported. As a result, a portion of the provider’s reported margins may be needed to offset the financing costs that are not included in Medicare cost reports.
59On average, facility margins were also higher (1) the greater the percentage of residents whose stay was paid by Medicare, (2) the greater the number of beds, (3) the greater the occupancy rate, and (4) the lesser the degree of competition in the county.
Facility Margins for PI Homes Increased and Were Higher on Average than for Other Homes

Page 34 GAO-11-571 Private Investment Nursing Home Ownership
Figure 11: Facility Margins for PI, Other For-Profit, and Nonprofit Homes, 2003 and 2008
Our examination of facility margins for each of five PI firms’ homes indicated some differences between firms. We found that two firms’ homes showed an increase in facility margins that was greater than other homes acquired by PI we studied. Representatives of one of these firms told us that increased margins were the result of increased spending in the homes with a focus on investments in technology, staffing, and treating higher acuity residents. They told us that the strategy of the nursing home chain they acquired had not changed and that both increased spending and margins were present before the acquisition. Two firm’s homes showed a change in facility margins that was less than other PI homes. Representatives for the nursing home chain operating one of these two sets of homes commented that they had not been focused on the margins; the chain’s chief executive officer noted that he
-2
-1
0
1
2
3
4
5
6
7
200820032008200320082003
Average facility margins (percentage)
PI-acquired
Source: GAO analysis of Medicare SNF cost reports.
Other for-profit Nonprofit
The numbers presented in this figure are based on unadjusted data, but the following key differences were significant (except where noted) after adjusting for control variables. The average facility margins:• Were higher for PI homes than other for-profit and nonprofit homes in both 2003 and 2008.• Increased from 2003 to 2008 in PI homes, and this change did not differ significantly from the change in other for-profit homes.• Decreased from 2003 to 2008 in nonprofit homes.
Page 35 GAO-11-571 Private Investment Nursing Home Ownership
was evaluated by its PI owner based on the quality of care provided, not margins.
The acquisition of nursing homes by private investment firms has raised questions about the potential effects on the quality of care. Our analyses did not find an increase in the likelihood of serious deficiencies or a decrease in average reported total nurse staffing for the PI-acquired homes we studied. In fact, reported RN staffing increased more in PI-acquired homes than other homes. However, the performance of these PI homes was mixed with respect to the other quality variables we examined. For example, PI-acquired homes had more total deficiencies and lower total nurse staffing ratios than nonprofit homes, both before and after acquisition. Also, despite concerns that PI firms might cut costs to improve profitability, we found that reported facility costs increased in the PI-acquired homes we studied. Margins also increased in the PI-acquired homes we studied from before to after acquisition, while they decreased in nonprofit homes. It is possible to increase both costs and margins because certain expenditures may prevent subsequent, costly care, or increase a home’s attractiveness to better paying residents. PI-acquired homes were more similar to for-profit than to nonprofit homes with respect to the change in margins and total deficiencies, but were like neither for-profit nor nonprofit homes with respect to the change in staffing mix and capital-related costs. In addition, compared to homes for which the same PI firm acquired both operations and real estate, PI-acquired homes for which ownership was split had lower reported RN ratios, higher reported capital-related costs, and lower reported facility margins in the period after acquisition.
Our findings were consistent with the fact that PI firms we studied are to varying degrees attempting to increase the attractiveness of their homes to higher paying residents, including those whose care is reimbursed by Medicare. The homes acquired by the PI firms we studied had a higher average proportion of Medicare residents both before and after acquisition. Our analyses and interviews with PI firm officials revealed differences in their management approaches. For example:
Officials at two PI firms noted that they were continuing the existing strategy of the homes they acquired by expanding the capacity to care for residents with high acuity or specialized needs. Consistent with their strategies, both firms’ homes reported a greater increase in RN staffing from 2003 to 2009 than other PI-acquired homes. One of these firms indicated that facility modernization, which was associated with its strategy, had continued since acquisition and in fact access to
Concluding Observations
Page 36 GAO-11-571 Private Investment Nursing Home Ownership
capital for such improvements had increased after acquisition. Both firms’ homes showed an increase in facility margins that was greater than the other PI homes we studied.
Officials at a third PI firm stated that training can be more important than the number of staff and so focused on training and reducing staff turnover. They also stated that they did not focus on facility improvements to the same degree as other PI firms. The increase in facility margins for this firm’s homes was less than for other PI firms. We also found that the likelihood of a serious deficiency for this firm’s homes was lower than for other PI firms’ homes in both 2003 and 2009.
We provided a draft of this report to the Department of Health and Human Services (HHS) for comment and also invited the PI firms from which we obtained information for this report to review the draft.60 In its written comments, HHS provided CMS’s observations on our methodology. HHS’s comments are reproduced in appendix II. CMS suggested an alternative to our “before and after” acquisition methodology to take into account the fact that PI firms acquired nursing homes at different points in time during 2004 through 2007. In addition, CMS identified a number of alternative analyses that it believed could help to explore the relationship between PI ownership and quality. CMS also acknowledged that the report is an important step toward better understanding the effect of nursing home ownership on the quality of care provided to residents. In general, representatives of the PI firms commented that the report handled a complex topic well and that its conclusions were fair and balanced. Several also commented that our acknowledgement of limitations to our analyses was important.
The alternative methodology presented in CMS’s comments would tailor a pre and post analysis to the year prior to each PI firm’s acquisition of a nursing home chain and to a time point after the acquisition. One of the studies we cited used such a methodology.61 We chose to use a different methodology and believe that the use of different methodologies enhances the understanding of an issue. Our methodology used 2003
60In two cases, companies that operate homes owned by PI firms reviewed the draft. We refer to all reviewers as representatives of the PI firms—eight firms in total.
61See D. Stevenson and D. Grabowski.
Agency Comments and Our Evaluation
CMS
Page 37 GAO-11-571 Private Investment Nursing Home Ownership
(pre) and 2008/2009 (post) for nursing homes acquired by PI firms from 2004 to 2007, irrespective of the specific year in which the acquisition occurred.62 We selected the 2004 through 2007 timeframe because it was the period of heaviest PI acquisition of nursing home chains. Finally, CMS said that the exclusion of homes acquired from 2004 through 2007 but sold by PI firms by 2009 could have biased our results. However, only 6 homes were excluded because they were sold and another 55 were excluded because we could not verify they were still owned by the acquiring PI firm in 2009. These exclusions represented less than 5 percent of the PI homes we studied. We believe these exclusions were appropriate and that it is unlikely that such a small share of homes would have notably affected our findings.
CMS also suggested a number of alternative approaches for exploring the relationship between private investment and quality of care, such as (1) using measures derived from its Five-Star Quality Rating System, (2) examining the citation of serious deficiencies on successive surveys, and (3) studying the association between aggregate staffing payroll and quality of care. We agree that there are other approaches that can be used to study the relationship between ownership and nursing home quality of care. We chose well-defined measures of deficiencies and nurse staffing that we and others have used to study nursing home quality.
In a few instances, CMS’s comments did not accurately describe our findings. For example, CMS stated that the increase in capital-related costs at PI-acquired homes from 2003 to 2008 was related largely to improving the attractiveness of facilities—facility modernization—to higher paying residents. However, we concluded that the increase in RN staffing from 2003 to 2009 was a key aspect of PI firms’ strategies to attract higher acuity, higher paying residents. In addition, CMS states that our study shows that CNA and total nurse staffing ratios decreased in PI homes. Rather, we report that average reported CNA ratios for PI homes did not change significantly from 2003 to 2009 and that average reported total nurse staffing ratios for PI homes increased from 2003 to 2009. Finally, we did not find that average total staffing ratios for any PI firms’ homes decreased or were unchanged from 2003 to 2009. Instead, we
62We used the latest available data—2008 for financial performance and 2009 for deficiency and staffing—in order to give any changes associated with PI acquisition time to take effect.

Page 38 GAO-11-571 Private Investment Nursing Home Ownership
reported that average total staffing increased in PI homes, although the increase in one firm’s homes was not as great as in other PI homes.
Representatives of most of the PI firms who provided oral comments generally told us that the report handled a complex topic well and they appreciated our statement of limitations of our methodology. However, several were concerned that the presentation of the report over-emphasized results that reflected poorly on PI firms. Representatives of two firms specifically mentioned that the report presented negative findings first, saving the more positive results for later and suggested that not everyone would read far enough to learn about the positive findings relative to the PI firms we studied or to read GAO’s conclusions. For example, we discuss total deficiencies and staffing before turning our attention to subsets of these measures—serious deficiencies and RN staffing. In serious deficiencies, PI firms’ homes were comparable to nonprofit homes and in RN staffing they compared favorably to nonprofit homes. However, we believe we present the findings fairly and in a logical order.
In addition, representatives of several PI firms provided specific comments on our findings about deficiencies and staffing. Regarding deficiencies cited on standard surveys and complaint investigations, one PI firm representative stated that the survey process resulted in more scrutiny of for-profit homes than nonprofit nursing homes. We consider cited deficiencies, particularly serious deficiencies, important measures of quality of nursing home care and our research has found that they represent real lapses in the care provided. Regarding our analysis of staffing ratios, the representatives of one firm stated that our analysis did not take into account staff efficiency. These representatives said that they had invested in labor saving technology. While staff efficiency may offset the need for more staff, in our analyses we could not measure or control for differences in staff efficiency using our datasets. The representatives of a different firm commented that we did not address changes in therapy staffing, noting that therapy staff had increased in its homes and that this increase offset some of the need for CNA staff. In our analysis of staffing, we chose to focus on nurse staffing because other research has associated it with quality of care.
In general, representatives of the PI firms said that our findings on facility costs and margins were consistent with their own analyses. However, representatives of one firm explained that what we called “costs” they considered “investments.” They said that money spent to train staff, modernize facilities, and adopt electronic medical records reduced errors,
PI Firms
Page 39 GAO-11-571 Private Investment Nursing Home Ownership
prevented subsequent costs, and also improved care. On Medicare cost reports, such expenditures are generally known as costs. A different PI firm commented that our finding that capital-related costs were higher when ownership was split was logical because rents for an operator are generally higher than mortgage payments and may result in lower margins and discourage investments in RN staffing. A few PI firms also stated that the Medicare cost reports were not necessarily accurate with respect to capital-related costs. We acknowledged that the data in the Medicare cost reports are self-reported and have limitations, but all nursing homes are subject to the same reporting requirements and limitations and thus these data are comparable across the groups we analyzed.
We incorporated technical comments provided by CMS and the representatives of PI firms as appropriate.
As agreed with your offices, unless you publicly announce the contents of this report earlier, we plan no further distribution until 30 days from the report date. At that time, we will send copies to the Secretary of Health and Human Services, the Administrator of the Centers for Medicare & Medicaid Services, and other interested parties. In addition, the report will be available at no charge on the GAO Web site at http://www.gao.gov.
If you or your staff have any questions about this report, please contact me at (202) 512-7114 or at [email protected]. Contact points for our Offices of Congressional Relations and Public Affairs may be found on the last page of this report. GAO staff who made key contributions to this report are listed in appendix III.
John E. Dicken Director, Health Care

Appendix I: Scope and Methodology
Page 40 GAO-11-571 Private Investment Nursing Home Ownership
To determine whether nursing homes that are owned by private investment (PI) firms differ from other nursing homes in deficiencies cited on state surveys, nurse staffing levels, or financial performance, we (1) identified nursing homes for which PI firms had acquired the operations or the real estate or both from 2004 through 2007 and (2) compared data from before and after acquisition of these homes to data from other nursing homes, including other for-profit homes and nonprofit homes. In addition, we reviewed published research on the quality and costs of nursing home care, our prior work on nursing homes, and other relevant documentation. We interviewed officials from the Centers for Medicare & Medicaid Services (CMS); representatives of PI firms that acquired nursing home operations, real estate, or both; representatives of companies that operate PI-owned nursing homes; and experts on nursing home quality and costs. This appendix provides information about (1) our data sources and the development of our analytic datasets, (2) our analytic approach, and (3) data reliability and limitations.
Based on our earlier work identifying the top 10 PI acquirers of nursing homes, we developed a list of homes acquired by PI firms from 2004 through 2007.1 We chose 2004 through 2007 as our target acquisition interval because these were the years during which PI firms acquired the greatest number of nursing homes.2 We obtained data for our outcome variables from CMS. We used CMS’s Online Survey, Certification, and Reporting system (OSCAR) as our source of data regarding deficiencies, nurse staffing, and characteristics of all the nursing homes we analyzed, including PI, other for-profit, and nonprofit homes. OSCAR is the only
1See GAO, Nursing Homes: Complexity of Private Investment Purchases Demonstrates Need for CMS to Improve the Usability and Completeness of Ownership Data, GAO-10-710 (Washington, D.C.: Sept. 30, 2010). This report determined the top 10 PI acquirers of nursing homes based on the number of homes purchased and retained by firms from 1998 through 2008. To identify acquisitions, this report used merger and acquisition data compiled by Dealogic, a company that offers financial analysis products to the investment banking industry. We supplemented the Dealogic data with information from other sources, such as company Web sites, nursing home industry publications, and company filings with the Securities and Exchange Commission. Nine of these PI firms provided us with information about their acquisitions; the other did not respond to any of our requests for data.
2Specifically, 595 nursing homes were acquired by PI firms in 2004, 39 in 2005, 682 in 2006, and 525 in 2007. See GAO-10-710. We defined the date of acquisition in terms of the most recent PI acquisition of operations, real estate, or both.
Appendix I: Scope and Methodology
Data Sources and Development of Analytic Datasets
Appendix I: Scope and Methodology
Page 41 GAO-11-571 Private Investment Nursing Home Ownership
national, uniform data source that contains this information. We used Medicare Skilled Nursing Facility (SNF) Cost Reports as our source of data regarding the financial performance of nursing homes. These reports are the only publicly available source of financial data on most Medicare providers and are a primary source of data used by CMS and others to examine nursing homes’ financial performance.
We identified nursing homes with three types of ownership: PI-owned, other for-profit, and nonprofit.
PI-owned nursing homes. We developed a list of nursing homes owned by the top 10 PI acquirers of nursing homes identified in our September 2010 report using information that these firms provided and other sources, such as nursing home chain Web sites.3 These 10 PI firms accounted for almost 90 percent of the nursing homes that were acquired by PI firms from 1998 through 2008. We included homes for which a PI firm acquired operations, real estate, or both, and were still owned by the acquiring PI firm in 2009.4 To compare data from before and after acquisition, we excluded homes acquired before 2004 or after 2007. We also reviewed information from the PI firms and other sources to determine whether the same PI firm acquired both the operations and real estate of these homes. When we could not determine whether the same PI firm owned both the operations and the real estate for a particular home—for example, when we knew that a PI firm owned the real estate for most, but not all, of the homes for which it owned operations, but we did not know which specific homes those were—we assigned it to the group with that firm’s usual ownership pattern.5
Other for-profit and nonprofit homes. We used OSCAR to identify the for-profit and nonprofit nursing homes that we compared to PI homes. To ensure that our comparison groups were appropriate, we excluded homes that were hospital-based or government-owned in 2009 (because they differ from other nursing homes in important ways, including resident
3See GAO-10-710.
4We did not differentiate among PI-acquired homes based on prior ownership, which could have been PI, other for-profit, or nonprofit.
5We could not determine whether the same PI firm acquired both the operations and the real estate or not for about 9 percent of the PI homes we identified. Although other for-profit and nonprofit homes may also have separate owners of operations and real estate, CMS did not capture relevant information in national databases.
Identification of Homes with Different Types of Ownership
Appendix I: Scope and Methodology
Page 42 GAO-11-571 Private Investment Nursing Home Ownership
needs and financial performance) and homes that were not certified by Medicare in 2009 (because almost all homes owned by the PI firms in our review were Medicare-certified).6 We also excluded homes for which we could not identify data from both before and after our target acquisition interval.
OSCAR also includes data on nursing home characteristics, including profit status; chain affiliation; facility size as indicated by the number of beds certified by Medicare, Medicaid, or both; and state.7 OSCAR also includes information about the number of residents and their payers, which we used to calculate the percentage of residents whose care was paid by Medicare, Medicaid, or a source other than Medicare or Medicaid, and occupancy rate.8
We identified separate datasets for our analyses of deficiencies, nurse staffing, and financial performance.
Deficiencies. To examine deficiencies, we used OSCAR data. OSCAR includes data about deficiencies that were cited during standard surveys of nursing homes (which are to be conducted, on average, every 12 months) and during complaint investigations, along with the dates of those surveys and investigations, allowing comparison of data from different points in time. Deficiencies identified during either type of survey are placed into 1 of 12 categories, identified by letter, according to the number of residents potentially or actually affected and the degree of relative harm involved. (See table 1.) Throughout this report, we refer to deficiencies at the actual harm and immediate jeopardy levels as serious deficiencies.
6Nursing homes enrolled in the Medicaid program alone (and not jointly enrolled in the Medicare and Medicaid programs) accounted for approximately 4 percent of nursing homes participating in either program during 2009.
7Chain affiliation is indicated in OSCAR by a nursing home’s self-reported multi-nursing home (chain) ownership, where multi-nursing home chains are defined as having two or more homes under one ownership or operation.
8Payers other than Medicare and Medicaid include private insurance, religious organizations, the Department of Veterans Affairs, residents who pay for their own care, and others.
Identification of Nursing Home Characteristics
Identification of Datasets for Our Outcome Measures
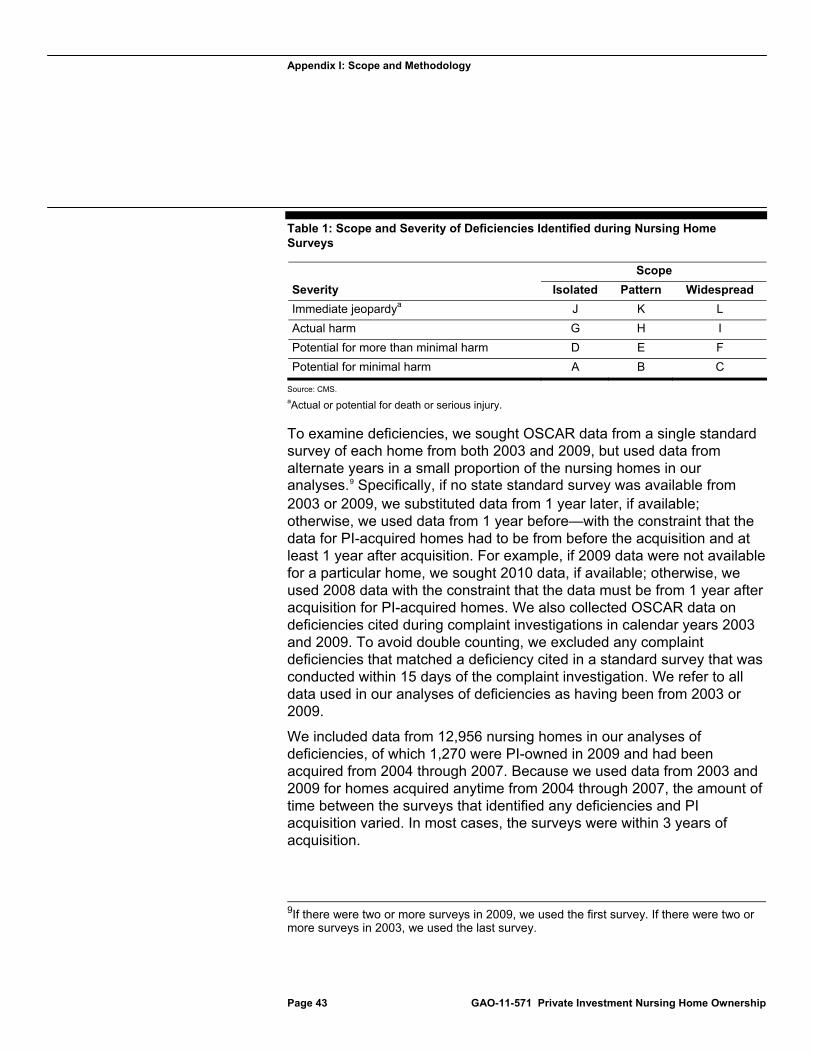
Appendix I: Scope and Methodology
Page 43 GAO-11-571 Private Investment Nursing Home Ownership
Table 1: Scope and Severity of Deficiencies Identified during Nursing Home Surveys
Scope
Severity Isolated Pattern Widespread
Immediate jeopardya J K L
Actual harm G H I
Potential for more than minimal harm D E F
Potential for minimal harm A B C
Source: CMS.
aActual or potential for death or serious injury.
To examine deficiencies, we sought OSCAR data from a single standard survey of each home from both 2003 and 2009, but used data from alternate years in a small proportion of the nursing homes in our analyses.9 Specifically, if no state standard survey was available from 2003 or 2009, we substituted data from 1 year later, if available; otherwise, we used data from 1 year before—with the constraint that the data for PI-acquired homes had to be from before the acquisition and at least 1 year after acquisition. For example, if 2009 data were not available for a particular home, we sought 2010 data, if available; otherwise, we used 2008 data with the constraint that the data must be from 1 year after acquisition for PI-acquired homes. We also collected OSCAR data on deficiencies cited during complaint investigations in calendar years 2003 and 2009. To avoid double counting, we excluded any complaint deficiencies that matched a deficiency cited in a standard survey that was conducted within 15 days of the complaint investigation. We refer to all data used in our analyses of deficiencies as having been from 2003 or 2009.
We included data from 12,956 nursing homes in our analyses of deficiencies, of which 1,270 were PI-owned in 2009 and had been acquired from 2004 through 2007. Because we used data from 2003 and 2009 for homes acquired anytime from 2004 through 2007, the amount of time between the surveys that identified any deficiencies and PI acquisition varied. In most cases, the surveys were within 3 years of acquisition.
9If there were two or more surveys in 2009, we used the first survey. If there were two or more surveys in 2003, we used the last survey.
Appendix I: Scope and Methodology
Page 44 GAO-11-571 Private Investment Nursing Home Ownership
Nurse staffing. We calculated four different staffing ratios, that is, nursing hours per resident per day: registered nurse (RN) ratios, licensed practical nurse (LPN) ratios, certified nurse aid (CNA) ratios, and total nurse staffing ratios (i.e., the total number of nursing hours, whether by RNs, LPNs, or CNAs, per resident per day).10 In each case, we included full-time, part-time, and contract hours, but we excluded hours reported for performing administrative duties or as Directors of Nursing. When calculating CNA staffing, we also included two other types of nursing staff—nurse aides in training and medication aides.
We used the same set of nursing homes included in our analyses of deficiencies to analyze nurse staffing, but excluded homes from the staffing analyses if the data related to staffing appeared to represent data entry or other reporting errors. Specifically, we excluded facilities that, in either 2003 or 2009, reported
more residents than beds, more than 10 percent of the home’s beds as not certified for Medicare
or Medicaid,11 0 total nursing hours per resident per day, 24 or more total nursing hours per resident per day, or staffing and census data that resulted in nurse staffing ratios that were
three or more standard deviations above the mean, indicating that they were statistical outliers.
We included data from 11,522 nursing homes in our analyses of staffing ratios, of which 1,176 were PI-owned in 2009 and acquired from 2004 through 2007.
10Some states use the term licensed vocational nurse rather than LPN. Throughout this report we use LPN to refer to both.
11Facilities are instructed to report only residents in certified beds. If a nursing home had residents in noncertified beds, actual nursing hours per resident per day would be lower than our calculations indicate. We considered several criteria for excluding homes based on the percentage of noncertified beds and concluded that excluding homes with more than 10 percent of noncertified beds results in data of sufficient reliability for our purposes.
Appendix I: Scope and Methodology
Page 45 GAO-11-571 Private Investment Nursing Home Ownership
Financial performance. To examine nursing homes’ financial performance, we used Medicare SNF cost reports to compute three measures:
Facility costs per resident day, defined as the total facility costs—including both operating and capital costs—divided by total resident days.12
Capital-related costs per resident day, defined as capital-related costs
allocated to nursing home resident care divided by total resident days.13
Facility margins, defined as the amount of total facility revenues
exceeding total facility costs, divided by total facility revenues.14
All Medicare-certified nursing homes—or SNFs—must submit cost reports on an annual basis to CMS. The cost report contains provider information—such as facility characteristics, utilization data, costs, and financial data—generally covering a 12-month period of operations based on the provider’s fiscal year.15 The cost report contains utilization and cost information on Medicare-covered services, and also contains information for services provided to all residents, regardless of payer.
12Facility costs were taken from the Medicare SNF cost report’s G-2 and G-3 worksheets. Facility costs were adjusted for inflation. Less than 25 percent of nursing homes’ margins we analyzed included costs and revenues for other lines of business conducted within the same nursing home, such as other long-term care, home health, outpatient rehabilitation services, and hospice.
13Capital-related costs are those that were allocated to nursing home resident care on the Medicare SNF cost report’s worksheet B, part II. These costs include mortgage payments, rents, improvements to land, buildings and equipment, depreciation, taxes, and property insurance. We adjusted capital-related costs for inflation.
14Facility revenues include net patient and other income from the Medicare SNF cost report’s worksheet G-3. These revenues include Medicare payments, which are based on a per diem amount for each Medicare beneficiary. The per diem is adjusted for geographic differences in labor costs and for differences in the resource needs of the Medicare resident. Facility costs are the same as described above. Margins calculated in this way are interpreted as the percent profit or loss that the nursing home experiences for the year. Less than 25 percent of nursing homes’ margins we analyzed included costs and revenues for other lines of business conducted within the same nursing home, such as other long-term care, home health, outpatient rehabilitation services, and hospice.
15Generally, a provider’s fiscal year is a 12-month period, but under certain circumstances, a provider may prepare a cost report for a period that is less than or greater than 12 months.
Appendix I: Scope and Methodology
Page 46 GAO-11-571 Private Investment Nursing Home Ownership
We used cost report data for the provider’s fiscal years 2003 and 2008 because fiscal year 2009 Medicare SNF cost reports were not available at the time we collected our data. For PI-acquired homes, we ensured that these data were from before and after acquisition.16 Our analyses of financial data also required information from OSCAR about facility characteristics such as the percentage of residents whose care was paid by Medicare or Medicaid and occupancy rate. We sought OSCAR data from calendar years 2003 and 2008, and if these data were not available, we substituted data from 1 year after, if available, otherwise 1 year before.17 We refer to all data used in our analyses of financial performance as having been from 2003 or 2008.
We created different datasets to examine our three calculated measures of financial performance. For each measure, we excluded nursing homes if the cost report covered less than 10 or more than 14 months and those that did not have Medicare SNF cost reports or OSCAR data from both time periods.18 We also excluded nursing homes for which the data appeared to represent data entry or other reporting anomalies or were statistical outliers.
Facility costs. Data for our analyses of facility costs were from 9,616 nursing homes, of which 1,089 were PI-owned in 2009 and acquired from 2004 through 2007. We excluded homes that, in either 2003 or 2008, reported
no facility costs or facility costs per resident day that were more than two times the
interquartile range below the 25th or above the 75th percentile.
16About 38 percent of PI homes we studied were acquired less than 1 year before the time period reflected by their 2008 Medicare cost report.
17We used a similar procedure to the one described for the deficiency data, with the constraint that the OSCAR data for PI-acquired homes had to be from before the acquisition and after acquisition.
18The differences between the numbers of nursing homes included in these datasets and those used to analyze deficiencies and nurse staffing were primarily due to the restrictions on the time period covered by the cost report and the requirement for data from both years.
Appendix I: Scope and Methodology
Page 47 GAO-11-571 Private Investment Nursing Home Ownership
Capital costs. Data for our analyses of capital-related costs were from 9,707 nursing homes, of which 1,088 were PI-owned in 2009 and acquired from 2004 through 2007. We excluded facilities that, in either 2003 or 2008, reported
no capital-related costs or
capital costs per resident day that were more than two times the
interquartile range below the 25th or above the 75th percentile.
Facility margins. Data for our analyses of facility margins were from
8,630 nursing homes, of which 955 were PI-owned in 2009 and acquired from 2004 through 2007. We excluded facilities that, in either 2003 or 2008, reported
no facility revenues or missing margins or
facility margins that were in the top or bottom 1 percent of all
homes we studied, regardless of type of ownership.19
Table 2 lists the variables we included in our datasets, describes our operational measures of these variables, and identifies the sources of the data we used to calculate these measures.
19Because our outcome measures had different distributions, our criteria for identifying outliers differed. There were fewer nursing homes retained in our examination of facility margins than either facility costs or capital-related costs because there more nursing homes with extreme values for margins than for facility or capital-related costs.
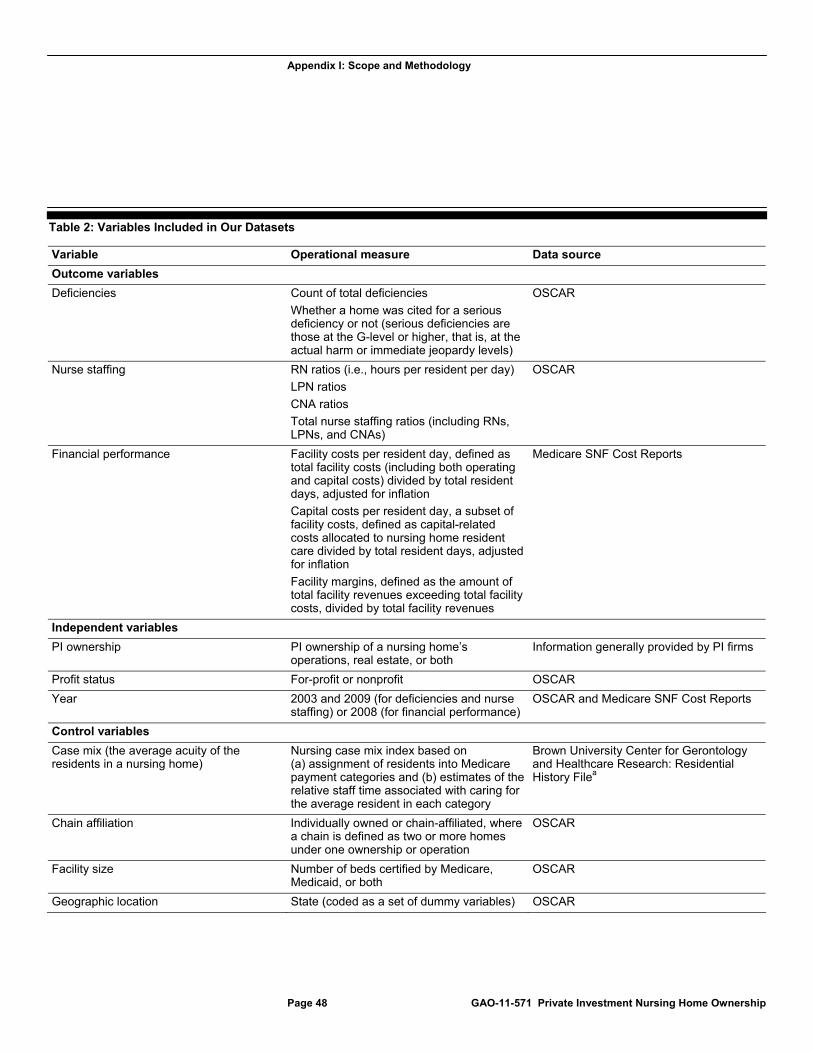
Appendix I: Scope and Methodology
Page 48 GAO-11-571 Private Investment Nursing Home Ownership
Table 2: Variables Included in Our Datasets
Variable Operational measure Data source
Outcome variables
Deficiencies Count of total deficiencies
Whether a home was cited for a serious deficiency or not (serious deficiencies are those at the G-level or higher, that is, at the actual harm or immediate jeopardy levels)
OSCAR
Nurse staffing RN ratios (i.e., hours per resident per day)
LPN ratios
CNA ratios
Total nurse staffing ratios (including RNs, LPNs, and CNAs)
OSCAR
Financial performance Facility costs per resident day, defined as total facility costs (including both operating and capital costs) divided by total resident days, adjusted for inflation
Capital costs per resident day, a subset of facility costs, defined as capital-related costs allocated to nursing home resident care divided by total resident days, adjusted for inflation
Facility margins, defined as the amount of total facility revenues exceeding total facility costs, divided by total facility revenues
Medicare SNF Cost Reports
Independent variables
PI ownership PI ownership of a nursing home’s operations, real estate, or both
Information generally provided by PI firms
Profit status For-profit or nonprofit OSCAR
Year 2003 and 2009 (for deficiencies and nurse staffing) or 2008 (for financial performance)
OSCAR and Medicare SNF Cost Reports
Control variables
Case mix (the average acuity of the residents in a nursing home)
Nursing case mix index based on (a) assignment of residents into Medicare payment categories and (b) estimates of the relative staff time associated with caring for the average resident in each category
Brown University Center for Gerontology and Healthcare Research: Residential History Filea
Chain affiliation Individually owned or chain-affiliated, where a chain is defined as two or more homes under one ownership or operation
OSCAR
Facility size Number of beds certified by Medicare, Medicaid, or both
OSCAR
Geographic location State (coded as a set of dummy variables) OSCAR
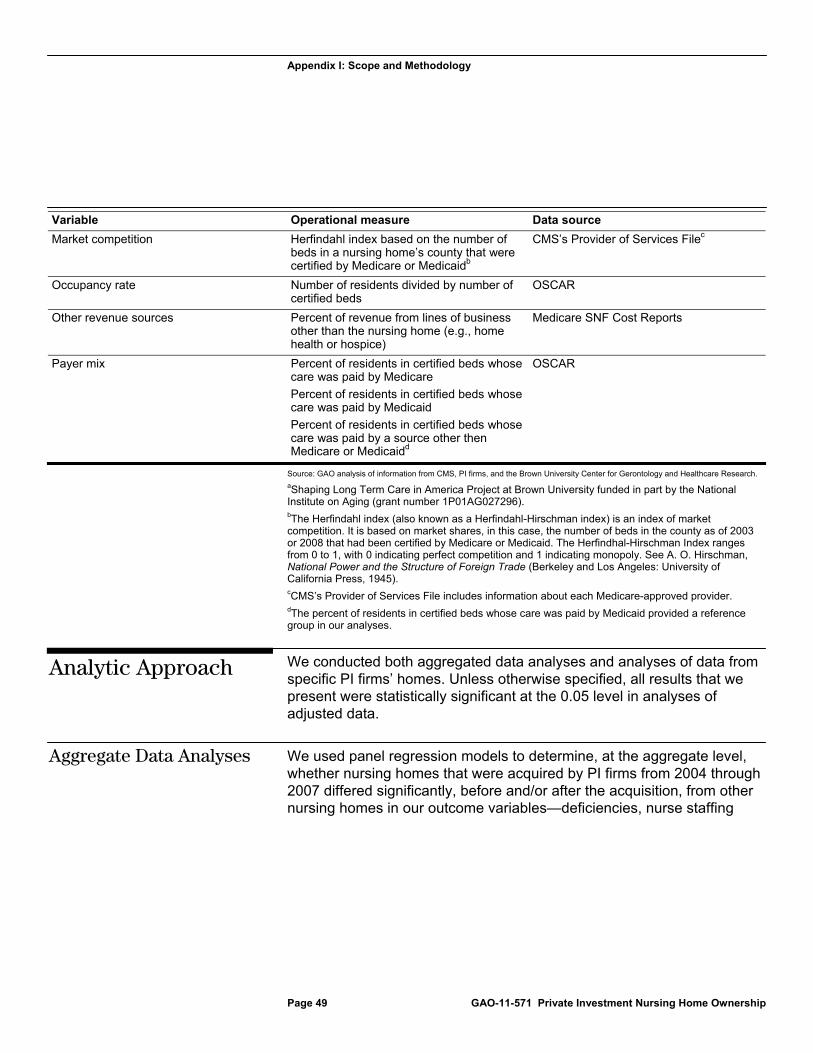
Appendix I: Scope and Methodology
Page 49 GAO-11-571 Private Investment Nursing Home Ownership
Variable Operational measure Data source
Market competition Herfindahl index based on the number of beds in a nursing home’s county that were certified by Medicare or Medicaidb
CMS’s Provider of Services Filec
Occupancy rate Number of residents divided by number of certified beds
OSCAR
Other revenue sources Percent of revenue from lines of business other than the nursing home (e.g., home health or hospice)
Medicare SNF Cost Reports
Payer mix Percent of residents in certified beds whose care was paid by Medicare
Percent of residents in certified beds whose care was paid by Medicaid
Percent of residents in certified beds whose care was paid by a source other then Medicare or Medicaidd
OSCAR
Source: GAO analysis of information from CMS, PI firms, and the Brown University Center for Gerontology and Healthcare Research.
aShaping Long Term Care in America Project at Brown University funded in part by the National Institute on Aging (grant number 1P01AG027296). bThe Herfindahl index (also known as a Herfindahl-Hirschman index) is an index of market competition. It is based on market shares, in this case, the number of beds in the county as of 2003 or 2008 that had been certified by Medicare or Medicaid. The Herfindhal-Hirschman Index ranges from 0 to 1, with 0 indicating perfect competition and 1 indicating monopoly. See A. O. Hirschman, National Power and the Structure of Foreign Trade (Berkeley and Los Angeles: University of California Press, 1945). cCMS’s Provider of Services File includes information about each Medicare-approved provider. dThe percent of residents in certified beds whose care was paid by Medicaid provided a reference group in our analyses.
We conducted both aggregated data analyses and analyses of data from specific PI firms’ homes. Unless otherwise specified, all results that we present were statistically significant at the 0.05 level in analyses of adjusted data.
We used panel regression models to determine, at the aggregate level, whether nursing homes that were acquired by PI firms from 2004 through 2007 differed significantly, before and/or after the acquisition, from other nursing homes in our outcome variables—deficiencies, nurse staffing
Analytic Approach
Aggregate Data Analyses

Appendix I: Scope and Methodology
Page 50 GAO-11-571 Private Investment Nursing Home Ownership
levels, or financial performance.20 Using these models, we compared outcome data from homes with different types of ownership (PI, other for-profit, and nonprofit) at each of two points in time (2003 and 2009 for deficiencies and staffing, and 2003 and 2008 for financial performance) and we examined whether there were differences between years for PI homes and whether any such differences were similar to any differences between years in the other for-profit and nonprofit homes. We included data from before PI acquisition so we could determine whether the postacquisition data reflected preexisting differences. We included data from other types of nursing homes so we could determine whether any changes from before to after acquisition reflected changes that occurred regardless of type of ownership. We also compared data from PI homes for which the same firm acquired both operations and real estate to data from PI homes for which the same firm did not acquire both operations and real estate.
Our panel regression models statistically controlled for variables that research has shown can influence nursing home deficiencies, staffing, and financial performance. These variables were (1) the percentage of residents for whom the payer was Medicare in 2003 and 2009; (2) the percentage of residents for whom the payer was neither Medicare nor Medicaid in 2003 and 2009; (3) chain affiliation in 2009; (4) facility size as indicated by the number of beds certified by Medicare, Medicaid, or both in 2009; (5) occupancy rate in 2003 and 2009; (6) market competition in 2003 and 2008; and (7) geographic location (state).21
We used random effects models rather than fixed effects models to measure not only the change in outcomes for the same nursing home groups over time, but also the difference between groups at each point in time. Moreover, we wanted to accurately reflect the change over time in our control variables and their effects on our outcome variables—
20Panel regression models can be used when data come from a cross-section of entities—in this case, nursing homes—and are collected at two or more points in time. Such models allow comparisons of data from the different points in time. We also conducted panel regression analyses on some key covariates (a) the percentage of residents for whom the payer was Medicare, (b) the percentage of residents for whom the payer was neither Medicare nor Medicaid, and (c) occupancy rate. In these analyses, we examined the effects of type of ownership and year; we did not include any control variables in these analyses.
21We defined market competition in terms of the number of beds in a nursing home’s county using a Herfindahl index. This index can range from 0, indicating perfect competition, to 1, indicating monopoly.

Appendix I: Scope and Methodology
Page 51 GAO-11-571 Private Investment Nursing Home Ownership
something that can be accomplished using a random effects model, but not a fixed effects model.
Illustration. To illustrate our analytic strategy, consider the example of reported RN ratios. Unadjusted average (or mean) reported RN ratios are presented in table 3, along with the number of homes in our analyses.
Table 3: Unadjusted Average Reported RN Ratios (Hours per Resident per Day)
Type of ownership (number of nursing homes) 2003 2009
Change from 2003 to 2009
PI homes (1,176) 0.298 0.397 0.100
Other for-profit homes (7,677) 0.275 0.307 0.032
Nonprofit homes (2,669) 0.365 0.393 0.029
Source: GAO analysis of OSCAR data.
Our panel models analyze the data to identify the size and statistical significance of differences between means. Statistical significance is indicated by the probability (P-value) of coefficients calculated by the panel regression for the comparisons it tests. The specific comparisons tested by our panel regressions are based on independent variables and their interactions. Our panel regression models included a main effect for year and a main effect for ownership type (PI, other for-profit, and nonprofit). The models also included an interaction between year and ownership type, which allowed for the comparison of data between different types of ownership at each point in time as well as the difference between years.22 Therefore, the five terms in the model are year, other for-profit homes, nonprofit homes, year by other for-profit homes, and year by nonprofit homes. The interpretation of the model terms are as follows: (1) the main effect year measures the difference between 2003 and 2009 for PI homes, (2) the main effect for other for-profit measures the difference between PI and other for-profits in 2003, (3) the main effect
22Categorical variables classify units of study into categories. For example, the categorical variable ownership type classifies nursing homes into three categories: PI, other for-profit, and nonprofit. In statistical models that include a categorical independent variable, where there are k categories, only k-1 dummy indicator variables are necessary to represent k categories in the regression model. The excluded category is the reference category. Year has two categories (2003 and 2009) and is represented by a term for 2009, with 2003 as the reference category for the variable year. Ownership type has three categories and is represented by two terms in our model: other for-profit homes and nonprofit homes, with PI homes as the reference category. Because our model has main effects for year and ownership type as well as their interactions, the reference category in our model is PI homes in 2003.
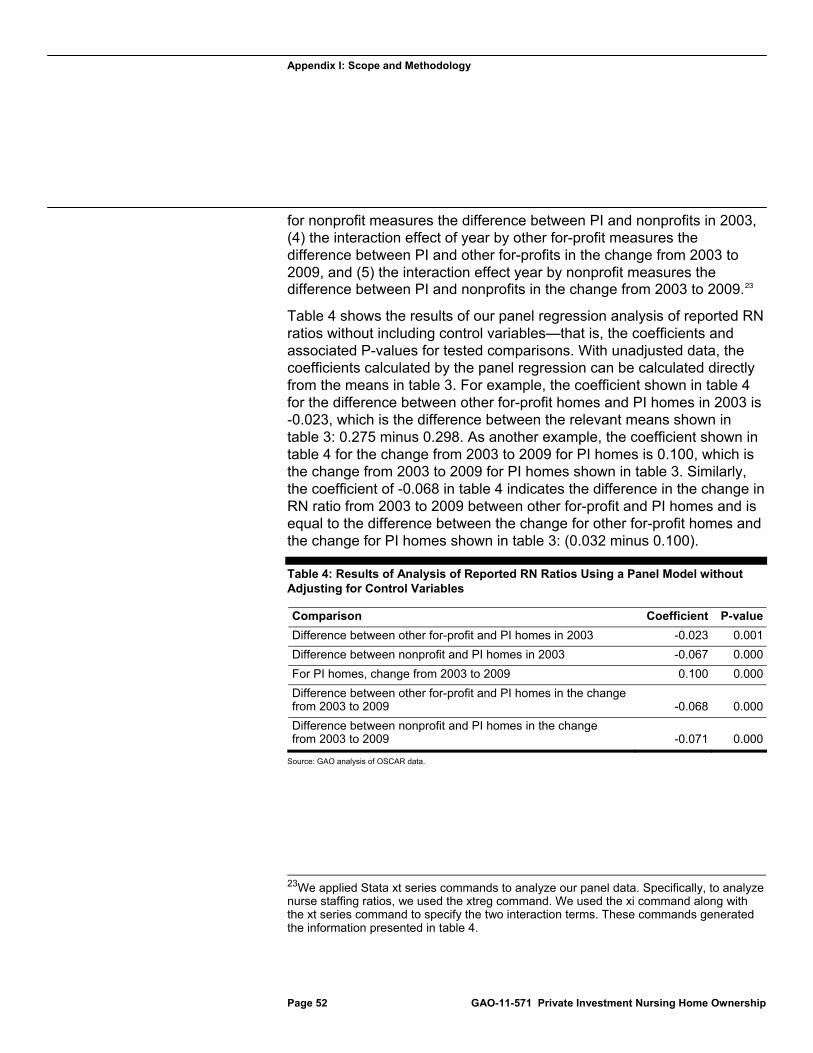
Appendix I: Scope and Methodology
Page 52 GAO-11-571 Private Investment Nursing Home Ownership
for nonprofit measures the difference between PI and nonprofits in 2003, (4) the interaction effect of year by other for-profit measures the difference between PI and other for-profits in the change from 2003 to 2009, and (5) the interaction effect year by nonprofit measures the difference between PI and nonprofits in the change from 2003 to 2009.23
Table 4 shows the results of our panel regression analysis of reported RN ratios without including control variables—that is, the coefficients and associated P-values for tested comparisons. With unadjusted data, the coefficients calculated by the panel regression can be calculated directly from the means in table 3. For example, the coefficient shown in table 4 for the difference between other for-profit homes and PI homes in 2003 is -0.023, which is the difference between the relevant means shown in table 3: 0.275 minus 0.298. As another example, the coefficient shown in table 4 for the change from 2003 to 2009 for PI homes is 0.100, which is the change from 2003 to 2009 for PI homes shown in table 3. Similarly, the coefficient of -0.068 in table 4 indicates the difference in the change in RN ratio from 2003 to 2009 between other for-profit and PI homes and is equal to the difference between the change for other for-profit homes and the change for PI homes shown in table 3: (0.032 minus 0.100).
Table 4: Results of Analysis of Reported RN Ratios Using a Panel Model without Adjusting for Control Variables
Comparison Coefficient P-value
Difference between other for-profit and PI homes in 2003 -0.023 0.001
Difference between nonprofit and PI homes in 2003 -0.067 0.000
For PI homes, change from 2003 to 2009 0.100 0.000
Difference between other for-profit and PI homes in the change from 2003 to 2009 -0.068 0.000
Difference between nonprofit and PI homes in the change from 2003 to 2009 -0.071 0.000
Source: GAO analysis of OSCAR data.
23We applied Stata xt series commands to analyze our panel data. Specifically, to analyze nurse staffing ratios, we used the xtreg command. We used the xi command along with the xt series command to specify the two interaction terms. These commands generated the information presented in table 4.
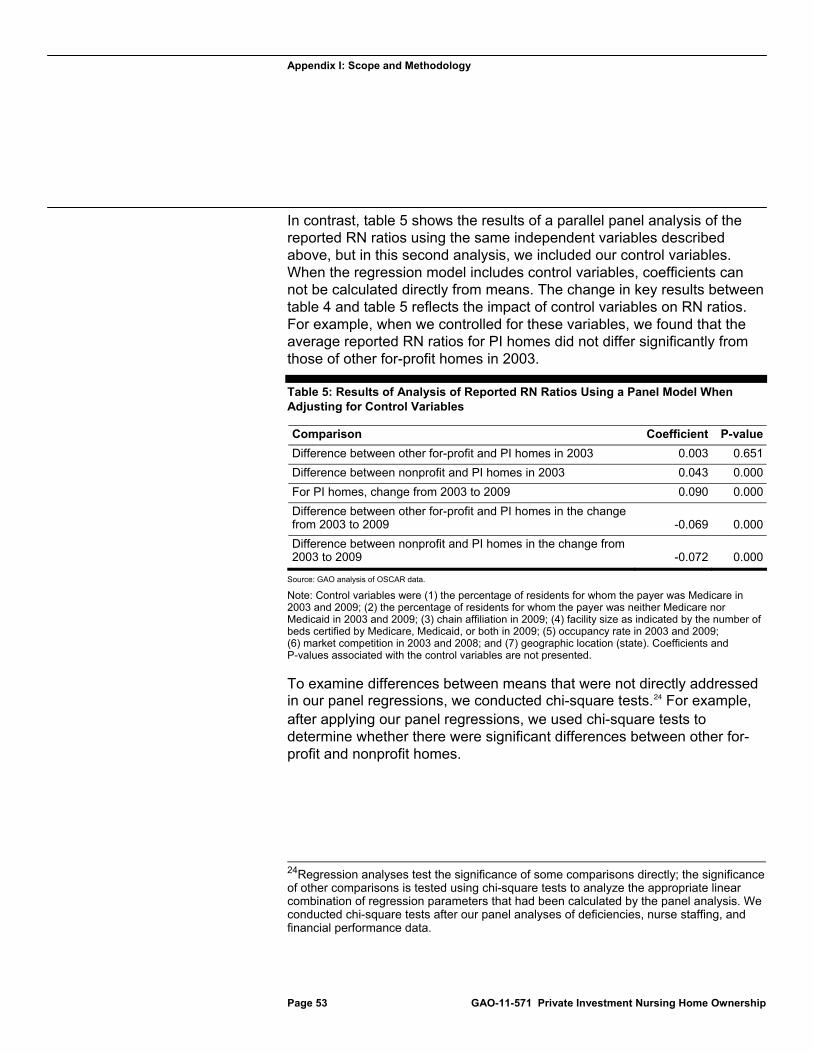
Appendix I: Scope and Methodology
Page 53 GAO-11-571 Private Investment Nursing Home Ownership
In contrast, table 5 shows the results of a parallel panel analysis of the reported RN ratios using the same independent variables described above, but in this second analysis, we included our control variables. When the regression model includes control variables, coefficients can not be calculated directly from means. The change in key results between table 4 and table 5 reflects the impact of control variables on RN ratios. For example, when we controlled for these variables, we found that the average reported RN ratios for PI homes did not differ significantly from those of other for-profit homes in 2003.
Table 5: Results of Analysis of Reported RN Ratios Using a Panel Model When Adjusting for Control Variables
Comparison Coefficient P-value
Difference between other for-profit and PI homes in 2003 0.003 0.651
Difference between nonprofit and PI homes in 2003 0.043 0.000
For PI homes, change from 2003 to 2009 0.090 0.000
Difference between other for-profit and PI homes in the change from 2003 to 2009 -0.069 0.000
Difference between nonprofit and PI homes in the change from 2003 to 2009 -0.072 0.000
Source: GAO analysis of OSCAR data.
Note: Control variables were (1) the percentage of residents for whom the payer was Medicare in 2003 and 2009; (2) the percentage of residents for whom the payer was neither Medicare nor Medicaid in 2003 and 2009; (3) chain affiliation in 2009; (4) facility size as indicated by the number of beds certified by Medicare, Medicaid, or both in 2009; (5) occupancy rate in 2003 and 2009; (6) market competition in 2003 and 2008; and (7) geographic location (state). Coefficients and P-values associated with the control variables are not presented.
To examine differences between means that were not directly addressed in our panel regressions, we conducted chi-square tests.24 For example, after applying our panel regressions, we used chi-square tests to determine whether there were significant differences between other for-profit and nonprofit homes.
24Regression analyses test the significance of some comparisons directly; the significance of other comparisons is tested using chi-square tests to analyze the appropriate linear combination of regression parameters that had been calculated by the panel analysis. We conducted chi-square tests after our panel analyses of deficiencies, nurse staffing, and financial performance data.

Appendix I: Scope and Methodology
Page 54 GAO-11-571 Private Investment Nursing Home Ownership
Deficiencies. To apply a panel model regression to deficiencies, we first examined the data to select an appropriate statistical model and ensure that the data were consistent with relevant statistical assumptions. Our measure of total deficiencies was a count of how many deficiencies were cited in the nursing home. Count variables can be modeled by a negative binomial regression. Coefficients from a negative binomial model represent the expected log-count of an event and can be transformed into incidence-rate ratios, which represent how much more or less the expected incidence rate is for one group in comparison to another. In this report, we refer to these ratios as total deficiencies.
When we examined the data regarding whether a home was cited for a serious deficiency or not, we determined that a different panel regression model was most appropriate. Because a relatively small proportion of nursing homes were cited for serious deficiencies, and most homes with any serious deficiency had no more than two, our measure was whether or not a home had been cited for any serious deficiencies. For such binary outcomes, a logistic regression model is appropriate. Logistic regression model coefficients represent log-odds ratios and can be transformed to odds ratios, which indicate how much more or less likely the odds are for a binary (yes/no) event to occur for one group in comparison to another. In this report, we refer to these ratios as the likelihood of a serious deficiency.
Nurse staffing. After excluding nursing homes with staffing ratios that appeared to represent data entry or other reporting errors, the distribution of each staffing ratio approximated a normal distribution, so we used an Ordinary Least Squares panel regression model to analyze these data.
Financial performance. After excluding nursing homes with extreme values, the distributions of facility costs per resident day and capital-related costs per resident day were highly positively skewed, that is, they were not distributed normally or symmetrically around the average. We transformed these variables by taking their natural logarithms; the resultant distributions were consistent with the relevant statistical assumptions. We used Ordinary Least Squares panel regression models to analyze the log-transformed values.
After excluding nursing homes with extreme values, facility margins approximated a normal distribution, so we used an Ordinary Least Squares panel regression model to analyze the data. We conducted two additional regression analyses of facility margins in which we controlled for case mix (the average acuity of the residents in a nursing home) and other sources of revenue (such as home health or hospice care). We do not report these analyses because each variable was correlated with
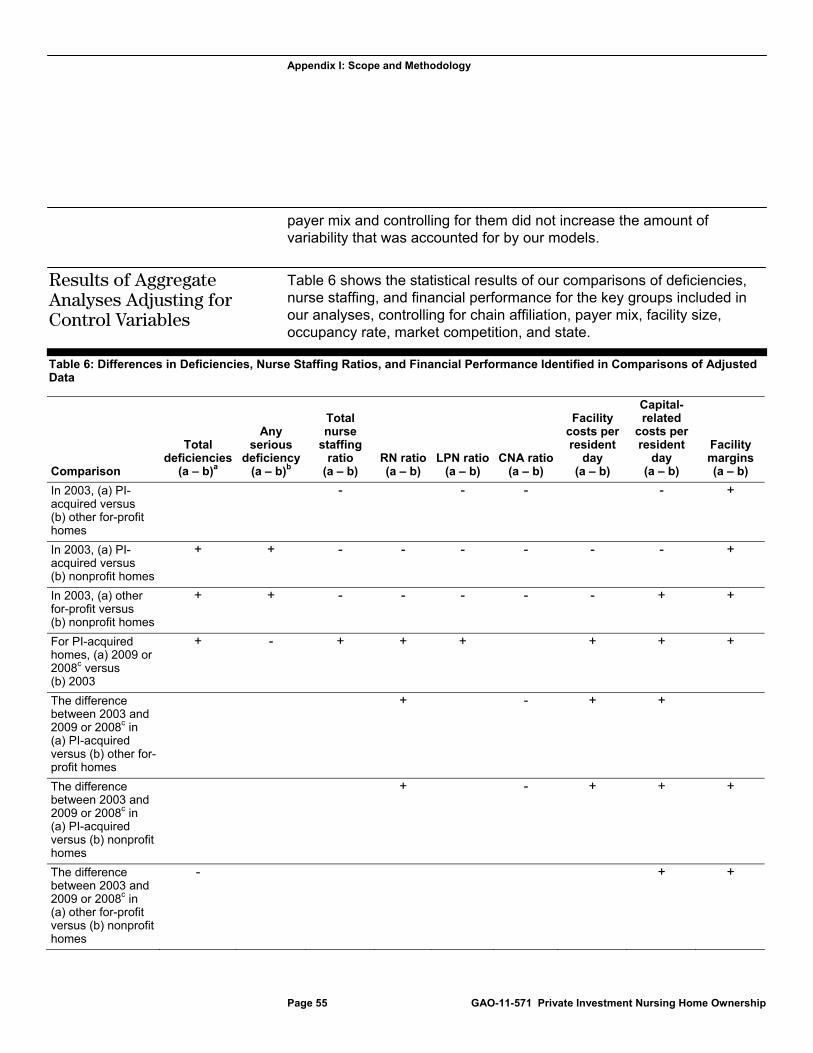
Appendix I: Scope and Methodology
Page 55 GAO-11-571 Private Investment Nursing Home Ownership
payer mix and controlling for them did not increase the amount of variability that was accounted for by our models.
Table 6 shows the statistical results of our comparisons of deficiencies, nurse staffing, and financial performance for the key groups included in our analyses, controlling for chain affiliation, payer mix, facility size, occupancy rate, market competition, and state.
Table 6: Differences in Deficiencies, Nurse Staffing Ratios, and Financial Performance Identified in Comparisons of Adjusted Data
Comparison
Total deficiencies
(a – b)a
Any serious
deficiency (a – b)b
Total nurse
staffing ratio
(a – b) RN ratio(a – b)
LPN ratio(a – b)
CNA ratio(a – b)
Facility costs per resident
day (a – b)
Capital-related
costs per resident
day (a – b)
Facility margins(a – b)
In 2003, (a) PI-acquired versus (b) other for-profit homes
- - - - +
In 2003, (a) PI-acquired versus (b) nonprofit homes
+ + - - - - - - +
In 2003, (a) other for-profit versus (b) nonprofit homes
+ + - - - - - + +
For PI-acquired homes, (a) 2009 or 2008c versus (b) 2003
+ - + + + + + +
The difference between 2003 and 2009 or 2008c in (a) PI-acquired versus (b) other for-profit homes
+ - + +
The difference between 2003 and 2009 or 2008c in (a) PI-acquired versus (b) nonprofit homes
+ - + + +
The difference between 2003 and 2009 or 2008c in (a) other for-profit versus (b) nonprofit homes
- + +
Results of Aggregate Analyses Adjusting for Control Variables
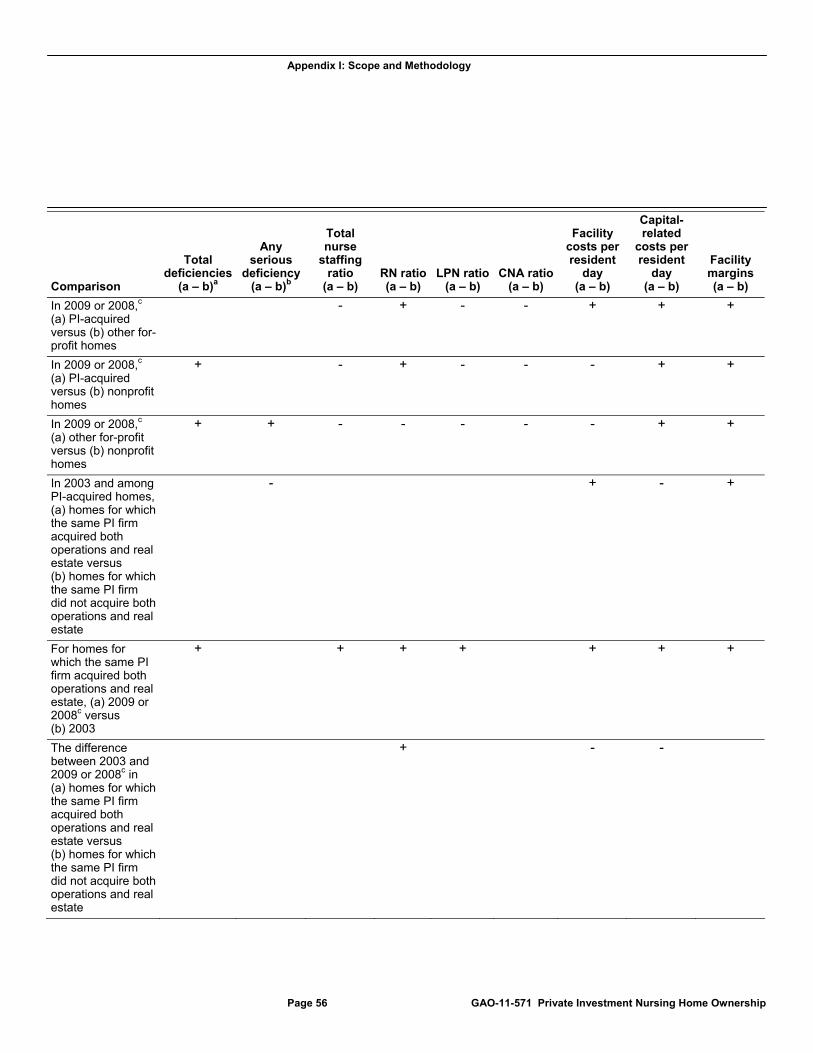
Appendix I: Scope and Methodology
Page 56 GAO-11-571 Private Investment Nursing Home Ownership
Comparison
Total deficiencies
(a – b)a
Any serious
deficiency (a – b)b
Total nurse
staffing ratio
(a – b) RN ratio(a – b)
LPN ratio(a – b)
CNA ratio(a – b)
Facility costs per resident
day (a – b)
Capital-related
costs per resident
day (a – b)
Facility margins(a – b)
In 2009 or 2008,c (a) PI-acquired versus (b) other for-profit homes
- + - - + + +
In 2009 or 2008,c (a) PI-acquired versus (b) nonprofit homes
+ - + - - - + +
In 2009 or 2008,c (a) other for-profit versus (b) nonprofit homes
+ + - - - - - + +
In 2003 and among PI-acquired homes, (a) homes for which the same PI firm acquired both operations and real estate versus (b) homes for which the same PI firm did not acquire both operations and real estate
- + - +
For homes for which the same PI firm acquired both operations and real estate, (a) 2009 or 2008c versus (b) 2003
+ + + + + + +
The difference between 2003 and 2009 or 2008c in (a) homes for which the same PI firm acquired both operations and real estate versus (b) homes for which the same PI firm did not acquire both operations and real estate
+ - -
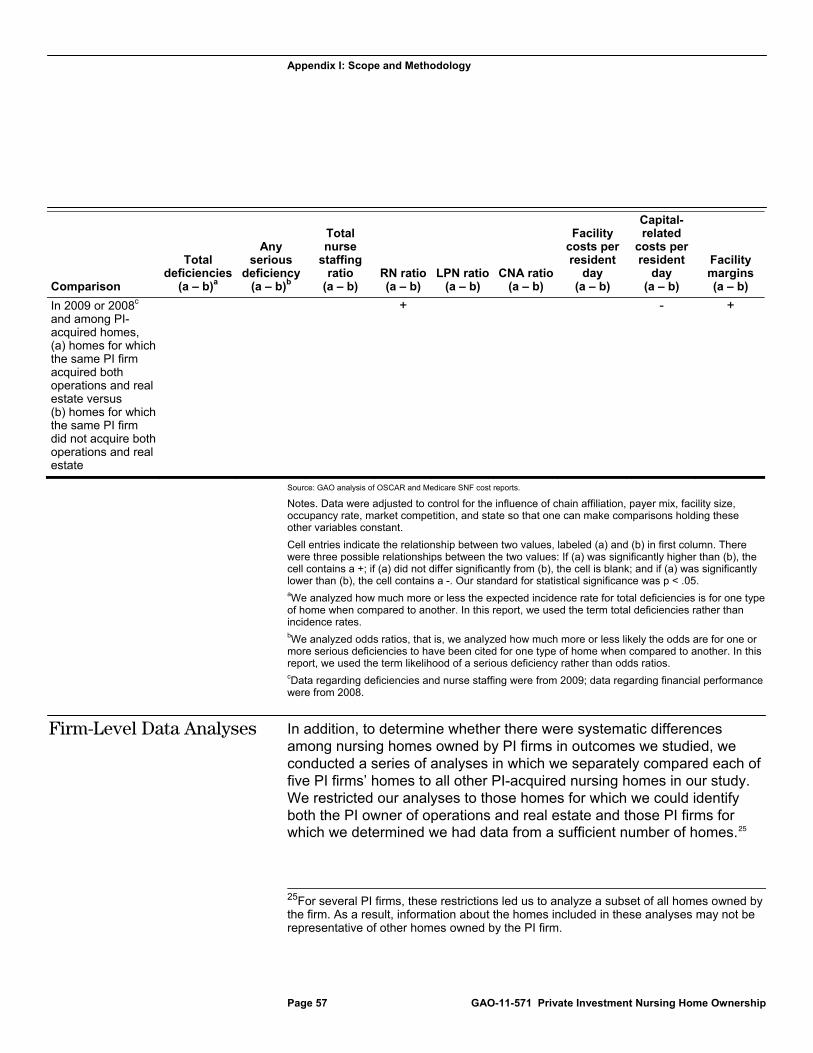
Appendix I: Scope and Methodology
Page 57 GAO-11-571 Private Investment Nursing Home Ownership
Comparison
Total deficiencies
(a – b)a
Any serious
deficiency (a – b)b
Total nurse
staffing ratio
(a – b) RN ratio(a – b)
LPN ratio(a – b)
CNA ratio(a – b)
Facility costs per resident
day (a – b)
Capital-related
costs per resident
day (a – b)
Facility margins(a – b)
In 2009 or 2008c and among PI-acquired homes, (a) homes for which the same PI firm acquired both operations and real estate versus (b) homes for which the same PI firm did not acquire both operations and real estate
+ - +
Source: GAO analysis of OSCAR and Medicare SNF cost reports.
Notes. Data were adjusted to control for the influence of chain affiliation, payer mix, facility size, occupancy rate, market competition, and state so that one can make comparisons holding these other variables constant.
Cell entries indicate the relationship between two values, labeled (a) and (b) in first column. There were three possible relationships between the two values: If (a) was significantly higher than (b), the cell contains a +; if (a) did not differ significantly from (b), the cell is blank; and if (a) was significantly lower than (b), the cell contains a -. Our standard for statistical significance was p < .05. aWe analyzed how much more or less the expected incidence rate for total deficiencies is for one type of home when compared to another. In this report, we used the term total deficiencies rather than incidence rates. bWe analyzed odds ratios, that is, we analyzed how much more or less likely the odds are for one or more serious deficiencies to have been cited for one type of home when compared to another. In this report, we used the term likelihood of a serious deficiency rather than odds ratios. cData regarding deficiencies and nurse staffing were from 2009; data regarding financial performance were from 2008.
In addition, to determine whether there were systematic differences among nursing homes owned by PI firms in outcomes we studied, we conducted a series of analyses in which we separately compared each of five PI firms’ homes to all other PI-acquired nursing homes in our study. We restricted our analyses to those homes for which we could identify both the PI owner of operations and real estate and those PI firms for which we determined we had data from a sufficient number of homes.25
25For several PI firms, these restrictions led us to analyze a subset of all homes owned by the firm. As a result, information about the homes included in these analyses may not be representative of other homes owned by the PI firm.
Firm-Level Data Analyses

Appendix I: Scope and Methodology
Page 58 GAO-11-571 Private Investment Nursing Home Ownership
For three PI firms’ homes, the same PI firm acquired both operations and real estate.
For two PI firms that acquired the nursing home operations, a different
PI firm acquired the real estate.
In each of five separate analyses, we compared the homes owned by a PI firm to all other PI homes in our larger aggregate analysis, including homes owned by the other firms we studied and any other homes owned by that PI firm (e.g., those for which we could not identify the real estate owner). Again, we statistically controlled for other variables that may influence deficiencies, staffing, and financial performance. Unless otherwise specified, all results that we present were statistically significant at the 0.05 level in analyses of adjusted data. To better understand differences among the nursing homes owned by these PI firms, we also interviewed representatives of PI firms that acquired nursing home operations, real estate, or both, and representatives of companies that operate PI-owned homes and, if their homes were part of our firm-level analyses, we discussed the results for their homes.
There are several important limitations to our findings: The results of our analyses can not be generalized beyond the PI-acquired nursing homes in our review. In addition, the differences between PI-acquired and other nursing homes that we observed cannot necessarily be attributed to PI ownership because they may have been caused by other uncontrolled and unquantified variables, such as specific characteristics of the particular sets of homes or particular PI firms in our review or the fact that these homes changed ownership, rather than the effect of PI ownership per se. Moreover, although our data for homes that were acquired by PI firms came from before and after the PI firm acquired them, we cannot assume that any difference we observed between the data from 2003 and the data from 2008 or 2009 were due to acquisition by the PI firm because other things could have occurred between those years. For example, changes we observed could have occurred after 2003, but before acquisition by the PI firm.
In addition, each of our measures has limitations:
PI ownership. Our sample of PI-acquired homes did not include all PI-owned homes. Specifically, to compare data from before and after acquisition by a PI firm, we excluded PI-owned homes that were acquired before or after our target acquisition interval. Moreover, the 10 PI firms in our sample acquired about 94 percent of the nursing homes that were acquired by PI firms from 2004 through 2007; we could not identify the
Data Reliability and Limitations
Appendix I: Scope and Methodology
Page 59 GAO-11-571 Private Investment Nursing Home Ownership
other approximately 6 percent of PI-acquired nursing homes, and as a result, some homes that we classified as other for-profit or nonprofit homes may have been PI-owned.
Deficiency data. We have previously documented inconsistencies in states’ citation of deficiencies.26 Our analyses controlled for variation across states, but may not have captured all variation associated with state surveys.27 In addition, deficiency data provide incomplete information about quality of care. Although cited deficiencies indicate problems with the quality of care that were identified during a survey, the absence of cited deficiencies does not necessarily indicate that the quality of care was good because surveyors may have failed to identify and cite actual quality problems.
Staffing data. Although OSCAR was the most suitable data source available for our analyses, OSCAR staffing data have several limitations. First, OSCAR provides a 2-week snapshot of staffing and a 1-day snapshot of residents at the time of the survey, so it may not have accurately depicted a facility’s staffing or number of residents over a longer period. Second, staffing is reported across the entire facility, while the number of residents is reported only for Medicare- and Medicaid-certified beds; as a result, our calculations may have overstated staffing ratios for homes with noncertified beds.28 Third, neither CMS nor the states regularly attempt to verify the accuracy of the OSCAR staffing data, and at least some studies question these data. For example, research in one state suggested systematic inaccuracies, with larger and
26See GAO, Nursing Homes: Some Improvement Seen in Understatement of Serious Deficiencies, but Implications for the Longer-Term Trend Are Unclear, GAO-10-434R (Washington, D.C.: Apr. 28, 2010); Nursing Homes: Addressing the Factors Underlying Understatement of Serious Care Problems Requires Sustained CMS and State Commitment, GAO-10-70 (Washington, D.C.: Nov. 24, 2009); and Nursing Homes: Federal Monitoring Surveys Demonstrate Continued Understatement of Serious Care Problems and CMS Oversight Weaknesses, GAO-08-517 (Washington, D.C.: May 9, 2008).
27Variation in citation of deficiencies could be linked to differences in the district offices that are responsible for the surveys. We considered controlling for district office rather than state when analyzing deficiency data, but found that we could not reliably associate district offices with the nursing homes they were responsible for surveying.
28We excluded nursing homes that reported that more than 10 percent of beds were not certified for Medicare or Medicaid.
Appendix I: Scope and Methodology
Page 60 GAO-11-571 Private Investment Nursing Home Ownership
for-profit homes being more likely to report higher levels of RN staffing in OSCAR than in their audited state Medicaid cost reports.29
Financial data. Although Medicare cost reports provided the most suitable data for our analyses, they are not routinely audited and are subject to minimal verification, so they may contain inaccuracies. Since the implementation of the Medicare prospective payment system (in 1998 for SNFs), providers are no longer reimbursed directly on the basis of costs, and some have raised concerns that the quality and level of effort providers put into accurately completing Medicare cost reports may have eroded. In addition, the Medicare program limits the amount of capital-related costs that may be reported—for example, by limiting the reporting of certain financing costs associated with acquisition of a facility. If a provider’s financing costs exceed these limits, the provider’s full financing costs cannot be reported. As a result, a portion of the providers’ reported margins may be needed to offset these unreported financing costs. Also, for about one-third of PI homes, our 2008 financial performance data are from less than 1 year after acquisition. Thus, our postacquisition time period may not fully capture any impact of PI ownership on the home’s financial performance.
Despite these limitations, our analyses do provide a reasonable basis for comparing deficiencies, nurse staffing, and financial performance of the PI-owned homes we studied to each other and to other types of nursing homes at two points in time. We reviewed all data for soundness and consistency and determined that they were sufficiently reliable for our purposes. We performed data reliability checks on the list of PI homes we compiled, OSCAR, Medicare’s Provider of Services, and Medicare SNF cost report data we used, reviewed relevant documentation, and discussed these data sources with knowledgeable officials and industry experts. We also reviewed published research on the quality and costs of nursing home care, our prior work on nursing homes, and other relevant documentation. We interviewed officials from CMS; representatives of PI firms that acquired nursing home operations, real estate, or both;
29A comparison of OSCAR to Texas Medicaid Cost Reports—which summarize a year’s payroll data and are subject to auditing processes not used with OSCAR—indicated that OSCAR was more likely to suggest higher average RN levels than the Texas Medicaid Cost Reports when the facilities were larger or for-profit than when they were smaller or nonprofit. See B. A. Kash, C. Hawes, and C. D. Phillips, “Comparing Staffing Levels in the Online Survey Certification and Reporting (OSCAR) System With the Medicaid Cost Report Data: Are Differences Systematic?” The Gerontologist, vol. 47, no. 4 (2007).
Appendix I: Scope and Methodology
Page 61 GAO-11-571 Private Investment Nursing Home Ownership
representatives of companies that operate PI-owned nursing homes; and experts on nursing home quality and costs.

Appendix II: Comments from the Department of Health and Human Services
Page 62 GAO-11-571 Private Investment Nursing Home Ownership
Appendix II: Comments from the Department of Health and Human Services

Appendix II: Comments from the Department of Health and Human Services
Page 63 GAO-11-571 Private Investment Nursing Home Ownership
Appendix II: Comments from the Department of Health and Human Services
Page 64 GAO-11-571 Private Investment Nursing Home Ownership
Appendix III: GAO Contact and Staff Acknowledgments
Page 65 GAO-11-571 Private Investment Nursing Home Ownership
John E. Dicken (202) 512-7114 or [email protected]
In addition to the contact name above, Walter Ochinko, Assistant Director; Dae Park, Assistant Director; Kristen Joan Anderson; Jennie Apter; Ramsey Asaly; Leslie V. Gordon; Dan Lee; Jessica Smith; and Sonya L. Vartivarian made key contributions to this report.
Appendix III: GAO Contact and Staff Acknowledgments
GAO Contact
Acknowledgments
Related GAO Products
Page 66 GAO-11-571 Private Investment Nursing Home Ownership
Nursing Homes: More Reliable Data and Consistent Guidance Would Improve CMS Oversight of State Complaint Investigations. GAO-11-280. Washington, D.C.: April 7, 2011.
Nursing Homes: Complexity of Private Investment Purchases Demonstrates Need for CMS to Improve the Usability and Completeness of Ownership Data. GAO-10-710. Washington, D.C.: September 30, 2010.
Poorly Performing Nursing Homes: Special Focus Facilities Are Often Improving, but CMS’s Program Could Be Strengthened. GAO-10-197. Washington, D.C.: March 19, 2010.
Nursing Homes: Addressing the Factors Underlying Understatement of Serious Care Problems Requires Sustained CMS and State Commitment. GAO-10-70. Washington, D.C.: November 24, 2009.
Nursing Homes: Opportunities Exist to Facilitate the Use of the Temporary Management Sanction. GAO-10-37R. Washington, D.C.: November 20, 2009.
Nursing Homes: CMS’s Special Focus Facility Methodology Should Better Target the Most Poorly Performing Homes, Which Tended to Be Chain Affiliated and For-Profit. GAO-09-689. Washington, D.C.: August 28, 2009.
Nursing Homes: Federal Monitoring Surveys Demonstrate Continued Understatement of Serious Care Problems and CMS Oversight Weaknesses. GAO-08-517. Washington, D.C.: May 9, 2008.
Nursing Home Reform: Continued Attention Is Needed to Improve Quality of Care in Small but Significant Share of Homes. GAO-07-794T. Washington, D.C.: May 2, 2007.
Nursing Homes: Efforts to Strengthen Federal Enforcement Have Not Deterred Some Homes from Repeatedly Harming Residents. GAO-07-241. Washington, D.C.: March 26, 2007.
Nursing Homes: Despite Increased Oversight, Challenges Remain in Ensuring High-Quality Care and Resident Safety. GAO-06-117. Washington, D.C.: December 28, 2005.
Nursing Home Quality: Prevalence of Serious Problems, While Declining, Reinforces Importance of Enhanced Oversight. GAO-03-561. Washington, D.C.: July 15, 2003.
Skilled Nursing Facilities: Medicare Payments Exceed Costs for Most but Not All Facilities. GAO-03-183. Washington, D.C.: December 31, 2002.
Related GAO Products

Related GAO Products
Page 67 GAO-11-571 Private Investment Nursing Home Ownership
Skilled Nursing Facilities: Available Data Show Average Nursing Staff Time Changed Little after Medicare Payment Increase. GAO-03-176. Washington, D.C.: November 13, 2002.
Skilled Nursing Facilities: Providers Have Responded to Medicare Payment System by Changing Practices. GAO-02-841. Washington, D.C.: August 23, 2002.
Nursing Homes: Quality of Care More Related to Staffing than Spending. GAO-02-431R. Washington, D.C.: June 13, 2002.
Nursing Homes: Sustained Efforts Are Essential to Realize Potential of the Quality Initiatives. GAO/HEHS-00-197. Washington, D.C.: September 28, 2000.
Nursing Homes: Aggregate Medicare Payments Are Adequate Despite Bankruptcies. GAO/T-HEHS-00-192. Washington, D.C.: September 5, 2000.
Skilled Nursing Facilities: Medicare Payment Changes Require Provider Adjustments but Maintain Access. GAO/HEHS-00-23. Washington, D.C.: December 14, 1999.
Nursing Home Care: Enhanced HCFA Oversight of State Programs Would Better Ensure Quality. GAO/HEHS-00-6. Washington, D.C.: November 4, 1999.
Nursing Home Oversight: Industry Examples Do Not Demonstrate That Regulatory Actions Were Unreasonable. GAO/HEHS-99-154R. Washington, D.C.: August 13, 1999.
Nursing Homes: Proposal to Enhance Oversight of Poorly Performing Homes Has Merit. GAO/HEHS-99-157. Washington, D.C.: June 30, 1999.
Nursing Homes: Complaint Investigation Processes Often Inadequate to Protect Residents. GAO/HEHS-99-80. Washington, D.C.: March 22, 1999.
Nursing Homes: Additional Steps Needed to Strengthen Enforcement of Federal Quality Standards. GAO/HEHS-99-46. Washington, D.C.: March 18, 1999.
California Nursing Homes: Care Problems Persist Despite Federal and State Oversight. GAO/HEHS-98-202. Washington, D.C.: July 27, 1998.
(290827)

The Government Accountability Office, the audit, evaluation, and investigative arm of Congress, exists to support Congress in meeting its constitutional responsibilities and to help improve the performance and accountability of the federal government for the American people. GAO examines the use of public funds; evaluates federal programs and policies; and provides analyses, recommendations, and other assistance to help Congress make informed oversight, policy, and funding decisions. GAO’s commitment to good government is reflected in its core values of accountability, integrity, and reliability.
The fastest and easiest way to obtain copies of GAO documents at no cost is through GAO’s Web site (www.gao.gov). Each weekday afternoon, GAO posts on its Web site newly released reports, testimony, and correspondence. To have GAO e-mail you a list of newly posted products, go to www.gao.gov and select “E-mail Updates.”
The price of each GAO publication reflects GAO’s actual cost of production and distribution and depends on the number of pages in the publication and whether the publication is printed in color or black and white. Pricing and ordering information is posted on GAO’s Web site, http://www.gao.gov/ordering.htm.
Place orders by calling (202) 512-6000, toll free (866) 801-7077, or TDD (202) 512-2537.
Orders may be paid for using American Express, Discover Card, MasterCard, Visa, check, or money order. Call for additional information.
Contact:
Web site: www.gao.gov/fraudnet/fraudnet.htm E-mail: [email protected] Automated answering system: (800) 424-5454 or (202) 512-7470
Ralph Dawn, Managing Director, [email protected], (202) 512-4400 U.S. Government Accountability Office, 441 G Street NW, Room 7125 Washington, DC 20548
Chuck Young, Managing Director, [email protected], (202) 512-4800 U.S. Government Accountability Office, 441 G Street NW, Room 7149 Washington, DC 20548
GAO’s Mission
Obtaining Copies of GAO Reports and Testimony
Order by Phone
To Report Fraud, Waste, and Abuse in Federal Programs
Congressional Relations
Public Affairs
Please Print on Recycled Paper