Embed Size (px)
Citation preview

NURSING CARE OF THE OLDER ADULT
THE AGING EXPERIENCEChapter 2 (4th Edition)
PATI COX, RN, BSN, M.Ed.

OUTLINE
• INTRODUCTION– Definitions– Demographics – past/present/future– Impact of aging on nursing– Ethical considerations
ATTITUDES TOWARD AGING– History– Ageism

Outline cont.
• The NORMAL AGING PROCESS• Normal Physiological
Changes-All Systems
• Physiological Changes Not Common to Aging
– Changes– Common Chronic Diseases -4– Common Causes of Death - 3

Names Synonymous with Aging
• “Oldster”• “Elderly”• “Golden Years”• “Twilight Years”• “Senior
Citizens”• “Silver Haired”• “Grumpy”• “Sunset years”

Terminology
• Gerus – Greek for old age
• Geriatrics – the medical study of older adults
• Gerontology – the nursing study of the older adult
• Senility – state of being old ( mentally & physically) not an acceptable medical diagnosis
• Senescence – process of aging
• Aged – means old and usually refers to those over the age of 75

GENERAL INFORMATION
•Natural process•Each of us move through•Attitudes are changing
about aging with the “Baby Boomers”
• Issues that affect quality of life are receiving more attention

Aging begins @ Birth

DEMOGRAPHICS
PAST

Demographics - Past
• Life expectancy – 1776 - 35 years– 1930 - 59.7 years– 1965 – 70.2 years
• Confuscious – 1000’s of years• Pioneers, Egyptians – youth to
young adult• 1 in 10 could expect to live to
65

DEMOGRAPHICS
TODAY

TODAY’S AGEDTODAY’S AGED
• YOUNG OLD – 65-74• MIDDLE OLD – 75-84• OLD OLD – 85 + (Fastest growing
population)• Experiences –
– Great Depression– Antibiotics, Airplanes– Automobiles, Television,– Polio, Small Pox, TB– WWI, WWII, Kennedy,
Truman, Roosevelt, Eisenhower
– King

“The Graying of America”
• Life expectancy has increased dramatically
• 80% of American’s anticipate living to 65 or older
• 12.7% of total population• 1 in every 8 Americans is 65 or older• 65-74 age group is 8 times higher
than in 1900• 75-84 age group is 16 times higher• 85+ is 22 times higher-fastest
growing
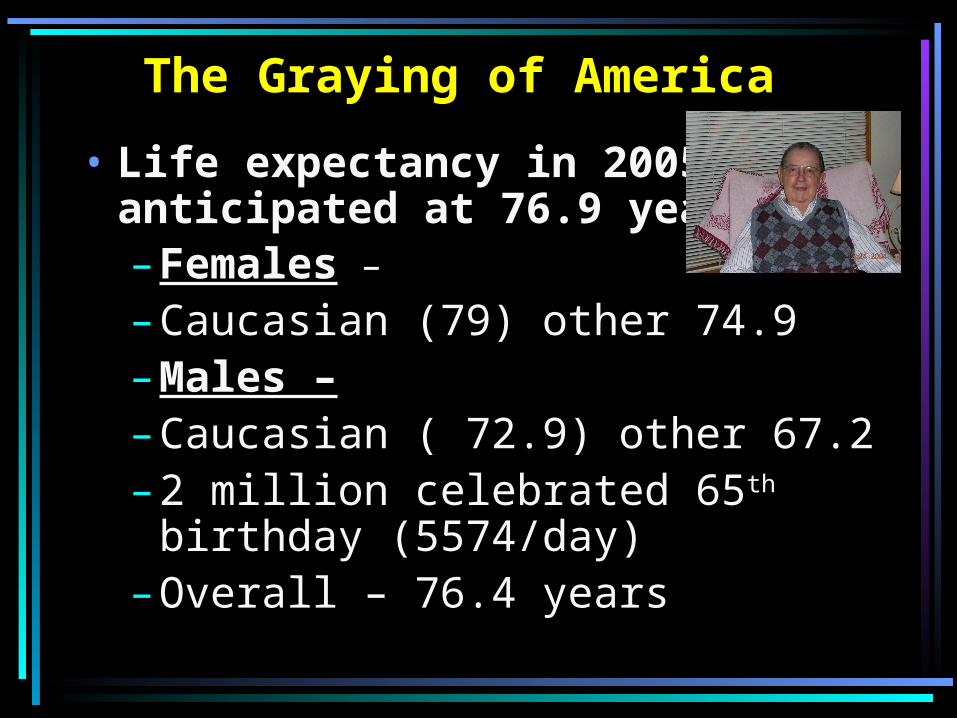
The Graying of America
• Life expectancy in 2005 is anticipated at 76.9 years– Females –
– Caucasian (79) other 74.9– Males –– Caucasian ( 72.9) other 67.2– 2 million celebrated 65th birthday
(5574/day) – Overall – 76.4 years

The Graying of America
• 50,545 persons 100 (+) in 2005• 35% increase from 1990 (37,306)
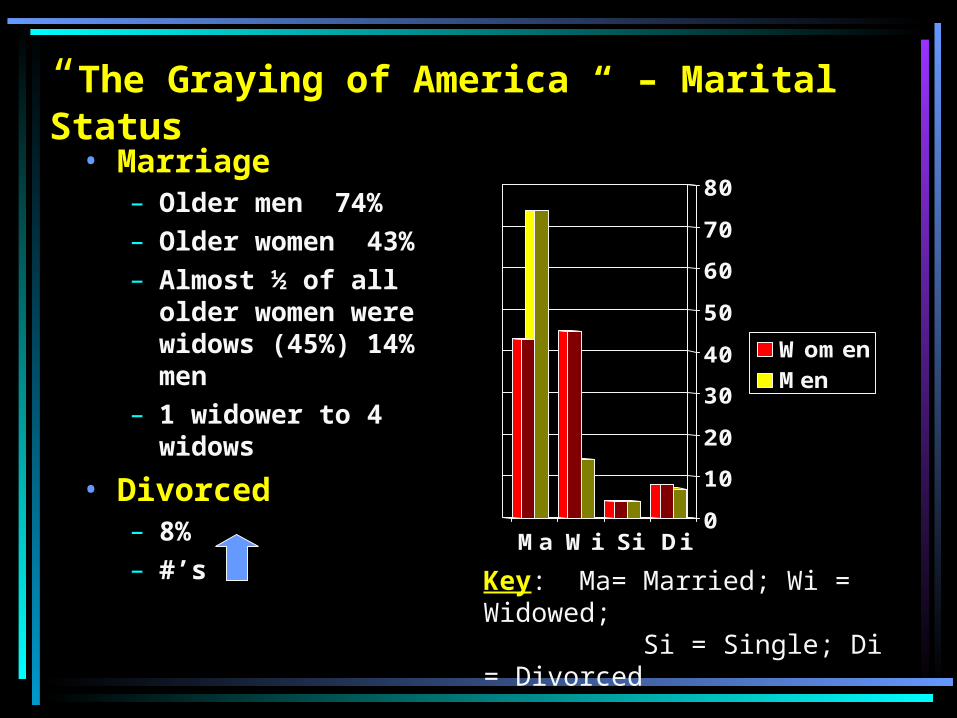
“The Graying of America “ – Marital Status
• Marriage– Older men 74% – Older women 43%– Almost ½ of all
older women were widows (45%) 14% men
– 1 widower to 4 widows
• Divorced– 8%– #’s
0
10
20
30
40
50
60
70
80
Ma Wi Si Di
WomenMen
Key: Ma= Married; Wi = Widowed; Si = Single; Di = Divorced

The Graying of America - Income
• Average income was $19,168 = men
• Average income was $10,899 = females
• Households headed by 65+ average income = $32,854– Caucasians - $33,467– African Americans - $27,952– Hispanics - $24,330

Family Households 65+ Householder
0 5 10 15 20 25
Under 10,000
$10,000 - 14,999
$15,000 - 24,999
$25,000 - 34,999
$35,000 - 49,000
$50,000-74,999
$75,000 and over
Bar 1
13.9%
14.5%
18.4%
19.4%
21.7%
8.1%
4.0%

Poverty• 3.4 million (10.2%) below poverty level in
2000• Historic low was reached in 1999• 2.2 million (6.7%) were classified as
“near poor”• 1 of 12 (8.9%) Caucasian• 22.3% African American; 18.8% Hispanics• Older women (12.2%) Older men (7.5%)• Living alone or living with nonrelatives –
highest poverty rate• Highest poverty = Hispanic women living
alone or with nonrelatives (38.3%)

Employment
• 12.8% (4.2 million) 65 and over were in workforce in 2005
• 2.4 mill. Men and 1.8 mill. Women• 3 % of US Labor force

Education
• Educational level is increasing
• High school grads increased from 1970-2005 from 28% to 70%
• 16% had Bachelor’s degrees or more in 2005

DEMOGRAPHICS
FUTURE
Future – “The Graying of America”
•By 2010-2030 = 20-22% = 70 million (twice # in 2000)
•Baby Boomers will reach 65•Growth slowed somewhat in the 1990’s due to the low birth numbers in the Great Depression – 1930’s
Future – “The Graying of America”
• Minority Population– 25.4% of elderly population in 2030 (219%)– 16.4% in 2000– Caucasian – 65+ will increase 81%– Hispanics – 65+ will increase 328%– African Americans – 65+ will increase
131%– American Indians, Eskimo – 65+ will
increase 147%– Asian & Pacific Islanders – 65+ will
increase 285%


Number of Person’s 65+ 1900-2030
0
10
20
30
40
50
60
70
80
1900 1960 1980 1990 2000 2010 2020 2030
Future – “The Graying of America”
•Factors that affect age distribution of population–Decreased mortality
•Better education, health, etc
–Decreased fertility•Baby Boomer females marry later, career oriented, fewer children

Impact on Nursing Care?
•What will the impact be?

Impact on Nursing
• Spend ¾ (75%) caring for the elderly• Most nurses will be classified as a
“geriatric” nurse• 65% of patients in acute care; 83%
home care; and 92% long term care• 85 + will have greatest health care
needs• Elderly will become more politically
active• Will care for individuals with
significant histories & life experiences
Ethical Considerations
•¼ of medical care $ is spent in the last month of life
• Treatment considerations• Ethic committees to assist staff in
making difficult decisions ( not just in hospitals, but in nursing homes, etc)

Attitudes Toward Aging
• History & Cultures– Western – Embarrassed &
tolerance– Eastern- Extended Family &
well respected– Are we changing our
attitudes toward the aged?

What are characteristi
cs of the Elderly ?
AgeismDiscrimination against individuals as they age or grow old

Forms of ageism
•Paternalism or Infantilism– Talk to older adult as if child– Refer to them as
• “sweetie”• “honey”• “dearie”

MYTHS or TRUTHS
about the ElderlyHow much do you really know
about the aged population?

What Did you use to BE?
“I still Am”

Trends Making Life Better
•Health Care•Housing•Education Aspects•Advocacy Groups

Housing
•95% remain in own home•5% are institutionalized
Living Arrangements
• Over ½ (55%) noninstitutionalized persons live with spouse
• 633,000 Grandparents aged 65+ maintained households in which grandchildren were present
• Institutionalized –– 65-74 = 1.1%– 75-84 = 4.7%– 85+ = 18.2%

Housing in 2005
• 80% were owners – 20% renters• The average year of construction
of the home was 1962• Average value of homes in 1999 –
96,442 • 76% owned their homes free and
clear

Living Arrangements – 65+ 2005
Living with SpouseLiving AloneOther
41%
19%
40%
Women

Living Arrangements 65+ 2005
MEN
73%
17%
10%
Living with SpouseLiving AloneOther

Geographical Distribution
• Approx. ½ (52%) of elderly live in 9 states:– California; Florida; New York; Texas; Pennsylvania;
Ohio; Illinois; Michigan; New Jersey• 14% or more of total population
– Florida Pennyslvania ;West Virginia; Iowa Rhode Island; Maine; South Dakota; Arkansas
• States with Lowest Poverty Rates for Elderly– Mississippi; Louisiana; District of Columbia;
Alabama; Tennessee; Arkansas; New Mexico; Kentucky; West Virginia; New York; Texas
• Most elderly lived in Metropolitan areas = 77.5% while 23% lived in nonmetropolitan areas
• Less likely to change residence than any other age group.– When moving – most move to same city as children
or same state

Health , Health Care, Disability• 26.1% elderly assessed their health as fair
or poor; little difference between sexes; ethnic races rated their health much more fairer or poorer than Caucasians
• In 2002, more than ½ (55%)of elderly population reported with @ least 1 disability
• 4 times the # of days of hospitalization• Average Length of Stay = 6 days (4.1 <65
yr)• 11% spent on health care (5% < 65)• More physician visits

Percent with Disabilities, by Age
0
10
20
30
40
50
60
70
80
% withany
disability
% withsevere
disability
% needassistance
65-6970-7475-7980+

Chronic Health Problems• 28.8% reported a limitation
caused by a C.H.P (65-74)• 50.6% of those 75 & older
reported they were limited due to a C.H.P.
• Four most common C.H.P.– Arthritis (53%)– Hypertension (42%)– Heart Disease (40%)– Cataracts (23%)

Advocacy Groups
• Gray Panthers– www.graypanthers.org
• AARP– www.aarp.org
• Veteran’s

10 Leading Causes of Death
• Cancer• Heart Disease• Cerebrovascular Disease (Stroke)• Influenza, Pneumonia• Ateriosclerosis, Diabetes Mellitus• Accidents, Bronchitis, Asthma• Emphysema, Cirrhosis of Liver• Nephritis, Nephrosis