Embed Size (px)
Citation preview

Methodology for Modeling Transient Fires in Nuclear Power Plant Fire Probabilistic Risk Assessment
U.S. Nuclear Regulatory Commission Electric Power Research Institute Office of Nuclear Regulatory Research 3420 Hillview Avenue Washington, DC 20555-0001 Palo Alto, CA 94304-1338
NUREG-2233 EPRI 3002018231

AVAILABILITY OF REFERENCE MATERIALSIN NRC PUBLICATIONS
NRC Reference Material
As of November 1999, you may electronically access NUREG-series publications and other NRC records at the NRC’s Library at www.nrc.gov/reading-rm.html. Publicly released records include, to name a few, NUREG-series publications; Federal Register notices; applicant, licensee, and vendor documents and correspondence; NRC correspondence and internal memoranda; bulletins and information notices; inspection and investigative reports; licensee event reports; and Commission papers and their attachments.
NRC publications in the NUREG series, NRC regulations, and Title 10, “Energy,” in the Code of Federal Regulations may also be purchased from one of these two sources:
1. The Superintendent of DocumentsU.S. Government Publishing OfficeWashington, DC 20402-0001Internet: www.bookstore.gpo.govTelephone: (202) 512-1800Fax: (202) 512-2104
2. The National Technical Information Service5301 Shawnee RoadAlexandria, VA 22312-0002Internet: www.ntis.gov1-800-553-6847 or, locally, (703) 605-6000
A single copy of each NRC draft report for comment isavailable free, to the extent of supply, upon writtenrequest as follows:
Address: U.S. Nuclear Regulatory Commission Office of Administration Multimedia, Graphics, and Storage & Distribution Branch Washington, DC 20555-0001 E-mail: [email protected]: (301) 415-2289
Some publications in the NUREG series that are posted at the NRC’s Web site address www.nrc.gov/reading-rm/doc-collections/nuregs are updated periodically and may differ from the last printed version. Although references to material found on a Web site bear the date the material was accessed, the material available on the date cited may subsequently be removed from the site.
Non-NRC Reference Material
Documents available from public and special technical libraries include all open literature items, such as books, journal articles, transactions, Federal Register notices, Federal and State legislation, and congressional reports. Such documents as theses, dissertations, foreign reports and translations, and non-NRC conference proceedings may be purchased from their sponsoring organization.
Copies of industry codes and standards used in asubstantive manner in the NRC regulatory process are maintained at—
The NRC Technical Library Two White Flint North 11545 Rockville Pike Rockville, MD 20852-2738
These standards are available in the library for reference use by the public. Codes and standards are usually copyrighted and may be purchased from the originating organization or, if they are American National Standards, from—
American National Standards Institute 11 West 42nd StreetNew York, NY 10036-8002Internet: www.ansi.org(212) 642-4900
Legally binding regulatory requirements are stated only in laws; NRC regulations; licenses, including technical specifications; or orders, not in NUREG-series publications. The views expressed in contractor prepared publications in this series are not necessarily those of the NRC.
The NUREG series comprises (1) technical and administrative reports and books prepared by the staff (NUREG–XXXX) or agency contractors (NUREG/CR–XXXX), (2) proceedings of conferences (NUREG/CP–XXXX),(3) reports resulting from international agreements(NUREG/IA–XXXX),(4) brochures (NUREG/BR–XXXX), and(5) compilations of legal decisions and orders of theCommission and the Atomic and Safety Licensing Boardsand of Directors’ decisions under Section 2.206 of theNRC’s regulations (NUREG–0750).
DISCLAIMER: This report was prepared as an account of work sponsored by an agency of the U.S. Government. Neither the U.S. Government nor any agency thereof, nor any employee, makes any warranty, expressed or implied, or assumes any legal liability or responsibility for any third party’s use, or the results of such use, of any information, apparatus, product, or process disclosed in this publication, or represents that its use by such third party would not infringe privately owned rights.

Methodology for Modeling Transient Fires in Nuclear Power Plant Fire Probabilistic Risk Assessment
October 2020
U.S. Nuclear Regulatory Commission Office of Nuclear Regulatory Research (RES) Washington, D.C. 20555-0001
U.S. NRC-RES Project Manager M. H. Salley
Electric Power Research Institute (EPRI) 3420 Hillview Avenue Palo Alto, CA 94304-1338
EPRI Project Managers A. Lindeman
EPRI 3002018231 NUREG
-2233

DISCLAIMER OF WARRANTIES AND LIMITATION OF LIABILITIES
THIS DOCUMENT WAS PREPARED BY THE ORGANIZATIONS NAMED BELOW AS AN ACCOUNT OF WORK SPONSORED OR COSPONSORED BY THE ELECTRIC POWER RESEARCH INSTITUTE, INC. (EPRI). NEITHER EPRI, ANY MEMBER OF EPRI, ANY COSPONSOR, THE ORGANIZATIONS BELOW, NOR ANY PERSON ACTING ON BEHALF OF ANY OF THEM:
(A) MAKES ANY WARRANTY OR REPRESENTATION WHATSOEVER, EXPRESS OR IMPLIED, (I) WITH RESPECT TO THE USE OF ANY INFORMATION, APPARATUS, METHOD, PROCESS, OR SIMILAR ITEM DISCLOSED IN THIS DOCUMENT, INCLUDING MERCHANTABILITY AND FITNESS FOR A PARTICULAR PURPOSE, OR (II) THAT SUCH USE DOES NOT INFRINGE ON OR INTERFERE WITH PRIVATELY OWNED RIGHTS, INCLUDING ANY PARTY'S INTELLECTUAL PROPERTY, OR (III) THAT THIS DOCUMENT IS SUITABLE TO ANY PARTICULAR USER'S CIRCUMSTANCE; OR
(B) ASSUMES RESPONSIBILITY FOR ANY DAMAGES OR OTHER LIABILITY WHATSOEVER (INCLUDING ANY CONSEQUENTIAL DAMAGES, EVEN IF EPRI OR ANY EPRI REPRESENTATIVE HAS BEEN ADVISED OF THE POSSIBILITY OF SUCH DAMAGES) RESULTING FROM YOUR SELECTION OR USE OF THIS DOCUMENT OR ANY INFORMATION, APPARATUS, METHOD, PROCESS, OR SIMILAR ITEM DISCLOSED IN THIS DOCUMENT.
REFERENCE HEREIN TO ANY SPECIFIC COMMERCIAL PRODUCT, PROCESS, OR SERVICE BY ITS TRADE NAME, TRADEMARK, MANUFACTURER, OR OTHERWISE, DOES NOT NECESSARILY CONSTITUTE OR IMPLY ITS ENDORSEMENT, RECOMMENDATION, OR FAVORING BY EPRI.
THE FOLLOWING ORGANIZATIONS PREPARED THIS REPORT:
Electric Power Research Institute (EPRI)
U.S. Nuclear Regulatory Commission, Office of Nuclear Regulatory Research
Jensen Hughes
Engineering, Planning, and Management, Inc.
Public Service Electric & Gas Nuclear, LLC
THE TECHNICAL CONTENTS OF THIS PRODUCT WERE NOT PREPARED IN ACCORDANCE WITH THE EPRI QUALITY PROGRAM MANUAL THAT FULFILLS THE REQUIREMENTS OF 10 CFR 50, APPENDIX B. THIS PRODUCT IS NOT SUBJECT TO THE REQUIREMENTS OF 10 CFR PART 21.
NOTE
For further information about EPRI, call the EPRI Customer Assistance Center at 800.313.3774 or e-mail [email protected].
Electric Power Research Institute, EPRI, and TOGETHERSHAPING THE FUTURE OF ELECTRICITY are registered service marks of the Electric Power Research Institute, Inc.

iii
ABSTRACT
The method for analyzing transient fires in NUREG/CR-6850 made use of the limited available data, and its application resulted in conservative estimates of transient fire risk. To counter the lack of available data, additional testing was performed based on the transient fire events observed in the Electric Power Research Institute fire events database. The results from the testing effort served as a primary input to develop more realistic data to analyze transient fire risk. This report develops new distributions of peak heat release rate, total energy release, and zones of influence for transient fires. Additionally, this report recommends input values for the detailed fire modeling of transient fires that include fire growth and decay parameters, yields of minor products of combustion, heat of combustion, and the physical size and effective elevation of the fire.
Keywords Fire modeling Fire probabilistic risk assessment Heat release rate Transient fires Zone of influence


v
TABLE OF CONTENTS
ABSTRACT ................................................................................................................................. iii
TABLE OF CONTENTS ............................................................................................................... v
LIST OF FIGURES ...................................................................................................................... ix
LIST OF TABLES ....................................................................................................................... xv
EXECUTIVE SUMMARY .......................................................................................................... xvii
CITATIONS ................................................................................................................................ xxi
ACKNOWLEDGMENTS .......................................................................................................... xxiii
ACRONYMS ............................................................................................................................. xxv
1 INTRODUCTION ............................................................................................................ 1-1
1.1 Background ........................................................................................................ 1-1
1.2 Technical Approach ............................................................................................ 1-2
1.3 Report Organization ........................................................................................... 1-2
2 REVIEW OF PRIOR TRANSIENT FIRE WORK ............................................................ 2-1
2.1 Frequently Asked Questions, NUREGs, and EPRI Research ............................ 2-1
2.1.1 NUREG/CR-6850 Volume 2 ................................................................... 2-1
2.1.2 Transient Fire Frequency Influence Factors (FAQ 12-0064 R1) ............ 2-3
2.1.3 Damage to Enclosed Sensitive Electronics (FAQ 13-0004) ................... 2-3
2.1.4 Transient Fire Likelihood (FAQ 14-0007) ............................................... 2-3
2.1.5 Bulk Cable/Tray Ignition (FAQ 16-0011) ................................................. 2-4
2.1.6 Fire Growth Times (NUREG/CR-6850 Supplement 1) ........................... 2-5
2.1.7 Transient Fire Propagation Factor (EPRI 3002005303) ......................... 2-5
2.2 Prior Testing ....................................................................................................... 2-6
2.2.1 EPRI/NRC Transient Fire Testing ........................................................... 2-6
2.2.2 NUREG/CR-6850 Appendix G ................................................................ 2-6
2.2.3 NUREG/CR-4679 ................................................................................. 2-10
2.2.4 WPI Testing for Savannah River Site ................................................... 2-10
2.3 Inspection Reports ........................................................................................... 2-13
3 APPROACH FOR DEVELOPING DISTRIBUTIONS AND DETAILED FIRE MODELING INPUT PARAMETERS .............................................................................. 3-1
3.1 Goals .................................................................................................................. 3-1
3.2 Weighting Test Data ........................................................................................... 3-2
3.2.1 Categorizing the FEDB Events (Step 1) ................................................. 3-3

vi
3.2.2 Assigning and Weighting Test Fuel Packages to FEDB Groups (Steps 2 and 3) ....................................................................................... 3-6
3.2.3 Normalized Test Weights (Step 4) ........................................................ 3-10
3.3 Probabilistic Distributions and Detailed Fire Modeling Input Data .................... 3-13
3.3.1 Classes of Distributions ........................................................................ 3-13
3.3.1.1 Definition of TCCL ................................................................ 3-13
3.3.1.2 Selection of Test Data for the TCCL Transient Fire Distribution ........................................................................... 3-14
3.3.2 Method for Creating Probabilistic Distributions ..................................... 3-17
3.3.3 Method for Creating Detailed Fire Modeling Parameters ..................... 3-18
4 PROBABILISTIC DISTRIBUTIONS FOR PEAK HRR, TER, AND ZOI ........................ 4-1
4.1 Generic Transient Fire Distribution ..................................................................... 4-2
4.1.1 Sensitivity of Generic Transient Distributions to Event Type .................. 4-3
4.1.2 Sensitivity of Generic Transient Distributions to Category and Fuel Package Weightings ............................................................................... 4-4
4.2 TCCL Transient Fire Distribution ........................................................................ 4-6
5 DETAILED FIRE MODELING GUIDANCE .................................................................... 5-1
5.1 Transient Fire Bins for Non-Suppression Probability .......................................... 5-1
5.2 Input Parameters for Detailed Modeling ............................................................. 5-3
5.2.1 Heat of Combustion, Q*, Source Height ................................................. 5-3
5.2.2 Soot Yield and CO Yield ......................................................................... 5-8
5.2.3 Fire Growth, Plateau, and Decay .......................................................... 5-12
5.2.3.1 Growth and Decay Exponents ............................................. 5-14
5.2.3.2 Growth, Plateau, and Decay Times ..................................... 5-19
5.2.4 Summary of Input Parameters .............................................................. 5-20
5.3 Time to Damage and ZOI Comparison ............................................................. 5-22
5.3.1 Generic Transient Fire Distribution ....................................................... 5-22
5.3.2 TCCL Transient Fire Distribution .......................................................... 5-27
6 DISCUSSION OF PROJECT UNCERTAINTIES ........................................................... 6-1
6.1 Experimental Design .......................................................................................... 6-1
6.1.1 Test Items ............................................................................................... 6-1
6.1.2 Ignition Sources ...................................................................................... 6-2
6.1.3 Hood Calorimetry .................................................................................... 6-2
6.1.4 Other Test Data ...................................................................................... 6-3
6.2 Derived Data ...................................................................................................... 6-3
6.2.1 Fire Diameter and Effective Elevation .................................................... 6-3
6.2.2 ZOI .......................................................................................................... 6-3
6.3 Growth, Plateau, and Decay Parameters ........................................................... 6-4
6.4 Creation of Probabilistic Distributions ................................................................. 6-5

vii
6.5 Inputs for Detailed Modeling ............................................................................... 6-5
7 COMBINING NEW DATA WITH EXISTING PRAS ....................................................... 7-1
8 SUMMARY AND CONCLUSIONS ................................................................................ 8-1
9 REFERENCES ............................................................................................................... 9-1
APPENDIX A SUMMARY OF PRIOR TESTING .............................................................. A-1
A.1 Tests from NUREG/CR-4680 ......................................................... A-1
A.2 Tests from NBSIR 85-3195 .......................................................... A-11
A.3 Tests from NUREG/CR-4679 ....................................................... A-13
A.4 WPI Waste Bag Tests .................................................................. A-15
APPENDIX B R SCRIPTS ................................................................................................ B-1
B.1 Script for Distributions of TER, HRR, and ZOIs .............................. B-1
B.2 Script for Histograms of Q* and Fire Elevation ............................... B-5
B.3 Script for Histograms of Heat of Combustion, Soot Yield, and CO Yield ......................................................................................... B-6
B.4 Script for Fire Growth and Decay Parameters ................................ B-7
B.5 Creating New Distributions of Peak HRR, TER, and ZOI ............... B-9
APPENDIX C TEST WEIGHTING DATA ......................................................................... C-1
C.1 FEDB Category Weights ................................................................ C-1
C.2 Results of Independent Assessments of Fuel Package Category and Weights .................................................................... C-5
C.3 Voting Results for Transient Combustible Control Location ......... C-15
APPENDIX D WEIGHTED DATA HISTOGRAMS AND GAMMA DISTRIBUTION FITS ............................................................................................................ D-1
D.1 Generic Transient Fire Distribution Plots ........................................ D-1
D.2 Transient Combustible Control Location Transient Fire Distribution Plots ........................................................................... D-36
APPENDIX E INSPECTION FINDINGS ANALYSIS ........................................................ E-1


ix
LIST OF FIGURES
Figure 3-1 Example of R rep function ................................................................................ 3-17
Figure 5-1 Hc versus fire size for all fires larger than 10 kW ............................................. 5-4
Figure 5-2 Q* versus fire size for all fires larger than 10 kW ............................................... 5-4
Figure 5-3 Source height versus fire size for all fires larger than 10 kW ............................. 5-4
Figure 5-4 Hc cumulative distribution function (top) and probability density function (bottom) ................................................................................................ 5-5
Figure 5-5 Q* cumulative distribution function (top) and probability density function (bottom) ................................................................................................ 5-6
Figure 5-6 Source height cumulative distribution function (top) and probability density function (bottom) .................................................................................... 5-7
Figure 5-7 Adjusted soot yield versus fire size .................................................................... 5-8
Figure 5-8 Adjusted CO yield versus fire size ...................................................................... 5-8
Figure 5-9 Soot yield cumulative distribution function (top) and probability density function (bottom) .............................................................................................. 5-10
Figure 5-10 CO yield cumulative distribution function (top) and probability density function (bottom) .............................................................................................. 5-11
Figure 5-11 Typical fit of growth, plateau, and decay parameters to a test ......................... 5-13
Figure 5-12 TER versus peak HRR for Test Data and Gamma Fit from Table 4-1 ............. 5-13
Figure 5-13 Plots of the growth exponent (n1) versus TER, peak HRR, growth time, plateau time, decay time, and decay exponent ................................................ 5-15
Figure 5-14 Plots of the decay exponent (n2) versus TER, peak HRR, growth time, plateau time, and decay time ........................................................................... 5-16
Figure 5-15 Growth exponent cumulative distribution function (top) and probability density function ................................................................................................ 5-17
Figure 5-16 Decay exponent cumulative distribution function (top) and probability density function ................................................................................................ 5-18
Figure 5-17 Plots of the energy release during growth versus TER (top) and energy release during decay versus TER (bottom) ...................................................... 5-19
Figure 5-18 Time to damage at the vertical TP ZOI for the experiments along with the times from Table 5-5 .................................................................................. 5-24
Figure A-1 HRR for Nowlen Test 1 (30 cm x 41 cm x 30 cm cardboard box with box of Kimwipes, 950 ml acetone, polyethylene wash bottle) .......................... A-2
Figure A-2 HRR for Nowlen Test 2 (30 cm x 41 cm x 30 cm cardboard box with box of Kimwipes, 950 ml acetone, polyethylene wash bottle) .......................... A-3

x
Figure A-3 HRR for Nowlen Test 3 (2.5 gal polyethylene bucket with box of Kimwipes, 950 ml acetone, polyethylene wash bottle) ...................................... A-4
Figure A-4 HRR for Nowlen Test 4 (2.5 gal polyethylene bucket with box of Kimwipes, 950 ml acetone, polyethylene wash bottle) ...................................... A-5
Figure A-5 HRR for Nowlen Test 5 (30 cm x 41 cm x 30 cm cardboard box with computer paper and crumpled paper) ............................................................... A-6
Figure A-6 HRR for Nowlen Test 6 (30 cm x 41 cm x 30 cm cardboard box with computer paper and crumpled paper) ............................................................... A-7
Figure A-7 HRR for Nowlen Test 7 (5 gal polyethylene trash can, polyethylene bag, cotton rags, paper) ............................................................................................ A-8
Figure A-8 HRR for Nowlen Test 8 (5 gal polyethylene trash can, polyethylene bag, cotton rags, paper) ............................................................................................ A-9
Figure A-9 HRR for Nowlen Test 9 (30 gal polyethylene trash can, polyethylene bag, cotton rags, paper) .......................................................................................... A-10
Figure A-10 HRR for Lee fabric pile test (30 cm stack of clothing ~2.7 kg) ........................ A-11
Figure A-11 HRR Volkinburg single airline trash bag test (one 11 gal trash bag with 12 polystyrene cups, 17 paper cups, and paper towels) .......................... A-12
Figure A-12 HRR for Lawson metal framed chair with foam seat test ................................ A-13
Figure A-13 HRR for Lawson metal framed chair with fiberglass seat test ......................... A-14
Figure A-14 HRR for WPI quarter waste bag Test 1 (One polyethylene bag with approximately six groupings of the following: a pair of shoe covers, two balls of masking tape, four yellow gloves, two cotton gloves, and one black rubber overshoe) ............................................................................. A-15
Figure A-15 HRR for WPI quarter waste bag Test 2 (One polyethylene bag with approximately six groupings of the following: a pair of shoe covers, two balls of masking tape, four yellow gloves, two cotton gloves, and one black rubber overshoe) ............................................................................. A-16
Figure A-16 HRR for WPI half waste bag Test 3 (One polyethylene bag with approximately 12 groupings of the following: a pair of shoe covers, two balls of masking tape, four yellow gloves, two cotton gloves, and one black rubber overshoe) ............................................................................. A-17
Figure A-17 HRR for WPI half waste bag Test 4 (One polyethylene bag with approximately 12 groupings of the following: a pair of shoe covers, two balls of masking tape, four yellow gloves, two cotton gloves, and one black rubber overshoe) ............................................................................. A-18
Figure D-1 Probability density function for peak heat release rate (HRR) ........................... D-1
Figure D-2 Cumulative distribution function for peak HRR .................................................. D-2
Figure D-3 Probability-probability plot for peak HRR ........................................................... D-3
Figure D-4 Probability density function for total energy release (TER) ............................... D-4
Figure D-5 Cumulative distribution function for TER ........................................................... D-4
Figure D-6 Probability-probability plot for TER .................................................................... D-5
Figure D-7 Probability density function for horizontal zone of influence (ZOI) for sensitive electronics (SE) ................................................................................. D-6
Figure D-8 Cumulative distribution function for horizontal ZOI for SE ................................. D-6

xi
Figure D-9 Probability-probability plot for horizontal ZOI for SE .......................................... D-7
Figure D-10 Probability density function for horizontal ZOI for thermoplastic (TP) cable ...... D-8
Figure D-11 Cumulative distribution function for horizontal ZOI for TP cable ....................... D-8
Figure D-12 Probability-probability plot for horizontal ZOI for TP cable ................................ D-9
Figure D-13 Probability density function for horizontal ZOI for Kerite-FR cable (KC) ......... D-10
Figure D-14 Cumulative distribution function for horizontal ZOI for KC ............................... D-10
Figure D-15 Probability-probability plot for horizontal ZOI for KC ....................................... D-11
Figure D-16 Probability density function for horizontal ZOI for thermoset (TS) cable ......... D-12
Figure D-17 Cumulative distribution function for horizontal ZOI for TS cable ..................... D-12
Figure D-18 Probability-probability plot for horizontal ZOI for TS cable .............................. D-13
Figure D-19 Probability density function for horizontal ZOI for bulk cable tray ignition (TI) ...................................................................................................... D-14
Figure D-20 Cumulative distribution function for horizontal ZOI for TI ................................ D-14
Figure D-21 Probability-probability plot for horizontal ZOI for TI ......................................... D-15
Figure D-22 Probability density function for vertical ZOI for SE .......................................... D-16
Figure D-23 Cumulative distribution function for vertical ZOI for SE ................................... D-16
Figure D-24 Probability-probability plot for vertical ZOI for SE ............................................ D-17
Figure D-25 Probability density function for vertical ZOI for TP cable ................................. D-18
Figure D-26 Cumulative distribution function for vertical ZOI for TP cable .......................... D-18
Figure D-27 Probability-probability plot for vertical ZOI for TP cable .................................. D-19
Figure D-28 Probability density function for vertical ZOI for KC .......................................... D-20
Figure D-29 Cumulative distribution function for vertical ZOI for KC ................................... D-20
Figure D-30 Probability-probability plot for vertical ZOI for KC ............................................ D-21
Figure D-31 Probability density function for vertical ZOI for TS cable ................................. D-22
Figure D-32 Cumulative distribution function for vertical ZOI for TS cable .......................... D-22
Figure D-33 Probability-probability plot for vertical ZOI for TS cable .................................. D-23
Figure D-34 Probability density function for vertical ZOI for TI ............................................ D-24
Figure D-35 Cumulative distribution function for vertical ZOI for TI ..................................... D-24
Figure D-36 Probability-probability plot for vertical ZOI for TI ............................................. D-25
Figure D-37 Probability density function for vertical in a corner ZOI for SE ........................ D-26
Figure D-38 Cumulative distribution function for vertical in a corner ZOI for SE ................. D-26
Figure D-39 Probability-probability plot for vertical in a corner ZOI for SE .......................... D-27
Figure D-40 Probability density function for vertical in a corner ZOI for TP cable ............... D-28
Figure D-41 Cumulative distribution function for vertical in a corner ZOI for TP cable ........ D-28
Figure D-42 Probability-probability plot for vertical in a corner ZOI for TP cable ................ D-29
Figure D-43 Probability density function for vertical in a corner ZOI for KC ........................ D-30
Figure D-44 Cumulative distribution function for vertical in a corner ZOI for KC ................. D-30
Figure D-45 Probability-probability plot for vertical in a corner ZOI for KC .......................... D-31
Figure D-46 Probability density function for vertical in a corner ZOI for TS cable ............... D-32

xii
Figure D-47 Cumulative distribution function for vertical in a corner ZOI for TS cable ........ D-32
Figure D-48 Probability-probability plot for vertical in a corner ZOI for TS cable ................ D-33
Figure D-49 Probability density function for vertical in a corner ZOI for TI .......................... D-34
Figure D-50 Cumulative distribution function for vertical in a corner ZOI for TI ................... D-34
Figure D-51 Probability-probability plot for vertical in a corner ZOI for TI ........................... D-35
Figure D-52 Probability density function for peak HRR ....................................................... D-36
Figure D-53 Cumulative distribution function for peak HRR ................................................ D-37
Figure D-54 Probability-probability plot for peak HRR ......................................................... D-38
Figure D-55 Probability density function for TER ................................................................ D-39
Figure D-56 Cumulative distribution function for TER ......................................................... D-39
Figure D-57 Probability-probability plot for TER .................................................................. D-40
Figure D-58 Probability density function for horizontal ZOI for SE ...................................... D-41
Figure D-59 Cumulative distribution function for horizontal ZOI for SE ............................... D-41
Figure D-60 Probability-probability plot for horizontal ZOI for SE ........................................ D-42
Figure D-61 Probability density function for horizontal ZOI for TP cable ............................. D-43
Figure D-62 Cumulative distribution function for horizontal ZOI for TP cable ..................... D-43
Figure D-63 Probability-probability plot for horizontal ZOI for TP cable .............................. D-44
Figure D-64 Probability density function for horizontal ZOI for KC ...................................... D-45
Figure D-65 Cumulative distribution function for horizontal ZOI for KC ............................... D-45
Figure D-66 Probability-probability plot for horizontal ZOI for KC ....................................... D-46
Figure D-67 Probability density function for horizontal ZOI for TS cable ............................. D-47
Figure D-68 Cumulative distribution function for horizontal ZOI for TS cable ..................... D-47
Figure D-69 Probability-probability plot for horizontal ZOI for TS cable .............................. D-48
Figure D-70 Probability density function for horizontal ZOI for TI ........................................ D-49
Figure D-71 Cumulative distribution function for horizontal ZOI for TI ................................ D-49
Figure D-72 Probability-probability plot for horizontal ZOI for TI ......................................... D-50
Figure D-73 Probability density function for vertical ZOI for SE .......................................... D-51
Figure D-74 Cumulative distribution function for vertical ZOI for SE ................................... D-51
Figure D-75 Probability-probability plot for vertical ZOI for SE ............................................ D-52
Figure D-76 Probability density function for vertical ZOI for TP cable ................................. D-53
Figure D-77 Cumulative distribution function for vertical ZOI for TP cable .......................... D-53
Figure D-78 Probability-probability plot for vertical ZOI for TP cable .................................. D-54
Figure D-79 Probability density function for vertical ZOI for KC .......................................... D-55
Figure D-80 Cumulative distribution function for vertical ZOI for KC ................................... D-55
Figure D-81 Probability-probability plot for vertical ZOI for KC ............................................ D-56
Figure D-82 Probability density function for vertical ZOI for TS cable ................................. D-57
Figure D-83 Cumulative distribution function for vertical ZOI for TS cable .......................... D-57
Figure D-84 Probability-probability plot for vertical ZOI for TS cable .................................. D-58
Figure D-85 Probability density function for vertical ZOI for TI ............................................ D-59
xiii
Figure D-86 Cumulative distribution function for vertical ZOI for TI ..................................... D-59
Figure D-87 Probability-probability plot for vertical ZOI for TI ............................................. D-60
Figure D-88 Probability density function for vertical in a corner ZOI for SE ........................ D-61
Figure D-89 Cumulative distribution function for vertical in a corner ZOI for SE ................. D-61
Figure D-90 Probability-probability plot for vertical in a corner ZOI for SE .......................... D-62
Figure D-91 Probability density function for vertical in a corner ZOI for TP cable ............... D-63
Figure D-92 Cumulative distribution function for vertical in a corner ZOI for TP cable ........ D-63
Figure D-93 Probability-probability plot for vertical in a corner ZOI for TP cable ................ D-64
Figure D-94 Probability density function for vertical in a corner ZOI for KC ........................ D-65
Figure D-95 Cumulative distribution function for vertical in a corner ZOI for KC ................. D-65
Figure D-96 Probability-probability plot for vertical in a corner ZOI for KC .......................... D-66
Figure D-97 Probability density function for vertical in a corner ZOI for TS cable ............... D-67
Figure D-98 Cumulative distribution function for vertical in a corner ZOI for TS cable ........ D-67
Figure D-99 Probability-probability plot for vertical in a corner ZOI for TS cable ................ D-68
Figure D-100 Probability density function for vertical in a corner ZOI for TI .......................... D-69
Figure D-101 Cumulative distribution function for vertical in a corner ZOI for TI ................... D-69
Figure D-102 Probability-probability plot for vertical in a corner ZOI for TI ........................... D-70


xv
LIST OF TABLES
Table 2-1 Dispositioned list of transient fire tests from NUREG/CR-6850 .......................... 2-6
Table 2-2 Dispositioned list of additional tests NUREG/CR-4679 [21] ............................. 2-10
Table 2-3 Dispositioned list of WPI PPE bag tests performed for SRS [22] ..................... 2-11
Table 3-1 Categorization of all PC or CH transient fire events in the FEDB ....................... 3-4
Table 3-2 Categorization of all PC or CH hot work transient fire events in the FEDB .................................................................................................................. 3-5
Table 3-3 Categorization of all PC or CH non-hot work transient fire events in the FEDB ............................................................................................................ 3-5
Table 3-4 Assignment of fuel packages to FEDB categories ............................................. 3-6
Table 3-5 Final normalized test weights for the generic transient fire distributions .......... 3-11
Table 3-6 Test items removed from TCCL transient fire distribution ................................ 3-15
Table 3-7 Final normalized test weights for the TCCL transient fire distributions ............. 3-16
Table 4-1 Generic transient fire distributions of peak HRR, TER, and ZOI ........................ 4-2
Table 4-2 Distributions of peak HRR, TER, and ZOI for hot work only or non-hot work only transient events ..................................................................... 4-4
Table 4-3 Distributions of peak HRR, TER, and ZOI for the individual assessments detailed in Appendix C.2 .................................................................................... 4-5
Table 4-4 TCCL transient fire distributions of peak HRR, TER, and ZOI ........................... 4-6
Table 5-1 Bins of peak HRR and TER for determining SF for the generic transient fire distribution .................................................................................................... 5-2
Table 5-2 Bins of peak HRR and TER for determining SF for the TCCL transient fire distribution .................................................................................................... 5-3
Table 5-3 Summary of input parameters for detailed modeling ........................................ 5-21
Table 5-4 HRR parameters and key FDTS parameters for a selection of percentiles for the generic transient fire distribution ........................................................... 5-22
Table 5-5 Time to damage for targets located on the vertical TP ZOI boundary using the parameters from Table 5-4 along with the ZOI based on Table 4-1 ........... 5-23
Table 5-6 Time to damage for the vertical ZOI using the parameters from Table 5-4 along with the ZOIs based on Table 4-1........................................................... 5-24
Table 5-7 Time to damage for the vertical in a corner ZOI using the parameters from Table 5-4 along with the ZOIs based on Table 4-1 .......................................... 5-25
Table 5-8 Time to damage for the horizontal ZOI using the parameters from Table 5-4 along with the ZOIs based on Table 4-1 .......................................... 5-25

xvi
Table 5-9 Actual ZOI using the parameters from Table 5-4 versus the ZOIs based on Table 4-1 for the largest no target damage percentile for each ZOI in Table 5-8 ...................................................................................................... 5-26
Table 5-10 HRR parameters and key FDTS parameters for a selection of percentiles for the TCCL transient fire distribution .............................................................. 5-27
Table 5-11 Time to damage for targets located on the vertical TP ZOI boundary using the parameters from Table 5-10 along with the ZOI based on Table 4-4 .......................................................................................................... 5-27
Table 5-12 Time to damage for the vertical ZOI using the parameters from Table 5-10 along with the ZOIs based on Table 4-4 ........................................ 5-28
Table 5-13 Time to damage for the vertical in a corner ZOI using the parameters from Table 5-10 along with the ZOIs based on Table 4-4 ................................ 5-28
Table 5-14 Time to damage for the horizontal ZOI using the parameters from Table 5-10 along with the ZOIs based on Table 4-4 ........................................ 5-29
Table 8-1 Recommended generic transient fire distributions of peak HRR, TER, and ZOI .............................................................................................................. 8-2
Table 8-2 Recommended TCCL transient fire distributions of peak HRR, TER, and ZOI .............................................................................................................. 8-3
Table 8-3 Summary of input parameters for detailed modeling .......................................... 8-4
Table 8-4 Generic transient fire HRR bins, fire growth parameters, and key Fire Dynamics Tools (FDTS) parameters for determining SF .................................... 8-5
Table 8-5 TCCL transient fire HRR bins, fire growth parameters, and key FDTS parameters for determining SF ........................................................................... 8-6
Table C-1 Independent weightings of all FEDB transient fires used for Table 3-1 ............. C-2
Table C-2 Independent weightings of hot work FEDB transient fires used for Table 3-2 ........................................................................................................... C-3
Table C-3 Independent weightings of non-hot work FEDB transient fires used for Table 3-3 ........................................................................................................... C-4
Table C-4 First independent assigning of fuel packages to FEDB fuel category and category weighting ..................................................................................... C-5
Table C-5 Second independent assigning of fuel packages to FEDB fuel category and category weighting ..................................................................................... C-8
Table C-6 Third independent assigning of fuel packages to FEDB fuel category and category weighting ................................................................................... C-11
Table C-7 Fourth independent assigning of fuel packages to FEDB fuel category and category weighting ................................................................................... C-13
Table C-8 Total number votes (max of 4 Round 1, max of 5 Round 2) that a fuel package is not in a TCCL ................................................................................ C-15
Table E-1 Summary of notable inspection findings related to transient materials ............. E-2

xvii
EXECUTIVE SUMMARY
PRIMARY AUDIENCE: Fire probabilistic risk assessment (FPRA) engineers and fire protection engineers supporting the development and/or maintenance of FPRAs.
SECONDARY AUDIENCE: Fire protection engineers responsible for plant fire protection and control of transient fire hazards. Engineers, utility managers, and other stakeholders who review FPRAs and who interface with FPRA methods.
KEY RESEARCH QUESTION
How can nuclear power plant fire operating experience and experimental results be used to improve the FPRA methodology and data for transient fires?
RESEARCH OVERVIEW
This report is a joint collaboration between the Electric Power Research Institute (EPRI) and the U.S. Nuclear Regulatory Commission Office of Nuclear Regulatory Research (NRC-RES) under a memorandum of understanding on fire research. The methods in this report were developed by a working group consisting of fire protection engineers and technical experts in experimental test programs, FPRA, operating experience, and fire modeling, representing both EPRI and the NRC. The working group met periodically to discuss the results and formalize the methods and data that are presented in this report.
This report combines experimental data on transient combustibles with operating experience to develop new probabilistic distributions for modeling transient fires in FPRA. Two sets of distributions have been developed. Each set consists of distributions of heat release rate (HRR), total energy release (TER), and zones of influence (ZOIs). The first is a set of generic parameters applicable for any at-power transient fire. The second is a set of parameters intended for use in locations subject to strict controls on the presence of transient combustibles.
In addition to the two sets of distributions, this report also develops input parameters for use in detailed fire modeling. These include fire growth and decay timing data, heat of combustion, fire Froude number, and yields of minor product of combustion.
KEY FINDINGS
Multiple independent evaluations of operational experience were combined to create the distributions and input parameters in this report. Analysis of the independent evaluations does not show a significant sensitivity of the probability distributions with respect to the individual assessments.
The peak HRR of a generic transient fire can be represented by a gamma distribution with a 98th percentile fire size of 278 kW and a 75th percentile fire size of 42 kW (see Table 4-1). At the 98th percentile, this is a 13% reduction from the 317 kW in NUREG/CR-6850 Volume II; however, at the 75th percentile, this is a 70% reduction in peak HRR from the 142 kW in NUREG/CR-6850 Volume II.

xviii
The 98th percentile peak HRR of a transient fire in a transient combustible control location (TCCL) is 143 kW (see Table 4-4). This is a 55% reduction from the NUREG/CR-6850 Volume II value. At the 75th percentile, the peak HRR of 25 kW is an 83% reduction in peak HRR from the NUREG/CR-6850 Volume II value.
The 98th percentile TER for a generic transient fire is 123 MJ. In the absence of secondary combustibles and in conjunction with the 278 kW peak HRR, this value is unlikely to result in hot gas layer capable of damaging electrical cables.
The 98th percentile vertical (plume temperature) ZOI for thermoplastic cable is 1.78 m (5.8 ft). Combined with the effective fire elevation of 15 cm (6 in.) this gives a total ZOI of 1.93 m (6.3 ft) above the floor. Any cable trays above the height of a typical interior door, 2.13 m (7 ft), will screen. For transient sources in a corner, the same cable trays will screen at the 90th percentile.
In detailed fire modeling, transient fires (both generic and TCCL) can be modeled with a heat of combustion of 25 MJ/kg, a fire Froude number (Q*) of 0.54, a soot yield of 5.2%, a CO yield of 4.3%, and an effective elevation above the local floor of 15 cm. (6 in.). A summary of the input parameters for detailed fire modeling is found in Table 5-3.
All transient fires (both generic and TCCL) can be modeled using a time-dependent HRR that combines a power law growth, a constant plateau, and a power law decay. The growth and decay exponents are fixed at 2.7 and 0.32, respectively. The growth time, plateau time, and decay times can be expressed as a function of the TER and peak HRR. Table 5-4 (for generic transient fires) and Table 5-10 (for TCCL transient fires) summarize the time for growth, steady state, and decay for various points along the respective HRR/TER distribution profiles.
WHY THIS MATTERS
The methods and data provided in NUREG/CR-6850 Volume II and NUREG/CR-6850 Supplement 1 resulted from an extensive effort to gather together the knowledge and best practices at that time for modeling fires in FPRAs. In some cases, the level of knowledge was not as mature as needed for supporting realism in FPRAs. For example, the aggregate results of multiple FPRAs showed that transient fires were consequential and high contributors to plant risk, which is a conclusion not wholly supported by operating experience. As a result, the FPRAs contain oversimplifications and assumptions that lean in the conservative direction. Over the years, the industry and the NRC have worked to perform testing on actual transient combustibles found in nuclear power plants and develop methods that are more realistic and representative of the operating experience with respect to fire. This report develops improved fire modeling methods that will improve the realism of modeling transient fires in FPRAs.
HOW TO APPLY RESULTS
This report provides new probabilistic distributions and detailed fire modeling input parameters for the modeling of transient fires in FPRAs. Distributions of ZOI enable the screening of targets without the need to separately calculate a ZOI through fire modeling. Detailed fire model input parameters on the fuel properties and fire growth and decay profiles can be used as direct replacement for values used in detailed fire models in current FPRAs and fire hazard analyses. This new set of model input data replaces the more limited set of data contained in NUREG/CR-6850 and NUREG/CR-6850 Supplement 1.

xix
LEARNING AND ENGAGEMENT OPPORTUNITIES
Users of this report may be interested in FPRA training, which is sponsored jointly by EPRI and the U.S. NRC-RES. The two modules that may be of interest are Module III: Fire Analysis and Module V: Advanced Fire Modeling. The Fire Analysis course is geared toward PRA practitioners responsible for treating those aspects related to fire growth and damage assessment. This training covers the basics of plant partitioning, fire frequency analysis, and the development and analysis of fire scenarios from fire ignition to target impact and fire suppression. The Advanced Fire Modeling course covers fundamentals of fire science and guidance on the use of fire models to predict fire-generated conditions that may impact nuclear power plant safety functions.
EPRI CONTACT: Ashley Lindeman, Principal Technical Leader, 704.595.2538, [email protected]
NRC CONTACT: David Stroup, Senior Fire Protection Engineer, 301.415.1649, [email protected]
PROGRAM: Nuclear Power, P41; and Risk and Safety Management, P41.07.01
IMPLEMENTATION CATEGORY: Plant Optimization


This publication is a corporate document that should be cited in the literature in the following manner:
Methodology for Modeling Transient Fires in Nuclear Power Plant Fire Probabilistic Risk Assessment. U.S. Nuclear Regulatory Commission, Office of Nuclear Regulatory Research (RES), Washington, DC, and Electric Power Research Institute (EPRI), Palo Alto, CA: 2020. NUREG-2233/3002018231. (While the NRC and EPRI reports have different publication dates, they are essentially the same report.)
xxi
CITATIONS
This report was prepared by the following:
U.S. Nuclear Regulatory Commission Washington, D.C. 20555-0001
Principal Investigators N. Melly B. Metzger D. Stroup
Electric Power Research Institute 3420 Hillview Avenue Palo Alto, CA 94304
Principal Investigators A. Lindeman M. Randelovic
Under contract to EPRI
Jensen Hughes 3610 Commerce Drive, Suite 817 Baltimore, MD 21227
Principal Investigator J. Floyd
Engineering, Planning, and Management, Inc. 959 Concord St., Suite 310 Framingham, MA 01701
Principal Investigator M. Schairer
Public Service Electric & Gas Nuclear, LLC Alloway Creek Neck Road Hancocks Bridge, NJ 08308
Principal Investigator D. Shumaker
This report describes research sponsored jointly by the U.S. Nuclear Regulatory Commission’s (NRC’s) Office of Nuclear Regulatory Research (RES) and the Electric Power Research Institute (EPRI) performed under a formal Memorandum of Understanding (MOU).


xxiii
ACKNOWLEDGMENTS
The Electric Power Research Institute and the U.S. Nuclear Regulatory Commission thank Dr. Nicholas Dembsey of the Worcester Polytechnic Institute Department of Fire Protection Engineering for contributing the data from the waste bag tests performed for the Department of Energy’s Savannah River Site.
A draft of this report was Noticed in the Federal Register for public comment on January 2, 2020 (85 FR 143). The authors thank Seth Statler, National Fire Protection Association, and the Center for Nuclear Waste Regulatory Analysis (CNWRA) for their comments on the draft of this document. The authors’ resolution of comments on the draft report is available in the Agencywide Documents Access and Management System (ADAMS) under accession number ML20083F972.

xxv
ACRONYMS
CFAST Consolidated Model of Fire Growth and Smoke Transport
CH challenging
CO carbon monoxide
CSV comma separated value
EDG emergency diesel generator
EPRI Electric Power Research Institute
FAQ frequently asked question
FDS Fire Dynamics Simulator
FDTS Fire Dynamics Tools
FEDB fire events database
FPRA fire probabilistic risk assessment
FR fire resistant
GT general transient
HGL hot gas layer
HRR heat release rate
HVAC heating, ventilation, and air conditioning
KC Kerite-FR cable
MCR main control room
NC non-challenging
NFPA National Fire Protection Association
NPP nuclear power plant
NRC Nuclear Regulatory Commission
NSP non-suppression probability
P-P probability-probability
PAU physical analysis unit
PC potentially challenging
PPE personal protective equipment
xxvi
PRA probabilistic risk assessment
RCP reactor coolant pump
RES NRC’s Office of Nuclear Regulatory Research
RHR residual heat removal
SE sensitive electronics
SF severity factor
SNL Sandia National Laboratories
SRS Savannah River Site
TCCL transient combustible control location
TER total energy release
TI bulk cable/tray ignition
TISR transient ignition source region
TISRF transient ignition source region factor
TP thermoplastic
TS thermoset
WC welding and cutting
WPI Worcester Polytechnic Institute
ZOI zone of influence

1-1
1 INTRODUCTION
1.1 Background
In 2005, the Electric Power Research Institute (EPRI) and the U.S. Nuclear Regulatory Commission’s (NRC’s) Office of Nuclear Regulatory Research (RES) issued a joint technical report titled EPRI/NRC-RES Fire PRA Methodology for Nuclear Power Facilities (EPRI 1011989, NUREG/CR-6850) [1]. This report documented methods, tools, and data for conducting a fire probabilistic risk assessment (FPRA) for a commercial nuclear power plant (NPP) application. Following this publication, many utilities developed FPRAs using the guidance in NUREG/CR-6850 to support risk-informed applications, including the transition to the performance-based fire protection licensing basis, National Fire Protection Association (NFPA) 805. The results obtained from the FPRA models have suggested specific elements in the fire scenario analysis where improved methods and/or guidance could reduce conservatism and increase realism in the risk estimates. Consequently, during the past 15 years, FPRA research covering the areas of fire ignition frequencies (for example, NUREG-2169 [2]), fire modeling (for example, NUREG-2178 [3, 4] and NUREG/CR-7010 [5, 6]), human reliability analysis (NUREG-1921 [7]), and spurious operations (for example, NUREG/CR-7150 [8]) have been published and made available to the industry.
The previously mentioned reports have resulted in improved realism for electrical cabinet fires, cable tray fires, electric motor fires, and dry transformer fires, which cover all of the ignition sources covered in Appendix G of NUREG/CR-6850 except for transient combustibles. The research in this report addresses that gap in recent research on improved realism.
This report consolidates existing methods on the modeling of transient fires; provides new probabilistic distributions for peak heat release rate (HRR), total energy release (TER)1, and zones of influence (ZOIs) for various types of targets and provides a method for the detailed modeling of transient fires including fire growth and decay, yields of minor combustion products, and the physical size and location of the fire. The distributions and data developed in this report are intended for use in at-power FPRA applications. For low-power FPRA applications, the distributions and detailed fire modeling data developed in this report would be applicable for transient fire locations where the combustible load does not change due to storage of materials or maintenance activities during low-power operations.
1 Note that TER is referred to as total heat released in applicable ASTM standards for oxygen consumption calorimetry.

Introduction
1-2
1.2 Technical Approach
The research documented in this report was developed by a working group that included members of both the regulator and the nuclear power industry. The working group members, along with their affiliations, are as follows:
Jason Floyd, Jensen Hughes
Brian Metzger, NRC-NRR
Nicholas Melly, NRC-RES
Mark Schairer, Engineering, Planning, and Management, Inc.
Denis Shumaker, Public Service Electric & Gas
David Stroup, NRC-RES
The project consisted of two phases. The first phase was an extensive set of experiments that measured the HRR and other fire characteristics of transient fires [9]. The test report contains details on all of the fuel packages that were tested; the test protocol, including selection of fuel packages and selection of ignition sources; the methods used to process the collected test data; and the collected and derived data including HRR, fire diameter, ZOIs, fire growth and decay parameters, and the combustion properties of the fuel packages. The second phase, documented in this report, created a combined data set of data collected in the first phase with data from previous experimental programs, developed a methodology for weighting the combined data set based on industry experience with transient fires, and used the weighted combined data set to create improved probabilistic distributions for use in modeling transient fires in FPRA. Additionally, this report presents detailed guidance for modeling the time dependence and defining the combustion characteristics of transient fires.
Additional support was obtained in the weighting of test data from the following individuals:
Joelle DeJoseph, Jensen Hughes
Orelvis Gonzalez, Jensen Hughes
Victor Ontiveros, Jensen Hughes
1.3 Report Organization
The report is organized as follows:
Section 2 provides a review of prior work related to transient fires. Section 2.1 is a review of prior FPRA guidance related to transient fires. Where this report provides updated data or methods, it is noted in the summary for that item. Section 2.2 is a review of prior testing of transient fuel packages and the applicability of that testing for the distributions and input data developed in Sections 4 and 5.
Section 3 covers the technical approach for developing the new distributions and related input data for modeling, including the definition of a transient combustible control location (TCCL).
Section 4 develops and presents two sets of probabilistic distributions for peak HRR, TER, and ZOIs. The two sets are a generic distribution applicable to all areas of a plant and a distribution intended for a TCCL.

Introduction
1-3
Section 5 develops and presents new input data for performing detailed fire modeling for transient fires. This includes defining physical parameters of the fire such as the diameter, heat of combustion, and product yield data. It also includes experimentally derived correlations that link the distributions of peak HRR and TER to the growth, steady-state, and decay stages of a transient combustible fire.
Section 6 covers potential sources of uncertainty.
Section 7 covers the extent to which the application of the new data and distributions can be combined with existing FPRAs using the prior distributions and modeling parameters
Section 8 summarizes the results of this study.


2-1
2 REVIEW OF PRIOR TRANSIENT FIRE WORK
This section provides a review of prior work on modeling transient fires in fire probabilistic risk assessments (FPRAs) and prior testing of transient fuel packages.
2.1 Frequently Asked Questions, NUREGs, and EPRI Research
In the review of prior work that follows, it is noted in each section whether the data developed in this report are an improvement over existing data. Note that the contents of Sections 4 and 5 show that conservatisms result from the application of the methods and data summarized in this section; therefore, the continued use of this prior work in FPRA is not a concern from a conservatism point of view. For existing FPRAs, a discussion on how an analyst may choose to apply the new distributions and data is presented in Section 7.
2.1.1 NUREG/CR-6850 Volume 2
NUREG/CR-6850 Volume 2 [1] provides guidance related to modeling the effects of transient fires. This includes ignition source weighting for transient fires, target screening, the peak heat release rate (HRR) distribution for transient fires and determining the severity factor (SF) while accounting for non-suppression probability (NSP).
In the fire ignition frequencies (Task 6) discussion in NUREG/CR-6850 [1], a method is provided to apportion the transient fire frequencies over fire compartments in a nuclear power plant (NPP). The approach uses a relative ranking scheme that accounts for the variance in maintenance, occupancy, and storage that occur among different fire compartments. The ignition frequency for a specific ignition source, IS, in compartment J, IS,J, is given by:
𝛌𝐈𝐒,𝐉 𝛌𝐈𝐒𝐖𝐋𝐖𝐈𝐒,𝐉,𝐋 (2-1)
where IS is the plant level fire ignition frequency for the ignition source (for example, values from NUREG-2169 [2]) appropriate for location L, WL is the weighting factor for location L, and WIS,J,L is the weighting factor reflecting the quantity of ignition source in compartment J of location L. Note that transient ignition frequencies are mapped to four location bins for general transients and three location bins for transients due to hot work.
The location weighting factor, WL, is tabulated in Table 6-2 of NUREG/CR-6850. WL accounts for differences in plant construction where one or more plant locations might be shared by multiple units. This report does not change the application of Table 6-2 for determining WL.
The NUREG/CR-6850 method for determining WIS,J,L was later clarified in frequently asked question (FAQ) 12-0064 R1 [10] and FAQ 14-0007 [11], covered in Sections 2.1.2 and 2.1.4. This report does not change the application of FAQ 12-0064 or FAQ 14-0007 as improved methods over those presented in NUREG/CR-6850.
In the scoping fire modeling (Task 8) discussion in NUREG/CR-6850, targets can be screened if an ignition source does not damage the target at the 98th percentile HRR for that ignition

Review of Prior Transient Fire Work
2-2
source type. This method was applied when defining the 98th percentile screening zones of influence (ZOIs) provided in Section 4.1 of this report.
In the detailed fire modeling (Task 11) discussion in NUREG/CR-6850, the compartment-based frequency may be further subdivided by assigning a scenario ignition frequency, scenario, to subsets of the floor area. As a simple example, consider a large room with only a single target, no fixed ignition sources, and no secondary combustibles that could cause a damaging hot gas layer (HGL). Only transient fires located so that the target is within the transient fire scenario ZOI would damage the target. All other transient fire locations would not damage the target. The room could be partitioned to assign part of the transient fire frequency to the area of the ZOI and the remainder of the frequency to the remainder of the room. This apportionment is done based on the floor area fraction as shown:
𝛌𝐬𝐜𝐞𝐧𝐚𝐫𝐢𝐨 𝛌𝐈𝐒,𝐉𝐧𝐀,𝐬𝐜𝐞𝐧𝐚𝐫𝐢𝐨
𝐧𝐀,𝐉 (2-2)
where nA is the floor area. This process was further refined in FAQ 14-0007.
The peak HRR distribution is defined in NUREG/CR-6850 Appendix G as a gamma distribution with a 75th percentile HRR of 142 kW and 98th percentile HRR of 317 kW. This distribution is defined with gamma parameters of = 1.8 (shape parameter) and = 57.4 (rate parameter). This distribution was based on a collection of 27 tests that are summarized in Table G-7 of NUREG/CR-6850. As covered in Section 2.2.2, some of the tests are not representative of expected transient combustibles in NPPs and no effort was made to weight the likelihood of the tests when developing the distribution. This report develops a new gamma distribution based on a much larger set of experiments that are weighted based on operating experience. Some of the tests from NUREG/CR-6850 are included in the new distribution. This new gamma distribution for peak HRR, presented in Section 4.1, replaces the gamma distribution from NUREG/CR-6850.
NUREG/CR-6850 Appendix E defines the SF of a fire scenario as the probability that the fire scenario, if not suppressed, could lead to target damage. For a scenario, k, this is represented as the product value SFkPns,k, where SF is the fraction of fires that could cause damage and Pns is the NSP associated with that fraction. For a transient fire, the HRR is represented by a probabilistic distribution of HRRs. Each unique HRR will have a unique time to damage and, therefore, a varying Pns. Adequately representing the SFkPns,k requires converting the HRR distribution into a probability distribution for the time to damage, pdamage(t). This allows SFkPns,k t
to be evaluated as:
𝐒𝐅𝐤𝐏𝐧𝐬,𝐤 𝐩𝐝𝐚𝐦𝐚𝐠𝐞 𝐭 𝐏𝐧𝐬 𝐭 𝒅𝐭𝟎 (2-3)
This can be estimated in a probabilistic risk assessment (PRA) by binning the HRR distribution, determining the time to damage for the midpoint fire size in each bin, and summing the product of the bin width, Pk,i, by the Pns for the midpoint fire size of the bin, Pns,k,i.
𝐒𝐅𝐤𝐏𝐧𝐬,𝐤 ∑ 𝐏𝐤,𝐢𝐏𝐧𝐬,𝐤,𝐢𝐢 (2-4)
The approach given in Equation 2-4 is not changed by this report; however, because this report provides new transient fire distributions in Section 4, the HRR bins in NUREG/CR-6850 are replaced with new bins in Section 5 that are tied to the new distributions.

Review of Prior Transient Fire Work
2-3
2.1.2 Transient Fire Frequency Influence Factors (FAQ 12-0064 R1)
FAQ 12-0064 R1 [10] clarifies the treatment of influence factors in the fire ignition frequencies (Task 6) discussion in NUREG/CR-6850 [1]. The clarification was needed to better address areas with enhanced administrative controls on transient combustibles or hot work. The FAQ addresses the computation of WIS,J,L in Equation 2-1 of this report. For transient combustibles, the applicable ignition sources are general transients (GTs) (Bins 3, 7, 25, and 37), ignition source = GT, and transient fires caused by welding and cutting (WC) (Bins 6, 24, and 36), ignition source = WC. The weighting factors are computed as:
𝐖𝐆𝐓,𝐉,𝐋𝐧𝐦,𝐉,𝐋 𝐧𝐨,𝐉,𝐋 𝐧𝐬,𝐉,𝐋
𝐍𝐆𝐓,𝐋
𝐍𝐆𝐓,𝐋 ∑ 𝐧𝐦,𝐢,𝐋 𝐧𝐨,𝐢,𝐋 𝐧𝐬,𝐢,𝐋𝐢 𝐢𝐧 𝐋
(2-5)
𝐖𝐖𝐂,𝐉,𝐋𝐧𝐡,𝐉,𝐋
𝐍𝐖𝐂,𝐋
𝐍𝐖𝐂,𝐋 ∑ 𝐧𝐡,𝐢,𝐋𝐢 𝐢𝐧 𝐋
(2-6)
where n is an influence factor with h being hot work, m being general electromechanical maintenance, o being occupancy, and s being storage. Values for n can be 0 (none), 0.1 (extremely low—only for h), 0.3 (very low), 1 (low), 3 (medium), 10 (high), and 50 (very high—only for h and m). Detailed definitions for the categories are provided in the FAQ.
The result of applying this FAQ is a unique weighting factor for each room that is used to determine the transient fire ignition source frequency. This FAQ was later modified by FAQ 14-0007, covered in Section 2.1.4, which allows for a further refinement of IS,J within the compartment J. This report does not change the methods in FAQ 12-0064 R1 or FAQ 14-0007.
2.1.3 Damage to Enclosed Sensitive Electronics (FAQ 13-0004)
FAQ 13-0004 [12] clarifies the treatment of determining damage to solid state and sensitive electronics (SE). The FAQ provides guidance for when to apply the NUREG/CR-6850 [1] damage thresholds of 65°C (149°F) or 3 kW/m2. That method states that if the SE is mounted inside of a cabinet in a manner in which the SE is shielded from the direct radiation of the fire by the cabinet wall, the exposure limits for thermoset (TS) cable can be used to evaluate damage to the SE.
This method is not changed by the contents of this report. Where this report refers to the SE ZOI or time to damage for SE, that reference is for SE directly exposed to the fire—that is, the SE is not in a cabinet and is either immersed in the fire plume or is directly exposed to radiation from the fire.
2.1.4 Transient Fire Likelihood (FAQ 14-0007)
FAQ 14-0007 [11] provides a refinement to the method presented in FAQ 12-0064 [10]. The methodology in FAQ 12-0064 applies at the physical analysis unit (PAU) level. FAQ 14-0007 notes that a PAU itself likely has areas with different levels of maintenance, occupancy, and storage. One example given is that a PAU could have an area marked as a transient combustible free zone even though another area of the PAU could have a storage area. The combustible free zone is likely present due to some risk significant equipment or cables in that area. The FPRA model would be more realistic if the combustible free zone were reflected in the modeling. FAQ-14-0007 was developed to provide a method for handling areas of the PAU with widely varying transient fire likelihoods.

Review of Prior Transient Fire Work
2-4
The method applies to general transients (Bins 3, 7, 25, and 37) and transient fires due to WC (Bins 6, 24, and 36). The method does not apply for cable fires due to WC (Bins 5, 11, and 31).
FAQ 14-0007 defines a new region called a transient ignition source region (TISR). A TISR is a subdivision of a PAU that is identified as having varying ignition frequency characteristics. A transient scenario in TISR k is assigned a frequency, scenario, based on the following equations:
𝛌𝐬𝐜𝐞𝐧𝐚𝐫𝐢𝐨 𝛌𝐓𝐒𝐈𝐑,𝒌𝐧𝐀,𝐬𝐜𝐞𝐧𝐚𝐫𝐢𝐨
𝐧𝐀,𝐓𝐈𝐒𝐑 (2-7)
𝛌𝐓𝐒𝐈𝐑𝒌𝛌𝐈𝐒,𝐉𝐓𝐈𝐒𝐑𝐅𝐈𝐒,𝐤,𝐉 (2-8)
where λ is the ignition source frequency assigned to TISR k and TISRFIS,k,J is the transient ignition source region factor for ignition source IS (IS is either GT or WC) in TISR k in compartment J. Note that different TISRs can be defined for general transient fires (Bins 3, 7, 25, and 37) and for transient fires due to WC (Bins 6, 24, and 36).
TISRFIS,k,J is computed by dividing J into multiple TISRs or TISRk,J. Each TISRk,J has a floor area, nA,k,J, and its own set of influence factors nM,k,J, nO,k,J, nS,k,J, and nH,k,J. TISRFIS,k,J is then computed using the influence factors weighted by floor area as shown:
𝐓𝐈𝐑𝐒𝐅𝐆𝐓,𝐤,𝐉𝐧𝐌,𝐤,𝐉 𝐧𝐎,𝐤,𝐉 𝐒 𝐧𝐀,𝐤,𝐉
∑ 𝐧𝐌,𝐢,𝐉 𝐧𝐎,𝐢,𝐉 𝐧𝐒,𝐢,𝐉 𝐧𝐀,𝐢,𝐉𝐢 𝐢𝐧 𝐉 (2-9)
𝐓𝐈𝐑𝐒𝐅𝐖𝐂,𝐤,𝐉𝐧𝐇,𝐤,𝐉 𝐧𝐀,𝐤,𝐉
∑ 𝐧𝐇,𝐢,𝐉 𝐧𝐀,𝐢,𝐉𝐢 𝐢𝐧 𝐉 (2-10)
Detailed examples are provided in FAQ 14-0007. This report does not change the method in this FAQ.
2.1.5 Bulk Cable/Tray Ignition (FAQ 16-0011)
FAQ 16-0011 [13] clarified the method for the initiation of a propagating fire in a cable tray. The FAQ establishes a temperature threshold of 500°C (932°F) and a heat flux threshold of 25 kW/m2 for bulk cable/tray ignition (TI). These are conditions that represent direct flame impingement. Bulk ignition represents the ignition of a large enough area of a tray that the fire intensity of the tray is large enough to cause fire spread along the tray or to trays above. Below the threshold exposures, cable failures due to thermal exposure may result in small areas of flame; however, those fires will not be sufficiently intense to sustain a growing, spreading fire.
The FAQ does not change the method for defining the effect of solid bottom trays presented in Appendix Q of NUREG/CR-6850 [1], nor does it change the method for determining the time of tray-to-tray propagation in Appendix R of NUREG/CR-6850.
The criteria in this FAQ were used to evaluate the TI ZOI and TI time to damage values that are presented in Sections 4 and 5 of this report.

Review of Prior Transient Fire Work
2-5
2.1.6 Fire Growth Times (NUREG/CR-6850 Supplement 1)
Chapter 17 of NUREG/CR-6850 Supplement 1 [14] provides a suggested value for the NSP for transient fires in the main control room (MCR) and a method for determining the growth times for transient fires.
The suggested NSP was a clarification on which NSP curve to apply for transient fires in the MCR. The clarification is to use the MCR NSP curve instead of the transient fire NSP curve for transient fires in the MCR. This report does not modify any existing methods on applying NSP to transient fires.
Growth time suggestions were provided for three types of transient fires, as follows:
For common trash items contained in a plastic or metal trash can, the time to peak HRR is 8 minutes. This is based upon two sets of experiments involving five tests of trash in trash receptacles. Growth times ranged from 7 to 13 minutes.
For common trash items contained in a plastic trash bag, but not in a trash can, the time to peak HRR is 2 minutes. This is based upon two sets of experiments involving six tests of trash in plastic trash bags or a box. Growth times ranged from 1 to 4 minutes.
For transient fires involving spilled solvents or flammable liquid fuels, the time to peak HRR is zero minutes—that is, the fire is instantly at its peak size.
The growth times provided are representative of those items; however, in a typical FPRA, specific transient fuel packages are not evaluated because the transient fire could be any transient combustible material. A more useful parameter would be a generic approach for fire growth that represents the overall expected hazard due to transient fires. Additionally, the method in NUREG/CR-6850 Supplement 1 does not address the length of time the fire burns or how the fire decays. Both of those parameters are important in assessing the HGL or the time to damage. The method in this report provides a comprehensive set of fire growth and decay guidance that is an improvement over the transient fire growth methodology in NUREG/CR-6850 Supplement 1.
2.1.7 Transient Fire Propagation Factor (EPRI 3002005303)
Section 4 of EPRI 3002005303 [15] describes a method of assessing the probability of propagation for transient fires. This method was an effort to reconcile the 317 kW, 98th percentile peak HRR for transient fires in NUREG/CR-6850 with the operating experience contained in The Updated Fire Events Database [16]. It was observed that there were events included in the fire ignition frequency for transient fires where the specific ignition source was not a significant combustible mass and was also not in proximity to a significant combustible mass. The method computes a weighting factor that reduces the transient ignition frequency to account for the fact that many of the events that are part of the frequency would never have developed into the large fires represented by the experiments used in NUREG/CR-6850.
The body of testing used in this report includes a much wider range of combustible materials compared with those in NUREG/CR-6850. The various events in the fire events database (FEDB) where no significant fuel load existed are represented in the test data used in this report. The distributions and modeling guidance in this report already incorporate transient events with no significant fuel load; therefore, the method covered in Section 4 of EPRI 3002005303 should not be applied when using the method in this report.

Review of Prior Transient Fire Work
2-6
2.2 Prior Testing
A review was undertaken of prior testing efforts related to transient combustibles. The following sections review prior test efforts and disposition individual tests for their relevance to transient fires in NPPs during at-power operations.
2.2.1 EPRI/NRC Transient Fire Testing
The guidance in this report primarily relies upon the extensive fire test series performed in 2018 and documented by the NRC and EPRI [9]. This test series consisted of 99 fuel packages with a total of 290 tests. Full details of the test items and ignition sources, data collected during the testing, and analysis of the test results are provided in the test report. Familiarity with the contents of the test report may aid in the understanding of the method development in this report.
2.2.2 NUREG/CR-6850 Appendix G
The 98th percentile HRR of 317 kW recommended by NUREG/CR-6850 [1] was based upon a collection of 27 tests of fuel packages from prior experiments performed between 1978 and 1985 [17–20]. A list of the 27 tests is provided in Table 2-1. Table 2-1 provides a brief description of the test, comments on the test, and an indication if the test was included in the distributions developed in this report. It is noted that the data available for the tests in Table 2-1 consist of the published HRR curves in the various reports referenced in NUREG/CR-6850. The curves were digitized by hand using Plot Digitizer, an open source tool. Data on product yields were not published. This limits the derived test data to peak HRR, total energy release (TER), ZOIs, Q* (where Q* is based upon the fuel package description and the assumption that the entire footprint of the package was involved), and the heat of combustion (Hc). Note that in the case of the Lee fabric test, the Hc assumes complete combustion of the fuel package. HRR curves and summary details of the tests are provided in Appendix A.
Table 2-1 Dispositioned list of transient fire tests from NUREG/CR-6850
Test Fuel Package Comments Use Test?
SNL—Nowlen Test 1 [17]
30 cm x 41 cm x 30 cm cardboard box with box of Kimwipes, 950 ml acetone, polyethylene wash bottle
These items are in FEDB events but not in the same fuel package. Low occurrence of flammable liquids in FEDB events. The quantity of liquid is plausible as is the grouping; therefore, it is included.
Y
SN—Nowlen Test 2 [17]
30 cm x 41 cm x 30 cm cardboard box with box of Kimwipes, 950 ml acetone, polyethylene wash bottle
These items are in FEDB events but not in the same fuel package. Low occurrence of flammable liquids in FEDB events. The quantity of liquid is plausible as is the grouping; therefore, it is included.
Y

Review of Prior Transient Fire Work
2-7
Table 2-1 Dispositioned list of transient fire tests from NUREG/CR-6850 (continued)
Test Fuel Package Comments Use Test?
SNL—Nowlen Test 3 [17]
2.5 gal polyethylene bucket with box of Kimwipes, 950 ml acetone, polyethylene wash bottle
These items are in FEDB events but not in the same fuel package. Low occurrence of flammable liquids in FEDB events. The quantity of liquid is plausible as is the grouping; therefore, it is included.
Y
SNL—Nowlen Test 4 [17]
2.5 gal polyethylene bucket with box of Kimwipes, 950 ml acetone, polyethylene wash bottle
These items are in FEDB events but not in the same fuel package. Low occurrence of flammable liquids in FEDB events. The quantity of liquid is plausible as is the grouping; therefore, it is included.
Y
SNL—Nowlen Test 5 [17]
30 cm x 41 cm x 30 cm cardboard box with computer paper and crumpled paper
Similar to FEDB Fire ID 30459. Y
SNL—Nowlen Test 6 [17]
30 cm x 41 cm x 30 cm cardboard box with computer paper and crumpled paper
Similar to FEDB Fire ID 30459. Y
SNL—Nowlen Test 7 [17]
5 gal trash can, polyethylene bag, cotton rags, paper
Similar fuels noted in FEDB Fire IDs 248, 20376, and 30351.
Y
SNL—Nowlen Test 8 [17]
5 gal polyethylene trash can, polyethylene bag, cotton rags, paper
Similar fuels noted in FEDB Fire IDs 248, 20376, and 30351. Y
SNL—Nowlen Test 9 [17]
30 gal polyethylene trash can with polyethylene bag and paper
Similar to the plastic-trash-full item tested for this project. Y
LBL—Volkinburg rubbish bag [18]
32 gal polyethylene bag with straw, grass, and eucalyptus duff
Vegetation materials not representative of materials expected in a NPP trash bag.
N
LBL—Volkinburg three airline bags [18]
Three 11 gal trash bags with 36 polystyrene cups, 51 paper cups, and paper towels
No events with multiple bags of trash in the FEDB. Little expectation of large amounts of polystyrene. It is noted that multiple bags of trash might occur during low power or shutdown operations.
N
LBL—Volkinburg two airline bags [18]
Two 11 gal trash bags with 24 polystyrene cups, 38 paper cups, and paper towels
No events with multiple bags of trash in the FEDB. Little expectation of large amounts of polystyrene. It is noted that multiple bags of trash might occur during low power or shutdown operations.
N

Review of Prior Transient Fire Work
2-8
Table 2-1 Dispositioned list of transient fire tests from NUREG/CR-6850 (continued)
Test Fuel Package Comments Use Test?
LBL—Volkinburg one airline bag [18]
One 11 gal trash bag with 12 polystyrene cups, 17 paper cups, and paper towels
Little expectation of large amounts of polystyrene; however, it is a single bag test, and the quantities of materials are reasonable for the contents of a small trash can.
Y
LBL—Volkinburg 6.6 L waste basket [18]
6.6 L (7 qt) polyethylene trash container with 12 qt size paper milk cartons
Polyethylene coated paper cartons not an expected item for a trash can in a NPP. This observation was echoed in NUREG/CR-4680 [17].
N
NBS—Lee clothing [18]
30 cm stack of clothing ~4.5 kg
Although clothing items are involved in FEDB events, the items involved were being worn or consisted of a single discarded item (outer layer like a sweatshirt). 4.5 kg is a significant clothing pile that exceeds the amounts noted in the FEDB events.
N
NBS—Lee fabric [18]
30 cm stack of fabric ~2.7 kg Although clothing items are involved in FEDB events, the items involved were being worn or consisted of a single discarded item (outer layer such as a sweatshirt). 2.7 kg of clothing is not a large stack and should be bounding for the FEDB events. It is representative of a couple of winter jackets.
Y
SNL— Chavez [19]
30 cm x 41 cm x 30 cm cardboard box with box of Kimwipes, 950 ml acetone, polyethylene wash bottle
These items are in FEDB events but not in the same fuel package. Low occurrence of flammable liquids in FEDB events. Although this is the same as the package for SNL—Nowlen Tests 1 and 2, which were included, the HRR curve could not be located in an available publication.
N
SNL—Chavez Test 5 [19]
2.5 gal polyethylene bucket with box of Kimwipes, 950 ml acetone, and one polyethylene wash bottle
These items are in FEDB events but not in the same fuel package. Low occurrence of flammable liquids in FEDB events. Although this is the same as the package for SNL—Nowlen Tests 3 and 4, which was included, the HRR curve could not be located in an available publication.
N

Review of Prior Transient Fire Work
2-9
Table 2-1 Dispositioned list of transient fire tests from NUREG/CR-6850 (continued)
Test Fuel Package Comments Use Test?
SNL—Cline 3 [19] Computer paper and two polyethylene trash bags
No history of multiple co-located bags in FEDB events. Nowlen notes issues with calorimetry during test, rendering data unreliable [1].
N
SNL—Cline 4 [19] Rags, paper towels, gloves and tape, methanol (2 gal or 7.57 liters), and two 40 gal polyethylene bags
No history of large quantities of flammable liquid or multiple co-located bags in FEDB events. Nowlen notes issues with calorimetry during test, rendering data unreliable [1].
N
SNL—Cline 5 [19] Computer paper and two 50 gal polyethylene trash cans
No history of multiple co-located trash containers in FEDB events. Nowlen notes issues with calorimetry during test, rendering data unreliable [1].
N
SNL—Cline 9 [19] Computer paper, folded paper, and two polyethylene trash bags
No history of multiple co-located trash containers in FEDB events. Nowlen notes issues with calorimetry during test, rendering data unreliable [1].
N
SNL—Cline #10 [19] Computer paper and two 50 gal polyethylene trash cans
No history of multiple co-located trash containers in FEDB events. Nowlen notes issues with calorimetry during test, rendering data unreliable [1].
N
SNL—Cline 11 [19] Rags, paper towels, gloves and tape, methanol (2 gal or 7.57 liters), and two 40 gal polyethylene bags
No history of large quantities of flammable liquid or multiple co-located bags in FEDB events. Nowlen notes issues with calorimetry during test, rendering data unreliable [1].
N
LBL—Volkinburg 30 lb wood crib [20]
13.6 kg of white fir with excelsior and ethanol
This is not a realistic fuel package for a transient fire in a NPP. A wood crib is a fuel package engineered for standardized fire testing.
N
LBL—Volkinburg 20 lb wood crib [20]
9.1 kg of Douglas fir with jet fuel
This is not a realistic fuel package for a transient fire in a NPP. A wood crib is a fuel package engineered for standardized fire testing.
N
LBL—Volkinburg 14 lb wood crib [20]
6.4 kg of Douglas fir with jet fuel
This is not a realistic fuel package for a transient fire in a NPP. A wood crib is a fuel package engineered for standardized fire testing.
N

Review of Prior Transient Fire Work
2-10
SNL = Sandia National Laboratories LBL = Lawrence Berkeley National Laboratory NBS = National Bureau of Standards
2.2.3 NUREG/CR-4679
While obtaining data for the tests listed in NUREG/CR-6850, an additional test publication [21] was located that contained three additional tests involving potential transient fuels. These additional tests are dispositioned in Table 2-2. HRR curves are provided in Appendix A. These tests lack mass loss data and species data; therefore, the Hc and minor product yields are not available.
Table 2-2 Dispositioned list of additional tests NUREG/CR-4679 [21]
Test Fuel Package Comments Use Test?
Lawson Test 51 Single molded fiberglass chair with metal legs
Similar to a school desk chair. This is a reasonable surrogate for chairs with metal frames and plastic seats.
Y
Lawson Test 56 Single metal chair with foam cushion
Chair was a typical metal chair with a thin foam cushion.
Y
Lawson Test 75 Three stackable metal chairs with foam cushions
The chairs were typical metal chairs with a thin foam cushion. Although a stack of chairs being stored is a possible fuel item, it would not be expected to be co-located with an ignition source, unlike a single chair that is being used during a maintenance or testing activity.
N
2.2.4 WPI Testing for Savannah River Site
In 2012, Worcester Polytechnic Institute (WPI) performed a series of fire tests on behalf of Savannah River Site (SRS) [22]. The fuel packages consisted of a plastic trash bag filled with varying quantities of personal protective equipment (PPE). The fires were ignited with a 10 kW propane ring burner that was applied for 80 seconds. This represents an ignition source that is much larger than those expected during an actual transient fire event. Test data include HRR, mass loss, and soot production; therefore, all quantities of interest except for carbon monoxide (CO) yield (which was not measured) can be derived from the test data. A total of nine tests were performed. These tests are described and dispositioned in Table 2-3. HRR curves and summary data for the tests used for creating distributions are provided in Appendix A.

Review of Prior Transient Fire Work
2-11
Table 2-3 Dispositioned list of WPI PPE bag tests performed for SRS [22]
Test Fuel Package Comments Use Test?
WPI quarter bag Corner 1
Polyethylene bag with approximately six groupings of the following:
A pair of shoe covers
Two balls of masking tape
Four yellow gloves
Two cotton gloves
One black rubber overshoe
Tests were done for SRS, which has areas with frequent need for workers in protective clothing. Generally, this type of fuel package is not expected for long-term NPP needs. This fill quantity would be representative of a plant dress-out area.
Y
WPI quarter bag Corner 2
Polyethylene bag with approximately six groupings of the following:
A pair of shoe covers
Two balls of masking tape
Four yellow gloves
Two cotton gloves
One black rubber overshoe
Tests were done for SRS, which has areas with frequent need for
workers in protective clothing. Generally, this type of fuel
package is not expected for long-term NPP needs. This fill
quantity would be representative of a plant dress-out area.
Y
WPI half bag Corner 3
Polyethylene bag with approximately 12 groupings of the following:
A pair of shoe covers
Two balls of masking tape
Four yellow gloves
Two cotton gloves
One black rubber overshoe
Tests were done for SRS, which has areas with frequent need for workers in protective clothing. Generally, this type of fuel package is not expected for long-term NPP needs. This quantity of material might be present in a dress-out area.
Y
WPI half bag Corner 4
Polyethylene bag with approximately 12 groupings of the following:
A pair of shoe covers
Two balls of masking tape
Four yellow gloves
Two cotton gloves
One black rubber overshoe
Tests were done for SRS, which has areas with frequent need for workers in protective clothing. Generally, this type of fuel package is not expected for long-term NPP needs. This quantity of material might be present in a dress-out area.
Y
WPI full bag Center 1
Polyethylene bag with approximately 25 groupings of the following:
A pair of shoe covers
Two balls of masking tape
Four yellow gloves
Two cotton gloves
One black rubber overshoe
Tests were done for SRS, which has areas with frequent need for workers in protective clothing. Generally, this type of fuel package is not expected for long-term NPP needs. This quantity of material would not be expected in typical dress-out areas during at-power operations but might be present during low-power or shutdown operations.
N

Review of Prior Transient Fire Work
2-12
Table 2-3 Dispositioned list of WPI PPE bag tests performed for SRS [22] (continued)
Test Fuel Package Comments Use Test?
WPI full bag Center 2
Polyethylene bag with approximately 25 groupings of the following:
A pair of shoe covers
Two balls of masking tape
Four yellow gloves
Two cotton gloves
One black rubber overshoe
Tests were done for SRS, which has areas with frequent need for workers in protective clothing. Generally, this type of fuel package is not expected for long-term NPP needs. This quantity of material would not be expected in typical dress-out areas during at-power operations but might be present during low-power or shutdown operations.
N
WPI full bag Corner 2
Polyethylene bag with approximately 25 groupings of the following:
A pair of shoe covers
Two balls of masking tape
Four yellow gloves
Two cotton gloves
One black rubber overshoe
Tests were done for SRS, which has areas with frequent need for workers in protective clothing. Generally, this type of fuel package is not expected for long-term NPP needs. This quantity of material would not be expected in typical dress-out areas during at-power operations but might be present during low-power or shutdown operations.
N
WPI full bag Corner 3
Polyethylene bag with approximately 25 groupings of the following:
A pair of shoe covers
Two balls of masking tape
Four yellow gloves
Two cotton gloves
One black rubber overshoe
Tests were done for SRS, which has areas with frequent need for workers in protective clothing. Generally, this type of fuel package is not expected for long-term NPP needs. This quantity of material would not be expected in typical dress-out areas during at-power operations but might be present during low-power or shutdown operations.
N
WPI full bag Wall 2
Polyethylene bag with approximately 25 groupings of the following:
A pair of shoe covers
Two balls of masking tape
Four yellow gloves
Two cotton gloves
One black rubber overshoe
Tests were done for SRS, which has areas with frequent need for workers in protective clothing. Generally, this type of fuel package is not expected for long-term NPP needs. This quantity of material would not be expected in typical dress-out areas during at-power operations but might be present during low-power or shutdown operations.
N

Review of Prior Transient Fire Work
2-13
2.3 Inspection Reports
In addition to actual fire events that have occurred in NPPs, findings from inspection reports provide some insights on potential transient events. The analysis performed in this report, covered in Section 3, used the set of challenging / potentially challenging events contained in the EPRI FEDB [16]. This implicitly contains the assumption that events that have occurred to date have a distribution of severity that matches the distribution that would exist if there were many more years of data collection. One check on this is to consider violations of transient material procedures found during NRC inspections over the period from 2000 to 2010. It is noted that such inspection findings are not fire events. They are only the discovery of some quantity of transient materials in a location where such materials and/or quantities should not be present. Transient materials also require a potential ignition source to ultimately result in a fire event. It is additionally noted that inspection findings likely bias toward significant violations—that is, a 55 gallon drum of lube oil in a combustible free zone would almost certainly result in a violation but a few sheets of paper fallen from a notebook would likely not.
A list of inspection findings where large amounts of transient combustibles were present is given in Table E-1. It is noted that that Table E-1 does not list all violations. Each finding is dispositioned in terms of its relevance to the data developed in this report. In general, the findings are dispositioned by one or more of the following basic responses:
The plant was not at power, and the scope of this report is at-power PRA.
Given the ignition sources associated with transient fire events, there is no credible ignition source that would ignite the fuel package—that is, another significant fire event would be required.
The combustible materials in the finding were tested during this project either directly or with a closely matching experiment.
A review of Table E-1 shows that the most severe violations in terms of quantity were associated with items with no credible transient ignition source or occurred during an outage. Remaining events are fuel items contained in the test database directly or through a reasonable surrogate.


3-1
3 APPROACH FOR DEVELOPING DISTRIBUTIONS AND DETAILED FIRE MODELING INPUT PARAMETERS
The following sections describe the approach used to develop probabilistic distributions and input parameters for detailed fire modeling of transient fires.
3.1 Goals
There were three high level goals for the outcome of this research effort. They are as follows:
1. Provide improved realism in methods for transient fire probabilistic risk assessment (FPRA) by reflecting operational experience.
This was achieved by weighting the available fire test data for transient combustibles to reflect the types and frequencies of events seen in the EPRI fire events database (FEDB). This process is covered in Section 3.2.
2. Provide for improved realism in the screening of targets by developing probabilistic distributions for target damage.
The heat release rate (HRR) data from fire tests were processed to determine the zone of influence (ZOI) for each test. This process is described in detail in Section 5 of the test report [9]. Using the weightings developed in Section 3.2, distributions to support target screening were developed. This process is covered in Section 3.3 with the distributions presented in Section 4.
2.1 The method accounts for vertical ZOI (plume temperature) and horizontal ZOI (radiative heat flux).
2.2 The method considered the target damage categories of exposed sensitive electronics (SE), thermoplastic (TP) cable, Kerite-FR cable (KC), thermoset (TS) cable, and bulk cable tray ignition (TI). Note that based on test data, Kerite-FR II, FR III, and HT cables can use TS data [23].
3. Provide input data to support improved realism in the detailed modeling of transient fires to support assessment of hot gas layer (HGL) development, time to damage for targets, and the effectiveness of automatic or manual fire suppression.
The HRR data from the test report [9], plus the additional tests identified in Section 2.2, were processed to characterize the fire growth and decay parameters for each test. This process is described in detail in the test report. Using the weightings developed in Section 3.2 and the distributions shown in Section 4, input data to support the detailed modeling of transient fires were developed. The process for developing the input data is covered in Sections 5.1 and 5.2. A discussion of time to damage is given in Section 5.3.

Approach for Developing Distributions and Detailed Fire Modeling Input Parameters
3-2
3.1 Input data are as simple as reasonably achievable.
3.2 Input data account for the probabilistic distribution of total energy release (TER). TER is significant for the potential to create a hazardous HGL and for determining the maximum ZOI.
3.3 Input data account for the probabilistic distribution of the peak HRR. The peak HRR influences HGL and ZOI.
3.4 Input data define the shape of the HRR curve—that is, how the fire grows and decays over time. This shape has a significant effect on the ZOI and the time to damage.
3.5 Input data define the size (through the fire Froude number) and location of the fire (distance off the floor). These influence the ZOI and HGL.
3.2 Weighting Test Data
The total testing data set that was used consists of 307 individual tests involving 110 fuel packages, which comprises the tests performed as part of this research effort [9] and the tests included as described in Sections 2.2.2, 2.2.3, and 2.2.4. One approach to developing model guidance would be to simply assign distributions based on the distributions of data in the individual tests. However, this approach would result in probabilistic distributions that consider each test as being an equally likely event. It would lack realism because the approach would not reflect the operating experience seen in the FEDB [16]. For example, there are multiple transient fire events in the FEDB involving a tarp but only one event with a plastic work cart. In developing distributions, it would not be appropriate to treat the fire tests involving a plastic work cart as being equally likely as the fire tests involving tarps. An approach was needed to weight the importance of each individual test and then use those weights to develop the modeling guidance.
The process of weighting test data consisted of the following four steps:
1. Assign each event from the FEDB into a fuel package category. A set of 28 categories derived from the test report was used. The result of this was a weighting of the relative occurrence of transient fires involving different types of fuels.
2. Assign each of the 110 fuel packages from testing to a fuel package category using the same list of categories from Step 1. This step linked the history of events from the FEDB to the data collected during testing.
3. Because there are more test fuel packages than categories, many categories had multiple test fuel packages assigned to them. This required an effort to define the relative importance of each fuel package within a category—that is, the likelihood that a transient fire in a specified fuel package category will involve a particular test fuel package.
4. Generate a per-individual test weight that combines the weights from Step 1 and Step 3 with the number of replicate tests for a specific test fuel package. For example, consider a FEDB fuel category with a Step 1 weight of 0.1 (that is, that fuel category represented 10% of the FEDB events) that had two test fuel packages assigned to that category in Step 2 that had equal relative importance (that is, both had Step 3 weights of 0.5). If both of those fuel packages had two replicate tests, each individual test would have a weight of 0.1 (Step 1) x 0.5 (Step 3) x 0.5 (1 of 2 tests) = 0.025 (FEDB weight x test item weight x test replicate weight). This final weight was used in developing the distributions (see Section 4) and detailed modeling method (see Section 5) for meeting the goals stated in Section 3.1.

Approach for Developing Distributions and Detailed Fire Modeling Input Parameters
3-3
3.2.1 Categorizing the FEDB Events (Step 1)
Typical event descriptions in the FEDB contain sparse details on the exact transient combustible involved in the fire event. Typically, a general description such as cardboard boxes is provided without significant detail on the specific amount or configuration of the fuel package. In examining the list of all FEDB transient events, provided in Appendix A of the test report [9], many of these general descriptions are seen multiple times. During test planning, these general descriptions were used to define 37 categories of fuels involved in transient fire events (that is, paper, cardboard, and so forth). This was done using all transient events (non-challenging [NC], potentially challenging [PC], and challenging [CH]) and served to aid in the selection of items to test. Some event descriptions did not fit a clear single category. These events were collected into an Other category. Events that lacked any meaningful descriptions were considered Unknown events.
The distributions developed in this report used a categorization of the subset of all transient events where the fire was CH or PC (139 events). This subset was chosen because the fire ignition frequency for transient events does not include events that were NC [2]. To maintain consistency with the testing effort, the list of categories based on all transient events was kept for use in developing the method presented in this report. Additionally, the 37 categories were reduced to 28 to reflect the items tested (for example, no paint coatings were tested, but there were NC events involving hot work and paint).
The categorization, Step 1, was performed by the project working group plus three additional persons (see Section 1.2). The three additional persons were all cognizant engineers operating out of different offices who have experience in performing FPRA walkdowns and fire modeling. Each was provided a spreadsheet containing the list of transient events from Appendix A of the test report [9]. A predefined list of the 28 categories was provided as a drop-down selection for each event. A note section in the spreadsheet provided some discussion on the definition of some of the categories. All were asked to pick the category that they believed best represented the event description. Responses were reviewed for consistency. In cases where events with similar descriptions were assigned different categories, a query was made to ensure that the intended selections were made. The final counts of the number of events in each category were then averaged over the four lists. Unknown events were then distributed proportionately among the other event categories. For example, if 10% of events were unknown, the number of events in all other categories was increased by 11% (1/0.9).
The result of this process, the average categorization after apportioning Unknown events, is shown in Table 3-1. Note that one of the 28 categories (oxy hose—that is, oxy-acetylene hose) did not have any PC or CH events. Table 3-1 lists the categories, the fraction of transient events each category represents, and the relative standard deviation in the voting for that category. Note that due to rounding Table 3-1 may not sum to 100%. For categories representing 3% or more of events (that is, at least four events), the relative standard deviation is 18% of the category weight and ranges from 8% to 35%. These events make up 80% of the operating experience. Below 3%, the relative standard deviation is 55%; however, because these categories consist of three events, single event differences in assigning events results in large deviations. The largest category of events, at 25.5%, is events involving power cords.

Approach for Developing Distributions and Detailed Fire Modeling Input Parameters
3-4
Table 3-1 Categorization of all PC or CH transient fire events in the FEDB
Category Percent Category Percent
Power cord 25.5% ± 4.7% Cardboard 1.7% ± 0.3%
Other 13.2% ± 4.6% Duct 1.5% ± 0.0%
Plastic 7.4% ± 1.7% Vacuum 1.5% ± 0.5%
Trash 7.4% ± 0.4% Blanket 1.3% ± 0.8%
Flammable liquid 6.8% ± 1.7% Tool bag 1.1% ± 0.8%
Wood 5.5% ± 0.6% Absorbent pad 0.8% ± 0.0%
Debris 5.1% ± 0.8% Laptop+cart 0.8% ± 0.0%
Filter 4.9% ± 0.4% Hose 0.6% ± 0.3%
Oily rag 3.0% ± 0.8% Chair 0.4% ± 0.4%
Rag 3.0% ± 0.5% PPE bag 0.4% ± 0.4%
Clothing 2.1% ± 1.0% Mop 0.2% ± 0.3%
Tarp 2.1% ± 1.2% Rope 0.2% ± 0.3%
Paper 1.9% ± 0.4% Oxy hose 0.0% ± 0.0%
Tape 1.7% ± 0.3%
The list of transient events provided in Appendix A of the test report [9] also indicates whether the events were due to hot work. This designation was used to split the number of events in each category into hot work (63) and non-hot work (76) events. The average percentage and deviations were recomputed. Tables 3-2 and 3-3, respectively, show the category percentages for hot work and non-hot work. Note that with the split there are a number of fuel categories that only appear in either hot work or non-hot work events. For example, there was only one Laptop+cart event, and it was a non-hot work event. For hot work events, there is no clearly dominant category. Other, Filter, and Plastic are the top three categories, and they range from 9% to 15% of all PC or CH events. For non-hot work fires, the Power Cord category is the dominant category at 40% of all PC or CH events.

Approach for Developing Distributions and Detailed Fire Modeling Input Parameters
3-5
Table 3-2 Categorization of all PC or CH hot work transient fire events in the FEDB
Category Percent Category Percent
Other 15.3% ± 1.1% Tool bag 2.6% ± 1.9%
Filter 9.4% ± 0.9% Paper 2.5% ± 0.8%
Plastic 8.5% ± 4.3% Oily rag 1.7% ± 1.7%
Power cord 7.2% ± 2.2% Cardboard 1.7% ± 0.0%
Rag 6.8% ± 1.2% Hose 1.3% ± 0.7%
Debris 6.8% ± 1.2% Chair 0.8% ± 0.8%
Trash 6.4% ± 0.8% PPE bag 0.8% ± 0.8%
Flammable liquid 5.5% ± 2.2% Absorbent pad 0.0% ± 0.0%
Wood 5.5% ± 0.7% Laptop+cart 0.0% ± 0.0%
Tape 3.8% ± 0.8% Mop 0.0% ± 0.0%
Tarp 3.8% ± 2.5% Oxy hose 0.0% ± 0.0%
Duct 3.4% ± 0.0% Rope 0.0% ± 0.0%
Clothing 3.0% ± 2.2% Vacuum 0.0% ± 0.0%
Blanket 3.0% ± 1.8%
Table 3-3 Categorization of all PC or CH non-hot work transient fire events in the FEDB
Category Percent Category Percent
Power cord 40.2% ± 6.8% Paper 1.4% ± 0.0%
Other 11.5% ± 9.0% Tarp 0.7% ± 0.7%
Trash 8.2% ± 0.1% Mop 0.3% ± 0.6%
Flammable liquid 7.8% ± 2.1% Rope 0.3% ± 0.6%
Plastic 6.5% ± 1.1% Blanket 0.0% ± 0.0%
Wood 5.5% ± 1.0% Chair 0.0% ± 0.0%
Oily rag 4.1% ± 0.0% Duct 0.0% ± 0.0%
Debris 3.7% ± 0.6% Hose 0.0% ± 0.0%
Vacuum 2.7% ± 0.9% Oxy hose 0.0% ± 0.0%
Cardboard 1.7% ± 0.6% PPE bag 0.0% ± 0.0%
Absorbent pad 1.4% ± 0.0% Rag 0.0% ± 0.0%
Clothing 1.4% ± 0.0% Tape 0.0% ± 0.0%
Filter 1.4% ± 0.0% Tool bag 0.0% ± 0.0%
Laptop+cart 1.4% ± 0.0%
The individual weighting votes corresponding to Tables 3-1 through 3-3 are shown respectively in Tables C-1 through C-3.

Approach for Developing Distributions and Detailed Fire Modeling Input Parameters
3-6
3.2.2 Assigning and Weighting Test Fuel Packages to FEDB Groups (Steps 2 and 3)
Assignment of the fuel packages to the FEDB groups, Step 2, was done by the working group and the same three individuals as in Section 3.2.1. Each was provided a spreadsheet containing a list describing all 110 test fuel packages and the range of peak HRRs seen during testing. A predefined list of the 27 categories (no Unknown) was provided as a drop-down selection for each package. After packages were assigned to categories, each individual then sorted the list by category and assigned weights to the packages within each category, Step 3. The instructions for this activity were to assign the weights based on their experiences and observations from walkdown activities as to the relative abundance of the test items in a fuel category. It was noted that, if they perceived the relative hazards of the packages in a category to be the same, it was acceptable to assign uniform weights.
The working group collated the four resulting lists and used them to develop a proposed list of assignments and weights to reconcile differences in the individual assignments. That list was then sent to the three individuals for concurrence. Concurrence was achieved with the first proposed list.
Table 3-4 shows the result of this activity. It lists each fuel category, the test items in each category, the weights assigned to each test item, the range of peak HRR for each test item, and the number of tests for each test item. The individual assessments are shown in Tables C-4 through C-7.
Table 3-4 Assignment of fuel packages to FEDB categories
Category Test Fuel Package Weight Peak HRR (kW) Number of Tests
Absorbent pad
Four oil pads 0.250 2.3–2.8 3
Four oil pads with oil 0.250 2.7–3.2 2
Single oil pad 0.250 3.2–3.6 3
Single oil pad with oil 0.250 2.3–3.3 3
Blanket Welding blanket draped 0.500 2.1–2.3 3
Welding blanket folded 0.500 0.4–0.7 3
Cardboard
Large box empty 0.083 377–536 4
Large box with paper 0.083 346–446 3
Large box with packing peanuts 0.083 563–579 3
Medium box empty 0.117 68–142 6
Medium box with paper 0.117 55–85 3
Medium box with packing peanuts 0.117 98–134 3
Small box empty 0.100 28–50 4
Small box with paper 0.100 43–50 3
Small box with packing peanuts 0.100 52–71 3
SNL—Nowlen Tests 5, 6 0.100 20–26 2

Approach for Developing Distributions and Detailed Fire Modeling Input Parameters
3-7
Table 3-4 Assignment of fuel packages to FEDB categories (continued)
Category Test Fuel Package Weight Peak HRR (kW) Number of Tests
Chair
Lawson Test 51 0.300 33.6 1
Lawson Test 56 0.300 85.5 1
Metal chair 0.300 7.4–23 5
Plastic chair 0.100 155–203 3
Clothing NBS—Lee fabric 0.500 51.8 1
Single PPE 0.500 17–26 3
Debris Bucket with debris 0.500 7.2–15 3
Debris pile 0.500 13–24 3
Duct Blower duct 1.000 5.1–8.7 3
Filter Heating, ventilation, and air conditioning (HVAC) filter 1.000 13–20 3
Flammable liquid Alcohol bottle 0.500 143–211 3
Oil bottle 0.500 1.7–2.5 3
Hose Water hose 1.000 1.2–24 3
Laptop+cart Laptop+cart 1.000 2214–2683 3
Mop Mop+bucket 1.000 65–113 2
Oily rag
Five rags with heptane 0.333 30–51 6
Rags with oil 0.333 10–11 2
Single rag with heptane 0.333 9.1–12 4
Other
Laptop 0.167 4.2–18 3
SNL—Nowlen Tests 1, 2 0.167 96–109 2
SNL—Nowlen Tests 3, 4 0.167 32–143 2
Tablet 0.167 13–22 3
Tablet+metal case 0.167 9.1 1
Tablet+plastic case 0.167 20–34 2
Oxy hose Oxy-acetylene hose 1.000 1.7–3.2 2

Approach for Developing Distributions and Detailed Fire Modeling Input Parameters
3-8
Table 3-4 Assignment of fuel packages to FEDB categories (continued)
Category Test Fuel Package Weight Peak HRR (kW) Number of Tests
Paper
Small binder closed 0.143 1.8 1
Small binder open 0.143 6.0–11 2
Large binder closed 0.143 0.1–1.2 3
Large binder open 0.143 3.9–6.9 2
Cardstock air 0.143 1.6–7.7 3
Cardstock wall 0.143 0.5–1.4 3
Pad of paper 0.143 1.3–1.8 3
Plastic
7.6 m coil chain 0.094 24–37 3
7.6 m coil tubing 0.094 1.2–1.5 3
Four cones 0.050 5.2–17 3
15.2 m coil chain 0.050 1.1–29 5
15.2 m coil tubing 0.050 1.3–1.7 3
Empty bucket 0.094 11–31 4
First aid kit 0.094 15–31 3
Lift slings 0.094 16–19 3
Plastic stanchion 0.094 47–67 3
Single cone 0.094 6.0–9.5 3
Uncoiled chain 0.094 1.1–1.3 3
Uncoiled tubing 0.094 0.6–0.9 3
Power cord
3.0 m coil 120 V cord 0.167 1.2–1.5 3
7.6 m coil 120 V cord 0.167 1.0–1.6 3
7.6 m coil 250 V cord 0.167 0.8–1.2 3
15.2 m coil 120 V cord 0.167 0.7–1.0 3
Power spider 0.167 1.3–5.7 2
Uncoiled 120 V cord 0.167 1 1

Approach for Developing Distributions and Detailed Fire Modeling Input Parameters
3-9
Table 3-4 Assignment of fuel packages to FEDB categories (continued)
Category Test Fuel Package Weight Peak HRR (kW) Number of Tests
PPE bag
Scissor stand quarter 0.150 13–22 3
Scissor stand full 0.200 109–181 3
Scissor stand half 0.150 29–60 3
Stack PPE 0.150 70–118 2
WPI half bag 0.200 443–463 2
WPI quarter bag 0.150 256–295 2
Rag
Five rags 0.333 7.5–14 4
Bag of rags 0.333 4.0–6.3 3
Single rag 0.333 2.6–4.7 4
Rope
7.6 m coil large rope 0.200 2.4–58 3
7.6 m coil small rope 0.200 2.8–4.5 3
15.2 m coil large rope 0.100 2.9–74 3
15.2 m coil small rope 0.100 9.5–15 3
Uncoiled large rope 0.200 2.7–3.2 3
Uncoiled small rope 0.200 2.9–3.6 3
Tape
Long duct tape air 0.250 1.0–1.5 3
Short duct tape air 0.250 0.5–0.8 2
Duct tape roll 0.250 3.4–20 3
Duct tape wall 0.250 0.3 1
Tarp
Canvas tarp draped 0.070 470–570 2
Canvas tarp folded 0.070 2.5–12 4
Fire-retardant plastic tarp draped 0.250 49–80 2
Fire-retardant plastic tarp folded 0.250 79.8 1
Plastic tarp draped 0.180 7.2–195 4
Plastic tarp folded 0.180 2.9–60 3
Tool bag Tool bag 1.000 51–56 2

Approach for Developing Distributions and Detailed Fire Modeling Input Parameters
3-10
Table 3-4 Assignment of fuel packages to FEDB categories (continued)
Category Test Fuel Package Weight Peak HRR (kW) Number of Tests
Trash
LBL—Volkinburg one airline bag 0.025 136 1
Metal trash quarter 0.150 75–95 3
Metal trash full 0.150 61–81 3
Metal trash full lid 0.350 16–21 2
Metal trash half 0.150 83–87 3
Plastic trash quarter 0.050 265–292 3
Plastic trash full 0.025 181–273 3
Plastic trash half 0.050 279–364 3
SNL—Nowlen Tests 7, 8 0.025 11–24 2
SNL—Nowlen Test 9 0.025 112 1
Vacuum Vacuum closed 0.900 0.8–1.3 2
Vacuum open 0.100 520–545 2
Wood
Pallet flame 0.167 2.1–2.5 2
Pallet panel 0.167 0.2–1.4 3
Plank flame 0.167 1.8–2.0 3
Plank panel 0.167 0.7–1.1 3
Wood block flame 0.167 0.7–1.1 5
Wood block panel 0.167 1.3–1.7 3
3.2.3 Normalized Test Weights (Step 4)
The product of the category weight (Step 1) and the fuel package weight (Step 3) gives the fraction of FEDB events represented by that fuel package. For example, the Clothing category has an event fraction of 2.1% and the single personal protective equipment (PPE) fuel package has a fuel package weight of 0.5; therefore, the single PPE fuel package represents 0.0207 x 0.5 = 1.04% of transient events. The final weighting step, Step 4, is to assign a weight to each individual test. Because there were three tests of the single PPE fuel package, each test has a weight of 1.04% / 3 = 0.347%. Following this process, each individual test was assigned a weight.
The individual test weights were used to develop probabilistic distributions and modeling guidance. To develop a non-generic distribution for a subset of the fuel packages, the test weights must be renormalized so that the sum of all of the individual package weights sum to 1. The final normalized weights for each fuel package and the number of tests for that fuel package are shown in Table 3-5. The list is in descending order of weight starting in the left column and wrapping to the right column. Note that the oxy-acetylene hose package has a weight of zero because there were no PC or CH FEDB events for that fuel package.

Approach for Developing Distributions and Detailed Fire Modeling Input Parameters
3-11
Table 3-5 Final normalized test weights for the generic transient fire distributions
Fuel Package Per Test Weight
Number of Tests Fuel Package
Per Test Weight
Number of Tests
Uncoiled 120 V cord 4.25E-02 1 Wood block flame 1.83E-03 5
Tablet+metal case 2.21E-02 1 Empty bucket 1.74E-03 4
Power spider 2.13E-02 2 Five rags with heptane 1.68E-03 6
HVAC filter 1.64E-02 3 Duct tape roll 1.42E-03 3
3.0 m coil 120 V cord 1.42E-02 3 Long duct tape air 1.42E-03 3
15.2 m coil 120 V cord 1.42E-02 3 Large binder open 1.35E-03 2
7.6 m coil 120 V cord 1.42E-02 3 Small binder open 1.35E-03 2
7.6 m coil 250 V cord 1.42E-02 3 Plastic tarp folded 1.25E-03 3
Metal trash full lid 1.29E-02 2 15.2 m coil tubing 1.23E-03 3
Alcohol bottle 1.13E-02 3 Four cones 1.23E-03 3
Oil bottle 1.13E-02 3 Plastic trash quarter 1.23E-03 3
SNL—Nowlen Tests 1, 2 1.10E-02 2 Plastic trash half 1.23E-03 3
SNL—Nowlen Tests 3, 4 1.10E-02 2 Lawson Test 51 1.13E-03 1
Tablet+plastic case 1.10E-02 2 Lawson Test 56 1.13E-03 1
NBS—Lee fabric 1.04E-02 1 Four oil pads with oil 9.45E-04 2
Bucket with debris 8.51E-03 3 Mop+bucket 9.45E-04 2
Debris pile 8.51E-03 3 Plastic tarp draped 9.36E-04 4
Laptop 7.35E-03 3 SNL—Nowlen Tests 7, 8 9.22E-04 2
Tablet 7.35E-03 3 Cardstock air 9.00E-04 3
Vacuum closed 6.81E-03 2 Cardstock wall 9.00E-04 3
Tool bag 5.67E-03 2 Large binder closed 9.00E-04 3
Fire-retardant plastic tarp folded
5.20E-03 1 Pad of paper 9.00E-04 3
Blower duct 5.04E-03 3 SNL—Nowlen Tests 5, 6 8.51E-04 2
Rags with oil 5.04E-03 2 Vacuum open 7.56E-04 2
Pallet flame 4.57E-03 2 15.2 m coil chain 7.37E-04 5
Duct tape wall 4.25E-03 1 Canvas tarp draped 7.28E-04 2
Metal trash quarter 3.69E-03 3 Medium box with paper 6.62E-04 3
Metal trash full 3.69E-03 3 Medium box with peanuts
6.62E-04 3

Approach for Developing Distributions and Detailed Fire Modeling Input Parameters
3-12
Table 3-5 Final normalized test weights for the generic transient fire distributions (continued)
Fuel Package Per Test Weight
Number of Tests
Fuel Package Per Test Weight
Number of Tests
Metal trash half 3.69E-03 3 Four oil pads 6.30E-04 3
Single PPE 3.47E-03 3 Single oil pad 6.30E-04 3
Bag of rags 3.36E-03 3 Single oil pad with oil 6.30E-04 3
Pallet panel 3.05E-03 3 Plastic trash full 6.14E-04 3
Plank flame 3.05E-03 3 Small box with paper 5.67E-04 3
Plank panel 3.05E-03 3 Small box with peanuts 5.67E-04 3
Wood block panel 3.05E-03 3 Large box with paper 4.73E-04 3
Small binder closed 2.70E-03 1 Large box with peanuts 4.73E-04 3
Fire-retardant plastic tarp draped 2.60E-03 2
Small box empty 4.25E-04 4
Five rags 2.52E-03 4 WPI half bag 3.78E-04 2
Laptop+cart 2.52E-03 3 Canvas tarp folded 3.64E-04 4
Single rag 2.52E-03 4 Large box empty 3.54E-04 4
Single rag with heptane 2.52E-03 4 Medium box empty 3.31E-04 6
7.6 m coil chain 2.32E-03 3 Stack PPE 2.84E-04 2
7.6 m coil tubing 2.32E-03 3 WPI quarter bag 2.84E-04 2
First aid kit 2.32E-03 3 Scissor stand full 2.52E-04 3
Lift slings 2.32E-03 3 Metal chair 2.27E-04 5
Plastic stanchion 2.32E-03 3 Scissor stand empty 1.89E-04 3
Single cone 2.32E-03 3 Scissor stand half 1.89E-04 3
Uncoiled chain 2.32E-03 3 7.6 m coil large rope 1.26E-04 3
Uncoiled tubing 2.32E-03 3 7.6 m coil small rope 1.26E-04 3
Welding blanket draped 2.21E-03 3 Plastic chair 1.26E-04 3
Welding blanket folded 2.21E-03 3 Uncoiled large rope 1.26E-04 3
Short duct tape air 2.13E-03 2 Uncoiled small rope 1.26E-04 3
Water hose 1.89E-03 3 15.2 m coil large rope 6.30E-05 3
LBL—Volkinburg one airline bag 1.84E-03 1
15.2 m coil small rope 6.30E-05 3
SNL—Nowlen Test 9 1.84E-03 1 Oxy-acetylene hose 0.00E+00 2

Approach for Developing Distributions and Detailed Fire Modeling Input Parameters
3-13
3.3 Probabilistic Distributions and Detailed Fire Modeling Input Data
This section describes how the test data were processed using the individual test weights to create probabilistic distributions of the peak HRR, TER, and ZOIs. These distributions formed the basis for developing input data for detailed fire modeling.
3.3.1 Classes of Distributions
Two classes of distributions were created. The first class is a set of generic transient fire distributions intended as an improved realism replacement for the distribution in Appendix G of NUREG/CR-6850 [1]. This class is referred to as the generic transient fire distribution. The second class is a set of generic transient fire distributions intended for use in transient combustible control locations (TCCLs). This class is referred to as the TCCL transient fire distribution. It recognizes that the use of a lower peak HRR has been allowed in some National Fire Protection Association (NFPA) 805 license amendments in plant areas where there are strict controls on transient combustibles. The definition and selection of fuel packages for this distribution is provided in Section 3.3.1.1.
3.3.1.1 Definition of TCCL
Because there is not a standard industrywide definition or terminology for defining plant locations where there are enhanced controls over transient combustibles, the working group developed a specific terminology and definition. This definition was developed using information from FAQ 12-0064 Hot Work/Transient Fire Frequency Influencing Factors [10], FAQ 14-0007 Transient Fire Frequency Likelihood [11], NUREG/CR-6850 [1], NUREG/CR-6850 Supplement 1 [14], NFPA 805 Request for Additional Information responses for using transient fire peak HRRs under 317 kW [24–27], Generic Letter 86-10 [28], and IMC 0609 Appendix F [29]. The terminology and definition are as follows:
A transient combustible control location (TCCL) is a designated location in a nuclear power plant (NPP) that meets the conditions provided in this section of the report. The location may be a physical analysis unit (PAU) or fire compartment, a single room within a PAU, or a well-defined floor space within a PAU. It is acknowledged that the term used for a TCCL may vary by NPP. Multiple locations can be defined as TCCLs. Regardless of the term that is used, the important factor is that the location meets the following conditions:
1. Control of transient combustible materials in these locations must be procedurally controlled with visual indication clearly marked (for example, floor is painted, the location is roped off or identified with multiple signs, or other method of clearly marking the area) so that someone unfamiliar with the administrative procedures would conclude that transient combustible storage is strictly controlled in that location.
2. No trend of violations of transient combustible administrative controls, for the subject TCCL (that if modeled, would have a measurable impact on the FPRA), have been observed for a reasonable prior period (that is, five years). A measurable impact implies a violation that lies above the hazard represented by the 98th percentile of the TCCL distribution (see Table 4-4).
3. Long-term storage of transient combustible material is strictly prohibited with no exceptions.
4. Temporary storage of transient combustible material is strictly controlled with appropriate compensatory measures for exceptions, as necessary. Any combustible material that is greater than negligible (see Note 1) and required to be in a TCCL must meet one of the following:
4.1 Have a transient combustible permit evaluated by the fire protection program to show that there is no impact to credited equipment and cables (see Notes 2 and 3).

Approach for Developing Distributions and Detailed Fire Modeling Input Parameters
3-14
4.2 Be constantly attended. Exceptions are allowed for shift changes and short breaks such as a lunch break.
4.3 Be removed from the TCCL or contained (for example, closed metal containers, covered by fire blanket) when not constantly attended.
Note 1: Negligible combustibles would include small isolated items (that is, less than 0.5 kg [1 lb] of solid material).
Note 2: With no exceptions, flammable and combustible liquids cannot be left unattended in a TCCL.
Note 3: Temporary structures consisting at least in part of combustible materials (for example, wooden scaffolding) are not built, stored, or moved into the TCCL, without analysis and any necessary compensatory measures, as determined by a transient combustible permit evaluation.
3.3.1.2 Selection of Test Data for the TCCL Transient Fire Distribution
Using the definition of a TCCL provided in Section 3.3.1.1, the working group culled the list of test items to remove those items believed to be highly unlikely to be present in a TCCL. This was done by two rounds of selection. In the first round, members of the working group individually marked a list of test items to indicate which items would not be in a TCCL. The results were collected, tallied, and presented to the working group. The working group then undertook a second round of individually marking the list. After the second round, there were only a handful of items where a supermajority did not concur that the item should be either excluded or included in the list of fuels potentially present in a TCCL. These items were discussed by the working group to reach a consensus on their status. The resulting list of items removed is shown in Table 3-6. The results of the two rounds of selection are shown in Appendix C. When using the shortened list of test items to develop distributions, the relative test item weights were maintained and renormalized. For example, if one test item from a fuel category with three equally weighted test items (that is, all weighted one-third) was removed, the other two items had their weights scaled up to one-half. Table 3-7 contains the normalized test weights that result from removing the items in Table 3-6.

Approach for Developing Distributions and Detailed Fire Modeling Input Parameters
3-15
Table 3-6 Test items removed from TCCL transient fire distribution
Fuel Package HRR
Range (kW)
Fuel Package HRR
Range (kW)
Four cones 5.2–17 Pallet flame 2.1–2.5
Four oil pads 2.3–2.8 Pallet panel 0.2–1.4
Four oil pads with oil 2.7–3.2 Plank flame 1.8–2.0
Five rags with heptane 30–51 Plank panel 0.7–1.1
Canvas tarp draped 470–570 Plastic chair 155–203
Debris pile 13–24 Plastic tarp draped 7.2–195
Fire-retardant plastic tarp draped 49–80 Plastic trash full 181–273
Laptop 4.2–18 Plastic trash half 279–364
Laptop+cart 2214–2683 Plastic trash quarter 265–292
Large box empty 377–536 Scissor stand full 109–181
Large box with paper 346–446 Scissor stand half 29–60
Large box with peanuts 563–579 Scissor stand quarter 13–22
Lawson Test 51 33.6 SNL—Nowlen Tests 7, 8 11–24
LBL—Volkinburg one airline bag 136 SNL—Nowlen Test 9 112
Metal trash full 61–81 Stack PPE 70–118
Metal trash full lid 16–21 Vacuum open 520–545
Metal trash half 83–87 Welding blanket draped 2.1–2.3
Metal trash quarter 75–95 WPI half bag 443–463
Oxy-acetylene hose 1.7–3.2 WPI quarter bag 256–295

Approach for Developing Distributions and Detailed Fire Modeling Input Parameters
3-16
Table 3-7 Final normalized test weights for the TCCL transient fire distributions
Fuel Package Per Test Weight
Number of Tests
Fuel Package Per Test Weight
Number of Tests
Uncoiled 120 V cord 4.65E-02 1 Plastic stanchion 2.67E-03 3
Tablet+metal case 2.89E-02 1 Single cone 2.67E-03 3
Power spider 2.32E-02 2 Uncoiled chain 2.67E-03 3
Bucket with debris 1.86E-02 3 Uncoiled tubing 2.67E-03 3
HVAC filter 1.79E-02 3 Short duct tape air 2.32E-03 2
15.2 m coil 120 V cord 1.55E-02 3 Lawson Test 56 2.07E-03 1
3.0 m coil 120 V cord 1.55E-02 3 Water hose 2.07E-03 3
7.6 m coil 120 V cord 1.55E-02 3 Empty bucket 2.00E-03 4
7.6 m coil 250 V cord 1.55E-02 3 Duct tape roll 1.55E-03 3
SNL—Nowlen Tests 1, 2 1.45E-02 2 Long duct tape air 1.55E-03 3
SNL—Nowlen Tests 3, 4 1.45E-02 2 Large binder open 1.48E-03 2
Tablet+plastic case 1.45E-02 2 Small binder open 1.48E-03 2
Alcohol bottle 1.24E-02 3 15.2 m coil tubing 1.41E-03 3
Oil bottle 1.24E-02 3 Single oil pad 1.38E-03 3
Fire-retardant plastic tarp folded
1.14E-02 1
Single oil pad with oil 1.38E-03 3
NBS—Lee fabric 1.14E-02 1 SNL—Nowlen Tests 5, 6 1.24E-03 2
Wood block panel 9.99E-03 3 Mop+bucket 1.03E-03 2
Tablet 9.64E-03 3 Cardstock air 9.84E-04 3
Rags with oil 8.26E-03 2 Cardstock wall 9.84E-04 3
Vacuum closed 8.26E-03 2 Large binder closed 9.84E-04 3
Tool bag 6.20E-03 2 Pad of paper 9.84E-04 3
Wood block flame 5.99E-03 5 Medium box with paper 9.64E-04 3
Blower duct 5.51E-03 3
Medium box with peanuts
9.64E-04 3
Welding blanket folded 4.82E-03 3 15.2 m coil chain 8.48E-04 5
Duct tape wall 4.65E-03 1 Small box with paper 8.26E-04 3
Single rag with heptane 4.13E-03 4 Small box with peanuts 8.26E-04 3
Single PPE 3.79E-03 3 Canvas tarp folded 7.95E-04 4
Bag of rags 3.67E-03 3 Small box empty 6.20E-04 4

Approach for Developing Distributions and Detailed Fire Modeling Input Parameters
3-17
Table 3-7 Final normalized test weights for the TCCL transient fire distributions (continued)
Fuel Package Per Test Weight
Number of Tests
Fuel Package Per Test Weight
Number of Tests
Small binder closed 2.95E-03 1 Medium box empty 4.82E-04 6
Five rags 2.76E-03 4 Metal chair 4.13E-04 5
Single rag 2.76E-03 4 7.6 m coil large rope 1.38E-04 3
Plastic tarp folded 2.73E-03 3 7.6 m coil small rope 1.38E-04 3
7.6 m coil chain 2.67E-03 3 Uncoiled large rope 1.38E-04 3
7.6 m coil tubing 2.67E-03 3 Uncoiled small rope 1.38E-04 3
First aid kit 2.67E-03 3 15.2 m coil large rope 6.89E-05 3
Lift slings 2.67E-03 3 15.2 m coil small rope 6.89E-05 3
3.3.2 Method for Creating Probabilistic Distributions
Probabilistic distributions were created for the peak HRR, the TER, and the ZOIs. This was done by using the runtime interpreted computer language R, which was developed for performing statistical analysis [30], and Microsoft Excel. A table of integer weighting factors, peak HRR, TER, and ZOIs was saved as a comma separated value (CSV) file. The integer weighting factor was the real number weight value from Table 3-5 or Table 3-7 converted to an integer by scaling it. The scaling factor was selected to convert the smallest real number weight to 10—that is, if the smallest weight in a table is y, the weight x was converted to an integer as Int(10 x / y). R was used to expand the table of test data using the integer test weights and the rep function. The rep function takes as input a two-column array of data and outputs a vector of the number in the first column repeated by the number in the second column. An example is shown in Figure 3-1.
1 23 44 1
→
𝑟𝑒𝑝 1,1,3,3,3,3,4
Figure 3-1 Example of R rep function
Expanded vectors of data were created for the peak HRR, the TER, and each of the ZOIs. The R ecdf command was then used to create an empirical cumulative probability distribution function for each vector of expanded test data. This function was then evaluated using each unique data point in the data set (that is, if the expanded HRR vector was 1.01, 1.01, 1.01, 2.02, 3.03, 3.03, the empirical function would be evaluated at 1.01, 2.02, and 3.03). The results were written for each quantity to a two-column CSV file where the first column is the list of unique HRR, TER, or ZOI values and the second column is the empirical function outputs for those values. One CSV file was written for each of the HRR, the TER, and the individual ZOIs. These files were read into Excel where functions evaluated the location of the 50th and 98th percentiles. The Excel solver function was then used to fit a gamma distribution that minimized the least square relative error to the 50th and 98th percentiles for each parameter. A gamma distribution was selected for consistency with other HRR distributions used in FPRA, such as the distributions for electrical cabinets [3].
The R commands used are provided in Appendix B.

Approach for Developing Distributions and Detailed Fire Modeling Input Parameters
3-18
3.3.3 Method for Creating Detailed Fire Modeling Parameters
Detailed fire modeling parameters refers to data needed as inputs to correlations (for example, the Fire Dynamics Tools [31], zone models (for example, Consolidated Model of Fire Growth and Transport (CFAST) [32, 33]) or field models (for example, Fire Dynamics Simulator (FDS) [34, 35]). These modeling parameters include the heat of combustion, the fire Froude number (Q*), the yields of minor products of combustion, the elevation of the fire, and the time-dependent HRR. Not all tests have the full set of data available for them. Therefore, for these parameters, individual CSV files were created for each parameter (or group of parameters in the case of characterizing fire growth and decay).
For the heat of combustion (Hc), soot and CO product yields (ys and yCO), and the source height (ze), individual CSV files were created for each parameter and its integer weights. The data were scaled to a minimum integer weighting factor of 1. R was then used to expand the data set and generate empirical cumulative distribution functions. This was limited to fires with HRRs greater than 10 kW. Below 10 kW, the ignition source often provides a significant contribution to the HRR measured in the test, the relative errors in yields and the heat of combustion are generally larger due to measurement noise and load cell measurement uncertainty, and the small ZOI associated with small fires significantly limits their overall contribution to risk. The empirical distribution functions, along with the expanded data, were exported to CSV files and used to develop recommended values for use in detailed fire modeling.
The R commands used are provided in Appendix B.

4-1
4 PROBABILISTIC DISTRIBUTIONS FOR PEAK HRR, TER, AND ZOI
This section of the report contains the recommended distributions of peak heat release rate (HRR), total energy release (TER), and zones of influence (ZOIs) for generic transient fires and transient combustible control location (TCCL) transient fires. ZOI distributions were developed for the horizontal (heat flux) ZOI, vertical (plume temperature) ZOI, and vertical in a corner ZOI for exposed sensitive electronics (SE), thermoplastic (TP) cable, Kerite-FR cable (KC), thermoset (TS) cable, and bulk cable tray ignition (TI).
The method for determining the ZOI values is detailed in the test report [9]. In brief, this method used the time-dependent HRR data for each test as inputs to the Fire Dynamics Tools [31] for plume temperature (McCaffery plume temperature correlation [31]) and radiative flux (solid flame model [4]). For each test HRR curve, the vertical (plume) or radial (heat flux) distance from the fire was changed in 5 cm increments until the threshold between target damage and no target damage was located. Target damage was assessed using a heat soak method [4]. Because the search process used 5 cm (2 in.) increments, this meant that the minimum ZOI value was 5 cm (that is, if a target was not damaged at a distance of 5 cm (2 in.), the search process was ended, and 5 cm (2 in.) was considered to be the ZOI. For the vertical ZOI, the ZOI distance is measured from the base of the fire (that is, it does not account for any vertical elevation of the base of the fire above the floor of the room). For the horizontal ZOI, the distance is measured from the edge of the fire. For some categories (TS and TI), almost all of the computed horizontal ZOI values were 5 cm (2 in.). As a result, for these categories the gamma distribution does not provide a good visual fit to the data. There should be little impact on risk assessment associated with this. It just means that a transient fire must essentially be in direct contact with the target for that category.
The ZOIs developed in this report are subject to limitations in their applicability. These limitations include the following:
The compartment is initially at a room temperature below the limits for long-term human habitability (<40°C [104°F]).
The target is either below the hot gas layer (HGL), or the HGL temperature does not exceed the room temperature limit stated previously.
The target is not within the ceiling jet of a fire.
The target or fire is not subject to ventilation effects that might increase the ZOI. This is mostly relevant for horizontal targets where cross ventilation might result in flame lean. Note, typically cross ventilation below a threshold of 1 m/s at the fire is considered insignificant [36].
The fire being modeled is either a generic transient fire or a TCCL transient fire using the full modeling methodology in this report. For applications where a specific, known fuel package is being evaluated, the time-dependent HRR and related modeling inputs should be developed based on the specifics of that fuel package. Data from specific similar fuel packages in the test report [9] may be applicable in this case.

Probabilistic Distributions for Peak HRR, TER, and ZOI
4-2
4.1 Generic Transient Fire Distribution
Table 4-1 shows the generic transient fire distributions developed using the final normalized weighting values in Table 3-5. Plots of the probability density functions, cumulative distribution functions, and probability-probability (P-P) for each item in Table 4-1 are shown in Appendix D. A P-P plot shows the theoretical (in this case the gamma distribution fit) cumulative probability of a distribution value plotted against the empirical (in this case the weighted test data) cumulative probability. Perfectly matched distributions would be a diagonal line. In general, the P-P plots show that the distribution is well matched or conservative for values between the 50th and 98th percentile (the plot is to the right of the diagonal line) and nonconservative for values below the 50th percentile. However, the 50th percentile fire is below 10 kW, which is not a fire with significant risk.
Table 4-1 Generic transient fire distributions of peak HRR, TER, and ZOI
Distribution Distribution Percentiles Gamma Distribution Parameters
75th 98th
HRR (kW) 41.6 278 0.271 141
TER (MJ) 11.8 123 0.184 77.1
Vertical ZOI
(m)
SE 1.90 5.49 0.954 1.44
TP 0.56 1.78 0.768 0.525
KC 0.53 1.64 0.814 0.470
TS 0.45 1.47 0.748 0.439
TI 0.41 1.33 0.760 0.395
Vertical in a corner ZOI
(m)
SE 3.27 9.47 0.943 2.50
TP 0.99 2.96 0.872 0.816
KC 0.91 2.74 0.873 0.754
TS 0.79 2.43 0.829 0.687
TI 0.71 2.18 0.827 0.618
Horizontal ZOI
(m)
SE 0.21 1.05 0.374 0.450
TP 0.09 0.36 0.501 0.132
KC 0.07 0.22 0.723 0.0666
TS 0.05 0.11 1.42 0.0233
TI 0.03 0.05 7.63 0.00345

Probabilistic Distributions for Peak HRR, TER, and ZOI
4-3
The following are some observations on the results:
The 98th percentile peak HRR value is 278 kW. This is a small reduction below the 317 kW value in NUREG/CR-6850 [1]; however, the 75th percentile peak HRR value of 42 kW is significantly below the 142 kW value in NUREG/CR-6850.
The 98th percentile vertical ZOI for TP is 1.78 m (5.8 ft). A typical tray configuration is horizontal cable trays running 0.3–0.6 m (1–2 ft) above 1.8–2.1 m (6–7 ft) tall electrical cabinets. This means that trays at 2.1–2.7 m (7–9 ft) above the floor are not in the transient ZOI provided that the base of the fire is less than 0.3 m (1 ft) above the floor. As covered in Section 5.2, a conservative ignition source location is 0.15 m (6 in.) above the floor. This means cable targets that are not in a corner and that an average person can walk under can be screened. Exposed SE will not screen at that height.
Although 98th percentile fires in a corner will not screen for cable targets at head height, at the 75th percentile all head height cable targets will screen. Exposed SE will not screen at that height for fires in a corner.
For the horizontal ZOI component, a transient fire will need to be less than 0.36 m (1.2 ft) from a target to damage cables and essentially in direct contact with a cable, <5 cm (2 in.) to cause sustained ignition.
To damage SE in a cabinet according to FAQ 13-0004 [12] (that is, the SE are not exposed and can be treated as TS), the fire will need to be within 11 cm (4 in.) of the cabinet.
Even in a relatively small compartment (3 m [10 ft] on a side), a 278 kW transient fire releasing 123 MJ of total energy would not result in a damaging HGL without the involvement of secondary combustibles.
4.1.1 Sensitivity of Generic Transient Distributions to Event Type
The values in Table 3-5 were adjusted to use the category weights for hot work only (see Table 3-2) and non-hot work only (see Table 3-3) events. For categories where no events were seen, such as laptop+cart for hot-work only events, the category weight was adjusted to represent one-half the lowest category weight present. This was done to recognize that even though a specific category may not have been seen yet in operational experience, that specific category cannot be ruled out as a possible event. The exception was the blankets category representing welding blanket events, which was not adjusted for non-hot work.
Table 4-2 compares the 75th and 98th percentile values for the hot work only and non-hot work only distributions against the generic distribution. The hot work only distribution is slightly less severe than the generic distribution. The 98th percentile TER is one-third less, and the vertical ZOI values are 7–10% lower. The non-hot work only distribution is somewhat more severe than the generic distribution. The 98th percentile TER is one-third more, and the vertical ZOI values are 11–17% higher. However, from a risk perspective these differences are minor. Head height trays not in a corner still screen at the 98th percentile, head height trays in a corner still screen at the 75th percentile, a damaging HGL will still not occur without secondary combustibles, and the horizontal cable damage and ignition distances change by only a small distance. Based on these observations, the event specific distributions are not significantly different from the generic distribution from a risk perspective. Therefore, only the generic distribution was fully developed in the remainder of this report, and it is the recommended distribution to use for modeling both hot work and non-hot work events.
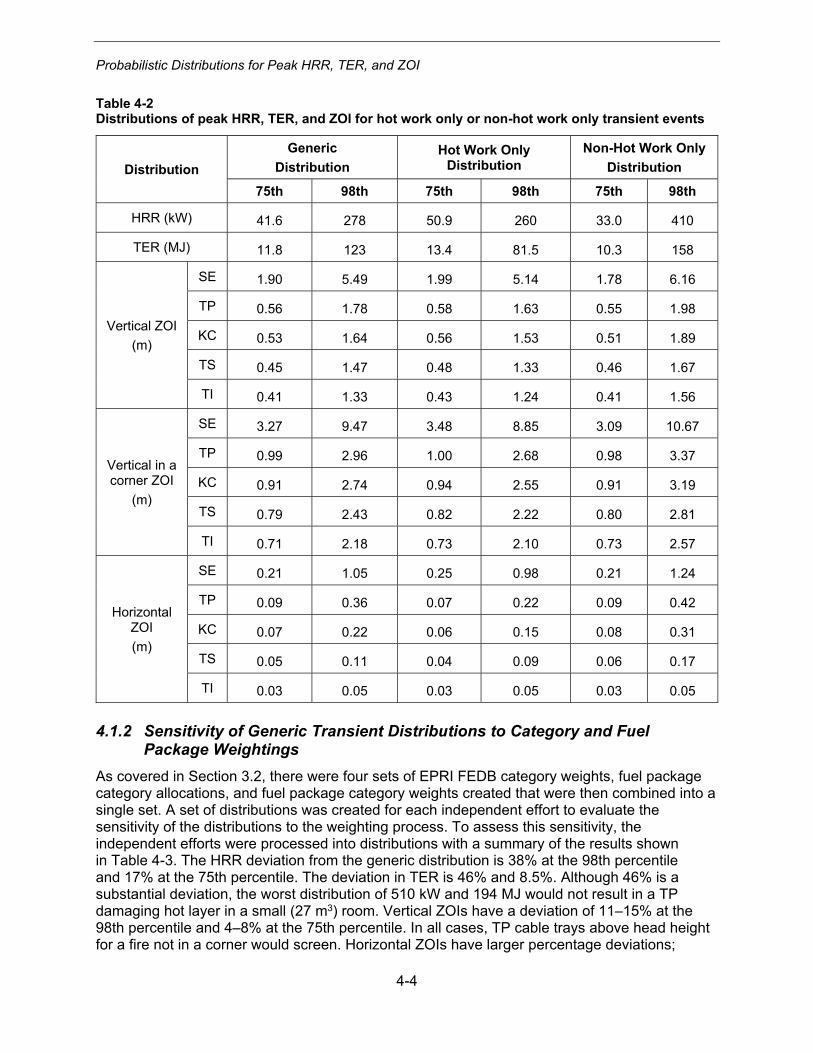
Probabilistic Distributions for Peak HRR, TER, and ZOI
4-4
Table 4-2 Distributions of peak HRR, TER, and ZOI for hot work only or non-hot work only transient events
Distribution
Generic
Distribution Hot Work Only
Distribution Non-Hot Work Only
Distribution
75th 98th 75th 98th 75th 98th
HRR (kW) 41.6 278 50.9 260 33.0 410
TER (MJ) 11.8 123 13.4 81.5 10.3 158
Vertical ZOI
(m)
SE 1.90 5.49 1.99 5.14 1.78 6.16
TP 0.56 1.78 0.58 1.63 0.55 1.98
KC 0.53 1.64 0.56 1.53 0.51 1.89
TS 0.45 1.47 0.48 1.33 0.46 1.67
TI 0.41 1.33 0.43 1.24 0.41 1.56
Vertical in a corner ZOI
(m)
SE 3.27 9.47 3.48 8.85 3.09 10.67
TP 0.99 2.96 1.00 2.68 0.98 3.37
KC 0.91 2.74 0.94 2.55 0.91 3.19
TS 0.79 2.43 0.82 2.22 0.80 2.81
TI 0.71 2.18 0.73 2.10 0.73 2.57
Horizontal ZOI
(m)
SE 0.21 1.05 0.25 0.98 0.21 1.24
TP 0.09 0.36 0.07 0.22 0.09 0.42
KC 0.07 0.22 0.06 0.15 0.08 0.31
TS 0.05 0.11 0.04 0.09 0.06 0.17
TI 0.03 0.05 0.03 0.05 0.03 0.05
4.1.2 Sensitivity of Generic Transient Distributions to Category and Fuel Package Weightings
As covered in Section 3.2, there were four sets of EPRI FEDB category weights, fuel package category allocations, and fuel package category weights created that were then combined into a single set. A set of distributions was created for each independent effort to evaluate the sensitivity of the distributions to the weighting process. To assess this sensitivity, the independent efforts were processed into distributions with a summary of the results shown in Table 4-3. The HRR deviation from the generic distribution is 38% at the 98th percentile and 17% at the 75th percentile. The deviation in TER is 46% and 8.5%. Although 46% is a substantial deviation, the worst distribution of 510 kW and 194 MJ would not result in a TP damaging hot layer in a small (27 m3) room. Vertical ZOIs have a deviation of 11–15% at the 98th percentile and 4–8% at the 75th percentile. In all cases, TP cable trays above head height for a fire not in a corner would screen. Horizontal ZOIs have larger percentage deviations;

Probabilistic Distributions for Peak HRR, TER, and ZOI
4-5
however, the range for TP is 22–42 cm versus 36 cm for the generic distribution. In actual distance, the deviation is small. For the third independent assessor, the reason for the large HRR is primarily that the open vacuum (shop vacuum containing a debris mixture with the top removed) fuel package was considered to be equally likely to the closed vacuum fuel package. Because vacuum events are 2.2% of transient fire events, this made the open top tests with peak HRRs of over 500 kW 1.1% of the distribution. Combined with a 0.22% weight assigned to the large cardboard boxes (over 500 kW) and 0.75% for the laptop+cart fuel package (over 2 MW), this resulted in 500 kW fires sitting at the 98th percentile. This was the only individual to put such a high weight on the open vacuum. For the fourth independent assessor, equal weight was applied to all of the fuels in the tarp category compared with the consensus where the non-fire-retardant canvas tarps were considered less likely than the plastic or plastic fire-retardant tarps. Additionally, the fourth assessment had tarps at 3% of transient fire events versus 2% in the consensus distribution. Combined with slightly higher weights for the large cardboard tests, this pushed the 98th percentile peak HRR up to over 400 kW.
Table 4-3 Distributions of peak HRR, TER, and ZOI for the individual assessments detailed in Appendix C.2
Distribution
Generic
Distribution 1 2 3 4
75th 98th 75th 98th 75th 98th 75th 98th 75th 98th
HRR (kW) 41.6 278 51.7 268 32.8 269 58.2 510 47.1 438
TER (MJ) 11.8 123 14.2 81.6 12.1 152 15.7 194 12.9 164
Vertical ZOI
(m)
SE 1.90 5.49 2.13 5.12 1.81 5.45 2.21 7.32 1.98 6.21
TP 0.56 1.78 0.64 1.64 0.54 1.76 0.63 2.13 0.58 1.98
KC 0.53 1.64 0.59 1.55 0.51 1.63 0.59 2.02 0.55 1.90
TS 0.45 1.47 0.51 1.34 0.44 1.47 0.51 1.76 0.47 1.66
TI 0.41 1.33 0.45 1.25 0.40 1.31 0.47 1.66 0.43 1.53
Vertical in a corner ZOI
(m)
SE 3.27 9.47 3.65 8.80 3.21 9.40 3.78 12.51 3.44 10.71
TP 0.99 2.96 1.08 2.70 0.95 2.98 1.09 3.52 1.02 3.37
KC 0.91 2.74 0.99 2.58 0.87 2.78 1.03 3.33 1.03 3.33
TS 0.79 2.43 0.85 2.26 0.76 2.43 0.89 2.90 0.82 2.77
TI 0.71 2.18 0.77 2.13 0.69 2.16 0.80 2.71 0.75 2.53
Horizontal ZOI
(m)
SE 0.21 1.05 0.26 0.97 0.19 1.02 0.26 1.53 0.21 1.25
TP 0.09 0.36 0.07 0.20 0.09 0.38 0.10 0.48 0.10 0.43
KC 0.07 0.22 0.06 0.15 0.07 0.24 0.08 0.34 0.08 0.31
TS 0.05 0.11 0.04 0.09 0.05 0.11 0.06 0.19 0.06 0.17
TI 0.03 0.05 0.03 0.05 0.03 0.05 0.03 0.05 0.03 0.05

Probabilistic Distributions for Peak HRR, TER, and ZOI
4-6
4.2 TCCL Transient Fire Distribution
Table 4-4 shows the TCCL transient fire distributions developed using the final normalized weighting values in Table 3-7. Plots of the probability density functions, cumulative distribution functions, and P-P for each item in Table 4-4 are shown in Appendix D. A P-P plot shows the theoretical (in this case the gamma distribution fit) cumulative probability of a distribution value plotted against the empirical (in this case the weighted test data) cumulative probability. Perfectly matched distributions would be a diagonal line. In general, the P-P plots show that the distribution is well matched or conservative for values between the 50th and 98th percentiles (the plot is to the right of the diagonal line) and nonconservative for values below the 50th percentile. However, the 50th percentile fire is under 5 kW, which is not a fire with significant risk.
Compared with the generic transient fire distribution, the TCCL distribution has approximately a 50% reduction in peak HRR and TER and 35–50% reductions in ZOI at the 98th percentile. At the 75th percentile, the respective values are 40% and 24–32%.
Table 4-4 TCCL transient fire distributions of peak HRR, TER, and ZOI
Distribution Distribution Percentiles Gamma Distribution Parameters
75th 98th
HRR (kW) 24.6 143 0.314 67.3
TER (MJ) 7.0 59.9 0.214 34.5
Vertical ZOI
(m)
SE 1.44 3.26 1.76 0.604
TP 0.40 1.00 1.33 0.218
KC 0.38 0.94 1.36 0.203
TS 0.32 0.80 1.36 0.173
TI 0.29 0.76 1.25 0.171
Vertical in a corner ZOI
(m)
SE 2.54 5.64 1.86 1.01
TP 0.71 1.69 1.53 0.34
KC 0.66 1.59 1.47 0.328
TS 0.57 1.40 1.43 0.292
TI 0.52 1.26 1.44 0.263
Horizontal ZOI
(m)
SE 0.15 0.68 0.43 0.273
TP 0.06 0.17 0.977 0.0442
KC 0.05 0.10 1.93 0.0175
TS 0.03 0.05 7.63 0.00343
TI 0.03 0.05 7.63 0.00342

Probabilistic Distributions for Peak HRR, TER, and ZOI
4-7
It is noted that some plants have used a value of 69 kW as the 98th percentile peak HRR in areas with increased combustible controls. This is half of the 143 kW value shown in Table 4-4. It might seem that this means the new TCCL distribution is more severe than prior approaches. However, it should be recognized that typical prior approaches for modeling transient fires generally used long plateaus at the peak HRR. A 69 kW fire with a long plateau would have a vertical TP ZOI of approximately 1.5 m vs. 1.0 m in Table 4-4. Therefore, using the new ZOIs in Table 4-4 should provide improvement even for plants that previously used 69 kW for transient fires.

5-1
5 DETAILED FIRE MODELING GUIDANCE
This section develops guidance for the detailed modeling of transient fires—that is, time-dependent modeling of a fire for evaluating time to damage, hot gas layer (HGL), or severity factor (SF) using Equation 2-4. In plots showing data from individual tests, the plots contain expanded test data. That is, each point on the plot represents a single test; however, that test is plotted as multiple collocated points based on the integer weighting factor covered in Section 3.3.3. Any curve fit displayed in a plot is also based upon the expanded data set.
5.1 Transient Fire Bins for Non-Suppression Probability
Table E-9 of NUREG/CR-6850 contains a 15-bin discretization of the transient fire heat release rate (HRR) distribution for computing the SF of unscreened targets (targets that do not screen at the 98th percentile during Task 8 of NUREG/CR-6850). With the new distributions developed in Sections 4.1 and 4.2, these bins are no longer well suited for computing the SF, and new bins are needed. NUREG/CR-6850 used bins spaced by equal HRR widths. Using the same equal HRR spacing approach with the new distributions would put approximately 60% of the distribution in the first bin. This would not give much resolution to computing SF by binning. Instead of uniformly equal HRR widths for the bins, the recommended bins use a set of bin spacings that increase in round numbers from 1% to 25%. This binning balances relatively uniform bin spacings at the upper end with a reasonable resolution of SF at the lower end. Tables 5-1 and 5-2 show the HRR and total energy release (TER) bins for the generic transient fire distribution and the transient combustible control location (TCCL) transient fire distribution.
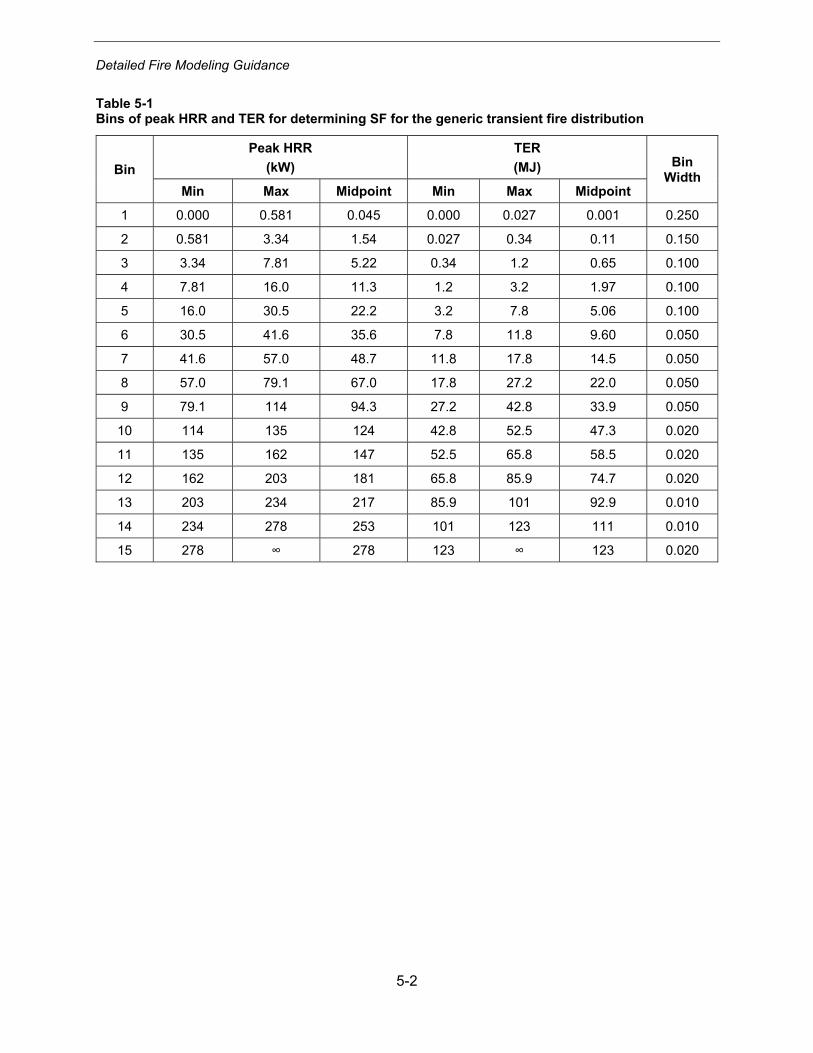
Detailed Fire Modeling Guidance
5-2
Table 5-1 Bins of peak HRR and TER for determining SF for the generic transient fire distribution
Bin
Peak HRR
(kW)
TER
(MJ) Bin Width
Min Max Midpoint Min Max Midpoint
1 0.000 0.581 0.045 0.000 0.027 0.001 0.250
2 0.581 3.34 1.54 0.027 0.34 0.11 0.150
3 3.34 7.81 5.22 0.34 1.2 0.65 0.100
4 7.81 16.0 11.3 1.2 3.2 1.97 0.100
5 16.0 30.5 22.2 3.2 7.8 5.06 0.100
6 30.5 41.6 35.6 7.8 11.8 9.60 0.050
7 41.6 57.0 48.7 11.8 17.8 14.5 0.050
8 57.0 79.1 67.0 17.8 27.2 22.0 0.050
9 79.1 114 94.3 27.2 42.8 33.9 0.050
10 114 135 124 42.8 52.5 47.3 0.020
11 135 162 147 52.5 65.8 58.5 0.020
12 162 203 181 65.8 85.9 74.7 0.020
13 203 234 217 85.9 101 92.9 0.010
14 234 278 253 101 123 111 0.010
15 278 ∞ 278 123 ∞ 123 0.020

Detailed Fire Modeling Guidance
5-3
Table 5-2 Bins of peak HRR and TER for determining SF for the TCCL transient fire distribution
Bin
Peak HRR
(kW)
TER
(MJ) Bin Width
Min Max Midpoint Min Max Midpoint
1 0.0 0.586 0.063 0.00 0.03 0.001 0.250
2 0.586 2.64 1.34 0.03 0.32 0.12 0.150
3 2.64 5.54 3.89 0.32 0.91 0.55 0.100
4 5.54 10.4 7.68 0.91 2.2 1.44 0.100
5 10.4 18.6 14.0 2.2 4.8 3.28 0.100
6 18.6 24.6 21.4 4.8 7.0 5.78 0.050
7 24.6 32.8 28.4 7.0 10.1 8.36 0.050
8 32.8 44.3 38.0 10.1 14.7 12.1 0.050
9 44.3 62.0 52.0 14.7 22.3 18.0 0.050
10 62.0 72.3 66.8 22.3 26.9 24.5 0.020
11 72.3 86.2 78.7 26.9 33.2 29.8 0.020
12 86.2 107 95.3 33.2 42.6 37.4 0.020
13 107 122 114 42.6 49.6 45.9 0.010
14 122 143 131 49.6 59.9 54.2 0.010
15 143 ∞ 143 59.9 ∞ 59.9 0.020
5.2 Input Parameters for Detailed Modeling
The parameters in this section were developed using the same expanded, weighted data set that was used for the generic transient fire distributions in Section 4.1. A separate set of parameters was not developed for the TCCL distribution. Fires below 10 kW were removed from the data set for all parameters except for the fire elevation. This was done due to measurement limitations for the heat of combustion, yields, Q*, shape parameters (limitations are covered in the test report [9]), and the fact that many of the very small fires were dominated by the ignition source.
5.2.1 Heat of Combustion, Q*, Source Height
Figures 5-1 through 5-3 shows plots of the heat of combustion (Hc), fire Froude number (Q*), and source height (ze) as a function of the fire size for all fires larger than 10 kW. Q* is a non-dimensional scaling of the intensity of the fire source [37]. No clear trend can be seen in the Hc, Q*, and ze data as a function of the HRR. This is expected because these parameters are largely driven by the type of material involved in the fire and the fire size is driven by the amount of material.

Detailed Fire Modeling Guidance
5-4
Figure 5-1 Hc versus fire size for all fires larger than 10 kW
Figure 5-2 Q* versus fire size for all fires larger than 10 kW
Figure 5-3 Source height versus fire size for all fires larger than 10 kW
0
10
20
30
40
50
60
0 500 1000 1500 2000 2500 3000
Hea
t of Combu
stion (M
J/kg)
Peak HRR (kW)
0
10
20
30
40
50
60
0 50 100 150 200 250 300
Heat of Com
bustion (M
J/kg)
Peak HRR (kW)
0
0.5
1
1.5
2
2.5
3
3.5
4
4.5
5
0 500 1000 1500 2000 2500 3000
Q*
Peak HRR (kW)
0
0.5
1
1.5
2
2.5
3
3.5
4
4.5
5
0 100 200 300 400 500 600
Q*
Peak HRR (kW)
0
0.2
0.4
0.6
0.8
1
1.2
1.4
0 500 1000 1500 2000 2500 3000
Source Height (m
)
Peak HRR (kW)
0
0.2
0.4
0.6
0.8
1
1.2
1.4
0 50 100 150 200 250 300
Source Height (m
)
Peak HRR (kW)

Detailed Fire Modeling Guidance
5-5
Figure 5-4 shows the cumulative distribution function and probability density function for Hc. The density function does not indicate a clear functional form (for example, normal, log-normal). Given a time-dependent HRR, Hc does not have a significant influence on zone of influence (ZOI) or HGL. In a risk assessment, it is the time-dependent HRR that drives the hazard, and the Hc simply changes the fuel mass flow needed to achieve that HRR. This lack of sensitivity in ZOI or HGL to the specific value of Hc makes the median value a reasonable selection. The 50th percentile value is 25 MJ/kg. The 16th to 84th percentile range is 15–35 MJ/kg.
Figure 5-4 Hc cumulative distribution function (top) and probability density function (bottom)
Figure 5-5 shows the cumulative distribution function and probability density function for Q*. Q* has an impact on the ZOIs and the HGL development. Higher Q* fires have larger vertical ZOIs, and lower Q* fires have larger horizontal ZOIs. For the HGL development, a higher Q* fire
0
0.1
0.2
0.3
0.4
0.5
0.6
0.7
0.8
0.9
1
0 10 20 30 40 50
Cumulative Distribution Function
Heat of Combustion (MJ/kg)
1.E‐03
1.E‐02
1.E‐01
0 10 20 30 40 50
Probab
ility Den
sity Function
Heat of Combustion (MJ/kg)

Detailed Fire Modeling Guidance
5-6
will see less entrainment than a lower Q* fire. Most of the Q* values are distributed in a relatively uniform manner at 1 or below. There are a few outlier points at higher Q* values. To avoid having a generic method bias ZOIs in either the horizontal or vertical direction, using the median Q* value is appropriate. The median Q* value is 0.54. The 16th to 84th percentile range is 0.23–1.2. These values are consistent with NUREG-1934 [37], which indicates that most fires in a nuclear power plant are expected to have Q* values on the order of 1.
Figure 5-5 Q* cumulative distribution function (top) and probability density function (bottom)
0
0.1
0.2
0.3
0.4
0.5
0.6
0.7
0.8
0.9
1
0 1 2 3 4 5
Cumulative Distribution Function
Q*
1.E‐03
1.E‐02
1.E‐01
1.E+00
1.E+01
1.E+02
0 1 2 3 4 5
Probab
ility Den
sity Function
Q*

Detailed Fire Modeling Guidance
5-7
Figure 5-6 shows the cumulative distribution function and probability density function for the source height, ze. The vast majority of fires are expected to occur on the floor, and this is especially true for the fires near the 98th percentile where many test packages involved thermoplastic (TP) materials melting into a pool. The 79th percentile source height is 0 cm (0 in.). In recognition that some items involve non-zero source heights, a source height of 15 cm (6 in.) is recommended. This is approximately the 85th percentile source height. Note that if the specific fire scenario involves an elevated fire (fire on a raised portion of floor, on top of another object, and so forth), this source height should be added to the base fire elevation. The 79th to 98th percentile range is 0.00–0.71 m.
Figure 5-6 Source height cumulative distribution function (top) and probability density function (bottom)
0
0.1
0.2
0.3
0.4
0.5
0.6
0.7
0.8
0.9
1
0 0.5 1 1.5
Cumulative Distribution Function
Elevation (m)
1.E‐02
1.E‐01
1.E+00
1.E+01
1.E+02
0 0.5 1 1.5
Probab
ility Den
sity Function
Elevation (m)

Detailed Fire Modeling Guidance
5-8
5.2.2 Soot Yield and CO Yield
Soot and CO yield (often given as ys and yCO) are required parameters for fire models such as the Consolidated Model of Fire Growth and Smoke Transport (CFAST) [32, 33] and Fire Dynamics Simulator (FDS) [34, 35]. In terms of a fire probabilistic risk assessment, these yields determine the tenability in areas requiring human action. For detailed fire modeling, the goal is to accurately represent the hazard posed by the distribution of fires based on operational experience. The yield itself does not fully determine that hazard. Two fires with the same HRR and the same soot yield would create different hazards if the Hc were different. A high Hc fuel would require a lower burning rate to achieve a given HRR than a low Hc fuel, and as a result would make less soot. Because the Hc was fixed in Section 5.2.1 to be 25 MJ/kg, the yields measured in the test must be adjusted based on the ratio of the test Hc to 25 MJ/kg. This puts all of the measured yields at the same relative production rate (kg/s) based on fire size. Figures 5-7 and 5-8 show the adjusted yields as a function of the fire size for all fires over 10 kW. There is no clear relationship between yields and the peak HRR. Yields are a function of the material being burned and its configuration. Because there were fires of different materials and configurations throughout the range of fire sizes seen in testing, the yields are not expected to correlate with the peak HRR.
Figure 5-7 Adjusted soot yield versus fire size
Figure 5-8 Adjusted CO yield versus fire size
0
0.05
0.1
0.15
0.2
0.25
0.3
0 500 1000 1500 2000 2500 3000
Soot Yield (kg
/kg)
Peak HRR (kW)
0
0.05
0.1
0.15
0.2
0.25
0.3
0 50 100 150 200 250 300
Soot Yield (kg
/kg)
Peak HRR (kW)
0
0.05
0.1
0.15
0.2
0.25
0.3
0.35
0.4
0.45
0 500 1000 1500 2000 2500 3000
CO Yield (kg
/kg)
Peak HRR (kW)
0
0.05
0.1
0.15
0.2
0.25
0.3
0.35
0.4
0.45
0 50 100 150 200 250 300
CO Yield (kg
/kg)
Peak HRR (kW)

Detailed Fire Modeling Guidance
5-9
Figures 5-9 and 5-10 show the cumulative distribution function and probability density function for the adjusted soot yield and adjusted CO yield. Because higher yields are conservative, the 75th percentile value is suggested as an input for detailed fire modeling. The 75th percentile adjusted yields for soot and CO are 5.2% and 4.3%, respectively. These yields are consistent with recommended yields used for life-safety in performance-based fire protection design. For example, the New Zealand fire code [38] suggests soot and CO yields of 7% and 4% for pre-flashover fires. All of the fire tests represented in the distribution were well-ventilated fire tests, although specific fuel packages might experience periods of ventilation limited burning due to configuration (for example, a fire in a container). These recommended yields should be generally applicable provided that the global equivalence ratio remains in the well-ventilated regime (equivalence ratio <1). The 41st (the equivalent of one deviation from 75th) to 98th percentile range for the soot and CO yields are 1.2–13.6% and 2.4–6.8%, respectively.

Detailed Fire Modeling Guidance
5-10
Figure 5-9 Soot yield cumulative distribution function (top) and probability density function (bottom)
0
0.1
0.2
0.3
0.4
0.5
0.6
0.7
0.8
0.9
1
0 0.03 0.06 0.09 0.12 0.15 0.18 0.21
Cumulative Distribution Function
Soot Yield (kg/kg)
1.E‐01
1.E+00
1.E+01
1.E+02
1.E+03
0 0.03 0.06 0.09 0.12 0.15 0.18 0.21
Probab
ility Den
sity Function
Soot Yield (kg/kg)
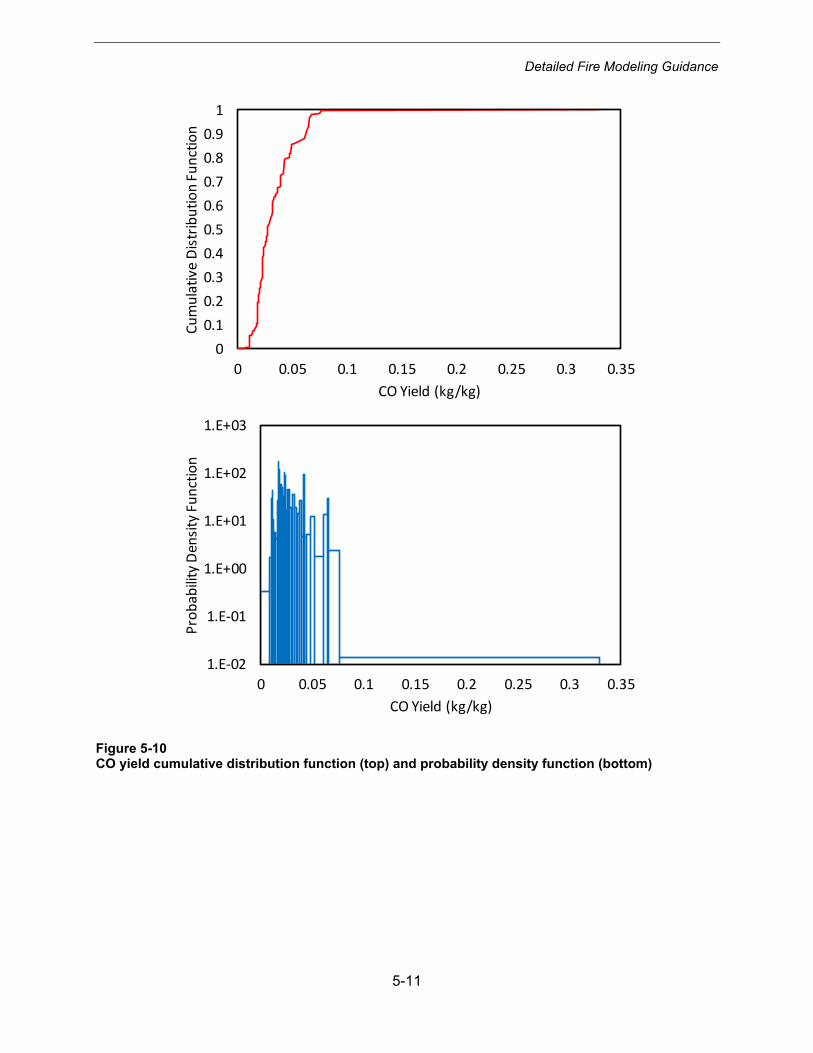
Detailed Fire Modeling Guidance
5-11
Figure 5-10 CO yield cumulative distribution function (top) and probability density function (bottom)
0
0.1
0.2
0.3
0.4
0.5
0.6
0.7
0.8
0.9
1
0 0.05 0.1 0.15 0.2 0.25 0.3 0.35
Cumulative Distribution Function
CO Yield (kg/kg)
1.E‐02
1.E‐01
1.E+00
1.E+01
1.E+02
1.E+03
0 0.05 0.1 0.15 0.2 0.25 0.3 0.35
Probab
ility Den
sity Function
CO Yield (kg/kg)

Detailed Fire Modeling Guidance
5-12
5.2.3 Fire Growth, Plateau, and Decay
All tests over 10 kW were fit with a three-part curve to define the fire profile. A description of the fitting process is presented in the test report [9]. Results are tabulated in the test report and in Appendix A for the additional tests from Section 2.2.2 through Section 2.2.4. The fit consists of a power law growth period from zero kW to the peak HRR in kW with growth time, tg in seconds, and growth exponent, n1; a plateau time, tp in seconds; and decay period with decay time, td in seconds, and decay exponent n2. The resulting equation for the HRR is:
𝒒 𝒕
⎩⎪⎨
⎪⎧ 𝒒𝒑𝒆𝒂𝒌
𝒕
𝒕𝒈
𝒏𝟏
𝒕 𝒕𝒈
𝒒𝒑𝒆𝒂𝒌 𝒕𝒈 𝒕 𝒕𝒈 𝒕𝒑
𝒒𝒑𝒆𝒂𝒌 𝟏𝒕 𝒕𝒈 𝒕𝒑
𝒕𝒅
𝒏𝟐𝒕𝒈 𝒕𝒑 𝒕 𝒕𝒅 𝒕𝒈 𝒕𝒑
(5-1)
This is the same basic form of equation used for electrical cabinets following the guidance in NUREG/CR-6850. Only for electrical cabinets, the times and exponents are fixed with the same values used for all cabinets and all fire sizes. This approach makes defining the HRR simpler because only one HRR curve needs to be developed. However, this approach also means that the modeled fires do not reflect the distribution of energy content and ZOI that was seen in the underlying test data. Accomplishing this requires more complexity; therefore, constant values for all parameters were not possible.
A typical fit of experimental data is shown in Figure 5-11. The ZOIs and any HGL formed by the transient fire are largely driven by the peak HRR, the time spent near the peak, and the total area under the HRR curve (the TER). The time prior to the peak is characterized by lower HRRs, and these contribute little to the ZOI or to the HGL. After the fire has decayed away from the peak, the lower fire size means targets near the ZOI no longer see damaging temperatures. Additionally, as the fire size decreases, eventually heat losses to the walls and ceiling from the HGL will be larger than the heat input from the fire, which will stop any further increase in HGL temperature. The goal was to define the curve shape so that it reproduces the correct TER and ZOIs over the HRR distribution—that is, the curve fit focus was on matching the shape of the top of the peak.

Detailed Fire Modeling Guidance
5-13
Figure 5-11 Typical fit of growth, plateau, and decay parameters to a test
The approach taken was to determine correlations that exist between the different fire growth parameters and ultimately define parameters as a function of a single parameter in manner that yields the correct percentile TER given the percentile peak HRR. It can be seen in Figure 5-12 that there is a clear trend between TER and peak HRR, which justifies this approach of coupling the peak HRR and the TER to the probabilistic distributions. Additionally, the figure overlays the gamma fits of HRR and TER from Table 4-1. For the smallest fires, which pose little contribution to overall risk, the approach of jointly selecting HRR and TER based on percentile likely underpredicts the hazard. However, once in the range of fires that are 25 to 30 kW, the gamma fit trends through the center of the TER data. At the largest fires, the gamma fit trends to the upper end of the TER data.
Figure 5-12 TER versus peak HRR for Test Data and Gamma Fit from Table 4-1
0
10
20
30
40
50
60
70
80
90
0 500 1000 1500
HRR (kW
)Time (s)
Test Data
Fit
The shape of the top of the peak drives the ZOI and HGL
The downslope haslittle effect on ZOI and HGL
The rise to peak has a minor influence on ZOI and HGL
tptg td
0.1
1
10
100
1000
10000
10 100 1000 10000
Total Energy Release (M
J)
Peak Heat Release Rate (kW)
Test Data
Gamma Fit
Detailed Fire Modeling Guidance
5-14
5.2.3.1 Growth and Decay Exponents
Figure 5-13 plots the growth exponent (n1) versus the peak HRR, TER, growth time (tg), the plateau time (tp), the decay time (tp), and the decay exponent (n2). For each plot, the best fit functional form (log, exponential, linear, or power) is shown along with the R2 value. Because the R2 values are all very low, this indicates that there is not a strong correlation for n1 as a function of any of the fire curve shape parameters. Similar results are seen for the decay exponent in Figure 5-14. The rates of growth and decay are tied to the type of fuel and its arrangement. Fire spreads over a surface at a rate determined by how quickly the advancing flame front can heat virgin material to its ignition. A material that chars or undergoes multiple solid phase reactions will decay at a different rate than a material that is initially a flammable liquid or a material that becomes a flammable liquid (for example, a TP). Because the exponents are not strongly tied to other fire parameters, they were set to median values. Figures 5-15 and 5-16, respectively, show the cumulative distribution function and probability density functions for the growth and decay exponents. The median growth exponent (n1) is 2.7 with 16th and 84th percentiles of 1.1 and 6.8, respectively. The median decay exponent (n2) is 0.32 with 16th and 84th percentiles of 0.14 and 0.45, respectively.

Detailed Fire Modeling Guidance
5-15
Figure 5-13 Plots of the growth exponent (n1) versus TER, peak HRR, growth time, plateau time, decay time, and decay exponent
y = 0.0102x + 5.7085R² = 0.0078
0.1
1
10
100
0.1 1 10 100 1000
Growth Exponen
t
Total Energy Release (MJ)
y = 0.6406x0.4229
R² = 0.1989
0.1
1
10
100
10 100 1000 10000
Growth Exponen
t
Peak HRR (kW)
y = 1.0349x0.2021
R² = 0.0833
0.1
1
10
100
1 10 100 1000 10000
Growth Exponen
t
Growth Time (s)
y = 7.3803x‐0.271
R² = 0.1917
0.1
1
10
100
1 10 100 1000 10000
Growth Exponen
t
Plateau Time (s)
y = 2.892e4E‐05x
R² = 0.002
0.1
1
10
100
10 100 1000 10000
Growth Exponen
t
Decay Time (s)
y = 0.8869x‐0.997
R² = 0.2979
0.1
1
10
100
0.01 0.1 1
Growth Exponen
t
Decay Exponent

Detailed Fire Modeling Guidance
5-16
Figure 5-14 Plots of the decay exponent (n2) versus TER, peak HRR, growth time, plateau time, and decay time
y = 0.2116x0.1318
R² = 0.1162
0
0.1
0.2
0.3
0.4
0.5
0.6
0.7
0.8
0.9
1
0.1 1 10 100 1000
Decay Exponen
t
Total Energy Release (MJ)
y = 0.2991e‐4E‐04x
R² = 0.041
0
0.1
0.2
0.3
0.4
0.5
0.6
0.7
0.8
0.9
1
10 100 1000 10000
Decay Exponen
t
Peak HRR (kW)
y = 0.284e3E‐05x
R² = 0.001
0
0.1
0.2
0.3
0.4
0.5
0.6
0.7
0.8
0.9
1
1 10 100 1000 10000
Decay Exponen
t
Growth Time (s)
y = 0.1857x0.1358
R² = 0.1603
0
0.1
0.2
0.3
0.4
0.5
0.6
0.7
0.8
0.9
1
1 10 100 1000 10000
Decay Exponen
t
Plateau Time (s)
y = 0.0089ln(x) + 0.2643R² = 0.0024
0
0.1
0.2
0.3
0.4
0.5
0.6
0.7
0.8
0.9
1
1 10 100 1000 10000
Decay Exponen
t
Decay Time (s)

Detailed Fire Modeling Guidance
5-17
Figure 5-15 Growth exponent cumulative distribution function (top) and probability density function
0
0.1
0.2
0.3
0.4
0.5
0.6
0.7
0.8
0.9
1
0 10 20 30 40 50 60
Cumulative Distribution Function
Growth Exponent
0.001
0.01
0.1
1
10
0.1 1 10 100
Probab
ility Den
sity Function
Growth Exponent

Detailed Fire Modeling Guidance
5-18
Figure 5-16 Decay exponent cumulative distribution function (top) and probability density function
0
1
2
3
4
5
6
7
8
9
0 0.2 0.4 0.6 0.8 1
Probab
ility Den
sity Function
Decay Exponent
0
0.1
0.2
0.3
0.4
0.5
0.6
0.7
0.8
0.9
1
0 0.2 0.4 0.6 0.8 1
Cumulative Distribution Function
Decay Exponent

Detailed Fire Modeling Guidance
5-19
5.2.3.2 Growth, Plateau, and Decay Times
Similar to the growth and decay exponents, plots were made of the growth time (tg), plateau time (tp), and decay time (td) as functions of other shape variables. Unlike the exponents, clear trends were seen when the energy release during the growth and decay phases was plotted against the TER from the fire. These plots are shown in Figure 5-17, where it is seen that relatively high R2 values exist for both parameters. Because the generic values of the growth and decay exponents are fixed values, a relationship between energy release during growth and energy release during decay to the total energy uniquely determines the growth and decay times. After growth and decay times are known, the plateau time is determined by the remaining energy left in the TER.
Figure 5-17 Plots of the energy release during growth versus TER (top) and energy release during decay versus TER (bottom)
y = 0.1857x1.0094
R² = 0.6804
0.01
0.1
1
10
100
1000
0.1 1 10 100 1000
Energy Release During Growth (M
J)
Total Energy Release (MJ)
y = 0.9552x0.9401
R² = 0.8285
0.1
1
10
100
1000
10000
0.1 1 10 100 1000
Energy Release During Decay (M
J)
Total Energy Release (MJ)

Detailed Fire Modeling Guidance
5-20
The resulting equations for the growth, decay, and plateau times are shown in Equations 5-2 through 5-4.
𝒒𝒑𝒆𝒂𝒌
𝟏𝟎𝟎𝟎
𝒕𝒈
𝒏𝟏 𝟏𝟎. 𝟏𝟖𝟔𝑻𝑬𝑹𝟏.𝟎𝟏
𝒕𝒈𝟑𝟕𝟎𝟎
𝒒𝒑𝒆𝒂𝒌𝟎. 𝟏𝟖𝟔𝑻𝑬𝑹𝟏.𝟎𝟏 𝟔𝟗𝟎
𝒒𝒑𝒆𝒂𝒌𝑻𝑬𝑹𝟏.𝟎𝟏
(5-2
𝒒𝒑𝒆𝒂𝒌
𝟏𝟎𝟎𝟎
𝒕𝒅𝒏𝟐
𝒏𝟐 𝟏𝟎. 𝟗𝟓𝟓𝑻𝑬𝑹𝟎.𝟗𝟒𝟎
𝒕𝒅𝟏𝟑𝟐𝟎
𝟎.𝟑𝟐𝒒𝒑𝒆𝒂𝒌𝟎. 𝟗𝟓𝟓𝑻𝑬𝑹𝟎.𝟗𝟒𝟎 𝟑𝟗𝟒𝟎
𝒒𝒑𝒆𝒂𝒌𝑻𝑬𝑹𝟎.𝟗𝟒
(5-3)
𝒕𝒑𝟏𝟎𝟎𝟎𝑻𝑬𝑹
𝒒𝒑𝒆𝒂𝒌
𝒕𝒈
𝒏𝟏 𝟏
𝒕𝒅𝒏𝟐
𝒏𝟐 𝟏 (5-4)
For small fires, this fit can yield a negative plateau time. In that case the plateau time should be set to 1 second, and the growth and decay times scaled proportionately to yield the correct energy, as shown in Equations 5-5 and 5-6. This can be determined by setting the total growth and decay energy proportional to the original value as a fraction of the remaining TER after a 1 second plateau time.
𝒒𝒑𝒆𝒂𝒌
𝟏𝟎𝟎𝟎
𝒕𝒈
𝒏𝟏 𝟏𝑻𝑬𝑹
𝒒𝒑𝒆𝒂𝒌
𝟏𝟎𝟎𝟎
𝟎.𝟏𝟖𝟔𝑻𝑬𝑹𝟏.𝟎𝟏
𝟎.𝟏𝟖𝟔𝑻𝑬𝑹𝟏.𝟎𝟏 𝟎.𝟗𝟓𝟓𝑻𝑬𝑹𝟎.𝟗𝟒𝟎
𝒕𝒈𝟑𝟕𝟎𝟎
𝒒𝒑𝒆𝒂𝒌𝑻𝑬𝑹
𝒒𝒑𝒆𝒂𝒌
𝟏𝟎𝟎𝟎
𝟎.𝟏𝟖𝟔𝑻𝑬𝑹𝟏.𝟎𝟏
𝟎.𝟏𝟖𝟔𝑻𝑬𝑹𝟏.𝟎𝟏 𝟎.𝟗𝟓𝟓𝑻𝑬𝑹𝟎.𝟗𝟒𝟎
(5-5)
𝒒𝒑𝒆𝒂𝒌
𝟏𝟎𝟎𝟎
𝒕𝒅𝒏𝟐
𝒏𝟐 𝟏𝑻𝑬𝑹
𝒒𝒑𝒆𝒂𝒌
𝟏𝟎𝟎𝟎
𝟎.𝟗𝟓𝟓𝑻𝑬𝑹𝟎.𝟗𝟒𝟎
𝟎.𝟏𝟖𝟔𝑻𝑬𝑹𝟏.𝟎𝟏 𝟎.𝟗𝟓𝟓𝑻𝑬𝑹𝟎.𝟗𝟒𝟎
𝒕𝒅𝟏𝟑𝟐𝟎
𝟎.𝟑𝟐𝒒𝒑𝒆𝒂𝒌𝑻𝑬𝑹
𝒒𝒑𝒆𝒂𝒌
𝟏𝟎𝟎𝟎
𝟎.𝟗𝟓𝟓𝑻𝑬𝑹𝟎.𝟗𝟒𝟎
𝟎.𝟏𝟖𝟔𝑻𝑬𝑹𝟏.𝟎𝟏 𝟎.𝟗𝟓𝟓𝑻𝑬𝑹𝟎.𝟗𝟒𝟎
(5-6)
5.2.4 Summary of Input Parameters
Table 5-3 summarizes the input parameters for detailed fire modeling. The same parameters apply to generic transient fires and TCCL transient fires. Table 5-3 gives the recommended value and, where applicable, the range of the value over the equivalent of one standard deviation (for example, the range capturing 68% of the values).

Detailed Fire Modeling Guidance
5-21
Table 5-3 Summary of input parameters for detailed modeling
Parameter Recommended Value Uncertainty
Range1 Comment
Peak HRR (kW)
Distribution in Table 4-1 or 4-4 N/A Determined by the percentile fire being modeled.
TER (MJ) Distribution in Table 4-1 or 4-4 N/A Determined by the percentile fire being modeled.
HC
(MJ/kg) 25 15–35
When using a generic HRR curve, varying HC does not impact ZOI or HGL. Note that the species yield range already incorporates the variance in the HC of test items. If HC is changed, yields need to be rescaled to preserve the effective hazard.
Q* 0.54 0.23–1.2
ze (m) 0.15 0.00–0.71 Effective elevation of the base of the fire above the local floor height.
Soot yield (kg/kg)
0.052 0.012–0.136 Note that the yield values are tied to the selected HC.
CO yield (kg/kg)
0.043 0.024–0.068 Note that the yield values are tied to the selected HC.
Growth exponent
n1 2.7 1.1–6.8
Changing exponents must be propagated through Equations 5-2 through 5-6.
Decay exponent
n2 0.32 0.14–0.45
Changing exponents must be propagated through Equations 5-2 through 5-6.
Growth time tg (s)
Equation 5-2 or 5-5
300–4090*
First, use Equation 5-2. Switch to Equation 5-5 if plateau time is set to 1 second. *Uncertainty range applies to the 690 constant in Equation 5-2.
Plateau time tp (s)
Equation 5-4 or 1 second
N/A
First, determine the growth and decay time. If plateau is less than 1 second, set to 1 second and redo growth time and decay time.
Decay time td (s)
Equation 5-3 or 5-6
2200–9560*
First, use Equation 5-3. Switch to Equation 5-6 if plateau time is set to 1 second. *Uncertainty range applies to 3940 constant in Equation 5-3.
1 Range is the equivalent of one standard deviation (16th and 84th percentiles) except for soot and CO, which are 41st to 98th, and z, which is 79th to 98th.

Detailed Fire Modeling Guidance
5-22
5.3 Time to Damage and ZOI Comparison
This section covers the time to damage for targets exposed to a transient fire based on the modeling parameters from Table 5-3. The section also covers how well those parameters reproduce the distribution of ZOIs.
5.3.1 Generic Transient Fire Distribution
With the Q* from Section 5.2.1 and the fire growth parameters from Section 5.2.3.2, one can select a percentile, use the gamma distributions in Section 4.1 to obtain the peak HRR and TER, and then apply Equations 5-2 through 5-6 to determine the time-dependent HRR curve. For example, the 90th percentile fire has a peak HRR of 114 kW and a TER of 42.8 MJ. If those values are entered into Equations 5-2 through 5-4, the solution for the growth time (tg), the plateau time (tp), and the decay time (td) are respectively 269 seconds, 16.5 seconds, and 1182 seconds. Table 5-4 shows the fire growth parameters (times and the growth (n1) and decay (n2) exponents) and key Fire Dynamics Tools (FDTS) [31] parameters (maximum diameter (Max D), flame height (Lf), and z0, which is the virtual origin input used in the plume temperature correlation) for a selection of percentiles. Total transient fire durations range from 3 minutes for the 25th percentile fire of 0.6 kW up to 28 minutes for the 98th percentile fire of 278 kW. Note that current recommendations [4] for modeling plume temperature for a fire in a corner remain the same – multiply the heat release rate by 4 and the diameter by 2.
Table 5-4 HRR parameters and key FDTS parameters for a selection of percentiles for the generic transient fire distribution
% Peak HRR (kW)
TER
(MJ)
tg
(s) n1
tp
(s) n2
td
(s) Q*
Max D
(m)
Lf
(m)
z0
(m)
98 278 123 322 2.7 39.5 0.32 1311 0.54 0.74 1.48 0.03
95 180 74.7 298 2.7 28.1 0.32 1258 0.54 0.62 1.24 0.03
90 114 42.8 269 2.7 16.5 0.32 1182 0.54 0.52 1.03 0.02
85 79.1 27.2 245 2.7 8.2 0.32 1110 0.54 0.45 0.89 0.02
80 57.0 17.8 222 2.7 1.4 0.32 1038 0.54 0.39 0.78 0.02
75 41.6 11.8 197 2.7 1.0 0.32 947 0.54 0.35 0.69 0.02
50 7.8 1.17 90.2 2.7 1.0 0.32 511 0.54 0.18 0.35 0.01
25 0.58 0.027 21.7 2.7 1.0 0.32 160 0.54 0.06 0.13 0.00
The time-dependent HRR curve can be used as an input to the FDTS to obtain the plume temperature [31] and heat flux [4] at a target location. The heat soak method [4] can then be applied to compute the time to damage at that target location.
The parameters in Table 5-4 were used to compute the time to damage for targets located at the ZOI boundary. Table 5-5 shows the results for the vertical TP ZOI from the base of the fire. Because a predefined fire curve shape is being imposed onto test data that are not perfectly represented by that shape (see Figure 5-11), it is expected that the ZOI resulting from the curve fit process will not be identical to the ZOI given by the gamma distribution—that is, if the HRR curve using Table 5-4 were used to find the ZOI boundary, it is expected that the result would be a slightly different value from the value listed Table 4-1. The Fit HRR ZOI column in Table 5-5 shows the result of recomputing the ZOI based on the curve fit for the HRR. For the vertical TP ZOI, it is seen that the fire shape parameters generally result in ZOI values that are slightly

Detailed Fire Modeling Guidance
5-23
larger, by 10–22 cm (4–9 in.). The exception is the 98th percentile where the fit ZOI is 1 cm less. This, however, is not a significant nonconservatism. Note that the damage time for the 98th percentile in Table 5-5 uses the Fit HRR ZOI height. Because overall, the fire exposure from the shape parameters is slightly more severe than the fire exposure based on the actual test data, the time to damage values should be biased conservatively. As previously noted, these ZOIs are measured from the base of the fire; therefore, they do not include the additional 15 cm elevation from Section 5.2.1.
Table 5-5 Time to damage for targets located on the vertical TP ZOI boundary using the parameters from Table 5-4 along with the ZOI based on Table 4-1
% ZOI
(m)
Time to Damage
(s)
Fit HRR ZOI
(m)
ZOI
(m)
98 1.78 671 1.77 -0.01
95 1.33 312 1.47 0.14
90 0.99 264 1.21 0.22
85 0.80 232 1.02 0.22
80 0.66 208 0.88 0.22
75 0.56 185 0.76 0.20
50 0.25 110 0.36 0.11
25 0.09 72 0.10 0.01
The damage times range from 11 minutes at the 98th percentile to 1.2 minutes at the 25th percentile. The 25th percentile has a short time to damage due to the small ZOI of 9 cm (3.5 in.) and the rapid growth time of 20 seconds. The growth time quickly puts the target in the flame which, according to the tables in Appendix H of NUREG/CR-6850, is associated with a 1 minute time to damage.
To assess reasonableness of the time to damage values in Table 5-5, a comparison is made against the experimental data. The time to damage was computed for each experiment using the HRR for that experiment along with the vertical TP ZOI determined for that test (see the test report [9] for details on determining the ZOI values for the tests). This was used to create a list of peak HRRs and times to damage, which was expanded using R and the normalized test weights covered in Section 3.2.3. The results are plotted as individual points in Figure 5-18. There is a significant amount of scatter in the data. The red dot-dot-dash line shows the values from Table 5-5. The solid black line is the median time to damage for the experiments, which was determined by selecting a peak HRR value and finding the median time to damage for all tests within 20% of that value. This was done for peak HRR values starting at 8.9 kW by 50% up to 512 kW (13.3, 20, 30, 45, and so forth). Therefore, the value at 20 kW represents the average time to damage using all tests with a peak HRR between 16.7 and 24 kW. The black dashed lines represent the 14th and 86th percentile (68% of the data or one standard deviation for a normal distribution) times to damage. The Table 5-5 values generally lie below the median curve but above the 14th percentile curve. This indicates that the time to damage predictions are biased conservative but are not bounding times, which meets the goal of improved realism.

Detailed Fire Modeling Guidance
5-24
Figure 5-18 Time to damage at the vertical TP ZOI for the experiments along with the times from Table 5-5
Predictions of all times to damage for all three sets of ZOIs (vertical, vertical in a corner, and horizontal) are shown in Tables 5-6 through 5-8, respectively. If the time value is underlined, it indicates that the fit HRR curve did not result in damage at the distribution ZOI. In this case the distribution ZOI was decreased until the fit HRR curve resulted in a time to damage. In the case that no time to damage exists even for a 1 cm ZOI, the damage time was set to 1 minute. In this case the target is essentially exposed to direct flame contact at the onset of the fire where the time to damage is 1 minute. Note that each column uses the ZOI for that specific target. For example, the 75th and 98th rows in the tables would use the ZOI values from Table 4-1 for each column in the tables.
Table 5-6 Time to damage for the vertical ZOI using the parameters from Table 5-4 along with the ZOIs based on Table 4-1
%
Vertical ZOI Time to Damage
(s)
SE TP KC TS TI
98 283 671 481 370 294
95 239 312 310 308 240
90 199 264 264 259 197
85 173 232 233 227 176
80 159 208 209 203 159
75 146 185 187 180 144
50 98 110 112 108 94
25 70 72 73 71 68
10
100
1000
10000
10 100 1000
Vertical TP ZOI Tim
e to Dam
age (s)
Peak HRR (kW)
Test DataTable 5.5Median14th/86th Percentile

Detailed Fire Modeling Guidance
5-25
Table 5-7 Time to damage for the vertical in a corner ZOI using the parameters from Table 5-4 along with the ZOIs based on Table 4-1
%
Vertical in a Corner ZOI Time to Damage
(s)
SE TP KC TS TI
98 285 691 540 364 300
95 240 320 318 316 245
90 200 273 271 267 199
85 173 242 240 236 178
80 159 218 216 212 162
75 145 195 193 189 147
50 98 117 116 113 96
25 70 74 77 73 69
Table 5-8 Time to damage for the horizontal ZOI using the parameters from Table 5-4 along with the ZOIs based on Table 4-1
%
Horizontal ZOI Time to Damage1
(s)
SE TP KC TS TI
98 272 745 468 351 60
95 227 713 520 921 60
90 188 751 597 927 60
85 167 798 745 924 60
80 152 783 716 930 60
75 137 741 691 60 60
50 89 60 60 60 60
25 68 60 60 60 60

Detailed Fire Modeling Guidance
5-26
The following observations are made on the results in the tables:
The method of defining the fire curve results in a time-to-plume temperature damage that generally decreases with fire size. A decrease in the lower bound of the time to damage as a function of fire size can be seen in Figure 5-18. The reason for this decrease is the fire duration. The 25th percentile fire releases 0.03 MJ of energy and lasts 3 minutes. The 98th percentile fire releases 123 MJ of energy and lasts 28 minutes. If a fire lasts only 3 minutes including the decay period, the time available to damage a target is less than for a fire lasting 28 minutes.
For the vertical ZOI and the vertical ZOI in a corner, sensitive electronics (SE) has the shortest time to damage followed by TI. This is primarily due to the limited data available for predicting either TI or damage to SE. In both cases there is only a threshold temperature or heat flux provided in either FAQ 16-0011 [13] or NUREG/CR-6850 [1].
For the vertical ZOI and vertical ZOI in a corner, the times to damage are generally similar for a given percentile.
For the horizontal ZOI, as the damage exposure threshold increases (for example, 3 kW/m2 for SE to 25 kW/m2 for TI), there are fewer cases where a time to damage is predicted using the distribution ZOI. This is an artifact of using a gamma distribution for the ZOI combined with the method used to determine the ZOI in the test report [9], which limited the ZOI to a minimum value of 5 cm (2 in.). Table 5-9 shows the ZOI based on Table 4-1 and the actual ZOI based on the parameters in Table 5-4 for the largest percentile in Table 5-8 where the distribution ZOI did not result in damage. Note that there is no entry in Table 5-9 for SE because all SE entries in Table 5-4 had a time to damage using the fit parameters. It is seen that the ZOI values are all small. In some cases, a slight reduction in the distribution ZOI results in a time to damage using the parameters in Table 5-4. In other cases, where the Table 4-1 ZOI value is very small, such as the TI row in Table 5-9, no ZOI is seen at the limiting value. In these cases, the target needs to be in direct contact or almost in direct contact with the fire for damage to occur. A conservative estimate for the time to damage in these cases would be 1 minute, which is the minimum time to damage based on the guidance in NUREG/CR-6850 Appendix H for flame impingement. Although this will not allow for any significant credit for suppression, the small ZOI means that apportioning the fire frequency for a horizontal target by the floor area fraction where the fire could be located should result in low risk contributions in most cases.
Table 5-9 Actual ZOI using the parameters from Table 5-4 versus the ZOIs based on Table 4-1 for the largest no target damage percentile for each ZOI in Table 5-8
Distribution % Table 4-1 ZOI
(m)
Table 5-4 ZOI
(m)
TP 85 0.136 0.135
KC 80 0.079 0.067
TS 95 0.088 0.085
TI 98 0.049 0.000

Detailed Fire Modeling Guidance
5-27
5.3.2 TCCL Transient Fire Distribution
The exercise in Section 5.3.1 is repeated in this section for the TCCL transient fire distribution. Table 5-10 shows the detailed modeling parameters for a selection of percentiles.
Table 5-10 HRR parameters and key FDTS parameters for a selection of percentiles for the TCCL transient fire distribution
% Peak HRR (kW)
TER
(MJ)
tg
(s) n1
tp
(s) n2
td
(s) Q*
Max D
(m)
Lf
(m)
z0
(m)
98 143 59.9 301 2.7 25 0.32 1290 0.54 0.57 1.13 0.03
95 95.3 37.4 281 2.7 15 0.32 1244 0.54 0.48 0.96 0.02
90 62.0 22.3 256 2.7 5 0.32 1178 0.54 0.41 0.81 0.02
85 44.3 14.7 234 2.7 1 0.32 1108 0.54 0.36 0.71 0.02
80 32.8 10.1 211 2.7 1 0.32 1028 0.54 0.31 0.63 0.01
75 24.6 7.0 190 2.7 1 0.32 949 0.54 0.28 0.56 0.01
50 5.5 0.91 98 2.7 1 0.32 565 0.54 0.15 0.31 0.01
25 0.6 0.035 29 2.7 1 0.32 213 0.54 0.06 0.12 0.00
Table 5-11 shows the time to damage results for the vertical TP ZOI from the base of the fire along with the ZOI based on the parameters in Table 5-10. For the vertical TP ZOI, it is seen that the fire shape parameters result in ZOI values that are approximately 30 cm (1 ft) higher over most of the range of percentiles. Because overall, the fire exposure from the shape parameters is slightly more severe than the fire exposure based on the actual test data, the time to damage values should be biased conservatively.
Table 5-11 Time to damage for targets located on the vertical TP ZOI boundary using the parameters from Table 5-10 along with the ZOI based on Table 4-4
% ZOI
(m)
Time to Damage
(s)
Fit HRR ZOI
(m)
ZOI
(m)
98 1.00 271 1.34 0.34
95 0.79 242 1.13 0.34
90 0.62 216 0.92 0.30
85 0.52 197 0.79 0.27
80 0.45 181 0.70 0.25
75 0.62 167 0.96 0.34
50 0.22 116 0.31 0.09
25 0.11 102 0.11 0.00

Detailed Fire Modeling Guidance
5-28
The damage times range from 4.5 minutes at the 98th percentile to 1.7 minutes at the 25th percentile. The 25th percentile has a short time to damage due to the small ZOI of 0.11 m (4.3 in.) and the rapid growth time of 29 seconds. The growth time quickly puts the target in the flame which, according to the tables in Appendix H of NUREG/CR-6850, is associated with a 1 minute time to damage.
Predictions of all times to damage for all three sets of ZOIs (vertical, vertical in a corner, and horizontal) are shown respectively in Tables 5-12 through 5-14. If the time value is underlined, it indicates that the fit HRR curve did not result in damage at the distribution ZOI and that the values represent instead the fit ZOI. In the case that no time to damage exists even for a 1 cm ZOI, the damage time was set to 1 minute. In this case the target is essentially exposed to direct flame contact where the time to damage is 1 minute.
Table 5-12 Time to damage for the vertical ZOI using the parameters from Table 5-10 along with the ZOIs based on Table 4-4
%
Vertical ZOI Time to Damage
(s)
SE TP KC TS TI
98 208 270 271 261 203
95 184 241 242 233 183
90 167 216 217 209 165
85 156 197 198 191 152
80 146 181 182 176 141
75 138 473 168 162 131
50 104 116 117 114 97
25 74 102 116 82 73
Table 5-13 Time to damage for the vertical in a corner ZOI using the parameters from Table 5-10 along with the ZOIs based on Table 4-4
%
Vertical in a Corner ZOI Time to Damage
(s)
SE TP KC TS TI
98 210 276 278 274 207
95 186 248 249 245 185
90 168 224 223 219 168
85 157 205 204 201 156
80 147 189 188 185 145
75 139 176 174 171 136
50 105 123 122 119 101
25 74 152 125 116 75

Detailed Fire Modeling Guidance
5-29
Table 5-14 Time to damage for the horizontal ZOI using the parameters from Table 5-10 along with the ZOIs based on Table 4-4
%
Horizontal ZOI Time to Damage
(s)
SE TP KC TS TI
98 243 472 416 413 60
95 206 534 467 961 60
90 177 623 597 983 60
85 160 799 745 60 60
80 145 791 753 60 60
75 133 766 723 60 60
50 92 60 60 60 60
25 70 60 60 60 60


6-1
6 DISCUSSION OF PROJECT UNCERTAINTIES
This section of the report covers the potential sources of uncertainties that occur in the distributions and input data developed in Sections 4 and 5. In general, it is difficult to quantify the exact magnitude of these uncertainties. A list of the major elements where uncertainties may be introduced is discussed in Sections 6.1 through 6.4 and summarized below:
Experimental design
– Test items
– Ignition sources
– Hood calorimetry
Derived data
– Diameter
– Zone of influence (ZOI)
– Growth and decay
Creation of probabilistic distributions
Detailed fire modeling guidance
6.1 Experimental Design
Full details of the experimental design, including detailed descriptions of test items, descriptions of ignition sources, and the test setup and instrumentation, can be found in the test report [9]. The experimental uncertainties are also presented in the test report.
6.1.1 Test Items
Test item uncertainty relates to the types of items selected and the sizes of fuel packages as they relate to the spectrum of events seen in operational experience. Event descriptions in the EPRI fire events database (FEDB) [16] are generally sparse in detail. Efforts were made to select test items believed to be reasonable surrogates of actual transient combustibles in a nuclear power plant (NPP). One item, the laptop+cart test item consisting of a two-shelf plastic work cart, laptop, and printer was selected purposefully to capture the most severe transient fire event seen in operational experience. This event also had a detailed description in the FEDB. There are a few items that arguably may not be reasonable surrogates (for example, the non-fire-resistant (FR) treated canvas tarp and the plastic patio chair); however, in the end those items had a very low weighting and do not contribute significantly to final probabilistic risk assessment (PRA) guidance. There are a couple of items where the testing was more toward a worst-case configuration—for example mop+bucket, but no mop alone and the mop+bucket was

Discussion of Project Uncertainties
6-2
dry. Overall although there is uncertainty in the relationship between the test items and the operating experience, there is likely some conservatism in the test items.
6.1.2 Ignition Sources
Like the selection of test items, the ignition sources were selected to be representative of those seen in NPP events. The actual energy content and intensity of ignition sources in NPP events is, however, unknown. If the selected ignition sources were biased to conservative source strengths, this could have resulted in faster fire growth rates (lower time to damage) and more complete burning for some test items. Some ignition sources had conservative aspects to them, but the net effect on the end PRA guidance is believed to be low. This conclusion is based on the following observations:
The lighter is a very brief, very low intensity source that was only used for items that were easy to ignite; this does not add any noticeable conservatism.
The radiant panel was set to a higher heat flux than one would likely see from a work light. However, the items it was used for did not sustain a significant fire. Therefore, although the source was conservative, the outcome was not.
The heptane wick is also a longer duration ignition source and longer than some sources expected in a plant. In most cases, items where the wick was used were easily ignited and the source duration did not have a large impact on the outcome (cardboard boxes, trash bags, personnel protective equipment [PPE] bags). In some cases (for example, temporary blower duct), no significant fire resulted. Although the wick burned for minutes, its heat release rate (HRR) is low (~1–2 kW) and the additional hazard contributed by the wick itself is near zero. For a few items such as the plastic tarps and the stack of PPE, the longer duration wick may have exacerbated the fire. It is possible that the fire-retardant tarp might not have seen as large an HRR as it did if it had a shorter duration ignition source.
The continuous flame is like the wick in that it is a long duration source. Many items it was used for did not ignite or did not result in a significant fire—for example, the various wood items. This source was used to drive the laptop and cart to ignition, but that was intentional to reproduce an actual plant event that resulted in sprinkler operation. This was necessary to give credibility to the overall results. For items such as the water hose and the large rope, the continuous flame probably resulted in somewhat larger fires than would have occurred with a shorter duration source. Most of those tests had a small fire size, but one hose test and one large rope test did get a larger fire; however; those cases where full involvement of the fuel package occurred represent a very small portion of the fire frequency used in developing the distributions.
6.1.3 Hood Calorimetry
The time-dependent HRR, the total energy release (TER), and the yields of carbon monoxide (CO) and soot were measured through oxygen consumption calorimetry using a hood to collect the combustion products from the fire.
Due to its design, the hood imposes a small amount of smoothing to the HRR signal. There is a short residence time in the hood and its attached duct that results in mixing of combustion products over a short time interval. This means that very sharp peaks in HRR will be smoothed and have a slightly lower peak HRR. Longer duration peaks will not be affected as much. This is a nonconservative effect. Overall, the HRR measurement has an 11% uncertainty.

Discussion of Project Uncertainties
6-3
However, the TER is not affected by the time smoothing. The TER is the time integration of the HRR. That integrated measurement is not affected by mixing in the hood and duct because eventually all of the combustion products are exhausted. As an integrated value, random fluctuations in the HRR are expected to average out in time and the total error for the TER is less than that for the HRR. The same applies to the CO and soot measurements. The uncertainty for these measurements respectively ranges from 2% to 10% and from 15% to 18% with the higher values applying for smaller TERs. This is due to the resolution of the load cell used for mass loss, which limits the accuracy for small mass losses.
6.1.4 Other Test Data
Data such as temperature, heat flux, and mass loss are not expected to have a conservative or nonconservative bias. These quantities are also not drivers of the PRA modeling guidance. They were used in the test report to validate the approaches used to determine the ZOIs for test items.
6.2 Derived Data
Full details of the how derived data were obtained from the experiments and their uncertainties can be found in the test report [9].
6.2.1 Fire Diameter and Effective Elevation
The maximum diameter was estimated from test video and test photos. This process is not expected to have a bias. When doing the ZOI calculations, the fire diameter was scaled to HRR to preserve the burning rate at the maximum diameter. At low fire sizes, this probably underestimates the diameter. This will have a nonconservative effect on the vertical ZOI and a conservative effect on the horizontal ZOI. However, this effect will be small because it is the fire period around the peak that primarily determines the ZOI. The very early growth has little impact on the ZOI, and the late decay period is beyond the time to damage.
The effective fire elevation was estimated based on the observed burning behavior of test items near the peak HRR. The selected value in Section 5.2.1 of 15 cm (6 in.) is the 85th percentile elevation and does provide a degree of conservatism without being a large bounding value.
6.2.2 ZOI
The ZOI is computed using the Fire Dynamics Tools (FDTS). The correlations used include the McCaffery plume temperature [31] and solid flame model [4] along with the heat soak approach [4]. Damage criteria for sensitive electronics (SE), thermoplastic (TP), and thermoset (TS) cables were taken from NUREG/CR-6850 [1]. Damage criteria for Kerite-FR cables were developed in the test report [9] using data from NUREG/CR-7102 [39]. These all contain conservatisms. The total estimated uncertainty in the ZOI values are 20% for vertical and 16% for horizontal. This incorporates the uncertainty of the correlations and the uncertainty in the test data used as input (for example, the HRR and fire diameter).
Comparison of FDTS predicted temperature and heat flux with that measured during the test showed that the FDTS were conservative. When used to compute the time to damage at the location of test instrumentation (temperature or heat flux), the FDTS usage had faster times to damage. This suggests that the overall ZOI values are also conservative; however, these calculations were done for thermoplastic (TP), which has a rapid decrease in time to damage as a function of temperature.

Discussion of Project Uncertainties
6-4
The heat soak method also introduces conservatism. For TP, Kerite-FR, and TS cables, the heat soak uses time to damage derived from experiments. The Appendix H data in NUREG/CR-6850 Volume II [1] took all of the penlight test results for all of the cables in a plastic category, plotted them, and drew a bounding curve that was then tabulated. This means that the damage times will be conservative for larger diameter cables because larger cables have more mass and require a longer time to heat. The bulk cable tray ignition (TI) uses the new ignition temperature from FAQ 16-0011 [13]. There are not many available data to base a time to TI on, and a 1 minute time was assumed. This is probably conservative; however, this ZOI is small and, therefore, its impact on risk is not likely to be large. Sensitive electronics have no test data for time to damage. As with the trays, a 1 minute time was assumed at the threshold temperature from NUREG/CR-6850. The exposed SE ZOIs are probably very conservative because at the threshold temperature it is likely that multiple minutes are needed before damage occurs. The impact of this on a PRA, however, will be limited because many SE are contained in an enclosure of some form. Enclosed SE would use the TS ZOIs (that is, based on FAQ 13-0004 [12]), which are not as conservative as the exposed SE ZOIs.
6.3 Growth, Plateau, and Decay Parameters
The growth and decay parameters were determined from visual inspection of plots of the HRR of tests. The fire endpoint is a known fixed value based on there being no more visible flame during testing. The time the ignition source was applied is also a known point in time. Uncertainty in these parameters relates to picking the growth time and the plateau time. The decay time is whatever remains. For most fires, there is a single significant peak in the HRR, and there is little uncertainty in the time one would pick to identify that peak. Some fires have multiple peaks where the first peak may not be the dominant peak. Different individuals might select very different peak times for such fires; however, most fires did not have this behavior, and the largest fires did not have this behavior. The growth exponent was picked to try to match the shape of the top of the peak. This was done using a power law fit to the data. Many fires exhibit a pre-growth phase where the burning intensity remains low for a period of time before taking off. Matching the shape of the curve for these fires means using a starting point other than the ignition point for determining the growth exponent. This introduces uncertainty, into the growth exponent, which is not easily quantified. The length of the plateau also has some uncertainty to it. No fire actually burns at a fixed peak rate for a length of time. In most of the fires, however, there is a clear point where the HRR begins a rapid and continuous drop. Although the selection of when that point begins may vary, it is not likely to be a large variance in actual time. Similar to the growth exponent, the decay exponent is picked to try to visually match the HRR curve at the start of the decay. Doing this requires a power law fit that is limited to some portion of the decay data starting at the end of the plateau. This introduces uncertainty into the decay exponent that is not easily quantified.
The growth and decay parameters impact the time to damage and, to some extent, hot gas layer (HGL) calculations when doing detailed modeling. The screening ZOIs use the actual test data in the development of those distributions. It is the time to the peak and the shape of the curve near the peak that drives the time to damage. The method for analyzing the growth and decay portions of the HRR curve generally does well in capturing the final growth to peak and the initial part of the decay. There is some conservatism on the decay side. The plateau does have some conservatism to it. In the test data, fires are only briefly at the exact peak and most of the plateau region is at a lower fire size. The fire characterization used assumes the HRR remains at its peak for the entire duration of the plateau. This will result in a decrease in the time to damage. The HGL is determined by the total energy released, as well as the shape of the curve. The growth and decay shape for detailed modeling preserves the total energy. There should be a lesser

Discussion of Project Uncertainties
6-5
impact of the plateau conservatism on the HGL. Full details of the process and the determined parameters can be found in the test report [9] and in Appendix A for the additional tests from Section 2.2.
6.4 Creation of Probabilistic Distributions
The creation of probabilistic distributions used the following four-step process:
1. Section 3.2.1. Apportion all of the challenging and potentially challenging transient events in the EPRI FEDB into categories. How this is done will have some effect on the distributions. Most FEDB events are easily categorized (that is—the only fuel mentioned is rags or wood or cardboard). Some events require judgment. This subjectivity was accounted for by having multiple independent assessments of the events. This should limit the possibility for a significant conservatism due to this process. All categories had uncertainty to them that is covered within the section.
2. Section 3.2.2. Apportion all of the test fuel packages to the FEDB categories. Similar to step 1, this will have some effect on the distributions because some fuel packages require judgment as to which category is the best fit. The same process used in Step 1—multiple independent assessments—was applied.
3. Section 3.2.3. Within each category, weight the individual fuel packages. This was also done by multiple independent assessments. It is likely that each assessor tended to be conservative. Engineers are trained to consider margin in design applications, and that has likely carried over into this assessment—that is, it is likely that rare events (the large box) were assigned weights that biased high. This likely shifted the distributions to the right (more severe) a small amount.
4. Section 3.3. Fit a gamma distribution to the data. The probability-probability plots in Appendix D provide an indication of goodness of fit for the distributions.
6.5 Inputs for Detailed Modeling
Inputs for detailed fire modeling consist of the heat of combustion, Q*, yields, and the fire growth parameters, as follows:
Heat of combustion. This parameter has little impact on the resulting risk. The recommended value is a midpoint value. This parameter should be neutral in terms of PRA conservatism.
Q*. Lower values increase the vertical ZOI, and higher values increase the horizontal ZOI. For the HGL, lower values result in deeper but cooler HGL, and higher values result in a shallower but hotter HGL. The recommended value is a midpoint value of the range of fire sizes of most interest. This parameter should be neutral in terms of PRA conservatism.
Yields. For yields, the recommendation is for the 75% yield values. These only apply to abandonment type calculations. These are also consistent with published guidance for doing performance-based design for commercial and residential structures; however, the recommended values do have some conservatism.
Fire growth parameters. These are difficult to evaluate. There are no clear trends in the rate of growth or decay. There are some trends relating the length of the decay to steady-state plateau and to the growth time. When used in detailed modeling, the growth parameters need to achieve a number of objectives: get the right peak HRR, get the right TER, get the right ZOIs, and do it all with a simple formula for the shape of the HRR curve. This cannot be done perfectly because real fire curves are not simple. The parameters

Discussion of Project Uncertainties
6-6
generated get the correct HRR and the TER. They are slightly conservative for ZOI (generally off by 10–20 cm [4–8 in.]). The resulting time to damage appears to be biased slightly conservative when compared with median values based on the experiments.

7-1
7 COMBINING NEW DATA WITH EXISTING PRAS
Although the largest benefit of the distributions and input data in this report will be seen by using the entire data set developed, it is possible to combine portions of the data with this report with existing fire probabilistic risk assessments (FPRAs) data. Potential options include the following:
Use the complete set of distributions and input data developed in Sections 4 and 5. Although this requires the largest effort, it should also yield the largest benefit.
Rescreen targets using the new zone of influence (ZOI) distributions while maintaining time to damage calculations using the NUREG/CR-6850 heat release rate (HRR) distribution and NUREG/CR-6850 Supplement 1 growth times. The use of the ZOI distributions in this report may result in the screening of additional targets. For those targets remaining, the use of the more severe NUREG/CR-6850 distribution will mean faster times to damage than those that would be computed using the data in this report. For example, Table 5-5 shows that the vertical TP time to damage at the 98th percentile ZOI of 1.78 minutes is 671 seconds. Using the 98th percentile NUREG/CR-6850 fire of 317 kW with a 2 minute growth time and a fire Froude (Q*) number of 1 would result in a time to damage of 150 seconds.
The NUREG/CR-6850 HRR distribution can be used with the new detailed fire modeling parameters. This requires first determining the equivalent percentile in the new distribution in order to obtain the total energy release (TER) for use in determining the growth time and decay time. For example, the old 75th percentile of 142 kW is equivalent to the 92.6th percentile in the new distribution, which has a TER of 56 MJ. The values of 142 kW and 56 MJ would then be used as inputs to Equations 5-2 through 5-4.
For fire sizes above the 50th percentile HRR in the new generic distribution, the NUREG/ CR-6850 Supplement 1 approach of a 2 minute, t2 growth can be used with the new HRR and TER distributions. For example, for the new 98th percentile fire of 278 kW and 123 MJ, the fire could be modeled with 120 second t2 growth followed by a constant 404 second plateau (404 seconds at 278 kW plus the growth gives 123 MJ). At or below the 50th
percentile and the new detailed modeling parameters give growth times less than 2 minutes.
In some cases, a FPRA may have a set of tables of the time to damage based on an ignition source, a percentile, and a distance from the ignition source. In this case, one can substitute the new HRR distribution and maintain the old time to damage for the closest larger percentile. For example, the 90th percentile peak HRR from the NUREG/CR-6850 distribution is 206 kW. With a 2 minute growth time and a fire Froude (Q*) number of 1, at 1 m above the fire, the time to damage would be 115 seconds. The 90th percentile using the gamma distribution in Table 4-1 is 114 kW. With the same 2 minute growth time and a fire Froude (Q*) number of 1, for targets at 1 m above the fire, the time to damage would be 136 seconds. This is an 18% increase in the time to damage; however, it is not as much increase as using the full set of data in this report, which would give a time to damage of 266 seconds. When doing this, the goal would be to select the tabulated HRR nearest to and larger than the value from the HRR distribution in Table 4-1. For example, if one had

Combining New Data with Existing PRAs
7-2
transient fires tabulated in 25 kW increments, one would use the 125 kW fire, which would be the closest value still larger than 114 kW.
As covered in Section 5.2.2, the effects of soot and CO are related to their total production rates, which are a function of the soot and CO yields, the heat of combustion, and the HRR of the fire. A 100 kW fire with a 5% soot yield and a 20 MJ/kg heat of combustion will make twice as much soot as a 100 kW fire with a 5% soot yield and a 40 MJ/kg heat of combustion. This is because the first fire must burn twice as much fuel to achieve the same HRR as the second fire. Based on this, an existing main control room (MCR) abandonment calculation can be evaluated against the yields in Section 5.2.2. If a higher effective soot yield was used, then the abandonment time could be reevaluated. For example, if a MCR abandonment calculation used a 20 MJ/kg heat of combustion with a 4.5% soot yield, this would be equivalent to a 5.6% soot yield using the heat of combustion of 25 MJ/kg in Section 5.2.1 (25/20×4.5 = 5.6). This is larger than the recommended value of 5.2% in Section 5.2.2. This means that the existing fire modeling output files could be revaluated to reflect the fact that the soot yield used was effectively 8% too high. Typically, abandonment is based on visibility, which is inversely proportional to soot density, and soot density is proportional to the soot yield. For this example, the existing model outputs could be reprocessed at 93% (1/1.08) of the abandonment visibility threshold to account for the soot yield. Therefore, if a visibility of 3 m was used in the abandonment calculation, in this example the modeling output files could be reprocessed for a visibility of 2.8 m.

8-1
8 SUMMARY AND CONCLUSIONS
This report documents the working group’s effort to combine the data collected in the testing phase [9] with data from previous experimental programs and to develop a methodology for weighting the combined data set based on industry experience with transient fires. The combined data set, covered in Section 2, consisting of 307 fire experiments involving 110 fuel packages, was used to develop the probabilistic distributions for peak heat release rate (HRR), total energy release (TER), and zones of influence (ZOI) for transient fires. ZOI values are included for vertical, vertical in a corner, and horizontal for exposed sensitive electronics (SE), thermoplastic (TP) cables, Kerite-FR cables (KC), thermoset (TS) cables, and bulk cable/tray ignition (TI). Additionally, this report recommends input values for the detailed fire modeling of transient fires that includes fire growth and decay parameters, yields of minor products of combustion, heat of combustion, and the physical size and effective elevation of the fire.
The distributions were created by weighting each experiment based on the challenging or potentially challenging transient fire events in the EPRI fire events database (FEDB) [16]. This process, which was covered in Section 3, involved categorizing each transient FEDB event to a predefined list of fuel categories, assigning each experiment to a predefined fuel category, and then weighting the individual events within each category. This process resulted in individual weights for each of the 307 experiments.
The weighted set of test data was used to develop two generic sets of distributions. The first set is a generic fire transient distribution intended as a replacement for the current transient fire distribution in Appendix G of NUREG/CR-6850 [1]. The second set is a transient combustible control location (TCCL) distribution. This is a less severe distribution, and it is intended for use in plant locations that meet the TCCL definition in Section 3.3.1.1.
The statistical programming language R was used to process the weighted test data into empirical cumulative distribution functions. Gamma distributions were then fit to the empirical functions. These distributions are presented in Section 4.1 for the generic transient fire distributions and in Section 4.2 for the TCCL transient fire distributions. Additional investigation of the sensitivity of the distributions is examined in Sections 4.1.1 and 4.1.2. The recommended gamma distributions are shown in Tables 4-1 and 4-4. These tables also contain values of the distributions at the 75th and 98th percentiles to support target screening. These tables are repeated for convenience as Tables 8-1 and 8-2.

Summary and Conclusions
8-2
Table 8-1 Recommended generic transient fire distributions of peak HRR, TER, and ZOI
Distribution Distribution Percentiles Gamma Distribution Parameters
75th 98th
HRR (kW) 41.6 278 0.271 141
TER (MJ) 11.8 123 0.184 77.1
Vertical ZOI
(m)
SE 1.90 5.49 0.954 1.44
TP 0.56 1.78 0.768 0.525
KC 0.53 1.64 0.814 0.470
TS 0.45 1.47 0.748 0.439
TI 0.41 1.33 0.760 0.395
Vertical in a corner ZOI
(m)
SE 3.27 9.47 0.943 2.50
TP 0.99 2.96 0.872 0.816
KC 0.91 2.74 0.873 0.754
TS 0.79 2.43 0.829 0.687
TI 0.71 2.18 0.827 0.618
Horizontal ZOI
(m)
SE 0.21 1.05 0.374 0.450
TP 0.09 0.36 0.501 0.132
KC 0.07 0.22 0.723 0.0666
TS 0.05 0.11 1.42 0.0233
TI 0.03 0.05 7.63 0.00345

Summary and Conclusions
8-3
Table 8-2 Recommended TCCL transient fire distributions of peak HRR, TER, and ZOI
Distribution Distribution Percentiles Gamma Distribution Parameters
75th 98th
HRR (kW) 24.6 143 0.314 67.3
TER (MJ) 7.0 59.9 0.214 34.5
Vertical ZOI
(m)
SE 1.44 3.26 1.76 0.604
TP 0.40 1.00 1.33 0.218
KC 0.38 0.94 1.36 0.203
TS 0.32 0.80 1.36 0.173
TI 0.29 0.76 1.25 0.171
Vertical in a corner ZOI
(m)
SE 2.54 5.64 1.86 1.01
TP 0.71 1.69 1.53 0.34
KC 0.66 1.59 1.47 0.328
TS 0.57 1.40 1.43 0.292
TI 0.52 1.26 1.44 0.263
Horizontal ZOI
(m)
SE 0.15 0.68 0.43 0.273
TP 0.06 0.17 0.977 0.0442
KC 0.05 0.10 1.93 0.0175
TS 0.03 0.05 7.63 0.00343
TI 0.03 0.05 7.63 0.00342
Detailed fire modeling parameters were developed using the same set of weighted test data minus tests with low HRRs. A summary of these parameters is given in Table 5-3 and repeated as Table 8-3. HC and Q* are median values based on the test data. Median was used for these parameters because HC is not a risk-determining parameter and median for Q* avoids biasing ZOI values toward one direction (for example, vertical or horizontal) and away from the other. Soot and CO yields are the 75th percentile values. This adds a degree of conservatism to a fire probabilistic risk assessment (FPRA) without the use of bounding values that introduce significant non-realism. The fire elevation, ze, was set to the 85th percentile. This also adds a slight amount of conservatism to the FPRA without being a bounding value that introduces significant non-realism. The remaining parameters either are directly taken from the probabilistic distributions or are derived from the probabilistic distributions in a manner designed to reasonably replicate the percentile ZOI given a percentile peak HRR and TER.

Summary and Conclusions
8-4
Table 8-3 Summary of input parameters for detailed modeling
Parameter Recommended Value Uncertainty
Range1 Comment
Peak HRR (kW)
Distribution in Table 4-1 or Table 4-4
N/A Determined by the percentile fire being modeled.
TER (MJ) Distribution in Table 4-1 or
Table 4-4 N/A
Determined by the percentile fire being modeled.
HC
(MJ/kg) 25 15–35
When using a generic HRR curve, varying HC does not impact ZOI or hot gas layer. Note that the species yield range already incorporates the variance in the HC of test items. If HC is changed, yields need to be rescaled to preserve the effective hazard.
Q* 0.54 0.23–1.2
ze (m) 0.15 0.00–0.71 Effective elevation of the base of the fire above the local floor height.
Soot yield (kg/kg)
0.052 0.012–0.136 Note that the yield values are tied to the selected HC.
CO yield (kg/kg)
0.043 0.024–0.068 Note that the yield values are tied to the selected HC.
Growth exponent
n1 2.7 1.1–6.8
Changing exponents must be propagated through Equations 5-2 through 5-6.
Decay exponent
n2 0.32 0.14–0.45
Changing exponents must be propagated through Equations 5-2 through 5-6.
Growth time
tg (s)
Equation 5-2 or 5-5
300–4090*
First use Equation 5-2. Switch to Equation 5-5 if plateau time is set to 1 second. *Uncertainty range applies to the 690 constant in Equation 5-2.
Plateau time
tp (s)
Equation 5-4 or 1 second
N/A
First, determine the growth and decay time. If plateau is less than 1 second, set to 1 second and redo growth time and decay time.
Decay time td (s)
Equation 5-3 or 5-6
2200–9560*
First use Equation 5-3. Switch to Equation 5-6 if plateau time is set to 1 second. *Uncertainty range applies to 3940 constant in Equation 5-3.
1 Range is the equivalent of one standard deviation (16th and 84th percentiles) except for soot and CO, which are 41st to 98th, and ze, which is 79th to 98th.

Summary and Conclusions
8-5
The distributions in Tables 4-1 and 4-4 were used to develop a set of bins for use in determining severity factors (SFs). These bins and their key detailed fire modeling parameters are shown in Tables 8-4 and Table 8-5. The tables show the peak HRR, the TER, the fire growth and decay parameters, the maximum diameter computed using Q* and the peak HRR, the flame height computed using Heskestad’s correlation [31], and the virtual origin used in the plume temperature correlation [31]. Note: This is not the same as the 15 cm [6 in.] effective floor elevation.
Table 8-4 Generic transient fire HRR bins, fire growth parameters, and key Fire Dynamics Tools (FDTS) parameters for determining SF
Bin Width
%
Peak HRR
(kW)
TER
(MJ)
tg
(s) n1
tp
(s)
td
(s) n2 Q*
Max D
(m)
Lf
(m)
z0
(m)
2 278 123 322 2.7 39 1311 0.32 0.54 0.74 1.48 0.03
1 253 111 317 2.7 37 1301 0.32 0.54 0.71 1.42 0.03
1 217 92.9 309 2.7 33 1283 0.32 0.54 0.67 1.34 0.03
2 181 74.7 298 2.7 28 1258 0.32 0.54 0.62 1.24 0.03
2 147 58.5 286 2.7 23 1227 0.32 0.54 0.57 1.14 0.03
2 124 47.3 275 2.7 19 1197 0.32 0.54 0.54 1.07 0.02
5 94 33.9 257 2.7 12 1146 0.32 0.54 0.48 0.96 0.02
5 67.0 22.0 233 2.7 5 1074 0.32 0.54 0.42 0.84 0.02
5 48.7 14.5 209 2.7 1 993 0.32 0.54 0.37 0.74 0.02
5 35.6 9.60 185 2.7 1 902 0.32 0.54 0.33 0.65 0.01
10 22.2 5.06 150 2.7 1 768 0.32 0.54 0.27 0.54 0.01
10 11.3 1.97 109 2.7 1 594 0.32 0.54 0.21 0.41 0.01
10 5.2 0.65 73 2.7 1 431 0.32 0.54 0.15 0.30 0.01
15 1.54 0.11 38 2.7 1 251 0.32 0.54 0.09 0.18 0.00
25 0.045 0.001 5 2.7 1 47 0.32 0.54 0.02 0.04 0.00

Summary and Conclusions
8-6
Table 8-5 TCCL transient fire HRR bins, fire growth parameters, and key FDTS parameters for determining SF
Bin Width
%
Peak HRR
(kW)
TER
(MJ)
tg
(s) n1
tp
(s)
td
(s) n2 Q*
Max D
(m)
Lf
(m)
z0
(m)
2 143 60 301 2.7 25 1290 0.32 0.54 0.57 1.13 0.03
1 131 54 297 2.7 22 1282 0.32 0.54 0.55 1.09 0.02
1 114 45.8 290 2.7 19 1266 0.32 0.54 0.52 1.03 0.02
2 95.3 37.4 281 2.7 15 1244 0.32 0.54 0.48 0.96 0.02
2 78.7 29.8 270 2.7 11 1216 0.32 0.54 0.45 0.89 0.02
2 66.8 24.5 261 2.7 7 1190 0.32 0.54 0.42 0.83 0.02
5 52.0 18.0 246 2.7 2 1147 0.32 0.54 0.38 0.76 0.02
5 38.0 12.1 222 2.7 1 1067 0.32 0.54 0.33 0.67 0.01
5 28.4 8.4 200 2.7 1 988 0.32 0.54 0.30 0.59 0.01
5 21.4 5.8 180 2.7 1 910 0.32 0.54 0.27 0.53 0.01
10 14.0 3.28 151 2.7 1 794 0.32 0.54 0.22 0.45 0.01
10 7.7 1.44 115 2.7 1 641 0.32 0.54 0.18 0.35 0.01
10 3.9 0.55 82 2.7 1 490 0.32 0.54 0.13 0.27 0.01
15 1.3 0.12 47 2.7 1 311 0.32 0.54 0.09 0.17 0.00
25 0.063 0.001 8 2.7 1 76 0.32 0.54 0.03 0.05 0.00

9-1
9 REFERENCES
1. EPRI/NRC-RES Fire PRA Methodology for Nuclear Power Facilities, Volume 2: Detailed Methodology. Electric Power Research Institute (EPRI), Palo Alto, CA and U.S. Nuclear Regulatory Commission, Washington, DC: September 2005. EPRI 1011989 and NUREG/CR-6850.
2. Nuclear Power Plant Fire Ignition Frequency and Non-Suppression Probability Estimation Using the Updated Fire Events Database, EPRI, Palo Alto, CA, and U.S. Nuclear Regulatory Commission, Washington, DC: January 2015. NUREG-2169 and EPRI 3002002936.
3. Refining and Characterizing Heat Release Rates from Electrical Enclosures During Fire, Volume 1: Peak Heat Release Rates and Effect of Obstructed Plume, U.S. Nuclear Regulatory Commission, Washington, DC, and EPRI, Palo Alto, CA: 2016. NUREG-2178 Volume 1 and EPRI 3002005578.
4. Refining and Characterizing Heat Release Rates from Electrical Enclosures During Fire, Volume 2: Fire Modeling Guidance for Electrical Cabinets, Electric Motors, Indoor Dry Transformers, and the Main Control Board, U.S. Nuclear Regulatory Commission, Washington, DC, and EPRI, Palo Alto, CA: 2019. NUREG-2178 Volume 2 and EPRI 3002016052.
5. Cable Heat Release, Ignition, and Spread in Tray Installations During Fire (CHRISTIFIRE), Phase 1: Horizontal Trays, U.S. Nuclear Regulatory Commission, Washington, DC: July 2012. NUREG/CR-7010 Vol 1.
6. Cable Heat Release, Ignition, and Spread in Tray Installations During Fire (CHRISTIFIRE), Phase 2: Vertical Shafts and Corridors, U.S. Nuclear Regulatory Commission, Washington, DC: December 2013. NUREG/CR-7010 Vol 2.
7. EPRI/NRC-RES Fire Human Reliability Analysis Guidelines—Final Report, U.S. Nuclear Regulatory Commission, Washington, DC, and EPRI, Palo Alto, CA: 2012. NUREG-1921 and EPRI 1023001.
8. Joint Assessment of Cable Damage and Quantification of Effects from Fire (JACQUE-FIRE), Volume 2: Expert Elicitation Exercise for Nuclear Power Plant Fire-Induced Electrical Circuit Failure, U.S. Nuclear Regulatory Commission, Washington, DC, and EPRI, Palo Alto, CA: 2014. NUREG/CR-7150 Vol. 2 and EPRI 3002001989.
9. Heat Release Rate and Fire Characteristics of Fuels Representative of Typical Transient Fire Events in Nuclear Power Plants, U.S. Nuclear Regulatory Commission, Washington, DC, and EPRI, Palo Alto, CA: 2019. NUREG-2232 and EPRI 3002015997.
10. Hot Work/Transient Fire Frequency: Influence Factors, U.S. Nuclear Regulatory Commission, Washington, DC: 2013. FAQ 12-0064 R1. Available from ADAMS: https://www.nrc.gov/docs/ ML1225/ML122550050.pdf.
11. Transient Fire Frequency Likelihood, U.S. Nuclear Regulatory Commission, Washington, DC: 2018. FAQ 14-0007. Available from ADAMS: https://www.nrc.gov/docs/ML1808/ML18088B138.html.

References
9-2
12. Treatment of Sensitive Electronics, U.S. Nuclear Regulatory Commission, Washington, DC: 2013. FAQ 13-0004. Available from ADAMS: https://www.nrc.gov/docs/ML1332/ML13322A085.pdf.
13. Cable Tray Ignition, U.S. Nuclear Regulatory Commission, Washington, DC, 2018. FAQ 16-0011. Available from ADAMS: https://www.nrc.gov/docs/ML1807/ML18074A023.html.
14. Fire Probabilistic Risk Assessment Methods Enhancements, U.S. Nuclear Regulatory Commission, Washington, DC, and EPRI, Palo Alto, CA: 2010. NUREG/CR-6850 Supplement 1 and EPRI 1019259.
15. Fire Modeling Enhancements for Fire Probabilistic Risk Assessment: Fire Location Factor, Transient Fires, and Liquid Spill Heat Release Rate. EPRI, Palo Alto, CA: 2015.3002005303.
16. Fire Events Database Update for the Period 2010–2014: Revision 1. EPRI, Palo Alto, CA: 2016. 3002005302.
17. Heat and Mass Release for Some Transient Fuel Source Fires: A Test Report, U.S. Nuclear Regulatory Commission, Washington, DC, and Sandia National Laboratories, Albuquerque, NM: October 1986. NUREG/CR-4680 and SAND86-0312.
18. B. Lee, Heat Release Rate Characteristics of Some Combustible Fuel Sources in Nuclear Power Plants, National Bureau of Standards, Gaithersburg, MD: July 1985. NBSIR 85-3195.
19. Investigation of Twenty-Foot Separation Distance as a Fire Protection Method as Specified in 10 CFR 50, Appendix R, U.S. Nuclear Regulatory Commission, Washington, DC, and Sandia National Laboratories, Albuquerque, NM: October 1983. NUREG/CR-3192 and SAND83-0306.
20. D. Volkinburg, R. Williamson, F. Fisher, and H. Hasegawa, Towards a Standard Ignition Source, Lawrence Berkeley National Laboratory, Berkeley, CA: October 1978, LBL-8306.
21. Quantitative Data on the Fire Behavior of Combustible Materials Found in Nuclear Power Plant: A Literature Review, U.S. Nuclear Regulatory Commission, Washington, DC, and Sandia National Laboratories, Albuquerque, NM: February 1987. NUREG/CR-4679 and SAND86-0311.
22. Y. Young, H. Park, et al., “Characteristics of Nuclear Facility Waste Bags,” Fire Technology, 51, 129–152, 2015, DOI: 10.007/s10694-013-0368-z.
23. Kerite-FR Cable Failure Thresholds, U.S. Nuclear Regulatory Commission, Washington, DC, 2012. FAQ 08-0053. Available from ADAMS: https://www.nrc.gov/docs/ML1214/ML121440155.pdf
24. Response to August 28, 2014 NRC Request for Additional Information Regarding License Amendment Request to Implement a Risk-Informed Performance-Based Fire Protection Program, McGuire Nuclear Station Units 1 and 2, November 12, 2014. Available from: https://adamswebsearch2.nrc.gov/webSearch2/main.jsp?AccessionNumber=ML14328A628.
25. One-Hundred-Twenty-Day Response to NRC Request for Additional Information National Fire Protection Association Standard 805, Diablo Canyon Units 1 and 2, November 26, 2014. Available from: https://adamswebsearch2.nrc.gov/webSearch2/main.jsp?AccessionNumber=ML14330A635.
26. Request for Additional Information Regarding the National Fire Protection Association Standard 805 License Amendment Request, Calvert Cliffs Units 1 and 2, April 13, 2015. Available from: https://adamswebsearch2.nrc.gov/webSearch2/main.jsp?AccessionNumber=ML15107A029.
27. Enclosure 1, Request for Additional Information (RAI) with Callaway Plant Response, Callaway, October 21, 2013. Available from: https://adamswebsearch2.nrc.gov/webSearch2/main.jsp?AccessionNumber=ML12194A638.

References
9-3
28. Implementation of Fire Protection Requirements, U.S. Nuclear Regulatory Commission, Washington, DC, Generic Letter 86-10, April 24, 1986. Available through https://www.nrc.gov/reading-rm/doc-collections/gen-comm/gen-letters/1986/gl86010.html.
29. Fire Protection Significance Determination Process, Appendix F, U.S. Nuclear Regulatory Commission, Washington, DC, IMC 0609, May 18, 2018. Available through ADAMS: https://www.nrc.gov/docs/ML0416/ML041600574.pdf.
30. R Core Team, An Introduction to R, Notes on R: A Programing Environment for Data Analysis and Graphics, The R Foundation, 2019.
31. Fire Dynamics Tools (FDTS) Quantitative Fire Hazard Analysis Methods for the U. S. Nuclear Regulatory Commission Fire Protection Inspection Program, U.S. Nuclear Regulatory Commission, Washington, DC: July 2013. NUREG-1805, Supplement 1.
32. R. Peacock, K. McGrattan, G. Forney, and P. Reneke, CFAST—Consolidated Model of Fire and Smoke Transport (Version 7), Volume 1: Technical Reference Guide, NIST TN 1889v1, National Institute of Standards and Technology, Gaithersburg, MD, 2019.
33. R. Peacock, G. Forney, and P. Reneke, P., CFAST—Consolidated Model of Fire and Smoke Transport (Version 7), Volume 2: User’s Guide, NIST TN 1889v2, National Institute of Standards and Technology, Gaithersburg, MD, 2019.
34. K. McGrattan, S. Hostikka, R. McDermott, J. Floyd, M. Vanella, C. Weinschenk, and K. Overholt, Fire Dynamics Simulator Technical Reference Guide Volume 1: Mathematical Model, NIST SP 1018-1, National Institute of Standards and Technology, Gaithersburg, MD, 2019.
35. K. McGrattan, S. Hostikka, R. McDermott, J. Floyd, M. Vanella, C. Weinschenk, and K. Overholt, K., Fire Dynamics Simulator User’s Guide, NIST SP 1019-1, National Institute of Standards and Technology, Gaithersburg, MD, 2019.
36. Standard for Smoke Control Systems, National Fire Protection Association, Quincy, MA, 2018. NFPA 92.
37. Nuclear Power Plant Fire Modeling Analysis Guidelines (NPP FIRE MAG), U.S. Nuclear Regulatory Commission, Washington, DC, and Electric Power Research Institute, Palo Alto, CA. November 2012: NUREG-1934 and EPRI 1023259.
38. C/VM2 Verification Method: Framework for Fire Safety Design—For New Zealand Building Code Clauses C1-C6 Protection from Fire, Ministry of Business, Innovation, and Employment, New Zealand, 2014.
39. Kerite Analysis in Thermal Environment of Fire (KATE-Fire): Test Results, U.S. Nuclear Regulatory Commission, Washington, DC: December 2011. NUREG/CR-7102.


A-1
APPENDIX A SUMMARY OF PRIOR TESTING
This appendix contains the heat release rate (HRR) and other test derived data for the experiments identified in Section 2.2.
A.1 Tests from NUREG/CR-4680
This section contains the HRR data and the test summary data for the nine tests from NUREG/CR-4680 [17] included in the distributions. Plots of the HRR also show the curve resulting from the fitting fire growth and decay parameters according to Equation 5-1 (see Figures A-1 through A-9).

Summary of Prior Testing
A-2
Figure A-1 HRR for Nowlen Test 1 (30 cm x 41 cm x 30 cm cardboard box with box of Kimwipes, 950 ml acetone, polyethylene wash bottle)
Summary details for the test are as follows:
Peak HRR (kW): 95.9 TER (MJ): 45.7 Hc (MJ/kg): 25.6
Vertical zone of influence (ZOI) (m):
SE TP KC TS TI
0.55 0.15 0.15 0.15 0.15
Vertical ZOI in a corner (m):
SE TP KC TS TI
0.95 0.30 0.25 0.25 0.25
Horizontal ZOI (m):
SE TP KC TS TI
0.70 0.15 0.10 0.05 0.05
Fire growth and decay parameters:
Growth (s) Plateau (s) Decay (s) n1 n2
149 123 1515 4.178 0.438
0
10
20
30
40
50
60
70
80
90
100
0 300 600 900 1200 1500 1800
Heat Release Rate (kW)
Time (s)
Data
Fit

Summary of Prior Testing
A-3
Figure A-2 HRR for Nowlen Test 2 (30 cm x 41 cm x 30 cm cardboard box with box of Kimwipes, 950 ml acetone, polyethylene wash bottle)
Summary details for the test are as follows:
Peak HRR (kW): 109.3 TER (MJ): 38.4 Hc (MJ/kg): 21.6
Vertical ZOI (m):
SE TP KC TS TI
2.5 0.80 0.75 0.65 0.65
Vertical ZOI in a corner (m):
SE TP KC TS TI
4.30 1.35 1.25 1.15 1.05
Horizontal ZOI (m):
SE TP KC TS TI
0.80 0.15 0.10 0.05 0.05
Fire growth and decay parameters:
Growth (s) Plateau (s) Decay (s) n1 n2
159 41 939 2.745 0.773
0
20
40
60
80
100
120
0 300 600 900 1200
Heat Release Rate (kW)
Time (s)
Data
Fit

Summary of Prior Testing
A-4
Figure A-3 HRR for Nowlen Test 3 (2.5 gal polyethylene bucket with box of Kimwipes, 950 ml acetone, polyethylene wash bottle)
Summary details for the test are as follows:
Peak HRR (kW): 142.9 TER (MJ): 71.8 Hc (MJ/kg): 33.0
Vertical ZOI (m):
SE TP KC TS TI
2.60 0.85 0.80 0.75 0.70
Vertical ZOI in a corner (m):
SE TP KC TS TI
4.50 1.45 1.40 1.25 1.25
Horizontal ZOI (m):
SE TP KC TS TI
0.65 0.20 0.15 0.05 0.05
Fire growth and decay parameters:
Growth (s) Plateau (s) Decay (s) n1 n2
487 13 2581 5.424 0.282
0
20
40
60
80
100
120
140
160
0 300 600 900 1200 1500 1800 2100 2400 2700 3000 3300
Heat Release Rate (kW)
Time (s)
Data
Fit

Summary of Prior Testing
A-5
Figure A-4 HRR for Nowlen Test 4 (2.5 gal polyethylene bucket with box of Kimwipes, 950 ml acetone, polyethylene wash bottle)
Summary details for the test are as follows:
Peak HRR (kW): 31.8 TER (MJ): 46.8 Hc (MJ/kg): 27.6
Vertical ZOI (m):
SE TP KC TS TI
2.65 0.95 0.90 0.75 0.65
Vertical ZOI in a corner (m):
SE TP KC TS TI
4.60 1.60 1.50 1.25 1.05
Horizontal ZOI (m):
SE TP KC TS TI
0.40 0.15 0.10 0.05 0.05
Fire growth and decay parameters:
Growth (s) Plateau (s) Decay (s) n1 n2
722 39 2576 0.720 0.545
0
5
10
15
20
25
30
35
0 600 1200 1800 2400 3000 3600
Heat Release Rate (kW)
Time (s)
Data
Fit

Summary of Prior Testing
A-6
Figure A-5 HRR for Nowlen Test 5 (30 cm x 41 cm x 30 cm cardboard box with computer paper and crumpled paper)
Summary details for the test are as follows:
Peak HRR (kW): 25.9 TER (MJ): 13.0 Hc (MJ/kg): 13.0
Vertical ZOI (m):
SE TP KC TS TI
0.25 0.05 0.05 0.05 0.05
Vertical ZOI in a corner (m):
SE TP KC TS TI
0.50 0.15 0.10 0.10 0.10
Horizontal ZOI (m):
SE TP KC TS TI
0.30 0.05 0.05 0.05 0.05
Fire growth and decay parameters:
Growth (s) Plateau (s) Decay (s) n1 n2
247 56 837 1.888 0.670
0
5
10
15
20
25
30
0 300 600 900 1200
Heat Release Rate (kW)
Time (s)
Data
Fit
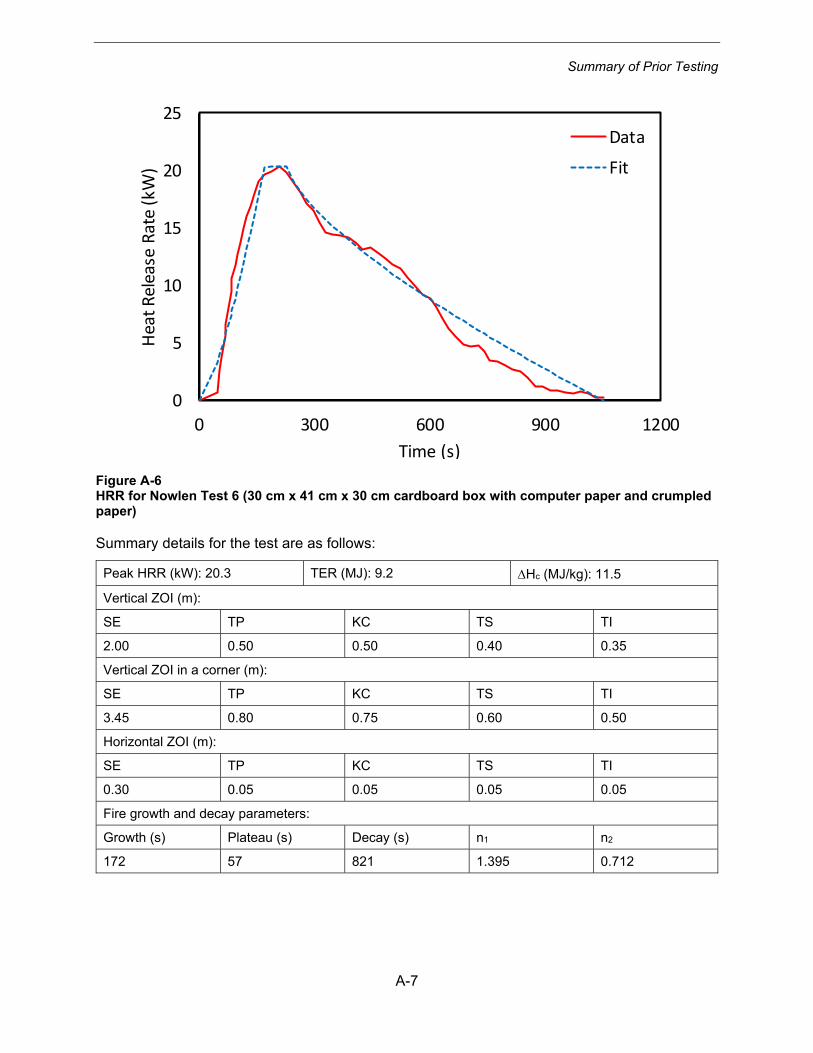
Summary of Prior Testing
A-7
Figure A-6 HRR for Nowlen Test 6 (30 cm x 41 cm x 30 cm cardboard box with computer paper and crumpled paper)
Summary details for the test are as follows:
Peak HRR (kW): 20.3 TER (MJ): 9.2 Hc (MJ/kg): 11.5
Vertical ZOI (m):
SE TP KC TS TI
2.00 0.50 0.50 0.40 0.35
Vertical ZOI in a corner (m):
SE TP KC TS TI
3.45 0.80 0.75 0.60 0.50
Horizontal ZOI (m):
SE TP KC TS TI
0.30 0.05 0.05 0.05 0.05
Fire growth and decay parameters:
Growth (s) Plateau (s) Decay (s) n1 n2
172 57 821 1.395 0.712
0
5
10
15
20
25
0 300 600 900 1200
Heat Release Rate (kW)
Time (s)
Data
Fit

Summary of Prior Testing
A-8
Figure A-7 HRR for Nowlen Test 7 (5 gal polyethylene trash can, polyethylene bag, cotton rags, paper)
Summary details for the test are as follows:
Peak HRR (kW): 10.8 TER (MJ): 25.2 Hc (MJ/kg): 31.5
Vertical ZOI (m):
SE TP KC TS TI
1.60 0.55 0.50 0.35 0.30
Vertical ZOI in a corner (m):
SE TP KC TS TI
2.70 0.90 0.75 0.60 0.45
Horizontal ZOI (m):
SE TP KC TS TI
0.20 0.05 0.05 0.05 0.05
Fire growth and decay parameters:
Growth (s) Plateau (s) Decay (s) n1 n2
907 2268 68 1.545 0.930
0
2
4
6
8
10
12
0 600 1200 1800 2400 3000 3600
Heat Release Rate (kW)
Time (s)
Data
Fit

Summary of Prior Testing
A-9
Figure A-8 HRR for Nowlen Test 8 (5 gal polyethylene trash can, polyethylene bag, cotton rags, paper)
Summary details for the test are as follows:
Peak HRR (kW): 23.9 TER (MJ): 58.5 Hc (MJ/kg): 38.0
Vertical ZOI (m):
SE TP KC TS TI
0.50 0.15 0.15 0.10 0.10
Vertical ZOI in a corner (m):
SE TP KC TS TI
0.90 0.25 0.25 0.20 0.20
Horizontal ZOI (m):
SE TP KC TS TI
0.30 0.10 0.05 0.05 0.05
Fire growth and decay parameters:
Growth (s) Plateau (s) Decay (s) n1 n2
897 2049 1088 1.060 0.673
0
5
10
15
20
25
30
0 500 1000 1500 2000 2500 3000 3500 4000 4500
Heat Release Rate (kW)
Time (s)
Data
Fit

Summary of Prior Testing
A-10
Figure A-9 HRR for Nowlen Test 9 (30 gal polyethylene trash can, polyethylene bag, cotton rags, paper)
Summary details for the test are as follows:
Peak HRR (kW): 111.5 TER (MJ): 206.3 Hc (MJ/kg): 32.1
Vertical ZOI (m):
SE TP KC TS TI
4.25 1.45 1.35 1.15 0.95
Vertical ZOI in a corner (m):
SE TP KC TS TI
7.30 2.45 2.25 1.85 1.50
Horizontal ZOI (m):
SE TP KC TS TI
0.80 0.40 0.25 0.05 0.05
Fire growth and decay parameters:
Growth (s) Plateau (s) Decay (s) n1 n2
1961 1137 1082 1.318 0.355
0
20
40
60
80
100
120
0 500 1000 1500 2000 2500 3000 3500 4000 4500
Heat Release Rate (kW)
Time (s)
Data
Fit

Summary of Prior Testing
A-11
A.2 Tests from NBSIR 85-3195
This section contains the HRR data and the test summary data for the two tests from the test report [18] included in the distributions (see Figures A-10 and A-11).
Figure A-10 HRR for Lee fabric pile test (30 cm stack of clothing ~2.7 kg)
Summary details for the test are as follows:
Peak HRR (kW): 51.8 TER (MJ): 32.9 Hc (MJ/kg): 12.2
Vertical ZOI (m):
SE TP KC TS TI
3.25 1.05 1.00 0.85 0.80
Vertical ZOI in a corner (m):
SE TP KC TS TI
5.60 1.80 1.70 1.45 1.30
Horizontal ZOI (m):
SE TP KC TS TI
0.50 0.15 0.10 0.05 0.05
Fire Growth and decay parameters:
Growth (s) Plateau (s) Decay (s) n1 n2
352 71 1005 0.854 0.907
0
10
20
30
40
50
60
0 300 600 900 1200 1500
Heat Release Rate (kW)
Time (s)
Data
Fit

Summary of Prior Testing
A-12
Figure A-11 HRR Volkinburg single airline trash bag test (one 11 gal trash bag with 12 polystyrene cups, 17 paper cups, and paper towels)
Summary details for the test are as follows:
Peak HRR (kW): 136.1 TER (MJ): 20.3 Hc (MJ/kg): 17.3
Vertical ZOI (m):
SE TP KC TS TI
4.75 1.50 1.45 1.30 1.25
Vertical ZOI in a corner (m):
SE TP KC TS TI
8.20 2.60 2.45 2.20 2.15
Horizontal ZOI (m):
SE TP KC TS TI
0.85 0.15 0.10 0.10 0.05
Note: Growth and decay parameters were not created due to the very low temporal resolution of the test data (only seven points from test start to end).
0
20
40
60
80
100
120
140
0 50 100 150 200 250 300 350
Heat Release Rate (kW)
Time (s)

Summary of Prior Testing
A-13
A.3 Tests from NUREG/CR-4679
This section contains the HRR data and the test summary data for the two tests from NUREG/CR-4679 [21] included in the distributions (see Figures A-12 and A-13).
Figure A-12 HRR for Lawson metal framed chair with foam seat test
Summary details for the test are as follows:
Peak HRR (kW): 85.5 TER (MJ): 12.9 Hc (MJ/kg): N/A
Vertical ZOI (m):
SE TP KC TS TI
2.80 0.85 0.80 0.70 0.65
Vertical ZOI in a corner (m):
SE TP KC TS TI
4.85 1.45 1.35 1.20 1.05
Horizontal ZOI (m):
SE TP KC TS TI
0.40 0.05 0.05 0.05 0.05
Fire growth and decay parameters:
Growth (s) Plateau (s) Decay (s) n1 n2
168 2 1551 1.445 0.382
0
10
20
30
40
50
60
70
80
90
0 300 600 900 1200 1500 1800
Heat Release Rate (kW)
Time (s)
Data
Fit

Summary of Prior Testing
A-14
Figure A-13 HRR for Lawson metal framed chair with fiberglass seat test
Summary details for the test are as follows:
Peak HRR (kW): 33.6 TER (MJ): 2.4 Hc (MJ/kg): N/A
Vertical ZOI (m):
SE TP KC TS TI
1.95 0.45 0.45 0.40 0.35
Vertical ZOI in a corner (m):
SE TP KC TS TI
3.30 0.75 0.70 0.60 0.55
Horizontal ZOI (m):
SE TP KC TS TI
0.25 0.05 0.05 0.05 0.05
Fire growth and decay parameters:
Growth (s) Plateau (s) Decay (s) n1 n2
38 35 516 3.991 0.174
0
5
10
15
20
25
30
35
40
0 100 200 300 400 500 600
Heat Release Rate (kW)
Time (s)
Data
Fit

Summary of Prior Testing
A-15
A.4 WPI Waste Bag Tests
This section contains the HRR data and the test summary data for the four Worcester Polytechnic Institute (WPI) waste bag tests [22] included in the distributions (see Figures A-14 through A-17).
Figure A-14 HRR for WPI quarter waste bag Test 1 (One polyethylene bag with approximately six groupings of the following: a pair of shoe covers, two balls of masking tape, four yellow gloves, two cotton gloves, and one black rubber overshoe)
Summary details for the test are as follows:
Peak HRR (kW): 256.4 TER (MJ): 82.1 Hc (MJ/kg): 27.8
Soot yield (kg/kg): 0.122
Vertical ZOI (m):
SE TP KC TS TI
5.55 1.50 1.40 1.20 1.15
Vertical ZOI in a corner (m):
SE TP KC TS TI
9.50 2.40 2.25 1.90 1.80
Horizontal ZOI (m):
SE TP KC TS TI
1.15 0.30 0.20 0.05 0.05
Fire growth and decay parameters:
Growth (s) Plateau (s) Decay (s) n1 n2
214 33 1402 2.623 0.426
0
50
100
150
200
250
300
0 300 600 900 1200 1500 1800
Heat Release Rate (kW)
Time (s)
Data
Fit
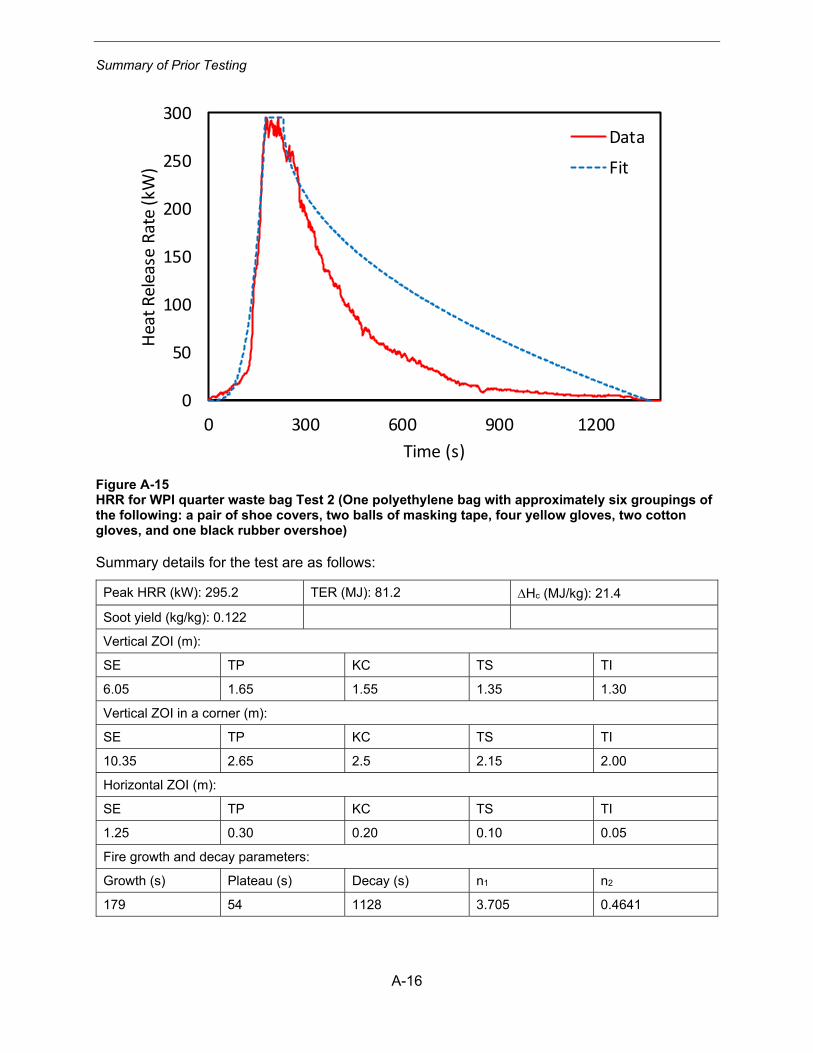
Summary of Prior Testing
A-16
Figure A-15 HRR for WPI quarter waste bag Test 2 (One polyethylene bag with approximately six groupings of the following: a pair of shoe covers, two balls of masking tape, four yellow gloves, two cotton gloves, and one black rubber overshoe)
Summary details for the test are as follows:
Peak HRR (kW): 295.2 TER (MJ): 81.2 Hc (MJ/kg): 21.4
Soot yield (kg/kg): 0.122
Vertical ZOI (m):
SE TP KC TS TI
6.05 1.65 1.55 1.35 1.30
Vertical ZOI in a corner (m):
SE TP KC TS TI
10.35 2.65 2.5 2.15 2.00
Horizontal ZOI (m):
SE TP KC TS TI
1.25 0.30 0.20 0.10 0.05
Fire growth and decay parameters:
Growth (s) Plateau (s) Decay (s) n1 n2
179 54 1128 3.705 0.4641
0
50
100
150
200
250
300
0 300 600 900 1200
Heat Release Rate (kW)
Time (s)
Data
Fit

Summary of Prior Testing
A-17
Figure A-16 HRR for WPI half waste bag Test 3 (One polyethylene bag with approximately 12 groupings of the following: a pair of shoe covers, two balls of masking tape, four yellow gloves, two cotton gloves, and one black rubber overshoe)
Summary details for the test are as follows:
Peak HRR (kW): 463.3 TER (MJ): 170.8 Hc (MJ/kg): 28.1
Soot yield (kg/kg): 0.104
Vertical ZOI (m):
SE TP KC TS TI
6.05 1.65 1.55 1.35 1.30
Vertical ZOI in a corner (m):
SE TP KC TS TI
10.35 2.65 2.5 2.15 2.00
Horizontal ZOI (m):
SE TP KC TS TI
1.25 0.30 0.20 0.10 0.05
Fire growth and decay parameters:
Growth (s) Plateau (s) Decay (s) n1 n2
235 74 1323 2.789 0.362
0
50
100
150
200
250
300
350
400
450
500
0 300 600 900 1200 1500 1800
Heat Release Rate (kW)
Time (s)
Data
Fit

Summary of Prior Testing
A-18
Figure A-17 HRR for WPI half waste bag Test 4 (One polyethylene bag with approximately 12 groupings of the following: a pair of shoe covers, two balls of masking tape, four yellow gloves, two cotton gloves, and one black rubber overshoe)
Summary details for the test are as follows:
Peak HRR (kW): 442.7 TER (MJ): 167.2 Hc (MJ/kg): 27.9
Soot yield (kg/kg): 0.100
Vertical ZOI (m):
SE TP KC TS TI
6.05 1.65 1.55 1.35 1.30
Vertical ZOI in a corner (m):
SE TP KC TS TI
10.35 2.65 2.5 2.15 2.00
Horizontal ZOI (m):
SE TP KC TS TI
1.25 0.30 0.20 0.10 0.05
Fire growth and decay parameters:
Growth (s) Plateau (s) Decay (s) n1 n2
243 62 1327 3.415 0.465
0
50
100
150
200
250
300
350
400
450
0 300 600 900 1200 1500 1800
Heat Release Rate (kW)
Time (s)
Data
Fit

B-1
APPENDIX B R SCRIPTS
This section contains the R scripts used to process data and create the PRA guidance in Sections 4 and 5. Appendix B.5 contains a brief summary of the process for creating new distributions of heat release rate (HRR), total energy release (TER), and zones of influence (ZOIs). Information about R and installation files for R can be found at https://www.r-project.org.
B.1 Script for Distributions of TER, HRR, and ZOIs
The script in this section creates empirical cumulative distribution functions for TER, HRR, and each of the ZOI categories.
It takes a comma separated value (CSV) file as input. The CSV file should have a header row with column names and a single row for each transient fire test being included in the distributions. The contents of the columns are indicated in the R script where Frequency is the integer weighting factor generated from Table 3-7, Peak HRR is the peak heat release rate, MJ is the total energy released by the fire, and the ZOI column names are H for horizontal, V for vertical, and VC for vertical in a corner. The peak HRR, TER, and ZOI values are tabulated for the 2018 testing program in Appendix B and Appendix D of Reference 9 and in Appendix A of this report for the prior testing summarized in Section 2.2.
The script outputs a file of each parameter in the input CSV file. This output file is a CSV file containing two columns where the first column is a unique data value from the parameter set and the second column is the cumulative distribution function for that data value.
To run the script, change the string for dirname to be the path to the working directory containing the CSV file of test data, and change the string for chid to the CSV filename without the “.csv” extension.
dirname<‐''C:/your path to the working directory/' chid<‐'filename' readfile<‐paste(dirname,chid,'.csv',sep="") indata=read.csv(readfile) colnames(indata)[1]<‐'Frequency' colnames(indata)[2]<‐'Peak HRR' colnames(indata)[3]<‐'MJ' colnames(indata)[4]<‐'H ZOI Sensitive (m)' colnames(indata)[5]<‐'H ZOI TP (m)' colnames(indata)[6]<‐'H ZOI Kerite (m)' colnames(indata)[7]<‐'H ZOI TS (m)' colnames(indata)[8]<‐'H ZOI Tray Ignition (m)' colnames(indata)[9]<‐'V ZOI Sensitive (m)' colnames(indata)[10]<‐'V ZOI TP (m)' colnames(indata)[11]<‐'V ZOI Kerite (m)' colnames(indata)[12]<‐'V ZOI TS (m)' colnames(indata)[13]<‐'V ZOI Tray Ignition (m)' colnames(indata)[14]<‐'VC ZOI Sensitive (m)' colnames(indata)[15]<‐'VC ZOI TP (m)'

R Scripts
B-2
colnames(indata)[16]<‐'VC ZOI Kerite (m)' colnames(indata)[17]<‐'VC ZOI TS (m)' colnames(indata)[18]<‐'VC ZOI Tray Ignition (m)' plotdata<‐rep(indata[1:nrow(indata),"Peak HRR"],indata[1:nrow(indata),"Frequency"]) fn<‐ecdf(plotdata) out1<‐unique(sort(plotdata)) out2<‐fn(out1) outdata<‐array(c(out1,out2),dim=c(length(out1),2)) outfile<‐ paste(dirname,chid,'_hrr.csv',sep="") write.csv(outdata,file=outfile) plotdata<‐rep(indata[1:nrow(indata),"MJ"],indata[1:nrow(indata),"Frequency"]) fn<‐ecdf(plotdata) out1<‐unique(sort(plotdata)) out2<‐fn(out1) outdata<‐array(c(out1,out2),dim=c(length(out1),2)) outfile<‐ paste(dirname,chid,'_mj.csv',sep="") write.csv(outdata,file=outfile) plotdata<‐rep(indata[1:nrow(indata),"H ZOI Sensitive (m)"],indata[1:nrow(indata),"Frequency"]) fn<‐ecdf(plotdata) out1<‐unique(sort(plotdata)) out2<‐fn(out1) outdata<‐array(c(out1,out2),dim=c(length(out1),2)) outfile<‐ paste(dirname,chid,'_hs.csv',sep="") write.csv(outdata,file=outfile) plotdata<‐rep(indata[1:nrow(indata),"H ZOI TP (m)"],indata[1:nrow(indata),"Frequency"]) fn<‐ecdf(plotdata) out1<‐unique(sort(plotdata)) out2<‐fn(out1) outdata<‐array(c(out1,out2),dim=c(length(out1),2)) outfile<‐ paste(dirname,chid,'_htp.csv',sep="") write.csv(outdata,file=outfile) plotdata<‐rep(indata[1:nrow(indata),"H ZOI Kerite (m)"],indata[1:nrow(indata),"Frequency"]) fn<‐ecdf(plotdata) out1<‐unique(sort(plotdata)) out2<‐fn(out1) outdata<‐array(c(out1,out2),dim=c(length(out1),2)) outfile<‐ paste(dirname,chid,'_hk.csv',sep="") write.csv(outdata,file=outfile) plotdata<‐rep(indata[1:nrow(indata),"H ZOI TS (m)"],indata[1:nrow(indata),"Frequency"]) fn<‐ecdf(plotdata) out1<‐unique(sort(plotdata)) out2<‐fn(out1) outdata<‐array(c(out1,out2),dim=c(length(out1),2)) outfile<‐ paste(dirname,chid,'_hts.csv',sep="") write.csv(outdata,file=outfile)
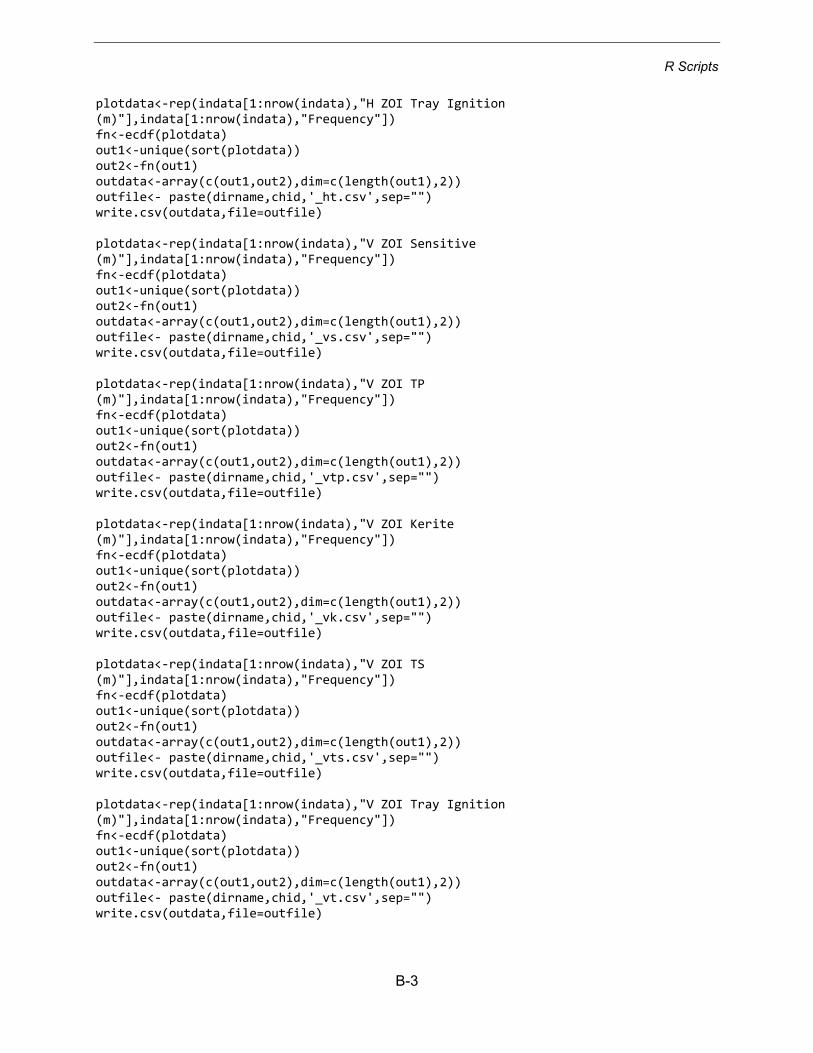
R Scripts
B-3
plotdata<‐rep(indata[1:nrow(indata),"H ZOI Tray Ignition (m)"],indata[1:nrow(indata),"Frequency"]) fn<‐ecdf(plotdata) out1<‐unique(sort(plotdata)) out2<‐fn(out1) outdata<‐array(c(out1,out2),dim=c(length(out1),2)) outfile<‐ paste(dirname,chid,'_ht.csv',sep="") write.csv(outdata,file=outfile) plotdata<‐rep(indata[1:nrow(indata),"V ZOI Sensitive (m)"],indata[1:nrow(indata),"Frequency"]) fn<‐ecdf(plotdata) out1<‐unique(sort(plotdata)) out2<‐fn(out1) outdata<‐array(c(out1,out2),dim=c(length(out1),2)) outfile<‐ paste(dirname,chid,'_vs.csv',sep="") write.csv(outdata,file=outfile) plotdata<‐rep(indata[1:nrow(indata),"V ZOI TP (m)"],indata[1:nrow(indata),"Frequency"]) fn<‐ecdf(plotdata) out1<‐unique(sort(plotdata)) out2<‐fn(out1) outdata<‐array(c(out1,out2),dim=c(length(out1),2)) outfile<‐ paste(dirname,chid,'_vtp.csv',sep="") write.csv(outdata,file=outfile) plotdata<‐rep(indata[1:nrow(indata),"V ZOI Kerite (m)"],indata[1:nrow(indata),"Frequency"]) fn<‐ecdf(plotdata) out1<‐unique(sort(plotdata)) out2<‐fn(out1) outdata<‐array(c(out1,out2),dim=c(length(out1),2)) outfile<‐ paste(dirname,chid,'_vk.csv',sep="") write.csv(outdata,file=outfile) plotdata<‐rep(indata[1:nrow(indata),"V ZOI TS (m)"],indata[1:nrow(indata),"Frequency"]) fn<‐ecdf(plotdata) out1<‐unique(sort(plotdata)) out2<‐fn(out1) outdata<‐array(c(out1,out2),dim=c(length(out1),2)) outfile<‐ paste(dirname,chid,'_vts.csv',sep="") write.csv(outdata,file=outfile) plotdata<‐rep(indata[1:nrow(indata),"V ZOI Tray Ignition (m)"],indata[1:nrow(indata),"Frequency"]) fn<‐ecdf(plotdata) out1<‐unique(sort(plotdata)) out2<‐fn(out1) outdata<‐array(c(out1,out2),dim=c(length(out1),2)) outfile<‐ paste(dirname,chid,'_vt.csv',sep="") write.csv(outdata,file=outfile)

R Scripts
B-4
plotdata<‐rep(indata[1:nrow(indata),"VC ZOI Sensitive (m)"],indata[1:nrow(indata),"Frequency"]) fn<‐ecdf(plotdata) out1<‐unique(sort(plotdata)) out2<‐fn(out1) outdata<‐array(c(out1,out2),dim=c(length(out1),2)) outfile<‐ paste(dirname,chid,'_vcs.csv',sep="") write.csv(outdata,file=outfile) plotdata<‐rep(indata[1:nrow(indata),"VC ZOI TP (m)"],indata[1:nrow(indata),"Frequency"]) fn<‐ecdf(plotdata) out1<‐unique(sort(plotdata)) out2<‐fn(out1) outdata<‐array(c(out1,out2),dim=c(length(out1),2)) outfile<‐ paste(dirname,chid,'_vctp.csv',sep="") write.csv(outdata,file=outfile) plotdata<‐rep(indata[1:nrow(indata),"VC ZOI Kerite (m)"],indata[1:nrow(indata),"Frequency"]) fn<‐ecdf(plotdata) out1<‐unique(sort(plotdata)) out2<‐fn(out1) outdata<‐array(c(out1,out2),dim=c(length(out1),2)) outfile<‐ paste(dirname,chid,'_vck.csv',sep="") write.csv(outdata,file=outfile) plotdata<‐rep(indata[1:nrow(indata),"VC ZOI TS (m)"],indata[1:nrow(indata),"Frequency"]) fn<‐ecdf(plotdata) out1<‐unique(sort(plotdata)) out2<‐fn(out1) outdata<‐array(c(out1,out2),dim=c(length(out1),2)) outfile<‐ paste(dirname,chid,'_vcts.csv',sep="") write.csv(outdata,file=outfile) plotdata<‐rep(indata[1:nrow(indata),"VC ZOI Tray Ignition (m)"],indata[1:nrow(indata),"Frequency"]) fn<‐ecdf(plotdata) out1<‐unique(sort(plotdata)) out2<‐fn(out1) outdata<‐array(c(out1,out2),dim=c(length(out1),2)) outfile<‐ paste(dirname,chid,'_vct.csv',sep="") write.csv(outdata,file=outfile)

R Scripts
B-5
B.2 Script for Histograms of Q* and Fire Elevation
The script in this section outputs the cumulative distribution functions for Q* and the fire elevation along with the associated expanded data set.
It takes two CSV files as input. The CSV file should have a header row with column names and a single row for each transient fire test being included in the distributions. The contents of the columns are indicated in the R script where Fadj is the integer weighting factor generated from Table 3-7, HRR is the peak heat release rate, and the final column is either Q* or the fire elevation (one file for each). Only include tests in each file where the applicable data exists.
The script outputs two types of files. The first type is a cumulative distribution function file. This output file is a CSV file containing two columns where the first column is a unique data value from the parameter set and the second column is the cumulative distribution function for that data value. The second type is a file containing the expanded data set with a column for peak HRR, and a column for either Q* or fire elevation. This file consists of Fadj copies of each row in the input file. For example, if Fadj for the first test was 10, the script would write 10 copies of the data for that test. This file allows one to plot one quantity against another and have best fits to the plotted data reflect the actual weight of each test. One set of files is written for both Q* and the fire elevation.
To run the script, change the string for dirname to be the path to the working directory containing the CSV file of test data, and change the string for chid to the CSV filename without the “.csv” extension.
dirname<‐'C:/your path to the working directory/' chid<‐'z filename' readfile<‐paste(dirname,chid,'.csv',sep="") indata=read.csv(readfile) colnames(indata)[1]<‐'Fadj' colnames(indata)[2]<‐'HRR' colnames(indata)[3]<‐'Z' HRRdata<‐rep(indata[1:nrow(indata),"HRR"],indata[1:nrow(indata),"Fadj"]) Zdata<‐rep(indata[1:nrow(indata),"Z"],indata[1:nrow(indata),"Fadj"]) fnZ<‐ecdf(Zdata) out1<‐unique(sort(Zdata)) out2<‐fnZ(out1) outdata<‐array(c(out1,out2),dim=c(length(out1),2)) outfile<‐ paste(dirname,chid,'_den.csv',sep="") write.csv(outdata,file=outfile) alldata <‐ array(c(HRRdata,Zdata),dim=c(length(HRRdata),2)) outfile<‐ paste(dirname,chid,'_expandeda.csv',sep="") write.csv(alldata,file=outfile) chid<‐'qstar filename' readfile<‐paste(dirname,chid,'.csv',sep="") indata=read.csv(readfile) colnames(indata)[1]<‐'Fadj' colnames(indata)[2]<‐'HRR' colnames(indata)[3]<‐'QS'

R Scripts
B-6
HRRdata<‐rep(indata[1:nrow(indata),"HRR"],indata[1:nrow(indata),"Fadj"]) QSdata<‐rep(indata[1:nrow(indata),"QS"],indata[1:nrow(indata),"Fadj"]) fnQS<‐ecdf(QSdata) out1<‐unique(sort(QSdata)) out2<‐fnQS(out1) outdata<‐array(c(out1,out2),dim=c(length(out1),2)) outfile<‐ paste(dirname,chid,'_qsa_den.csv',sep="") write.csv(outdata,file=outfile) alldata <‐ array(c(HRRdata,QSdata),dim=c(length(HRRdata),2)) outfile<‐ paste(dirname,chid,'_expandeda.csv',sep="") write.csv(alldata,file=outfile)
B.3 Script for Histograms of Heat of Combustion, Soot Yield, and CO Yield
The script in this section outputs histogram distributions and expanded data sets for HC, soot yield, and the heat of combustion.
The script takes three CSV files as input. Each CSV file should have a header row with column names and a single row for each transient fire test being included in the distributions. For each CSV file, only include tests for which the applicable data are available. The first column in each file is Fadj, which is the integer weighting factor generated from Table 3-7, and the second column in each is either HC, the soot yield, or the CO yield.
The script outputs a cumulative distribution function file for each parameter. The output files are a CSV file containing two columns where the first column is a unique data value from the parameter set and the second column is the cumulative distribution function for that data value.
To run the script, change the string for dirname to be the path to the working directory containing the CSV file of test data, and change the string for each of the three chid to the CSV filename containing the quantity being processed next without the .csv extension.
dirname<‐'C:/your path to the working directory/' chid<‐'hoc filename' readfile<‐paste(dirname,chid,'.csv',sep="") indata=read.csv(readfile) colnames(indata)[1]<‐'Fadj' colnames(indata)[2]<‐'HoC' HOCdata<‐rep(indata[1:nrow(indata),"HoC"],indata[1:nrow(indata),"Fadj"]) fnHOC<‐ecdf(HOCdata) out1<‐unique(sort(HOCdata)) out2<‐fnHOC(out1) outdata<‐array(c(out1,out2),dim=c(length(out1),2)) outfile<‐ paste(dirname,chid,'_hoc_den.csv',sep="") write.csv(outdata,file=outfile) chid<‐'co filename' readfile<‐paste(dirname,chid,'.csv',sep="") indata=read.csv(readfile) colnames(indata)[1]<‐'Fadj' colnames(indata)[2]<‐'YCO'

R Scripts
B-7
YCOdata<‐rep(indata[1:nrow(indata),"YCO"],indata[1:nrow(indata),"Fadj"]) fnCO<‐ecdf(YCOdata) out1<‐unique(sort(YCOdata)) out2<‐fnCO(out1) outdata<‐array(c(out1,out2),dim=c(length(out1),2)) outfile<‐ paste(dirname,chid,'_yco_den.csv',sep="") write.csv(outdata,file=outfile) chid<‐'ys filename' readfile<‐paste(dirname,chid,'.csv',sep="") indata=read.csv(readfile) colnames(indata)[1]<‐'Fadj' colnames(indata)[2]<‐'YS' YSdata<‐rep(indata[1:nrow(indata),"YS"],indata[1:nrow(indata),"Fadj"]) fnS<‐ecdf(YSdata) out1<‐unique(sort(YSdata)) out2<‐fnS(out1) outdata<‐array(c(out1,out2),dim=c(length(out1),2)) outfile<‐ paste(dirname,chid,'_yS_den.csv',sep="") write.csv(outdata,file=outfile)
B.4 Script for Fire Growth and Decay Parameters
The script in this section outputs the histogram distributions for fire growth and decay parameters.
The script takes a CSV file as input. The CSV file should have a header row with column names and a single row for each transient fire test being included in the distributions. For the CSV file, only include tests for which the fire growth and decay data are available. The first column in each file is Fadj, which is the integer weighting factor generated from Table 3-7; the second column in each file is HRR, which is the peak heat release rate; the third column is the TER; and the fourth through eighth columns are respectively the fire growth time, the growth exponent, the plateau length, the decay time, and the decay exponent.
The script outputs two types of files. The first type is a cumulative distribution function file for each of the five growth parameters. The output files are a CSV file containing two columns where the first column is a unique data value from the parameter set and the second column is the cumulative distribution function for that data value. The second file is a CSV file containing the expanded peak HRR, TER, and the five fire growth and decay parameters.
To run the script, change the string for dirname to be the path to the working directory containing the CSV file of test data, and change the string for chid to the CSV filename without the .csv extension.
dirname<‐'C:/your path to the working directory/' chid<‐'filename' readfile<‐paste(dirname,chid,'.csv',sep="") indata=read.csv(readfile) colnames(indata)[1]<‐'Fadj' colnames(indata)[2]<‐'HRR' colnames(indata)[3]<‐'MJ' colnames(indata)[4]<‐'Growth' colnames(indata)[5]<‐'n1'

R Scripts
B-8
colnames(indata)[6]<‐'Plateau' colnames(indata)[7]<‐'Decay' colnames(indata)[8]<‐'n2' HRRdata<‐rep(indata[1:nrow(indata),"HRR"],indata[1:nrow(indata),"Fadj"]) MJdata<‐rep(indata[1:nrow(indata),"MJ"],indata[1:nrow(indata),"Fadj"]) Grdata<‐rep(indata[1:nrow(indata),"Growth"],indata[1:nrow(indata),"Fadj"]) fnGr<‐ecdf(Grdata) out1<‐unique(sort(Grdata)) out2<‐fnGr(out1) outdata<‐array(c(out1,out2),dim=c(length(out1),2)) outfile<‐ paste(dirname,chid,'_gr_den.csv',sep="") write.csv(outdata,file=outfile) n1data<‐rep(indata[1:nrow(indata),"n1"],indata[1:nrow(indata),"Fadj"]) fnn1<‐ecdf(n1data) out1<‐unique(sort(n1data)) out2<‐fnn1(out1) outdata<‐array(c(out1,out2),dim=c(length(out1),2)) outfile<‐ paste(dirname,chid,'_n1_den.csv',sep="") write.csv(outdata,file=outfile) Pldata<‐rep(indata[1:nrow(indata),"Plateau"],indata[1:nrow(indata),"Fadj"]) fnPl<‐ecdf(Pldata) out1<‐unique(sort(Pldata)) out2<‐fnPl(out1) outdata<‐array(c(out1,out2),dim=c(length(out1),2)) outfile<‐ paste(dirname,chid,'_pl_den.csv',sep="") write.csv(outdata,file=outfile) Dedata<‐rep(indata[1:nrow(indata),"Decay"],indata[1:nrow(indata),"Fadj"]) fnDe<‐ecdf(Dedata) out1<‐unique(sort(Dedata)) out2<‐fnDe(out1) outdata<‐array(c(out1,out2),dim=c(length(out1),2)) outfile<‐ paste(dirname,chid,'_de_den.csv',sep="") write.csv(outdata,file=outfile) n2data<‐rep(indata[1:nrow(indata),"n2"],indata[1:nrow(indata),"Fadj"]) fnn2<‐ecdf(n2data) out1<‐unique(sort(n2data)) out2<‐fnn2(out1) outdata<‐array(c(out1,out2),dim=c(length(out1),2)) outfile<‐ paste(dirname,chid,'_n2_den.csv',sep="") write.csv(outdata,file=outfile) alldata <‐ array(c(HRRdata,MJdata,Grdata,n1data,Pldata,Dedata,n2data),dim=c(length(n2data),7)) outfile<‐ paste(dirname,chid,'_expanded_shape.csv',sep="") write.csv(alldata,file=outfile)
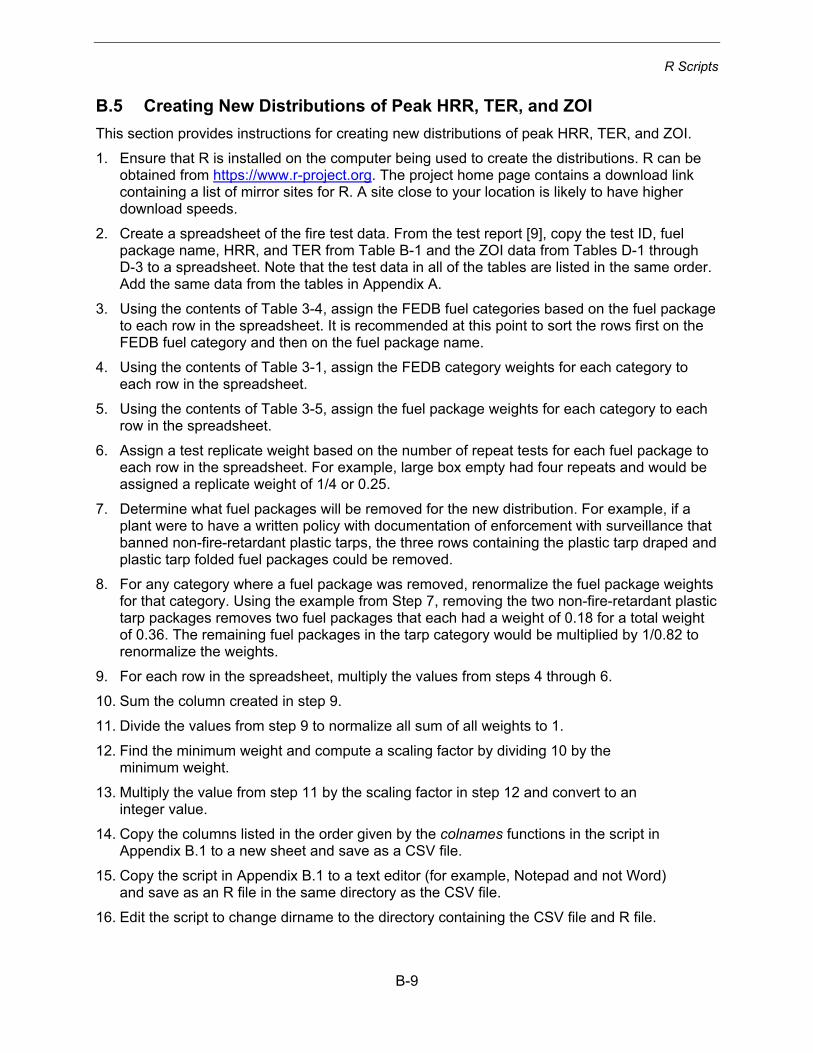
R Scripts
B-9
B.5 Creating New Distributions of Peak HRR, TER, and ZOI
This section provides instructions for creating new distributions of peak HRR, TER, and ZOI.
1. Ensure that R is installed on the computer being used to create the distributions. R can be obtained from https://www.r-project.org. The project home page contains a download link containing a list of mirror sites for R. A site close to your location is likely to have higher download speeds.
2. Create a spreadsheet of the fire test data. From the test report [9], copy the test ID, fuel package name, HRR, and TER from Table B-1 and the ZOI data from Tables D-1 through D-3 to a spreadsheet. Note that the test data in all of the tables are listed in the same order. Add the same data from the tables in Appendix A.
3. Using the contents of Table 3-4, assign the FEDB fuel categories based on the fuel package to each row in the spreadsheet. It is recommended at this point to sort the rows first on the FEDB fuel category and then on the fuel package name.
4. Using the contents of Table 3-1, assign the FEDB category weights for each category to each row in the spreadsheet.
5. Using the contents of Table 3-5, assign the fuel package weights for each category to each row in the spreadsheet.
6. Assign a test replicate weight based on the number of repeat tests for each fuel package to each row in the spreadsheet. For example, large box empty had four repeats and would be assigned a replicate weight of 1/4 or 0.25.
7. Determine what fuel packages will be removed for the new distribution. For example, if a plant were to have a written policy with documentation of enforcement with surveillance that banned non-fire-retardant plastic tarps, the three rows containing the plastic tarp draped and plastic tarp folded fuel packages could be removed.
8. For any category where a fuel package was removed, renormalize the fuel package weights for that category. Using the example from Step 7, removing the two non-fire-retardant plastic tarp packages removes two fuel packages that each had a weight of 0.18 for a total weight of 0.36. The remaining fuel packages in the tarp category would be multiplied by 1/0.82 to renormalize the weights.
9. For each row in the spreadsheet, multiply the values from steps 4 through 6.
10. Sum the column created in step 9.
11. Divide the values from step 9 to normalize all sum of all weights to 1.
12. Find the minimum weight and compute a scaling factor by dividing 10 by the minimum weight.
13. Multiply the value from step 11 by the scaling factor in step 12 and convert to an integer value.
14. Copy the columns listed in the order given by the colnames functions in the script in Appendix B.1 to a new sheet and save as a CSV file.
15. Copy the script in Appendix B.1 to a text editor (for example, Notepad and not Word) and save as an R file in the same directory as the CSV file.
16. Edit the script to change dirname to the directory containing the CSV file and R file.

R Scripts
B-10
17. Edit the script to change chid to the name of the CSV file without the .csv extension (that is, datafile and not datafile.csv).
18. Run R.
19. Load the script into R by doing File->Open Script.
20. In the script window, type crtl-A to select the entire script. Then, right click and select run.
21. The script will execute and create a series of files containing the empirical cumulative distribution functions. Load each file into Excel, and determine the 50th and 98th percentile for the peak HRR, TER, and the ZOIs.
22. Use Excel to fit a gamma distribution to the percentiles. This can be done by using the gamma distribution parameters in this report to compute the 50th and 98th percentiles for each parameter and then summing the squares of the percent differences between the data percentiles and the distribution percentiles for each parameter. The Excel Solver function can now be used to find the minimum sum of the squares by solving for the gamma distribution parameters.

C-1
APPENDIX C TEST WEIGHTING DATA
This appendix contains the inputs used to develop the individual test weights in Section 3.
C.1 FEDB Category Weights
Tables C-1 through C-3 contain the independent weightings of fire events database (FEDB) data used to develop the distributions shown in Sections 4 and the detailed modeling input data in Section 5. Table C-1 is for all events, Table C-2 is for hot work events only, and Table C-3 is for non-hot work events. Each individual assessor was provided a list of FEDB events and the list of FEDB categories shown in the tables. Each event was assigned to a single category with the total number in each category used to determine the fraction weights shown in the tables. The tables show the list of categories, each independent assessment, the average assessment, and the variance. All of the quantities are in terms of the total weighted fraction—for example in Table C-1 the average and deviation for the absorbent pad category would be 0.95 ± 0.35%. Note that the unknown category was uniformly distributed over the other categories when creating the tables shown in Section 3.
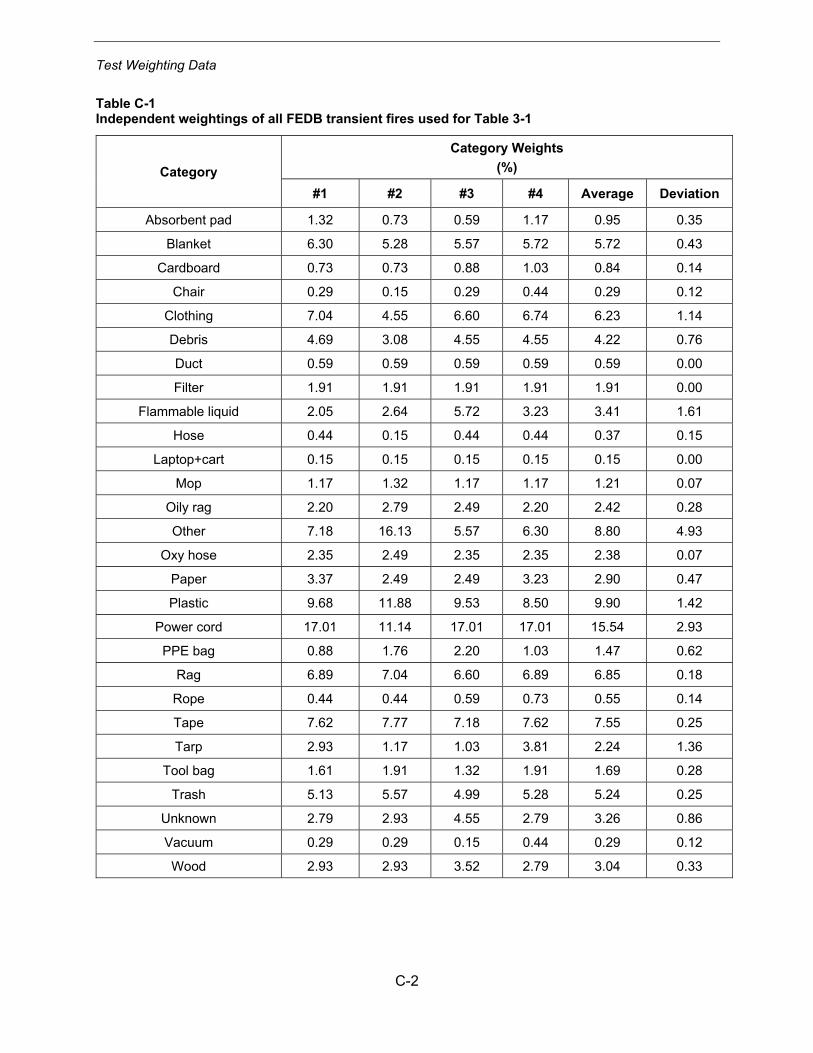
Test Weighting Data
C-2
Table C-1 Independent weightings of all FEDB transient fires used for Table 3-1
Category
Category Weights
(%)
#1 #2 #3 #4 Average Deviation
Absorbent pad 1.32 0.73 0.59 1.17 0.95 0.35
Blanket 6.30 5.28 5.57 5.72 5.72 0.43
Cardboard 0.73 0.73 0.88 1.03 0.84 0.14
Chair 0.29 0.15 0.29 0.44 0.29 0.12
Clothing 7.04 4.55 6.60 6.74 6.23 1.14
Debris 4.69 3.08 4.55 4.55 4.22 0.76
Duct 0.59 0.59 0.59 0.59 0.59 0.00
Filter 1.91 1.91 1.91 1.91 1.91 0.00
Flammable liquid 2.05 2.64 5.72 3.23 3.41 1.61
Hose 0.44 0.15 0.44 0.44 0.37 0.15
Laptop+cart 0.15 0.15 0.15 0.15 0.15 0.00
Mop 1.17 1.32 1.17 1.17 1.21 0.07
Oily rag 2.20 2.79 2.49 2.20 2.42 0.28
Other 7.18 16.13 5.57 6.30 8.80 4.93
Oxy hose 2.35 2.49 2.35 2.35 2.38 0.07
Paper 3.37 2.49 2.49 3.23 2.90 0.47
Plastic 9.68 11.88 9.53 8.50 9.90 1.42
Power cord 17.01 11.14 17.01 17.01 15.54 2.93
PPE bag 0.88 1.76 2.20 1.03 1.47 0.62
Rag 6.89 7.04 6.60 6.89 6.85 0.18
Rope 0.44 0.44 0.59 0.73 0.55 0.14
Tape 7.62 7.77 7.18 7.62 7.55 0.25
Tarp 2.93 1.17 1.03 3.81 2.24 1.36
Tool bag 1.61 1.91 1.32 1.91 1.69 0.28
Trash 5.13 5.57 4.99 5.28 5.24 0.25
Unknown 2.79 2.93 4.55 2.79 3.26 0.86
Vacuum 0.29 0.29 0.15 0.44 0.29 0.12
Wood 2.93 2.93 3.52 2.79 3.04 0.33
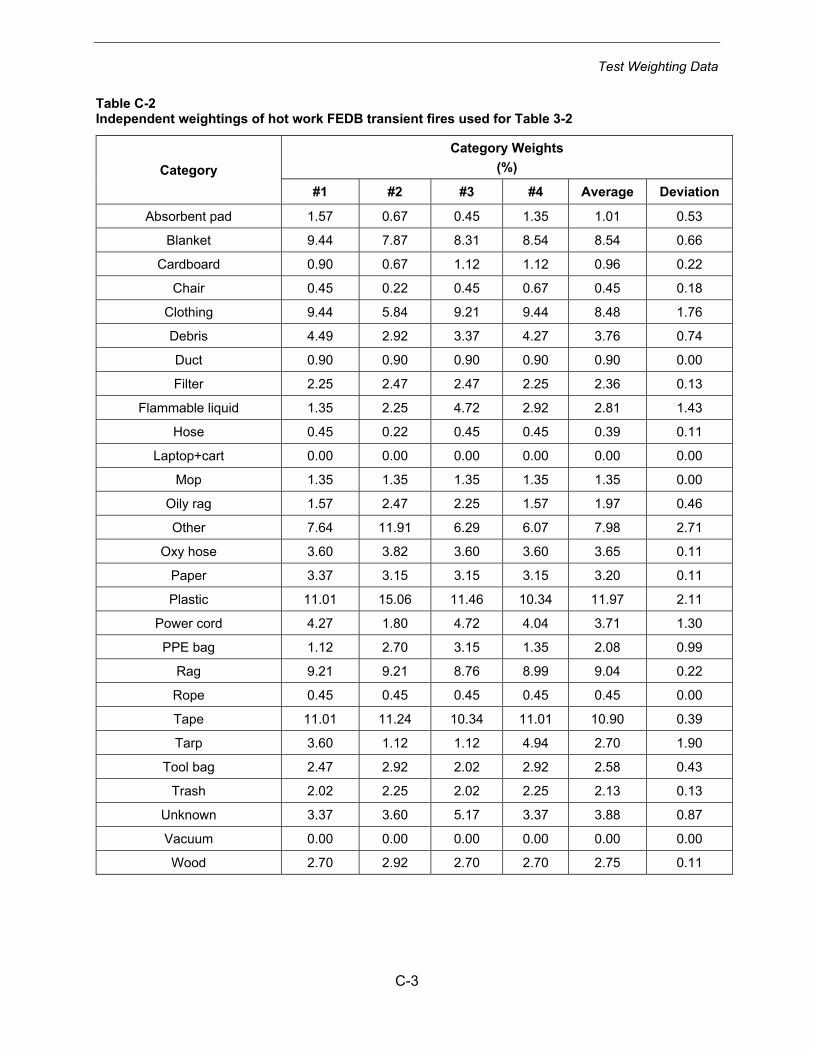
Test Weighting Data
C-3
Table C-2 Independent weightings of hot work FEDB transient fires used for Table 3-2
Category
Category Weights
(%)
#1 #2 #3 #4 Average Deviation
Absorbent pad 1.57 0.67 0.45 1.35 1.01 0.53
Blanket 9.44 7.87 8.31 8.54 8.54 0.66
Cardboard 0.90 0.67 1.12 1.12 0.96 0.22
Chair 0.45 0.22 0.45 0.67 0.45 0.18
Clothing 9.44 5.84 9.21 9.44 8.48 1.76
Debris 4.49 2.92 3.37 4.27 3.76 0.74
Duct 0.90 0.90 0.90 0.90 0.90 0.00
Filter 2.25 2.47 2.47 2.25 2.36 0.13
Flammable liquid 1.35 2.25 4.72 2.92 2.81 1.43
Hose 0.45 0.22 0.45 0.45 0.39 0.11
Laptop+cart 0.00 0.00 0.00 0.00 0.00 0.00
Mop 1.35 1.35 1.35 1.35 1.35 0.00
Oily rag 1.57 2.47 2.25 1.57 1.97 0.46
Other 7.64 11.91 6.29 6.07 7.98 2.71
Oxy hose 3.60 3.82 3.60 3.60 3.65 0.11
Paper 3.37 3.15 3.15 3.15 3.20 0.11
Plastic 11.01 15.06 11.46 10.34 11.97 2.11
Power cord 4.27 1.80 4.72 4.04 3.71 1.30
PPE bag 1.12 2.70 3.15 1.35 2.08 0.99
Rag 9.21 9.21 8.76 8.99 9.04 0.22
Rope 0.45 0.45 0.45 0.45 0.45 0.00
Tape 11.01 11.24 10.34 11.01 10.90 0.39
Tarp 3.60 1.12 1.12 4.94 2.70 1.90
Tool bag 2.47 2.92 2.02 2.92 2.58 0.43
Trash 2.02 2.25 2.02 2.25 2.13 0.13
Unknown 3.37 3.60 5.17 3.37 3.88 0.87
Vacuum 0.00 0.00 0.00 0.00 0.00 0.00
Wood 2.70 2.92 2.70 2.70 2.75 0.11

Test Weighting Data
C-4
Table C-3 Independent weightings of non-hot work FEDB transient fires used for Table 3-3
Category
Category Weights
(%)
#1 #2 #3 #4 Average Deviation
Absorbent pad 0.84 0.84 0.84 1.35 0.84 0.00
Blanket 0.42 0.42 0.42 8.54 0.42 0.00
Cardboard 0.42 0.84 0.42 1.12 0.63 0.24
Chair 0.00 0.00 0.00 0.67 0.00 0.00
Clothing 2.53 2.11 1.69 9.44 2.00 0.40
Debris 5.06 3.38 6.75 4.27 5.06 1.38
Duct 0.00 0.00 0.00 0.90 0.00 0.00
Filter 1.27 0.84 0.84 2.25 1.05 0.24
Flammable liquid 3.38 3.38 7.59 2.92 4.54 2.05
Hose 0.42 0.00 0.42 0.45 0.32 0.21
Laptop+cart 0.42 0.42 0.42 0.00 0.42 0.00
Mop 0.84 1.27 0.84 1.35 0.95 0.21
Oily rag 3.38 3.38 2.95 1.57 3.27 0.21
Other 6.33 24.05 4.22 6.07 10.34 9.21
Oxy hose 0.00 0.00 0.00 3.60 0.00 0.00
Paper 3.38 1.27 1.27 3.15 2.32 1.22
Plastic 7.17 5.91 5.91 10.34 6.01 0.87
Power cord 40.93 28.69 40.08 4.04 37.76 6.07
PPE bag 0.42 0.00 0.42 1.35 0.32 0.21
Rag 2.53 2.95 2.53 8.99 2.74 0.24
Rope 0.42 0.42 0.84 0.45 0.74 0.40
Tape 1.27 1.27 1.27 11.01 1.27 0.00
Tarp 1.69 1.27 0.84 4.94 1.37 0.40
Tool bag 0.00 0.00 0.00 2.92 0.00 0.00
Trash 10.97 11.81 10.55 2.25 11.08 0.53
Unknown 1.69 1.69 3.38 3.37 2.11 0.84
Vacuum 0.84 0.84 0.42 0.00 0.84 0.34
Wood 3.38 2.95 5.06 2.70 3.59 1.00

Test Weighting Data
C-5
C.2 Results of Independent Assessments of Fuel Package Category and Weights
Table C-4 through C-7 show the four individual assignments of fuel packages to FEDB categories along with the weighting. The tables are organized by category. Note that weights in each fuel category may not sum to 1 due to rounding.
Table C-4 First independent assigning of fuel packages to FEDB fuel category and category weighting
Category Fuel Package Weight Category Fuel Package Weight
Absorbent pad
Four oil pads 0.250
Power Cord
15.2 m coil 120 V cord 0.167
Four oil pads with oil 0.250 3.0 m coil 120 V cord 0.167
Single oil pad 0.250 7.6 m coil 120 V cord 0.167
Single oil pad with oil 0.250 7.6 m coil 250 V cord 0.167
Blanket Welding blanket draped 0.500 Power spider 0.167
Welding blanket folded 0.500 Uncoiled 120 V cord 0.167
Cardboard
Large box empty 0.100
PPE bag
Scissor stand full 0.200
Large box with peanuts 0.100 Scissor stand half 0.100
Medium box empty 0.250 Scissor stand quarter 0.100
Medium box with peanuts
0.250 Single PPE 0.100
Small box empty 0.150 Stack PPE 0.100
Small box with peanuts 0.150 WPI half bag 0.200
Chair
Lawson Test 51 0.100 WPI quarter bag 0.200
Lawson Test 56 0.100
Rag
Five rags 0.333
Metal chair 0.700 Bag of rags 0.333
Plastic chair 0.100 Single rag 0.333
Clothing NBS—Lee fabric 1.000
Rope
15.2 m coil large rope 0.167
Debris Bucket with debris 0.500 15.2 m coil small rope 0.167
Debris pile 0.500 7.6 m coil large rope 0.167
Duct Blower duct 1.000 7.6 m coil small rope 0.167
Filter Heating, ventilation, and air conditioning (HVAC) filter
1.000 Uncoiled large rope 0.167
Flammable Liquid
Alcohol bottle 0.250 Uncoiled small rope 0.167
Oil bottle 0.750 Tape
Duct tape roll 0.500
Hose Water hose 1.000 Duct tape wall 0.167

Test Weighting Data
C-6
Table C-4 First independent assigning of fuel packages to FEDB fuel category and category weighting (continued)
Category Fuel Package Weight Category Fuel Package Weight
Laptop+cart Laptop+cart 1.000
Long duct tape air 0.167
Mop Mop+bucket 1.000 Short duct tape air 0.167
Oily rag
Five rags with heptane 0.250
Tarp
Canvas tarp draped 0.167
Rags with oil 0.250 Canvas tarp folded 0.167
Single rag with heptane 0.500 Fire-retardant plastic tarp draped
0.167
Other
Laptop 0.167 Fire-retardant plastic tarp folded
0.167
SNL—Nowlen Tests 1, 2
0.167 Plastic tarp draped 0.167
SNL—Nowlen Tests 3, 4
0.167 Plastic tarp folded 0.167
Tablet 0.167 Tool Bag Tool bag 1.000
Tablet+metal case 0.167
Trash
LBL—Volkinburg one airline bag
0.111
Tablet+plastic case 0.167 Metal trash full 0.111
Oxy hose Oxy-acetylene hose 1.000 Metal trash full lid 0.111
Paper
Cardstock air 0.080 Metal trash half 0.111
Cardstock wall 0.200 Metal trash quarter 0.111
Large binder closed 0.080 Plastic trash full 0.111
Large binder open 0.080 Plastic trash half 0.111
Large box with paper 0.050 Plastic trash quarter 0.111
Medium box with paper 0.050 SNL—Nowlen Tests 7 ,8 0.111
Pad of paper 0.200 Vacuum
Vacuum closed 0.750
Small binder closed 0.080 Vacuum open 0.250
Small binder open 0.080
Wood
Pallet flame 0.167
Small box with paper 0.050 Pallet panel 0.167
SNL—Nowlen Tests 5, 6
0.050 Plank flame 0.167

Test Weighting Data
C-7
Table C-4 First independent assigning of fuel packages to FEDB fuel category and category weighting (continued)
Category Fuel Package Weight Category Fuel Package Weight
Plastic
15.2 m coil chain 0.077
Plank panel 0.167
15.2 m coil tubing 0.077 Wood block flame 0.167
Four cones 0.077 Wood block panel 0.167
7.6 m coil chain 0.077
7.6 m coil tubing 0.077
Empty bucket 0.077
First aid kit 0.077
Lift slings 0.0769
Plastic stanchion 0.0769
Single cone 0.0769
SNL—Nowlen Test 9 0.0769
Uncoiled chain 0.0769
Uncoiled tubing 0.0769

Test Weighting Data
C-8
Table C-5 Second independent assigning of fuel packages to FEDB fuel category and category weighting
Category Fuel Package Weight Category Fuel Package Weight
Absorbent pad
Four oil pads 0.600
Power Cord
15.2 m coil 120 V cord 0.100
Single oil pad 0.400 3.0 m coil 120 V cord 0.200
Blanket Welding blanket draped 0.500 7.6 m coil 120 V cord 0.300
Welding blanket folded 0.500 7.6 m coil 250 V cord 0.100
Cardboard
Large box empty 0.100 Power spider 0.200
Large box with paper 0.100 Uncoiled 120 V cord 0.100
Large box with peanuts 0.100 PPE bag Stack PPE 1.000
Medium box empty 0.200
Rag
Five rags 0.400
Medium box with paper 0.100 Bag of rags 0.400
Medium box with peanuts
0.050 Single rag 0.200
Small box empty 0.100
Rope
15.2 m coil large rope 0.200
Small box with paper 0.100 15.2 m coil small rope 0.200
Small box with peanuts 0.050 7.6 m coil large rope 0.200
SNL—Nowlen Tests 5, 6 0.100 7.6 m coil small rope 0.200
Chair
Lawson Test 51 0.200 Uncoiled large rope 0.100
Lawson Test 56 0.300 Uncoiled small rope 0.100
Metal chair 0.300
Tape
Duct tape roll 0.300
Plastic chair 0.200 Duct tape wall 0.300
Clothing NBS—Lee fabric 0.400 Long duct tape air 0.200
Single PPE 0.600 Short duct tape air 0.200
Debris Bucket with debris 0.600
Tarp
Canvas tarp draped 0.200
Debris pile 0.400 Canvas tarp folded 0.100
Duct Blower duct 1.000 Fire-retardant plastic tarp draped
0.300
Filter HVAC filter 1.000 Fire-retardant plastic tarp folded
0.100

Test Weighting Data
C-9
Table C-5 Second independent assigning of fuel packages to FEDB fuel category and category weighting (continued)
Category Fuel Package Weight Category Fuel Package Weight
Flammable liquid
Alcohol bottle 0.300
Plastic tarp draped 0.200
Oil bottle 0.300 Plastic tarp folded 0.100
SNL—Nowlen Tests 1, 2 0.200 Tool Bag Tool bag 1.000
SNL—Nowlen Tests 3, 4 0.200
Trash
LBL—Volkinburg one airline bag
0.100
Hose Water hose 1.000 Metal trash full 0.100
Laptop+cart Laptop+cart 1.000 Metal trash full lid 0.100
Mop Mop+bucket 1.000 Metal trash half 0.100
Oily rag
Four oil pads with oil 0.100 Metal trash quarter 0.100
Five rags with heptane 0.300 Plastic trash full 0.050
Rags with oil 0.200 Plastic trash half 0.050
Single oil pad with oil 0.200 Plastic trash quarter 0.050
Single rag with heptane 0.200 Scissor stand full 0.050
Other
Laptop 0.200 Scissor stand half 0.050
Lift slings 0.100 Scissor stand quarter 0.050
Tablet 0.300 SNL—Nowlen Tests 7, 8 0.050
Tablet+metal case 0.200 SNL—Nowlen Test 9 0.050
Tablet+plastic case 0.200 WPI half bag 0.050
Oxy hose Oxy-acetylene hose 1.000 WPI quarter bag 0.050
Paper
Cardstock air 0.050 Vacuum
Vacuum closed 0.500
Cardstock wall 0.050 Vacuum open 0.500
Large binder closed 0.200
Wood
Pallet flame 0.200
Large binder open 0.200 Pallet panel 0.200
Pad of paper 0.200 Plank flame 0.300
Small binder closed 0.150 Plank panel 0.050
Small binder open 0.150 Wood block flame 0.200

Test Weighting Data
C-10
Table C-5 Second independent assigning of fuel packages to FEDB fuel category and category weighting (continued)
Category Fuel Package Weight Category Fuel Package Weight
Plastic
15.2 m coil chain 0.050 Wood block panel 0.050
15.2 m coil tubing 0.050
Four cones 0.200
7.6 m coil chain 0.050
7.6 m coil tubing 0.050
Empty bucket 0.100
First aid kit 0.150
Plastic stanchion 0.050
Single cone 0.200
Uncoiled chain 0.050
Uncoiled tubing 0.050

Test Weighting Data
C-11
Table C-6 Third independent assigning of fuel packages to FEDB fuel category and category weighting
Category Fuel Package Weight Category Fuel Package Weight
Absorbent pad
Four oil pads 0.250
Power cord
15.2 m coil 120 V cord 0.250
Four oil pads with oil 0.250 3.0 m coil 120 V cord 0.125
Single oil pad 0.250 7.6 m coil 120 V cord 0.125
Single oil pad with oil 0.250 7.6 m coil 250 V cord 0.125
Blanket Welding blanket draped 0.500 Power spider 0.125
Welding blanket folded 0.500 Uncoiled 120 V cord 0.250
Cardboard
Large box empty 0.111
PPE bag
Scissor stand full 0.143
Large box with paper 0.111 Scissor stand half 0.143
Large box with peanuts 0.111 Scissor stand quarter 0.143
Medium box empty 0.111 Single PPE 0.143
Medium box with paper 0.111 Stack PPE 0.143
Medium box with peanuts
0.111 WPI half bag 0.143
Small box empty 0.111 WPI quarter bag 0.143
Small box with paper 0.111
Rag
Five rags 0.333
Small box with peanuts 0.111 Bag of rags 0.333
Chair
Lawson Test 51 0.100 Single rag 0.333
Lawson Test 56 0.200
Rope
15.2 m coil large rope 0.167
Metal chair 0.600 15.2 m coil small rope 0.167
Plastic chair 0.100 7.6 m coil large rope 0.167
Clothing NBS—Lee fabric 0.333 7.6 m coil small rope 0.167
Lift slings 0.667 Uncoiled large rope 0.167
Debris Bucket with debris 0.500 Uncoiled small rope 0.167
Debris pile 0.500
Tape
Duct tape roll 0.250
Duct Blower duct 1.000 Duct tape wall 0.250
Filter HVAC filter 1.000 Long duct tape air 0.250
Flammable liquid
Alcohol bottle 0.500 Short duct tape air 0.250
Oil bottle 0.500 Tarp Canvas tarp draped 0.0625

Test Weighting Data
C-12
Table C-6 Third independent assigning of fuel packages to FEDB fuel category and category weighting (continued)
Category Fuel Package Weight Category Fuel Package Weight
Hose
15.2 m coil tubing 0.333
Canvas tarp folded 0.0625
7.6 m coil tubing 0.333 Fire-retardant plastic tarp draped
0.250
Uncoiled tubing 0.333 Fire-retardant plastic tarp folded
0.250
Laptop+cart
Laptop 0.200 Plastic tarp draped 0.1875
Laptop+cart 0.200 Plastic tarp folded 0.1875
Tablet 0.200 Tool Bag Tool bag 1.000
Tablet+metal case 0.200
Trash
LBL—Volkinburg one airline bag
0.100
Tablet+plastic case 0.200 Metal trash full 0.050
Mop Mop+bucket 1.000 Metal trash full lid 0.100
Oily rag
Five rags with heptane 0.333 Metal trash half 0.050
Rags with oil 0.333 Metal trash quarter 0.050
Single rag with heptane 0.333 Plastic trash full 0.050
Oxy hose Oxy-acetylene hose 1.000 Plastic trash half 0.050
Paper
Cardstock air 0.050 Plastic trash quarter 0.050
Cardstock wall 0.050 SNL—Nowlen Tests 1, 2 0.100
Large binder closed 0.200 SNL—Nowlen Tests 3, 4 0.100
Large binder open 0.200 SNL—Nowlen Tests 5, 6 0.100
Pad of paper 0.100 SNL—Nowlen Tests 7, 8 0.100
Small binder closed 0.200 SNL—Nowlen Test 9 0.100
Small binder open 0.200 Vacuum
Vacuum closed 0.500
Plastic
15.2 m coil chain 0.150 Vacuum open 0.500
Four cones 0.050
Wood
Pallet flame 0.166
7.6 m coil chain 0.150 Pallet panel 0.166
Empty bucket 0.100 Plank flame 0.166
First aid kit 0.050 Plank panel 0.167
Plastic stanchion 0.250 Wood block flame 0.167
Single cone 0.100 Wood block panel 0.167
Uncoiled chain 0.100
Water hose 0.050

Test Weighting Data
C-13
Table C-7 Fourth independent assigning of fuel packages to FEDB fuel category and category weighting
Category Fuel Package Weight Category Fuel Package Weight
Absorbent pad
Four oil pads 0.200
Plastic
15.2 m coil tubing 0.067
Four oil pads with oil 0.300 Four cones 0.067
Single oil pad 0.100 7.6 m coil tubing 0.067
Single oil pad with oil 0.400 Empty bucket 0.150
Blanket Welding blanket draped 0.500 Lift slings 0.067
Welding blanket folded 0.500 Plastic stanchion 0.450
Cardboard
Large box empty 0.133 Single cone 0.067
Large box with paper 0.133 Uncoiled tubing 0.067
Large box with peanuts 0.133
Power cord
15.2 m coil 120 V cord 0.200
Medium box empty 0.133 3.0 m coil 120 V cord 0.200
Medium box with paper 0.133 7.6 m coil 120 V cord 0.200
Medium box with peanuts
0.133 7.6 m coil 250 V cord 0.200
Small box empty 0.050 Uncoiled 120 V cord 0.200
Small box with paper 0.050
PPE bag
Scissor stand full 0.100
Small box with peanuts 0.050 Scissor stand half 0.200
SNL—Nowlen Tests 5,6 0.050 Scissor stand quarter 0.400
Chair
Lawson Test 51 0.300 WPI half bag 0.100
Lawson Test 56 0.300 WPI quarter bag 0.200
Metal chair 0.300
Rag
Five rags 0.333
Plastic chair 0.100 Bag of rags 0.333
Clothing
NBS—Lee fabric 0.125 Single rag 0.333
Single PPE 0.750
Rope
15.2 m coil chain 0.040
Stack PPE 0.125 15.2 m coil large rope 0.040
Debris Bucket with debris 0.500 15.2 m coil small rope 0.040
Debris pile 0.500 7.6 m coil chain 0.200
Duct Blower duct 1.000 7.6 m coil large rope 0.040
Filter HVAC filter 1.000 7.6 m coil small rope 0.040
Flammable liquid
Alcohol bottle 0.800 Uncoiled chain 0.200
Oil bottle 0.200 Uncoiled large rope 0.200
Hose Water hose 1.000 Uncoiled small rope 0.200

Test Weighting Data
C-14
Table C-7 Fourth independent assigning of fuel packages to FEDB fuel category and category weighting (continued)
Category Fuel Package Weight Category Fuel Package Weight
Laptop+cart Laptop+cart 1.000
Tape
Duct tape roll 0.200
Mop Mop+bucket 1.000 Duct tape wall 0.400
Oily rag
Five rags with heptane 0.333 Long duct tape air 0.200
Rags with oil 0.333 Short duct tape air 0.200
Single rag with heptane 0.333
Tarp
Canvas tarp draped 0.050
Other
First aid kit 0.125 Canvas tarp folded 0.025
Laptop 0.125 Fire-retardant plastic tarp draped
0.250
Power spider 0.125 Fire-retardant plastic tarp folded
0.250
SNL—Nowlen Tests 1, 2
0.125 Plastic tarp draped 0.325
SNL—Nowlen Tests 3, 4
0.125 Plastic tarp folded 0.100
Tablet 0.125 Tool Bag Tool bag 1.000
Tablet+metal case 0.125
Trash
LBL—Volkinburg one airline bag
0.050
Tablet+plastic case 0.125 Metal trash full 0.100
Oxy hose Oxy-acetylene hose 1.000 Metal trash full lid 0.500
Paper
Cardstock air 0.143 Metal trash half 0.100
Cardstock wall 0.143 Metal trash quarter 0.100
Large binder closed 0.143 Plastic trash full 0.017
Large binder open 0.143 Plastic trash half 0.033
Pad of paper 0.143 Plastic trash quarter 0.033
Small binder closed 0.143 SNL—Nowlen Tests 7, 8 0.050
Small binder open 0.143 SNL—Nowlen Test 9 0.017
Vacuum Vacuum closed 0.950
Vacuum open 0.050
Wood
Pallet flame 0.167
Pallet panel 0.167
Plank flame 0.167
Plank panel 0.167
Wood block flame 0.167
Wood block panel 0.167

Test Weighting Data
C-15
C.3 Voting Results for Transient Combustible Control Location
Table C-8 shows the results of voting for which test fuel packages to include in the transient combustible control location (TCCL) distribution by the members of the working group. The table contains the list of test fuel packages and the total number of votes for that package not being present in the distribution for both rounds of voting. Additionally, the table shows which packages were not included (indicated by an X).
Table C-8 Total number votes (max of 4 Round 1, max of 5 Round 2) that a fuel package is not in a TCCL
Fuel Package
Votes
Fuel Package
Votes
Round 1
Round 2
Final Round
1 Round
2 Final
15.2 m coil 120 V cord 0 0 Oil bottle 1 0
15.2 m coil chain 0 1 Oxy-acetylene hose 3 5 X
15.2 m coil large rope 1 1 Pad of paper 0 0
15.2 m coil small rope 1 0 Pallet flame 3 5 X
15.2 m coil tubing 2 3 Pallet panel 3 5 X
3 m coil 120 V cord 0 0 Plank flame 2 5 X
Four cones 2 3 X Plank panel 2 5 X
Four oil pads 4 5 X Plastic chair 4 4 X
Four oil pads with oil 4 5 X Plastic stanchion 1 0
Five rags 1 1 Plastic tarp draped 4 5 X
Five rags with heptane 3 4 X Plastic tarp folded 1 0
7.6 m coil 120 V cord 0 0 Plastic trash full 3 5 X
7.6 m coil 250 V cord 0 0 Plastic trash half 3 5 X
7.6 m coil chain 0 0 Plastic trash quarter 3 5 X
7.6 m coil large rope 0 0 Power spider 0 0
7.6 m coil small rope 0 0 Rags with oil 1 0
7.6 m coil tubing 0 0 Scissor stand full 4 5 X
Alcohol bottle 2 1 Scissor stand half 4 5 X
Bag of rags 2 2 Scissor stand quarter 3 4 X
Blower duct 1 0 Short duct tape air 0 0
Bucket with debris 1 0 Single cone 0 0
Canvas tarp draped 4 5 X Single oil pad 2 3
Canvas tarp folded 1 0 Single oil pad with oil 3 3
Cardstock air 1 1 Single PPE 1 0
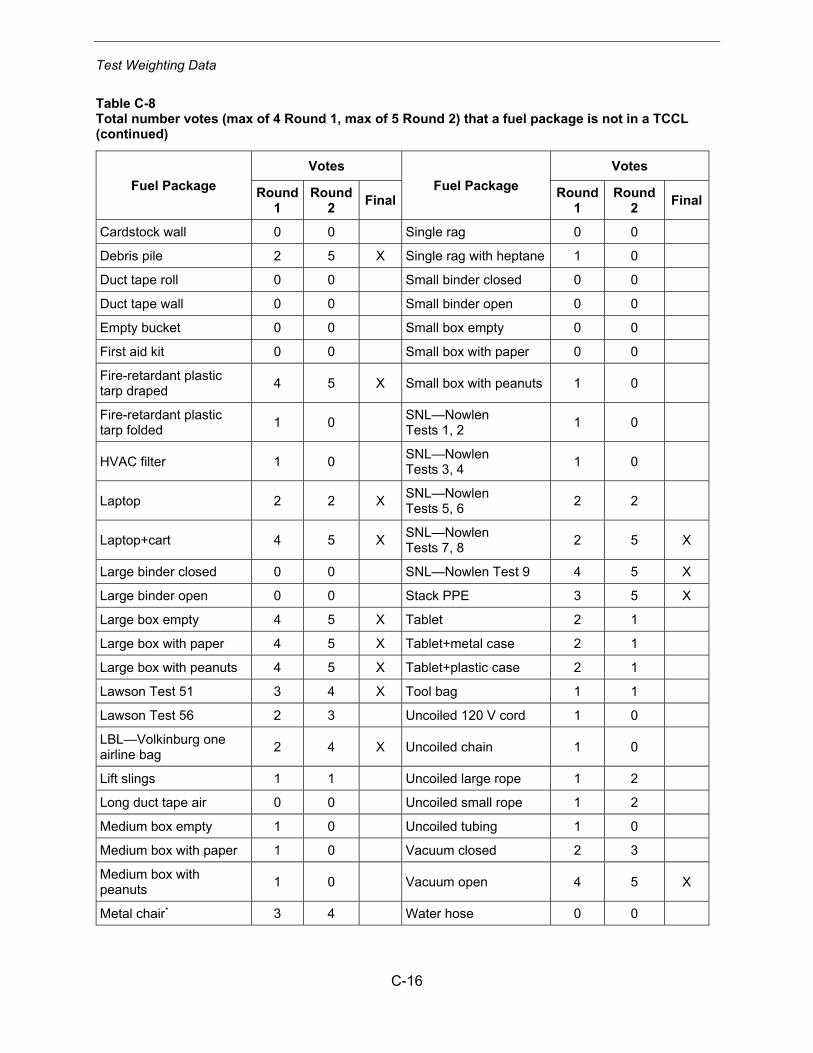
Test Weighting Data
C-16
Table C-8 Total number votes (max of 4 Round 1, max of 5 Round 2) that a fuel package is not in a TCCL (continued)
Fuel Package
Votes
Fuel Package
Votes
Round 1
Round 2
Final Round
1 Round
2 Final
Cardstock wall 0 0 Single rag 0 0
Debris pile 2 5 X Single rag with heptane 1 0
Duct tape roll 0 0 Small binder closed 0 0
Duct tape wall 0 0 Small binder open 0 0
Empty bucket 0 0 Small box empty 0 0
First aid kit 0 0 Small box with paper 0 0
Fire-retardant plastic tarp draped
4 5 X Small box with peanuts 1 0
Fire-retardant plastic tarp folded
1 0 SNL—Nowlen Tests 1, 2
1 0
HVAC filter 1 0 SNL—Nowlen Tests 3, 4
1 0
Laptop 2 2 X SNL—Nowlen Tests 5, 6
2 2
Laptop+cart 4 5 X SNL—Nowlen Tests 7, 8
2 5 X
Large binder closed 0 0 SNL—Nowlen Test 9 4 5 X
Large binder open 0 0 Stack PPE 3 5 X
Large box empty 4 5 X Tablet 2 1
Large box with paper 4 5 X Tablet+metal case 2 1
Large box with peanuts 4 5 X Tablet+plastic case 2 1
Lawson Test 51 3 4 X Tool bag 1 1
Lawson Test 56 2 3 Uncoiled 120 V cord 1 0
LBL—Volkinburg one airline bag
2 4 X Uncoiled chain 1 0
Lift slings 1 1 Uncoiled large rope 1 2
Long duct tape air 0 0 Uncoiled small rope 1 2
Medium box empty 1 0 Uncoiled tubing 1 0
Medium box with paper 1 0 Vacuum closed 2 3
Medium box with peanuts
1 0 Vacuum open 4 5 X
Metal chair* 3 4 Water hose 0 0

Test Weighting Data
C-17
Table C-8 Total number votes (max of 4 Round 1, max of 5 Round 2) that a fuel package is not in a TCCL (continued)
Fuel Package
Votes
Fuel Package
Votes
Round 1
Round 2
Final Round
1 Round
2 Final
Metal trash full 3 5 X Welding blanket draped 2 4 X
Metal trash full lid 3 5 X Welding blanket folded 0 1
Metal trash half 3 5 X Wood block flame 1 1
Metal trash quarter 3 5 X Wood block panel 1 1
Mop+bucket 2 2 WPI half bag 4 5 X
NBS—Lee fabric 1 1 WPI quarter bag 3 5 X
*Note: While the metal chair had four votes to eliminate it from the TCCL, the working decided to include it in the TCCL to be consistent with the Lawson Test 56 fuel package which was a similar chair.


D-1
APPENDIX D WEIGHTED DATA HISTOGRAMS AND GAMMA DISTRIBUTION FITS
This appendix contains a triplet of plots for each of the distributions in Table 4-1 and Table 4-4.
The first plot in each triplet is a probability density function, the second plot is a cumulative probability distribution, and the third plot is a probability-probability plot. The empirical (test data) plot data originates from the empirical cumulative distribution density functions generated in R. Note that the density axis for each probability density function plot is shown as a log scale. For each quantity, it can be seen that the histogram density is significantly higher on the left side of the plots and the right side shows a long tail of relatively low density. These are classic hallmarks of data obeying a gamma distribution. The cumulative probability distribution plots contain a main plot and an inset plot. The main plot is plotted out to the maximum value in the test data. The inset plot is zoomed to show up to approximately the 98th percentile; the actual value varies slightly in order to obtain a round number for the independent axis of the plot.
D.1 Generic Transient Fire Distribution Plots
Figures D-1 through D-51 contain the plots for the distribution in Table 4-1.
Figure D-1 Probability density function for peak heat release rate (HRR)
1.E‐08
1.E‐07
1.E‐06
1.E‐05
1.E‐04
1.E‐03
1.E‐02
1.E‐01
1.E+00
0 500 1000 1500 2000 2500 3000
Probab
ility Den
sity Function
Fire Size (kW)
Data
Fit
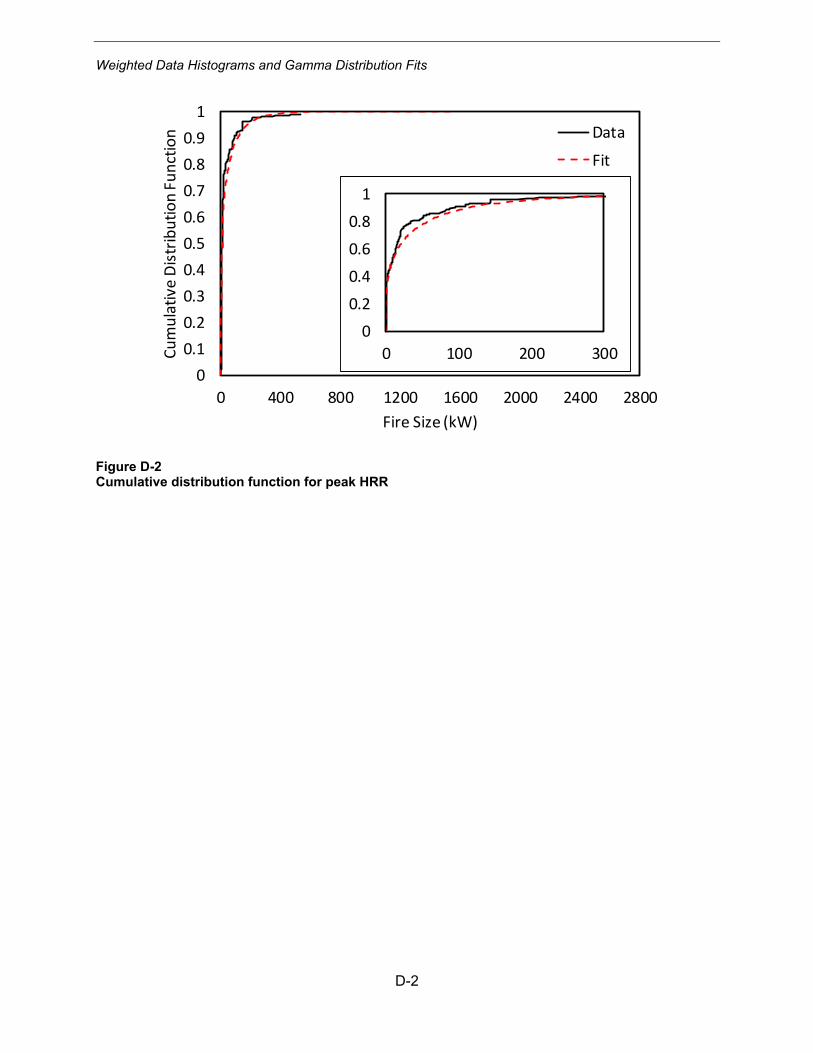
Weighted Data Histograms and Gamma Distribution Fits
D-2
Figure D-2 Cumulative distribution function for peak HRR
0
0.1
0.2
0.3
0.4
0.5
0.6
0.7
0.8
0.9
1
0 400 800 1200 1600 2000 2400 2800
Cumulative Distribution Function
Fire Size (kW)
Data
Fit
0
0.2
0.4
0.6
0.8
1
0 100 200 300

Weighted Data Histograms and Gamma Distribution Fits
D-3
Figure D-3 Probability-probability plot for peak HRR
0
0.25
0.5
0.75
1
0 0.25 0.5 0.75 1
Fit Probab
ility
Data Probability

Weighted Data Histograms and Gamma Distribution Fits
D-4
Figure D-4 Probability density function for total energy release (TER)
Figure D-5 Cumulative distribution function for TER
1.E‐07
1.E‐06
1.E‐05
1.E‐04
1.E‐03
1.E‐02
1.E‐01
1.E+00
0 100 200 300 400 500 600 700
Probab
ility Den
sity Function
Total Energy Release (MW)
Data
Fit
0
0.1
0.2
0.3
0.4
0.5
0.6
0.7
0.8
0.9
1
0 100 200 300 400 500 600 700
Cumulative Distribution Function
Total Energy Release (MW)
Data
Fit
0
0.2
0.4
0.6
0.8
1
0 50 100 150
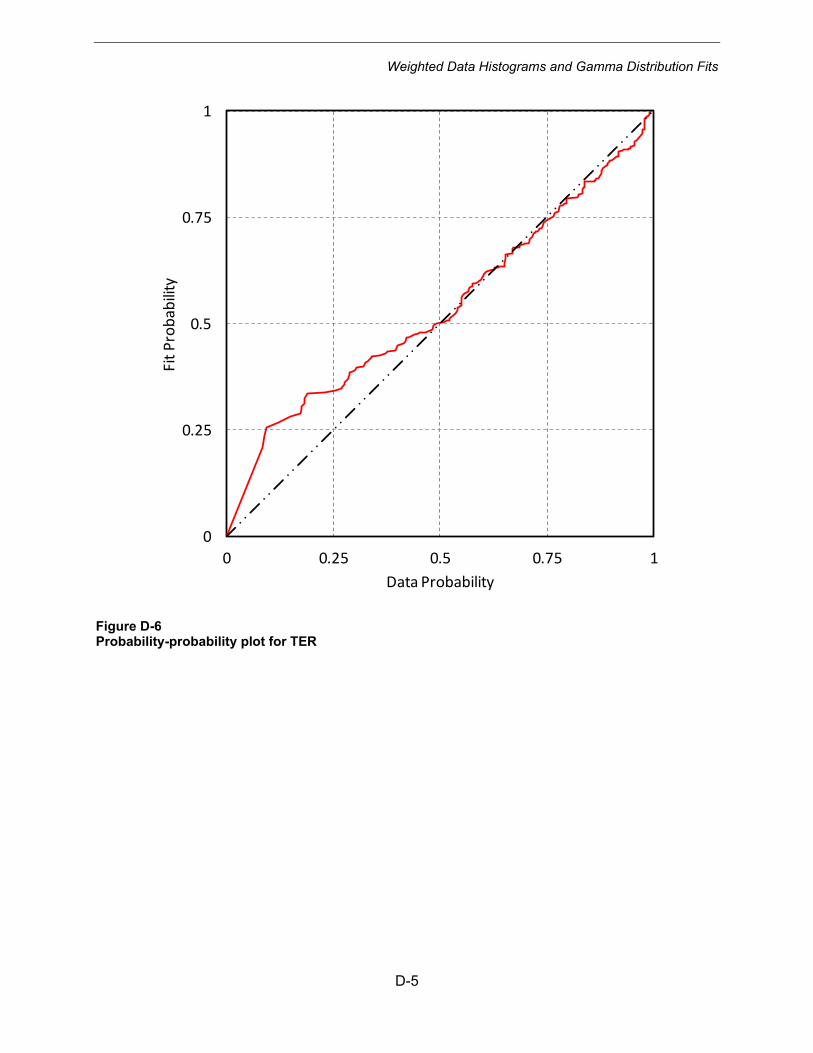
Weighted Data Histograms and Gamma Distribution Fits
D-5
Figure D-6 Probability-probability plot for TER
0
0.25
0.5
0.75
1
0 0.25 0.5 0.75 1
Fit Probab
ility
Data Probability

Weighted Data Histograms and Gamma Distribution Fits
D-6
Figure D-7 Probability density function for horizontal zone of influence (ZOI) for sensitive electronics (SE)
Figure D-8 Cumulative distribution function for horizontal ZOI for SE
1.E‐05
1.E‐04
1.E‐03
1.E‐02
1.E‐01
1.E+00
1.E+01
0 1 2 3 4
Probab
ility Den
sity Function
Horizontal Sensitive ZOI (m)
Data
Fit
0
0.1
0.2
0.3
0.4
0.5
0.6
0.7
0.8
0.9
1
0 1 2 3 4
Cumulative Distribution Function
Horizontal Sensitive ZOI (m)
Data
Fit
0
0.2
0.4
0.6
0.8
1
0 0.25 0.5 0.75 1

Weighted Data Histograms and Gamma Distribution Fits
D-7
Figure D-9 Probability-probability plot for horizontal ZOI for SE
0
0.25
0.5
0.75
1
0 0.25 0.5 0.75 1
Fit Probab
ility
Data Probability

Weighted Data Histograms and Gamma Distribution Fits
D-8
Figure D-10 Probability density function for horizontal ZOI for thermoplastic (TP) cable
Figure D-11 Cumulative distribution function for horizontal ZOI for TP cable
1.E‐04
1.E‐03
1.E‐02
1.E‐01
1.E+00
1.E+01
1.E+02
0 0.25 0.5 0.75 1 1.25
Probab
ility Den
sity Function
Horizontal Thermoplastic ZOI (m)
Data
Fit
0
0.1
0.2
0.3
0.4
0.5
0.6
0.7
0.8
0.9
1
0 0.25 0.5 0.75 1 1.25
Cumulative Distribution Function
Horizontal Thermoplastic ZOI (m)
Data
Fit
0
0.2
0.4
0.6
0.8
1
0 0.1 0.2 0.3 0.4

Weighted Data Histograms and Gamma Distribution Fits
D-9
Figure D-12 Probability-probability plot for horizontal ZOI for TP cable
0
0.25
0.5
0.75
1
0 0.25 0.5 0.75 1
Fit Probab
ility
Data Probability

Weighted Data Histograms and Gamma Distribution Fits
D-10
Figure D-13 Probability density function for horizontal ZOI for Kerite-FR cable (KC)
Figure D-14 Cumulative distribution function for horizontal ZOI for KC
1.E‐03
1.E‐02
1.E‐01
1.E+00
1.E+01
1.E+02
0 0.25 0.5 0.75 1
Probab
ility Den
sity Function
Horizontal Kerite FR ZOI (m)
Data
Fit
0
0.1
0.2
0.3
0.4
0.5
0.6
0.7
0.8
0.9
1
0 0.25 0.5 0.75 1
Cumulative Distribution Function
Horizontal Kerite FR ZOI (m)
Data
Fit
0
0.2
0.4
0.6
0.8
1
0 0.05 0.1 0.15 0.2 0.25

Weighted Data Histograms and Gamma Distribution Fits
D-11
Figure D-15 Probability-probability plot for horizontal ZOI for KC
0
0.25
0.5
0.75
1
0 0.25 0.5 0.75 1
Fit Probab
ility
Data Probability

Weighted Data Histograms and Gamma Distribution Fits
D-12
Figure D-16 Probability density function for horizontal ZOI for thermoset (TS) cable
Figure D-17 Cumulative distribution function for horizontal ZOI for TS cable
1.E‐06
1.E‐05
1.E‐04
1.E‐03
1.E‐02
1.E‐01
1.E+00
1.E+01
1.E+02
0 0.2 0.4 0.6 0.8 1
Probab
ility Den
sity Function
Horizontal Thermoset ZOI (m)
Data
Fit
0
0.1
0.2
0.3
0.4
0.5
0.6
0.7
0.8
0.9
1
0 0.2 0.4 0.6 0.8 1
Cumulative Distribution Function
Horizontal Thermoset ZOI (m)
Data
Fit
0
0.2
0.4
0.6
0.8
1
0 0.05 0.1 0.15

Weighted Data Histograms and Gamma Distribution Fits
D-13
Figure D-18 Probability-probability plot for horizontal ZOI for TS cable
0
0.25
0.5
0.75
1
0 0.25 0.5 0.75 1
Fit Probab
ility
Data Probability

Weighted Data Histograms and Gamma Distribution Fits
D-14
Figure D-19 Probability density function for horizontal ZOI for bulk cable tray ignition (TI)
Figure D-20 Cumulative distribution function for horizontal ZOI for TI
1.E‐03
1.E‐02
1.E‐01
1.E+00
1.E+01
1.E+02
0 0.1 0.2 0.3 0.4 0.5
Probab
ility Den
sity Function
Horizontal Tray Ignition ZOI (m)
Data
Fit
0
0.1
0.2
0.3
0.4
0.5
0.6
0.7
0.8
0.9
1
0 0.1 0.2 0.3 0.4 0.5
Cumulative Distribution Function
Horizontal Tray Ignition ZOI (m)
Data
Fit
0
0.2
0.4
0.6
0.8
1
0 0.05 0.1 0.15 0.2 0.25

Weighted Data Histograms and Gamma Distribution Fits
D-15
Figure D-21 Probability-probability plot for horizontal ZOI for TI
0
0.25
0.5
0.75
1
0 0.25 0.5 0.75 1
Fit Probab
ility
Data Probability
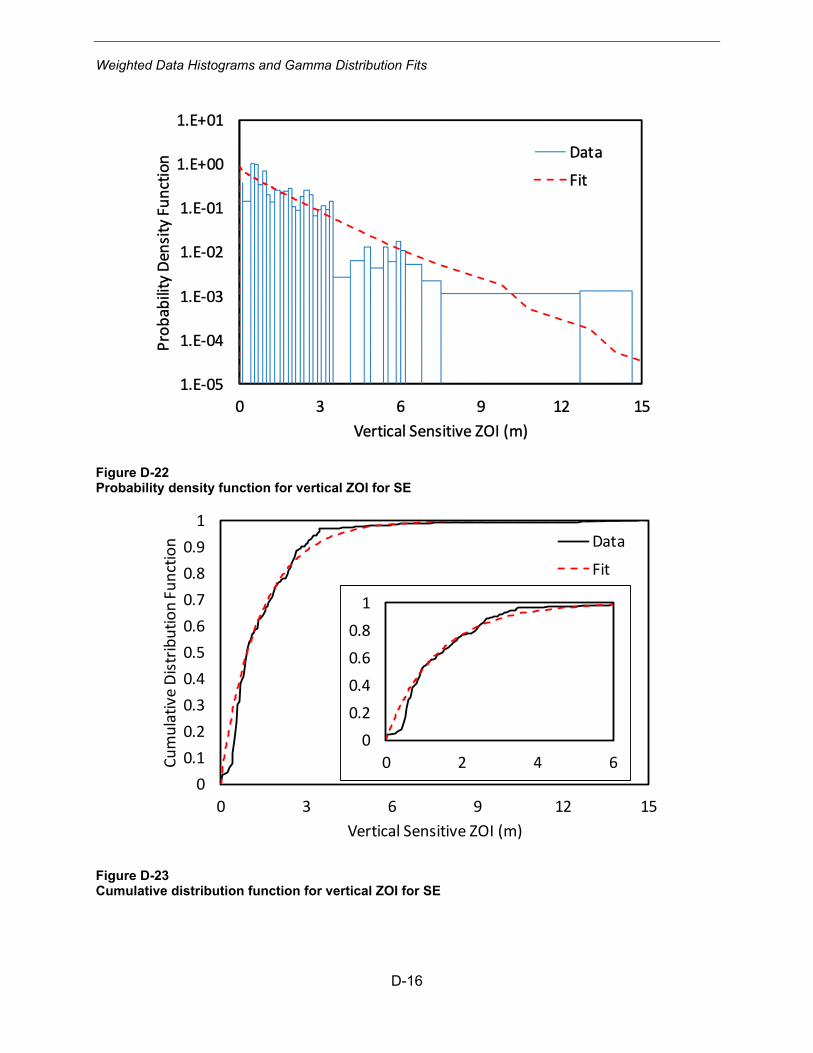
Weighted Data Histograms and Gamma Distribution Fits
D-16
Figure D-22 Probability density function for vertical ZOI for SE
Figure D-23 Cumulative distribution function for vertical ZOI for SE
0
0.1
0.2
0.3
0.4
0.5
0.6
0.7
0.8
0.9
1
0 3 6 9 12 15
Cumulative Distribution Function
Vertical Sensitive ZOI (m)
Data
Fit
0
0.2
0.4
0.6
0.8
1
0 2 4 6

Weighted Data Histograms and Gamma Distribution Fits
D-17
Figure D-24 Probability-probability plot for vertical ZOI for SE
0
0.25
0.5
0.75
1
0 0.25 0.5 0.75 1
Fit Probab
ility
Data Probability
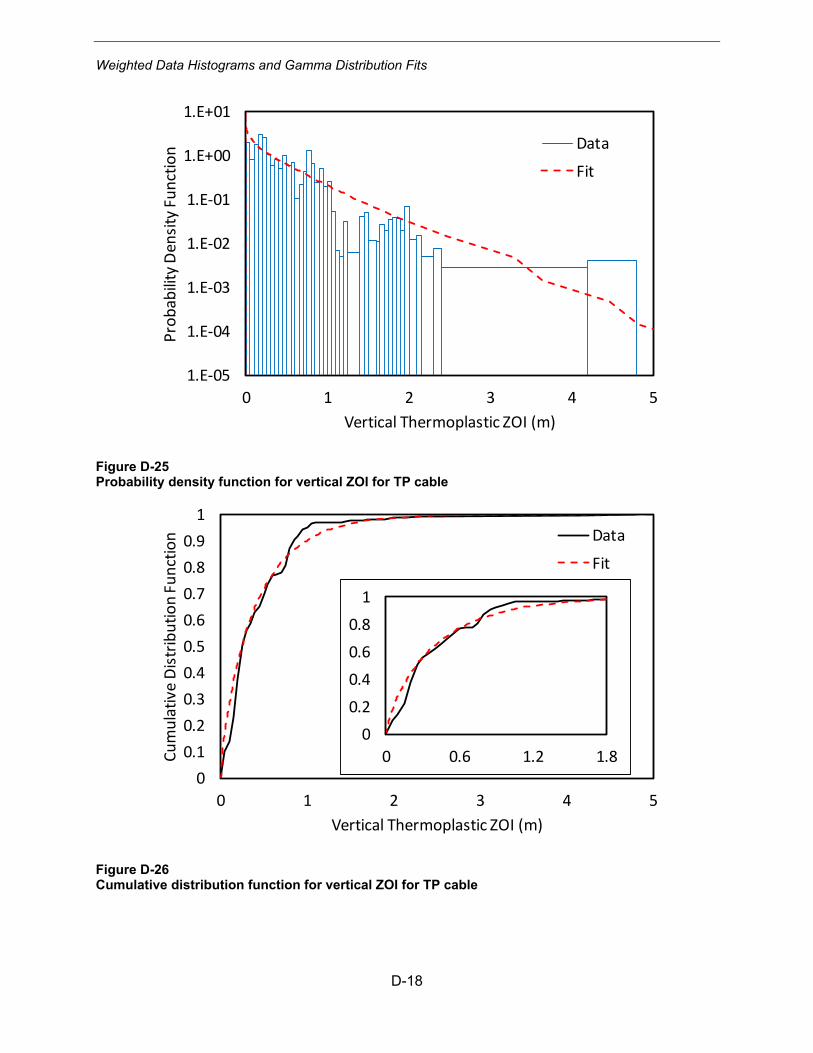
Weighted Data Histograms and Gamma Distribution Fits
D-18
Figure D-25 Probability density function for vertical ZOI for TP cable
Figure D-26 Cumulative distribution function for vertical ZOI for TP cable
1.E‐05
1.E‐04
1.E‐03
1.E‐02
1.E‐01
1.E+00
1.E+01
0 1 2 3 4 5
Probab
ility Den
sity Function
Vertical Thermoplastic ZOI (m)
Data
Fit
0
0.1
0.2
0.3
0.4
0.5
0.6
0.7
0.8
0.9
1
0 1 2 3 4 5
Cumulative Distribution Function
Vertical Thermoplastic ZOI (m)
Data
Fit
0
0.2
0.4
0.6
0.8
1
0 0.6 1.2 1.8

Weighted Data Histograms and Gamma Distribution Fits
D-19
Figure D-27 Probability-probability plot for vertical ZOI for TP cable
0
0.25
0.5
0.75
1
0 0.25 0.5 0.75 1
Fit Probab
ility
Data Probability

Weighted Data Histograms and Gamma Distribution Fits
D-20
Figure D-28 Probability density function for vertical ZOI for KC
Figure D-29 Cumulative distribution function for vertical ZOI for KC
1.E‐05
1.E‐04
1.E‐03
1.E‐02
1.E‐01
1.E+00
1.E+01
0 1 2 3 4 5
Probab
ility Den
sity Function
Vertical Kerite FR ZOI (m)
Data
Fit
0
0.1
0.2
0.3
0.4
0.5
0.6
0.7
0.8
0.9
1
0 1 2 3 4 5
Cumulative Distribution Function
Vertical Kerite FR ZOI (m)
Data
Fit
0
0.2
0.4
0.6
0.8
1
0 0.6 1.2 1.8

Weighted Data Histograms and Gamma Distribution Fits
D-21
Figure D-30 Probability-probability plot for vertical ZOI for KC
0
0.25
0.5
0.75
1
0 0.25 0.5 0.75 1
Fit Probab
ility
Data Probability

Weighted Data Histograms and Gamma Distribution Fits
D-22
Figure D-31 Probability density function for vertical ZOI for TS cable
Figure D-32 Cumulative distribution function for vertical ZOI for TS cable
1.E‐05
1.E‐04
1.E‐03
1.E‐02
1.E‐01
1.E+00
1.E+01
1.E+02
0 0.5 1 1.5 2 2.5 3 3.5 4 4.5
Probab
ility Den
sity Function
Vertical Thermoset ZOI (m)
Data
Fit
0
0.1
0.2
0.3
0.4
0.5
0.6
0.7
0.8
0.9
1
0 0.5 1 1.5 2 2.5 3 3.5 4 4.5
Cumulative Distribution Function
Vertical Thermoset ZOI (m)
Data
Fit
0
0.2
0.4
0.6
0.8
1
0 0.5 1 1.5

Weighted Data Histograms and Gamma Distribution Fits
D-23
Figure D-33 Probability-probability plot for vertical ZOI for TS cable
0
0.25
0.5
0.75
1
0 0.25 0.5 0.75 1
Fit Probab
ility
Data Probability

Weighted Data Histograms and Gamma Distribution Fits
D-24
Figure D-34 Probability density function for vertical ZOI for TI
Figure D-35 Cumulative distribution function for vertical ZOI for TI
1.E‐05
1.E‐04
1.E‐03
1.E‐02
1.E‐01
1.E+00
1.E+01
1.E+02
0 0.5 1 1.5 2 2.5 3 3.5 4
Probab
ility Den
sity Function
Vertical Tray Ignition ZOI (m)
Data
Fit
0
0.1
0.2
0.3
0.4
0.5
0.6
0.7
0.8
0.9
1
0 0.5 1 1.5 2 2.5 3 3.5 4
Cumulative Distribution Function
Vertical Tray Ignition ZOI (m)
Data
Fit
0
0.2
0.4
0.6
0.8
1
0 0.5 1 1.5

Weighted Data Histograms and Gamma Distribution Fits
D-25
Figure D-36 Probability-probability plot for vertical ZOI for TI
0
0.25
0.5
0.75
1
0 0.25 0.5 0.75 1
Fit Probab
ility
Data Probability

Weighted Data Histograms and Gamma Distribution Fits
D-26
Figure D-37 Probability density function for vertical in a corner ZOI for SE
Figure D-38 Cumulative distribution function for vertical in a corner ZOI for SE
1.E‐05
1.E‐04
1.E‐03
1.E‐02
1.E‐01
1.E+00
0 3 6 9 12 15 18 21 24 27
Probab
ility Den
sity Function
Vertical in a Corner Sensitive ZOI (m)
Data
Fit
0
0.1
0.2
0.3
0.4
0.5
0.6
0.7
0.8
0.9
1
0 3 6 9 12 15 18 21 24 27
Cumulative Distribution Function
Vertical in a Corner Sensitive ZOI (m)
Data
Fit
0
0.2
0.4
0.6
0.8
1
0 2 4 6 8 10

Weighted Data Histograms and Gamma Distribution Fits
D-27
Figure D-39 Probability-probability plot for vertical in a corner ZOI for SE
0
0.25
0.5
0.75
1
0 0.25 0.5 0.75 1
Fit Probab
ility
Data Probability

Weighted Data Histograms and Gamma Distribution Fits
D-28
Figure D-40 Probability density function for vertical in a corner ZOI for TP cable
Figure D-41 Cumulative distribution function for vertical in a corner ZOI for TP cable
1.E‐05
1.E‐04
1.E‐03
1.E‐02
1.E‐01
1.E+00
1.E+01
0 1 2 3 4 5 6 7 8 9
Probab
ility Den
sity Function
Vertical in a Corner Thermoplastic ZOI (m)
Data
Fit
0
0.1
0.2
0.3
0.4
0.5
0.6
0.7
0.8
0.9
1
0 3 6 9
Cumulative Distribution Function
Vertical in a Corner Thermoplastic ZOI (m)
Data
Fit
0
0.2
0.4
0.6
0.8
1
0 0.6 1.2 1.8 2.4 3

Weighted Data Histograms and Gamma Distribution Fits
D-29
Figure D-42 Probability-probability plot for vertical in a corner ZOI for TP cable
0
0.25
0.5
0.75
1
0 0.25 0.5 0.75 1
Fit Probab
ility
Data Probability

Weighted Data Histograms and Gamma Distribution Fits
D-30
Figure D-43 Probability density function for vertical in a corner ZOI for KC
Figure D-44 Cumulative distribution function for vertical in a corner ZOI for KC
1.E‐05
1.E‐04
1.E‐03
1.E‐02
1.E‐01
1.E+00
1.E+01
0 2 4 6 8
Probab
ility Den
sity Function
Vertical in a Corner Kerite FR ZOI (m)
Data
Fit
0
0.1
0.2
0.3
0.4
0.5
0.6
0.7
0.8
0.9
1
0 2 4 6 8
Cumulative Distribution Function
Vertical in a Corner Kerite FR ZOI (m)
Data
Fit
0
0.2
0.4
0.6
0.8
1
0 0.6 1.2 1.8 2.4 3

Weighted Data Histograms and Gamma Distribution Fits
D-31
Figure D-45 Probability-probability plot for vertical in a corner ZOI for KC
0
0.25
0.5
0.75
1
0 0.25 0.5 0.75 1
Fit Probab
ility
Data Probability

Weighted Data Histograms and Gamma Distribution Fits
D-32
Figure D-46 Probability density function for vertical in a corner ZOI for TS cable
Figure D-47 Cumulative distribution function for vertical in a corner ZOI for TS cable
1.E‐05
1.E‐04
1.E‐03
1.E‐02
1.E‐01
1.E+00
1.E+01
0 1 2 3 4 5 6 7
Probab
ility Den
sity Function
Vertical in a Corner Thermoset ZOI (m)
Data
Fit
0
0.1
0.2
0.3
0.4
0.5
0.6
0.7
0.8
0.9
1
0 1 2 3 4 5 6 7
Cumulative Distribution Function
Vertical in a Corner Thermoset ZOI (m)
Data
Fit
0
0.2
0.4
0.6
0.8
1
0 0.5 1 1.5 2 2.5

Weighted Data Histograms and Gamma Distribution Fits
D-33
Figure D-48 Probability-probability plot for vertical in a corner ZOI for TS cable
0
0.25
0.5
0.75
1
0 0.25 0.5 0.75 1
Fit Probab
ility
Data Probability

Weighted Data Histograms and Gamma Distribution Fits
D-34
Figure D-49 Probability density function for vertical in a corner ZOI for TI
Figure D-50 Cumulative distribution function for vertical in a corner ZOI for TI
1.E‐05
1.E‐04
1.E‐03
1.E‐02
1.E‐01
1.E+00
1.E+01
0 1 2 3 4 5 6 7
Probab
ility Den
sity Function
Vertical in a Corner Tray Ignition ZOI (m)
Data
Fit
0
0.1
0.2
0.3
0.4
0.5
0.6
0.7
0.8
0.9
1
0 1 2 3 4 5 6 7
Cumulative Distribution Function
Vertical in a Corner Tray Ignition ZOI (m)
Data
Fit
0
0.2
0.4
0.6
0.8
1
0 0.5 1 1.5 2 2.5

Weighted Data Histograms and Gamma Distribution Fits
D-35
Figure D-51 Probability-probability plot for vertical in a corner ZOI for TI
0
0.25
0.5
0.75
1
0 0.25 0.5 0.75 1
Fit Probab
ility
Data Probability

Weighted Data Histograms and Gamma Distribution Fits
D-36
D.2 Transient Combustible Control Location Transient Fire Distribution Plots
Figures D-52 through D-102 contain the plots for the distributions in Table 4-4.
Figure D-52 Probability density function for peak HRR
1.E‐05
1.E‐04
1.E‐03
1.E‐02
1.E‐01
1.E+00
0 50 100 150 200 250
Probab
ility Den
sity Function
Fire Size (kW)
Data
Fit

Weighted Data Histograms and Gamma Distribution Fits
D-37
Figure D-53 Cumulative distribution function for peak HRR
0
0.1
0.2
0.3
0.4
0.5
0.6
0.7
0.8
0.9
1
0 50 100 150 200 250
Cumulative Distribution Function
Fire Size (kW)
Data
Fit

Weighted Data Histograms and Gamma Distribution Fits
D-38
Figure D-54 Probability-probability plot for peak HRR
0
0.25
0.5
0.75
1
0 0.25 0.5 0.75 1
Fit Probab
ility
Data Probability

Weighted Data Histograms and Gamma Distribution Fits
D-39
Figure D-55 Probability density function for TER
Figure D-56 Cumulative distribution function for TER
1.E‐04
1.E‐03
1.E‐02
1.E‐01
1.E+00
0 10 20 30 40 50 60 70 80 90
Probab
ility Den
sity Function
Total Energy Release (MW)
Data
Fit
0
0.1
0.2
0.3
0.4
0.5
0.6
0.7
0.8
0.9
1
0 10 20 30 40 50 60 70 80 90
Cumulative Distribution Function
Total Energy Release (MW)
Data
Fit
0
0.2
0.4
0.6
0.8
1
0 20 40 60

Weighted Data Histograms and Gamma Distribution Fits
D-40
Figure D-57 Probability-probability plot for TER
0
0.25
0.5
0.75
1
0 0.25 0.5 0.75 1
Fit Probab
ility
Data Probability

Weighted Data Histograms and Gamma Distribution Fits
D-41
Figure D-58 Probability density function for horizontal ZOI for SE
Figure D-59 Cumulative distribution function for horizontal ZOI for SE
1.E‐02
1.E‐01
1.E+00
1.E+01
1.E+02
0 0.2 0.4 0.6 0.8
Probab
ility Den
sity Function
Horizontal Sensitive ZOI (m)
Data
Fit
0
0.1
0.2
0.3
0.4
0.5
0.6
0.7
0.8
0.9
1
0 0.2 0.4 0.6 0.8
Cumulative Distribution Function
Horizontal Sensitive ZOI (m)
Data
Fit

Weighted Data Histograms and Gamma Distribution Fits
D-42
Figure D-60 Probability-probability plot for horizontal ZOI for SE
0
0.25
0.5
0.75
1
0 0.25 0.5 0.75 1
Fit Probab
ility
Data Probability

Weighted Data Histograms and Gamma Distribution Fits
D-43
Figure D-61 Probability density function for horizontal ZOI for TP cable
Figure D-62 Cumulative distribution function for horizontal ZOI for TP cable
1.E‐04
1.E‐03
1.E‐02
1.E‐01
1.E+00
1.E+01
1.E+02
0 0.05 0.1 0.15 0.2 0.25 0.3
Probab
ility Den
sity Function
Horizontal Thermoplastic ZOI (m)
Data
Fit
0
0.1
0.2
0.3
0.4
0.5
0.6
0.7
0.8
0.9
1
0 0.05 0.1 0.15 0.2 0.25 0.3
Cumulative Distribution Function
Horizontal Thermoplastic ZOI (m)
Data
Fit

Weighted Data Histograms and Gamma Distribution Fits
D-44
Figure D-63 Probability-probability plot for horizontal ZOI for TP cable
0
0.25
0.5
0.75
1
0 0.25 0.5 0.75 1
Fit Probab
ility
Data Probability
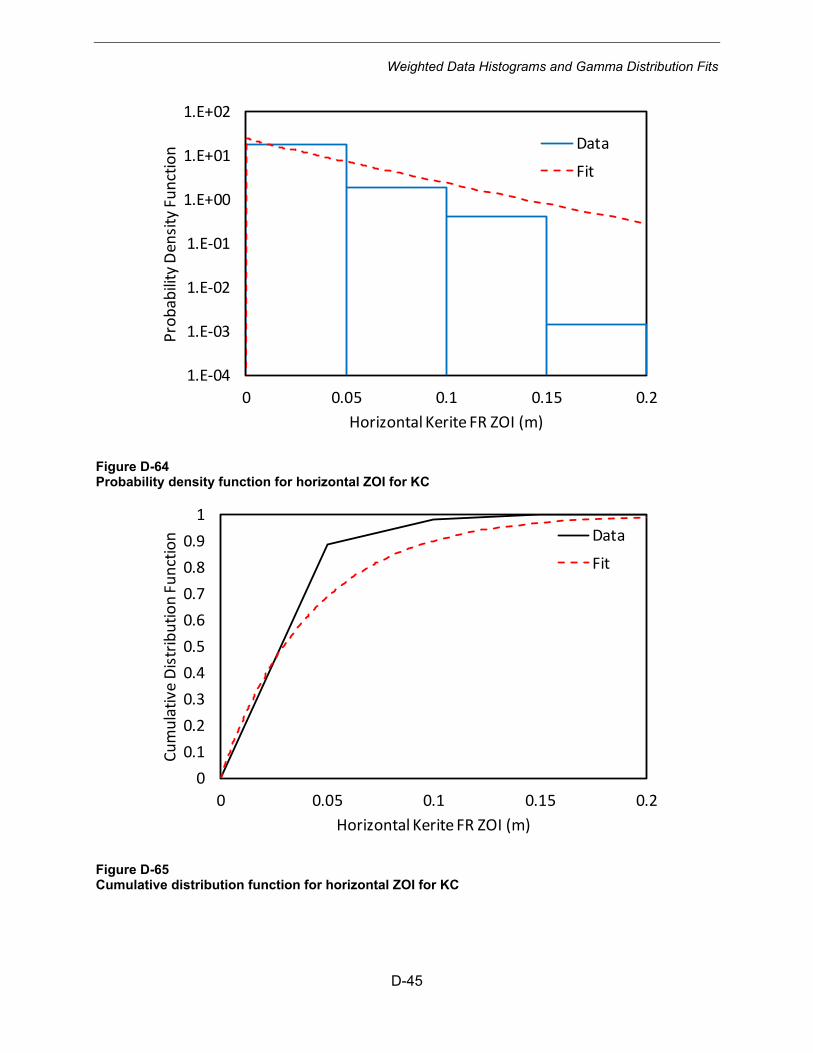
Weighted Data Histograms and Gamma Distribution Fits
D-45
Figure D-64 Probability density function for horizontal ZOI for KC
Figure D-65 Cumulative distribution function for horizontal ZOI for KC
1.E‐04
1.E‐03
1.E‐02
1.E‐01
1.E+00
1.E+01
1.E+02
0 0.05 0.1 0.15 0.2
Probab
ility Den
sity Function
Horizontal Kerite FR ZOI (m)
Data
Fit
0
0.1
0.2
0.3
0.4
0.5
0.6
0.7
0.8
0.9
1
0 0.05 0.1 0.15 0.2
Cumulative Distribution Function
Horizontal Kerite FR ZOI (m)
Data
Fit

Weighted Data Histograms and Gamma Distribution Fits
D-46
Figure D-66 Probability-probability plot for horizontal ZOI for KC
0
0.25
0.5
0.75
1
0 0.25 0.5 0.75 1
Fit Probab
ility
Data Probability

Weighted Data Histograms and Gamma Distribution Fits
D-47
Figure D-67 Probability density function for horizontal ZOI for TS cable
Figure D-68 Cumulative distribution function for horizontal ZOI for TS cable
1.E‐06
1.E‐05
1.E‐04
1.E‐03
1.E‐02
1.E‐01
1.E+00
1.E+01
1.E+02
0 0.02 0.04 0.06 0.08 0.1
Probab
ility Den
sity Function
Horizontal Thermoset ZOI (m)
Data
Fit
0
0.1
0.2
0.3
0.4
0.5
0.6
0.7
0.8
0.9
1
0 0.02 0.04 0.06 0.08 0.1
Cumulative Distribution Function
Horizontal Thermoset ZOI (m)
Data
Fit

Weighted Data Histograms and Gamma Distribution Fits
D-48
Figure D-69 Probability-probability plot for horizontal ZOI for TS cable
0
0.25
0.5
0.75
1
0 0.25 0.5 0.75 1
Fit Probab
ility
Data Probability

Weighted Data Histograms and Gamma Distribution Fits
D-49
Figure D-70 Probability density function for horizontal ZOI for TI
Figure D-71 Cumulative distribution function for horizontal ZOI for TI
0
5
10
15
20
25
30
0 0.01 0.02 0.03 0.04 0.05 0.06 0.07
Probab
ility Den
sity Function
Horizontal Tray Ignition ZOI (m)
Data
Fit
0
0.1
0.2
0.3
0.4
0.5
0.6
0.7
0.8
0.9
1
0 0.1 0.2 0.3 0.4 0.5 0.6 0.7
Cumulative Distribution Function
Horizontal Tray Ignition ZOI (m)
Data
Fit

Weighted Data Histograms and Gamma Distribution Fits
D-50
Figure D-72 Probability-probability plot for horizontal ZOI for TI
0
0.25
0.5
0.75
1
0 0.25 0.5 0.75 1
Fit Probab
ility
Data Probability

Weighted Data Histograms and Gamma Distribution Fits
D-51
Figure D-73 Probability density function for vertical ZOI for SE
Figure D-74 Cumulative distribution function for vertical ZOI for SE
0
0.1
0.2
0.3
0.4
0.5
0.6
0.7
0.8
0.9
1
0 0.5 1 1.5 2 2.5 3 3.5 4 4.5
Cumulative Distribution Function
Vertical Sensitive ZOI (m)
Data
Fit

Weighted Data Histograms and Gamma Distribution Fits
D-52
Figure D-75 Probability-probability plot for vertical ZOI for SE
0
0.25
0.5
0.75
1
0 0.25 0.5 0.75 1
Fit Probab
ility
Data Probability

Weighted Data Histograms and Gamma Distribution Fits
D-53
Figure D-76 Probability density function for vertical ZOI for TP cable
Figure D-77 Cumulative distribution function for vertical ZOI for TP cable
1.E‐03
1.E‐02
1.E‐01
1.E+00
1.E+01
0 0.25 0.5 0.75 1 1.25
Probab
ility Den
sity Function
Vertical Thermoplastic ZOI (m)
Data
Fit
0
0.1
0.2
0.3
0.4
0.5
0.6
0.7
0.8
0.9
1
0 0.25 0.5 0.75 1 1.25
Cumulative Distribution Function
Vertical Thermoplastic ZOI (m)
Data
Fit

Weighted Data Histograms and Gamma Distribution Fits
D-54
Figure D-78 Probability-probability plot for vertical ZOI for TP cable
0
0.25
0.5
0.75
1
0 0.25 0.5 0.75 1
Fit Probab
ility
Data Probability

Weighted Data Histograms and Gamma Distribution Fits
D-55
Figure D-79 Probability density function for vertical ZOI for KC
Figure D-80 Cumulative distribution function for vertical ZOI for KC
1.E‐02
1.E‐01
1.E+00
1.E+01
0 0.2 0.4 0.6 0.8 1 1.2
Probab
ility Den
sity Function
Vertical Kerite FR ZOI (m)
Data
Fit
0
0.1
0.2
0.3
0.4
0.5
0.6
0.7
0.8
0.9
1
0 0.2 0.4 0.6 0.8 1 1.2
Cumulative Distribution Function
Vertical Kerite FR ZOI (m)
Data
Fit

Weighted Data Histograms and Gamma Distribution Fits
D-56
Figure D-81 Probability-probability plot for vertical ZOI for KC
0
0.25
0.5
0.75
1
0 0.25 0.5 0.75 1
Fit Probab
ility
Data Probability

Weighted Data Histograms and Gamma Distribution Fits
D-57
Figure D-82 Probability density function for vertical ZOI for TS cable
Figure D-83 Cumulative distribution function for vertical ZOI for TS cable
1.E‐02
1.E‐01
1.E+00
1.E+01
0 0.2 0.4 0.6 0.8 1 1.2
Probab
ility Den
sity Function
Vertical Thermoset ZOI (m)
Data
Fit
0
0.1
0.2
0.3
0.4
0.5
0.6
0.7
0.8
0.9
1
0 0.2 0.4 0.6 0.8 1 1.2
Cumulative Distribution Function
Vertical Thermoset ZOI (m)
DataFitData

Weighted Data Histograms and Gamma Distribution Fits
D-58
Figure D-84 Probability-probability plot for vertical ZOI for TS cable
0
0.25
0.5
0.75
1
0 0.25 0.5 0.75 1
Fit Probab
ility
Data Probability

Weighted Data Histograms and Gamma Distribution Fits
D-59
Figure D-85 Probability density function for vertical ZOI for TI
Figure D-86 Cumulative distribution function for vertical ZOI for TI
1.E‐02
1.E‐01
1.E+00
1.E+01
0 0.2 0.4 0.6 0.8 1
Probab
ility Den
sity Function
Vertical Tray Ignition ZOI (m)
Data
Fit
0
0.1
0.2
0.3
0.4
0.5
0.6
0.7
0.8
0.9
1
0 0.2 0.4 0.6 0.8 1
Cumulative Distribution Function
Vertical Tray Ignition ZOI (m)
Data
Fit

Weighted Data Histograms and Gamma Distribution Fits
D-60
Figure D-87 Probability-probability plot for vertical ZOI for TI
0
0.25
0.5
0.75
1
0 0.25 0.5 0.75 1
Fit Probab
ility
Data Probability

Weighted Data Histograms and Gamma Distribution Fits
D-61
Figure D-88 Probability density function for vertical in a corner ZOI for SE
Figure D-89 Cumulative distribution function for vertical in a corner ZOI for SE
1.E‐03
1.E‐02
1.E‐01
1.E+00
0 1 2 3 4 5 6 7
Probab
ility Den
sity Function
Vertical in a Corner Sensitive ZOI (m)
Data
Fit
0
0.1
0.2
0.3
0.4
0.5
0.6
0.7
0.8
0.9
1
0 1 2 3 4 5 6 7
Cumulative Distribution Function
Vertical in a Corner Sensitive ZOI (m)
Data
Fit

Weighted Data Histograms and Gamma Distribution Fits
D-62
Figure D-90 Probability-probability plot for vertical in a corner ZOI for SE
0
0.25
0.5
0.75
1
0 0.25 0.5 0.75 1
Fit Probab
ility
Data Probability

Weighted Data Histograms and Gamma Distribution Fits
D-63
Figure D-91 Probability density function for vertical in a corner ZOI for TP cable
Figure D-92 Cumulative distribution function for vertical in a corner ZOI for TP cable
1.E‐03
1.E‐02
1.E‐01
1.E+00
1.E+01
0 0.5 1 1.5 2 2.5
Probab
ility Den
sity Function
Vertical in a Corner Thermoplastic ZOI (m)
Data
Fit
0
0.1
0.2
0.3
0.4
0.5
0.6
0.7
0.8
0.9
1
0 0.5 1 1.5 2 2.5
Cumulative Distribution Function
Vertical in a Corner Thermoplastic ZOI (m)
Data
Fit

Weighted Data Histograms and Gamma Distribution Fits
D-64
Figure D-93 Probability-probability plot for vertical in a corner ZOI for TP cable
0
0.25
0.5
0.75
1
0 0.25 0.5 0.75 1
Fit Probab
ility
Data Probability

Weighted Data Histograms and Gamma Distribution Fits
D-65
Figure D-94 Probability density function for vertical in a corner ZOI for KC
Figure D-95 Cumulative distribution function for vertical in a corner ZOI for KC
1.E‐03
1.E‐02
1.E‐01
1.E+00
1.E+01
0 0.5 1 1.5 2 2.5
Probab
ility Den
sity Function
Vertical in a Corner Kerite FR ZOI (m)
Data
Fit
0
0.1
0.2
0.3
0.4
0.5
0.6
0.7
0.8
0.9
1
0 0.5 1 1.5 2 2.5
Cumulative Distribution Function
Vertical in a Corner Kerite FR ZOI (m)
Data
Fit

Weighted Data Histograms and Gamma Distribution Fits
D-66
Figure D-96 Probability-probability plot for vertical in a corner ZOI for KC
0
0.25
0.5
0.75
1
0 0.25 0.5 0.75 1
Fit Probab
ility
Data Probability

Weighted Data Histograms and Gamma Distribution Fits
D-67
Figure D-97 Probability density function for vertical in a corner ZOI for TS cable
Figure D-98 Cumulative distribution function for vertical in a corner ZOI for TS cable
1.E‐03
1.E‐02
1.E‐01
1.E+00
1.E+01
0 0.5 1 1.5 2
Probab
ility Den
sity Function
Vertical in a Corner Thermoset ZOI (m)
Data
Fit
0
0.1
0.2
0.3
0.4
0.5
0.6
0.7
0.8
0.9
1
0 0.5 1 1.5 2
Cumulative Distribution Function
Vertical in a Corner Thermoset ZOI (m)
Data
Fit

Weighted Data Histograms and Gamma Distribution Fits
D-68
Figure D-99 Probability-probability plot for vertical in a corner ZOI for TS cable
0
0.25
0.5
0.75
1
0 0.25 0.5 0.75 1
Fit Probab
ility
Data Probability

Weighted Data Histograms and Gamma Distribution Fits
D-69
Figure D-100 Probability density function for vertical in a corner ZOI for TI
Figure D-101 Cumulative distribution function for vertical in a corner ZOI for TI
1.E‐03
1.E‐02
1.E‐01
1.E+00
1.E+01
0 0.25 0.5 0.75 1 1.25 1.5 1.75
Probab
ility Den
sity Function
Vertical in a Corner Tray Ignition ZOI (m)
Data
Fit
0
0.1
0.2
0.3
0.4
0.5
0.6
0.7
0.8
0.9
1
0 0.25 0.5 0.75 1 1.25 1.5 1.75
Cumulative Distribution Function
Vertical in a Corner Tray Ignition ZOI (m)
Data
Fit
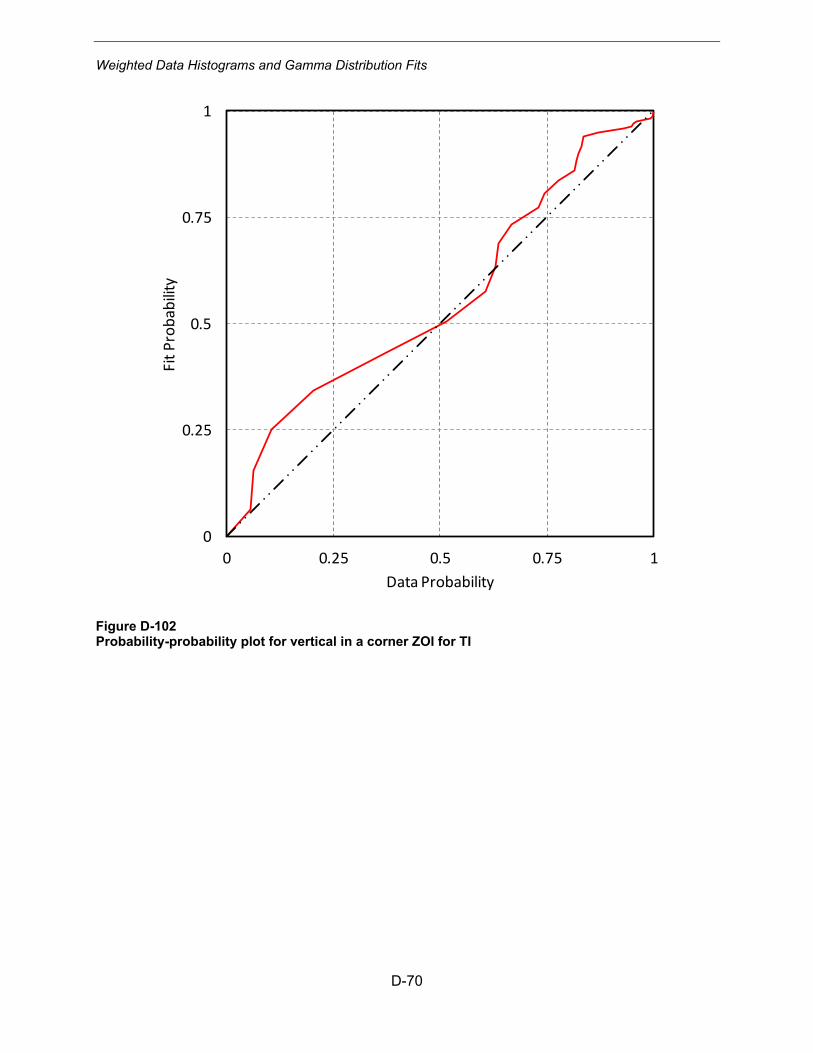
Weighted Data Histograms and Gamma Distribution Fits
D-70
Figure D-102 Probability-probability plot for vertical in a corner ZOI for TI
0
0.25
0.5
0.75
1
0 0.25 0.5 0.75 1
Fit Probab
ility
Data Probability

E-1
APPENDIX E INSPECTION FINDINGS ANALYSIS
The analysis performed in this report used the set of challenging or potentially challenging events contained in the EPRI fire events database [16]. This implicitly contains the assumption that events that have occurred to date have a distribution of severity that matches the distribution that would exist if there were many more years of data collection. One check on this is to consider violations of transient material procedures found during U.S. Nuclear Regulatory Commission inspections over the period from 2000 to 2010. It is noted that such inspection findings are not fire events. The findings are only the discovery of some quantity of transient materials in a location where such materials and/or quantities should not exist. Transient materials also require a potential ignition source to ultimately result in a fire event. It is additionally noted that inspection findings tend to bias toward significant violations—that is, a 55 gallon drum of lube oil in a combustible free zone would almost certainly result in a violation but a few sheets of paper fallen from a notebook would likely not.
A list of inspection findings where large amounts of transient combustibles were present is given in Table E-1. The table is not all violations. The table provides the date of the inspection and plant status, the plant area, a description of the materials, and a disposition of the inspection report. Test numbers in the table refer to the tests in the test report [9]. In general, the findings are dispositioned by one or more of the following basic responses:
The plant was not at power and the scope of this report is at-power probabilisticrisk assessment.
There is no credible ignition source that would ignite the fuel package.
The combustible materials were tested during this project either directly or with a closelymatching experiment.
A review of the table shows that the most severe violations in terms of quantity were associated with items with no credible transient ignition source or occurred during an outage. Remaining events are fuel items contained in the test database directly or through a reasonable surrogate.

E-2
Tab
le E
-1
Su
mm
ary
of
no
tab
le in
spec
tio
n f
ind
ing
s re
late
d t
o t
ran
sien
t m
ater
ials
Dat
e (I
f A
vaila
ble
) an
d
Pla
nt
Sta
tus
Pla
nt
Are
a C
om
bu
stib
le
Typ
e D
escr
ipti
on
R
esp
on
se
6/9/
2000
100%
pow
er
Bat
tery
roo
ms
Rub
ber
mat
ting
on th
e flo
ors
and
viny
l ap
rons
han
ging
in
the
room
s
Insp
ecto
rs p
erfo
rmed
wal
kdow
ns o
f fou
r ba
ttery
roo
ms
and
obse
rved
rub
ber
mat
ting
on
the
floor
s an
d vi
nyl a
pron
s ha
ngin
g in
the
room
s. T
he li
cens
ee d
eter
min
ed th
at, a
lthou
gh
the
viny
l apr
ons
wou
ld n
ot s
uppo
rt
com
bust
ion,
the
rubb
er m
ats
wou
ld a
nd s
houl
d be
con
trol
led
as tr
ansi
ent c
ombu
stib
les.
The
m
attin
g, in
mos
t cas
es g
reat
er th
an 1
00 lb
., ha
d be
en in
the
room
s fo
r ye
ars.
Rub
ber
floor
mat
ting
is li
kely
not
an
inte
nsel
y bu
rnin
g su
bsta
nce.
Tes
ting
of
rubb
er h
ose
(Tes
t030
, Tes
t082
, and
T
est0
83)
show
ed th
at s
usta
ined
igni
tion
was
unl
ikel
y (o
ne o
f thr
ee te
sts)
. Ove
rall
burn
ing
rate
s w
ere
low
(pe
ak b
urni
ng r
ate
near
2 k
W/k
g of
hos
e).
9/3/
2000
Def
uele
d
Con
tain
men
t T
arp
The
prim
ary
caus
e of
the
fire
was
failu
re to
pr
oper
ly e
valu
ate
and
cont
rol t
rans
ient
co
mbu
stib
les
durin
g w
eldi
ng, c
uttin
g, a
nd
grin
ding
evo
lutio
ns. S
peci
fical
ly, s
park
s fr
om a
gr
indi
ng e
volu
tion
land
ed o
n a
com
bust
ible
fo
reig
n m
ater
ial e
xclu
sion
tarp
.
The
follo
win
g ta
rps
wer
e te
sted
:
P
last
ic ta
rp d
rape
d (T
est0
17, T
est0
18,
Tes
t01 9
, Tes
t020
)
F
R p
last
ic ta
rp d
rape
d (T
est0
50,
Tes
t051
) an
d fo
lded
(T
est0
52)
P
last
ic ta
rp fo
lded
(08
_29_
001,
08_2
9_00
2, 0
8_29
_003
)
3/7/
2001
(5
5 ga
llon
drum
) 3/
8/20
01
(oily
rag
s)
Bot
h at
100
%
pow
er
Aux
iliar
y bu
ildin
g 55
gal
dru
m
lube
oil
half
full
unse
aled
, oily
ra
gs
Dur
ing
wal
kdow
ns o
f the
Uni
t 1 p
rimar
y au
xilia
ry b
uild
ing,
the
insp
ecto
rs id
entif
ied
the
follo
win
g co
mbu
stib
le m
ater
ial c
ontr
ol
defic
ienc
ies:
a 5
5 ga
llon
drum
of l
ube
oil
appr
oxim
atel
y ha
lf fu
ll of
lube
oil
was
not
se
aled
and
was
left
unat
tend
ed n
ear
the
Uni
t 1
high
hea
d sa
fety
inje
ctio
n pu
mp
area
, and
se
vera
l oily
rag
s w
ere
foun
d st
ored
in a
n op
en
plas
tic b
ag n
ear
the
Uni
t 1 h
igh
head
saf
ety
inje
ctio
n pu
mp
area
. Tra
nsie
nt c
ombu
stib
le
mat
eria
ls (
lube
oil
in th
e 55
gal
dru
m)
in th
e pr
imar
y au
xilia
ry b
uild
ing
was
app
roxi
mat
ely
five
times
the
amou
nt a
ssum
ed in
the
fire
haza
rd a
naly
sis.
Igni
ting
lube
oil
wou
ld r
equi
re a
n ev
ent
that
hea
ts th
e vo
lum
e of
oil
to it
s fla
shpo
int a
nd a
n ev
ent t
o fa
il th
e dr
um,
allo
win
g th
e he
ated
oil
to b
e ex
pose
d to
ai
r. A
55
gal d
rum
of l
ube
oil w
ould
re
quire
on
the
orde
r of
50
MJ
of n
et
ener
gy in
put t
o he
at fr
om r
oom
te
mpe
ratu
re to
its
flash
poin
t. T
here
are
no
cred
ible
tran
sien
t ign
ition
sou
rces
that
co
ntai
n th
at a
mou
nt o
f ene
rgy.
Sev
eral
oily
rag
s w
ere
test
ed:
07_1
6_00
4, 0
7_16
_005
, 07_
16_0
06,
07_2
3_00
1, T
est0
03, T
est0
05, T
est0
06,
Tes
t064
, and
Tes
t066
.
____________________________________________________________________________________
Inspection Findings Analysis

E-3
Tab
le E
-1
Su
mm
ary
of
no
tab
le in
spec
tio
n f
ind
ing
s re
late
d t
o t
ran
sien
t m
ater
ials
(co
nti
nu
ed)
Dat
e (I
f A
vaila
ble
) an
d
Pla
nt
Sta
tus
Pla
nt
Are
a C
om
bu
stib
le
Typ
e D
escr
ipti
on
R
esp
on
se
3/14
/200
2
100%
pow
er
Tur
bine
bu
ildin
g 53
0 lb
of C
lass
A
mat
eria
l T
he in
spec
tors
iden
tifie
d th
at th
e lic
ense
e pl
aced
tran
sien
t com
bust
ible
mat
eria
ls in
ex
cess
of p
roce
dure
req
uire
men
ts in
the
turb
ine
build
ing
appr
oxim
atel
y 15
ft fr
om th
e au
xilia
ry b
uild
ing.
The
vio
latio
n w
as n
ot d
ue to
the
amou
nt
bein
g a
haza
rd fo
r th
e tu
rbin
e bu
ildin
g,
but f
or th
e am
ount
bei
ng o
ver
100
lb
with
in 2
0 ft
of a
saf
ety-
rela
ted
stru
ctur
e.
As
a sa
fety
-rel
ated
str
uctu
re, t
he e
xter
ior
wal
l sho
uld
have
at l
east
a 1
-hou
r fir
e-re
sist
ant (
FR
) ra
ting.
A fi
re in
volv
ing
clas
s m
ater
ials
, eve
n ag
ains
t the
wal
l, w
ould
be
a le
ss s
ever
e ex
posu
re th
an u
sed
durin
g th
e A
ST
M E
119
test
s. A
lthou
gh a
vi
olat
ion
of p
roce
dure
, the
ris
k si
gnifi
canc
e of
this
is n
eglig
ible
.
3/16
/200
2
Ref
uelin
g ou
tage
Aux
iliar
y bu
ildin
g 33
0 ga
l (si
x
55 g
al d
rum
s)
of fl
amm
able
lu
bric
atin
g oi
l
With
the
unit
in M
ode
5, in
spec
tors
iden
tifie
d th
at th
e lic
ense
e ha
d st
aged
app
roxi
mat
ely
330
gal (
six
55 g
al d
rum
s) o
f fla
mm
able
lu
bric
atin
g oi
l in
a ro
om to
be
used
for
the
reac
tor
cool
ant p
umps
(R
CP
s).
Lube
oil
is n
ot a
flam
mab
le li
quid
. The
fla
shpo
int o
f lub
e oi
l (ty
pica
lly o
ver
200°
C)
is to
o hi
gh to
mee
t eith
er N
atio
nal
Fire
Pro
tect
ion
Ass
ocia
tion
or D
epar
tmen
t of
Tra
nspo
rtat
ion
thre
shol
ds fo
r a
flam
mab
le li
quid
(un
der
100°C
). S
ee
Eve
nt 3
/7/2
001
for
a fu
rthe
r di
scus
sion
on
dru
ms
cont
aini
ng lu
be o
il.
9/19
/200
2
100%
pow
er
HP
CI p
ump
room
55
gal
dru
m
of o
il T
he in
spec
tor
iden
tifie
d a
55 g
al d
rum
of o
il in
th
e H
PC
I pum
p ro
om th
at w
as n
ot c
ontr
olle
d in
ac
cord
ance
with
the
tran
sien
t com
bust
ible
co
ntro
l req
uire
men
ts.
See
Eve
nt 3
/7/2
001
for
a fu
rthe
r di
scus
sion
on
drum
s co
ntai
ning
lube
oil.
____________________________________________________________________________________
Inspection Findings Analysis

E-4
Tab
le E
-1
Su
mm
ary
of
no
tab
le in
spec
tio
n f
ind
ing
s re
late
d t
o t
ran
sien
t m
ater
ials
(co
nti
nu
ed)
Dat
e (I
f A
vaila
ble
) an
d
Pla
nt
Sta
tus
Pla
nt
Are
a C
om
bu
stib
le
Typ
e D
escr
ipti
on
R
esp
on
se
10/1
6/20
03
One
uni
t at
pow
er a
nd
one
unit
defu
eled
Aux
iliar
y bu
ildin
g M
ultip
le
asso
rted
am
ount
s
In
the
heat
ing ,
ven
tilat
ion,
and
air
con d
ition
ing
equi
pmen
t (H
VA
C)
room
,st
agin
g ar
ea h
avin
g co
mbu
stib
le m
ater
ials
incl
u din
g tw
o co
ils o
f pla
stic
hos
es, s
tora
geba
rrel
(5 5
gal
dru
m),
pla
stic
buc
ket,
and
anop
en la
rge
tool
che
st.
A
lso,
sev
eral
larg
e st
orag
e ca
bine
ts, s
ome
of w
hich
we r
e la
bele
d as
con
tain
ing
flam
mab
le m
ater
ials
.
In
a m
otor
con
trol
cen
ter
room
(a
sep a
rate
fire
zone
than
the
prec
edin
g ite
ms)
, ant
i-co
ntam
inat
ion
clot
hing
con
tain
er a
nd a
larg
ew
a ste
can
; the
se m
ater
ials
wer
e lo
cate
dap
prox
imat
ely
10 ft
bel
ow c
able
tray
s.
In
the
com
pone
nt c
oolin
g w
ater
roo
m (
ath
ird u
niqu
e fir
e zo
ne),
ant
i-con
tam
inat
ion
clot
hing
con
tain
er; t
he c
onta
iner
was
loc a
ted
appr
oxi m
atel
y 7
ft be
low
cab
le tr
ays.
H
oses
wer
e te
sted
(T
est0
30,
Tes
t08 2
, and
Tes
t083
), p
last
ic b
ucke
t was
test
ed (
07_3
1_00
2, 0
7_31
_003
,an
d 07
_31_
004)
, and
a c
anva
s to
ol b
agw
ith to
ols
(like
ly a
n ea
sier
sou
rce
to ig
nite
than
a to
ol c
h est
) w
as te
sted
(09
_19_
001
and
09_1
9_00
2). I
f the
bar
rel w
as b
eing
used
for
tras
h, la
rge
met
al tr
ash
cans
wer
e te
sted
(09
_05_
007,
09_
06_0
01, a
nd09
_06_
002)
. If t
he b
arre
l con
tain
ed lu
beoi
l, se
e E
vent
3/7
/200
1 fo
r a
furt
her
disc
ussi
on o
n dr
ums
cont
aini
ng lu
b e o
il.
Ig
nitio
n of
com
bust
ible
s w
ithin
a s
tora
geca
bine
t wou
ld r
equi
re a
sub
stan
tial
igni
tion
sour
ce.
P
PE
sto
rage
was
test
ed (
WP
I PP
E b
ags)
,an
d fu
ll, la
rge
tras
h ca
ns w
ere
test
ed(T
e st 0
59, T
est 0
69, T
est0
72, 0
9_05
_007
,09
_06_
001,
and
9_0
6_00
2).
P
PE
sto
rage
was
test
ed (
WP
I PP
E b
ags)
.
____________________________________________________________________________________
Inspection Findings Analysis

E-5
Tab
le E
-1
Su
mm
ary
of
no
tab
le in
spec
tio
n f
ind
ing
s re
late
d t
o t
ran
sien
t m
ater
ials
(co
nti
nu
ed)
Dat
e (I
f A
vaila
ble
) an
d
Pla
nt
Sta
tus
Pla
nt
Are
a C
om
bu
stib
le
Typ
e D
escr
ipti
on
R
esp
on
se
11/1
3/20
03
One
uni
t at
pow
er a
nd
one
unit
defu
eled
Aux
iliar
y bu
ildin
g W
eldi
ng
equi
pmen
t and
m
isce
llane
ous
supp
lies
In
the
HV
AC
equ
ipm
ent r
oom
, wel
ding
equi
pmen
t, in
clud
ing
elec
tric
alca
bles
and
ro p
e.
In
the
HV
AC
equ
ipm
ent r
oom
, sta
ging
are
aw
ith c
ombu
stib
le m
ater
ials
incl
udin
geq
uipm
ent c
art w
ith tw
o co
ils o
f pla
stic
hos
ean
d a
coil
of r
ubbe
r ho
se, v
acuu
m c
lean
e r,
and
two
canv
as b
ags.
W
eldi
ng e
quip
men
t wou
ld b
e bo
unde
dby
eith
er th
e 25
0 V
pow
er c
ord
test
s(T
est0
34, T
est0
35, a
nd T
est0
36)
or th
ecl
osed
vac
uum
test
s (T
est0
47 a
ndT
est0
48),
pow
er c
ords
wer
e te
sted
(08_
02_0
01, 0
8_02
_002
, 08_
03_0
01,
08_0
3_00
2, 0
8_03
_003
, 08_
03_ 0
04,
08_0
3_00
5, T
est0
31, T
est 0
32, a
ndT
est0
33),
and
rop
e w
a s te
sted
(Tes
t079
, Tes
t080
, and
Tes
t081
).
H
oses
wer
e te
sted
(T
est0
30, T
est0
31,
and
Tes
t032
), v
acuu
m c
lean
ers
wer
ete
sted
(T
est0
46, T
est0
47, T
est0
48, a
ndT
est0
49),
and
can
vas
tool
s ba
g w
ere
test
ed (
09_1
9_00
1 an
d 09
_19_
002)
.
____________________________________________________________________________________
Inspection Findings Analysis

E-6
Tab
le E
-1
Su
mm
ary
of
no
tab
le in
spec
tio
n f
ind
ing
s re
late
d t
o t
ran
sien
t m
ater
ials
(co
nti
nu
ed)
Dat
e (I
f A
vaila
ble
) an
d
Pla
nt
Sta
tus
Pla
nt
Are
a C
om
bu
stib
le
Typ
e D
escr
ipti
on
R
esp
on
se
1/27
/200
4
100%
pow
er
Aux
iliar
y bu
ildin
g (t
wo
diffe
rent
fire
ar
eas)
Ass
orte
d co
mbu
stib
les
Man
y of
the
com
bust
ible
s ha
d be
en
perm
anen
tly s
tage
d in
the
area
for
ease
of u
se
to s
uppo
rt m
aint
enan
ce a
nd o
pera
tions
ac
tiviti
es. T
he in
spec
tors
iden
tifie
d th
e fo
llow
ing
mat
eria
ls:
T
hree
laun
dry
cart
s pa
rtia
lly fi
lled
with
ant
i-co
ntam
inat
ion
clot
hing
(tw
o of
the
cart
sw
ere
loca
ted
next
to e
ach
othe
r.)
N
umer
ous
rolls
of p
last
ic b
aggi
ng m
ater
ial
N
ine
open
pla
stic
con
tain
ers
fille
d w
ithcl
oth
and
plas
tic m
ater
ial s
One
met
al tr
ash
can
fille
d w
ith c
loth
rag
s
S
ever
al n
on-f
ire-r
ated
met
al c
abin
ets
cont
aini
ng c
loth
and
pla
stic
mat
eria
ls
In
spec
tion
repo
rt e
stim
ates
the
heat
rele
ase
rate
(H
RR
) of
the
laun
dry
cart
sas
120
0 kW
, whi
ch is
less
than
the
plas
tic c
arts
(T
est1
02, T
est0
105,
and
Tes
t010
6 ).
S
ize
of r
olls
is n
ot s
peci
fied.
Lik
ely
tota
lm
ass
is le
ss th
an th
e pl
astic
car
ts.
C
onta
iner
s an
d no
t tra
sh c
ans
sug g
ests
sm
alle
r co
ntai
ners
. Bec
ause
the
laun
d ry
cart
s w
ere
iden
tifie
d as
the
mos
t sev
ere
viol
atio
n, th
is is
like
lyap
prox
i mat
ed b
y th
e fu
ll pl
astic
tras
hca
n (T
e st0
59, T
est0
69, a
nd T
est0
72).
M
etal
tras
h ca
n w
ith p
aper
and
pla
stic
wa s
test
ed (
09_0
5_00
7, 0
9_06
_001
,an
d 09
_06_
002)
, and
mor
e se
vere
than
rag
s, w
hich
cha
r.
E
ven
thou
gh n
on-f
ire-r
ated
, mat
eria
lsin
them
wou
l d b
e pr
otec
ted
agai
nst
mos
t typ
ical
igni
tion
sour
ces
asso
ciat
ed w
ith tr
ansi
ent e
vent
s.
2/5/
2004
100%
pow
er
Was
te s
tora
ge
stat
ion
330
gal o
f lu
bric
atin
g oi
l T
he tr
ansi
ent f
ire lo
adin
g of
the
330
gal o
f co
mbu
stib
le li
quid
was
ana
lyze
d by
the
insp
ecto
r to
be
an in
crea
se o
f a fa
ctor
of 1
00
over
the
norm
al c
ombu
stib
le fi
re lo
adin
g.
See
Eve
nt 3
/7/2
001
for
a fu
rthe
r di
scus
sion
on
drum
s co
ntai
ning
lube
oil.
____________________________________________________________________________________
Inspection Findings Analysis

E-7
Tab
le E
-1
Su
mm
ary
of
no
tab
le in
spec
tio
n f
ind
ing
s re
late
d t
o t
ran
sien
t m
ater
ials
(co
nti
nu
ed)
Dat
e (I
f A
vaila
ble
) an
d
Pla
nt
Sta
tus
Pla
nt
Are
a C
om
bu
stib
le
Typ
e D
escr
ipti
on
R
esp
on
se
2/24
/200
4
100%
pow
er
Aux
iliar
y bu
ildin
g 4
55 g
al b
arre
ls
fille
d w
ith R
CP
m
otor
oil
Insp
ecto
rs o
bser
ved
four
55
gal b
arre
ls fi
lled
with
RC
P m
otor
oil
that
wer
e st
ored
insi
de th
e ra
diol
ogic
al d
rum
min
g st
atio
n on
the
55 ft
el
evat
ion
of th
e pr
imar
y au
xilia
ry b
uild
ing.
La
bels
atta
ched
to th
e ba
rrel
s in
dica
ted
that
th
ey h
ad b
een
stor
ed in
side
the
area
for
~
11 m
onth
s.
See
Eve
nt 3
/7/2
001
for
a fu
rthe
r di
scus
sion
on
drum
s co
ntai
ning
lube
oil.
3/4/
2004
100%
pow
er
Rea
ctor
bu
ildin
g 55
gal
dru
m
of o
il
Dur
ing
a w
alkd
own
of th
e re
acto
r bu
ildin
g, th
e in
spec
tors
obs
erve
d th
at a
55
gal d
rum
of o
il w
as s
tore
d in
the
A c
ore
spra
y pu
mp
room
.
See
Eve
nt 3
/7/2
001
for
a fu
rthe
r di
scus
sion
on
drum
s co
ntai
ning
lube
oil.
5/10
/200
4 th
roug
h 5/
14/2
004
and
5/24
/200
4 th
roug
h 5/
28/2
004
Uni
t 1 c
ame
out o
f out
age
5/9/
2004
Ele
ctric
al r
oom
La
rge
quan
titie
s of
hea
lth
ph
ysic
s m
ater
ials
Insp
ecto
rs n
oted
larg
e qu
antit
ies
of h
ealth
ph
ysic
s m
ater
ials
and
equ
ipm
ent f
or o
utag
e us
e st
ored
insi
de a
cha
in-li
nk fe
nce
encl
osur
e in
the
nort
h en
d of
the
Uni
t 1 W
est e
lect
rical
ro
om.
Insp
ectio
n fin
ding
s no
te th
at th
e ar
ea
did
not c
onta
in c
abin
ets
or tr
ays.
The
re
is n
o in
dica
tion
that
a p
oten
tial i
gniti
on
sour
ce w
as p
rese
nt in
the
vici
nity
of
the
mat
eria
ls.
7/28
/200
4
100%
pow
er
Hal
lway
s ad
jace
nt to
m
ater
ial
stor
age
area
Thr
ee p
last
ic
tras
h ca
ns a
nd
a co
at r
ack
The
team
iden
tifie
d th
at m
ater
ials
wer
e st
acke
d on
top
of s
helv
ing
in th
e m
ater
ials
st
orag
e ar
ea. T
he m
ater
ials
wer
e st
acke
d hi
gh
enou
gh s
o th
at a
fire
in th
e m
ater
ials
wou
ld
neith
er b
e de
tect
ed b
y th
e de
tect
ors
for
the
auto
mat
ic d
elug
e sy
stem
nor
ext
ingu
ishe
d by
th
e de
luge
sys
tem
. The
team
not
ed th
at th
ere
wer
e ca
bles
impo
rtan
t to
safe
ty lo
cate
d di
rect
ly a
bove
the
mat
eria
ls.
Pla
stic
tras
h ca
ns w
ere
test
ed:
P
last
ic tr
ash
quar
ter
(Tes
t057
,T
est0
67, T
est 0
70)
P
last
ic tr
ash
half
(Tes
t058
, Tes
t068
,T
est0
71)
P
last
ic tr
ash
full
(Tes
t059
, Tes
t069
,T
est0
72)
____________________________________________________________________________________
Inspection Findings Analysis

E-8
Tab
le E
-1
Su
mm
ary
of
no
tab
le in
spec
tio
n f
ind
ing
s re
late
d t
o t
ran
sien
t m
ater
ials
(co
nti
nu
ed)
Dat
e (I
f A
vaila
ble
) an
d
Pla
nt
Sta
tus
Pla
nt
Are
a C
om
bu
stib
le
Typ
e D
escr
ipti
on
R
esp
on
se
8/20
/200
4
Coa
stdo
wn
to r
efue
ling
outa
ge
Scr
eenw
ell
hous
e 16
00 lb
of r
esin
D
urin
g a
wal
kdow
n, th
e in
spec
tors
obs
erve
d ap
prox
imat
ely
1600
lb (
dry
wei
ght)
of r
esin
st
ored
on
the
272
ft el
evat
ion.
The
res
in w
as
cont
aine
d pr
imar
ily in
5 g
al p
last
ic b
ucke
ts
with
som
e bu
cket
s lo
cate
d im
med
iate
ly
adja
cent
to a
bui
ldin
g st
ruct
ural
col
umn.
The
m
ater
ial p
rocu
rem
ent a
nd c
ontr
ol d
epar
tmen
t ha
d de
liver
ed tw
o sh
ipm
ents
of r
esin
to th
e sc
reen
wel
l hou
se d
urin
g a
seve
n-da
y pe
riod
and
did
not r
ecog
nize
follo
win
g th
e se
cond
sh
ipm
ent t
hat t
he tr
ansi
ent c
ombu
stib
le
wei
ght w
as e
xcee
ded.
Ion
exch
ange
res
in is
typi
cally
in a
moi
st
stat
e an
d w
ill n
ot s
uppo
rt a
fire
unl
ess
fully
dr
ied
out.
It w
ould
req
uire
a s
ubst
antia
l he
at s
ourc
e to
do
this
for
whi
ch n
o cr
edib
le
igni
tion
sour
ce e
xist
s.
10/1
/200
5 th
roug
h 12
/31/
05
Rea
ctor
bu
ildin
g 25
0 lb
of w
ood
The
tran
sien
t com
bust
ible
s co
nsis
ted
of
woo
d pl
anki
ng lo
cate
d on
sca
ffold
ing
in
the
sout
heas
tern
cor
ner
room
of t
he
reac
tor
build
ing.
Tes
ting
show
ed th
at s
caffo
ldin
g is
not
ea
sily
igni
ted
with
the
type
s of
igni
tion
sour
ces
asso
ciat
ed w
ith tr
ansi
ent f
ires
(Tes
t087
, Tes
t088
, Tes
t089
, Tes
t098
, T
est0
99, a
nd T
est1
00).
10/1
8/20
04
Ref
uelin
g ou
tage
Nea
r, b
ut n
ot
in, t
he
emer
genc
y di
esel
ge
nera
tor
(ED
G)
room
Nin
e 55
gal
dr
ums
Insp
ecto
rs o
bser
ved
mai
nten
ance
per
sonn
el
chan
ging
out
the
lube
oil
for
the
1A E
DG
. At
the
time
of th
e in
spec
tor’s
obs
erva
tions
, the
us
ed lu
bric
atin
g oi
l had
bee
n re
mov
ed fr
om
the
ED
G a
nd tr
ansf
erre
d ou
t of t
he r
oom
.
See
Eve
nt 3
/7/2
001
for
a fu
rthe
r di
scus
sion
on
drum
s co
ntai
ning
lube
oil.
____________________________________________________________________________________
Inspection Findings Analysis

E-9
Tab
le E
-1
Su
mm
ary
of
no
tab
le in
spec
tio
n f
ind
ing
s re
late
d t
o t
ran
sien
t m
ater
ials
(co
nti
nu
ed)
Dat
e (I
f A
vaila
ble
) an
d
Pla
nt
Sta
tus
Pla
nt
Are
a C
om
bu
stib
le
Typ
e D
escr
ipti
on
R
esp
on
se
10/1
9/20
04
Ref
uelin
g ou
tage
Wor
king
m
ater
ial
stor
age
Tw
o ca
rdbo
ard
boxe
s an
d a
plas
tic b
ucke
t
Insp
ecto
rs id
entif
ied
two
card
boar
d bo
xes
an
d a
plas
tic b
ucke
t tha
t wer
e st
acke
d on
to
p of
she
lvin
g in
the
wor
king
mat
eria
ls
stor
age
area
.
Car
dboa
rd b
oxes
and
pla
stic
buc
kets
w
ere
test
ed:
E
mpt
y bu
cket
(07
_31_
001,
07
_31_
002,
07_
31_0
03, 0
7_31
_004
)
M
ediu
m b
ox w
ith p
aper
(08
_06_
004,
08
_06_
005,
08_
06_0
06)
M
ediu
m b
ox w
ith p
eanu
ts (
08_0
6_00
7,
08_0
6_00
8, 0
8_06
_009
)
La
rge
box
with
pea
nuts
(T
est0
08,
Tes
t011
, Tes
t015
)
La
rge
box
with
pap
er (
Tes
t009
, T
est0
12, T
est0
16)
10/2
0/20
04
Ref
uelin
g ou
tage
Mat
eria
ls
stor
age
area
T
wo
card
boar
d bo
xes
labe
led
as c
onta
inin
g pa
per
tow
els
and
a th
ird
card
boar
d bo
x la
bele
d as
co
ntai
ning
re
info
rced
wip
es
Insp
ecto
rs id
entif
ied
mat
eria
ls s
tack
ed o
n to
p of
a m
etal
cab
inet
. C
ardb
oard
box
es w
ith p
aper
wer
e te
sted
:
M
ediu
m b
ox w
ith p
aper
(08
_06_
004,
08
_06_
005,
08_
06_0
06)
La
rge
box
with
pap
er (
Tes
t009
, T
est0
12, T
est0
16)
1/26
/200
6
100%
pow
er
Aux
iliar
y bu
ildin
g F
our
drum
s of
ch
arco
al
The
insp
ecto
rs o
bser
ved
four
dru
ms
of
char
coal
sto
red
on th
e au
xilia
ry b
uild
ing
oper
atin
g flo
or n
ear
a C
lass
1E
bus
and
a
mot
or c
ontr
ol c
ente
r.
Item
s in
a s
eale
d m
etal
can
are
not
cr
edib
ly ig
nite
d w
ith th
e ty
pes
of ig
nitio
n so
urce
s as
soci
ated
with
tran
sien
t fire
s.
Cha
rcoa
l req
uire
s a
rela
tivel
y lo
ng-
dura
tion,
inte
nse
sour
ce to
obt
ain
sust
aine
d ig
nitio
n.
____________________________________________________________________________________
Inspection Findings Analysis

E-10
Tab
le E
-1
Su
mm
ary
of
no
tab
le in
spec
tio
n f
ind
ing
s re
late
d t
o t
ran
sien
t m
ater
ials
(co
nti
nu
ed)
Dat
e (I
f A
vaila
ble
) an
d
Pla
nt
Sta
tus
Pla
nt
Are
a C
om
bu
stib
le
Typ
e D
escr
ipti
on
R
esp
on
se
4/10
/200
6
Ref
uelin
g ou
tage
Dry
spe
nt-f
uel
stor
age
pad
Sea
land
co
ntai
ner/
hydr
aul
ic fl
uid
truc
k
Sea
land
con
tain
ers
cont
aini
ng c
ombu
stib
le
mat
eria
ls w
ithin
50
ft of
the
horiz
onta
l sto
rage
m
odul
e (in
reg
ard
to s
pent
-fue
l dry
sto
rage
pa
d) a
nd a
truc
k tr
aile
r, lo
cate
d on
the
stor
age
pad,
whi
ch h
ad h
ydra
ulic
flui
d st
ored
on
it.
Item
s in
a m
etal
shi
ppin
g co
ntai
ner
do n
ot
pose
a s
igni
fican
t haz
ard.
The
y ar
e pr
otec
ted
from
igni
tion
sour
ces
by th
e m
etal
wal
ls o
f the
con
tain
er a
nd a
clo
sed
cont
aine
r lim
its a
vaila
ble
oxyg
en fo
r a
larg
e fir
e. T
his
also
app
ears
to b
e ou
tsid
e an
d no
t with
in th
e sc
ope
of a
fire
pr
obab
ilist
ic r
isk
asse
ssm
ent.
4/11
/200
6
100%
pow
er
Rea
ctor
bu
ildin
g P
last
ic c
hair,
po
rtab
le y
ello
w
plas
tic s
igns
, an
d ~
60 ft
of
rubb
er h
ose
Dur
ing
a fir
e pr
otec
tion
wal
kdow
n, th
e in
spec
tors
iden
tifie
d a
num
ber
of tr
ansi
ent
com
bust
ible
item
s in
clud
ing
a pl
astic
cha
ir,
port
able
yel
low
pla
stic
sig
ns, a
nd
appr
oxim
atel
y 60
ft o
f rub
ber
hose
tem
pora
rily
inst
alle
d in
an
area
of t
he b
uild
ing.
Sim
ilar
item
s w
ere
test
ed:
P
last
ic c
hair
(Tes
t084
, Tes
t085
, an
d T
est0
86)
S
tack
of f
our
cone
s (0
8_14
_002
, 08
_15_
001,
and
08_
15_0
02)
W
ater
hos
e (T
est0
30, T
est0
82,
and
Tes
t083
)
Fur
ther
mor
e, if
the
hose
was
cha
rged
, th
ere
is n
o cr
edib
le e
vent
that
wou
ld
resu
lt in
a fi
re.
5/15
/200
6
92%
pow
er
Res
idua
l hea
t re
mov
al (
RH
R)
com
plex
Offi
ce c
hair
and
a pl
astic
tras
h bi
n ha
lf fu
ll of
pa
per
Spe
cific
ally
, the
insp
ecto
rs id
entif
ied
an o
ffice
ch
air
and
a pl
astic
tras
h bi
n ap
prox
imat
ely
half
full
of p
aper
sec
ured
app
roxi
mat
ely
1 ft
from
a s
afet
y-re
late
d el
ectr
ical
pan
el fo
r
ED
G r
oom
ven
tilat
ion
and
asso
ciat
ed
cabl
e ra
cew
ay. L
icen
see
pers
onne
l per
form
ed
a w
alkd
own
of th
e R
HR
com
plex
and
id
entif
ied
thre
e ad
ditio
nal t
rash
bin
s an
d tw
o ch
airs
in o
ther
sw
itchg
ear
room
s w
ithin
the
RH
R c
ompl
ex.
Sim
ilar
item
s w
ere
test
ed:
P
last
ic c
hair
(Tes
t084
, Tes
t085
, an
d T
est0
86)
P
last
ic tr
ash
quar
ter
bin
(Tes
t057
, T
est0
67, a
nd T
est0
70)
P
last
ic tr
ash
half
bin
(Tes
t058
, Tes
t068
an
d T
est0
71)
____________________________________________________________________________________ Inspection Findings Analysis
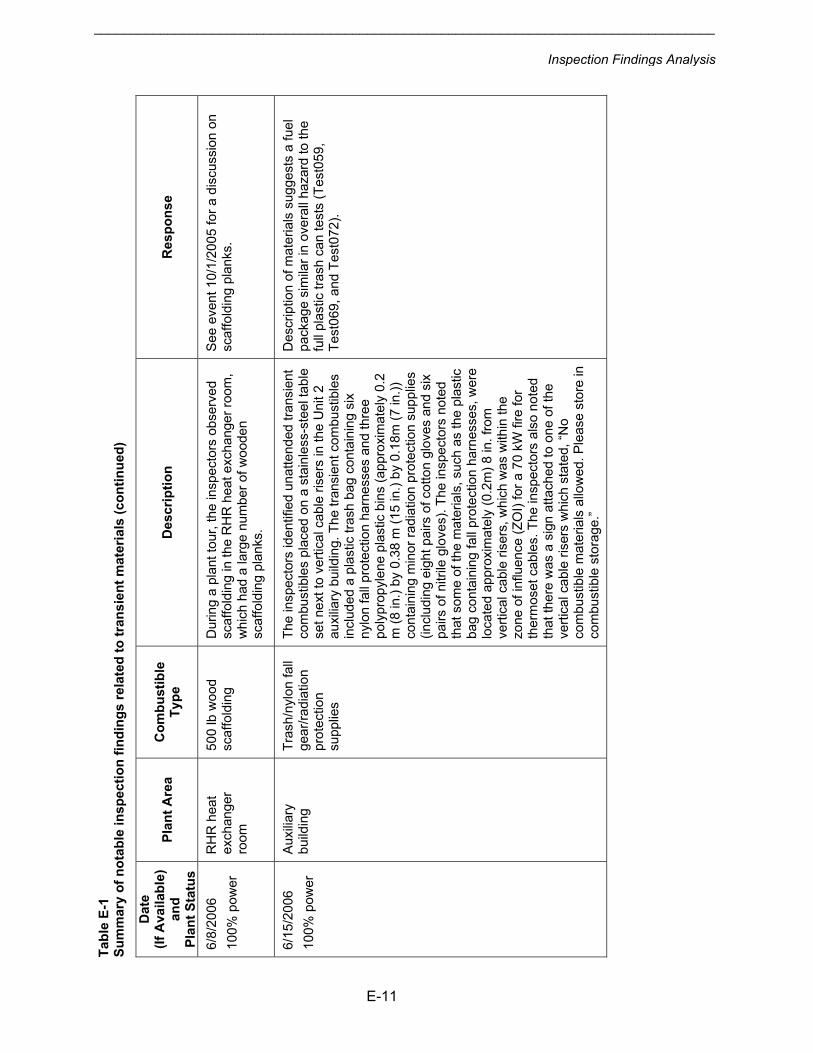
E-11
Tab
le E
-1
Su
mm
ary
of
no
tab
le in
spec
tio
n f
ind
ing
s re
late
d t
o t
ran
sien
t m
ater
ials
(co
nti
nu
ed)
Dat
e (I
f A
vaila
ble
) an
d
Pla
nt
Sta
tus
Pla
nt
Are
a C
om
bu
stib
le
Typ
e D
escr
ipti
on
R
esp
on
se
6/8/
2006
100%
pow
er
RH
R h
eat
exch
ange
r ro
om
500
lb w
ood
scaf
fold
ing
Dur
ing
a pl
ant t
our,
the
insp
ecto
rs o
bser
ved
scaf
fold
ing
in th
e R
HR
hea
t exc
hang
er r
oom
, w
hich
had
a la
rge
num
ber
of w
oode
n sc
affo
ldin
g pl
anks
.
See
eve
nt 1
0/1/
2005
for
a di
scus
sion
on
scaf
fold
ing
plan
ks.
6/15
/200
6
100%
pow
er
Aux
iliar
y bu
ildin
g T
rash
/nyl
on fa
ll ge
ar/r
adia
tion
prot
ectio
n su
pplie
s
The
insp
ecto
rs id
entif
ied
unat
tend
ed tr
ansi
ent
com
bust
ible
s pl
aced
on
a st
ainl
ess-
stee
l tab
le
set n
ext t
o ve
rtic
al c
able
ris
ers
in th
e U
nit 2
au
xilia
ry b
uild
ing.
The
tran
sien
t com
bust
ible
s in
clud
ed a
pla
stic
tras
h ba
g co
ntai
ning
six
ny
lon
fall
prot
ectio
n ha
rnes
ses
and
thre
e po
lypr
opyl
ene
plas
tic b
ins
(app
roxi
mat
ely
0.2
m (
8 in
.) b
y 0.
38 m
(15
in.)
by
0.18
m (
7 in
.))
cont
aini
ng m
inor
rad
iatio
n pr
otec
tion
supp
lies
(incl
udin
g ei
ght p
airs
of c
otto
n gl
oves
and
six
pa
irs o
f nitr
ile g
love
s). T
he in
spec
tors
not
ed
that
som
e of
the
mat
eria
ls, s
uch
as th
e pl
astic
ba
g co
ntai
ning
fall
prot
ectio
n ha
rnes
ses,
wer
e lo
cate
d ap
prox
imat
ely
(0.2
m)
8 in
. fro
m
vert
ical
cab
le r
iser
s, w
hich
was
with
in th
e zo
ne o
f inf
luen
ce (
ZO
I) fo
r a
70 k
W fi
re fo
r th
erm
oset
cab
les.
The
insp
ecto
rs a
lso
note
d th
at th
ere
was
a s
ign
atta
ched
to o
ne o
f the
ve
rtic
al c
able
ris
ers
whi
ch s
tate
d, “
No
com
bust
ible
mat
eria
ls a
llow
ed. P
leas
e st
ore
in
com
bust
ible
sto
rage
.”
Des
crip
tion
of m
ater
ials
sug
gest
s a
fuel
pa
ckag
e si
mila
r in
ove
rall
haza
rd to
the
full
plas
tic tr
ash
can
test
s (T
est0
59,
Tes
t069
, and
Tes
t072
).
____________________________________________________________________________________
Inspection Findings Analysis

E-12
Tab
le E
-1
Su
mm
ary
of
no
tab
le in
spec
tio
n f
ind
ing
s re
late
d t
o t
ran
sien
t m
ater
ials
(co
nti
nu
ed)
Dat
e (I
f A
vaila
ble
) an
d
Pla
nt
Sta
tus
Pla
nt
Are
a C
om
bu
stib
le
Typ
e D
escr
ipti
on
R
esp
on
se
8/16
/200
6
100%
pow
er
Cab
le v
ault
Pla
stic
tarp
sh
eetin
g
Pla
stic
tarp
in s
ever
al c
onfig
urat
ions
w
ere
test
ed:
P
last
ic ta
rp fo
lded
(08
_29_
001,
08
_29_
002,
08_
29_0
03)
P
last
ic ta
rp d
rape
d (T
est0
17, T
est0
18,
Tes
t019
, Tes
t020
)
F
ire-r
etar
dant
pla
stic
tarp
dra
ped
(Tes
t050
, Tes
t051
) an
d fo
lded
(T
est0
52)
3/7/
2007
100%
pow
er
Tur
bine
bu
ildin
g 21
55
gal o
il dr
ums—
and
late
r, n
ine
55
gal o
il dr
ums
The
lice
nsee
iden
tifie
d th
at 2
1 55
gal
oil
drum
s w
ere
loca
ted
on tu
rbin
e bu
ildin
g 62
0 E
ast e
leva
tion
and
that
nin
e dr
ums
wer
e w
ithin
the
turb
ine
lube
oil
room
. And
on
4/9/
2007
, the
lice
nsee
per
sonn
el id
entif
ied
that
nin
e 55
gal
oil
drum
s w
ere
loca
ted
in th
e tu
rbin
e lu
be o
il st
orag
e ar
ea a
nd th
at th
is
exce
eded
per
mitt
ed le
vels
.
See
Eve
nt 3
/7/2
001
for
a fu
rthe
r di
scus
sion
on
drum
s co
ntai
ning
lube
oil.
5/7/
2007
Ref
uelin
g ou
tage
Tur
bine
bu
ildin
g T
hree
ace
tyle
ne
cylin
ders
and
on
e ox
ygen
cy
linde
r
Dur
ing
a ro
utin
e pl
ant w
alkd
own,
the
insp
ecto
rs id
entif
ied
that
ther
e w
ere
thre
e ac
etyl
ene
cylin
ders
and
one
oxy
gen
cylin
der
in th
e tu
rbin
e bu
ildin
g ea
st r
oom
.
Gas
cyl
inde
rs r
equi
re a
sub
stan
tial f
ire
even
t to
caus
e th
em to
ove
r pr
essu
rize
and
fail.
No
cred
ible
igni
tion
sour
ce e
xist
s fo
r th
is. A
lso,
this
occ
urre
d du
ring
an
outa
ge.
5/10
/200
7
Ref
uelin
g ou
tage
Tur
bine
bu
ildin
g T
hree
ace
tyle
ne
cylin
ders
and
on
e ox
ygen
cy
linde
r in
clo
se
prox
imity
to
seve
ral 5
5 ga
l dr
ums
of o
il
The
lice
nsee
iden
tifie
d th
at th
e th
ree
acet
ylen
e cy
linde
rs a
nd o
ne o
xyge
n cy
linde
r w
ere
loca
ted
in th
e tu
rbin
e bu
ildin
g 62
0 ea
st
room
and
in c
lose
pro
xim
ity to
sev
eral
55
gal
drum
s of
oil.
See
Eve
nt 5
/7/2
007
for
a fu
rthe
r di
scus
sion
on
gas
cylin
ders
.
See
Eve
nt 3
/7/2
001
for
a fu
rthe
r di
scus
sion
on
drum
s co
ntai
ning
lube
oil.
____________________________________________________________________________________ Inspection Findings Analysis

E-13
Tab
le E
-1
Su
mm
ary
of
no
tab
le in
spec
tio
n f
ind
ing
s re
late
d t
o t
ran
sien
t m
ater
ials
(co
nti
nu
ed)
Dat
e (I
f A
vaila
ble
) an
d
Pla
nt
Sta
tus
Pla
nt
Are
a C
om
bu
stib
le
Typ
e D
escr
ipti
on
R
esp
on
se
5/16
/200
7
Ref
uelin
g ou
tage
Tur
bine
bu
ildin
g
Tw
o ac
etyl
ene
cylin
ders
, a
larg
e am
ount
of
clot
h ra
gs
scat
tere
d on
the
floor
, and
se
vera
l em
pty
woo
den
crat
es
Insp
ecto
rs id
entif
ied
that
ther
e w
ere
two
acet
ylen
e cy
linde
rs, a
larg
e am
ount
of c
loth
ra
gs s
catte
red
on th
e flo
or, a
nd s
ever
al e
mpt
y w
oode
n cr
ates
loca
ted
in th
e tu
rbin
e bu
ildin
g 62
0 ea
st r
oom
.
See
Eve
nt 5
/7/2
007
for
a fu
rthe
r di
scus
sion
on
gas
cylin
ders
. Sca
ttere
d in
dica
tes
disc
ontin
uous
pile
s. S
mal
l pile
s of
rag
s w
ere
test
ed (
07_1
6_00
1,
07_1
6_00
2, 0
7_16
_003
, and
07_
23_0
03).
E
mpt
y w
ood
crat
es a
re n
ot e
asily
igni
ted
give
n ty
pica
l tra
nsie
nt ig
nitio
n so
urce
s (T
est0
93, T
est0
94, a
nd T
est0
97 a
re
surr
ogat
es).
Eve
nt o
ccur
red
durin
g an
out
age.
8/23
/200
7
At p
ower
ED
G r
oom
F
lam
e-re
tard
ant
trea
ted
woo
d sc
affo
ldin
g
Dur
ing
a w
alkd
own,
the
insp
ecto
rs n
oted
that
te
mpo
rary
sca
ffold
ing
inst
alle
d in
the
ED
G
room
s co
ntai
ned
a la
rge
amou
nt o
f woo
d.
The
insp
ecto
rs id
entif
ied
that
the
scaf
fold
did
no
t hav
e a
tran
sien
t com
bust
ible
mat
eria
ls
perm
it bu
t was
con
stru
cted
of f
lam
e-re
tard
ant
trea
ted
woo
d.
Usi
ng in
dust
ry s
tand
ards
, the
insp
ecto
rs
estim
ated
the
woo
d to
be
appr
oxim
atel
y 50
0 lb
., by
mul
tiply
ing
the
appa
rent
boa
rd-f
eet o
f w
ood
by 4
.0 lb
. By
mul
tiply
ing
the
estim
ated
w
eigh
t of t
he w
ood
by 8
000
BT
U p
er p
ound
, th
e in
spec
tors
est
imat
ed th
e he
at o
f co
mbu
stio
n of
the
woo
d at
4.0
MB
TU
.
See
eve
nt 1
0/1/
2005
for
a di
scus
sion
on
scaf
fold
ing
plan
ks. A
dditi
onal
ly, t
hese
w
ere
trea
ted
plan
ks, w
hich
wou
ld fu
rthe
r in
crea
se th
e di
fficu
lty o
f obt
aini
ng
sust
aine
d ig
nitio
n.
____________________________________________________________________________________
Inspection Findings Analysis

E-14
Tab
le E
-1
Su
mm
ary
of
no
tab
le in
spec
tio
n f
ind
ing
s re
late
d t
o t
ran
sien
t m
ater
ials
(co
nti
nu
ed)
Dat
e (I
f A
vaila
ble
) an
d
Pla
nt
Sta
tus
Pla
nt
Are
a C
om
bu
stib
le
Typ
e D
escr
ipti
on
R
esp
on
se
9/19
/200
7
At p
ower
Con
trol
bu
ildin
g
Thr
ee
com
bust
ible
ch
airs
The
una
ttend
ed tr
ansi
ent c
ombu
stib
le
mat
eria
l was
thre
e co
mbu
stib
le c
hairs
. The
te
am n
oted
that
one
of t
he c
hairs
was
loca
ted
bene
ath
som
e of
the
cabl
e tr
ays
in th
e ro
om
whi
ch c
onta
ined
Tra
in B
saf
ety-
rela
ted
safe
sh
utdo
wn
cabl
es. T
he te
am n
oted
that
ther
e w
ere
no o
ther
sou
rces
of h
eat o
r el
ectr
ical
en
ergy
in th
e ro
om th
at w
ould
cau
se th
e ch
airs
to ig
nite
.
Fire
siz
e lik
ely
boun
ded
by th
e pl
astic
ch
air
test
(T
est0
84, T
est0
85, a
nd
Tes
t086
) or
pla
stic
car
t tes
t (T
est1
02,
Tes
t010
5, a
nd T
est0
106)
dep
endi
ng u
pon
the
spec
ific
cons
truc
tion
of th
e ch
airs
.
Fin
ding
not
es n
o ig
nitio
n
sour
ces
pres
ent.
9/28
/200
7
100%
pow
er
Aux
iliar
y bu
ildin
g T
rash
/car
ts
Dur
ing
a pl
ant t
our,
the
insp
ecto
rs id
entif
ied
a co
ncer
n w
ith tw
o no
nmet
allic
car
ts c
onta
inin
g w
hat a
ppea
red
to b
e tr
ash
stor
ed o
n el
evat
ion
354’
in th
e U
nit 1
aux
iliar
y bu
ildin
g.
The
insp
ecto
rs n
oted
the
cart
s an
d th
eir
cont
ents
app
eare
d to
exc
eed
the
allo
wed
tr
ansi
ent C
lass
A c
ombu
stib
le li
mit
for
the
area
of 1
00 lb
.
The
lapt
op+
cart
test
s (T
est1
02, T
est0
105,
T
est0
106)
are
sur
roga
tes
for
this
.
10/1
1/20
07
One
uni
t in
outa
ge, o
ne
unit
at 1
00%
po
wer
Cab
le
spre
adin
g ro
om
Woo
den
box,
a
fiber
boar
d ta
ble,
a
plas
tic c
hair,
a
smal
l tra
sh c
an
cont
aini
ng
pape
r tr
ash,
a
larg
e pl
astic
bag
co
ntai
ning
air
filte
rs, p
last
ic
wra
p ar
ound
el
ectr
ical
gea
r, a
co
mpu
ter
incl
udin
g po
wer
su
pply
cab
les,
Insp
ecto
rs fo
und
unap
prov
ed tr
ansi
ent
com
bust
ible
mat
eria
ls s
tore
d in
the
cabl
e sp
read
ing
room
. The
insp
ecto
rs o
bser
ved
a w
oode
n bo
x, a
fibe
rboa
rd ta
ble,
a p
last
ic
chai
r, a
sm
all t
rash
can
con
tain
ing
pape
r tr
ash,
a la
rge
plas
tic b
ag c
onta
inin
g ai
r fil
ters
, pl
astic
wra
p ar
ound
ele
ctric
al g
ear,
a
com
pute
r in
clud
ing
pow
er s
uppl
y ca
bles
, tw
o pl
astic
com
pute
r st
orag
e ca
ses,
a la
mp,
and
as
sort
ed p
aper
s an
d do
cum
ents
. The
m
ater
ials
wer
e la
rgel
y ou
tage
rel
ated
an
d ha
d be
en le
ft af
ter
outa
ge a
ctiv
ities
w
ere
com
plet
ed.
Indi
vidu
al it
ems
in th
is g
roup
wer
e te
sted
. O
vera
ll, th
e fu
el m
ass
and
haza
rd a
re
sim
ilar
to th
at o
f the
pla
stic
car
t (T
est1
02,
Tes
t010
5, a
ndT
est0
106)
.
____________________________________________________________________________________ Inspection Findings Analysis

E-15
Tab
le E
-1
Su
mm
ary
of
no
tab
le in
spec
tio
n f
ind
ing
s re
late
d t
o t
ran
sien
t m
ater
ials
(co
nti
nu
ed)
Dat
e (I
f A
vaila
ble
) an
d
Pla
nt
Sta
tus
Pla
nt
Are
a C
om
bu
stib
le
Typ
e D
escr
ipti
on
R
esp
on
se
10/1
1/20
07
One
uni
t in
outa
ge, o
ne
unit
at 1
00%
po
wer
(c
ontin
ued)
Cab
le
spre
adin
g ro
om
two
plas
tic
com
pute
r st
orag
e ca
ses,
a
lam
p, a
nd
asso
rted
pap
ers
and
docu
men
ts
11/2
9/20
07
95%
pow
er
(coa
stdo
wn
to r
efue
ling
outa
ge)
Con
trol
bu
ildin
g C
ardb
oard
bo
xes
cont
aini
ng
fluor
esce
nt li
ght
bulb
s
Insp
ecto
rs o
bser
ved
tran
sien
t com
bust
ible
ite
ms
(car
dboa
rd b
oxes
con
tain
ing
fluor
esce
nt
light
bul
bs)
in a
com
bust
ible
free
zon
e.
Qua
ntity
of b
oxes
is n
ot s
peci
fied.
A
sing
le b
ox o
f T8
bulb
s w
ould
hav
e a
surf
ace
area
on
the
orde
r of
the
med
ium
bo
x. T
he la
rge
box
wou
ld b
e eq
uiva
lent
to
thre
e bo
xes.
The
find
ing
only
not
es b
oxes
an
d no
t a la
rge
quan
tity
of b
oxes
. Thi
s w
as li
kely
a s
imila
r ha
zard
to th
e la
rge
box
(Tes
t007
, Tes
t010
, Tes
t014
, and
T
est0
104)
.
12/3
/200
7
97%
pow
er
(coa
stdo
wn
to r
efue
ling
outa
ge)
Con
trol
bu
ildin
g R
ubbe
r ho
ses
and
plas
tic
buck
et
Insp
ecto
rs n
oted
tran
sien
t com
bust
ible
item
s (r
ubbe
r ho
ses
and
plas
tic b
ucke
t) in
the
tran
sien
t com
bust
ible
free
zon
e.
Tes
ted
sim
ilar
item
s su
ch a
s th
e w
ater
ho
se (
Tes
t030
, Tes
t082
, Tes
t083
) an
d pl
astic
buc
kets
:
M
op+
buck
et (
Tes
t024
, Tes
t025
)
B
ucke
t with
deb
ris (
07_2
4_00
1,
07_2
4_00
2, 0
7_24
_003
)
E
mpt
y bu
cket
(07
_31_
001,
07
_31_
002,
07_
31_0
03, 0
7_31
_004
)
____________________________________________________________________________________
Inspection Findings Analysis

E-16
Tab
le E
-1
Su
mm
ary
of
no
tab
le in
spec
tio
n f
ind
ing
s re
late
d t
o t
ran
sien
t m
ater
ials
(co
nti
nu
ed)
Dat
e (I
f A
vaila
ble
) an
d
Pla
nt
Sta
tus
Pla
nt
Are
a C
om
bu
stib
le
Typ
e D
escr
ipti
on
R
esp
on
se
1/15
/200
8
100%
pow
er
Aux
iliar
y bu
ildin
g P
last
ic b
in fi
lled
with
glo
ve li
ners
an
d th
ree-
ring
bind
er
C
otto
n gl
oves
are
not
a s
igni
fican
t haz
ard
as s
how
n by
test
ing
of c
otto
n ra
gs
(07_
17_0
01, 0
7_17
_002
, 07_
17_0
03).
A
thre
e-rin
g bi
nder
is a
lso
not a
sig
nific
ant
haza
rd a
s sh
own
by te
stin
g of
thre
e-rin
g bi
nder
s (0
7_18
_011
, 07_
18_0
12, a
nd
07_1
8_00
3). T
he p
last
ic b
in s
ize
is n
ot
note
d; h
owev
er, i
t is
likel
y bo
unde
d by
ot
her
plas
tic s
tora
ge c
onta
iner
s te
sted
—th
at is
, bou
nded
by
the
2 ga
l buc
ket
(07_
31_0
01, 0
7_31
_002
, 07_
31_0
03,
and
07_3
1_00
4) a
nd th
e fu
ll pl
astic
tras
h ca
n (T
est0
59, T
est0
69, T
est0
72).
3/6/
2008
96%
pow
er
Con
trol
bu
ildin
g P
last
ic to
ol c
art
cont
aini
ng a
pl
astic
tool
box,
ab
sorb
ent p
ads,
an
d ot
her
plas
tic/r
ubbe
r ite
ms
The
insp
ecto
rs o
bser
ved
unat
tend
ed tr
ansi
ent
com
bust
ible
item
s (p
last
ic to
ol c
art c
onta
inin
g a
plas
tic to
olbo
x, a
bsor
bent
pad
s, a
nd o
ther
pl
astic
/rub
ber
item
s) s
tage
d on
the
cont
rol
build
ing
781
elev
atio
n.
Sim
ilar
to la
ptop
+ca
rt te
sts
(Tes
t102
, T
est0
105,
Tes
t010
6).
4/4/
2008
100%
pow
er
Tur
bine
bu
ildin
g S
ix b
ucke
ts o
f re
sin
(tha
t is,
12
lb. o
f res
in
per
buck
et)
In r
espo
nse
to a
n in
spec
tor’s
que
stio
n, th
e lic
ense
e id
entif
ied
six
buck
ets
of r
esin
–tha
t is,
12
lb. o
f res
in p
er b
ucke
t) in
the
turb
ine
build
ing.
Thi
s am
ount
of r
esin
(72
lb.)
ex
ceed
ed th
e lic
ense
e's
fire
prot
ectio
n pr
ogra
m’s
lim
it (t
hat i
s, 2
80,0
00 B
TU
s, th
e eq
uiva
lent
of 2
gal
of g
ener
al p
urpo
se s
olve
nt)
for
tran
sien
t com
bust
ible
mat
eria
l. T
he
addi
tiona
l com
bust
ible
load
ing
from
the
resi
n (s
tyre
ne a
nd r
esin
in a
queo
us m
ixtu
re)
was
1,
296,
000
BT
Us.
Fin
ding
sta
tes
resi
n w
as a
queo
us—
that
is
, con
tain
ed w
ater
. See
Eve
nt 8
/20/
2004
fo
r a
disc
ussi
on o
n io
n ex
chan
ge r
esin
s.
____________________________________________________________________________________ Inspection Findings Analysis

E-17
Tab
le E
-1
Su
mm
ary
of
no
tab
le in
spec
tio
n f
ind
ing
s re
late
d t
o t
ran
sien
t m
ater
ials
(co
nti
nu
ed)
Dat
e (I
f A
vaila
ble
) an
d
Pla
nt
Sta
tus
Pla
nt
Are
a C
om
bu
stib
le
Typ
e D
escr
ipti
on
R
esp
on
se
Bet
wee
n 6/
26/2
008
and
8/11
/200
8
Mul
tiple
bu
ildin
gs
Mul
tiple
m
ater
ials
W
ood
palle
ts in
the
safe
guar
ds
build
ing
hallw
ay
P
last
ic s
heet
s on
top
of th
e U
nit 2
T
rain
B b
atte
ries
E
mpt
y re
sin
barr
els
and
woo
d pa
llets
in th
e sa
fegu
ards
bui
ldin
g ha
llway
H
oses
and
oth
er m
ater
ial i
n au
xilia
ry b
uild
ing
R
opes
, har
ness
es, a
nd o
ther
mat
eria
l in
the
serv
ice
wat
er in
take
str
uctu
re
W
ood
palle
ts a
re n
ot e
asily
igni
ted
with
th
e ty
pes
of ig
nitio
n so
urce
s as
soci
ated
w
ith tr
ansi
ent f
ires.
Pla
stic
she
ets
wer
e te
sted
in th
e fo
llow
ing
conf
igur
atio
ns:
– P
last
ic ta
rp fo
lded
(08
_29_
001,
08
_29_
002,
08_
29_0
03)
– P
last
ic ta
rp d
rape
d (T
est0
17,
Tes
t018
, Tes
t019
, Tes
t020
) –
Fire
-ret
arda
nt p
last
ic ta
rp d
rape
d (T
est0
50, T
est0
51)
and
fold
ed
(Tes
t052
)
Em
pty
resi
n ba
rrel
s an
d w
ood
palle
ts—
if a
larg
e qu
antit
y of
res
in h
ad ju
st
swap
ped
out,
this
was
like
ly a
n
outa
ge e
vent
.
Hos
es w
ere
test
ed in
Tes
t030
, T
est0
82, a
nd T
est0
83.
R
opes
(T
est0
79, T
est0
80, T
est0
81,
08_1
6_00
1, 0
8_16
_002
, 08_
16_0
03,
08_1
6_00
4, 0
8_20
_001
, 08_
20_0
02,
08_2
0_00
3, 0
8_20
_004
, 08_
20_0
05,
08_2
1_00
1, 0
8_21
_002
, 08_
21_0
03,
08_2
1_00
5, 0
8_21
_006
, and
08
_21_
007)
and
har
ness
es
(08_
24_0
01, 0
8_24
_002
, and
08
_24_
003
) w
ere
test
ed.
9/11
/200
8 N
ot s
peci
fied
Nin
e te
mpo
rary
po
wer
cab
les
In p
repa
ratio
n fo
r a
refu
elin
g ou
tage
, nin
e te
mpo
rary
pow
er c
able
s w
ere
stru
ng th
roug
h a
com
bust
ible
con
trol
zon
e w
ithou
t an
engi
neer
ing
eval
uatio
n th
at a
sses
sed
risk
and
esta
blis
hed
com
pens
ator
y m
easu
res.
Pow
er c
ablin
g sh
own
in te
stin
g to
not
re
adily
sup
port
fire
s su
ch a
s in
Tes
ts03
1 th
roug
h 03
6, a
nd 0
8_02
_002
thro
ugh
08_0
3_00
5.
____________________________________________________________________________________
Inspection Findings Analysis

E-18
Tab
le E
-1
Su
mm
ary
of
no
tab
le in
spec
tio
n f
ind
ing
s re
late
d t
o t
ran
sien
t m
ater
ials
(co
nti
nu
ed)
Dat
e (I
f A
vaila
ble
) an
d
Pla
nt
Sta
tus
Pla
nt
Are
a C
om
bu
stib
le
Typ
e D
escr
ipti
on
R
esp
on
se
10/2
2/20
08
100%
pow
er
Aux
iliar
y bu
ildin
g
Pla
stic
cha
ir In
spec
tors
iden
tifie
d a
plas
tic c
hair
stag
ed
adja
cent
to c
able
ris
ers
in th
e au
xilia
ry b
uild
ing.
S
peci
fical
ly, t
he p
last
ic c
hair
was
loca
ted
betw
een
two
cabl
e ris
ers
and
was
less
th
an 2
ft fr
om c
able
ris
ers
cont
aini
ng s
afet
y-re
late
d ca
bles
.
Pla
stic
cha
ir w
as te
sted
(T
est0
84,
Tes
t085
, Tes
t086
).
10/2
4/20
08
Coa
stdo
wn
to r
efue
ling
outa
ge
Aux
iliar
y bu
ildin
g R
esin
/laun
dry
Sev
en b
arre
ls o
f res
in a
nd a
laun
dry
cart
left
outs
ide
of th
e de
sign
ated
sto
rage
loca
tion
on
the
elev
atio
n 35
4 in
the
Uni
t 1 a
uxili
ary
build
ing.
(T
he in
spec
tors
not
ed th
at th
e ba
rrel
s an
d th
e la
undr
y ca
rt a
ppea
red
to e
xcee
d th
e al
low
able
tran
sien
t Cla
ss A
com
bust
ible
lim
it fo
r th
e ar
ea o
f 100
lb.)
.
Laun
dry
cart
is li
kely
rep
rese
nted
by
the
lapt
op+
cart
test
s (T
est1
02, T
est0
105,
T
est0
106)
. Ion
exc
hang
e re
sins
are
ty
pica
lly p
acke
d m
oist
and
do
not r
eadi
ly
supp
ort a
fire
unt
il th
e w
ater
is d
riven
out
. T
his
wou
ld r
equi
re a
larg
e he
at s
ourc
e w
ell b
eyon
d th
e ty
pes
of ig
nitio
n so
urce
s se
en in
ope
ratio
nal e
xper
ienc
e.
11/4
/200
8
100%
pow
er
Unk
now
n F
iber
glas
s ca
rt
with
rag
s an
d to
ols
The
insp
ecto
rs id
entif
ied
an u
natte
nded
fib
ergl
ass
cart
with
rag
s an
d to
ols
in th
e up
per
tray
adj
acen
t to
a ca
ble
riser
con
tain
ing
emer
genc
y sh
utdo
wn
syst
em c
able
s.
Pla
stic
car
t tes
ted
(Tes
t102
, Tes
t010
5,
Tes
t010
6) w
as m
ore
seve
re th
an a
fib
ergl
ass
cart
.
11/6
/200
8
100%
pow
er
Unk
now
n B
lack
foam
sh
eet o
f in
sula
tion
mat
eria
l
A b
lack
foam
she
et o
f ins
ulat
ion
mat
eria
l, ap
prox
imat
ely
0.19
m2
(2 ft
2 ), w
as le
ft be
hind
an
d ad
jace
nt to
a c
able
ris
er c
onta
inin
g re
acto
r pr
otec
tion
syst
em c
able
s.
Tw
o sq
uare
feet
of f
oam
insu
latio
n is
a
smal
l qua
ntity
of m
ater
ial a
nd b
ound
ed b
y m
any
item
s te
sted
.
____________________________________________________________________________________ Inspection Findings Analysis
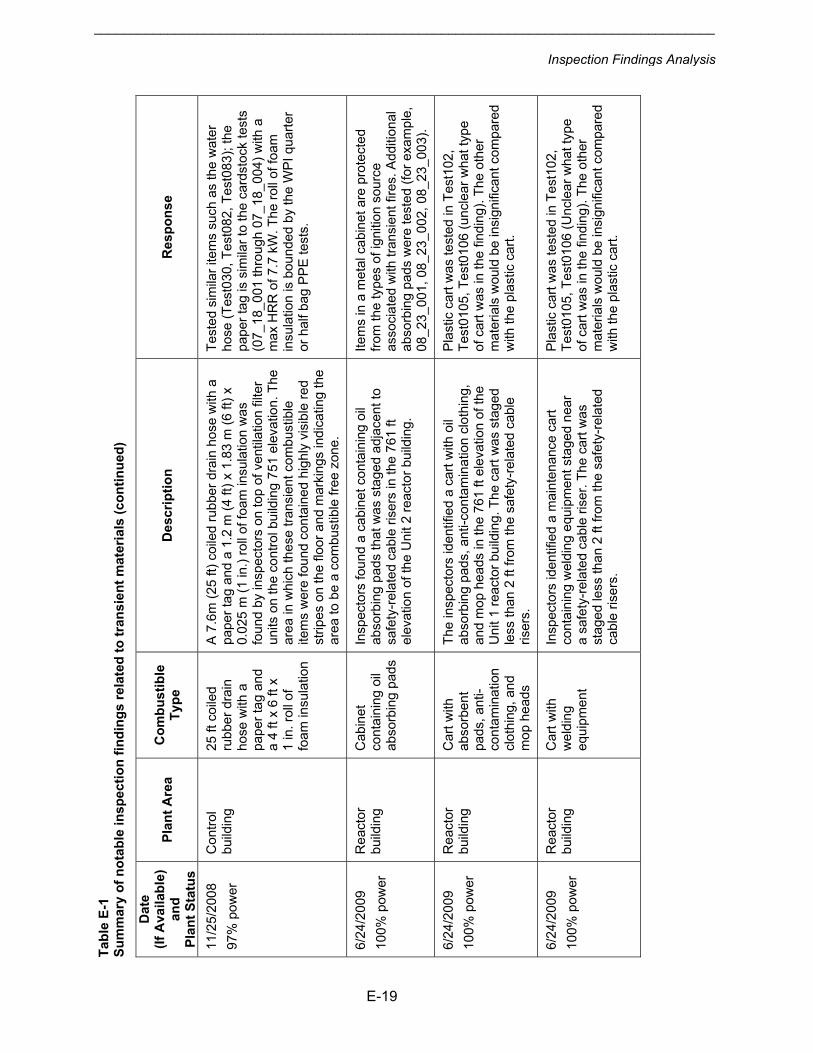
E-19
Tab
le E
-1
Su
mm
ary
of
no
tab
le in
spec
tio
n f
ind
ing
s re
late
d t
o t
ran
sien
t m
ater
ials
(co
nti
nu
ed)
Dat
e (I
f A
vaila
ble
) an
d
Pla
nt
Sta
tus
Pla
nt
Are
a C
om
bu
stib
le
Typ
e D
escr
ipti
on
R
esp
on
se
11/2
5/20
08
97%
pow
er
Con
trol
bu
ildin
g 25
ft c
oile
d ru
bber
dra
in
hose
with
a
pape
r ta
g an
d a
4 ft
x 6
ft x
1
in. r
oll o
f fo
am in
sula
tion
A 7
.6m
(25
ft)
coile
d ru
bber
dra
in h
ose
with
a
pape
r ta
g an
d a
1.2
m (
4 ft)
x 1
.83
m (
6 ft)
x
0.02
5 m
(1
in.)
rol
l of f
oam
insu
latio
n w
as
foun
d by
insp
ecto
rs o
n to
p of
ven
tilat
ion
filte
r un
its o
n th
e co
ntro
l bui
ldin
g 75
1 el
evat
ion.
The
ar
ea in
whi
ch th
ese
tran
sien
t com
bust
ible
ite
ms
wer
e fo
und
cont
aine
d hi
ghly
vis
ible
red
st
ripes
on
the
floor
and
mar
king
s in
dica
ting
the
area
to b
e a
com
bust
ible
free
zon
e.
Tes
ted
sim
ilar
item
s su
ch a
s th
e w
ater
ho
se (
Tes
t030
, Tes
t082
, Tes
t083
); th
e pa
per
tag
is s
imila
r to
the
card
stoc
k te
sts
(07_
18_0
01 th
roug
h 07
_18_
004)
with
a
max
HR
R o
f 7.7
kW
. The
rol
l of f
oam
in
sula
tion
is b
ound
ed b
y th
e W
PI q
uart
er
or h
alf b
ag P
PE
test
s.
6/24
/200
9
100%
pow
er
Rea
ctor
bu
ildin
g C
abin
et
cont
aini
ng o
il ab
sorb
ing
pads
Insp
ecto
rs fo
und
a ca
bine
t con
tain
ing
oil
abso
rbin
g pa
ds th
at w
as s
tage
d ad
jace
nt to
sa
fety
-rel
ated
cab
le r
iser
s in
the
761
ft el
evat
ion
of th
e U
nit 2
rea
ctor
bui
ldin
g.
Item
s in
a m
etal
cab
inet
are
pro
tect
ed
from
the
type
s of
igni
tion
sour
ce
asso
ciat
ed w
ith tr
ansi
ent f
ires.
Add
ition
al
abso
rbin
g pa
ds w
ere
test
ed (
for
exam
ple,
08
_23_
001,
08_
23_0
02, 0
8_23
_003
).
6/24
/200
9
100%
pow
er
Rea
ctor
bu
ildin
g C
art w
ith
abso
rben
t pa
ds, a
nti-
cont
amin
atio
n cl
othi
ng, a
nd
mop
hea
ds
The
insp
ecto
rs id
entif
ied
a ca
rt w
ith o
il ab
sorb
ing
pads
, ant
i-con
tam
inat
ion
clot
hing
, an
d m
op h
eads
in th
e 76
1 ft
elev
atio
n of
the
Uni
t 1 r
eact
or b
uild
ing.
The
car
t was
sta
ged
less
than
2 ft
from
the
safe
ty-r
elat
ed c
able
ris
ers.
Pla
stic
car
t was
test
ed in
Tes
t102
, T
est0
105,
Tes
t010
6 (u
ncle
ar w
hat t
ype
of
car
t was
in th
e fin
ding
). T
he o
ther
m
ater
ials
wou
ld b
e in
sign
ifica
nt c
ompa
red
with
the
plas
tic c
art.
6/24
/200
9
100%
pow
er
Rea
ctor
bu
ildin
g C
art w
ith
wel
ding
eq
uipm
ent
Insp
ecto
rs id
entif
ied
a m
aint
enan
ce c
art
cont
aini
ng w
eldi
ng e
quip
men
t sta
ged
near
a
safe
ty-r
elat
ed c
able
ris
er. T
he c
art w
as
stag
ed le
ss th
an 2
ft fr
om th
e sa
fety
-rel
ated
ca
ble
riser
s.
Pla
stic
car
t was
test
ed in
Tes
t102
, T
est0
105,
Tes
t010
6 (U
ncle
ar w
hat t
ype
of
car
t was
in th
e fin
ding
). T
he o
ther
m
ater
ials
wou
ld b
e in
sign
ifica
nt c
ompa
red
with
the
plas
tic c
art.
____________________________________________________________________________________
Inspection Findings Analysis

E-20
Tab
le E
-1
Su
mm
ary
of
no
tab
le in
spec
tio
n f
ind
ing
s re
late
d t
o t
ran
sien
t m
ater
ials
(co
nti
nu
ed)
Dat
e (I
f A
vaila
ble
) an
d
Pla
nt
Sta
tus
Pla
nt
Are
a C
om
bu
stib
le
Typ
e D
escr
ipti
on
R
esp
on
se
9/29
/200
9
96%
pow
er
Die
sel
gene
rato
r bu
ildin
g
1 qt
mot
or o
il,
1 pt
. lub
ricat
ing
oil,
and
plas
tic
debr
is it
ems
A p
last
ic c
onta
iner
with
abo
ut 0
.95
liter
s (1
qu
art)
of m
otor
oil,
a p
last
ic c
onta
iner
with
ab
out 0
.47
liter
s (1
pin
t) o
f lub
ricat
ing
oil,
an
empt
y co
llaps
ible
pla
stic
con
tain
er, a
pla
stic
bo
ttle
half-
fille
d w
ith w
hat a
ppea
red
to b
e a
soap
-bub
ble
and
wat
er s
olut
ion
used
for
leak
de
tect
ion
on p
ipe
fittin
gs, t
wo
pape
r to
wel
s,
and
othe
r as
sort
ed s
mal
l deb
ris it
ems
unde
rnea
th tw
o ai
r re
ceiv
er ta
nks
in th
e di
esel
ge
nera
tor
vent
ilatio
n fa
n ro
om. T
he a
rea
in
whi
ch th
ese
tran
sien
t com
bust
ible
item
s w
ere
foun
d co
ntai
ned
high
ly v
isib
le r
ed s
trip
ed p
aint
on
the
floor
and
mar
king
s in
dica
ting
the
area
to
be a
com
bust
ible
fr
ee z
one.
The
des
crip
tion
sugg
ests
that
thes
e w
ere
indi
vidu
al it
ems
loca
ted
near
one
ano
ther
. T
he o
nly
item
s th
at a
re e
asily
igni
tabl
e ar
e th
e pa
per
tow
els
and
debr
is. B
ased
on
the
test
ing
of p
last
ic c
onta
iner
s fil
led
with
oil,
it is
unl
ikel
y th
at e
ither
the
pape
r to
wel
s or
sm
all a
mou
nts
of d
ebris
wou
ld
be c
apab
le o
f hea
ting
the
oil c
onta
iner
s to
fa
ilure
and
then
als
o he
atin
g an
y sp
illin
g hi
gh fl
ashp
oint
liqu
ids
to ig
nitio
n.
12/3
0/20
09
91%
pow
er
(coa
stdo
wn
to r
efue
ling
outa
ge)
Aux
iliar
y bu
ildin
g pe
rson
nel
hatc
h ar
ea
Com
pres
sed
gas
cylin
ders
co
ntai
ning
fla
mm
able
g
ass
es
(oxy
gen
and
prop
ylen
e)
Insp
ecto
rs id
entif
ied
two
unat
tend
ed
com
pres
sed
gas
cylin
ders
con
tain
ing
flam
mab
le g
asse
s (o
xyge
n an
d pr
opyl
ene)
in
the
auxi
liary
bui
ldin
g.
See
Eve
nt 5
/7/2
007
for
a fu
rthe
r di
scus
sion
on
gas
cylin
ders
.
____________________________________________________________________________________ Inspection Findings Analysis

E-21
Tab
le E
-1
Su
mm
ary
of
no
tab
le in
spec
tio
n f
ind
ing
s re
late
d t
o t
ran
sien
t m
ater
ials
(co
nti
nu
ed)
Dat
e (I
f A
vaila
ble
) an
d
Pla
nt
Sta
tus
Pla
nt
Are
a C
om
bu
stib
le
Typ
e D
escr
ipti
on
R
esp
on
se
1/22
/201
0
100%
pow
er
Con
trol
roo
m
heat
ing
and
vent
ilatio
n eq
uipm
ent r
oom
200
lb. o
f lu
mbe
r D
urin
g a
fire
prot
ectio
n in
spec
tion
activ
ity, t
he
insp
ecto
rs d
isco
vere
d sc
affo
ldin
g er
ecte
d in
the
cont
rol r
oom
hea
ting
and
vent
ilatio
n eq
uipm
ent
room
. Tra
nsie
nt c
ombu
stib
les
tota
ling
less
than
10
0 lb
. of l
umbe
r m
ay b
e in
trod
uced
into
a L
evel
2
cont
rol a
rea
with
out p
erfo
rmin
g a
tran
sien
t co
mbu
stib
le e
valu
atio
n. H
owev
er, b
ecau
se th
e sc
affo
ldin
g ap
pear
ed to
use
mor
e th
an 1
00 lb
. of
lum
ber,
the
insp
ecto
r re
ques
ted
to v
iew
the
tran
sien
t com
bust
ible
eva
luat
ion
for
the
area
. N
o tr
ansi
ent c
ombu
stib
le e
valu
atio
n ha
d be
en
perf
orm
ed. W
hen
a tr
ansi
ent c
ombu
stib
le
eval
uatio
n w
as p
erfo
rmed
, it w
as d
isco
vere
d th
at th
e ro
om c
onta
ined
ove
r 20
0 lb
. of l
umbe
r.
Tes
ting
show
ed th
at u
ntre
ated
di
men
sion
al lu
mbe
r ex
pose
d to
typi
cal
tran
sien
t ign
ition
sou
rces
will
not
su
stai
n a
fire.
Dat
e no
t sp
ecifi
ed
Hig
h-pr
essu
re
cool
ant i
njec
tion
pum
p ro
om
Thr
ee
fiber
glas
s ex
tens
ion
ladd
ers,
ap
prox
imat
ely
100
ft of
ru
bber
hos
e, a
pl
astic
buc
ket,
and
two
wor
k bo
xes
with
un
know
n co
nten
ts
The
com
bust
ible
s no
ted
wer
e no
t con
trol
led
in
acco
rdan
ce w
ith th
e pl
ant t
rans
ient
com
bust
ible
co
ntro
l req
uire
men
ts.
Fib
ergl
ass
does
not
rea
dily
sup
port
co
mbu
stio
n.
Sim
ilar
item
s w
ere
test
ed:
W
ater
hos
e (T
est0
30, T
est0
82,
Tes
t083
)
B
ucke
t with
deb
ris (
07_2
4_00
1,
07_2
4_00
2, 0
7_24
_003
)
E
mpt
y bu
cket
(07
_31_
001,
07
_31_
002,
07_
31_0
03, 0
7_31
_004
)
M
ediu
m b
ox w
ith p
aper
(08
_06_
004,
08
_06_
005,
08_
06_0
06)
____________________________________________________________________________________
Inspection Findings Analysis

E-22
Tab
le E
-1
Su
mm
ary
of
no
tab
le in
spec
tio
n f
ind
ing
s re
late
d t
o t
ran
sien
t m
ater
ials
(co
nti
nu
ed)
Dat
e (I
f A
vaila
ble
) an
d
Pla
nt
Sta
tus
Pla
nt
Are
a C
om
bu
stib
le
Typ
e D
escr
ipti
on
R
esp
on
se
Dat
e no
t sp
ecifi
ed
(con
tinue
d)
Med
ium
box
with
pea
nuts
(0
8_06
_007
, 08_
06_0
08,
08_0
6_00
9)
La
rge
box
with
pea
nuts
(T
est0
08,
Tes
t011
, Tes
t015
)
La
rge
box
with
pap
er (
Tes
t009
, T
est0
12, T
est0
16)
Dat
e no
t sp
ecifi
ed
Aux
iliar
y bu
ildin
g S
even
55
gal
drum
s of
w
aste
lu
bric
atio
n oi
l
Sev
en 5
5 ga
l dru
ms
of w
aste
lubr
icat
ion
oil
stor
ed in
the
com
mon
ele
ctric
al a
cces
s ar
ea
adja
cent
to th
e fo
ur E
DG
roo
ms.
See
Eve
nt 3
/7/2
001
for
a fu
rthe
r di
scus
sion
on
drum
s co
ntai
ning
lube
oil.
Dat
e no
t sp
ecifi
ed
Mai
n st
eam
va
lve
encl
osur
e bu
ildin
g
Tw
o pi
les
of
plyw
ood
The
insp
ecto
rs d
iscu
ssed
the
exis
ting
perm
it w
ith a
fire
pro
tect
ion
engi
neer
with
res
pect
to
the
tota
l fire
load
ing
for
the
area
bec
ause
two
pile
s of
ply
woo
d in
the
area
app
eare
d to
be
in
exc
ess
of th
e as
sum
ed fi
re lo
adin
g on
th
e pe
rmit.
The
fire
sev
erity
cla
ssifi
catio
n fo
r th
e bu
ildin
g is
st
ated
as
insi
gnifi
cant
bas
ed o
n a
tota
l fire
lo
adin
g of
less
than
650
0 B
TU
/ft2 .
Bas
ed o
n th
e fir
e lo
adin
g ad
ded
by th
e tw
o pi
les
of p
lyw
ood,
th
e fin
al c
alcu
late
d to
tal f
ire lo
adin
g in
crea
sed
to
appr
oxim
atel
y 71
00 B
TU
/ft2 .
Giv
en th
at th
e pe
rmis
sibl
e lo
adin
g
in th
is a
rea
was
650
0 B
TU
/ft2
and
th
e ac
tual
load
ing
was
710
0 B
TU
/ft2
(10%
exc
ess)
, thi
s do
es n
ot a
ppea
r to
be
a s
igni
fican
t fin
ding
bec
ause
ca
lcul
atio
ns fo
r pe
rmis
sibl
e lo
adin
g ar
e ge
nera
lly c
onse
rvat
ive
in n
atur
e.
____________________________________________________________________________________ Inspection Findings Analysis

E-23
Tab
le E
-1
Su
mm
ary
of
no
tab
le in
spec
tio
n f
ind
ing
s re
late
d t
o t
ran
sien
t m
ater
ials
(co
nti
nu
ed)
Dat
e (I
f A
vaila
ble
) an
d
Pla
nt
Sta
tus
Pla
nt
Are
a C
om
bu
stib
le
Typ
e D
escr
ipti
on
R
esp
on
se
Dat
e no
t sp
ecifi
ed
Not
spe
cifie
d in
re
port
W
eldi
ng c
able
s,
rubb
er h
oses
, co
tton
stor
age
bags
, and
an
oxyg
en-a
cety
lene
ga
s w
eldi
ng r
ig
The
insp
ecto
rs p
erfo
rmed
a w
alkd
own
of th
e st
andb
y liq
uid
cont
rol a
rea.
The
insp
ecto
rs
iden
tifie
d th
at a
roo
m lo
cate
d w
ithin
the
area
an
d ad
jace
nt to
saf
ety-
rela
ted
switc
hgea
r co
ntai
ned
a si
gnifi
cant
am
ount
of c
ombu
stib
le
mat
eria
ls. S
peci
fical
ly, w
eldi
ng c
able
s, r
ubbe
r ho
ses,
cot
ton
stor
age
bags
, and
an
oxyg
en-
acet
ylen
e ga
s w
eldi
ng r
ig w
ere
foun
d in
the
room
.
The
onl
y ea
sily
igni
ted
item
iden
tifie
d w
as c
otto
n st
orag
e ba
gs (
sim
ilar
to
bag
of r
ags:
07_
17_0
01, 0
7_17
_002
, an
d 07
_17_
003)
, whi
ch w
ould
hav
e lo
w H
RR
s. R
ubbe
r ho
se (
Tes
t030
, T
est0
82, a
nd T
est0
83)
and
wel
ding
ca
bles
(T
est0
34, T
est0
35, a
nd
Tes
t036
) ar
e no
t eas
ily ig
nite
d, a
nd
test
ing
show
s lo
w H
RR
s. U
nlik
ely
this
m
ater
ial w
ould
fail
a co
mpr
esse
d
gas
cylin
der.
Dat
e no
t sp
ecifi
ed, b
ut
occu
rred
du
ring
refu
elin
g ou
tage
Con
tain
men
t 11
dru
ms
of
lubr
icat
ing
oil a
nd
stor
age
shel
ves
of r
adia
tion
prot
ectio
n m
ater
ials
The
mat
eria
l in
the
cont
ainm
ent b
uild
ing
incl
uded
11
drum
s of
lubr
icat
ing
oil a
nd
stor
age
shel
ves
of r
adia
tion
prot
ectio
n m
ater
ials
(cl
othi
ng a
nd p
last
ic c
onta
min
atio
n co
ntro
l clo
thin
g an
d su
pplie
s).
See
Eve
nt 3
/7/2
001
for
a fu
rthe
r di
scus
sion
on
drum
s co
ntai
ning
lu
be o
il.
PP
E s
tora
ge w
as te
sted
(W
PI
PP
E b
ags)
.
Dat
e no
t sp
ecifi
ed, b
ut
occu
rred
du
ring
refu
elin
g ou
tage
Tur
bine
bui
ldin
g E
ight
dru
ms
of
was
te o
il In
spec
tor
iden
tifie
d ei
ght d
rum
s of
was
te o
il in
th
e tu
rbin
e bu
ildin
g ad
jace
nt to
aux
iliar
y fe
edw
ater
pum
p an
d E
DG
roo
ms.
Eve
nt o
ccur
red
durin
g a
refu
elin
g ou
tage
.
____________________________________________________________________________________
Inspection Findings Analysis

E-24
Tab
le E
-1
Su
mm
ary
of
no
tab
le in
spec
tio
n f
ind
ing
s re
late
d t
o t
ran
sien
t m
ater
ials
(co
nti
nu
ed)
Dat
e (I
f A
vaila
ble
) an
d
Pla
nt
Sta
tus
Pla
nt
Are
a C
om
bu
stib
le
Typ
e D
escr
ipti
on
R
esp
on
se
Dat
e no
t sp
ecifi
ed, b
ut
occu
rred
du
ring
refu
elin
g ou
tage
Rea
ctor
bui
ldin
g S
ix 5
5 ga
l bar
rels
of
lubr
icat
ing
oil,
stor
age
shel
ves
and
rack
s of
ra
diat
ion
prot
ectio
n m
ater
ials
, bag
s of
ac
cum
ulat
ed
was
te, t
empo
rary
ca
bles
and
ho
ses,
and
pl
astic
shi
ppin
g co
ntai
ners
The
mat
eria
ls in
the
reac
tor
build
ing
incl
uded
si
x 55
gal
bar
rels
of l
ubric
atin
g oi
l, st
orag
e sh
elve
s an
d ra
cks
of r
adia
tion
prot
ectio
n m
ater
ials
(cl
oth,
pap
er, a
nd p
last
ic
cont
amin
atio
n co
ntro
l sup
plie
s), b
ags
of
accu
mul
ated
was
te (
clot
h, p
aper
, and
pla
stic
),
tem
pora
ry c
able
s an
d ho
ses,
and
pla
stic
sh
ippi
ng c
onta
iner
s. P
erm
its d
id n
ot e
xist
for
the
stor
age
of th
ese
mat
eria
ls. S
ever
al
pote
ntia
l ign
ition
sou
rces
wer
e id
entif
ied
incl
udin
g w
eldi
ng, g
rindi
ng, a
nd u
se o
f po
rtab
le o
r te
mpo
rary
ele
ctric
al e
quip
men
t.
Eve
nt o
ccur
red
durin
g a
refu
elin
g ou
tage
. See
Eve
nt 3
/7/2
001
for
a fu
rthe
r di
scus
sion
on
drum
s co
ntai
ning
lu
be o
il.
Dat
e no
t sp
ecifi
ed
Die
sel g
ener
ator
co
ntro
l roo
m
Woo
den
tabl
es
with
com
pute
r,
mon
itor,
and
pr
inte
rs
Eac
h ro
om h
ad a
woo
den
tabl
e w
ith a
co
mpu
ter,
mon
itor,
and
a p
rinte
r se
t on
them
. T
he in
spec
tors
iden
tifie
d el
ectr
ical
rel
ay
pane
ls th
at s
uppo
rted
die
sel g
ener
ator
op
erat
ion
wer
e lo
cate
d ac
ross
equ
ipm
ent
aisl
es a
ppro
xim
atel
y 3.
5 ft
from
the
edge
of
the
tabl
es.
Sol
id d
imen
sion
al w
ood
is n
ot e
asily
ig
nite
d w
ith th
e ty
pes
of ig
nitio
n so
urce
as
soci
ated
with
tran
sien
t eve
nts.
The
ov
eral
l fue
l pac
kage
of a
tabl
e pl
us
com
pute
r ha
rdw
are,
if fu
lly in
volv
ed
wou
ld b
e si
mila
r to
the
plas
tic w
ork
cart
(T
est1
02, T
est0
105,
and
T
est0
106)
.
____________________________________________________________________________________ Inspection Findings Analysis

E-25
Tab
le E
-1
Su
mm
ary
of
no
tab
le in
spec
tio
n f
ind
ing
s re
late
d t
o t
ran
sien
t m
ater
ials
(co
nti
nu
ed)
Dat
e (I
f A
vaila
ble
) an
d
Pla
nt
Sta
tus
Pla
nt
Are
a C
om
bu
stib
le
Typ
e D
escr
ipti
on
R
esp
on
se
Dat
e no
t sp
ecifi
ed
Spe
nt-f
uel p
ool
build
ing
Can
of s
pray
pa
int a
nd a
can
of
an
adhe
sive
ch
emic
al
Fla
mm
able
che
mic
als
(tha
t is,
a c
an o
f spr
ay
pain
t and
a c
an o
f an
adhe
sive
che
mic
al)
wer
e st
ored
on
an o
pen
wor
kben
ch lo
cate
d on
the
100
elev
atio
n of
the
build
ing.
The
insp
ecto
r al
so
obse
rved
oth
er tr
ansi
ent c
ombu
stib
le m
ater
ials
in
clud
ing
a pi
le o
f unu
sed
tem
pora
ry c
able
s th
at
wer
e lo
cate
d on
the
130
elev
atio
n of
the
spen
t-fu
el p
ool b
uild
ing.
Fla
mm
able
mas
s of
can
s on
the
orde
r of
the
flam
mab
le li
quid
s te
sted
(T
est0
56, T
est0
60, a
nd T
est0
61).
C
hem
ical
s in
a s
pray
can
wou
ld
requ
ire a
sev
ere
igni
tion
sour
ce to
fail
the
can
and
igni
te th
e co
nten
ts.
Dat
e no
t sp
ecifi
ed
Rel
ay r
oom
T
hree
cha
irs,
two
woo
den
broo
ms,
a fi
ling
cabi
net,
a pr
inte
r, a
nd
vario
us
elec
tric
al
com
pone
nts
Spe
cific
ally
, the
team
iden
tifie
d th
ree
chai
rs, t
wo
woo
den
broo
ms,
a fi
ling
cabi
net,
a co
mpu
ter
prin
ter,
and
var
ious
ele
ctric
al c
ompo
nent
s th
at
wer
e no
t ana
lyze
d fo
r co
mbu
stib
le lo
adin
g.
Item
s in
a m
etal
filin
g ca
bine
t are
not
a
sign
ifica
nt h
azar
d. O
vera
ll, th
is is
like
ly
less
sev
ere
than
the
plas
tic c
art t
est
(Tes
t102
, Tes
t010
5, a
nd T
est0
106)
.
Dat
e no
t sp
ecifi
ed
Con
tain
men
t P
ropa
ne to
be
appr
oxim
atel
y 33
.5 lb
. of l
iqui
d an
d ca
lcul
ated
th
e co
mbu
stib
le
load
ing
to b
e ap
prox
imat
ely
772,
000
BT
U.
Dur
ing
a w
alkd
own,
the
insp
ecto
rs n
oted
th
at a
tem
pora
ry p
ropa
ne c
ylin
der
for
a ge
nera
tor
cont
aine
d a
larg
e am
ount
of p
ropa
ne.
The
insp
ecto
rs id
entif
ied
that
the
prop
ane
cylin
der
did
not h
ave
a tr
ansi
ent c
ombu
stib
le
mat
eria
ls p
erm
it.
Usi
ng in
dust
ry s
tand
ards
, the
insp
ecto
rs
estim
ated
the
prop
ane
to b
e ap
prox
imat
ely
33
.5 lb
. of l
iqui
d an
d ca
lcul
ated
the
com
bust
ible
lo
adin
g to
be
appr
oxim
atel
y 77
2,00
0 B
TU
.
Hig
hly
unlik
ely
that
the
igni
tion
sour
ces
seen
in o
pera
tiona
l exp
erie
nce
wou
ld
resu
lt in
the
failu
re o
f a p
ropa
ne
cylin
der.
____________________________________________________________________________________
Inspection Findings Analysis
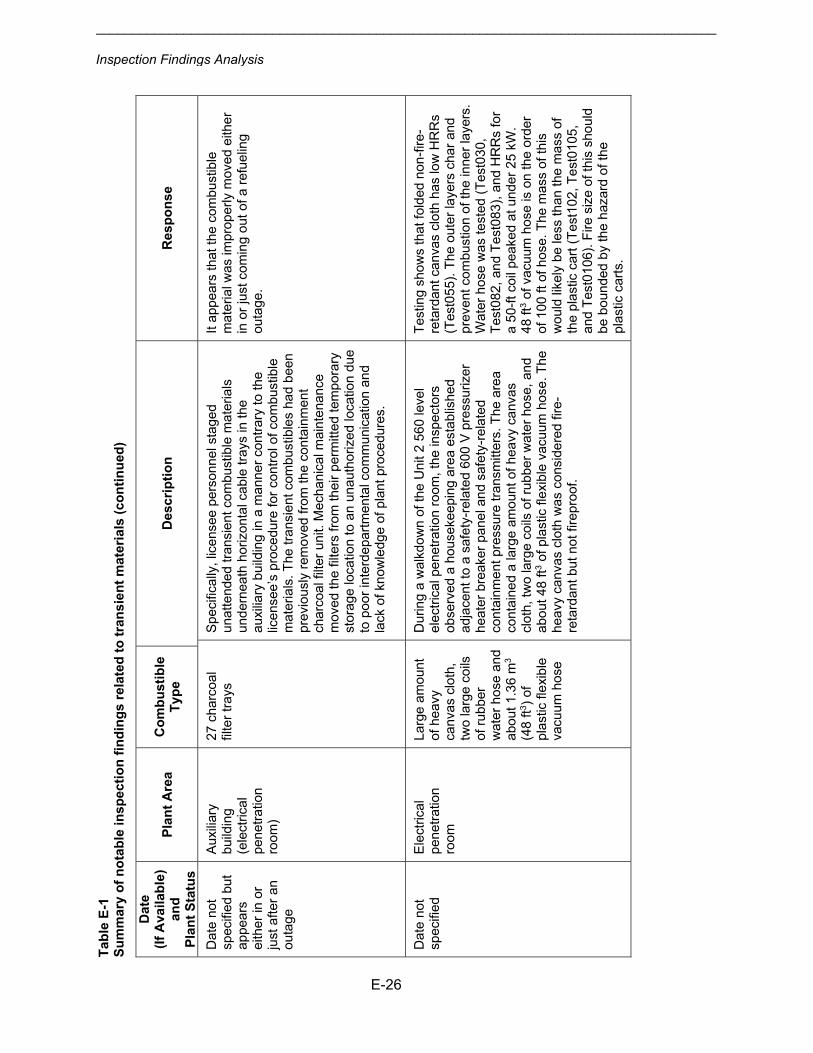
E-26
Tab
le E
-1
Su
mm
ary
of
no
tab
le in
spec
tio
n f
ind
ing
s re
late
d t
o t
ran
sien
t m
ater
ials
(co
nti
nu
ed)
Dat
e (I
f A
vaila
ble
) an
d
Pla
nt
Sta
tus
Pla
nt
Are
a C
om
bu
stib
le
Typ
e D
escr
ipti
on
R
esp
on
se
Dat
e no
t sp
ecifi
ed b
ut
appe
ars
eith
er in
or
just
afte
r an
ou
tage
Aux
iliar
y bu
ildin
g (e
lect
rical
pe
netr
atio
n ro
om)
27 c
harc
oal
filte
r tr
ays
Spe
cific
ally
, lic
ense
e pe
rson
nel s
tage
d un
atte
nded
tran
sien
t com
bust
ible
mat
eria
ls
unde
rnea
th h
oriz
onta
l cab
le tr
ays
in th
e au
xilia
ry b
uild
ing
in a
man
ner
cont
rary
to th
e lic
ense
e’s
proc
edur
e fo
r co
ntro
l of c
ombu
stib
le
mat
eria
ls. T
he tr
ansi
ent c
ombu
stib
les
had
been
pr
evio
usly
rem
oved
from
the
cont
ainm
ent
char
coal
filte
r un
it. M
echa
nica
l mai
nten
ance
m
oved
the
filte
rs fr
om th
eir
perm
itted
tem
pora
ry
stor
age
loca
tion
to a
n un
auth
oriz
ed lo
catio
n du
e to
poo
r in
terd
epar
tmen
tal c
omm
unic
atio
n an
d la
ck o
f kno
wle
dge
of p
lant
pro
cedu
res.
It ap
pear
s th
at th
e co
mbu
stib
le
mat
eria
l was
impr
oper
ly m
oved
eith
er
in o
r ju
st c
omin
g ou
t of a
ref
uelin
g ou
tage
.
Dat
e no
t sp
ecifi
ed
Ele
ctric
al
pene
trat
ion
room
Larg
e am
ount
of
hea
vy
canv
as c
loth
, tw
o la
rge
coils
of
rub
ber
wat
er h
ose
and
abou
t 1.3
6 m
3 (4
8 ft3 )
of
plas
tic fl
exib
le
vacu
um h
ose
Dur
ing
a w
alkd
own
of th
e U
nit 2
560
leve
l el
ectr
ical
pen
etra
tion
room
, the
insp
ecto
rs
obse
rved
a h
ouse
keep
ing
area
est
ablis
hed
adja
cent
to a
saf
ety-
rela
ted
600
V p
ress
uriz
er
heat
er b
reak
er p
anel
and
saf
ety-
rela
ted
cont
ainm
ent p
ress
ure
tran
smitt
ers.
The
are
a co
ntai
ned
a la
rge
amou
nt o
f hea
vy c
anva
s cl
oth,
two
larg
e co
ils o
f rub
ber
wat
er h
ose,
and
ab
out 4
8 ft3
of p
last
ic fl
exib
le v
acuu
m h
ose.
The
he
avy
canv
as c
loth
was
con
side
red
fire-
reta
rdan
t but
not
fire
proo
f.
Tes
ting
show
s th
at fo
lded
non
-fire
-re
tard
ant c
anva
s cl
oth
has
low
HR
Rs
(Tes
t055
). T
he o
uter
laye
rs c
har
and
prev
ent c
ombu
stio
n of
the
inne
r la
yers
. W
ater
hos
e w
as te
sted
(T
est0
30,
Tes
t082
, and
Tes
t083
), a
nd H
RR
s fo
r a
50-f
t coi
l pea
ked
at u
nder
25
kW.
48 ft
3 of
vac
uum
hos
e is
on
the
orde
r of
100
ft o
f hos
e. T
he m
ass
of th
is
wou
ld li
kely
be
less
than
the
mas
s of
th
e pl
astic
car
t (T
est1
02, T
est0
105,
an
d T
est0
106)
. Fire
siz
e of
this
sho
uld
be b
ound
ed b
y th
e ha
zard
of t
he
plas
tic c
arts
.
____________________________________________________________________________________ Inspection Findings Analysis

E-27
Tab
le E
-1
Su
mm
ary
of
no
tab
le in
spec
tio
n f
ind
ing
s re
late
d t
o t
ran
sien
t m
ater
ials
(co
nti
nu
ed)
Dat
e (I
f A
vaila
ble
) an
d
Pla
nt
Sta
tus
Pla
nt
Are
a C
om
bu
stib
le
Typ
e D
escr
ipti
on
R
esp
on
se
Unk
now
n U
nkno
wn
At l
east
100
lb.
of r
ubbe
r di
aphr
agm
s an
d ho
ses
Not
ava
ilabl
e.
See
eve
nt 6
/9/2
000
for
a di
scus
sion
of
quan
titie
s of
rub
ber
mat
eria
l.
Unk
now
n T
urbi
ne b
uild
ing
Mul
tiple
can
s of
un
know
n co
mbu
stib
le
mat
eria
ls
Not
ava
ilabl
e.
Item
s in
a s
eale
d m
etal
can
are
not
ea
sily
igni
ted
with
the
type
s of
igni
tion
sour
ces
asso
ciat
ed w
ith tr
ansi
ent f
ires.
____________________________________________________________________________________
Inspection Findings Analysis


NRC FORM 335 U.S. NUCLEAR REGULATORY COMMISSION (12-2010) NRCMD 3.7
BIBLIOGRAPHIC DATA SHEET (See instructions on the reverse)
1. REPORT NUMBER (Assigned by NRC, Add Vol., Supp., Rev., and Addendum Numbers, if any.)
NUREG-2233
2. TITLE AND SUBTITLE
Methodology for Modeling Transient Fires in Nuclear Power Plant Fire Probabilistic Risk Assessment
3. DATE REPORT PUBLISHED
MONTH
October YEAR
2020
4. FIN OR GRANT NUMBER
5. AUTHOR(S) N. Melly (NRC), B. Metzger (NRC), D. Stroup (NRC), A. Lindeman (EPRI), M. Randelovic (EPRI), J. Floyd (Jensen Hughes), M. Schairer (Engineering, Planning and Management), D. Shumaker (PSEG Nuclear LLC)
6. TYPE OF REPORT
Technical
7. PERIOD COVERED (Inclusive Dates)
8. PERFORMING ORGANIZATION - NAME AND ADDRESS (If NRC, provide Division, Office or Region, U. S. Nuclear Regulatory Commission, and mailing address; if contractor, provide name and mailing address.)
9. SPONSORING ORGANIZATION - NAME AND ADDRESS (If NRC, type "Same as above", if contractor, provide NRC Division, Office or Region, U. S. Nuclear Regulatory Commission, and mailing address.) Division of Risk Analysis Electric Power Research Institute Office of Nuclear Regulatory Research 3420 Hillview Avenue U.S. Nuclear Regulatory Commission Palo Alto, CA 94304 Washington, DC 20555-0001
10. SUPPLEMENTARY NOTES
M.H. Salley, NRC Project Manager 11. ABSTRACT (200 words or less) The method for analyzing transient fires in NUREG/CR-6850 made use of the limited available data, and its application resulted in conservative estimates of transient fire risk. To counter the lack of available data, additional testing was performed based on the transient fire events observed in the Electric Power Research Institute fire events database. The results from the testing effort served as a primary input to develop more realistic data to analyze transient fire risk. This report develops new distributions of peak heat release rate, total energy release, and zones of influence for transient fires. Additionally, this report recommends input values for the detailed fire modeling of transient fires that include fire growth and decay parameters, yields of minor products of combustion, heat of combustion, and the physical size and effective elevation of the fire.
12. KEY WORDS/DESCRIPTORS (List words or phrases that will assist researchers in locating the report.)
Fire modeling, Fire probabilistic risk assessment (Fire PRA), Heat release rate (HRR), Transient fires, Zone of influence (ZOI)
13. AVAILABILITY STATEMENT
unlimited 14. SECURITY CLASSIFICATION
(This Page)
unclassified (This Report)
unclassified 15. NUMBER OF PAGES
16. PRICE
NRC FORM 335 (12-2010)


NU
REG
-2233
Methodology for M
odeling Transient Fires in Nuclear Power Plant Fire
Probabilistic Risk Assessm
ent O
ctober 2020