Embed Size (px)
Citation preview
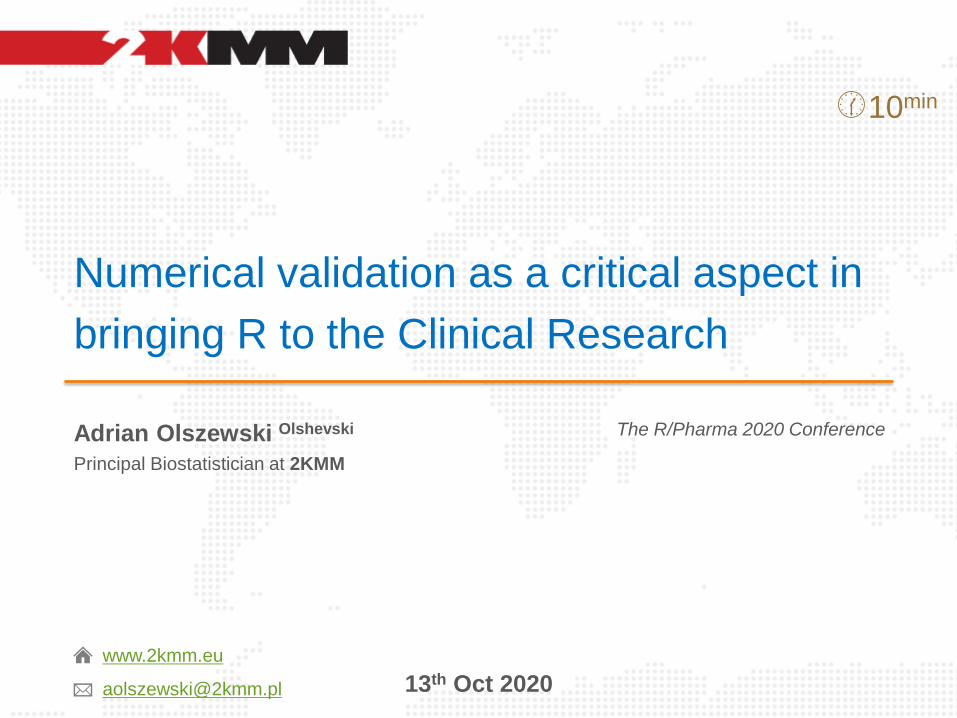
Numerical validation as a critical aspect in
bringing R to the Clinical Research
Adrian Olszewski Olshevski
Principal Biostatistician at 2KMM
13th Oct 2020
The R/Pharma 2020 Conference
10min
www.2kmm.eu
DISCLAIMER
All trademarks, logos of companies and names of products
used in this document
are the sole property of their respective owners
and are included here for informational, illustrative purposes only,
which falls within the nominative fair use.
This presentation is based exclusively on information
publicly available on the Internet under provided hyperlinks.
If you believe your rights are violated, please email me:
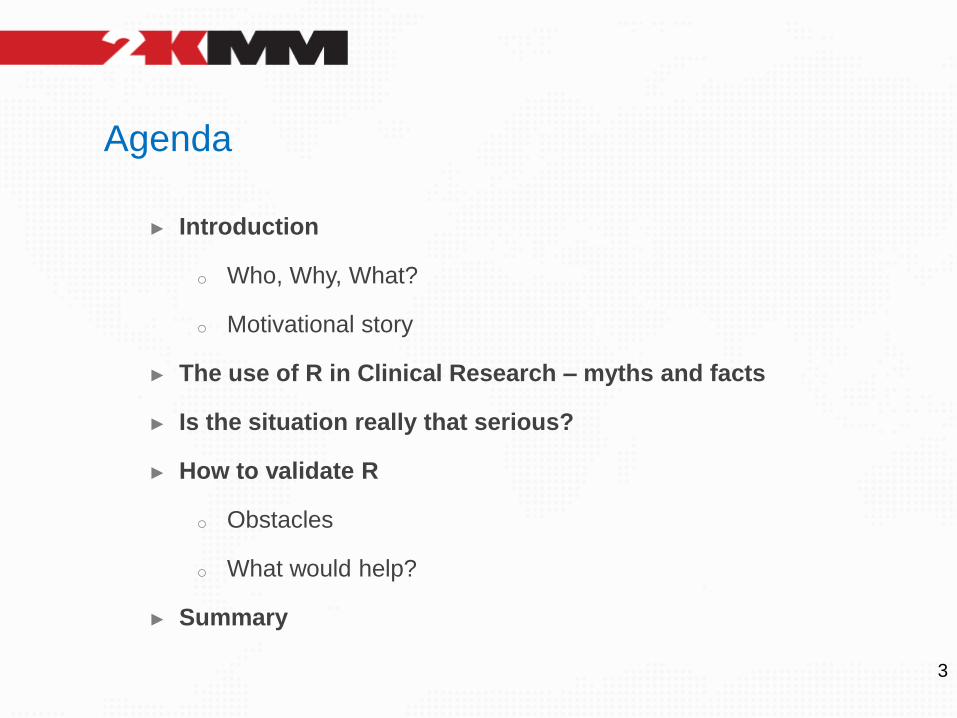
Agenda
► Introduction
o Who, Why, What?
o Motivational story
► The use of R in Clinical Research – myths and facts
► Is the situation really that serious?
► How to validate R
o Obstacles
o What would help?
► Summary
3
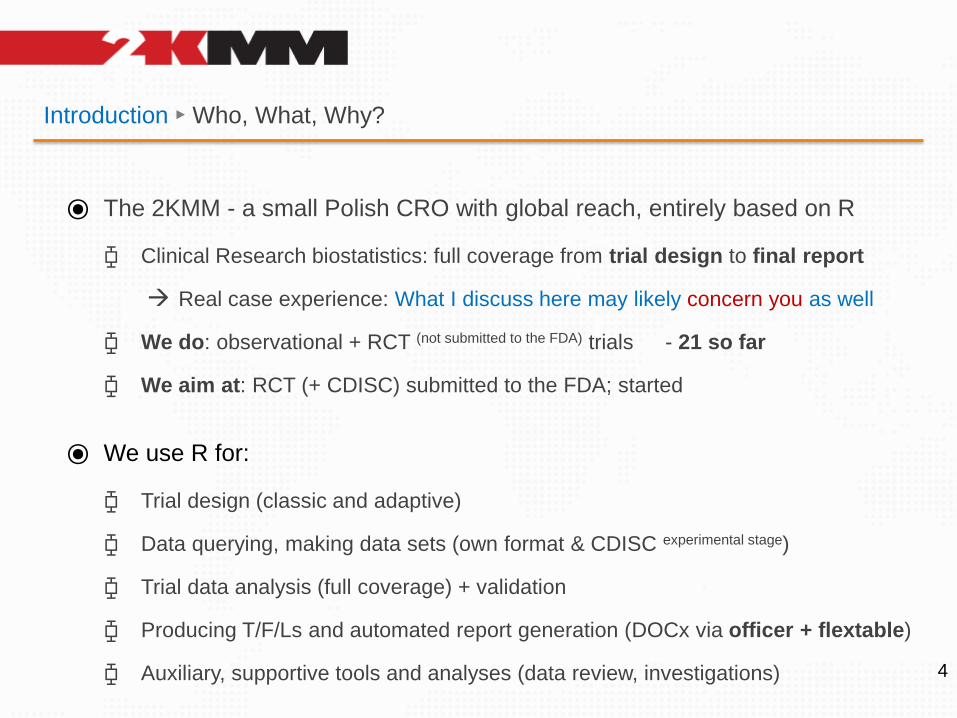
Introduction ► Who, What, Why?
⦿ The 2KMM - a small Polish CRO with global reach, entirely based on R
⧮ Clinical Research biostatistics: full coverage from trial design to final report
→ Real case experience: What I discuss here may likely concern you as well
⧮ We do: observational + RCT (not submitted to the FDA) trials - 21 so far
⧮ We aim at: RCT (+ CDISC) submitted to the FDA; started
4
⦿ We use R for:
⧮ Trial design (classic and adaptive)
⧮ Data querying, making data sets (own format & CDISC experimental stage)
⧮ Trial data analysis (full coverage) + validation
⧮ Producing T/F/Ls and automated report generation (DOCx via officer + flextable)
⧮ Auxiliary, supportive tools and analyses (data review, investigations)
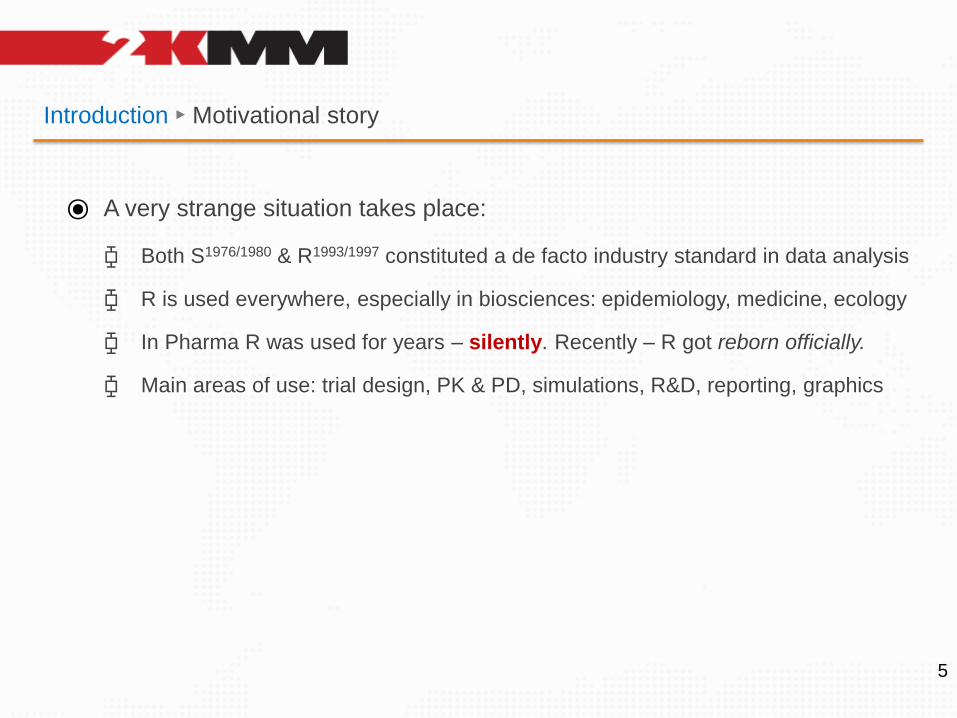
Introduction ► Motivational story
⦿ A very strange situation takes place:
⧮ Both S1976/1980 & R1993/1997 constituted a de facto industry standard in data analysis
⧮ R is used everywhere, especially in biosciences: epidemiology, medicine, ecology
⧮ In Pharma R was used for years – silently. Recently – R got reborn officially.
⧮ Main areas of use: trial design, PK & PD, simulations, R&D, reporting, graphics
5
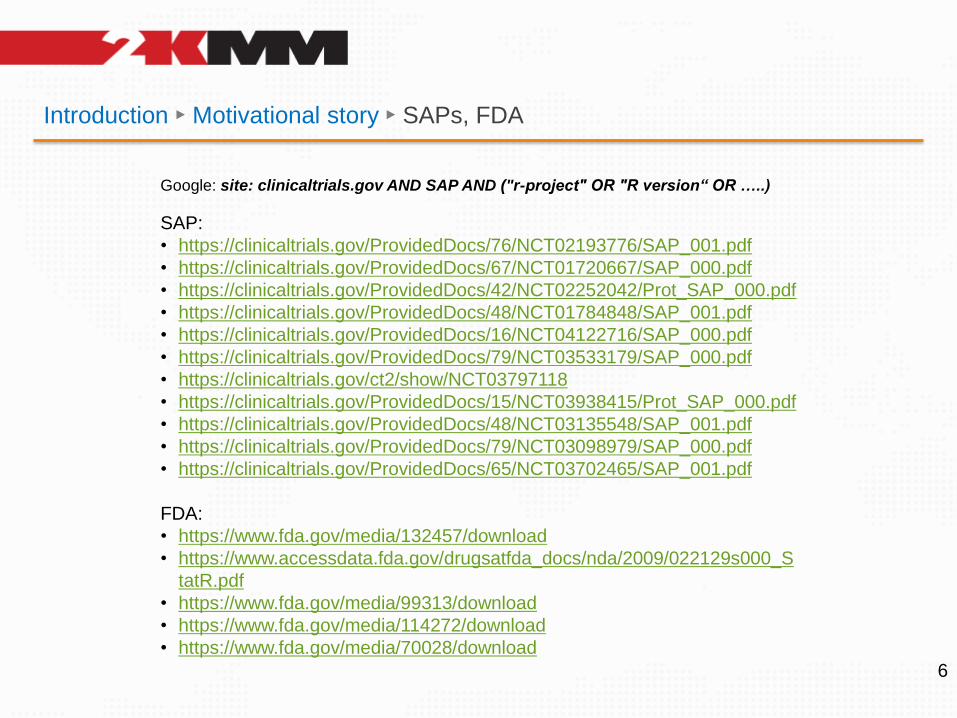
Introduction ► Motivational story ► SAPs, FDA
6
Google: site: clinicaltrials.gov AND SAP AND ("r-project" OR "R version“ OR …..)
SAP:
• https://clinicaltrials.gov/ProvidedDocs/76/NCT02193776/SAP_001.pdf
• https://clinicaltrials.gov/ProvidedDocs/67/NCT01720667/SAP_000.pdf
• https://clinicaltrials.gov/ProvidedDocs/42/NCT02252042/Prot_SAP_000.pdf
• https://clinicaltrials.gov/ProvidedDocs/48/NCT01784848/SAP_001.pdf
• https://clinicaltrials.gov/ProvidedDocs/16/NCT04122716/SAP_000.pdf
• https://clinicaltrials.gov/ProvidedDocs/79/NCT03533179/SAP_000.pdf
• https://clinicaltrials.gov/ct2/show/NCT03797118
• https://clinicaltrials.gov/ProvidedDocs/15/NCT03938415/Prot_SAP_000.pdf
• https://clinicaltrials.gov/ProvidedDocs/48/NCT03135548/SAP_001.pdf
• https://clinicaltrials.gov/ProvidedDocs/79/NCT03098979/SAP_000.pdf
• https://clinicaltrials.gov/ProvidedDocs/65/NCT03702465/SAP_001.pdf
FDA:
• https://www.fda.gov/media/132457/download
• https://www.accessdata.fda.gov/drugsatfda_docs/nda/2009/022129s000_S
tatR.pdf
• https://www.fda.gov/media/99313/download
• https://www.fda.gov/media/114272/download
• https://www.fda.gov/media/70028/download
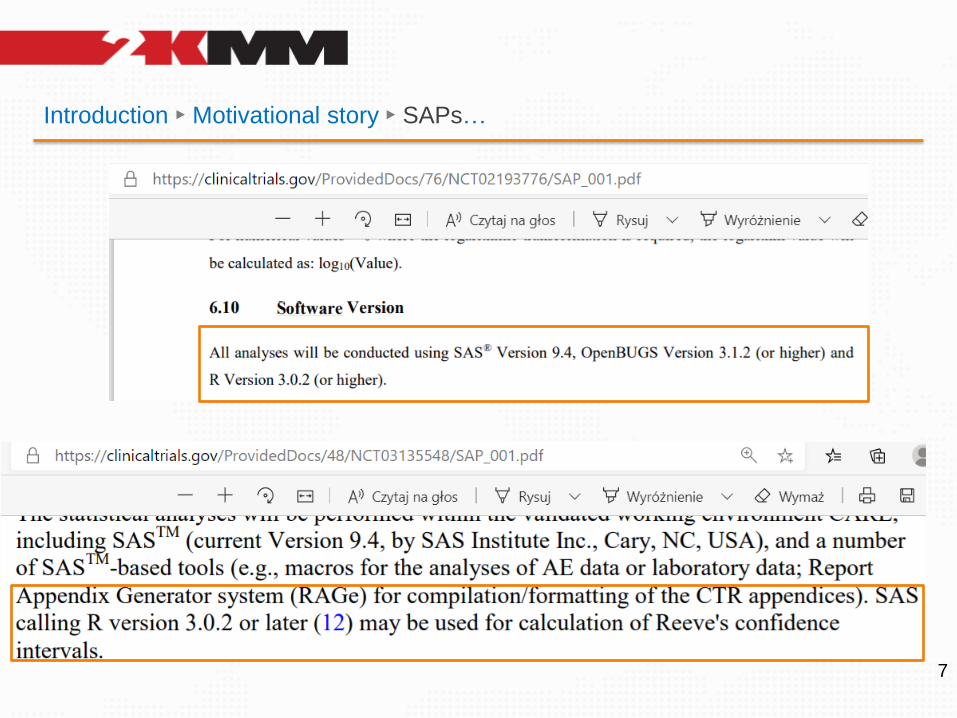
Introduction ► Motivational story ► SAPs…
7
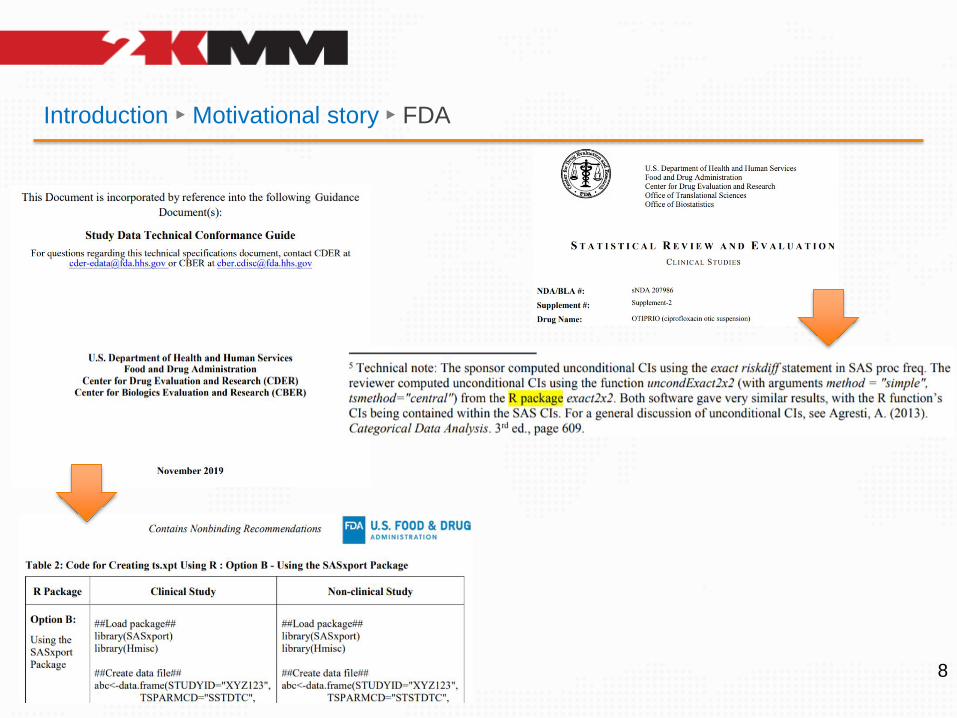
Introduction ► Motivational story ► FDA
8
Introduction ► Motivational story ► FDA
9
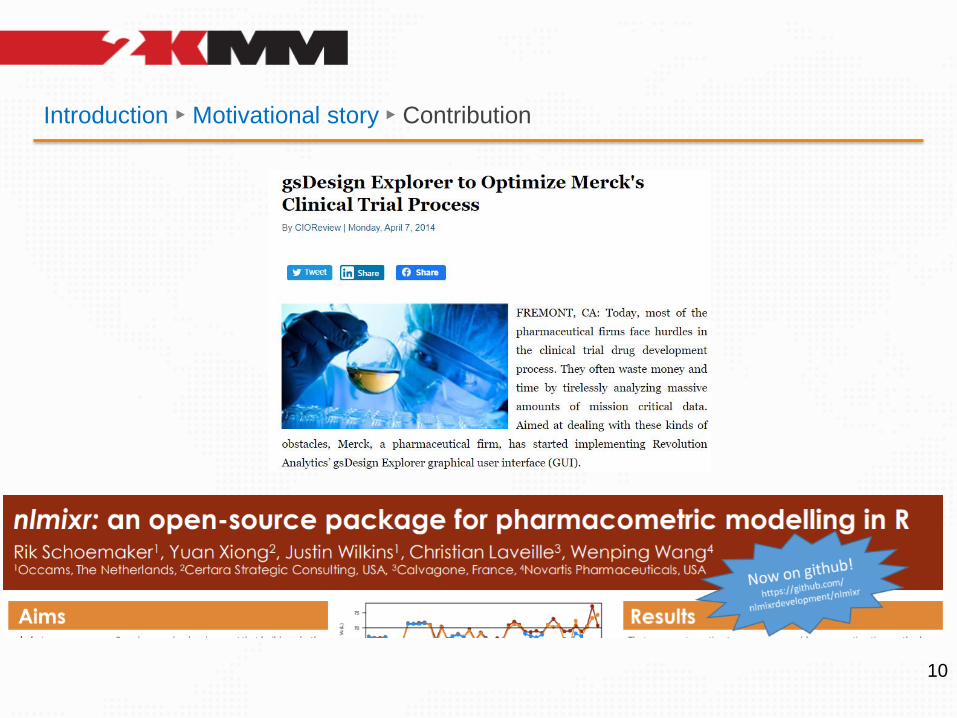
Introduction ► Motivational story ► Contribution
10
Introduction ► Motivational story ► User stories
11
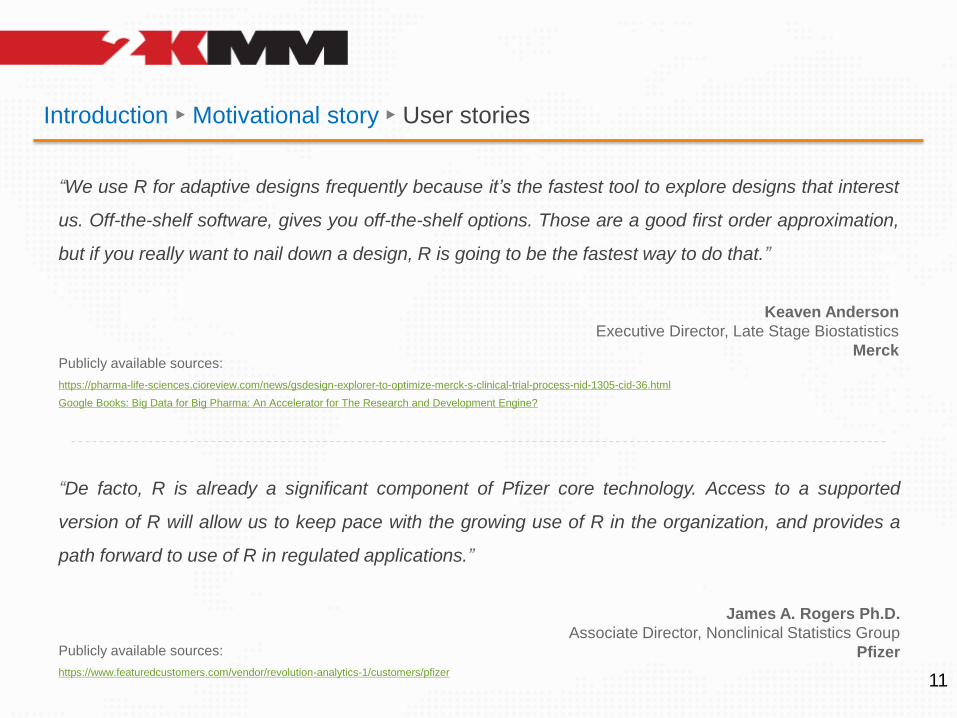
“We use R for adaptive designs frequently because it’s the fastest tool to explore designs that interest
us. Off-the-shelf software, gives you off-the-shelf options. Those are a good first order approximation,
but if you really want to nail down a design, R is going to be the fastest way to do that.”
Keaven Anderson
Executive Director, Late Stage Biostatistics
Merck
“De facto, R is already a significant component of Pfizer core technology. Access to a supported
version of R will allow us to keep pace with the growing use of R in the organization, and provides a
path forward to use of R in regulated applications.”
James A. Rogers Ph.D.
Associate Director, Nonclinical Statistics Group
Pfizer
https://pharma-life-sciences.cioreview.com/news/gsdesign-explorer-to-optimize-merck-s-clinical-trial-process-nid-1305-cid-36.html
Google Books: Big Data for Big Pharma: An Accelerator for The Research and Development Engine?
Publicly available sources:
https://www.featuredcustomers.com/vendor/revolution-analytics-1/customers/pfizer
Publicly available sources:
Introduction ► Motivational story ► User stories
12
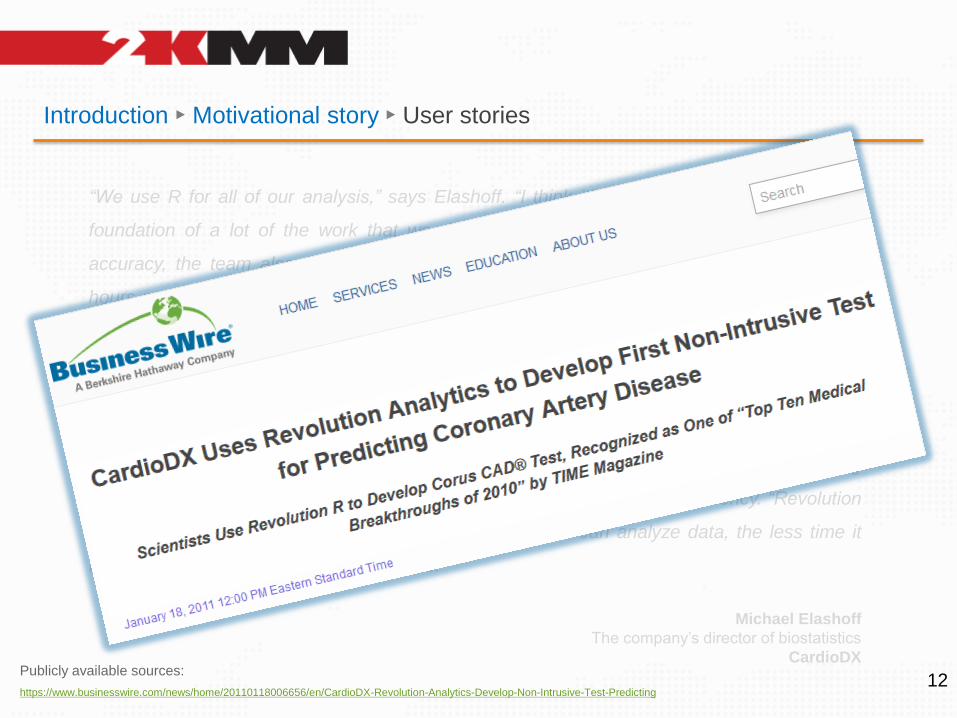
“We use R for all of our analysis,” says Elashoff. “I think it’s fair to say that R really is the
foundation of a lot of the work that we do.” To speed up the process without sacrificing
accuracy, the team also uses Revolution R analytic products. “We use R seven or eight
hours per day, so any improvement in speed is helpful, particularly when you’re looking at a
million biomarkers and wondering if you’ll need to re-run a million analyses.”
Open-source R packages enable the biostatisticians at CardioDX to run a broad range of
analyses, accurately and effectively, on a routine basis. Adding Revolution R products to the
mix improves processing speeds and makes it easier to crunch large data sets. Accelerating
the analytic process reduces ov erall project time, increasing the team’s efficiency. “Revolution
R is faster than regular R,” says Elashoff. “The faster we can analyze data, the less time it
takes us to build our diagnostic algorithms.”
Michael Elashoff
The company’s director of biostatistics
CardioDX
https://www.businesswire.com/news/home/20110118006656/en/CardioDX-Revolution-Analytics-Develop-Non-Intrusive-Test-Predicting
Publicly available sources:
Introduction ► Motivational story ► User stories
13
“We use R for all of our analysis,” says Elashoff. “I think it’s fair to say that R really is the
foundation of a lot of the work that we do.” To speed up the process without sacrificing
accuracy, the team also uses Revolution R analytic products. “We use R seven or eight
hours per day, so any improvement in speed is helpful, particularly when you’re looking at a
million biomarkers and wondering if you’ll need to re-run a million analyses.”
Open-source R packages enable the biostatisticians at CardioDX to run a broad range of
analyses, accurately and effectively, on a routine basis. Adding Revolution R products to the
mix improves processing speeds and makes it easier to crunch large data sets. Accelerating
the analytic process reduces ov erall project time, increasing the team’s efficiency. “Revolution
R is faster than regular R,” says Elashoff. “The faster we can analyze data, the less time it
takes us to build our diagnostic algorithms.”
Michael Elashoff
The company’s director of biostatistics
CardioDX
https://www.featuredcustomers.com/media/CustomerCaseStudy.document/revolution-analytics-1_cardiodx_8284.pdf
Publicly available sources:
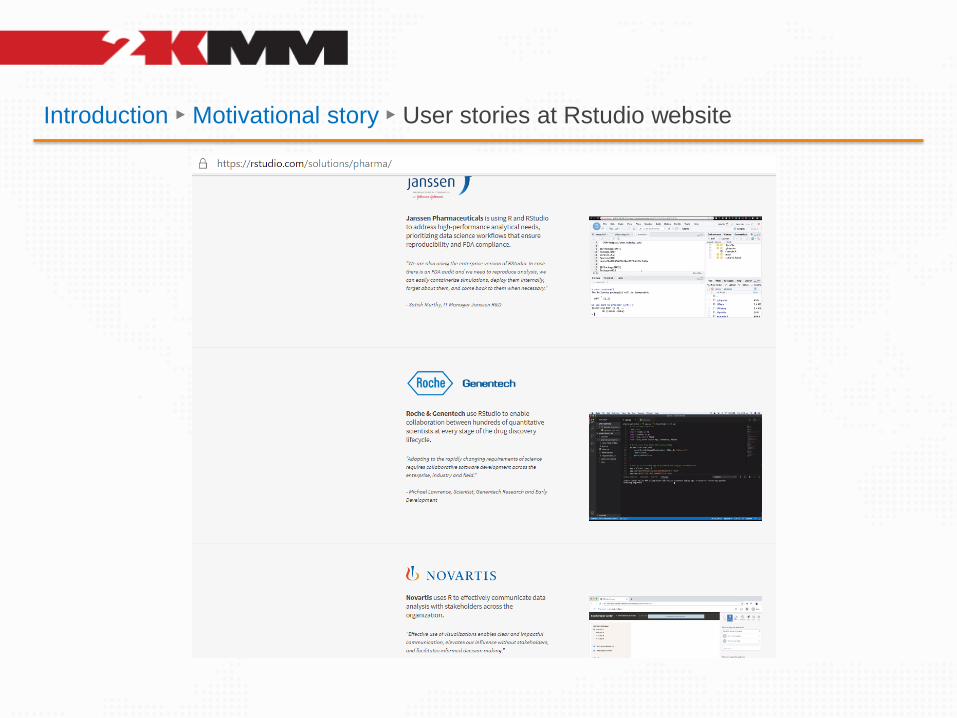
Introduction ► Motivational story ► User stories at Rstudio website
Introduction ► Motivational story ► Summary
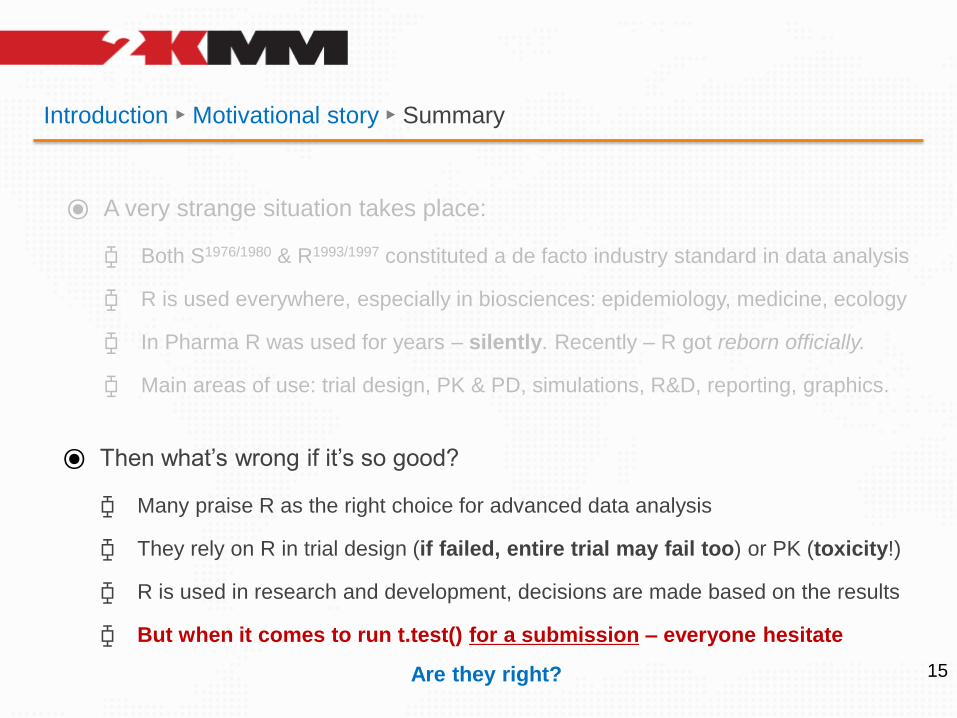
⦿ A very strange situation takes place:
⧮ Both S1976/1980 & R1993/1997 constituted a de facto industry standard in data analysis
⧮ R is used everywhere, especially in biosciences: epidemiology, medicine, ecology
⧮ In Pharma R was used for years – silently. Recently – R got reborn officially.
⧮ Main areas of use: trial design, PK & PD, simulations, R&D, reporting, graphics.
15
⦿ Then what’s wrong if it’s so good?
⧮ Many praise R as the right choice for advanced data analysis
⧮ They rely on R in trial design (if failed, entire trial may fail too) or PK (toxicity!)
⧮ R is used in research and development, decisions are made based on the results
⧮ But when it comes to run t.test() for a submission – everyone hesitate
Are they right?
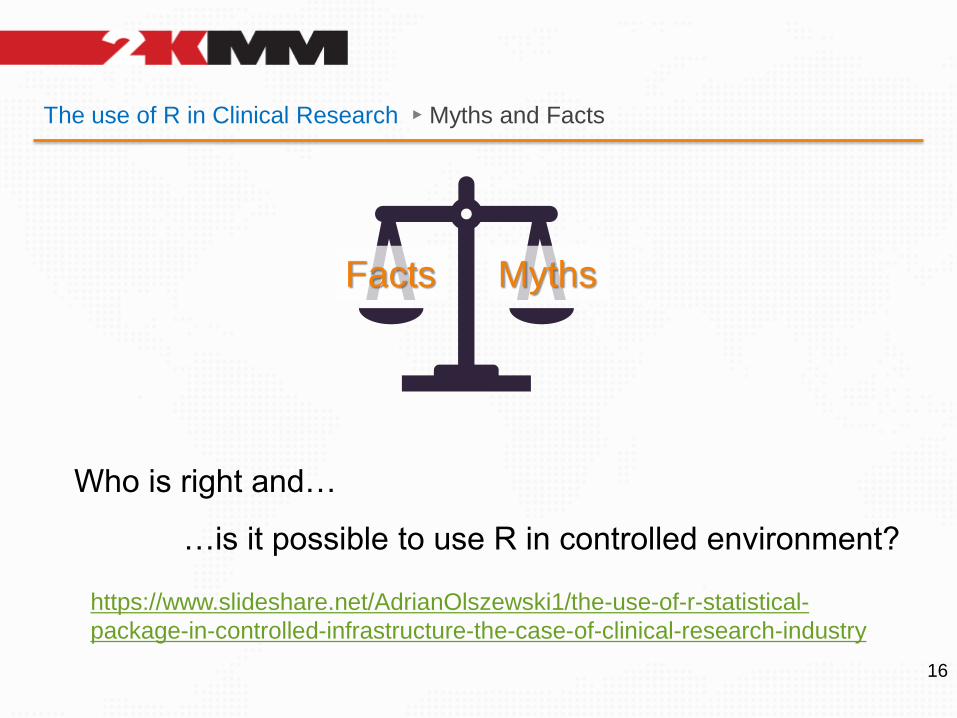
The use of R in Clinical Research ► Myths and Facts
16
Facts Myths
Who is right and…
…is it possible to use R in controlled environment?
https://www.slideshare.net/AdrianOlszewski1/the-use-of-r-statistical-
package-in-controlled-infrastructure-the-case-of-clinical-research-industry
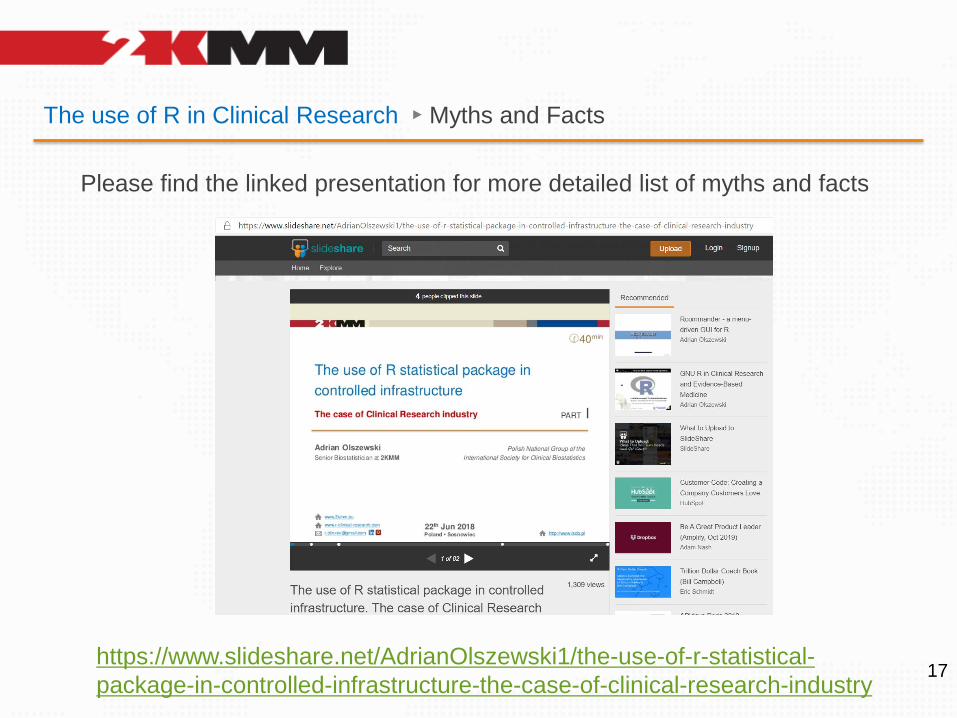
The use of R in Clinical Research ► Myths and Facts
17https://www.slideshare.net/AdrianOlszewski1/the-use-of-r-statistical-
package-in-controlled-infrastructure-the-case-of-clinical-research-industry
Please find the linked presentation for more detailed list of myths and facts
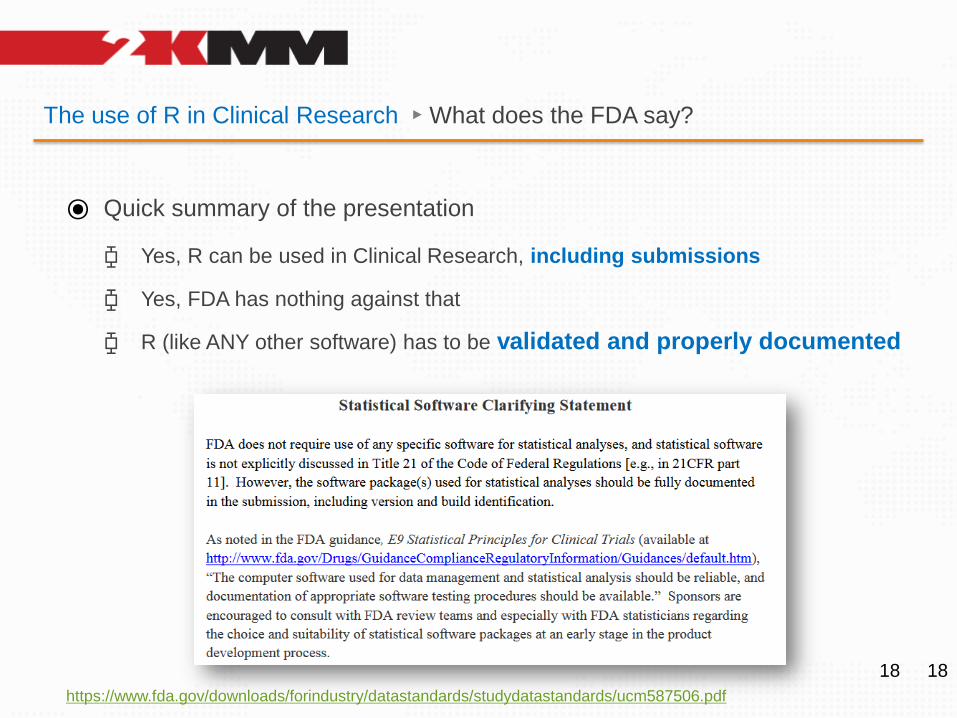
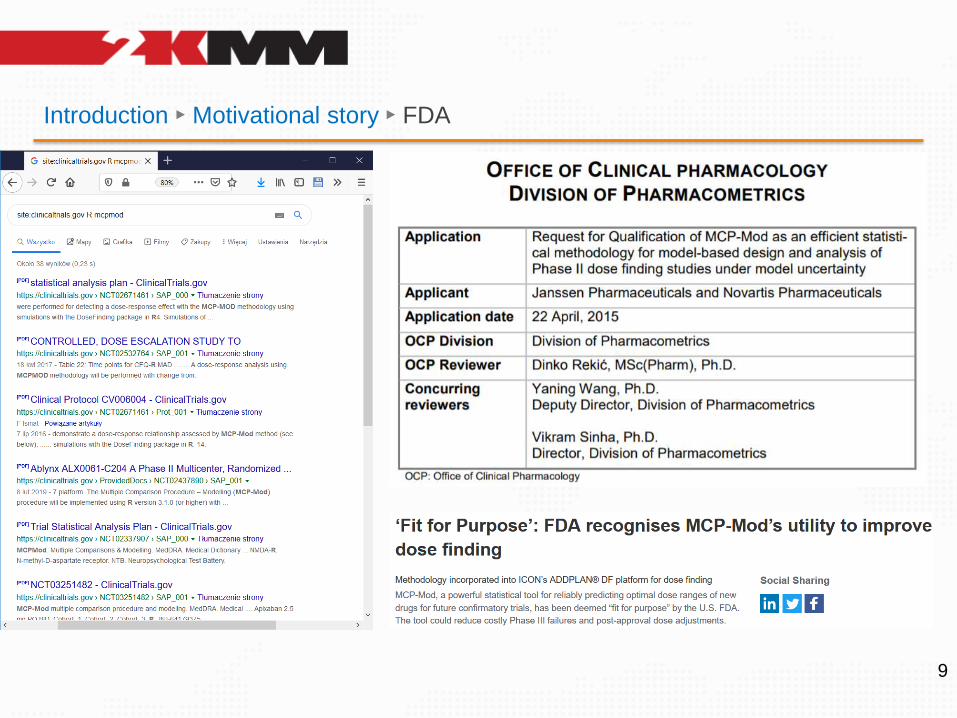
The use of R in Clinical Research ► What does the FDA say?
⦿ Quick summary of the presentation
⧮ Yes, R can be used in Clinical Research, including submissions
⧮ Yes, FDA has nothing against that
⧮ R (like ANY other software) has to be validated and properly documented
1818
https://www.fda.gov/downloads/forindustry/datastandards/studydatastandards/ucm587506.pdf
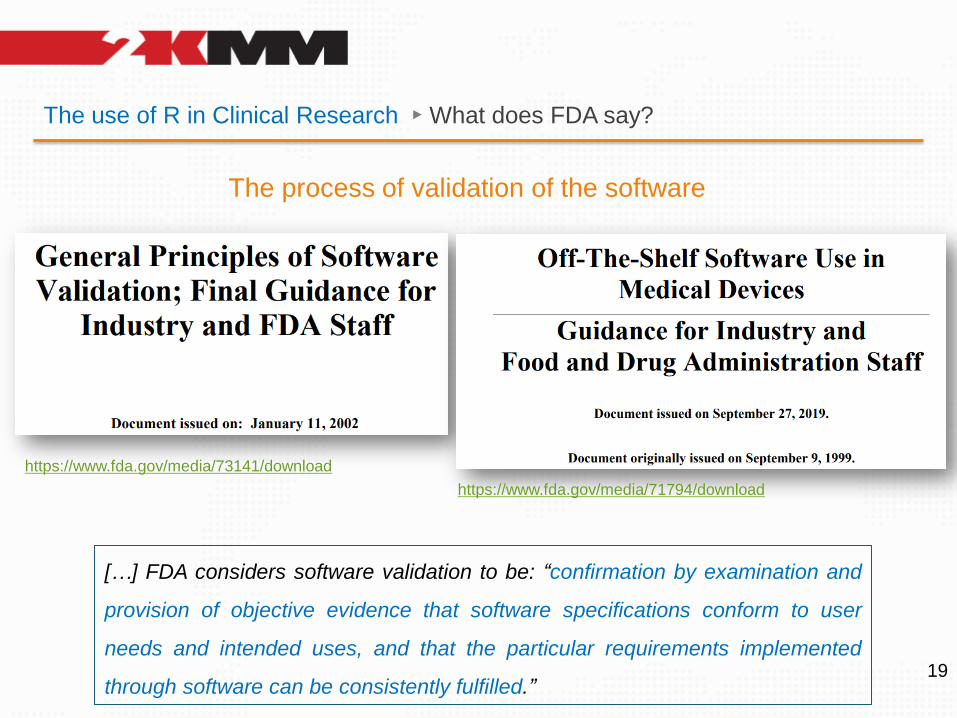
The use of R in Clinical Research ► What does FDA say?
19
The process of validation of the software
https://www.fda.gov/media/73141/download
[…] FDA considers software validation to be: “confirmation by examination and
provision of objective evidence that software specifications conform to user
needs and intended uses, and that the particular requirements implemented
through software can be consistently fulfilled.”
https://www.fda.gov/media/71794/download
The use of R in Clinical Research ► What does the FDA say?
20
2.1. APPLICABILITY
This document […] can be applied to any software.
[…]
This document does not specifically identify which software is or is not regulated
2.4. QUALITY SYSTEM REGULATION VS PRE-MARKET SUBMISSIONS
[…]
The management and control of the software validation process should not be
confused with any other validation requirements, such as process validation for an
automated manufacturing process
3.1.1 Requirements and Specifications
[…]
design input requirements must be documented, and that specified requirements
must be verified[…]
Success in accurately and completely documenting software requirements is a crucial
factor in successful validation of the resulting software.
The use of R in Clinical Research ► What does the FDA say?
21
A specification is defined as “a document that states requirements.”
3.1.1 Requirements and Specifications
[…]
There are many different kinds of written specifications, e.g., system requirements
specification, software requirements specification, software design specification,
software test specification, software integration specification, etc
3.1.2 Verification and Validation
[…]
Software verification provides objective evidence that the design outputs of a
particular phase of the software development life cycle meet all of the specified
requirements for that phase. Software verification looks for consistency,
completeness, and correctness of the software and its supporting
documentation, as it is being developed, and provides support for a subsequent
conclusion that software is validated.
The use of R in Clinical Research ► What does the FDA say?
22
The software requirements specification document should contain a written definition of the software functions.
It is not possible to validate software without predetermined and documented software requirements.
Typical software requirements specify the following:
✓ All software system inputs
✓ All software system outputs
✓ All functions that the software system will perform
✓ All performance requirements that the software will meet, (e.g., data throughput, reliability, and timing)
✓ The definition of all external and user interfaces, as well as any internal software-to-system interfaces
✓ How users will interact with the system
✓ What constitutes an error and how errors should be handled
✓ Required response times
✓ The intended operating environment for the software, if this is a design constraint (e.g. hardware platform,
operating system)
✓ All ranges, limits, defaults, and specific values that the software will accept
✓ All safety related requirements, specifications, features, or functions that will be implemented in software
23
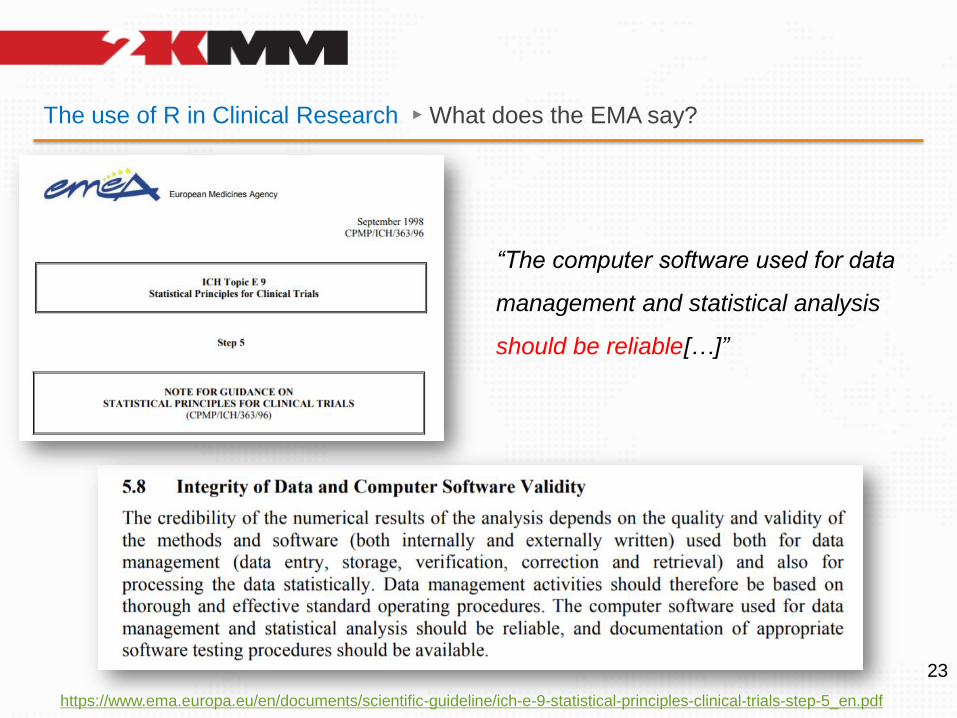
The use of R in Clinical Research ► What does the EMA say?
https://www.ema.europa.eu/en/documents/scientific-guideline/ich-e-9-statistical-principles-clinical-trials-step-5_en.pdf
“The computer software used for data
management and statistical analysis
should be reliable[…]”
How to validate R?
24
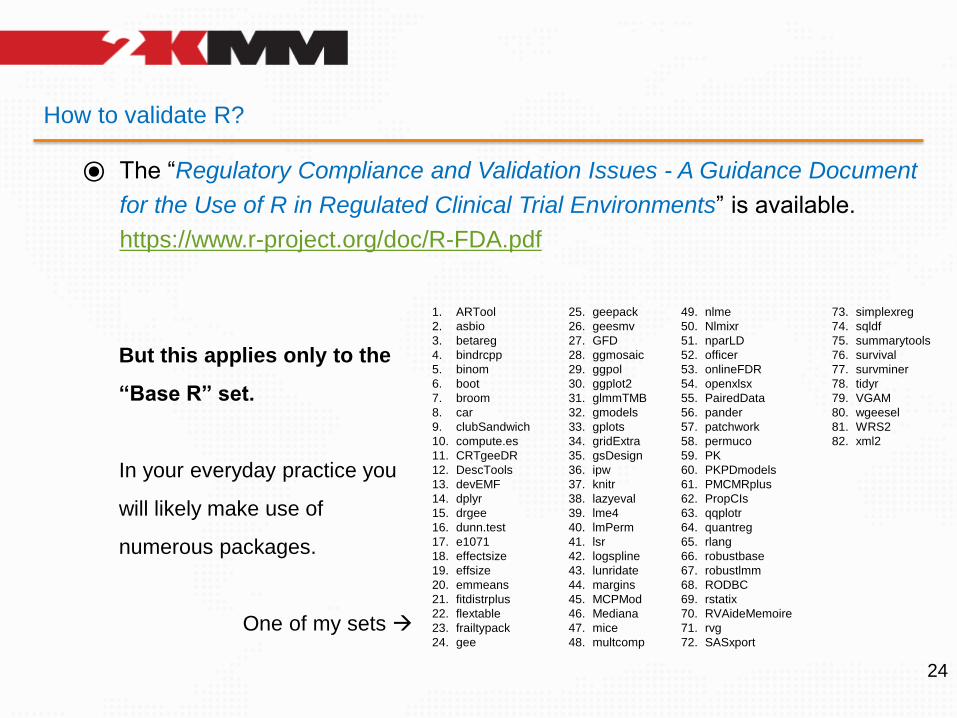
⦿ The “Regulatory Compliance and Validation Issues - A Guidance Document
for the Use of R in Regulated Clinical Trial Environments” is available.
https://www.r-project.org/doc/R-FDA.pdf
But this applies only to the
“Base R” set.
In your everyday practice you
will likely make use of
numerous packages.
One of my sets →
1. ARTool
2. asbio
3. betareg
4. bindrcpp
5. binom
6. boot
7. broom
8. car
9. clubSandwich
10. compute.es
11. CRTgeeDR
12. DescTools
13. devEMF
14. dplyr
15. drgee
16. dunn.test
17. e1071
18. effectsize
19. effsize
20. emmeans
21. fitdistrplus
22. flextable
23. frailtypack
24. gee
25. geepack
26. geesmv
27. GFD
28. ggmosaic
29. ggpol
30. ggplot2
31. glmmTMB
32. gmodels
33. gplots
34. gridExtra
35. gsDesign
36. ipw
37. knitr
38. lazyeval
39. lme4
40. lmPerm
41. lsr
42. logspline
43. lunridate
44. margins
45. MCPMod
46. Mediana
47. mice
48. multcomp
49. nlme
50. Nlmixr
51. nparLD
52. officer
53. onlineFDR
54. openxlsx
55. PairedData
56. pander
57. patchwork
58. permuco
59. PK
60. PKPDmodels
61. PMCMRplus
62. PropCIs
63. qqplotr
64. quantreg
65. rlang
66. robustbase
67. robustlmm
68. RODBC
69. rstatix
70. RVAideMemoire
71. rvg
72. SASxport
73. simplexreg
74. sqldf
75. summarytools
76. survival
77. survminer
78. tidyr
79. VGAM
80. wgeesel
81. WRS2
82. xml2
What have we learned from these documents?
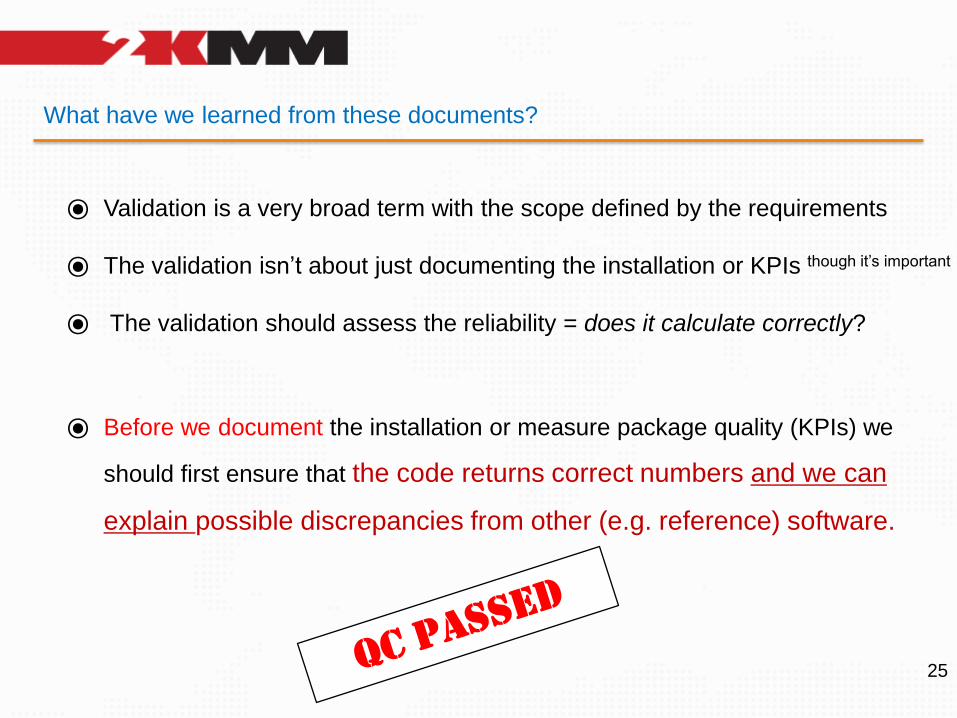
⦿ Validation is a very broad term with the scope defined by the requirements
⦿ The validation isn’t about just documenting the installation or KPIs though it’s important
⦿ The validation should assess the reliability = does it calculate correctly?
25
⦿ Before we document the installation or measure package quality (KPIs) we
should first ensure that the code returns correct numbers and we can
explain possible discrepancies from other (e.g. reference) software.
Who does really need it?
⦿ Let me tell you a secret. The one who *really needs* the tool to be validated
is not any agency. It is YOU.
26
⦿ Because the one who will lose is not any agency. At the end of the day - it is
YOU
⧮ Statistical confirmation of the objectives is the key product of a trial
⧮ The final outcome is needed to approve (or reject) your drug
⧮ Failed trial means:
- for you: lost money, lost reputation, lost chance (others will notice)
- for patients: lost chance to recover, lost hopes, maybe lost lives.
Isn’t this enough? Will you risk?
Is the situation really that serious? ► Facts
⦿ As a matter of fact:
⧮ Not all key packages have exhaustive unit tests, especially those older ones.
⧮ Unit tests may cover only basic scenarios, limited by the author’s imagination
Think about it: why are there so many “Issues” on the GitHub for the key
packages, if the unit tests pass well? collaboration + „fresh view”
⧮ There is no global authority that ensures the quality. No central QA body!
so if anything fails, there’s nobody to complain to about. Use it at own risk!
⧮ Last, but not least – and maybe the most important… unit tests seem to be
rarely subjected to comparisons against other statistical software.
In pharma – that’s: SAS, nQuery, WinNonlin, SPSS and other tools.27
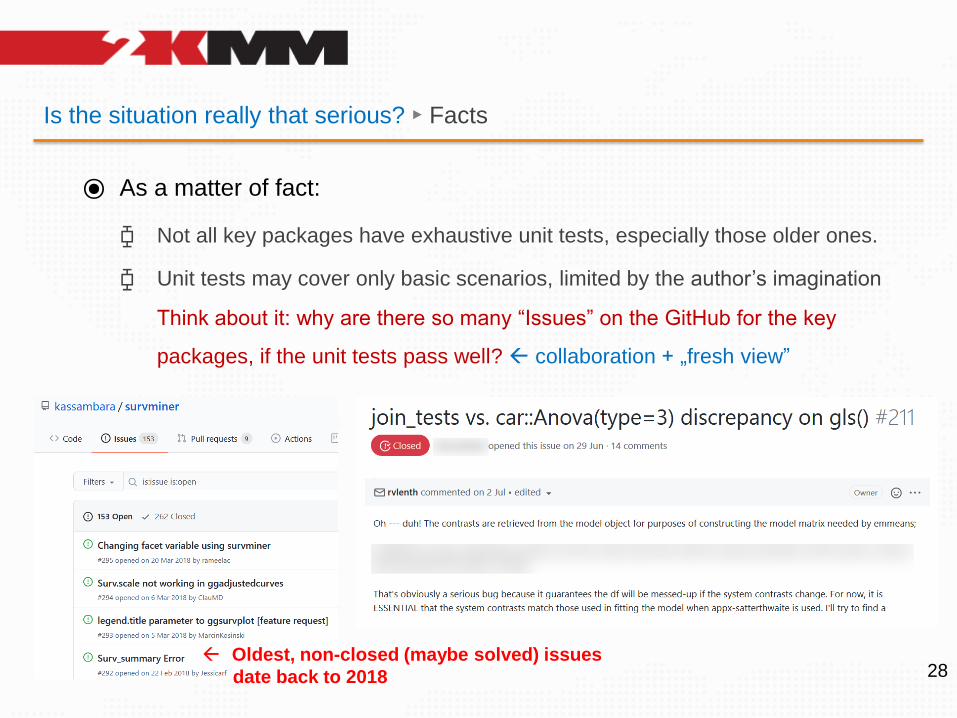
Is the situation really that serious? ► Facts
⦿ As a matter of fact:
⧮ Not all key packages have exhaustive unit tests, especially those older ones.
⧮ Unit tests may cover only basic scenarios, limited by the author’s imagination
Think about it: why are there so many “Issues” on the GitHub for the key
packages, if the unit tests pass well? collaboration + „fresh view”
28 Oldest, non-closed (maybe solved) issues
date back to 2018
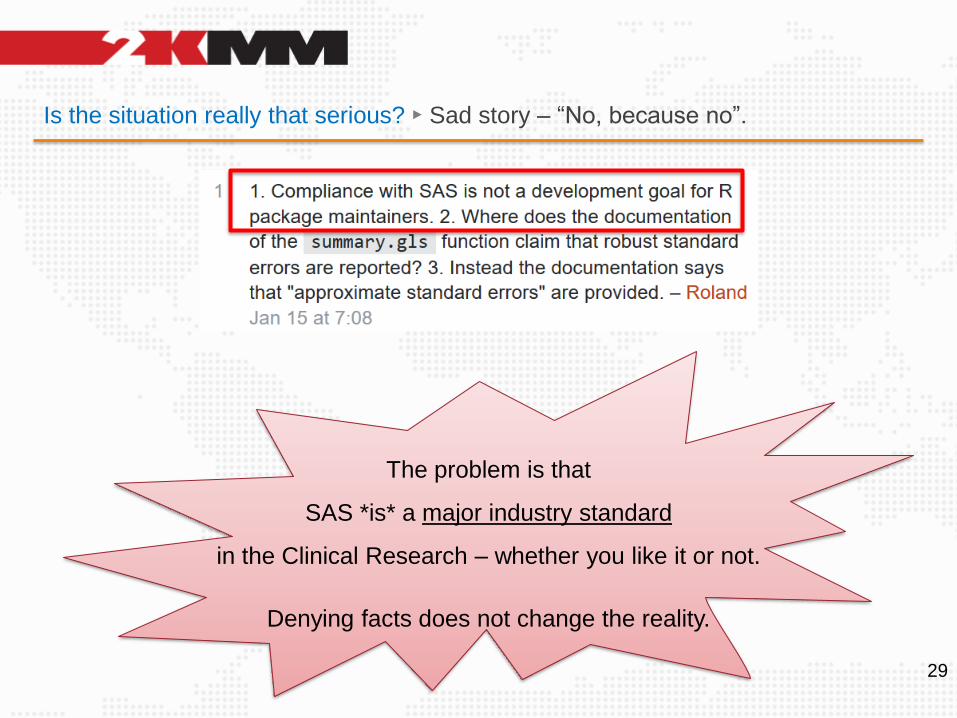
Is the situation really that serious? ► Sad story – “No, because no”.
29
The problem is that
SAS *is* a major industry standard
in the Clinical Research – whether you like it or not.
Denying facts does not change the reality.
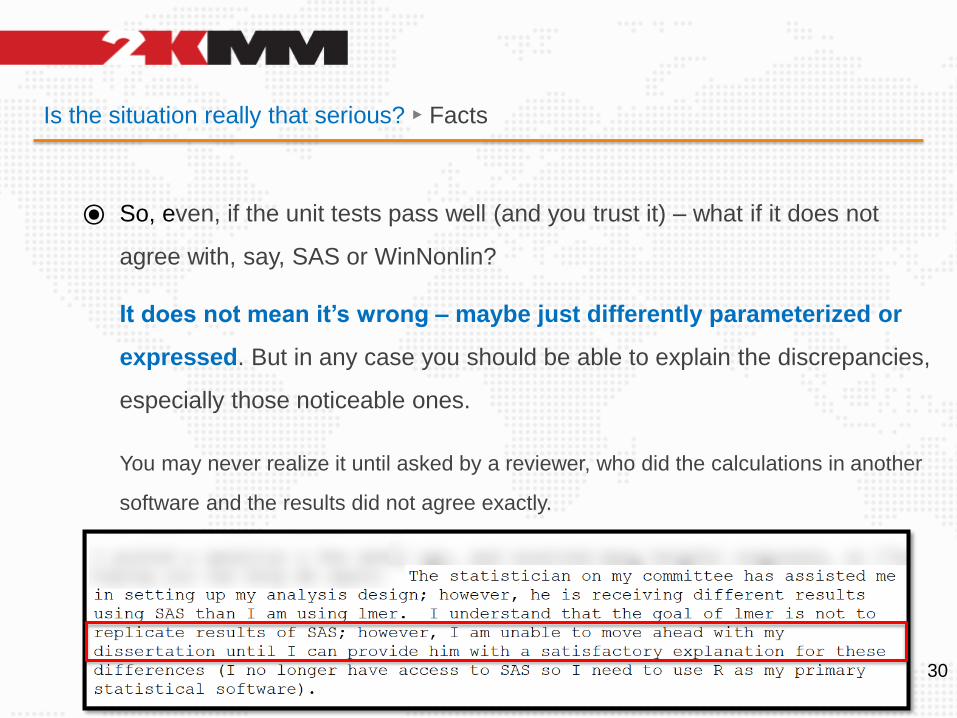
Is the situation really that serious? ► Facts
⦿ So, even, if the unit tests pass well (and you trust it) – what if it does not
agree with, say, SAS or WinNonlin?
It does not mean it’s wrong – maybe just differently parameterized or
expressed. But in any case you should be able to explain the discrepancies,
especially those noticeable ones.
You may never realize it until asked by a reviewer, who did the calculations in another
software and the results did not agree exactly.
30
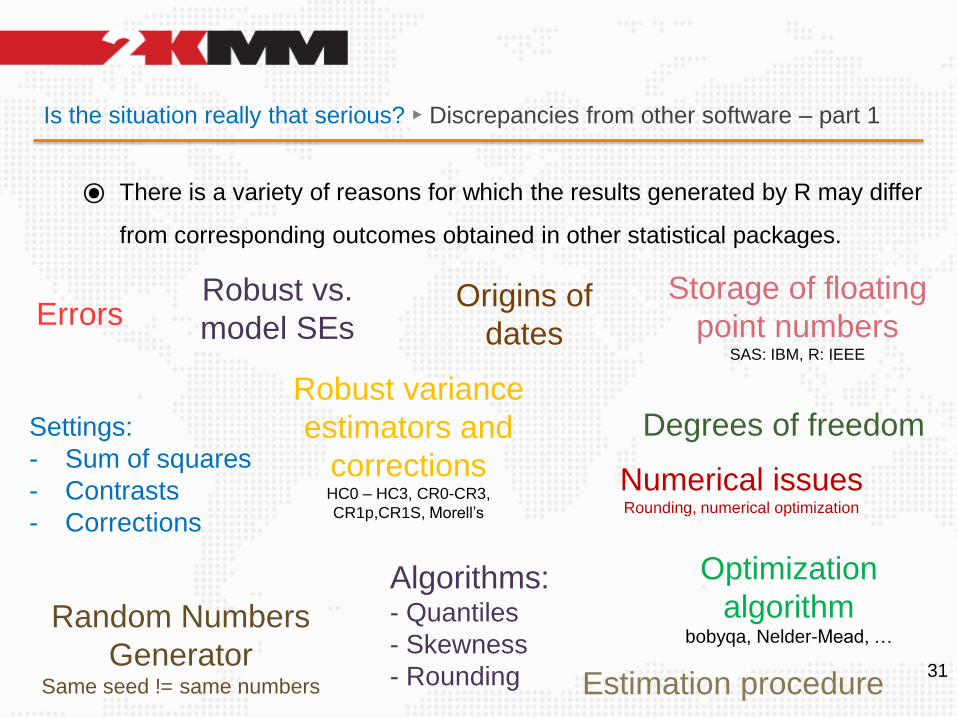
Is the situation really that serious? ► Discrepancies from other software – part 1
⦿ There is a variety of reasons for which the results generated by R may differ
from corresponding outcomes obtained in other statistical packages.
31
Errors
Algorithms:- Quantiles
- Skewness
- Rounding
Storage of floating
point numbersSAS: IBM, R: IEEE
Random Numbers
GeneratorSame seed != same numbers
Settings:
- Sum of squares
- Contrasts
- Corrections
Optimization
algorithmbobyqa, Nelder-Mead, …
Estimation procedure
Robust vs.
model SEsOrigins of
dates
Degrees of freedomRobust variance
estimators and
correctionsHC0 – HC3, CR0-CR3,
CR1p,CR1S, Morell’s
Numerical issuesRounding, numerical optimization
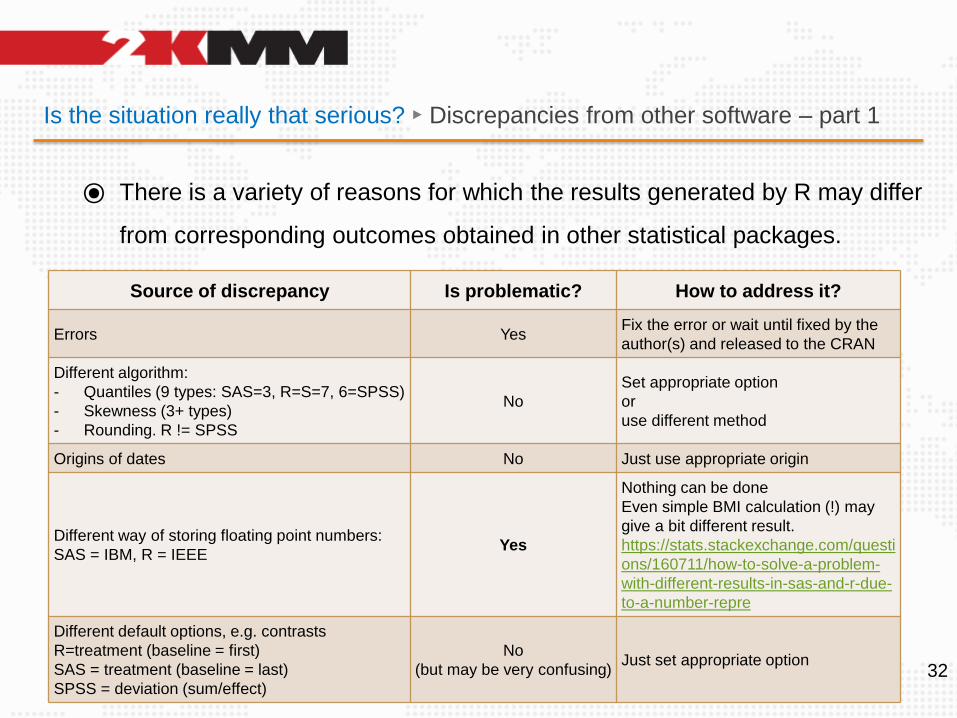
Is the situation really that serious? ► Discrepancies from other software – part 1
⦿ There is a variety of reasons for which the results generated by R may differ
from corresponding outcomes obtained in other statistical packages.
32
Source of discrepancy Is problematic? How to address it?
Errors YesFix the error or wait until fixed by the
author(s) and released to the CRAN
Different algorithm:
- Quantiles (9 types: SAS=3, R=S=7, 6=SPSS)
- Skewness (3+ types)
- Rounding. R != SPSS
No
Set appropriate option
or
use different method
Origins of dates No Just use appropriate origin
Different way of storing floating point numbers:
SAS = IBM, R = IEEEYes
Nothing can be done
Even simple BMI calculation (!) may
give a bit different result.
https://stats.stackexchange.com/questi
ons/160711/how-to-solve-a-problem-
with-different-results-in-sas-and-r-due-
to-a-number-repre
Different default options, e.g. contrasts
R=treatment (baseline = first)
SAS = treatment (baseline = last)
SPSS = deviation (sum/effect)
No
(but may be very confusing)Just set appropriate option
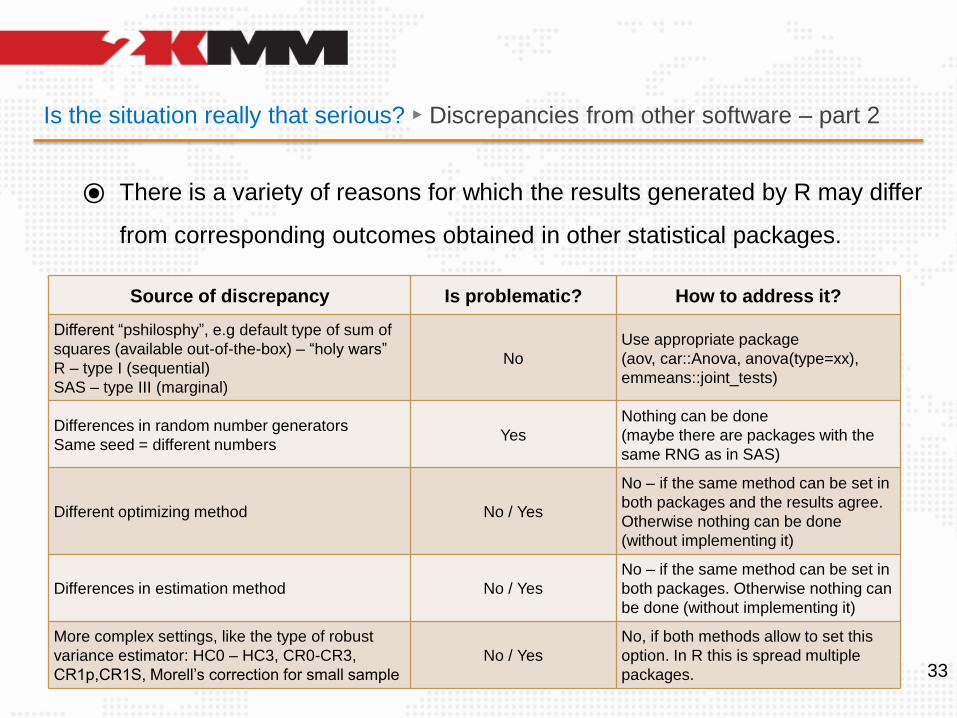
Is the situation really that serious? ► Discrepancies from other software – part 2
⦿ There is a variety of reasons for which the results generated by R may differ
from corresponding outcomes obtained in other statistical packages.
33
Source of discrepancy Is problematic? How to address it?
Different “pshilosphy”, e.g default type of sum of
squares (available out-of-the-box) – “holy wars”
R – type I (sequential)
SAS – type III (marginal)
No
Use appropriate package
(aov, car::Anova, anova(type=xx),
emmeans::joint_tests)
Differences in random number generators
Same seed = different numbersYes
Nothing can be done
(maybe there are packages with the
same RNG as in SAS)
Different optimizing method No / Yes
No – if the same method can be set in
both packages and the results agree.
Otherwise nothing can be done
(without implementing it)
Differences in estimation method No / Yes
No – if the same method can be set in
both packages. Otherwise nothing can
be done (without implementing it)
More complex settings, like the type of robust
variance estimator: HC0 – HC3, CR0-CR3,
CR1p,CR1S, Morell’s correction for small sample
No / Yes
No, if both methods allow to set this
option. In R this is spread multiple
packages.
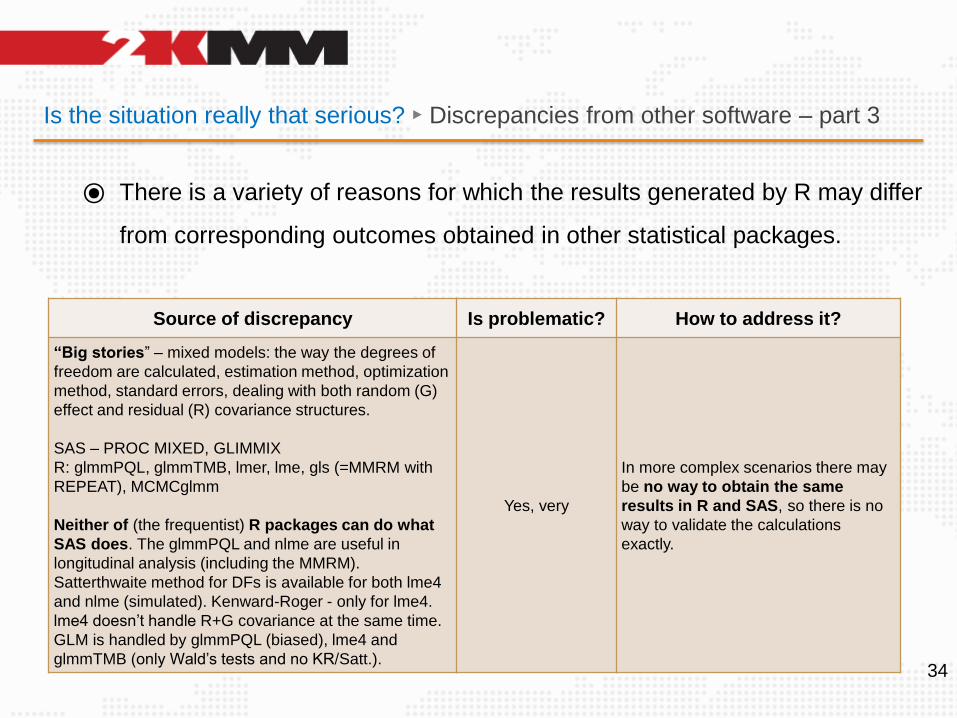
Is the situation really that serious? ► Discrepancies from other software – part 3
⦿ There is a variety of reasons for which the results generated by R may differ
from corresponding outcomes obtained in other statistical packages.
34
Source of discrepancy Is problematic? How to address it?
“Big stories” – mixed models: the way the degrees of
freedom are calculated, estimation method, optimization
method, standard errors, dealing with both random (G)
effect and residual (R) covariance structures.
SAS – PROC MIXED, GLIMMIX
R: glmmPQL, glmmTMB, lmer, lme, gls (=MMRM with
REPEAT), MCMCglmm
Neither of (the frequentist) R packages can do what
SAS does. The glmmPQL and nlme are useful in
longitudinal analysis (including the MMRM).
Satterthwaite method for DFs is available for both lme4
and nlme (simulated). Kenward-Roger - only for lme4.
lme4 doesn’t handle R+G covariance at the same time.
GLM is handled by glmmPQL (biased), lme4 and
glmmTMB (only Wald’s tests and no KR/Satt.).
Yes, very
In more complex scenarios there may
be no way to obtain the same
results in R and SAS, so there is no
way to validate the calculations
exactly.
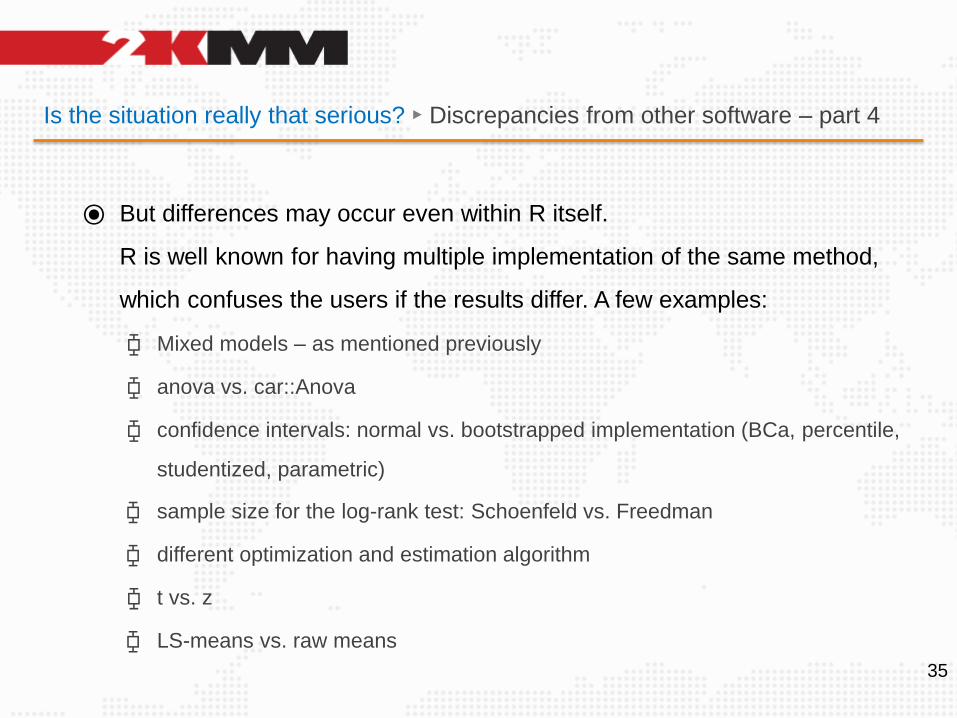
Is the situation really that serious? ► Discrepancies from other software – part 4
⦿ But differences may occur even within R itself.
R is well known for having multiple implementation of the same method,
which confuses the users if the results differ. A few examples:
⧮ Mixed models – as mentioned previously
⧮ anova vs. car::Anova
⧮ confidence intervals: normal vs. bootstrapped implementation (BCa, percentile,
studentized, parametric)
⧮ sample size for the log-rank test: Schoenfeld vs. Freedman
⧮ different optimization and estimation algorithm
⧮ t vs. z
⧮ LS-means vs. raw means
35
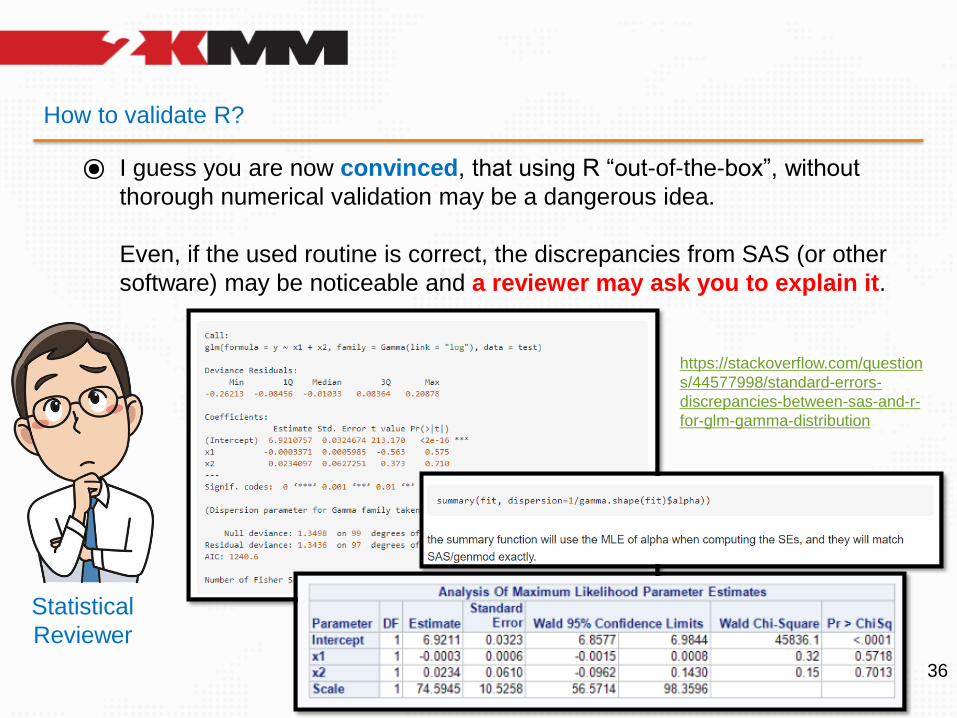
How to validate R?
36
⦿ I guess you are now convinced, that using R “out-of-the-box”, without
thorough numerical validation may be a dangerous idea.
Even, if the used routine is correct, the discrepancies from SAS (or other
software) may be noticeable and a reviewer may ask you to explain it.
Statistical
Reviewer
https://stackoverflow.com/question
s/44577998/standard-errors-
discrepancies-between-sas-and-r-
for-glm-gamma-distribution
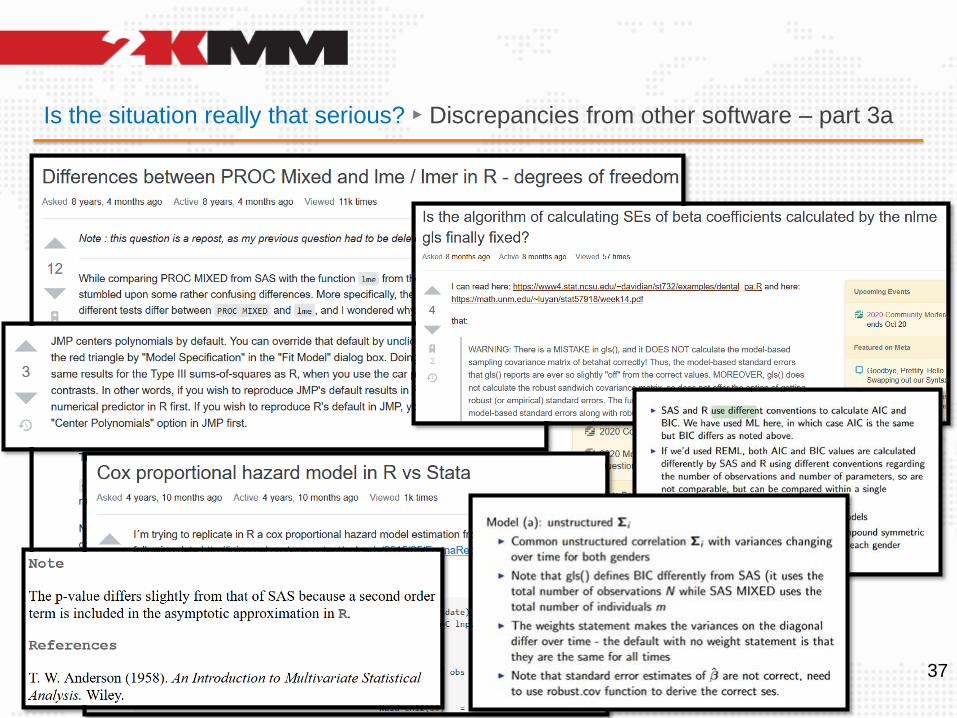
Is the situation really that serious? ► Discrepancies from other software – part 3a
37
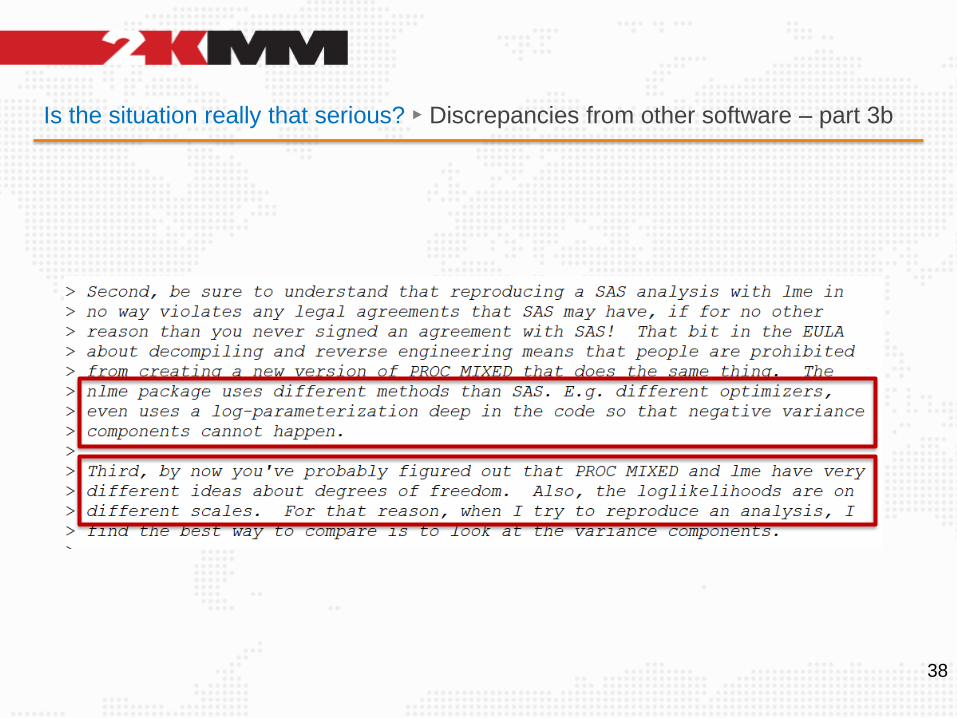
Is the situation really that serious? ► Discrepancies from other software – part 3b
38
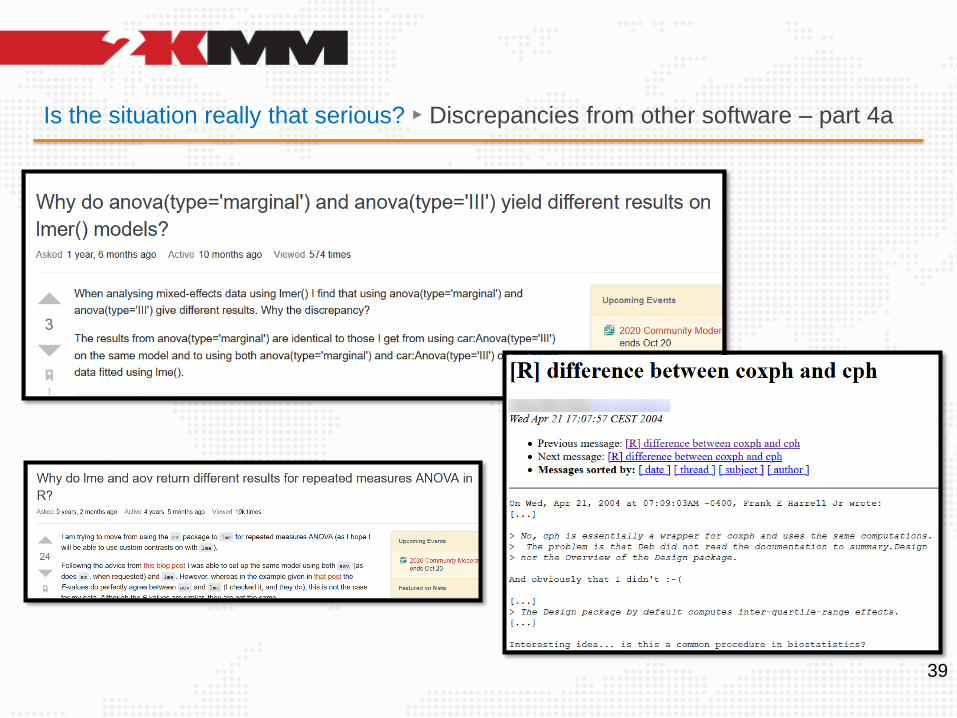
Is the situation really that serious? ► Discrepancies from other software – part 4a
39
How to validate R?
40
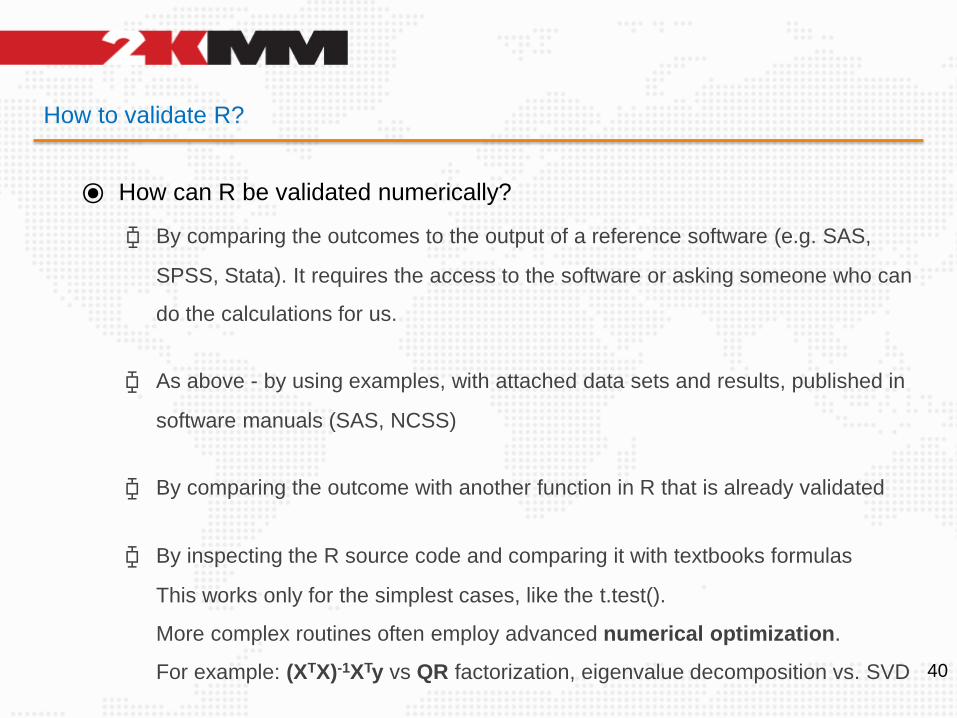
⦿ How can R be validated numerically?
⧮ By comparing the outcomes to the output of a reference software (e.g. SAS,
SPSS, Stata). It requires the access to the software or asking someone who can
do the calculations for us.
⧮ As above - by using examples, with attached data sets and results, published in
software manuals (SAS, NCSS)
⧮ By comparing the outcome with another function in R that is already validated
⧮ By inspecting the R source code and comparing it with textbooks formulas
This works only for the simplest cases, like the t.test().
More complex routines often employ advanced numerical optimization.
For example: (XTX)-1XTy vs QR factorization, eigenvalue decomposition vs. SVD
How to validate R? ► Obstacles 1
41
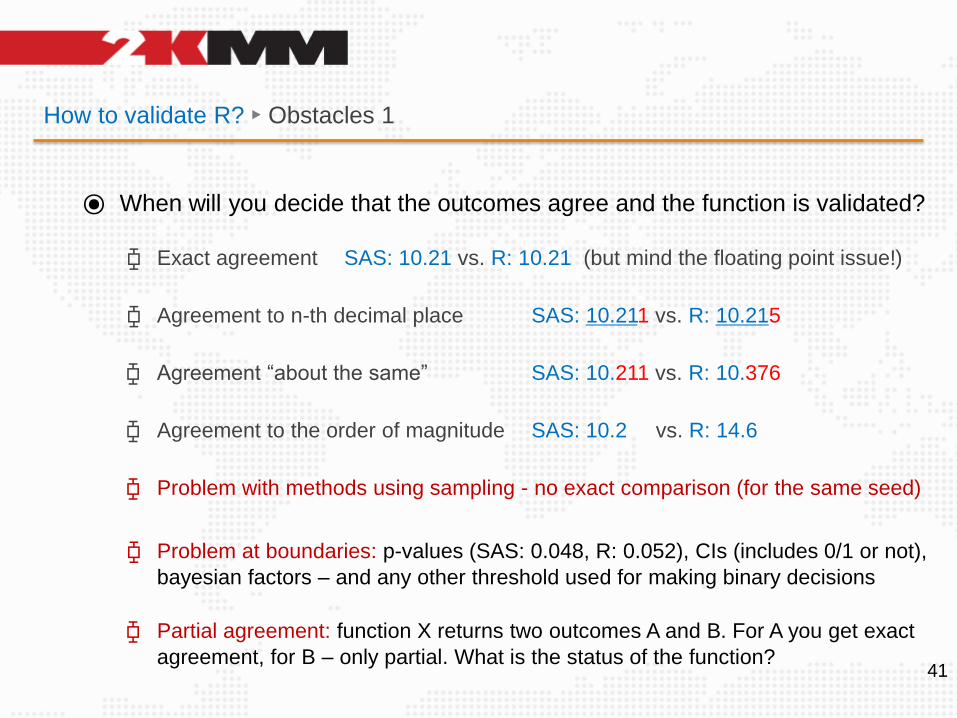
⦿ When will you decide that the outcomes agree and the function is validated?
⧮ Exact agreement SAS: 10.21 vs. R: 10.21 (but mind the floating point issue!)
⧮ Agreement to n-th decimal place SAS: 10.211 vs. R: 10.215
⧮ Agreement “about the same” SAS: 10.211 vs. R: 10.376
⧮ Agreement to the order of magnitude SAS: 10.2 vs. R: 14.6
⧮ Problem with methods using sampling - no exact comparison (for the same seed)
⧮ Problem at boundaries: p-values (SAS: 0.048, R: 0.052), CIs (includes 0/1 or not),
bayesian factors – and any other threshold used for making binary decisions
⧮ Partial agreement: function X returns two outcomes A and B. For A you get exact
agreement, for B – only partial. What is the status of the function?
How to validate R? ► Obstacles 2
42
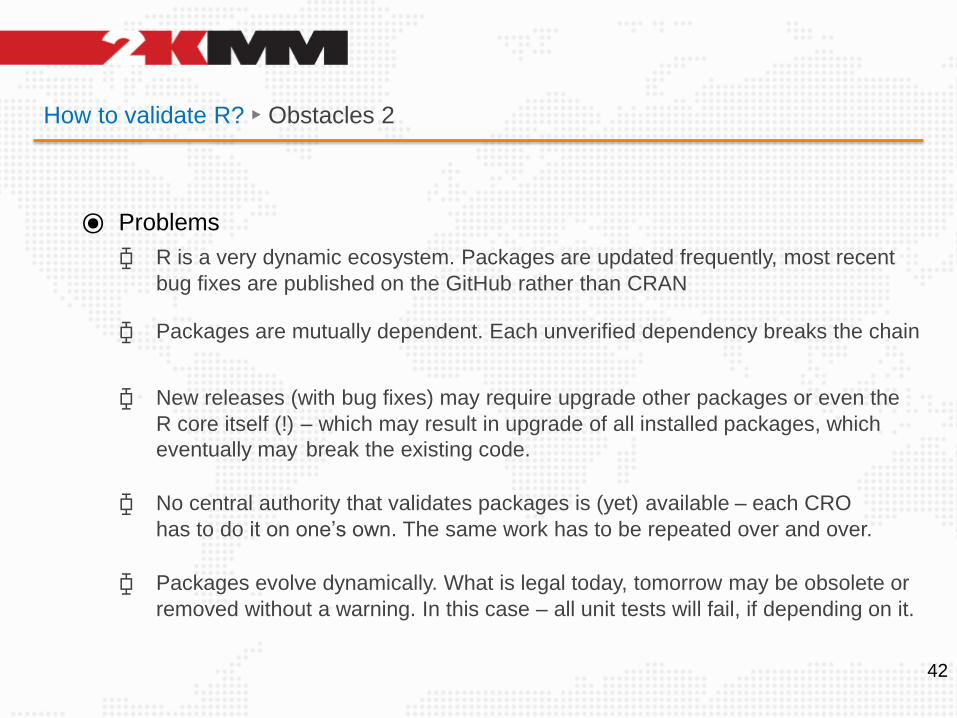
⦿ Problems
⧮ R is a very dynamic ecosystem. Packages are updated frequently, most recent
bug fixes are published on the GitHub rather than CRAN
⧮ Packages are mutually dependent. Each unverified dependency breaks the chain
⧮ New releases (with bug fixes) may require upgrade other packages or even the
R core itself (!) – which may result in upgrade of all installed packages, which
eventually may break the existing code.
⧮ No central authority that validates packages is (yet) available – each CRO
has to do it on one’s own. The same work has to be repeated over and over.
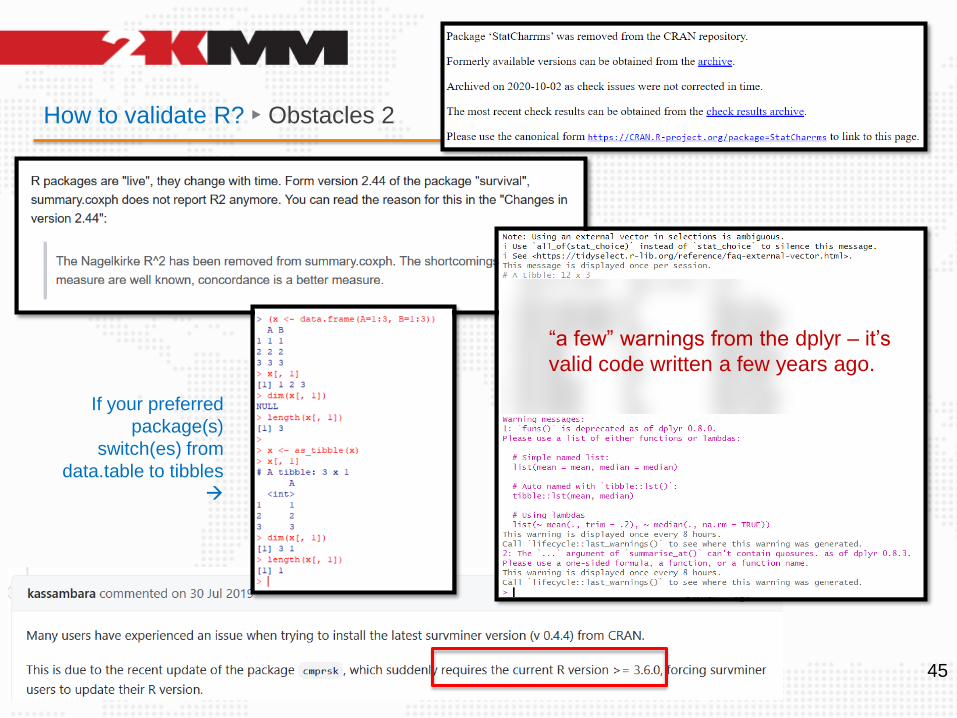
⧮ Packages evolve dynamically. What is legal today, tomorrow may be obsolete or
removed without a warning. In this case – all unit tests will fail, if depending on it.
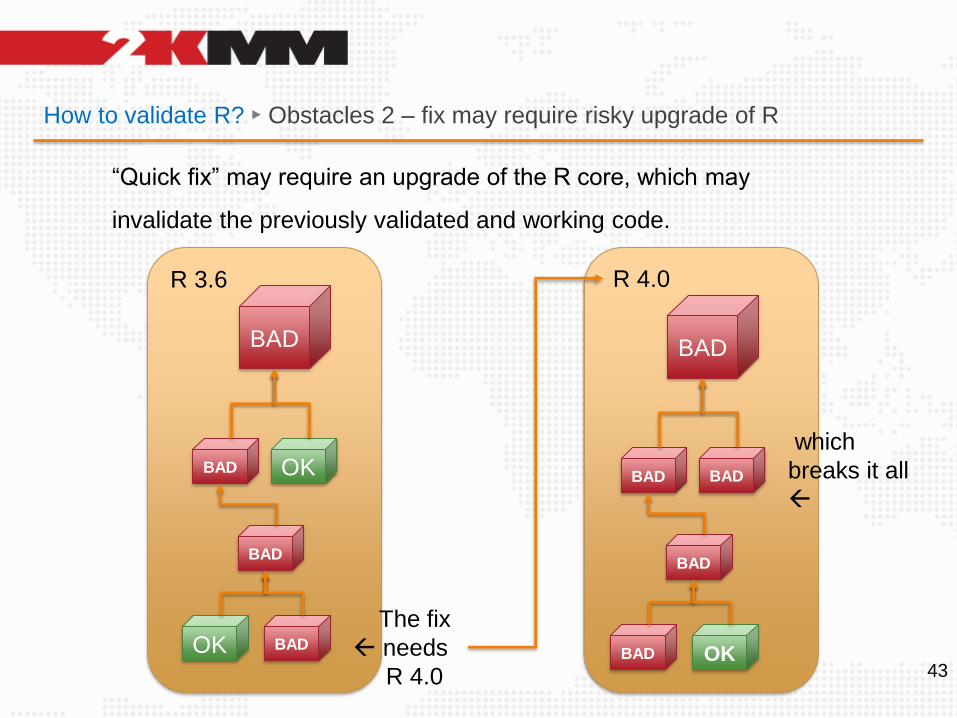
How to validate R? ► Obstacles 2 – fix may require risky upgrade of R
43
BAD
BAD
BAD
OK
OK BAD
R 3.6
The fix
needs
R 4.0
R 4.0
BAD
BAD
BAD
BAD
BAD OK
“Quick fix” may require an upgrade of the R core, which may
invalidate the previously validated and working code.
which
breaks it all
How to validate R? ► Obstacles 2
44
OK
OK
OK
OK
OK
R 3.6
R 4.0
OK
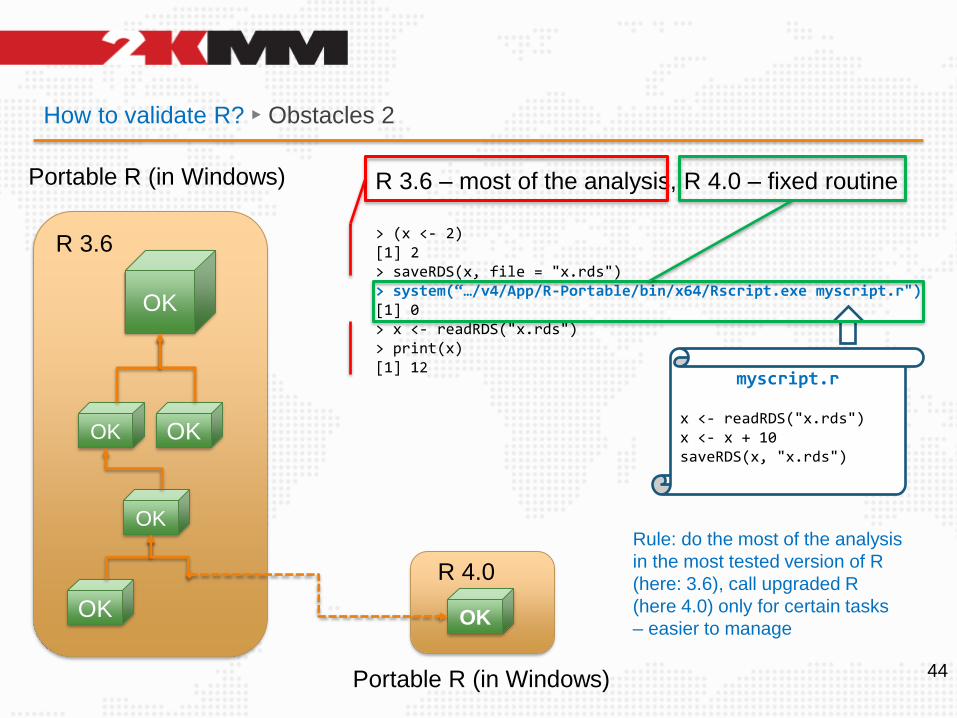
Portable R (in Windows) R 3.6 – most of the analysis, R 4.0 – fixed routine
> (x <- 2)[1] 2> saveRDS(x, file = "x.rds")> system(“…/v4/App/R-Portable/bin/x64/Rscript.exe myscript.r")[1] 0> x <- readRDS("x.rds")> print(x)[1] 12
Portable R (in Windows)
myscript.r
x <- readRDS("x.rds")x <- x + 10saveRDS(x, "x.rds")
Rule: do the most of the analysis
in the most tested version of R
(here: 3.6), call upgraded R
(here 4.0) only for certain tasks
– easier to manage
How to validate R? ► Obstacles 2
45
“a few” warnings from the dplyr – it’s
valid code written a few years ago.
If your preferred
package(s)
switch(es) from
data.table to tibbles
→
How to validate R? ► Obstacles 3
46
⦿ Considerations
- The numerical validation consumes time (=money), and needs special efforts.
- Fortunately, it is an incremental process. Only the used functions have to be
validated (not all available ones!). That is – the smallest part of the validation
is a package::function part, not the entire package itself (possibly exposing
numerous functions you may never require)
- Once test cases are prepared, they can be stored into a repository and run
as needed. The library grows over time, utilizing data from new trials.
- It is doable by a single person but only assuming a good availability of
resources and reasonable time to spend (several months).
What would help?
47
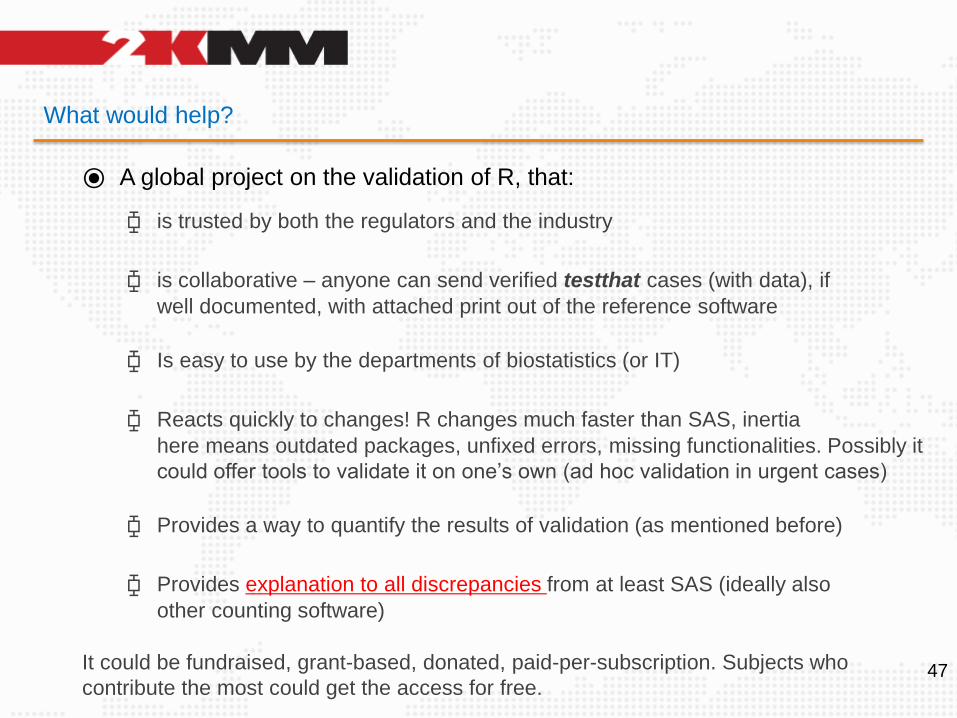
⦿ A global project on the validation of R, that:
⧮ is trusted by both the regulators and the industry
⧮ is collaborative – anyone can send verified testthat cases (with data), if
well documented, with attached print out of the reference software
⧮ Is easy to use by the departments of biostatistics (or IT)
⧮ Reacts quickly to changes! R changes much faster than SAS, inertia
here means outdated packages, unfixed errors, missing functionalities. Possibly it
could offer tools to validate it on one’s own (ad hoc validation in urgent cases)
⧮ Provides a way to quantify the results of validation (as mentioned before)
⧮ Provides explanation to all discrepancies from at least SAS (ideally also
other counting software)
It could be fundraised, grant-based, donated, paid-per-subscription. Subjects who
contribute the most could get the access for free.
What would help?
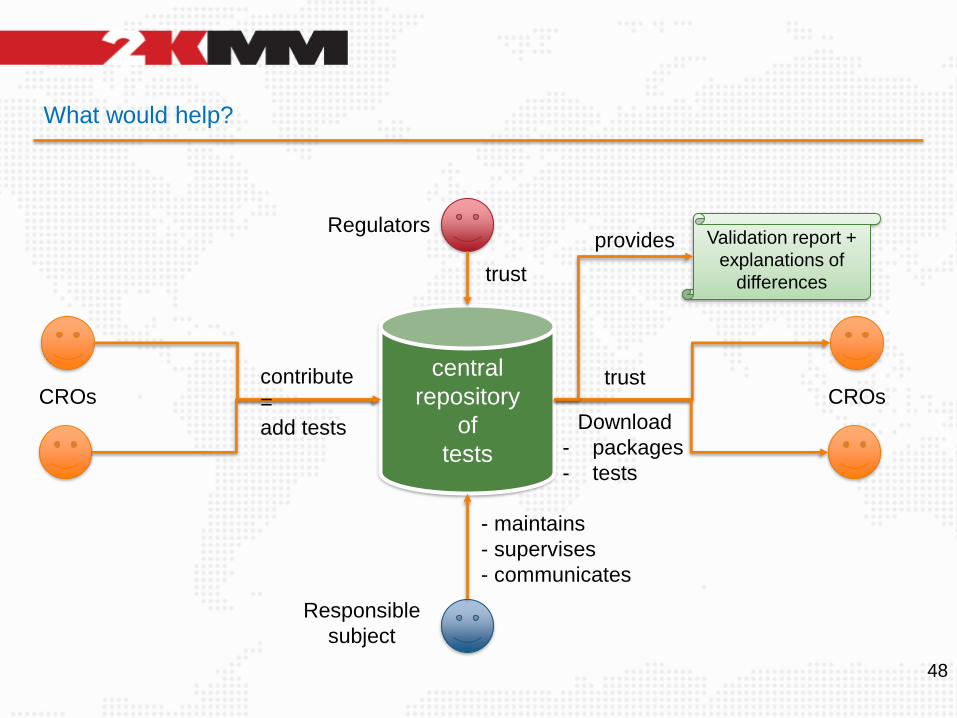
48
central
repository
of
tests
contribute
=
add tests
CROs
Regulators
trustCROs
trust
Download
- packages
- tests
Responsible
subject
- maintains
- supervises
- communicates
Validation report +
explanations of
differences
provides
What would help?
49
⦿ Such project would enable much wider use of R in submissions of
demanding RCTs, where the risk of potential serious problems, maybe even
leading to general failure of the trial, may prevent the managers from
considering R a safe, reliable option or ever the replacement for SAS.
That’s one of the reasons for “… they hesitate”.
⦿ The presented idea seems to differ from the idea of the R Validation Hub,
at least currently ( https://www.pharmar.org ). Both may nicely complement
each other, though.
Other approaches ► a warning
50
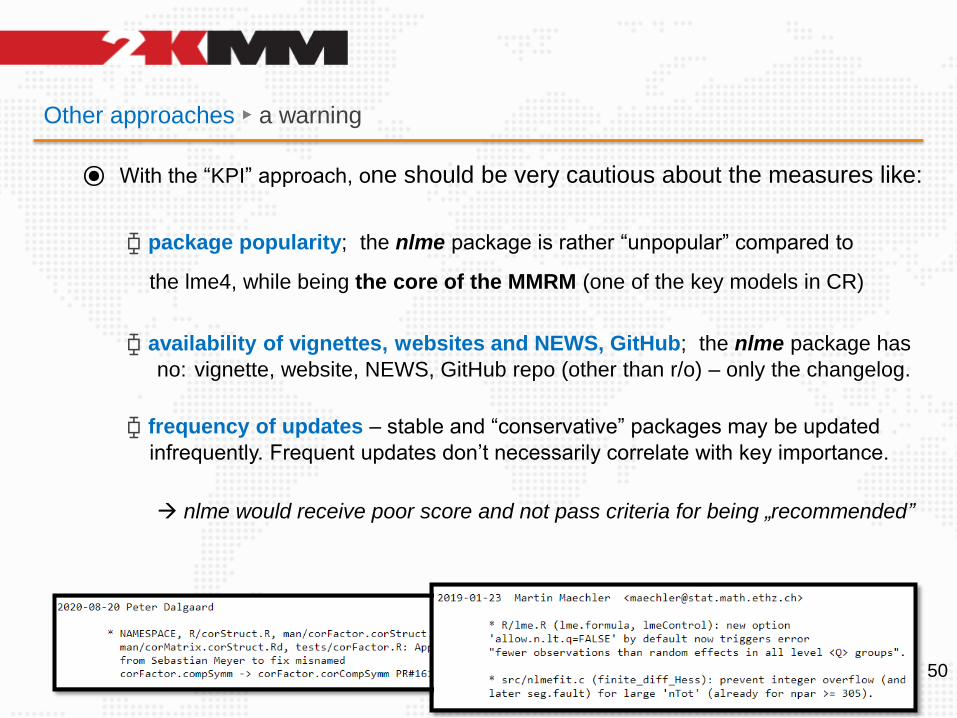
⦿ With the “KPI” approach, one should be very cautious about the measures like:
⧮ package popularity; the nlme package is rather “unpopular” compared to
the lme4, while being the core of the MMRM (one of the key models in CR)
⧮ availability of vignettes, websites and NEWS, GitHub; the nlme package has
no: vignette, website, NEWS, GitHub repo (other than r/o) – only the changelog.
⧮ frequency of updates – stable and “conservative” packages may be updated
infrequently. Frequent updates don’t necessarily correlate with key importance.
→ nlme would receive poor score and not pass criteria for being „recommended”
51
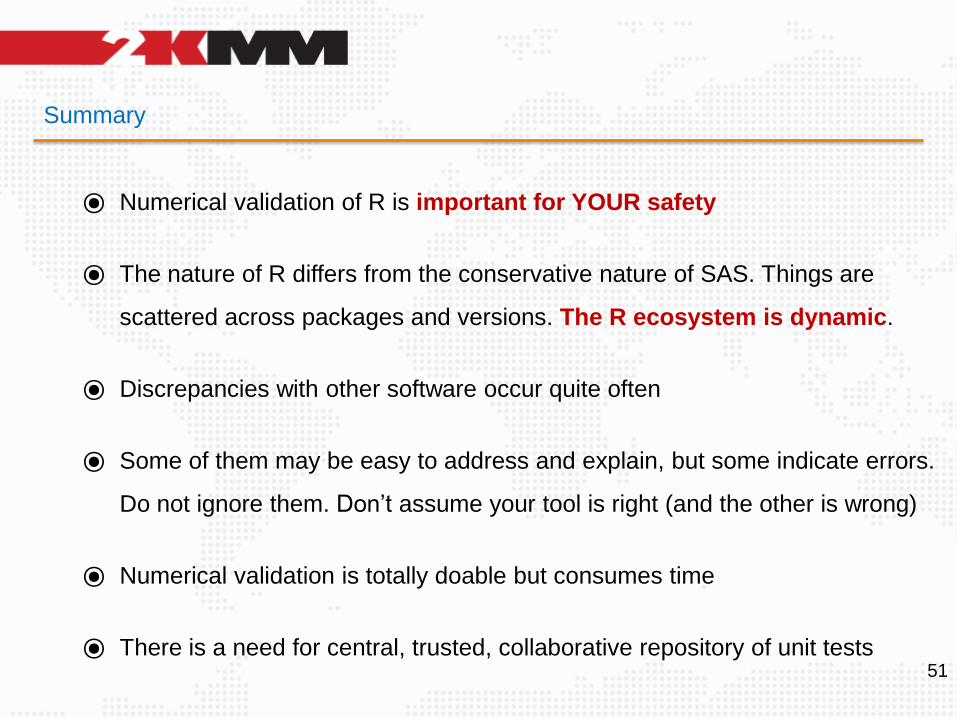
Summary
⦿ Numerical validation of R is important for YOUR safety
⦿ The nature of R differs from the conservative nature of SAS. Things are
scattered across packages and versions. The R ecosystem is dynamic.
⦿ Discrepancies with other software occur quite often
⦿ Some of them may be easy to address and explain, but some indicate errors.
Do not ignore them. Don’t assume your tool is right (and the other is wrong)
⦿ Numerical validation is totally doable but consumes time
⦿ There is a need for central, trusted, collaborative repository of unit tests
52
THANK YOU
This is just the beginning…