Embed Size (px)
Citation preview
Numerical Test 5 Solutions Booklet
AssessmentDay Practice Aptitude Tests
Instructions This numerical reasoning test comprises 30 questions, and you will have 30 minutes in which to correctly answer as many as you can. Calculators are permitted for this test, and it is recommended you have some rough paper to work on. You will have to work quickly and accurately to perform well in this test. If you don't know the answer to a question, leave it and come back to it if you have time. Each question will have five possible answers, one of which is correct. You may click Back and Next during the test to review or skip questions. You can submit your test at any time. If the time limit is up before you click submit the test will automatically be submitted with the answers you have selected. It is recommended to keep working until the time limit is up. Try to find a time and place where you will not be interrupted during the test. The test will begin on the next page.

For personal use only. Unauthorised copying or
distribution in printed, electronic, or any other
form in whole or in part, is prohibited without
prior written permission from AssessmentDay.
Page 2
Document last updated 25-01-2013
AssessmentDay www.assessmentday.co.uk
Q1 What was the unit sales ratio of Austrian Quarter 4 : Portugal Quarter 1: Greek Quarter 4?
(A) 35:28:22
(B) 5:3:4
(C) 6:4:3
(D) 5:4:3
(E) 3:4:2
Step 1 - Put the 3 countries into a ratio
Austria (Quarter 4) : Portugal (Quarter 1): Greek (Quarter 4) = 35,000: 28,000: 21,000
Step 2 – Simplify the ratio (recognize that 7 is a common denominator)
5:4:3
Thus the correct answer is (D) 5:4:3

For personal use only. Unauthorised copying or
distribution in printed, electronic, or any other
form in whole or in part, is prohibited without
prior written permission from AssessmentDay.
Page 3
Document last updated 25-01-2013
AssessmentDay www.assessmentday.co.uk
Q2 Which country met or exceeded its annual target for unit sales?
(A) Greece
(B) Portugal
(C) Austria
(D) Ireland
(E) Croatia
Tip: Notice that all the available answers have just one country, so we know that as soon as
we have found one country that exceeded its target, we have the correct answer and we can
move on.
Step 1 – Calculate the total unit sales for each country
Greece = 108,300
Portugal = 104,200
Austria = 105,800
Ireland = 102,400
Crotia = 105,200
Step 2 – Compare each total to the Yearly Target (Unit sales)
Targets are either 105,000 or 110,000.
Only Austria has exceeded its 105,000 target.
Thus the correct answer is (C) Austria

For personal use only. Unauthorised copying or
distribution in printed, electronic, or any other
form in whole or in part, is prohibited without
prior written permission from AssessmentDay.
Page 4
Document last updated 25-01-2013
AssessmentDay www.assessmentday.co.uk
Q3 The previous year’s average number of Portuguese units sold per quarter was 20% higher than the year shown. What was the previous year’s average number of Portuguese units sold per quarter?
(A) 104,200
(B) 31,260
(C) 26,050
(D) 21,260
(E) 20,840
Step 1 – Calculate this year’s average number of Portuguese units sold per quarter
(28,000 + 33,200 + 22,600 + 20,400) / 4 = 104,200 /4 = 26,050
Step 2 – Calculate a 20% increase to get last year’s average number of Portuguese units
sold per quarter
26,050 x 1.2 = 31,260
Thus the correct answer is (B) 31,260

For personal use only. Unauthorised copying or
distribution in printed, electronic, or any other
form in whole or in part, is prohibited without
prior written permission from AssessmentDay.
Page 5
Document last updated 25-01-2013
AssessmentDay www.assessmentday.co.uk
Q4 If Austria’s annual corporation tax was 22% on the first €200,000 of sales and 20% on sales exceeding €200,000, how much is their corporation tax bill for the year (assuming each unit is sold at €3.5)?
(A) €34,000
(B) €34,060
(C) €37,060
(D) €44,000
(E) €78,060
Step 1 – Calculate the total value of Austrian unit sales
Total Austrian unit sales = 105,800
Total value of Austrian unit sales = 105,800 x €3.5 = €370,300
Step 2 - Calculate the corporation tax for the first €200,000 of Austrian unit sales
€200,000 x 22% = €44,000
Step 3 - Calculate the tax for sales exceeding €200,000
€370,300 - €200,000 = €170,300
€170,300 x 20% = €34,060
Step 4 – Calculate the total tax
€44,000 + €34,060
Thus the correct answer is (E) €78,060

For personal use only. Unauthorised copying or
distribution in printed, electronic, or any other
form in whole or in part, is prohibited without
prior written permission from AssessmentDay.
Page 6
Document last updated 25-01-2013
AssessmentDay www.assessmentday.co.uk
Q5 Greek and Irish sales generated 2.5 Euros per unit sold, whilst the other countries’ sales generated 2.25 Euros per unit sold. Which country or countries exceeded their Annual Product Sales Target?
(A) Portugal and Austria
(B) Ireland and Austria
(C) Croatia and Austria
(D) Croatia and Greece
(E) Ireland and Greece
Step 1 – Calculate the total unit sales for each country
Using the earlier question’s total unit sales for each country
Greece = 108,300 x 2.5 = 270,750
Portugal = 104,200 x 2.25 = 234,450
Austria = 105,800 x 2.25 = 238,050
Ireland = 102,400 x 2.5 = 256,000
Croatia = 105,200 x 2.25 = 236,700
Step 2 – Compare each total to the Annual Product Sales Target
Only Croatia and Greece exceeded their respective targets.
Thus the correct answer is (D) Croatia and Greece

For personal use only. Unauthorised copying or
distribution in printed, electronic, or any other
form in whole or in part, is prohibited without
prior written permission from AssessmentDay.
Page 7
Document last updated 25-01-2013
AssessmentDay www.assessmentday.co.uk
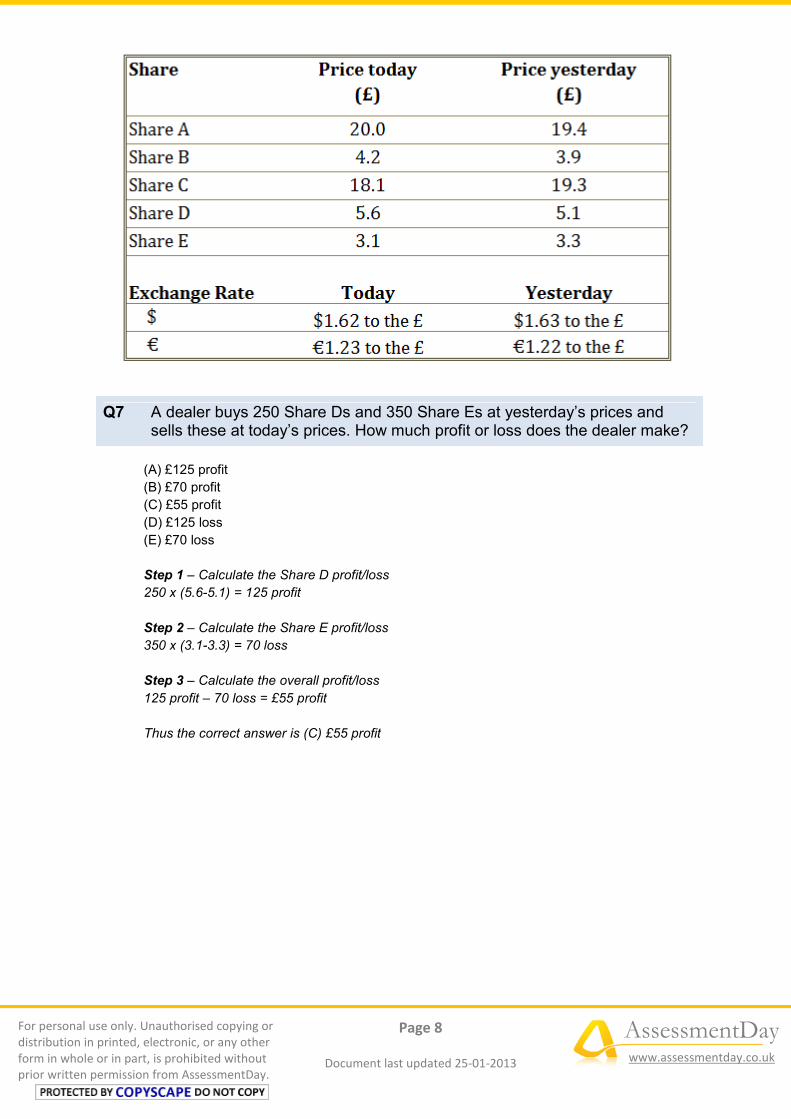
Q6 Which shares have increased and decreased respectively in value by the largest percent from yesterday to today?
(A) Share D, Share A
(B) Share D, Share C
(C) Share D, Share E
(D) Share B, Share A
(E) Share B, Share C
Tip: The wording of the question for percentage increases and decreases is critical. Since the wording says “FROM yesterday TO today” the calculation we must perform is (today) ÷ (yesterday). To determine this, think about how you would increase something by say 20%. You multiply the original by 1.2 to get the increased result. Step 1 – Calculate the % change in value for each share Share A: 20 /19.4 = 3.1% increase Share B: 4.2 / 3.9 = 7.7% increase Share C: 18.1 / 19.3 = 6.2% decrease Share D: 5.6 / 5.1 = 9.8% increase Share E: 3.1 / 3.3 = 6.1% decrease Thus the correct answer is (B) Share D, Share C
For personal use only. Unauthorised copying or
distribution in printed, electronic, or any other
form in whole or in part, is prohibited without
prior written permission from AssessmentDay.
Page 8
Document last updated 25-01-2013
AssessmentDay www.assessmentday.co.uk
Q7 A dealer buys 250 Share Ds and 350 Share Es at yesterday’s prices and sells these at today’s prices. How much profit or loss does the dealer make?
(A) £125 profit
(B) £70 profit
(C) £55 profit
(D) £125 loss
(E) £70 loss
Step 1 – Calculate the Share D profit/loss
250 x (5.6-5.1) = 125 profit
Step 2 – Calculate the Share E profit/loss
350 x (3.1-3.3) = 70 loss
Step 3 – Calculate the overall profit/loss
125 profit – 70 loss = £55 profit
Thus the correct answer is (C) £55 profit

For personal use only. Unauthorised copying or
distribution in printed, electronic, or any other
form in whole or in part, is prohibited without
prior written permission from AssessmentDay.
Page 9
Document last updated 25-01-2013
AssessmentDay www.assessmentday.co.uk
Q8 A trader has 200,000 Share Bs to sell at today’s price and today plans to split her proceeds equally into an investment in Share A and Share D. In how many Share As and Share Ds does the trader invest?
(A) 20,000 Share A and 70,000 Share D
(B) 21,000 Share A and 75,000 Share D
(C) 22,000 Share A and 80,000 Share D
(D) 23,000 Share A and 85,000 Share D
(E) 24,000 Share A and 90,000 Share D
Step 1 – Calculate the amount invested per share
200,000 x 4.2 = £840,000
£840,000 / 2 = £420,000 per share A and D.
Step 2 – Calculate the number of Share A shares at today’s prices
£420,000/20 = 21,000 of Share A
Step 3 – Calculate the number of Share D shares at today’s prices
£420,000/5.6 = 75,000 of Share D
Tip: If at this point you had answers in decimals you should question whether that’s correct
and go back.
Thus the correct answer is (B) 21,000 Share A and 75,000 Share D

For personal use only. Unauthorised copying or
distribution in printed, electronic, or any other
form in whole or in part, is prohibited without
prior written permission from AssessmentDay.
Page 10
Document last updated 25-01-2013
AssessmentDay www.assessmentday.co.uk
Q9 What was the total cost of buying 550 Share C’s yesterday and 1,050 Share E’s today (to the nearest $1,000)?
(A) $11,000
(B) $14,000
(C) $17,000
(D) $18,000
(E) $23,000
Step 1 - Calculate the cost of 550 Share Cs bought yesterday
550 x 19.3 = £10,615
Step 2 – Change into $
10,615 x 1.63 = $17,302.45
Step 3 – Calculate the cost of 1,050 Share Es bought today
1,050 x 3.1 = £3,255
Step 4 – Change into $
3,255 x 1.62 = $5,273.1
Step 5 – Calculate the total cost
$17,302.45+ $5,273.1 = $22,575.55
Tip: If you forgot to convert into dollars, your answer of £14,000 looks very similar to option
(B) and you would have got this question wrong. Often, distracters like this are included in the
answers to catch you out.
Thus the correct answer is (E) $23,000

For personal use only. Unauthorised copying or
distribution in printed, electronic, or any other
form in whole or in part, is prohibited without
prior written permission from AssessmentDay.
Page 11
Document last updated 25-01-2013
AssessmentDay www.assessmentday.co.uk
Q10 Today’s prices for Share A and Share C (in Euros) respectively represent a 15% decrease and a 22% increase on the price (in Euros) one year ago. What were the respective prices a year ago (to the nearest Euro)?
(A) €18 (Share A); €18 (Share C)
(B) €22 (Share A); €22 (Share C)
(C) €29 (Share A); €29 (Share C)
(D) €29 (Share A); €18 (Share C)
(E) €29 (Share A); €30 (Share C)
Step 1 – Convert share prices in to Euros
Share A: 20 x 1.23 = €24.6
Share C: 18.1 x 1.23 = €22.263
Step 2 - Calculate the Share A price one year ago
24.6 ÷ 0.85 = €28.94
Step 3 – Calculate the Share C price one year ago
22.263 ÷ 1.22 = €18.25
Thus the correct answer is (D) €29 (Share A); €18 (Share C)
For personal use only. Unauthorised copying or
distribution in printed, electronic, or any other
form in whole or in part, is prohibited without
prior written permission from AssessmentDay.
Page 12
Document last updated 25-01-2013
AssessmentDay www.assessmentday.co.uk
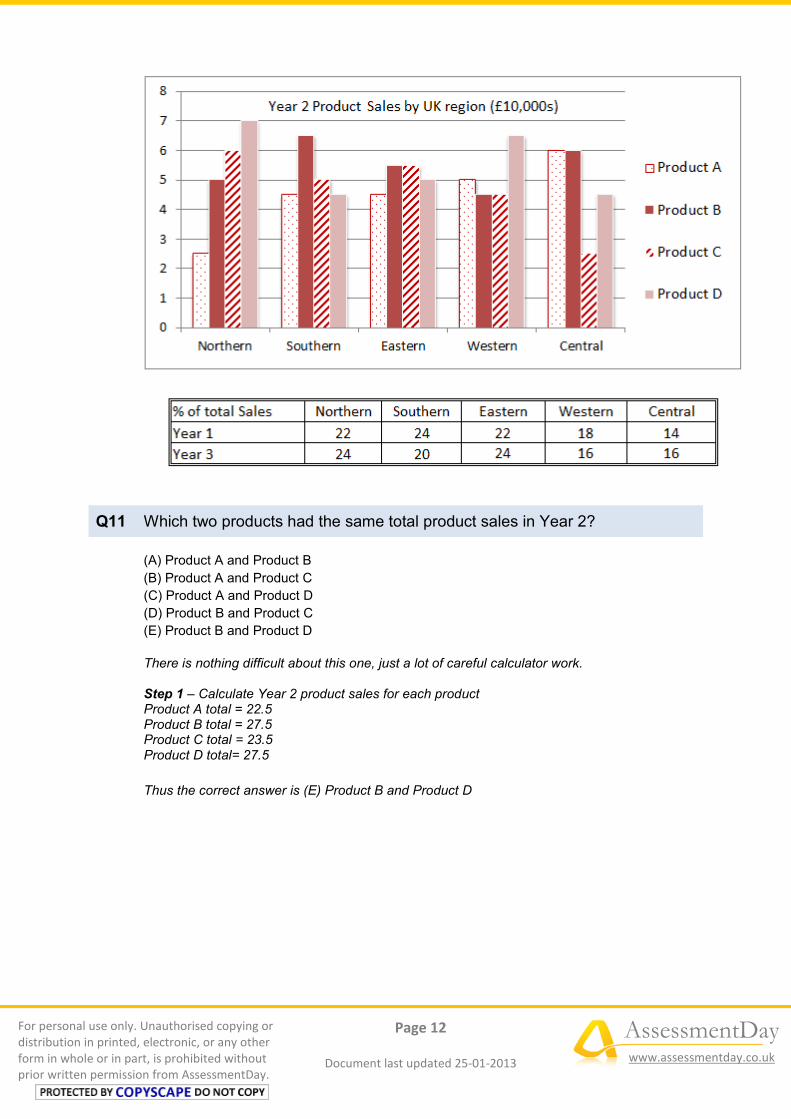
Q11 Which two products had the same total product sales in Year 2?
(A) Product A and Product B
(B) Product A and Product C
(C) Product A and Product D
(D) Product B and Product C
(E) Product B and Product D
There is nothing difficult about this one, just a lot of careful calculator work. Step 1 – Calculate Year 2 product sales for each product Product A total = 22.5 Product B total = 27.5 Product C total = 23.5 Product D total= 27.5
Thus the correct answer is (E) Product B and Product D

For personal use only. Unauthorised copying or
distribution in printed, electronic, or any other
form in whole or in part, is prohibited without
prior written permission from AssessmentDay.
Page 13
Document last updated 25-01-2013
AssessmentDay www.assessmentday.co.uk
Q12 As a percentage of total sales across all regions, how has the Eastern region’s sales changed between Year 1 and Year 2?
(A) 1% less
(B) 1.7% more
(C) 1.7% less
(D) 3% more
(E) 3% less
The information that you need is in the graph (Year 2) and the table (Year 1)
Step 1 – Calculate the Eastern region’s % of total sales (Year 2)
Eastern region’s Year 2 sales = 4.5 + 5.5 + 5.5 + 5.0 = 20.5
Add up the total sales for all products across all regions (Year 2)
(2.5 + 5 + 6 + 7 + 4.5 + 6.5 + 5 + 4.5 + 4.5 + 5.5 + 5.5 + 5 + 5 + 4.5 + 4.5 + 6.5 + 6 + 6 + 2.5 +
4.5) = 101 (£10,000s).
Now as a % of total sales this is 20.5 / 101 = 20.3% for year 2.
Step 2 – Calculate the change between Year 1 and Year 2
Year 1 from the table is given as 22%
And 22 – 20.3 = 1.7%
Thus the correct answer is (C) 1.7% less

For personal use only. Unauthorised copying or
distribution in printed, electronic, or any other
form in whole or in part, is prohibited without
prior written permission from AssessmentDay.
Page 14
Document last updated 25-01-2013
AssessmentDay www.assessmentday.co.uk
Q13 For products A, B, C and D combined, which region had a sales value different from the other regions in Year 2?
(A) Western
(B) Eastern
(C) Central
(D) Western
(E) None of these
Step 1 - Calculate the total sales for each region
Eastern = 4.5 + 5.5 + 5.5 + 5 = 20.5
Northern = 2.5 + 5 + 6 + 7 = 20.5
Southern = 4.5 + 6.5 + 5 + 4.5 = 20.5
Western = 5 + 4.5 + 4.5 + 6.5 = 20.5
Central = 6 + 6 + 2.5 + 4.5 = 19
We can now see that the Central region had a value not equal to the others.
Thus the correct answer is (C) Central
For personal use only. Unauthorised copying or
distribution in printed, electronic, or any other
form in whole or in part, is prohibited without
prior written permission from AssessmentDay.
Page 15
Document last updated 25-01-2013
AssessmentDay www.assessmentday.co.uk
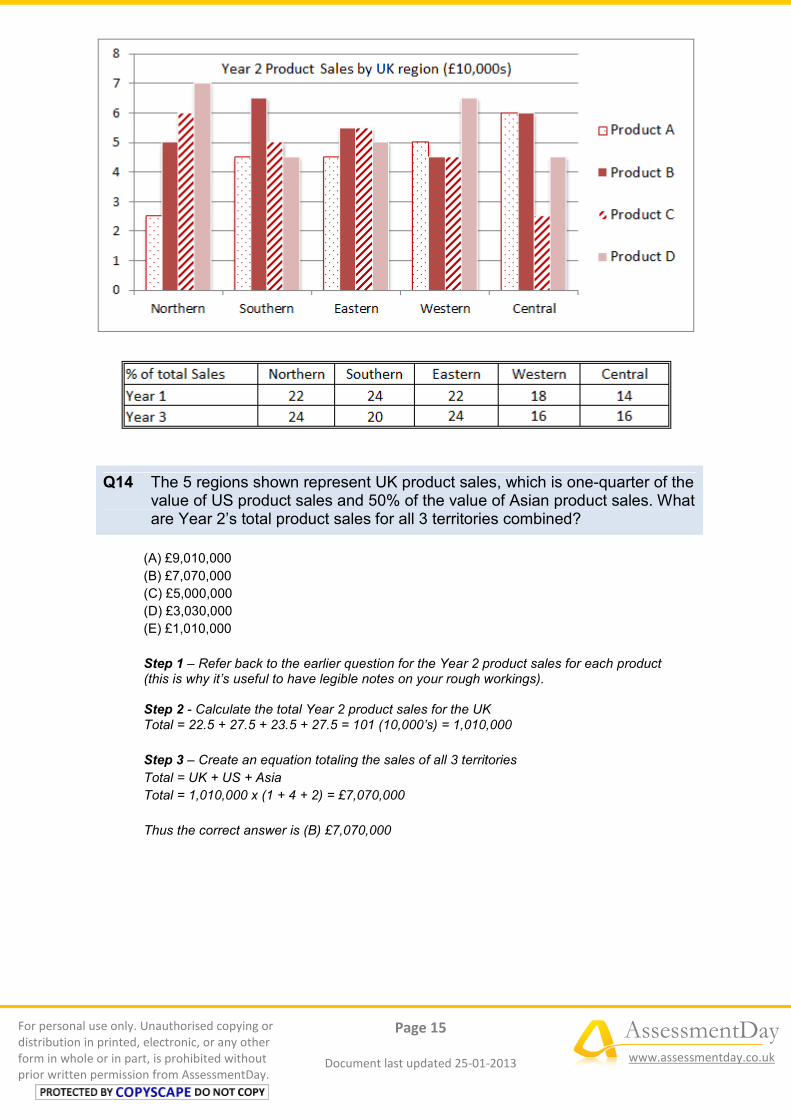
Q14 The 5 regions shown represent UK product sales, which is one-quarter of the value of US product sales and 50% of the value of Asian product sales. What are Year 2’s total product sales for all 3 territories combined?
(A) £9,010,000
(B) £7,070,000
(C) £5,000,000
(D) £3,030,000
(E) £1,010,000
Step 1 – Refer back to the earlier question for the Year 2 product sales for each product (this is why it’s useful to have legible notes on your rough workings). Step 2 - Calculate the total Year 2 product sales for the UK Total = 22.5 + 27.5 + 23.5 + 27.5 = 101 (10,000’s) = 1,010,000
Step 3 – Create an equation totaling the sales of all 3 territories
Total = UK + US + Asia
Total = 1,010,000 x (1 + 4 + 2) = £7,070,000
Thus the correct answer is (B) £7,070,000

For personal use only. Unauthorised copying or
distribution in printed, electronic, or any other
form in whole or in part, is prohibited without
prior written permission from AssessmentDay.
Page 16
Document last updated 25-01-2013
AssessmentDay www.assessmentday.co.uk
Q15 Which region experienced the greatest change in its share of total UK sales between Year 1 and Year 2?
(A) Northern
(B) Southern
(C) Western
(D) Eastern
(E) Central
The information that you need is in the graph (Year 2) and the table (Year 1)
Step 1 – Calculate each region’s % of total sales for Year 2 (you can save time by using the
figures from a previous question)
Eastern = 20.5 / 101 = 20.3
Northern = 20.5 / 101 = 20.3
Southern = 20.5 / 101 = 20.3
Western = 20.5 / 101 = 20.3
Central = 19 / 101 = 18.8
Step 2 – Calculate the change in market share between Year 1 and Year 2, as follows;
N S E W C
22 – 20.3
= 1.7%
24 – 20.3
= 3.7%
22 – 20.3
= 1.7%
18 – 20.3
= -2.3%
14 – 18.8
= -4.8%
Thus the correct answer is (E) Central

For personal use only. Unauthorised copying or
distribution in printed, electronic, or any other
form in whole or in part, is prohibited without
prior written permission from AssessmentDay.
Page 17
Document last updated 25-01-2013
AssessmentDay www.assessmentday.co.uk
Q16 Next year, which liability is projected to have experienced the second highest percentage change in value compared with last year?
(A) Interest paying loans
(B) Currency swaps
(C) Other current liabilities
(D) Pension payments
(E) Cannot tell
Step 1 - Calculate the % change in value for each liability shown.
Interest paying loans = 134 / 135 = 0.993 = 0.7% decrease
Currency swaps= 6.9 / 8.5= 0.812 = 18.8% decrease – second largest change
Other current liabilities = 48 / 42 = 15% increase
Interest bearing loans = 42.6 / 53 = 19.62% decrease – Largest change
Pension payments = 218 / 204 = 6.9% increase
Tax liabilities = 49.5 / 48 = 3.125% increase.
Thus the correct answer is (B) Currency swaps

For personal use only. Unauthorised copying or
distribution in printed, electronic, or any other
form in whole or in part, is prohibited without
prior written permission from AssessmentDay.
Page 18
Document last updated 25-01-2013
AssessmentDay www.assessmentday.co.uk
Q17 What is the average difference between the total Non-Current Liabilities and the total Current Liabilities for the 3 years shown (to the nearest £million)?
(A) £116 million
(B) £117 million
(C) £118 million
(D) £119 million
(E) £120 million
Step 1 – Calculate the Previous year’s difference between the total Non-current liabilities and
the total Current liabilities
305 – 185.5 = 119.5
Step 2 – Calculate the Current year’s difference between the total Non-current liabilities and
the total Current liabilities
297.4 – 189.3 = 108.1
Step 3 – Calculate Next year’s projected difference between the total Non-current liabilities
and the total Current liabilities
310.1 – 189.2 = 120.9
Step 4 – Calculate the average
(119.5 + 108.1 + 120.9) / 3 = 116.2
Thus the correct answer is (A) £116 million

For personal use only. Unauthorised copying or
distribution in printed, electronic, or any other
form in whole or in part, is prohibited without
prior written permission from AssessmentDay.
Page 19
Document last updated 25-01-2013
AssessmentDay www.assessmentday.co.uk
Q18 If the projected figures shown prove accurate and the same percentage changes occur for each liability in the year after next, what will the total Current Liabilities be in the year after next (to the nearest £million)?
(A) £192 million
(B) £189 million
(C) £187 million
(D) £185 million
(E) £183 million
Step 1 – Calculate each Current Liability’s % change, as follows
Interest paying loans 134 / 126 = 106.35%
Currency swaps 6.9 / 11.3 = 61.06 %
Other current liabilities 48.3 / 52 = 92.88%
Step 2 – Calculate each Current Liability’s subsequent year’s value
Interest paying loans 134 x 106.35% = 142.51
Currency swaps 6.9 x 61.06% = 4.21
Other current liabilities 48.3 x 92.88% = 44.86
Tip: instead of writing down the percentage increase for each category, it saves time if you
leave the number in your calculator and work out the “subsequent year” figure straight away.
In other words, combine steps 1 and 2.
Step 3 – Total the Current Liability values
142.51 + 4.21 + 44.86 = 191.59
Thus the correct answer is (A) £192 million

For personal use only. Unauthorised copying or
distribution in printed, electronic, or any other
form in whole or in part, is prohibited without
prior written permission from AssessmentDay.
Page 20
Document last updated 25-01-2013
AssessmentDay www.assessmentday.co.uk
Q19 The Pension payments figure for each year is based upon the following numbers of ex-employees drawing a pension: 8,155 (previous year); 8,240 (current year); 8,325 (next year). What is the average pension payable across the 3 years shown (to the nearest £1,000)?
(A) £15,000
(B) £20,000
(C) £25,000
(D) £30,000
(E) £35,000
Step 1 – Calculate the total amount of pension payments across the 3 years shown
204 + 196 + 218 = £618 million
Step 2 – Calculate the total number of ex-employees drawing a pension across the 3 years
shown
8,155 + 8,240 + 8,325 = 24,720
Step 3 – Calculate the average pension payable across the 3 years
£618 million / 24,720 = £25,000
Thus the correct answer is (C) £25,000

For personal use only. Unauthorised copying or
distribution in printed, electronic, or any other
form in whole or in part, is prohibited without
prior written permission from AssessmentDay.
Page 21
Document last updated 25-01-2013
AssessmentDay www.assessmentday.co.uk
Q20 Next year’s projected figures need to be corrected by adding an additional 4% for inflation. What is next year’s corrected total Non-Current Liabilities?
(A) £322.5 million
(B) £310.1 million
(C) £309.3 million
(D) £297.7 million
(E) £297.4 million
Step 1 – Calculate next year’s projected total Non-current liabilities
Interest bearing loans + Pension payments + Tax liabilities =
42.6 + 218 + 49.5 = 310.1
Step 2 – Correct the total by adding 4% for inflation
310.1 x 1.04 = £322.5 million
Thus the correct answer is (A) £322.5 million

For personal use only. Unauthorised copying or
distribution in printed, electronic, or any other
form in whole or in part, is prohibited without
prior written permission from AssessmentDay.
Page 22
Document last updated 25-01-2013
AssessmentDay www.assessmentday.co.uk
Q21 What was the global income for Ploche Inc in 2007 (to the nearest £10,000)?
(A) £6,000,000
(B) £5,510,000
(C) £5,500,000
(D) £5,430,000
(E) £4,510,000
The information that you need is shown in both the line graph and the histogram.
Step 1 – Calculate 2006’s global income for Ploche Inc by adding the 4 quarters
13.5 + 11.6 + 13.9 + 15.3 = 54.3 (£100,000s)
= £5.43 million
Step 2 – Calculate 2007 global income (allowing for the annual change of 1.4%)
£5.43 million x 1.014 = £5.506 million
Step 3 - To the nearest £10,000
£5.506 million = £5,510,000
Thus the correct answer is (B) £5,510,000
For personal use only. Unauthorised copying or
distribution in printed, electronic, or any other
form in whole or in part, is prohibited without
prior written permission from AssessmentDay.
Page 23
Document last updated 25-01-2013
AssessmentDay www.assessmentday.co.uk
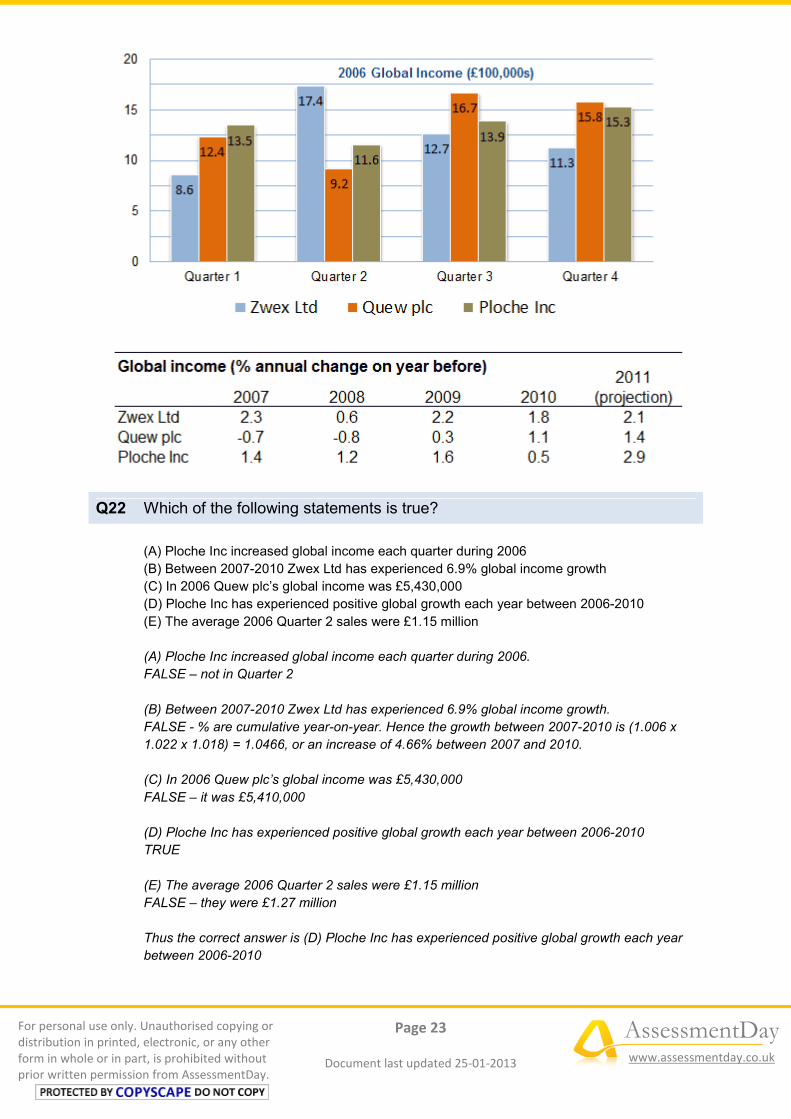
Q22 Which of the following statements is true?
(A) Ploche Inc increased global income each quarter during 2006
(B) Between 2007-2010 Zwex Ltd has experienced 6.9% global income growth
(C) In 2006 Quew plc’s global income was £5,430,000
(D) Ploche Inc has experienced positive global growth each year between 2006-2010
(E) The average 2006 Quarter 2 sales were £1.15 million
(A) Ploche Inc increased global income each quarter during 2006.
FALSE – not in Quarter 2
(B) Between 2007-2010 Zwex Ltd has experienced 6.9% global income growth.
FALSE - % are cumulative year-on-year. Hence the growth between 2007-2010 is (1.006 x
1.022 x 1.018) = 1.0466, or an increase of 4.66% between 2007 and 2010.
(C) In 2006 Quew plc’s global income was £5,430,000
FALSE – it was £5,410,000
(D) Ploche Inc has experienced positive global growth each year between 2006-2010
TRUE
(E) The average 2006 Quarter 2 sales were £1.15 million
FALSE – they were £1.27 million
Thus the correct answer is (D) Ploche Inc has experienced positive global growth each year
between 2006-2010

For personal use only. Unauthorised copying or
distribution in printed, electronic, or any other
form in whole or in part, is prohibited without
prior written permission from AssessmentDay.
Page 24
Document last updated 25-01-2013
AssessmentDay www.assessmentday.co.uk
Q23 In which year up to 2010 did Quew plc experience a higher annual % growth than either Zwex Ltd or Ploche Inc?
(A) 2007
(B) 2008
(C) 2009
(D) 2010
(E) None of these
Step 1 - Simply compare Quew plc’s figures for each period compared to Zwex Ltd and
Ploche Inc:
2007 2008 2009 2010
Zwex Ltd 2.3 0.6 2.2 1.8
Quew
plc -0.7 -0.8 0.3 1.1
Ploche
Inc 1.4 1.2 1.6 0.5
We see that in 2010 Quew grew by 1.1% whilst Ploche grew by 0.5%. Note the question asks
for EITHER Zwex or Ploche; don't fall into the trap of looking for a year in which Quew is
larger than BOTH Zwex and Ploche.
Thus the correct answer is (D) 2010

For personal use only. Unauthorised copying or
distribution in printed, electronic, or any other
form in whole or in part, is prohibited without
prior written permission from AssessmentDay.
Page 25
Document last updated 25-01-2013
AssessmentDay www.assessmentday.co.uk
Q24 In 2006 Zwex’s Global sales comprised European and non-European sales, which were in the ratio 3:4. What were Zwex’s European sales for 2006?
(A) £2.14 million
(B) £2.5 million
(C) £3 million
(D) £3.5 million
(E) £3.75 million
Step 1 – Calculate Zwex Ltd’s Global sales for 2006
8.6 + 17.4 + 12.7 + 11.3 = 50 (£100,000s)
Step 2 – Put this figure into the ratio given in the question. If European sales were 3 parts out
of a total of 7 (i.e. European plus non-European) we have to multiply by 3/7.
Step 3 – Calculate Zwex’s European sales
£5 million x 3/7 = £2.143 million
Thus the correct answer is (A) £2.14 million

For personal use only. Unauthorised copying or
distribution in printed, electronic, or any other
form in whole or in part, is prohibited without
prior written permission from AssessmentDay.
Page 26
Document last updated 25-01-2013
AssessmentDay www.assessmentday.co.uk
Q25 What was the global income for Quew plc in 2008 (to the nearest £100,000)?
(A) £5.41 million
(B) £5.37 million
(C) £5.33 million
(D) £5.30 million
(E) £5.23 million
The information that you need is shown in both the line graph and the histogram.
Step 1 – Calculate 2006’s global income for Quew plc by adding the 4 quarters
12.4 + 9.2 + 16.7 + 15.8 = 54.1 (£100,000’s)
= £5.41 million
Step 2 – Calculate 2007 global income (allowing for the global income change of - 0.7%)
£5.41 million x 99.3% = £5.37 million
Step 3 – Calculate 2008 global income (allowing for the global income change of - 0.8%)
£5.37 million x 99.2% = £5.33 million
Step 4 - To the nearest £100,000
£5.33 million = £5.30 million
Note that £5.33 is incorrect as the question asked for to the nearest £100,000.
Thus the correct answer is (D) £5.30 million
For personal use only. Unauthorised copying or
distribution in printed, electronic, or any other
form in whole or in part, is prohibited without
prior written permission from AssessmentDay.
Page 27
Document last updated 25-01-2013
AssessmentDay www.assessmentday.co.uk
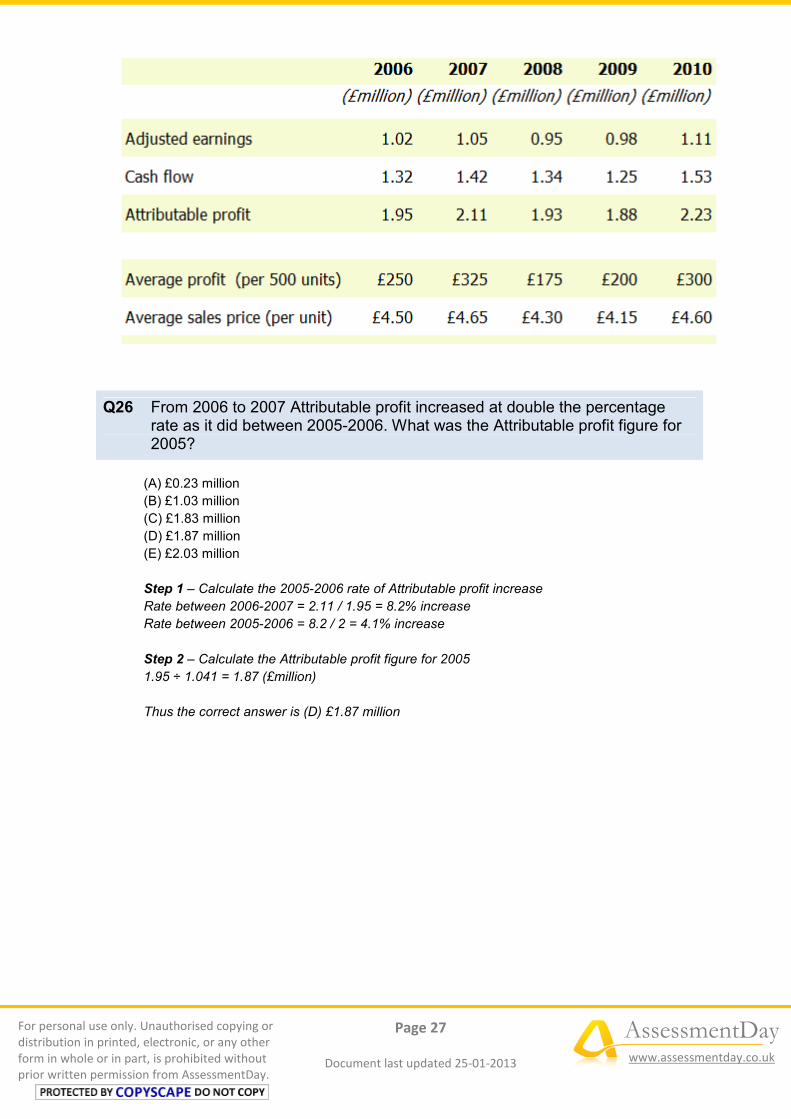
Q26 From 2006 to 2007 Attributable profit increased at double the percentage rate as it did between 2005-2006. What was the Attributable profit figure for 2005?
(A) £0.23 million
(B) £1.03 million
(C) £1.83 million
(D) £1.87 million
(E) £2.03 million
Step 1 – Calculate the 2005-2006 rate of Attributable profit increase
Rate between 2006-2007 = 2.11 / 1.95 = 8.2% increase
Rate between 2005-2006 = 8.2 / 2 = 4.1% increase
Step 2 – Calculate the Attributable profit figure for 2005
1.95 ÷ 1.041 = 1.87 (£million)
Thus the correct answer is (D) £1.87 million

For personal use only. Unauthorised copying or
distribution in printed, electronic, or any other
form in whole or in part, is prohibited without
prior written permission from AssessmentDay.
Page 28
Document last updated 25-01-2013
AssessmentDay www.assessmentday.co.uk
Q27 If the target was to have an average profit (per unit) in excess of 50p, in which year or years was this achieved?
(A) 2006
(B) 2006 and 2007
(C) 2010
(D) 2007 and 2010
(E) 2006, 2007 and 2010
Step 1 - Calculate the average profit (per unit) as follows:
2006 2007 2008 2009 2010
£250 £325 £175 £200 £300
£250 /
500 =
£0.50
£325 /
500 =
£0.65
£175/ 500
= £0.35
£200/
500 =
£0.40
£300
/ 500
=
£0.60
Note the question asks for "in excess of 50p". So in 2006 where the profit was exactly 50p,
this does not satisfy the requirement.
Thus the correct answer is (D) 2007 and 2010

For personal use only. Unauthorised copying or
distribution in printed, electronic, or any other
form in whole or in part, is prohibited without
prior written permission from AssessmentDay.
Page 29
Document last updated 25-01-2013
AssessmentDay www.assessmentday.co.uk
Q28 In 2011, if Adjusted earnings increase by an eighth and there is a 2:3 ratio of (2011 Adjusted earnings: 2011 Cash flow), what will be the Cash flow in 2011?
(A) £2.14 million
(B) £1.87 million
(C) £1.25 million
(D) £0.83 million
(E) £0.14 million
Step 1 – Calculate the 2011 Adjusted earnings
1.11 x 1 1/8 = 1.249
Step 2 – Calculate the 2011 Cash flow
Adjusted earnings : Cash flow = 2:3
Cash flow = 1.249 x 3/2 = 1.87
Thus the correct answer is (B) £1.87 million

For personal use only. Unauthorised copying or
distribution in printed, electronic, or any other
form in whole or in part, is prohibited without
prior written permission from AssessmentDay.
Page 30
Document last updated 25-01-2013
AssessmentDay www.assessmentday.co.uk
Q29 Which year had the lowest ratio of Adjusted earnings to Attributable profit?
(A) 2006
(B) 2007
(C) 2008
(D) 2009
(E) 2010
Step 1 - Calculate the ratio for each year as shown in the table below;
2006 2007 2008 2009 2010
Adjusted
earnings/
Attributable
profit
=
1.02/1.95
=
1.05/2.11
=
0.95/1.93
=
0.98/1.88
=
1.11/2.23
= 0.52 = 0.498 = 0.492 = 0.52 = 0.50
Thus the correct answer is (C) 2008

For personal use only. Unauthorised copying or
distribution in printed, electronic, or any other
form in whole or in part, is prohibited without
prior written permission from AssessmentDay.
Page 31
Document last updated 25-01-2013
AssessmentDay www.assessmentday.co.uk
Q30 Which year from 2007 onwards showed the greatest percentage change in Cash flow compared to the preceding year?
(A) 2006
(B) 2007
(C) 2008
(D) 2009
(E) 2010
Step 1 – Calculate the % change in cash flow for each year
2007 2008 2009 2010
1.42 / 1.32 1.34 / 1.42 1.25 / 1.34 1.53/1.25
= 7.58%
(increase)
= 5.63%
(decrease)
= 6.72%
(decrease)
= 22.4%
(increase)
Thus the correct answer is (E) 2010
-- End of Test --