Embed Size (px)
Citation preview

A Thesis on
Numerical Study of Crystallization Process Using CFD Tools
Submitted by
Prasanna Rao Ravi
Roll No. 211CH1263
In partial fulfillment of the requirements for the degree in
Master of Technology in Chemical Engineering
Under the Supervision of
Dr. BasudebMunshi
Department of Chemical Engineering
National Institute of Technology, Rourkela
May, 2013

DEPARTMENT OF CHEMICAL ENGINEERING
NATIONAL INSTITUTE OF TECHNOLOGY, ROURKELA
ODISHA, INDIA – 769008
______________________________________________________________________________
CERTIFICATE
This is to certify that the thesis titled “Numerical Study of Crystallization Process using CFD
Tools”, submitted to the National Institute of Technology, Rourkela by Prasanna Rao Ravi,
Roll No. 211CH1263 for the award of the degree of Master of Technology in Chemical
Engineering, is a bonafide record of research work carried out by him under my supervision and
guidance. The candidate has fulfilled all the prescribed requirements. The thesis, which is based
on candidate’s own work, has not been submitted elsewherefor a degree/diploma.
Date: 24/05/2013 Dr. Basudeb Munshi
Associate Professor
Department of Chemical Engineering
National Institute of Technology, Rourkela

ACKNOWLEDGEMENTS
I would like to express my sincere gratitude to Dr. Basudeb Munshi for his guidance and
assistance in this thesis. The technical discussions with Dr. Basudeb Munshi were always been
very insightful, and I will always be indebted to his for all the knowledge he shared with me. His
prompt responses and availability despite his constantly busy schedule were truly appreciated.
The reality is that Dr. Basudeb Munshi was much more than an advisor for me. His
encouragement and efforts led this report to successful completion in a timely fashion.
Special Thanks also to Mr. Akhilesh Khapre for sharing the literature and invaluable assistance.
I am also thankful to all the staff and faculty members of Chemical Engineering Department,
National Institute of Technology, Rourkela for their consistent encouragement.
I would like to extend my sincere thanks to my friends and colleagues.
Date: 24/05/2013 Prasanna Rao Ravi
Roll No. 211CH1263
4th
Semester, M.Tech
Chemical Engineering Dept

INDEX
ABSTRACT i
LIST OF FIGURES ii
LIST OF TABLES v
NOMENCALTURE vi
CHAPTERS
1. INTRODUCTION
1.1 Methods to generate supersaturation 2
1.2 Solubility curve 3
1.3 Nucleation 4
1.4 Computational Fluid Dynamics 4
1.4.1 Ansys Fluent software 5
1.4.2 Advantages of CFD 6
1.4.3 Limitations of CFD 6
1.5 Objectives 7
1.6 Organization of the thesis 7
2. LITERATURE SURVEY
2.1 Literature review on crystallization 9
2.2 Literature review on numerical solution of population
balance equation 13
3. COMPUTATIONAL FLUID DYNAMICS MODEL EQUATIONS
3.1 Eulerian Model 15
3.2 Population balance model 18
4. Crystallization of sucrose
4.1 Problem statement 20
4.2 Geometry and mesh 21
4.3 Initial and Boundary conditions, and Solution schemes 22
4.4` Results and discussion 23
5. Conclusion and future scope 40
6. References 41

i
ABSTRACT
Crystallization is the formation of solid particles within a homogenous phase.
Crystallization is considered a last stage purification step in pharmaceutical, chemical,
agrochemical and food industries. Crystallization is mostly used for separation of a pure product
from an impure solution and the product formed is suitable for packing and marketing. Good
yield and purity are important for crystallization; apart from it crystal size distribution also plays
a vital role in the design of crystallization. The energy required for crystallization is less than
distillation. The study is made on crystallization process of sucrose in a continuous rectangular
flow chamber. The present work is aimed to compare the simulation results with experimental
results and to study the parametric sensitivity on mean crystal diameter of sucrose and total
crystal production with variation in inlet velocity of solution, inlet mass fraction of sucrose and
wall temperature of crystallizer. The transient simulations are carried out to study the
crystallization process. The simulation results when validated against experimental results are
found to be consistent.The simulation results show that as the inlet mass fraction of sucrose is
increased, then the mean crystal size and total crystal production are observed to be increased.
The mean crystal size is increased and total crystal production is decreased with decrease in inlet
velocity of solution. The mean crystal size is observed to be invariant with change in wall
temperature of the crystallizer but the total crystal production is increased with increase in wall
temperature.
Keywords: CFD, Crystallization, Mean crystal Size, Total crystal production

ii
LIST OF FIGURES
Figure No. Figure Caption Page No.
Figure 1.1 Ostwald –Miers diagram for solute/solvent
3
Figure 2.1 The crystallization triangle (Jones, 2002)
12
Figure 4.1 Schematic diagram of nucleation cell
20
Figure 4.2 Geometry of the crystallizer in ANSYS workbench
22
Figure 4.3 Tetrahedral mesh of the crystallizer geometry
22
Figure 4.4 Transient distributions of local crystal diameter at location 0.015m
from inletand mean crystal diameter. The used inlet velocity is
0.001067 m/s, inlet mass fraction of sucrose is 0.7 and inlet
temperature is 303.15K.
24
Figure 4.5 Distribution of moment-0 inside the crystallizer at time 240.9
second. The used inlet velocity is 0.001067 m/s, inlet mass
fraction of sucrose is 0.7 and inlet temperature is 303.15K. The
outlet is present at 0.0 m.
24
Figure 4.6 Distribution of moment-3 inside the crystallizer at 400 second.
The used inlet velocity is 0.001067 m/s, inlet mass fraction of
sucrose is 0.7 and inlet temperature is 303.15K. The outlet is
present at 0.0 m.
25
Figure 4.7 Distribution of velocity inside the crystallizer at 400 second.The
used inlet velocity is 0.001067 m/s, inlet mass fraction of sucrose
is 0.7 and inlet temperature is 303.15K. The outlet is present at 0.0
m.
25
Figure 4.8 Effect of inlet mass fraction of sucrose on the transient distribution
of mean crystal diameter. The used inlet velocityis 0.001067
m/sand the inlet temperature is 303.15K.
26

iii
Figure 4.9 Contour plot of moment-3 of the crystallizer at time 360second.
The used inlet velocity is 0.001067 m/s, inlet mass fraction of
sucrose is 0.78 and the inlet temperature is 303K. The outlet is
present at 0.0 m.
27
Figure 4.10 Transient distribution of mean crystal diameter obtained by
TVAC/TSAC and TLAC/TNAC. The used inlet mass fraction of
sucrose is 0.85,the inlet temperature is 303.15K and the inlet
velocity is 0.001067 m/s.
27
Figure 4.11 Transient distribution of mean crystal diameter obtained by
TVAC/TSAC and TLAC/TNAC. The used inlet mass fraction of
sucrose is 0.78,the inlet temperature is 303.15K and the inlet
velocity is 0.001067 m/s.
28
Figure 4.12 Transient distribution of mean crystal diameter obtained by
TVAC/TSAC and TLAC/TNAC. The used inlet mass fraction of
sucrose is 0.74,the inlet temperature is 303.15K and the inlet
velocity is 0.001067 m/s.
29
Figure 4.13 Transient distribution of mean crystal diameter obtained by
TVAC/TSAC and TLAC/TNAC. The used inlet mass fraction of
sucrose is 0.70,the inlet temperature is 303.15K and the inlet
velocity is 0.001067 m/s.
30
Figure 4.14 Effect of inlet mass fraction of sucrose on the transient distribution
of number density of the crystallizer. The used inlet velocity of
solution is 0.001067 m/s and theinlet temperature is 303.15K.
31
Figure 4.15 Effect of the inlet velocity on the transient distribution ofmean
crystal diameterinside the crystallizer. The used inlet mass fraction
of sucrose is 0.7 and the inlet temperature is 303.15K.
32
Figure 4.16 Transient distribution of mean crystal diameterobtained by
TVAC/TSAC and TLAC/TNAC. The used inlet mass fraction of
sucrose is 0.7,the inlet temperature is 303.15Kand the inlet
velocity is 0.0005 m/s.
32
Figure 4.17 Transient distribution of mean crystal diameter obtained by
TVAC/TSAC and TLAC/TNAC. The used inlet mass fraction of
sucrose is 0.7,the inlet temperature is 303.15K and the inlet
velocity is 0.0001 m/s.
33
iv
Figure 4.18 Transient distribution of mean crystal diameter obtained by
TVAC/TSAC and TLAC/TNAC. The used inlet mass fraction of
sucrose is 0.7,the inlet temperature is 303.15K and the inlet
velocity is 0.00001 m/s.
34
Figure 4.19 Transient distribution of mean crystal diameter obtained by
TVAC/TSAC and TLAC/TNAC. The used inlet mass fraction of
sucrose is 0.7,the inlet temperature is 303.15K and the inlet
velocity is 0.001 m/s.
35
Figure 4.20 Effect of inlet velocity on the transient distribution of number
density of crystals. The used inlet mass fraction of sucrose is 0.7
and theinlet temperatureis 303.15K.
35
Figure 4.21 Effect of the wall temperature of the crystallizer on thetransient
distribution of number density of the crystals inside the
crystallizer. The used inlet mass fraction of sucrose is 0.7, the inlet
temperature is 303.15 K and the inlet velocity is 0.001m/s.
36
Figure 4.22 Effect of the wall temperature of the crystallizer on thetransient
distribution of mean crystal diameter. The used inlet mass fraction
of sucrose is 0.7, the inlet temperature is 303.15 K and the inlet
velocity is 0.001m/s.
37
Figure 4.23 Transient distribution of mean crystal diameter obtained by
TVAC/TSAC and TLAC/TNAC. The used inlet mass fraction of
sucrose is 0.7,the inlet temperature is 303.15K and the inlet
velocity is 0.001067 m/s. The specified wall temperature is 323 K.
38
Figure 4.24 Transient distribution of mean crystal diameter obtained by
TVAC/TSAC and TLAC/TNAC. The used inlet mass fraction of
sucrose is 0.7,the inlet temperature is 303.15K and the inlet
velocity is 0.001067 m/s. The specified wall temperature is 333 K.
38
Figure 4.25 Contour plot of the temperature of the crystallizer at time
360second. The used inlet velocity of is 0.001067 m/s, inlet mass
fraction of sucrose is 0.70 and the inlet temperature is 303.15K.
The specified wall temperature is 333 K. The outlet is present at
0.0 m.
39
Figure 4.26 Contour plot of moment-3 of the crystallizer at time 360second.
The used inlet velocity is 0.001067 m/s, inlet mass fraction of
sucrose is 0.70 and the inlet temperature is 303.15K. The specified
wall temperature is 333 K. The outlet is present at 0.0 m.
39

v
LIST OF TABLES
Table No. Table Caption Page No.
1) Table 4.1: Physical dimensions and operating conditions used in simulation. 21
2) Table 4.2: Discretization schemes for modeling equations 23
vi
NOMENCLATURE
mass fraction
gradient
C concentration
D diffusion coefficient
E activation energy
p static pressure
R rate of the reaction
Sc Schmidt number
t time
T temperature
TLAC total length of all crystals per unit volume of solution
TNAC total number of all crystals per unit volume of solution
TSAC total surface of all crystals per unit volume of solution
TVAC total volume of all crystals per unit volume of solution
v velocity
α volume fraction
μ viscosity
Subscripts
j species
p,q phase
r reaction
t turbulent

CHAPTER 1
____________________________________________________
INTRODUCTION
INTRODUCTION
2
CHAPTER 1
INTRODUCTION
Crystallization is the formation of solid particles within a homogenous phase. Solid
particles can be formed from either vapor phase or liquid phase through crystallization (Abbas et
al., 2007). Crystals formed during crystallization from an impure solution are itself pure and
crystals formed are also suitable for packing and storing. More than 80% of the substances used
in pharmaceuticals, fine chemicals, agrochemicals, food and cosmetics are isolated or formulated
in their solid form.
The driving force for crystallization from solution is supersaturated solution. If the solute
concentration exceeds the equilibrium (saturated) solute concentration at a fixed temperature,
then the solution is said to be supersaturated solution. Formation of crystal is considered in
general a two-step process. Former is formation of nuclei known as nucleation and latter is
growth of these nuclei to macroscopic scale known as crystal growth. The formation of crystal is
governed by nucleation rate and birth rate. Nucleation rate and birth rate are the crystallization
kinetics (Abdel et al., 2003)
1.1 Methods to generate supersaturation
Based on solubility of solute dependence on temperature, four methods have been
classified.
1. Temperature reduction,
2. Evaporating the solvent,
3. Changing the solvent composition(salting) and
4. Chemical reaction(precipitation)
If the solubility increases more or less with temperature as in case of KNO3, then the
supersaturated solution can be generated by simply decrease in temperature. If the solute
solubility is relatively invariant with temperature, then the supersaturated solution can formed by
evaporating a small portion of the solvent (increasing the temperature). If neither evaporation nor
temperature reduction is desirable then a third component is added which physically forms with
INTRODUCTION
3
the original solvent, a mixed solvent where the solubility of the solvent is sharply reduced. A
new insoluble solute can also be formed by reaction the third component with the original solute
in the solution. This process is called precipitation (Julian et al., 1993).
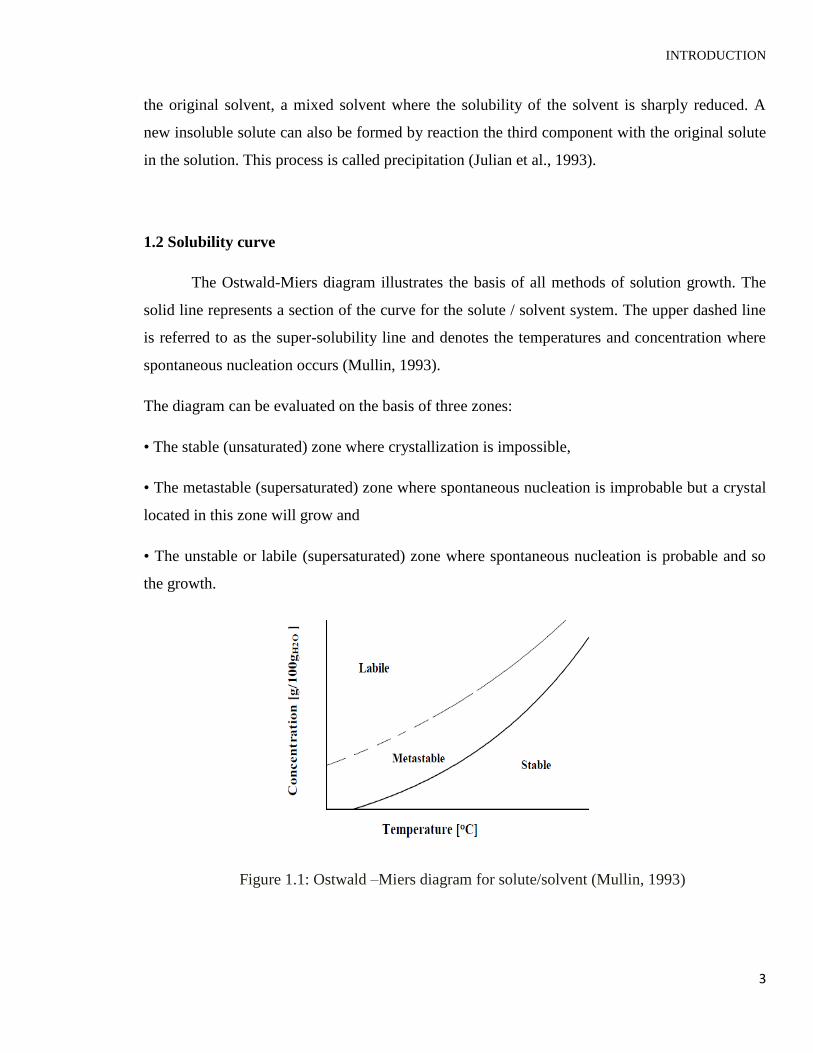
1.2 Solubility curve
The Ostwald-Miers diagram illustrates the basis of all methods of solution growth. The
solid line represents a section of the curve for the solute / solvent system. The upper dashed line
is referred to as the super-solubility line and denotes the temperatures and concentration where
spontaneous nucleation occurs (Mullin, 1993).
The diagram can be evaluated on the basis of three zones:
• The stable (unsaturated) zone where crystallization is impossible,
• The metastable (supersaturated) zone where spontaneous nucleation is improbable but a crystal
located in this zone will grow and
• The unstable or labile (supersaturated) zone where spontaneous nucleation is probable and so
the growth.
Figure 1.1: Ostwald –Miers diagram for solute/solvent (Mullin, 1993)

INTRODUCTION
4
1.3 Nucleation
The nucleation rate is the number of new particles formed per unit time per unit volume
of magma or solid free mother liquor(Julian et al., 1993). Nucleation is classified into three
types.
1. Primary nucleation,
2. Secondary nucleation and
3. Contact nucleation.
Primary nucleation refers to the birth of very small bodies (nuclei) of a new phase within
a supersaturated homogenous existing phase. In primary nucleation some energy is consumed to
form an interface, based on the surface energy of each phase, so more energy is required for the
nucleation and it is advisable to go for secondary nucleation
Secondary nucleation refers to the formation of nuclei attributable to the influence of the
existing macroscopic crystals in the magma is called secondary nucleation. In secondary
nucleation, crystal growth can also be influenced by fluid shear and collisions between existing
crystals with each other or with the walls of the crystallizer and rotary impeller or agitator
blades.
In contact nucleation the crystals are forced to strike on the selected crystal surface by
small rods in laboratory scale. The energy required for contact nucleation is less when compared
to primary and secondary nucleation so no visible effect can be observed.
1.4 Computational Fluid Dynamics
Computational Fluid Dynamics (CFD) is the art of replacing such PDE systems by a set
of algebraic equations which can be solved using digital computers. Fluid flow is governed by
conservation laws of energy, mass and momentum. These are usually a set of partial differential
equations. CFD gives a qualitative and quantitative prediction of fluid flow by numerical
solution of partial differential equations. In CFD, the flow domain is divided into small grids or
elements. Differential equations of mass, momentum and energy balance are discretized and
INTRODUCTION
5
represented in terms of the variables at any predetermined position within the or at the center of
cell. Finally, the initial conditions and the boundary conditions of the specific problem are used
to solve these equations. The solution method can be direct or iterative. In addition, certain
control parameters are used to control the convergence, stability, and accuracy of the method.
These equations are solved iteratively until the solution reaches the desired accuracy (ANSYS
Fluent 13.0).
1.4.1 Ansys Fluent software
Fluent is one of the widely used CFD software package. Ansys Fluent software contains
the wide range of physical modeling capabilities which are needed to model flow, turbulence,
reactions and heat transfer for industrial applications.
Features of Ansys Fluent software:
Turbulence: Ansys Fluent offers a number of turbulence models to study the effects of
turbulence in a wide range of flow regimes.
Multiphase flow: It is possible to model different fluids in a single domain with
FLUENT.
Acoustics: It allows users to perform sound calculations.
Reacting flow: Modeling of surface chemistry, combustion as well as finite rate
chemistry can be done in fluent.
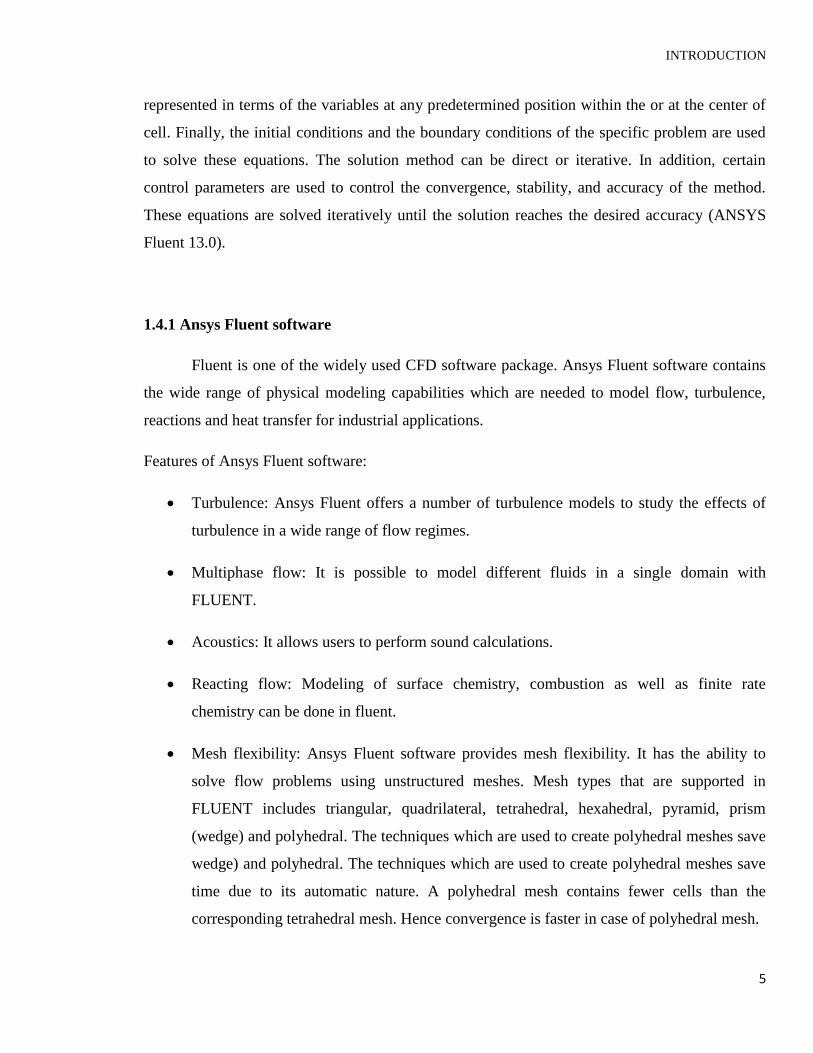
Mesh flexibility: Ansys Fluent software provides mesh flexibility. It has the ability to
solve flow problems using unstructured meshes. Mesh types that are supported in
FLUENT includes triangular, quadrilateral, tetrahedral, hexahedral, pyramid, prism
(wedge) and polyhedral. The techniques which are used to create polyhedral meshes save
wedge) and polyhedral. The techniques which are used to create polyhedral meshes save
time due to its automatic nature. A polyhedral mesh contains fewer cells than the
corresponding tetrahedral mesh. Hence convergence is faster in case of polyhedral mesh.

INTRODUCTION
6
Dynamic and moving mesh: The user sets up the initial mesh and instructs the motion,
while FLUENT software automatically changes the mesh to follow the motion while
FLUENT software automatically changes the mesh to follow the motion instructed.
Post-processing and data export: Users can post-process their data in Fluent software,
creating among other things contours, path lines, and vectors to display the data.
1.4.2 Advantages of CFD
Computational simulations are relatively inexpensive, and costs are likely to decrease as
computers become more powerful.
CFD simulations can be executed in a short period of time.
CFD allows the analyst to examine a large number of locations in the region of interest,
and yields a comprehensive set of flow parameters for examination.
CFD allows great control over the physical process, and provides the ability to isolate
specific phenomena for study. (Example: a heat transfer process can be idealized with
adiabatic, constant heat flux, or constant temperature boundaries)
1.4.3 Limitations of CFD
CFD solutions rely upon physical models of real world processes (e.g. turbulence,
chemistry, multiphase flow, compressibility, etc.).
Solving equations on a computer invariably introduces numerical errors.
As with physical models, the accuracy of the CFD solution is only as good as the
initial/boundary conditions provided to the numerical model.
INTRODUCTION
7
1.5 Objectives
The research objective can be broadly divided into following sub-sections:
i. Modeling and simulation of sucrose crystallization process
ii. Validation of the model by comparing the present simulated results with the data
available in the open literature.
iii. Studying the effect of inlet velocity of the solution, inlet mass fraction of sucrose and
wall temperature of the crystallizer on the size and total production of the crystals in the
crystallizer.
1.6 Organization of the thesis
Chapter 1 represents the basics of crystallization including the methods to generate
supersaturation, types of nucleation and application and role of computational fluiddynamics.
Chapter 2 deals with the literature review of crystallization. The chapter is dividedinto the
sections namely literature review on crystallization and literature review on numerical solution of
population balance equation.
Chapter 3 comprises of modeling equations of multiple phase flow and population balance.
Themodel equation includes the equation of continuity, momentum and energy.
Chapter 4 represents the study of crystallization of sucroseusing CFD tools. The modeling
equations are solved numerically to study the effects of inlet velocity of solution, inlet mass
fraction of sucrose and wall temperature of crystallizer on mean crystal diameter and total crystal
production.
Chapter 5 deals with the overall conclusions and future recommendations.

CHAPTER2
____________________________________________________
LITERATURE SURVEY

LITERATURE SURVEY
9
CHAPTER 2
LITERATURE SURVEY
A substantial quantity of research work is done on crystallization both experimentally and
numerically. But some research works are completely experimental and others include mostly
theoretical works. There is little research activity which took care both the types. It forces us to
look into the grey area of crystallization process. This chapter deals with the literature review of
crystallization and its related processes. It is divided into two sections:
1. Literature review on crystallization
2. Literature review on numerical solution of population balance equation
2.1 Literature review on crystallization
Crystallization is the formation of solid particles from a homogenous solution and in
general it is a solid- liquid separation technique (Angelov et al., 2007; Basim et al., 2002). It is
widely used in pharmaceutical, chemical, agrochemical and food industries (Lindberg et al.,
2001; Hussain et al., 2004). The driving force for crystallization is supersaturation. A solution is
said to be supersaturated if the concentration of solute is more than the saturated concentration of
it at the prevailing temperature. Neither birth of nuclei nor crystal growth will occur when the
solution is in unsaturated condition (Julain et al., 1993).
The supersaturated solution can be generated by changingsome system properties like PH,
temperature, solution composition or by adding a third component (Andre et al., 2011). The
selection of the system property depends upon the variation of solubility of solute with
temperature in the solvent. If the solubility increases more or less with temperature as in case of
KNO3 and Na2SO4 (Deckelmann et al, 2007) then the supersaturated solution can be generated
by simply decreasing the system temperature. If the solute solubility is relatively invariant with
temperature, then the supersaturated solution can be formed by evaporating a small portion of the
solvent (increasing the temperature) as in case of NaCl. If neither evaporation nor temperature
reduction was desirable then a third component is added which physically forms with the original
LITERATURE SURVEY
10
solvent, a mixed solvent where the solubility of the solvent is sharply reduced, otherwise the
third component was added such that a new insoluble solute can be formed by reaction of the
third component with the original solute in the solution. This process is called
precipitation(Julian et al., 1993).
The transfer of the molecules from the continuous phase (solution) to the solid phase is
governed by nucleation and growth rates. Both the rates are called the crystallization kinetics
(Basim et al., 2002; Bernado et al., 2011).
Nucleation which was defined as birth of new particles per unit volume of magma or
solid free mother liquor (Julian et al., 1993) can be distinguished into two types namely primary
and secondary nucleation. Primary nucleation refers to the birth of very small bodies of a new
phase within a supersaturated homogenous solution and if the birth was uninfluenced by foreign
particles or wall of the crystallizer, then the primary nucleation was termed as homogenous
nucleation otherwise the primary nucleation was termed as heterogeneous nucleation (Albert et
al., 1993). In primary nucleation some energy was consumed to form an interface, based on
the surface energy of each phase, so more energy was required for the primary nucleation and it
was advisable to go for secondary nucleation where nucleation was induced mainly by existing
macroscopic crystals (seeds) and also by fluid flow, crystal disruption etc. (Jones, 2002) and
secondary nucleation can be carried out at low supersaturations. Grinding processes are
employed to generate seed crystals but the mean size and size distribution of seeds are
unsatisfactory. Also the grinding process may impart some impurities during grinding and even
pollute the environment. These undesirable characteristics do notappear in the seeds that are
formed by insonated nucleation(Kordylla et al, 2008; Corona et al., 2010). Insonated nucleation
was the effect of ultra sound to control the nucleation rate.The ultrasonic effect oncrystallization
has been reported to accelerate crystal precipitation, retard precipitation, change the crystal size
distribution and crystal habit, increase nucleation rate and agglomerate particles (Hairong et al.,
2006;Guo et al., 2006; Jones et al., 2011).
The mechanism of crystal growth from solution is often thought to consist of two steps in
series, i.e., a mass transfer diffusion step followed by a surface reaction step (Shiau, 2003; Tai,
1999). The crystal growth rate can be expressed as rate of linear increase in characteristic length
or mass deposition rate, mass flux (Jones,2002). The mechanism of crystal growth has been
LITERATURE SURVEY
11
proposed by several theoretical models. The theoretical models can be broadly classified into two
types namely diffusion-reaction model and surface integration model.
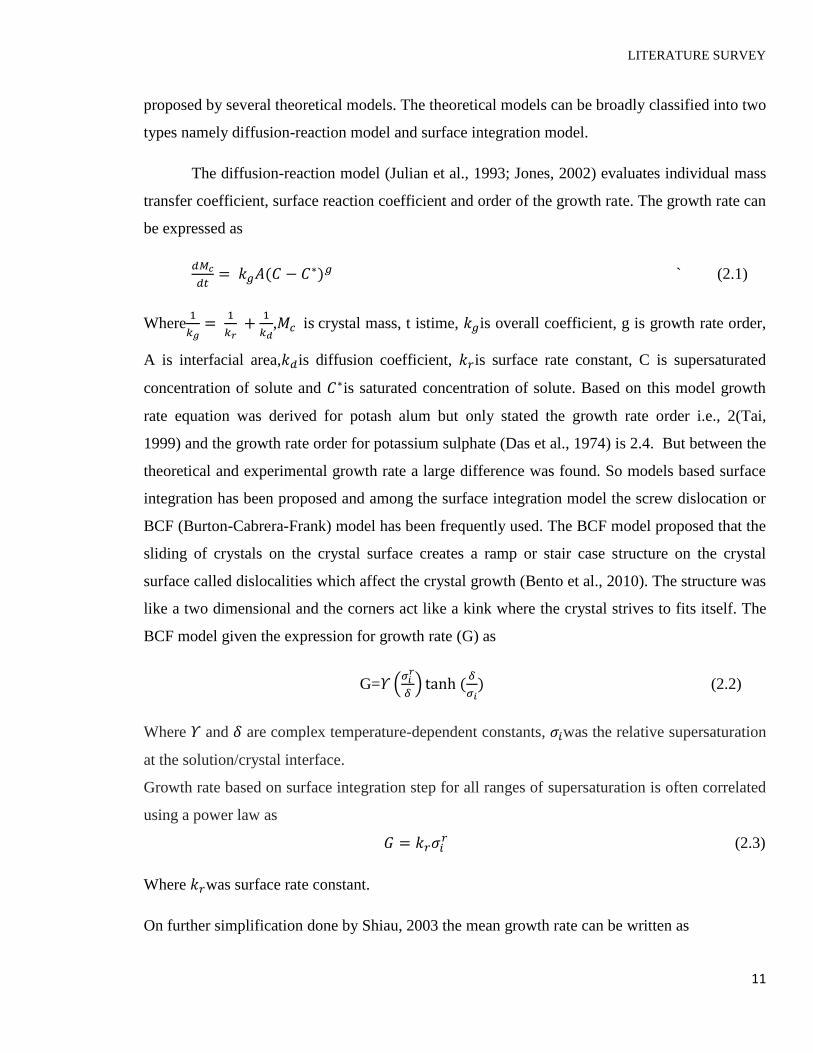
The diffusion-reaction model (Julian et al., 1993; Jones, 2002) evaluates individual mass
transfer coefficient, surface reaction coefficient and order of the growth rate. The growth rate can
be expressed as
` (2.1)
Where
, crystal mass, t istime, is overall coefficient, g is growth rate order,
A is interfacial area, is diffusion coefficient, is surface rate constant, C is supersaturated
concentration of solute and is saturated concentration of solute. Based on this model growth
rate equation was derived for potash alum but only stated the growth rate order i.e., 2(Tai,
1999) and the growth rate order for potassium sulphate (Das et al., 1974) is 2.4. But between the
theoretical and experimental growth rate a large difference was found. So models based surface
integration has been proposed and among the surface integration model the screw dislocation or
BCF (Burton-Cabrera-Frank) model has been frequently used. The BCF model proposed that the
sliding of crystals on the crystal surface creates a ramp or stair case structure on the crystal
surface called dislocalities which affect the crystal growth (Bento et al., 2010). The structure was
like a two dimensional and the corners act like a kink where the crystal strives to fits itself. The
BCF model given the expression for growth rate (G) as
G=
(2.2)
Where and are complex temperature-dependent constants, was the relative supersaturation
at the solution/crystal interface.
Growth rate based on surface integration step for all ranges of supersaturation is often correlated
using a power law as
(2.3)
Where was surface rate constant.
On further simplification done by Shiau, 2003 the mean growth rate can be written as
LITERATURE SURVEY
12
(2.4)
Where was average dislocation activity (dimensionless), was average frequency factor
( ), E was activation energy (kJ/mol), R was universal gas constant(kJ/mol.K), σ was
relative supersaturation and T was temperature(K)
For sucrose the meangrowth rate equation(Shiau, 2003) was stated as
(μm/min) =
(2.5)
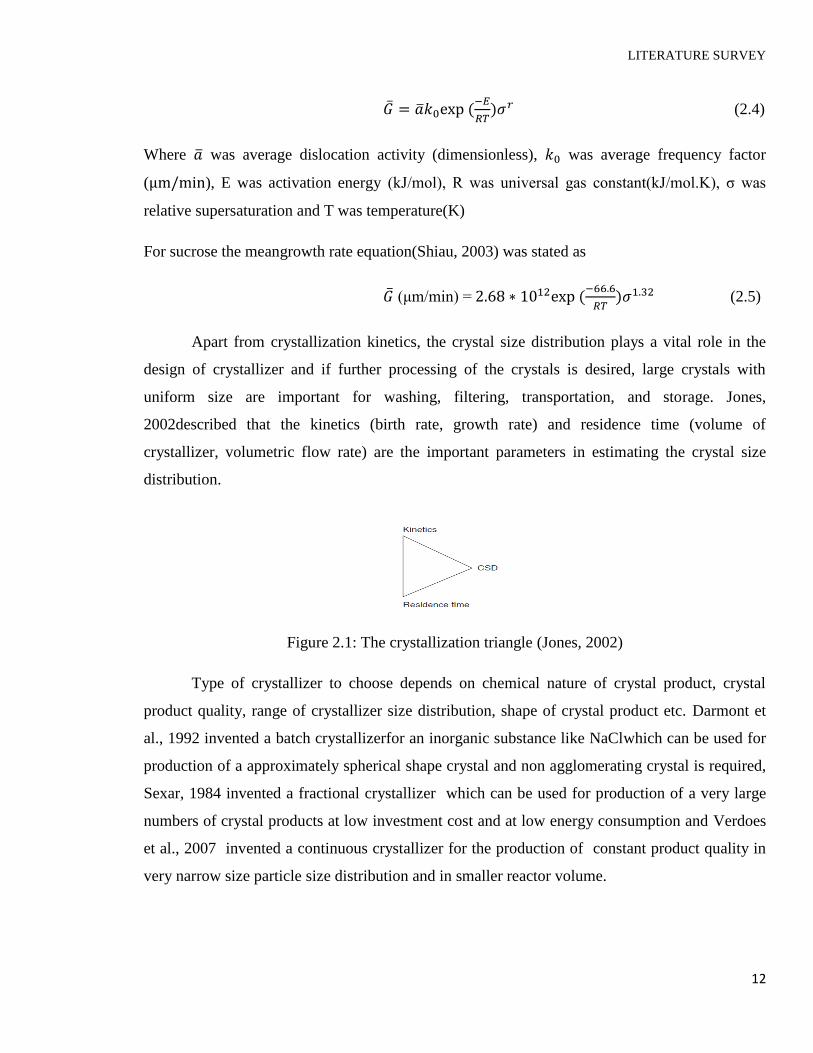
Apart from crystallization kinetics, the crystal size distribution plays a vital role in the
design of crystallizer and if further processing of the crystals is desired, large crystals with
uniform size are important for washing, filtering, transportation, and storage. Jones,
2002described that the kinetics (birth rate, growth rate) and residence time (volume of
crystallizer, volumetric flow rate) are the important parameters in estimating the crystal size
distribution.
Figure 2.1: The crystallization triangle (Jones, 2002)
Type of crystallizer to choose depends on chemical nature of crystal product, crystal
product quality, range of crystallizer size distribution, shape of crystal product etc. Darmont et
al., 1992 invented a batch crystallizerfor an inorganic substance like NaClwhich can be used for
production of a approximately spherical shape crystal and non agglomerating crystal is required,
Sexar, 1984 invented a fractional crystallizer which can be used for production of a very large
numbers of crystal products at low investment cost and at low energy consumption and Verdoes
et al., 2007 invented a continuous crystallizer for the production of constant product quality in
very narrow size particle size distribution and in smaller reactor volume.
LITERATURE SURVEY
13
2.2 Literature review on numerical solution of population balance equation
Alone mass balance, momentum and energy balance does not give any information
regarding crystal size distribution. The conservation laws are unchanged even if product was one
large crystal or some number of small crystals (Julian et al., 1993)
The crystal size distribution can evolve in conjunction with transport and chemical
reaction in a multiphase system. The evolutionary processes can be a combination of different
phenomena like nucleation, growth, dispersion, dissolution, aggregation, and breakage producing
the dispersion. Thus in multiphase flow involving a size distribution, a balance equation is
required to describe the changes in the particle population, in addition to momentum, mass, and
energy balances. This balance was generally referred to as the population balance. Average
particle size can be evaluated from the population balance equation (PBE).
Numerical solution of PBE was done by adaptive high-resolution finite volume schemes
(Angelov et al., 2007; Angelov et al., 2009;Angelov et al., 2006), method of characteristics
(Angelov et al., 2009; Gerald et al., 2007; Ramkrishna et al., 1997), classes method (Daniele et
al., 2005), quadratic method of moment (Daniele et al., 2005) and semidiscrete upwind scheme
(Gerald et al., 2007).
Numerical solution of PBE by high-resolution finite volume scheme, shown accuracy and
efficiency in resolving sharp peak and accuracy increased further with the adaptive meshing
techniques when compared with finite volume schemes. Unlike first-order schemes, these high
resolution schemes give less numerical diffusion and also avoid the numerical dispersion which
can happen in the high order schemes near sharp discontinuities. The numerical test cases
presented by Angelov et al., 2006 shows that these high resolution schemes also worked well
for the solution of PBEs with nucleation and size dependent/independent growth. The numerical
solution of PBE by method of characteristics (Angelov et al., 2006; Ramkrishna et al., 1997) also
has overcome the numerical diffusion and dispersion and also gave highly resolved solutions, as
well as being computationally efficient.Classes method (CM) also gave good accuracy like high-
resolution finite volume scheme and method of characteristics but the number of scalars are more
and more computational time is required (Daniele et al., 2005). Semi-discrete finite volume

LITERATURE SURVEY
14
scheme (FVS) scheme for the numerical solution of PBE also showed the same results like
method of characteristics and high resolution finite volume scheme(Gerald et al., 2009).
A study was made by using CFD tool in a jet crystallizer by Reginald et al.,2009. The simulation
results of the shape of the crystal size distribution and its variation with Re number is found
consistent with experimental results. The simulation results indicate that more and larger
crystals, with wider size distribution, were produced at a lower jet Reynolds number due to a
longer residence time for nucleation and growth.

CHAPTER 3
____________________________________________________
COMPUTATIONAL FLUID DYNAMICS MODEL
EQUATIONS

COMPUTATIONAL FLUID DYNAMICS MODEL EQUATIONS
15
CHAPTER 3
COMPUTATIONAL FLUID DYNAMICS MODEL EQUATIONS
In this chapter the computational fluid dynamics modeling equations are described for
multiphase system. Besides, population balance modeling equations are also mentioned. The
theory for the system is taken from the ANSYS Fluent 13.0.
3.1 Eulerian Model
A large number of flows encountered in nature and technology are a mixture of phases.
Physical phases of matter are gas, liquid, and solid, but the concept of phase in a multiphase flow
system is applied in a broader sense. In multiphase flow, a phase can be defined as an
identifiable class of material that has a particular inertial response to and interaction with the
flow and the potential field in which it is immersed.
Mass conservation equation
The continuity equation for phase q is
– (3.1)
Where the volume fraction of qth phase, is the velocity of phase q, characterizes the
mass transfer from the pth
to qth
phase and characterizes the mass transfer from the qth
to pth
phase
Species transport equations
The species transport equation of phase i is
(3.2)
is the net rate of production of species i by chemical reaction, is mass fraction of species i
and is the rate of creation by addition from the dispersed phase plus any user-defined sources.
An equation of this form will be solved for N-1 species where N is the total number of fluid

COMPUTATIONAL FLUID DYNAMICS MODEL EQUATIONS
16
phase chemical species present in the system. Since the mass fraction of the species must sum to
unity, the Nth
mass fraction is determined as one minus the sum of the N-1 solved mass fractions.
Mass diffusion in laminar flows:
is the diffusion flux of species i, which arises due to concentration gradients.
(3.3)
Mass diffusion in turbulent flows
(3.4)
Momentum conservation equation
The momentum balance for phase q is
(3.5)
Where is the qth
phase stress-strain tensor, is an external body force, is a lift force,
is a virtual mass force, is an interaction force between phases, is the interphase
velocity, and p is the pressure shared by all phases.
(3.6)
where and are the shear and bulk viscosity of phase q.
Conservation of energy equation
The energy balance for phase q is
(3.7)

COMPUTATIONAL FLUID DYNAMICS MODEL EQUATIONS
17
Where is the specific enthalpy of the qth phase, is the heat flux, is a source term that
includes sources of enthalpy, is the intensity of heat exchange between the pth and qth
phases.
Volume fraction equation
The tracking of the interface(s) between the phases is accomplished by the solution of a
continuity equation for the volume fraction of one (or more) of the phases. For the qth(fluid’s
volume fraction) phase, this equation has the following form
α
– (3.8)
Where is the mass transfer from phase q to phase p and is the mass transfer from
phase p to phase q, is the volume fraction of phase q, is density of phase q and is the
velocity of phase q By default, the source term on the right-hand side α is zero, but we can
specify a constant or user-defined mass source for each phase. The volume fraction equation will
not be solved for the primary phase; the primary-phase volume fraction will be computed based
on the following constraint:
(3.9)
Material properties
The properties appearing in the transport equations are determined by the presence of the
component phases in each control volume. In a two-phase system, for example, if the phases are
represented by the subscripts 1 and 2, and the mixture density in each cell is given by
ρ = α 2ρ 2 + (1−α 2) ρ1 (3.10)
In general, for n phase system, the volume-fraction-averaged density takes on the following
form:
(3.11)
All other properties (e.g., viscosity) are also computed in this manner.
COMPUTATIONAL FLUID DYNAMICS MODEL EQUATIONS
18
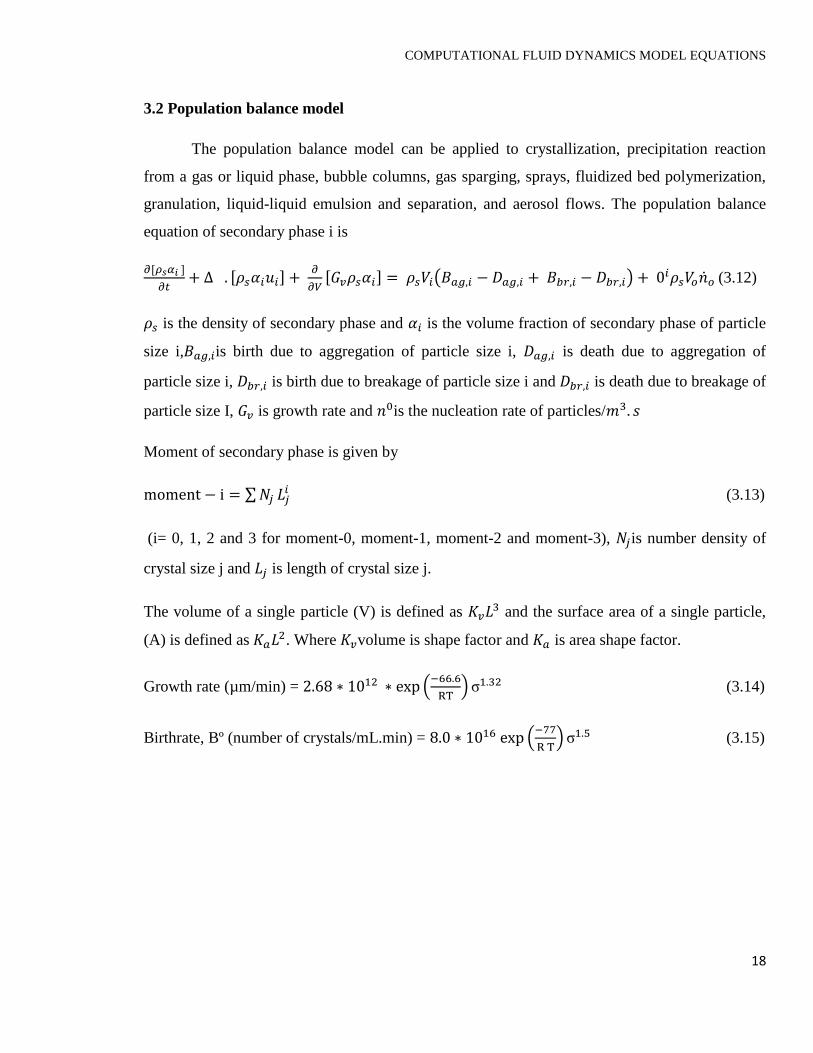
3.2 Population balance model
The population balance model can be applied to crystallization, precipitation reaction
from a gas or liquid phase, bubble columns, gas sparging, sprays, fluidized bed polymerization,
granulation, liquid-liquid emulsion and separation, and aerosol flows. The population balance
equation of secondary phase i is
(3.12)
is the density of secondary phase and is the volume fraction of secondary phase of particle
size i, is birth due to aggregation of particle size i, is death due to aggregation of
particle size i, is birth due to breakage of particle size i and is death due to breakage of
particle size I, is growth rate and is the nucleation rate of particles/
Moment of secondary phase is given by
(3.13)
(i= 0, 1, 2 and 3 for moment-0, moment-1, moment-2 and moment-3), is number density of
crystal size j and is length of crystal size j.
The volume of a single particle (V) is defined as and the surface area of a single particle,
(A) is defined as . Where volume is shape factor and is area shape factor.
Growth rate (µm/min) =
σ (3.14)
Birthrate, Bº (number of crystals/mL.min) =
σ (3.15)

CHAPTER 4
____________________________________________________
SUCROSE CRYSTALLIZATION
SUCROSE CRYSTALLIZATION
20
CHAPTER 4
SUCROSE CRYSTALLIZATION
This chapter deals with the study of crystallization of sucrose using CFD. The modeling
equations are solved numerically to study the effects of inlet velocity of solution, inlet mass
fraction of sucrose and wall temperature of crystallizer on mean crystal diameter and total crystal
production.
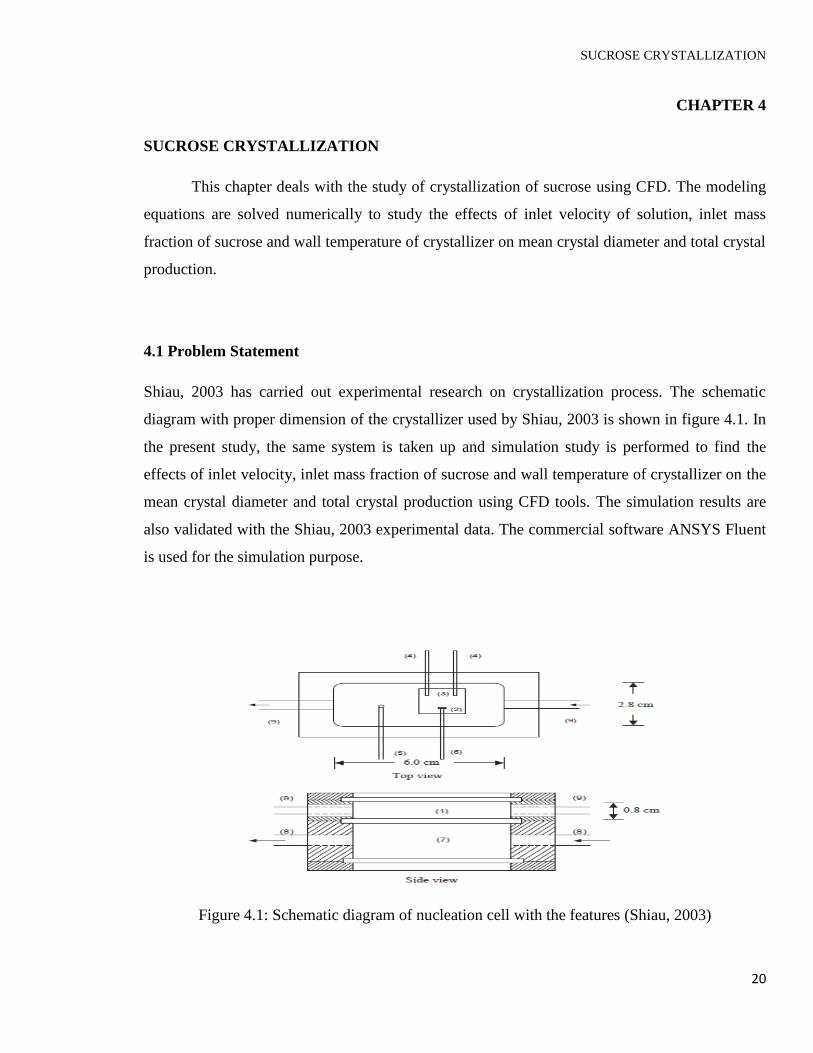
4.1 Problem Statement
Shiau, 2003 has carried out experimental research on crystallization process. The schematic
diagram with proper dimension of the crystallizer used by Shiau, 2003 is shown in figure 4.1. In
the present study, the same system is taken up and simulation study is performed to find the
effects of inlet velocity, inlet mass fraction of sucrose and wall temperature of crystallizer on the
mean crystal diameter and total crystal production using CFD tools. The simulation results are
also validated with the Shiau, 2003 experimental data. The commercial software ANSYS Fluent
is used for the simulation purpose.
Figure 4.1: Schematic diagram of nucleation cell with the features (Shiau, 2003)

SUCROSE CRYSTALLIZATION
21
Parts of nucleation cell:
(1) solution chamber, (2) parent crystal, (3) glass cover slip where parent crystal is slid,
(4) support rods for glass cover slip (5) thermostat, (6) movable rod holding parent crystal,
(7) constant-temperature water chamber, (8)water inlet and outlet, (9) solution inlet and outlet.
In figure 4.1, the rectangular cell has a chamber (1) for crystal nucleation and growth in the
upper part and a chamber (7) for temperature-controlled water in the lower part. The rectangular
cell was designed for the continuous-flow system in this work. Stimulation is performed in the
pure aqueous sucrose solution. A parent crystal (2) was glued to a movable rod (6) and then the
growth chamber was injected with the supersaturated sucrose solution. In general, thousands of
contact nuclei could be created by sliding the parent crystal along a glass plate (3) in the growth
chamber. The glass cover slip is supported by support rod (4) and the thermostat (5) senses the
temperature so that the system's temperature is maintained near a desired setpoint. The physical
dimensions and operating conditions are listed in table1.
Table 4.1: Physical dimensions and operating conditions used in simulation.
Parameter Unit Range or Value
Length X Width X Height of the
crystallizer
m X m X m 0.06 X 0.014 X 0.008
Inlet/Outlet Channel m X m X m 0.008 X 0.004 X 0.004
Inlet velocity of solution m/s 0.00001-0.001
Inlet mass fraction of sucrose Dimensionless 0.70 -0.85
Wall temperature of crystallizer K 323-333
Inlet temperature of solution K 303.15
4.2 Geometry and mesh
A 3D geometry of the crystallizer is created in ANSYS workbench and is shown in figure
4.2. Tetrahedral mesh is used for meshing the geometry shown in figure 4.3. It is meshed into
17631 nodes and 47444 elements.

SUCROSE CRYSTALLIZATION
22
Figure 4.2: Geometry of the crystallizer in ANSYS workbench
4.3 Initial and Boundary conditions, and Solution schemes
Equation 3.1 - 3.15 are solved in the present simulation. In order to obtain a well-posed
system of equation, reasonable boundary conditions for the computational domain are
implemented. Velocity of the solution, mass fraction of sucrose and temperature of solution are
specified at the inlet of the crystallizer. Wall temperature is specified at the wall of the
crystallizer and at the outlet pressure boundary condition is specified. No slip boundary condition
is specified at the interface of the solid wall and process fluid. In fluent, solver is set as
segregated which solves the equation individually. Unsteady state simulation has been
formulated. The initial condition for the simulation is 303.15 K, sucrose mass fraction equal to
Figure 4.3: Tetrahedral mesh of the crystallizer geometry

SUCROSE CRYSTALLIZATION
23
0.685, stagnant solution and 0.1 nm diameter of the seed in the entire crystallizer. The modeling
equations are discretized by the following schemes shown in table 4.2
Table 4.2: Discretization schemes for modeling equations
Equation Scheme
Momentum First order upwind
Species Transport for phase-2 First order upwind
Species transport for phase-1 Second order upwind
Volume fraction Quick Scheme
Gradient Least square cell method
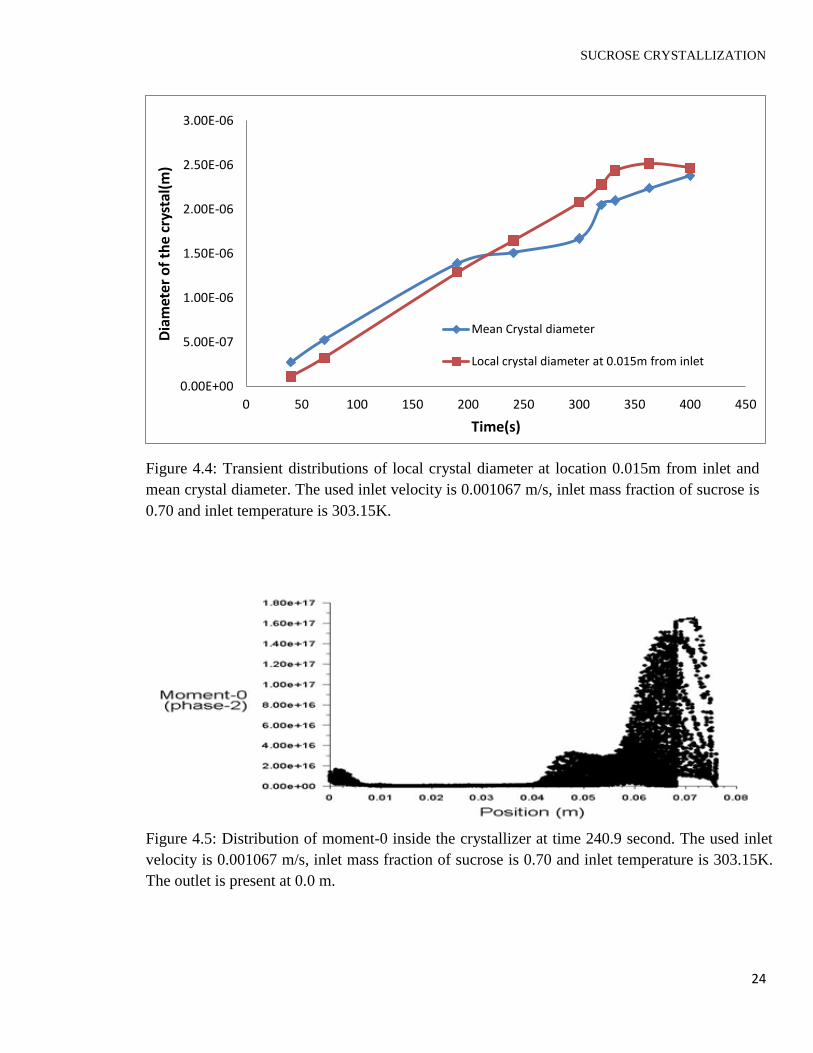
4.4 Results and discussion
The simulation is carried out to know the variation of local crystal diameter (at position
0.015 m from the inlet) and to calculate the mean crystal diameter in the crystallizer (shown in
figure 4.4). The results shows that the mean crystal diameter is more than local crystal diameter
up to 240.9s and local crystal diameter is more than mean crystal diameter in between 240-300s.
This is obvious because number density of crystals is more in the entire crystallizer than at local
position up to 240.9s (shown in figure 4.5) and in between 240-300s the number density of
crystals around the local position is more than the entire crystallizer. The initial crystal size is
0.1nm The mean crystal size at 300s is 2.08 µm from simulation and 4.8 µm from experimental
(Shiau, 2003). Both the experimental and simulation crystal diameters are of the same order.
Therefore CFD models for the crystallizer are validated with the experimental data and hence,
the parameter sensitivity on crystallization process can be studied.
SUCROSE CRYSTALLIZATION
24
0.00E+00
5.00E-07
1.00E-06
1.50E-06
2.00E-06
2.50E-06
3.00E-06
0 50 100 150 200 250 300 350 400 450
Dia
met
er o
f th
e cr
ysta
l(m
)
Time(s)
Mean Crystal diameter
Local crystal diameter at 0.015m from inlet
Figure 4.4: Transient distributions of local crystal diameter at location 0.015m from inlet and
mean crystal diameter. The used inlet velocity is 0.001067 m/s, inlet mass fraction of sucrose is
0.70 and inlet temperature is 303.15K.
..
Figure 4.5: Distribution of moment-0 inside the crystallizer at time 240.9 second. The used inlet
velocity is 0.001067 m/s, inlet mass fraction of sucrose is 0.70 and inlet temperature is 303.15K.
The outlet is present at 0.0 m.

SUCROSE CRYSTALLIZATION
25
The figure 4.6 shows that the crystal is growing more near the corners of the inlet section
wherefluid is stagnant as observed through velocity profiles depicted in figure 4.7.
Figure 4.6: Distribution of moment-3 inside the crystallizer at 400 second. The used inlet
velocity is 0.001067 m/s, inlet mass fraction of sucrose is 0.70 and inlet temperature is
303.15K. The outlet is present at 0.0 m.
Figure 4.7: Distribution of velocity inside the crystallizer at 400 second. The used inlet velocity
is 0.001067 m/s, inlet mass fraction of sucrose is 0.70 and inlet temperature is 303.15K. The
outlet is present at 0.0 m.

SUCROSE CRYSTALLIZATION
26
The study shows population of crystal is more nearer the inlet and hence density of the solution
is more at closer to the inlet of the crystallizer than the outlet. It results in increase in velocity at
the outlet of the crystallizer found in figure 4.7.
Effect of inlet mass fraction of sucrose on the mean crystal size
The simulation is carried out for a range of inlet mass fraction of sucrose (0.70-0.85) with inlet
velocity 0.001067 m/s, initial crystal size 0.1nm and inlet temperature 303.15K. The simulation
result as shown in figure 4.8 finds that as the inlet mass fraction of sucrose increases the mean
crystal diameter increases upto a certain time and then remains constant except for inlet mass
fraction of sucrose 0.70. At higher inlet mass fraction of sucrose, the collisions between the
nuclei is increasing, so some nuclei are carried away towards the middle of the crystallizer. The
crystal growthis predominant around the middle of the crystallizer (shown in figure 4.9)where
the concentration difference is less. This shows that if less concentration difference is present
then less number of collisions will occur and the overall displacement due to molecular collision
will be towards the crystal surface. After a certain time, around the middle of the crystallizer, the
solution is attaining saturation, so crystal growth becomes negligible.
0.00E+00
2.00E-07
4.00E-07
6.00E-07
8.00E-07
1.00E-06
1.20E-06
1.40E-06
1.60E-06
1.80E-06
0 50 100 150 200 250 300 350 400
Mea
n c
ryst
al d
iam
eter
(m)
Time(s)
mass fraction 0.85
mass fraction 0.78
Mass fraction 0.7
Mass fraction 0.74
Figure 4.8: Effect of inlet mass fraction of sucrose on the transient distribution of mean crystal
diameter. The used inlet velocity is 0.001067 m/s and the inlet temperature is 303.15K.
.
.
SUCROSE CRYSTALLIZATION
27
0.00E+00
2.00E-07
4.00E-07
6.00E-07
8.00E-07
1.00E-06
1.20E-06
1.40E-06
1.60E-06
0 50 100 150 200 250 300 350 400
Mea
n c
ryst
al d
iam
eter
(m)
Time(s)
Calculated from TVAC/TSAC
Calculated from TLAC/TNAC
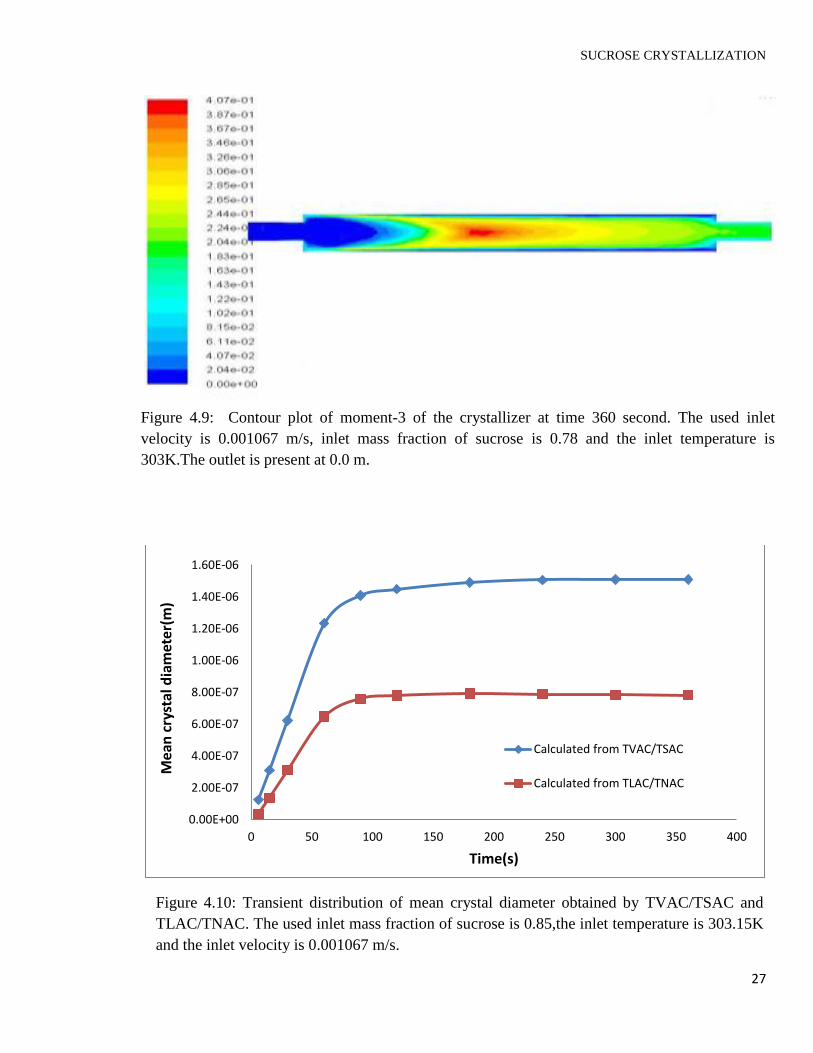
Figure 4.10: Transient distribution of mean crystal diameter obtained by TVAC/TSAC and
TLAC/TNAC. The used inlet mass fraction of sucrose is 0.85,the inlet temperature is 303.15K
and the inlet velocity is 0.001067 m/s.
Figure 4.9: Contour plot of moment-3 of the crystallizer at time 360 second. The used inlet
velocity is 0.001067 m/s, inlet mass fraction of sucrose is 0.78 and the inlet temperature is
303K.The outlet is present at 0.0 m.

SUCROSE CRYSTALLIZATION
28
The mean crystal diameter is calculated following two methods: (i) by taking the ration of
TVAC and TSAC and (ii) by the ratio of TLAC and TNAC. Where, TVAC stands for total
volume of all crystals per unit volume of solution (moment 3), TSAC is total surface area of all
crystals per unit volume of solution (moment 2), TLAC is total length of all crystals per unit
volume of solution (moment 1) and TNAC represents total number of all crystals per unit
volume of solution (moment 0).
The stimulation result shown in figure 4.10 is carried out for inlet mass fraction of
sucrose 0.85, inlet velocity 0.001067 m/s and inlet temperature 303.15K. There is some
difference in results calculated from two methods. But calculation based on TVAC/TSAC gives
more accurate results because of consideration of volume shape factor ( ) and area shape factor
( ).The simulation result shows that upto 100s the rapid crystal growth size is present and
beyond that the crystal size is approximately constant, which happens due to attaining the
saturation state.
0.00E+00
2.00E-07
4.00E-07
6.00E-07
8.00E-07
1.00E-06
1.20E-06
1.40E-06
1.60E-06
1.80E-06
0 50 100 150 200 250 300 350 400
Mea
n c
ryst
al d
iam
eter
(m)
Time(s)
Calculated from TVAC/TSAC
Calculated from TLAC/TNAC
Figure 4.11Transient distribution of mean crystal diameter obtained by TVAC/TSAC and
TLAC/TNAC. The used inlet mass fraction of sucrose is 0.78,the inlet temperature is 303.15K
and the inlet velocity is 0.001067 m/s.

SUCROSE CRYSTALLIZATION
29
The stimulation result shown in figure 4.11 is carried out for inlet mass fraction of
sucrose 0.78, inlet velocity 0.001067 m/sand inlet temperature 303.15K. The simulation result
shows that upto 110s the rapid crystal growth size is present and beyond that the crystal size is
approximately constant. It follows the trend of the figure 4.10 except the increasing trend is
shifted by 10 sec more in figure 4.11. It occurs due presence larger concentration gradient at the
inlet in the latter case.
The stimulation result shown in figure 4.12 is carried out for inlet mass fraction of sucrose 0.74,
inlet velocity 0.001067 m/sand inlet temperature 303.15K. The simulation result shows that upto
200s the rapid crystal growth size is present and beyond that the crystal size is approximately
constant. The increasing trend is shifted further in the rightward as compared to figure 4.10 and
4.11 and it follows the same explanation given while comparing figure 4.11 with figure 4.10.
0.00E+00
2.00E-07
4.00E-07
6.00E-07
8.00E-07
1.00E-06
1.20E-06
1.40E-06
1.60E-06
1.80E-06
0 50 100 150 200 250 300 350 400
Mea
n c
ryst
al d
iam
eter
(m)
Time(s)
Calculated from TVAC/TSAC
Calculated from TLAC/TNAC
Figure 4.12:Transient distribution of mean crystal diameter obtained by TVAC/TSAC and
TLAC/TNAC. The used inlet mass fraction of sucrose is 0.74,the inlet temperature is 303.15K
and the inlet velocity is 0.001067 m/s.
SUCROSE CRYSTALLIZATION
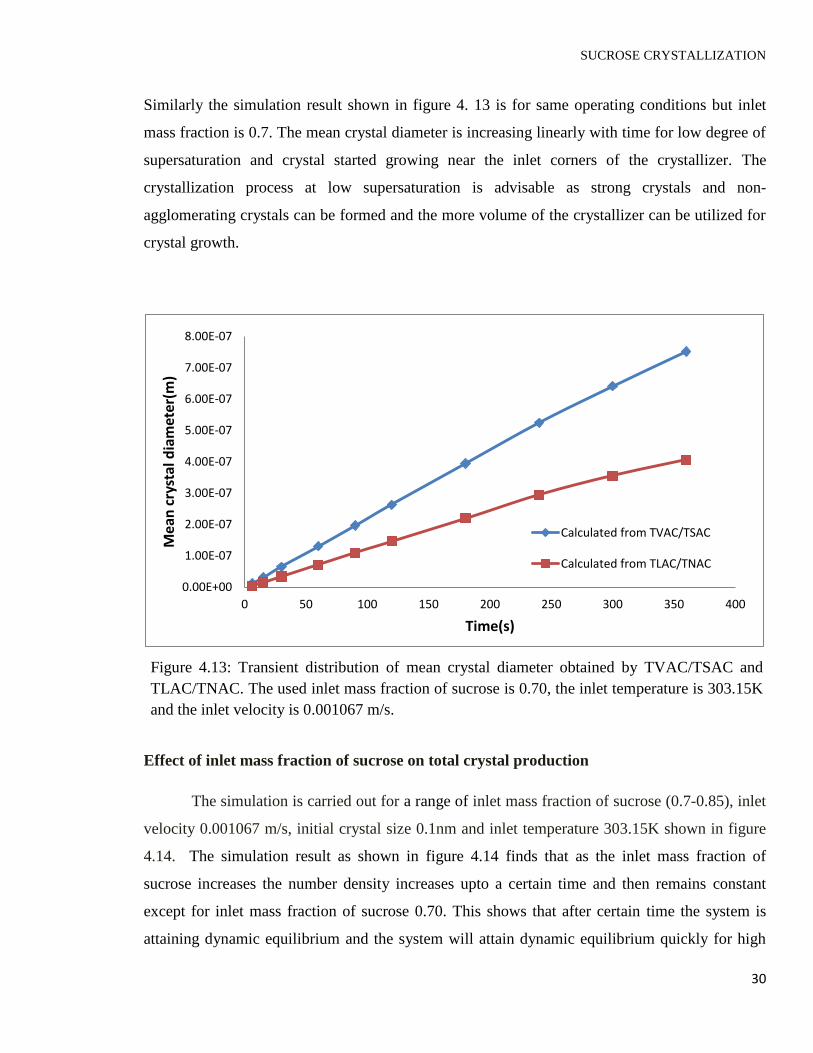
30
Similarly the simulation result shown in figure 4. 13 is for same operating conditions but inlet
mass fraction is 0.7. The mean crystal diameter is increasing linearly with time for low degree of
supersaturation and crystal started growing near the inlet corners of the crystallizer. The
crystallization process at low supersaturation is advisable as strong crystals and non-
agglomerating crystals can be formed and the more volume of the crystallizer can be utilized for
crystal growth.
Effect of inlet mass fraction of sucrose on total crystal production
The simulation is carried out for a range of inlet mass fraction of sucrose (0.7-0.85), inlet
velocity 0.001067 m/s, initial crystal size 0.1nm and inlet temperature 303.15K shown in figure
4.14. The simulation result as shown in figure 4.14 finds that as the inlet mass fraction of
sucrose increases the number density increases upto a certain time and then remains constant
except for inlet mass fraction of sucrose 0.70. This shows that after certain time the system is
attaining dynamic equilibrium and the system will attain dynamic equilibrium quickly for high
0.00E+00
1.00E-07
2.00E-07
3.00E-07
4.00E-07
5.00E-07
6.00E-07
7.00E-07
8.00E-07
0 50 100 150 200 250 300 350 400
Mea
n c
ryst
al d
iam
eter
(m)
Time(s)
Calculated from TVAC/TSAC
Calculated from TLAC/TNAC
Figure 4.13: Transient distribution of mean crystal diameter obtained by TVAC/TSAC and
TLAC/TNAC. The used inlet mass fraction of sucrose is 0.70, the inlet temperature is 303.15K
and the inlet velocity is 0.001067 m/s.
.

SUCROSE CRYSTALLIZATION
31
inlet mass fraction of sucrose. As the concentration increases the molecular collisions between
the nuclei increases and the mean crystal diameter will be less.Also at larger supersaturation the
crystal growth is characterized by abnormal needlelike or whisker like growth from the ends of
the crystals, which, under these conditions, may grow much faster than the sides. The spikes are
imperfect crystals which are bound to the parent crystal by weak forces and which break off to
give crystals of poor quality. At higher mass fraction of sucrose the mother liquor may be
occluded between crystals during crystal growth. So loosely bonded crystals will be formed
which may dissociate into individual particles. The simulation results also shows that at low
supersaturation a linear increase in number density is observed which is helpful for controlling
the crystallization process.
Effect of inlet velocity of solution on mean crystal size
The simulation is carried out for a range of inlet velocity (0.00001-0.001m/s), inlet mass
fraction of sucrose 0.70, initial crystal size 0.1nm and inlet temperature 303.15K (shown in
figure 4.15). In a supersaturated solution the mass transfer of solute takes place from low
0.00E+00
1.00E+16
2.00E+16
3.00E+16
4.00E+16
5.00E+16
6.00E+16
7.00E+16
8.00E+16
9.00E+16
1.00E+17
0 50 100 150 200 250 300 350 400
Tota
l nu
mb
er o
f cr
ysta
l/ V
olu
me
of
solu
tio
n(
no
of
crys
tal/
m3)
Time(s)
Massn fraction 0.85
Mass fraction 0.78
Mass fraction 0.74
Mass fraction 0.7
Figure 4.14: Effect of inlet mass fraction of sucrose on the transient distribution of number
density of the crystallizer. The used inlet velocity of solution is 0.001067 m/s and the inlet
temperature is 303.15K individually.

SUCROSE CRYSTALLIZATION
32
concentration zone to high concentration zone of it. The crystal growth is two step processes.
Formerly the mass transfer of nuclei towards the crystal surface and latter is surface reaction on
the crystal surface. The results show that with decrease in velocity the mean crystal diameter is
increasing. This shows that at higher velocities of solution, the velocity of fluid is dominating the
mass transfer rate, so majority of the nuclei are carried away from the crystal surface.
0.00E+00
1.00E-07
2.00E-07
3.00E-07
4.00E-07
5.00E-07
6.00E-07
7.00E-07
8.00E-07
9.00E-07
1.00E-06
0 50 100 150 200 250 300 350 400
Mea
n C
ryst
al d
iam
eter
(m)
Time(s)
Inlet velocity of solution 0.0005 m/s
Inlet velocity of solution 0.0001 m/s
Inlet velocity of solution 0.001 m/s
Inlet velocity of solution 0.00001 m/s
0.00E+00
1.00E-07
2.00E-07
3.00E-07
4.00E-07
5.00E-07
6.00E-07
7.00E-07
8.00E-07
9.00E-07
0 50 100 150 200 250 300 350 400
Mea
n c
ryst
al d
iam
eter
(m)
Time(s)
Calculated from TVAC/TSAC
Calculated from TLAC/TNAC
Figure 4.15: Effect of the inlet velocity on the transient distribution of mean crystal diameter
inside the crystallizer. The used inlet mass fraction of sucrose is 0.70 and the inlet temperature
is 303.15K.
.
Figure 4.16: Transient distribution of mean crystal diameter obtained by TVAC/TSAC and
TLAC/TNAC. The used inlet mass fraction of sucrose is 0.70, the inlet temperature is
303.15K and the inlet velocity is 0.0005 m/s.

SUCROSE CRYSTALLIZATION
33
The simulation shown in figure 4.16 is for inlet mass fraction of sucrose 0.70, inlet
velocity 0.0005m/s, initial seed crystal size 0.1nm and inlet temperature 303.15K. The mean
crystal diameter can be calculated by two methods, one is by ratio of moment-3 to moment-2 and
the other is by ratio of moment-1 to moment-0. The former one is more accurate as volume shape
factor and area shape factor is taken into consideration. The simulation result finds that the mean
crystal size is increasing linearly with time. The mean crystal diameter for velocity 0.0005m/s is
more than the mean crystal size for velocity 0.001m/s and less than the mean crystal size for
velocity 0.0001m/s and 0.00001m/s. This shows the mean crystal size increases with decrease in
inlet velocity. Also the number density for velocity, 0.0005m/s is more than number density for
inlet velocity, 0.001m/s. This shows at high velocity because of velocity current the nuclei are
carried away from the crystal surface instead of towards the crystal surface.
The simulation shown in figure 4.17 is for inlet mass fraction of sucrose 0.70, inlet
velocity 0.0001m/s, initial seed crystal size is taken as 0.1nm and inlet temperature
0.00E+00
1.00E-07
2.00E-07
3.00E-07
4.00E-07
5.00E-07
6.00E-07
7.00E-07
8.00E-07
9.00E-07
0 50 100 150 200 250 300 350 400
Mea
n c
ryst
al d
iam
eter
(m)
Time(s)
Calculated from TVAC/TSAC
Calculated from TLAC/TNAC
Figure 4.17: Transient distribution of mean crystal diameter obtained by TVAC/TSAC and
TLAC/TNAC. The used inlet mass fraction of sucrose is 0.70, the inlet temperature is 303.15K
and the inlet velocity is 0.0001 m/s.

SUCROSE CRYSTALLIZATION
34
303.15K. The simulation results show that the mean crystal size is increasing linearly with time.
The mean crystal diameter for velocity 0.0001m/s is more than the mean crystal size for velocity
0.0005m/s, 0.001m/s and less than the mean crystal size for velocity 0.00001m/s. This shows the
mean crystal size increases with decrease in inlet velocity of solution. Also the number density
for velocity of solution 0.0001m/s is more than number density for inlet velocity of solution
0.0005m/s and 0.001m/s. This shows at higher inlet velocity of solution because of velocity
current the nuclei are carried away from the crystal surface instead of towards the crystal surface.
Similarly the simulation is carried out for same operating conditions but for different inlet
velocity 0.00001m/s (shown in figure 4.18)and 0.001m/s (shown in figure 4.19) and for both the
inlet velocities, the mean crystal size is increasing linearly with time. The simulation result
shows that the mean crystal size is more for less inlet velocity of solution. The number density
present in the solution is lowest for the least inlet velocity of solution. Thisshows at lower inlet
0.00E+00
1.00E-07
2.00E-07
3.00E-07
4.00E-07
5.00E-07
6.00E-07
7.00E-07
8.00E-07
9.00E-07
1.00E-06
0 50 100 150 200 250 300 350 400
Mea
n c
ryst
al d
iam
eter
(m)
Time(s)
Calculated from TVAC/TSAC
Calculated from TLAC/TNAC
Figure 4.18: Transient distribution of mean crystal diameter obtained by TVAC/TSAC and
TLAC/TNAC. The used inlet mass fraction of sucrose is 0.70, the inlet temperature is
303.15K and the inlet velocity is 0.00001 m/s.

SUCROSE CRYSTALLIZATION
35
velocity of solution the mass transfer rate is dominating than the velocity current and the nuclei
are carried toward the crystal surface.
Effect of inlet velocity of solution on total crystal production
0.00E+00
1.00E-07
2.00E-07
3.00E-07
4.00E-07
5.00E-07
6.00E-07
7.00E-07
8.00E-07
9.00E-07
0 50 100 150 200 250 300 350 400
Mea
n c
ryst
al d
iam
eter
(m)
Time(s)
Calculated from TVAC/TSAC
Calculated from TLAC/TNAC
0.00E+00
2.00E+15
4.00E+15
6.00E+15
8.00E+15
1.00E+16
1.20E+16
0 50 100 150 200 250 300 350 400
Tota
l nu
mb
er
of
crys
tal/
volu
me
of
solu
tio
n
(no
. of
crys
tal/
m3)
Time(s)
Velocity of solution 0.00001m/s
Velocity of solution 0.0001m/s
Velocity of solution 0.0005m/s
Velocity of solution 0.001m/s
Figure 4.19: Transient distribution of mean crystal diameter obtained by TVAC/TSAC and
TLAC/TNAC. The used inlet mass fraction of sucrose is 0.70, the inlet temperature is 303.15K
and the inlet velocity is 0.001 m/s.
Figure 4.20: Effect of inlet velocity on the transient distribution of number density of crystals.
The used inlet mass fraction of sucrose is 0.70 and the inlet temperatureis 303.15K

SUCROSE CRYSTALLIZATION
36
The simulation result shown in figure 4.20 is carried out for different inlet velocity
(0.00001m/s- 0.001m/s), for inlet mass fraction of sucrose 0.70 and for initial crystal size 0.1nm
and inlet temperature 303.15K. The simulation result shows that as the inlet velocity of solution
is decreasing, the number density is decreasing. This shows that at lower inlet velocity of
solution the nuclei is transferred towards the crystal surface and mean crystal size is increasing
shown in figure 4.14.
Effect of temperature of wall on total crystal production
There is no effect of wall temperature on the mean crystal diameter (shown in figure
4.22) but the production of crystals is increasing (shown in figure 4.21) with increase in wall
temperature. The simulation shows that the solution is attaining saturation around 180s because
of wall temperatures. The crystal growth is more in the zone where the temperature is less and
the crystal growth is less in the zone where the temperature is more(shown in figure 4.25). This
shows that with increase in temperature the molecular collision is increasing and the nuclei are
not agglomerating.
0.00E+00
1.00E+16
2.00E+16
3.00E+16
4.00E+16
5.00E+16
6.00E+16
7.00E+16
8.00E+16
9.00E+16
0 50 100 150 200 250 300 350
Tota
l nu
mb
er
of
crys
tals
/vo
lum
e o
f so
luti
on
(no
. of
crys
tals
/m3)
Time(s)
Wall Temperature 323K
Wall Temperature 333K
Figure 4.21: Effect of the wall temperature of the crystallizer on thetransient distribution of
number density of the crystals inside the crystallizer. The used inlet mass fraction of sucrose
is 0.7, the inlet temperature is 303.15 K and the inlet velocity is 0.001m/s.

SUCROSE CRYSTALLIZATION
37
Effect of temperature of wall on mean crystal size
The simulation result for a range of wall temperatures (323K, 333K), inlet velocity
0.001067 m/s, initial seed crystal size 0.1nm and inlet mass fraction of sucrose 0.70 and inlet
temperature 303.15K The crystal size is increasing linearly with time upto 180s and then the
crystal size is nearly constant. But for isothermal system shown in figure 4.23 the supersaturation
is prevailing for atleast 360s. This shows that desupersatuation is taking place from 180s
onwards because of wall temperature.
The simulation shown in figure 4.23 is for inlet velocity 0.001067 m/s, inlet mass fraction
0.70, wall temperature 323K, initial seed crystal size 0.1nm, inlet temperature 303.15K and wall
temperature of crystallizer 323K. The mean crystal diameter can be calculated by two methods,
one is by ratio of moment 3 to moment 2 and the other is by ratio of moment 1 to moment 0. The
former one is more accurate as volume shape factor and area shape factor is taken into
consideration. The mean crystal size is increasing upto 180s and beyond 180s onwards there is
no change in crystal size. This shows the supersaturation is prevailing upto 180s and beyond the
0.00E+00
2.00E-07
4.00E-07
6.00E-07
8.00E-07
1.00E-06
1.20E-06
1.40E-06
1.60E-06
1.80E-06
0 50 100 150 200 250 300 350
Dia
met
er o
f cr
ysta
l(m
)
Time(s)
Wall temperature 323K
Wall temperature 333K
Figure 4.22:Effect of the wall temperature of the crystallizer on thetransient distribution of
mean crystal diameter. The used inlet mass fraction of sucrose is 0.70, the inlet temperature is
303.15 K and the inlet velocity is 0.001m/s.

SUCROSE CRYSTALLIZATION
38
solution is saturated.Similarly for figure 4.24 but wall temperature of crystallizer is 333K and the
system is attaining equilibrium just 178s (approximately)
0.00E+00
2.00E-07
4.00E-07
6.00E-07
8.00E-07
1.00E-06
1.20E-06
1.40E-06
1.60E-06
1.80E-06
0 50 100 150 200 250 300 350
Dia
met
er o
f cr
ysta
l(m
)
Time(s)
Calculated from TVAC/TSAC
Calculated from TLAC/TNAC
0.00E+00
2.00E-07
4.00E-07
6.00E-07
8.00E-07
1.00E-06
1.20E-06
1.40E-06
1.60E-06
1.80E-06
0 50 100 150 200 250 300 350
Dia
met
er o
f C
ryst
al(m
)
Time(s)
Calculated from TVAC/TSAC
Calculated from TLAC/TNAC
Figure 4.23: Transient distribution of mean crystal diameter obtained by TVAC/TSAC and
TLAC/TNAC. The used inlet mass fraction of sucrose is 0.70, the inlet temperature is
303.15K and the inlet velocity is 0.001067 m/s. The specified wall temperature is 323 K
Figure 4.24: Transient distribution of mean crystal diameter obtained by TVAC/TSAC and
TLAC/TNAC. The used inlet mass fraction of sucrose is 0.70, the inlet temperature is
303.15K and the inlet velocity is 0.001067 m/s. The specified wall temperature is 333 K.

SUCROSE CRYSTALLIZATION
39
Figure 4.25: Contour plot of the temperature of the crystallizer at time 300second. The used inlet
velocity of is 0.001067 m/s, inlet mass fraction of sucrose is 0.70 and the inlet temperature is
303.15K. The specified wall temperature is 333 K.The outlet is present at 0.0 m.
The counter plot showed in figure 4.24 and figure 4.25 shows that the crystals are growing
around the middle region of the crystallizer where the temperature is less or in the region where
the wall temperature effect is negligible. This shows that as the temperature increases the
collision increases.
Figure 4.26: Contour plot of moment-3 of the crystallizer at time 300second. The used inlet
velocity is 0.001067 m/s, inlet mass fraction of sucrose is 0.70 and the inlet temperature is
303.15K. The specified wall temperature is 333 K. The outlet is present at 0.0 m.

CHAPTER 5
____________________________________________________
CONCLUSION
CONCLUSION AND FUTURE SCOPE
40
CHAPTER 5
CONCLUSION
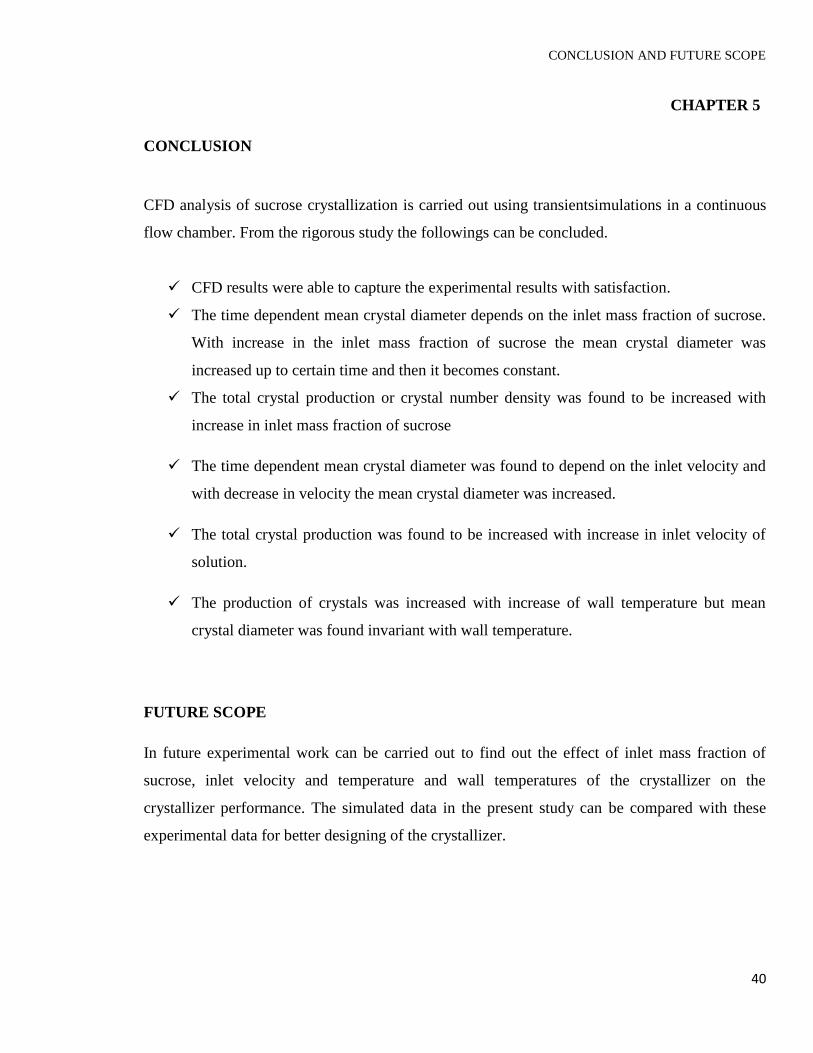
CFD analysis of sucrose crystallization is carried out using transientsimulations in a continuous
flow chamber. From the rigorous study the followings can be concluded.
CFD results were able to capture the experimental results with satisfaction.
The time dependent mean crystal diameter depends on the inlet mass fraction of sucrose.
With increase in the inlet mass fraction of sucrose the mean crystal diameter was
increased up to certain time and then it becomes constant.
The total crystal production or crystal number density was found to be increased with
increase in inlet mass fraction of sucrose
The time dependent mean crystal diameter was found to depend on the inlet velocity and
with decrease in velocity the mean crystal diameter was increased.
The total crystal production was found to be increased with increase in inlet velocity of
solution.
The production of crystals was increased with increase of wall temperature but mean
crystal diameter was found invariant with wall temperature.
FUTURE SCOPE
In future experimental work can be carried out to find out the effect of inlet mass fraction of
sucrose, inlet velocity and temperature and wall temperatures of the crystallizer on the
crystallizer performance. The simulated data in the present study can be compared with these
experimental data for better designing of the crystallizer.
REFERENCES
41
REFERENCES
1. Abbas, A. and Romagnoli, J., “Multiscale modeling, simulation and validation of batch
cooling crystallization”, Separationand Purification Technology, 2006, 153-163.
2. Abdel, N., Mohameed, H., Nasr, A. and Takrouri, K., “Model-based optimal cooling
strategy for batch crystallization processes”,Chemical Engineering Research and Design,
2003, 35-46.
3. Albert, M. and Allan, S., “Handbook of industrial crystallization”, 1993, 2nd
edition, 38-
120.
4. Andre, B., Everson, A. and Gisele, A., “Determination of crystal growth rate for porcine
insulin crystallization with CO2 as a volatile acidifying agent”, Chemical Engineering and
Processing: Process Intensification, 2012, 29– 33.
5. Angelov, I., Ashfaq, A., Elsner, M., Seidel-Morgenstern, A., Qamara, S. and Warnecke,
G., “Adaptive high-resolution schemes for multidimensional population balances in
crystallization processes”, Computers & Chemical Engineering, 2007, 1296–1311.
6. Angelov, I., Ashfaq, A., Elsner, M., Seidel-Morgenstern, A., Qamara, S. and Warnecke,
G., “A comparative study of high resolution schemes for solving population balances in
crystallization”, Computers & Chemical Engineering, 2006, 1119–1131.
7. Angelov, I., Ashfaq, A., Elsner, M., Seidel-Morgenstern, A., Qamara, S. and Warnecke,
G.,“Numerical approximations of a population balance model for coupled batch
preferential crystallizers”, Applied Numerical Mathematics, 2009,739–753.
8. ANSYS Fluent 13.0 Theory Guide, 2009.
9. Basim, A., Hazim, A. andMohamad, K., “Effect of cooling rate on unseeded batch
crystallization of KCl”,Chemical Engineering and Processing: Process
Intensification,2002,297–302.
10. Benedito,J., Corona, E., Garcia-Perez, J. and Santacatalina, J., “Ultrasonic monitoring of
lard crystallization during storage”,Food Research International, 2011, 146-155.
REFERENCES
42
11. Bento,L., Ferreira,A., Khaddour, I. and Rocha, F., “Kinetics and thermodynamics of
sucrose crystallization from pure solution at different initial supersaturations”, Surface
Science, 2010, 1208–1214.
12. Chirag, M. and Damien, J., “Nucleation and growth kinetics of struvite crystallization”,
Water Research, 2013, 2890–2897.
13. Daniele, L., Jay, S., Kumar, D. and Rodney, O., “On the comparison between population
balance models for CFD simulation of bubble columns”, Industrial and Engineering
Chemistry Research, 2005, 5063-5072.
14. Darmont, J. and Detry, L., “Process and equipment for crystallizing and inorganic
substance”, 1992, U.S. Patent.
15. David, R., Muhw, H. and Villermaux, J., “Solving population balance in the case of the
precipitation of silver bromide crystals with high primary nucleation rates by using the
first order upwind differentiation”, Chemical Engineering Science,1996, 309-319.
16. En, S., Gibaek, L., Jean, M., Xavier, J., Xuan, M. and Young, L., “On the solution of
population balance equations (PBE) with accurate front tracking methods in practical
crystallization processes”, 2009, Chemical Engineering Science, 3715 – 3732.
17. Espinosa, R., Franke, L. and Deckelmann, G., “Model for the mechanical stress due to
the salt crystallization in porous materials”, Construction and Building Materials, 2007,
1350-1367.
18. Fevotte, G., Klein, J. and Puel, F., “Simulation and analysis of industrial crystallization
processes through multidimensional population balance equations”, Chemical
Engineering Science, 2003,3729–3740.
19. Garside, J., Mullin, J. and Das, S., “Growth and dissolution kinetics of potassium sulfate
crystals in an agitated vessel”, Industrial and Engineering Chemistry Research, 1974,
299-301.
20. Gerald, W. and Shamsul, Q., “Numerical solution of population balance equations for
nucleation, growth and aggregation processes”, Computers & Chemical Engineering,
1996, 1576-1589.
21. Gerald, W. and Shamsul, Q., “Solving population balance equations for two-component
aggregation by a finite volume scheme”,Chemical Engineering Science , 2007, 679 –
693.

REFERENCES
43
22. Gilles, D., Mitrovi, A. and Motz, S., “Comparison of numerical methods for the
simulation of dispersed phase systems”,Chemical Engineering Science, 2002, 4329 –
4344.
23. Guo, Z.,Jones, G. and Li, N., “The effect of ultrasound on the homogeneous nucleation of
BaSO4 during reactive crystallization”, Journal of Applied Physics, 2006, 1617 – 1626.
24. Hairong, L., Hong, L., Yu, L. and Zhichao,G., “The application of power ultrasound to
reaction crystallization”,UltrasonicsSonochemistry, 2006, 359–363.
25. Heinrich, S., Kumar, J., Peglow, M. and Warnecke, G., “Comparison of numerical
methods for solving population balance equations incorporating aggregation and
breakage”,Powder Technology, 2009, 218–229.
26. Hussain, S., Lionberger, A., Raw, S., D'Costa, R.,Wu H. and Yu, X.,“Applications of
process analytical technology to crystallization processes”,Advanced Drug Delivery
Reviews, 2004,349–369.
27. Jonathan, A. and Mikael, A., “CFD modeling of sucrose crystallization”, 1999, Second
International Conference, Australia, 381-386.
28. Jones, G., “Crystallization process systems”, 2002, 2nd
edition, 60-140.
29. Jones,G., Kougoulos, E. and Narducci, O., “Continuous crystallization of adipic acid with
ultrasound”, Chemical Engineering Science, 2011, 1069-1076.
30. Julian, C., Peter, H. and Warren, L., “Unit operations of chemical engineering” 5th
edition, 882-901.
31. Keisuke, F., Kouji, M., Yuichi, Y. and Yusuke, A., “Determination of crystal nucleus size
of potassium chloride from ethanol solution caused by ultrasonic irradiation”,Chemical
Engineering and Processing: Process Intensification, 2009, 902–906.
32. Kordylla, A., Krawczyk,T., Schembecker,G. and Tumakaka,F., “Modeling ultrasound-
induced nucleation during cooling crystallization”, Chemical Engineering Science, 2009,
1635 -1642.
33. Lawrence, E. and Verdoes, D., “Process and equipment for carrying out crystallization”,
2007, U.S.Patent.
34. Lindberg, M. and Rasmuson, C., “Reaction crystallization in strained fluid films”,
Chemical Engineering Science, 2000, 3257-3273.
35. Mullin, J., “Crystallization”, 1993, 3rd edition, 20-80.

REFERENCES
44
36. Ramkrishna, D. and Sanjeev, K., “On the solution of population balance equations by
discretization-IIInucleation, growth and aggregation of particles”,Chemical Engineering
Science, 1997, 4659- 4679.
37. Reginald, B., Richard, D.and Xing, Y., “Modeling and computational fluid dynamics-
population balanceequation-micromixing simulation of impinging jet crystallizers”,
Crystal Growth and Design, 2009, 1156–1164.
38. Rohani, S., “Nucleation, growth, and aggregation kinetics of potassium chloride from a
continuous mixed-suspension mixed product removal cooling crystallizer”, Separations
Technology, 1993, 99-105.
39. Saxer, K., “Fractional crystallization process”, 1984, U.S. Patent.
40. Shiau, D., “The distribution of dislocation activities among crystals in sucrose
crystallization”, Chemical Engineering Science, 2003, 5299 – 5304.
41. Tai, Y., “Crystal growth kinetics of two step growth process in liquid fluidized bed
crystallizer”, Journal of Crystal Growth, 1999, 109-118.

REFERENCES
xlv