Embed Size (px)
Citation preview
ILASS Americas, 20th Annual Conference on Liquid Atomization and Spray Systems, Chicago, IL, May 2007
Numerical Simulation of Spray Pattern in a Liquid Flashing Column
R. J. Schick
Spray Analysis and Research Services
Spraying Systems Co.
P.O. Box 7900
Wheaton, IL 60189-7900 USA
Genong Li* and Heshmat Massah
Ansys Inc, 10 Cavendish Court
Lebanon, NH 03766 USA
Abstract Spray columns and towers are fundamental in many industrial applications. Understanding the spray pattern in these
dynamic environments is very important in the design of an overall spray system solution. Traditional laboratory
physical experiments can be time-consuming, expensive, and sometimes impossible to complete. Computational
fluid dynamics (CFD) modeling can be used effectively in this area.
In this case study, a slurry feedstock is injected into a reaction column through numerous nozzles and a significant
amount of the feed gets flashed quickly after exiting the nozzles. The gas from flashing produces a complicated
flow field in the column that has a great impact on the spray pattern. A critical factor in the operating process is a
requirement that the spray have good coverage over the column while not impinging on the sidewalls. CFD is the
tool we used to optimize the position and the orientation of each nozzle in this spraying system.
The gas flow field in the column is solved by the Navier-Stokes equations while trajectories of droplets are calcu-
lated by the discrete phase model (DPM). The flow field and the droplets’ calculation are closely coupled, allowing
the interactions of spray and flow field to be accurately captured. Droplet size distribution of the spray is closely
accounted for as well.
In this case study, different nozzle layouts are studied and compared for optimization of the nozzles and their respec-
tive placement. From the simulation, it is apparent that flow-spray interactions are vital in the prediction of spray
pattern.
*Corresponding author
Introduction Spray columns and towers are fundamental in
many industrial applications such as gas conditioning
and gas scrubbing. They have the advantages of sim-
plicity and low operational costs. Understanding the
spray pattern in these dynamic environments is very
important in the design of an overall spray system solu-
tion.
In a traditional design, nozzles’ location and their
orientation are usually estimated by droplets’ trajecto-
ries in a simple configuration (for example, nozzle
pointing down and ignoring interaction with the flow
field) and fine tuned during the test operation after its
installation. This process is very time-consuming and
cost-inefficient. And sometimes doing experiments
during operation is even impossible due to the extreme
adverse environment in the column.
During the last few decades, Computational Fluid
Dynamics (CFD) has been widely adopted in the
chemical process industries. Along with the great ad-
vancement in numerical modeling and the continuing
reduction in computer hardware’s cost, more and more
complex industrial problems can be faithfully solved
through pure numerical simulations. Many different
numerical models have been developed in the spray
application. For instance, the Volume of Fluid (VOF)
method can be used to predict a spray nozzle’s basic
characteristics (e.g., spray angle and droplets’ size dis-
tribution) and the Discrete Phase Method (DPM) can be
used to track droplets’ trajectories [1]. Compared with
physical testing, numerical simulation is much more
cost effective and environmentally friendly. In the mean
time, CFD can give detailed 3D information, while ex-
periments usually can only provide point information.
To illustrate the effectiveness of CFD in the spray
application, a flashing column is studied in this paper.
A slurry feedstock is injected into a reaction column
through numerous nozzles and a significant amount of
the feed gets flashed quickly after exiting the nozzles.
The gas from flashing produces a complicated flow
field in the column that has a great impact on the spray
pattern. A critical factor in the operating process is a
requirement that the spray have good coverage over the
column while not impinging on the sidewalls. The CFD
tool can play an effective role in the optimization of
parameters for this process, such as the location and
orientation of the spray nozzles.
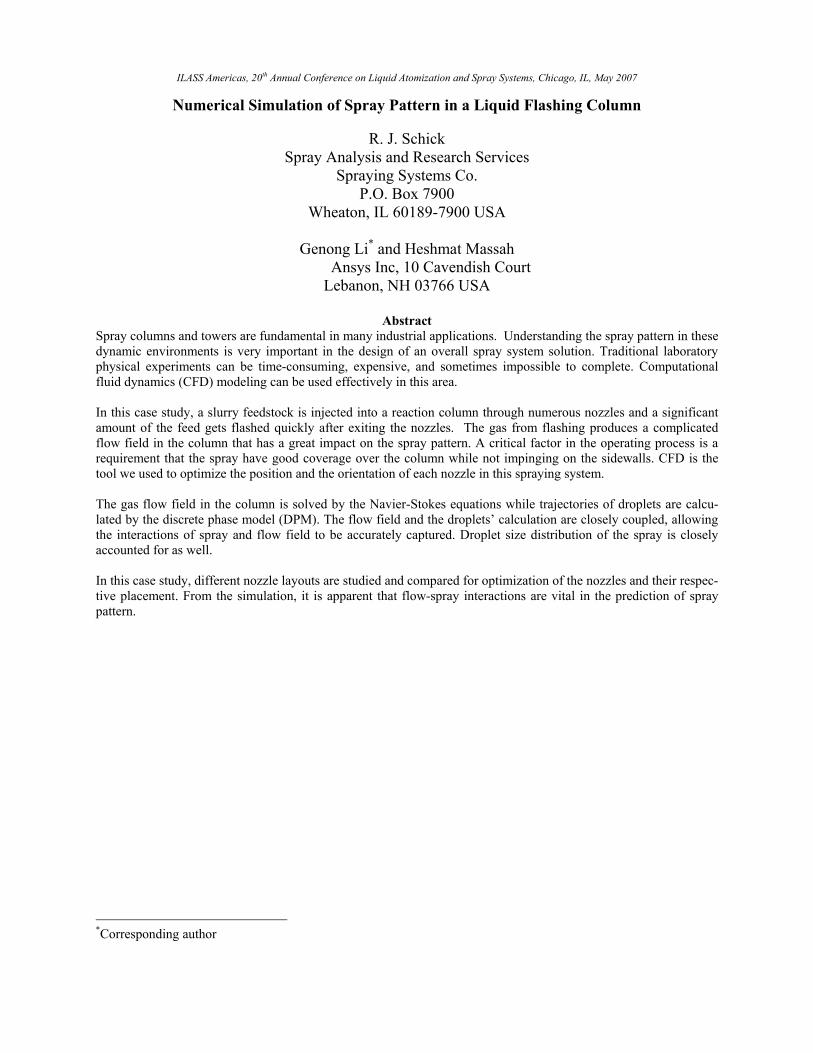
Problem Description Figure 1 shows a reaction column that has been
studied in this work. The column is about 10m in di-
ameter and 25m in height. Liquid slurry is sprayed into
the column from the feed headers. To maintain a favor-
able flashing environment, steam is injected to the col-
umn to control the temperature from the steam distribu-
tor headers and a defoaming agent is injected into the
column to prevent foaming formation from the de-
foamer headers. Some undesirable constituents in the
slurry feed get flashed out and they escape the tower
from the demist devices near the top of the tower, and
the purified slurry get collected in the bottom liquid
pool for downstream processing. There are six lances
(NA-NF) installed for the slurry feeding nozzles. Under
normal operating conditions, only four lances are used
(NB and NE are spare ones). Due to some constraints in
piping line arrangement, each of Lance NA and NC has
two Spraying System’s WXF-275 nozzles on it, and
each of Lance ND and NF has only one Spraying Sys-
tem’s WXF-120 nozzle on it. In addition, all those
lances cannot be inserted further into the column due to
some constraints from other considerations. As a result,
the layout of those nozzles is not symmetric. The major
concern in this process is that the slurry spray may im-
pact the column side walls which could cause damage
to the column lining. Therefore, each nozzle has to be
carefully oriented so that the liquid spray could have a
good coverage while not wetting the tower wall.
Figure 1. Reaction Column Geometry
In general a spray pattern is determined by spray
nozzle’s type, which will determine the size distribution
of droplets, initial velocity and directions, and the envi-
ronment to which the spray is injecting, which will af-
fect droplets’ trajectories via drag force. For the consid-
ered case, prediction of spray pattern is complicated by
Liquid pool
Steam distributor
Slurry feed nozzle
Defoamer
NA NB NC
ND
NE
NF
the complex flow pattern formed in the column by the
flashing gases. Under the normal operation, 19% of the
total liquid slurry gets flashed in the column, producing
a significant amount of gas. The flow pattern of the gas
will have a great impact on the spray.
We will focus our study on the prediction of the
slurry spray pattern. The steam and defoaming spray
will be ignored since their influence on the slurry spray
is negligible. The spray’s initial conditions (spray an-
gle, flow rate, droplets’ size distribution and their initial
velocity from the nozzle) are known from the vender
for any given spray nozzle and are provided as inputs in
the simulation.
Spray Nozzle Selection Spray nozzle selection is a critical part of the liquid
flashing design process. Based on the geometrical con-
straints of the flashing column and past experience, a
60˚ spray angle was desirable. Additional factors are
involved in the nozzle selection process. Mechanical
demands of the nozzle due to the solvent solution in-
clude: manufacturability, erosion resistance, and corro-
sion resistance. Generally, large volume concentration
solvent solutions require a refractory or ceramic mate-
rial for nozzle material, rather than the more traditional
ferrous alloy material. Extended nozzle life was a key
design element due to the associated expense of the
application.
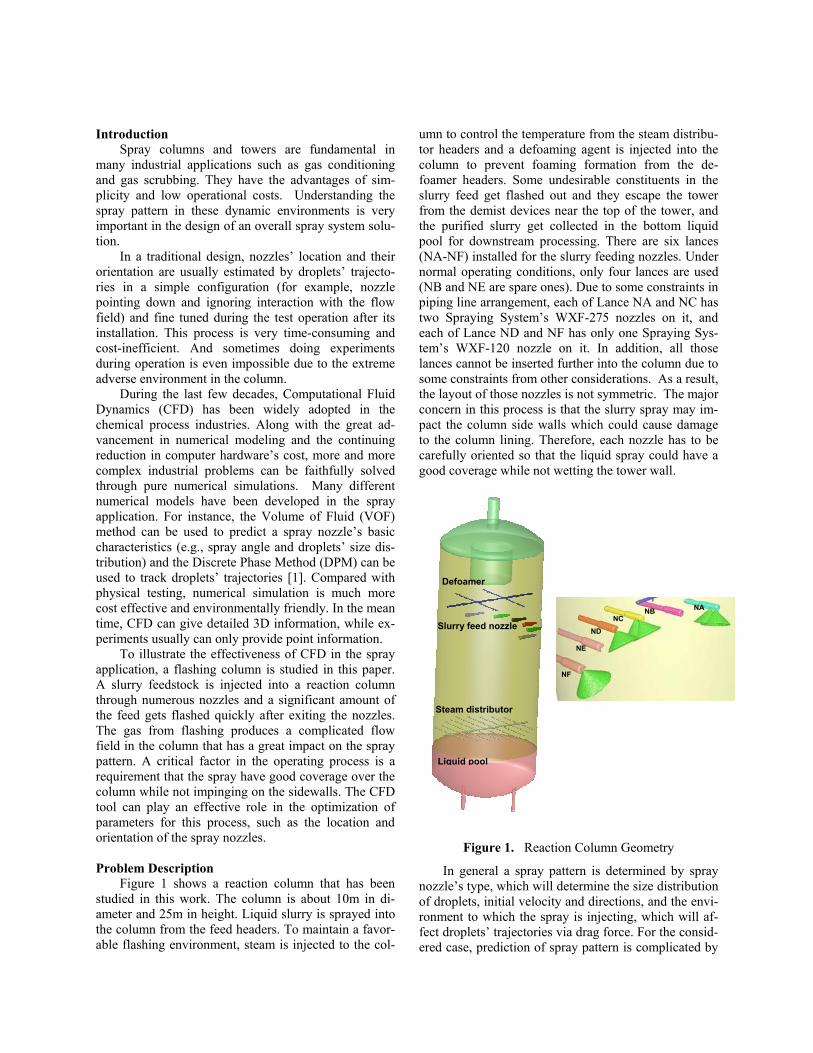
Based on the required flow rate and performance
criteria as noted above, a large flow Spraying Systems
Co. WhirlJet® nozzle was used in this case study. The
WhirlJet® nozzle is a hydraulic atomizer, featuring a
large free passage design to minimize clogging. A spe-
cial design was developed to provide a 60˚ hollow cone
spray. It consists of a cast design with a traditional
whirl chamber atomization device. The whirl chamber
was modified slightly to avoid a flashing scenario due
to the solvent spray fluid. This prototype nozzle was
then fully characterized to determine drop size, veloc-
ity, and volume flux distribution. Figure 2 shows a
typical WhirlJet® nozzle. Spray characterization testing
was performed for several nozzles to determine optimal
injection properties for the CFD model, based on the
theoretical requirements[2].
Figure 2. WhirlJet® Nozzle
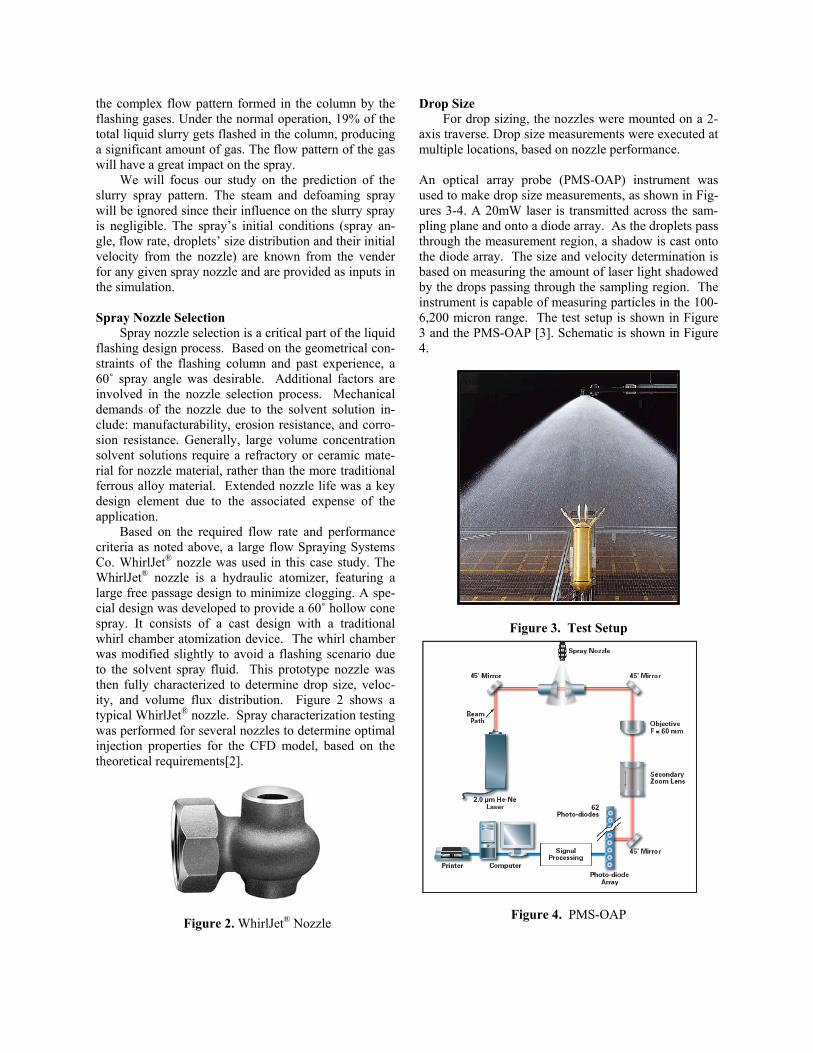
Drop Size For drop sizing, the nozzles were mounted on a 2-
axis traverse. Drop size measurements were executed at
multiple locations, based on nozzle performance.
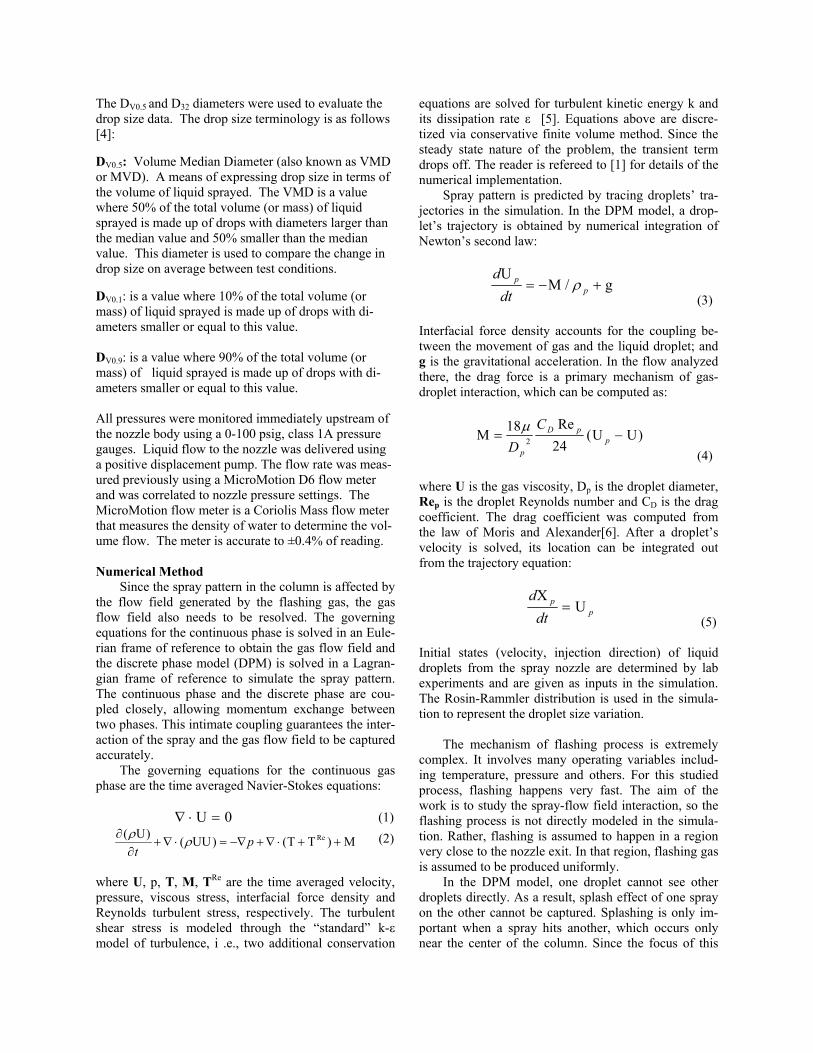
An optical array probe (PMS-OAP) instrument was
used to make drop size measurements, as shown in Fig-
ures 3-4. A 20mW laser is transmitted across the sam-
pling plane and onto a diode array. As the droplets pass
through the measurement region, a shadow is cast onto
the diode array. The size and velocity determination is
based on measuring the amount of laser light shadowed
by the drops passing through the sampling region. The
instrument is capable of measuring particles in the 100-
6,200 micron range. The test setup is shown in Figure
3 and the PMS-OAP [3]. Schematic is shown in Figure
4.
Figure 3. Test Setup
Figure 4. PMS-OAP
The DV0.5 and D32 diameters were used to evaluate the
drop size data. The drop size terminology is as follows
[4]:
DV0.5: Volume Median Diameter (also known as VMD
or MVD). A means of expressing drop size in terms of
the volume of liquid sprayed. The VMD is a value
where 50% of the total volume (or mass) of liquid
sprayed is made up of drops with diameters larger than
the median value and 50% smaller than the median
value. This diameter is used to compare the change in
drop size on average between test conditions.
DV0.1: is a value where 10% of the total volume (or
mass) of liquid sprayed is made up of drops with di-
ameters smaller or equal to this value.
DV0.9: is a value where 90% of the total volume (or
mass) of liquid sprayed is made up of drops with di-
ameters smaller or equal to this value.
All pressures were monitored immediately upstream of
the nozzle body using a 0-100 psig, class 1A pressure
gauges. Liquid flow to the nozzle was delivered using
a positive displacement pump. The flow rate was meas-
ured previously using a MicroMotion D6 flow meter
and was correlated to nozzle pressure settings. The
MicroMotion flow meter is a Coriolis Mass flow meter
that measures the density of water to determine the vol-
ume flow. The meter is accurate to ±0.4% of reading.
Numerical Method Since the spray pattern in the column is affected by
the flow field generated by the flashing gas, the gas
flow field also needs to be resolved. The governing
equations for the continuous phase is solved in an Eule-
rian frame of reference to obtain the gas flow field and
the discrete phase model (DPM) is solved in a Lagran-
gian frame of reference to simulate the spray pattern.
The continuous phase and the discrete phase are cou-
pled closely, allowing momentum exchange between
two phases. This intimate coupling guarantees the inter-
action of the spray and the gas flow field to be captured
accurately.
The governing equations for the continuous gas
phase are the time averaged Navier-Stokes equations:
0U �� (1)
M)TT()UU()U( Re ������� ���
ww
pt
UU (2)
where U, p, T, M, TRe are the time averaged velocity,
pressure, viscous stress, interfacial force density and
Reynolds turbulent stress, respectively. The turbulent
shear stress is modeled through the “standard” k-İ model of turbulence, i .e., two additional conservation
equations are solved for turbulent kinetic energy k and
its dissipation rate İ [5]. Equations above are discre-
tized via conservative finite volume method. Since the
steady state nature of the problem, the transient term
drops off. The reader is refereed to [1] for details of the
numerical implementation.
Spray pattern is predicted by tracing droplets’ tra-
jectories in the simulation. In the DPM model, a drop-
let’s trajectory is obtained by numerical integration of
Newton’s second law:
g/MU
�� pp
dtd
U (3)
Interfacial force density accounts for the coupling be-
tween the movement of gas and the liquid droplet; and
g is the gravitational acceleration. In the flow analyzed
there, the drag force is a primary mechanism of gas-
droplet interaction, which can be computed as:
)UU(24
Re18M
2� p
pD
p
C
DP
(4)
where U is the gas viscosity, Dp is the droplet diameter,
Rep is the droplet Reynolds number and CD is the drag
coefficient. The drag coefficient was computed from
the law of Moris and Alexander[6]. After a droplet’s
velocity is solved, its location can be integrated out
from the trajectory equation:
pp
dtd
UX
(5)
Initial states (velocity, injection direction) of liquid
droplets from the spray nozzle are determined by lab
experiments and are given as inputs in the simulation.
The Rosin-Rammler distribution is used in the simula-
tion to represent the droplet size variation.
The mechanism of flashing process is extremely
complex. It involves many operating variables includ-
ing temperature, pressure and others. For this studied
process, flashing happens very fast. The aim of the
work is to study the spray-flow field interaction, so the
flashing process is not directly modeled in the simula-
tion. Rather, flashing is assumed to happen in a region
very close to the nozzle exit. In that region, flashing gas
is assumed to be produced uniformly.
In the DPM model, one droplet cannot see other
droplets directly. As a result, splash effect of one spray
on the other cannot be captured. Splashing is only im-
portant when a spray hits another, which occurs only
near the center of the column. Since the focus of this
study is on the spray-wall interaction, the DPM ap-
proach is acceptable.
Numerical Results Many different runs have been made to determine
where and how to place the nozzles. In the fist run, a set
of data on nozzles’ location and orientation was esti-
mated based on past experience. They are intended to
provide a starting point for the optimization process.
Many iterations were conducted to eventually obtain
the best configuration.
Table 1 summarizes two of many studied nozzle
configurations. The fist one is from a suggestion based
on experience, and the second is an improved one dur-
ing the optimization iteration. For each configuration,
in order to study the effect of internal gas flow (which
is produced by the flashed gas) on the spray pattern,
two separate simulations are conducted - one in the
absent of the internal flow and the other in the presence
of the internal flow. In the absence of the internal flow,
we assume the tower is filled with the still flashed gas.
In the other case, the flow field and the spray calcula-
tion are coupled intimately.
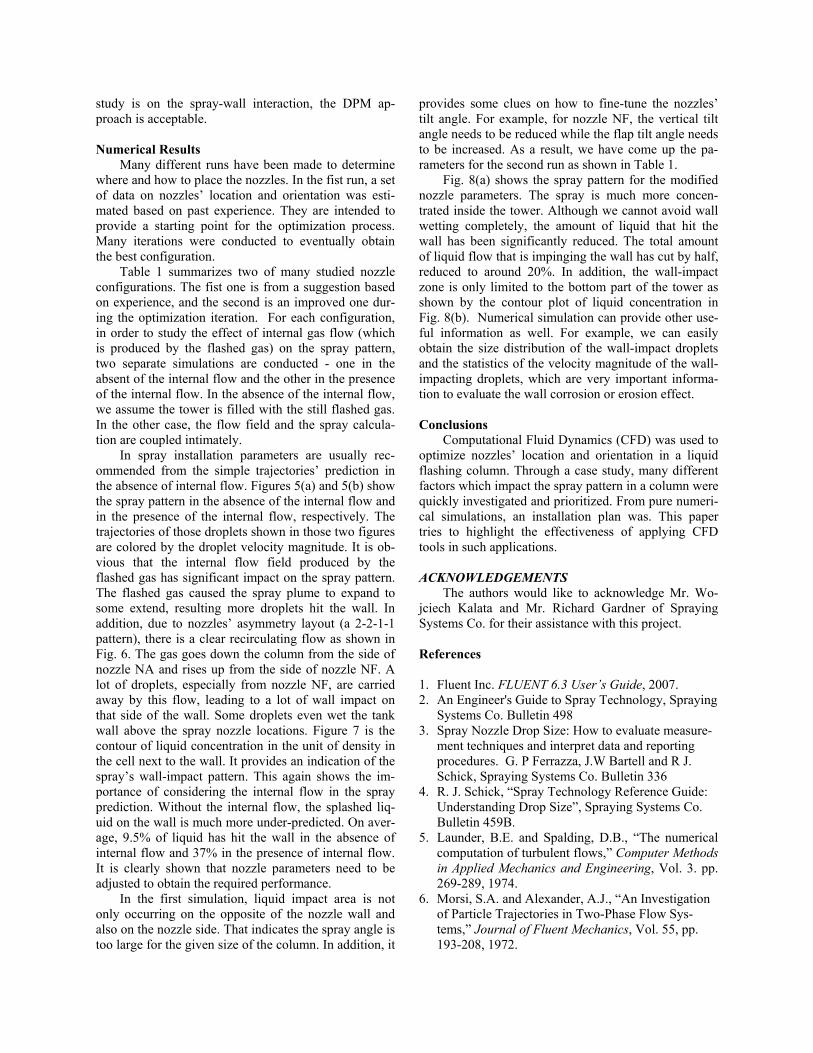
In spray installation parameters are usually rec-
ommended from the simple trajectories’ prediction in
the absence of internal flow. Figures 5(a) and 5(b) show
the spray pattern in the absence of the internal flow and
in the presence of the internal flow, respectively. The
trajectories of those droplets shown in those two figures
are colored by the droplet velocity magnitude. It is ob-
vious that the internal flow field produced by the
flashed gas has significant impact on the spray pattern.
The flashed gas caused the spray plume to expand to
some extend, resulting more droplets hit the wall. In
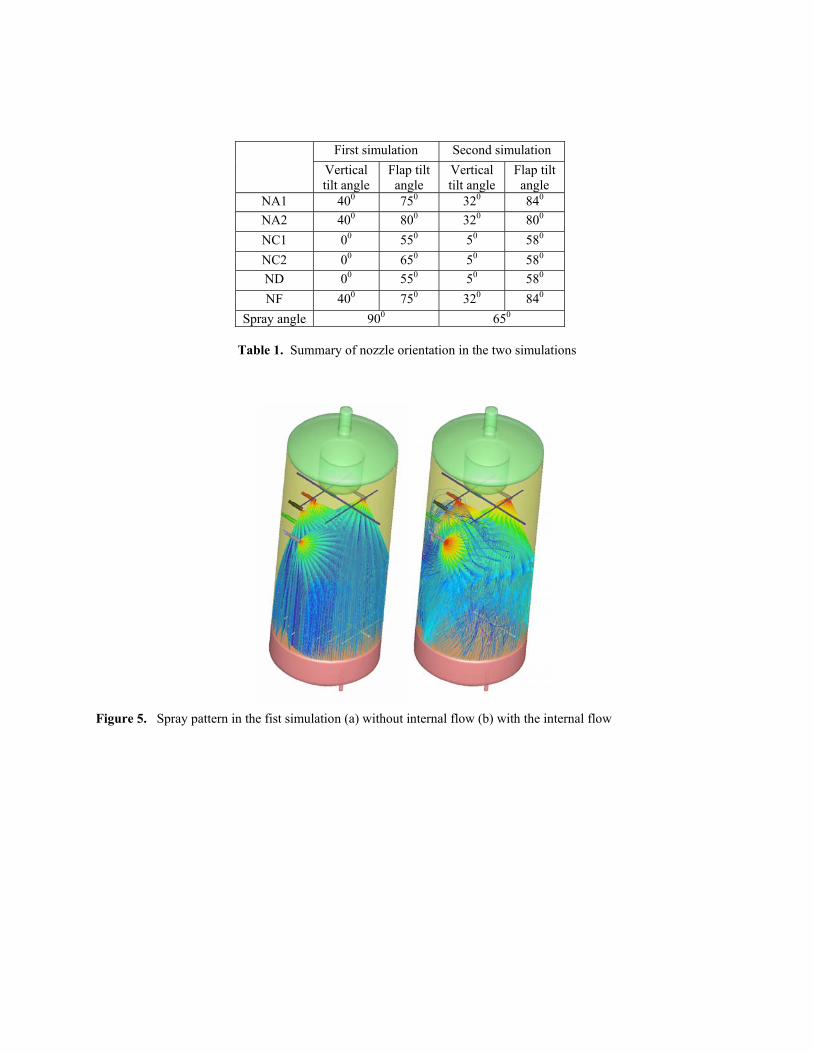
addition, due to nozzles’ asymmetry layout (a 2-2-1-1
pattern), there is a clear recirculating flow as shown in
Fig. 6. The gas goes down the column from the side of
nozzle NA and rises up from the side of nozzle NF. A
lot of droplets, especially from nozzle NF, are carried
away by this flow, leading to a lot of wall impact on
that side of the wall. Some droplets even wet the tank
wall above the spray nozzle locations. Figure 7 is the
contour of liquid concentration in the unit of density in
the cell next to the wall. It provides an indication of the
spray’s wall-impact pattern. This again shows the im-
portance of considering the internal flow in the spray
prediction. Without the internal flow, the splashed liq-
uid on the wall is much more under-predicted. On aver-
age, 9.5% of liquid has hit the wall in the absence of
internal flow and 37% in the presence of internal flow.
It is clearly shown that nozzle parameters need to be
adjusted to obtain the required performance.
In the first simulation, liquid impact area is not
only occurring on the opposite of the nozzle wall and
also on the nozzle side. That indicates the spray angle is
too large for the given size of the column. In addition, it
provides some clues on how to fine-tune the nozzles’
tilt angle. For example, for nozzle NF, the vertical tilt
angle needs to be reduced while the flap tilt angle needs
to be increased. As a result, we have come up the pa-
rameters for the second run as shown in Table 1.
Fig. 8(a) shows the spray pattern for the modified
nozzle parameters. The spray is much more concen-
trated inside the tower. Although we cannot avoid wall
wetting completely, the amount of liquid that hit the
wall has been significantly reduced. The total amount
of liquid flow that is impinging the wall has cut by half,
reduced to around 20%. In addition, the wall-impact
zone is only limited to the bottom part of the tower as
shown by the contour plot of liquid concentration in
Fig. 8(b). Numerical simulation can provide other use-
ful information as well. For example, we can easily
obtain the size distribution of the wall-impact droplets
and the statistics of the velocity magnitude of the wall-
impacting droplets, which are very important informa-
tion to evaluate the wall corrosion or erosion effect.
Conclusions Computational Fluid Dynamics (CFD) was used to
optimize nozzles’ location and orientation in a liquid
flashing column. Through a case study, many different
factors which impact the spray pattern in a column were
quickly investigated and prioritized. From pure numeri-
cal simulations, an installation plan was. This paper
tries to highlight the effectiveness of applying CFD
tools in such applications.
ACKNOWLEDGEMENTS The authors would like to acknowledge Mr. Wo-
jciech Kalata and Mr. Richard Gardner of Spraying
Systems Co. for their assistance with this project.
References
1. Fluent Inc. FLUENT 6.3 User’s Guide, 2007.
2. An Engineer's Guide to Spray Technology, Spraying
Systems Co. Bulletin 498
3. Spray Nozzle Drop Size: How to evaluate measure-
ment techniques and interpret data and reporting
procedures. G. P Ferrazza, J.W Bartell and R J.
Schick, Spraying Systems Co. Bulletin 336
4. R. J. Schick, “Spray Technology Reference Guide:
Understanding Drop Size”, Spraying Systems Co.
Bulletin 459B.
5. Launder, B.E. and Spalding, D.B., “The numerical
computation of turbulent flows,” Computer Methods in Applied Mechanics and Engineering, Vol. 3. pp.
269-289, 1974.
6. Morsi, S.A. and Alexander, A.J., “An Investigation
of Particle Trajectories in Two-Phase Flow Sys-
tems,” Journal of Fluent Mechanics, Vol. 55, pp.
193-208, 1972.
First simulation Second simulation
Vertical
tilt angle
Flap tilt
angle
Vertical
tilt angle
Flap tilt
angle
NA1 400 75
0 32
0 84
0
NA2 400 80
0 32
0 80
0
NC1 00 55
0 5
0 58
0
NC2 00 65
0 5
0 58
0
ND 00 55
0 5
0 58
0
NF 400 75
0 32
0 84
0
Spray angle 900 65
0
Table 1. Summary of nozzle orientation in the two simulations
Figure 5. Spray pattern in the fist simulation (a) without internal flow (b) with the internal flow
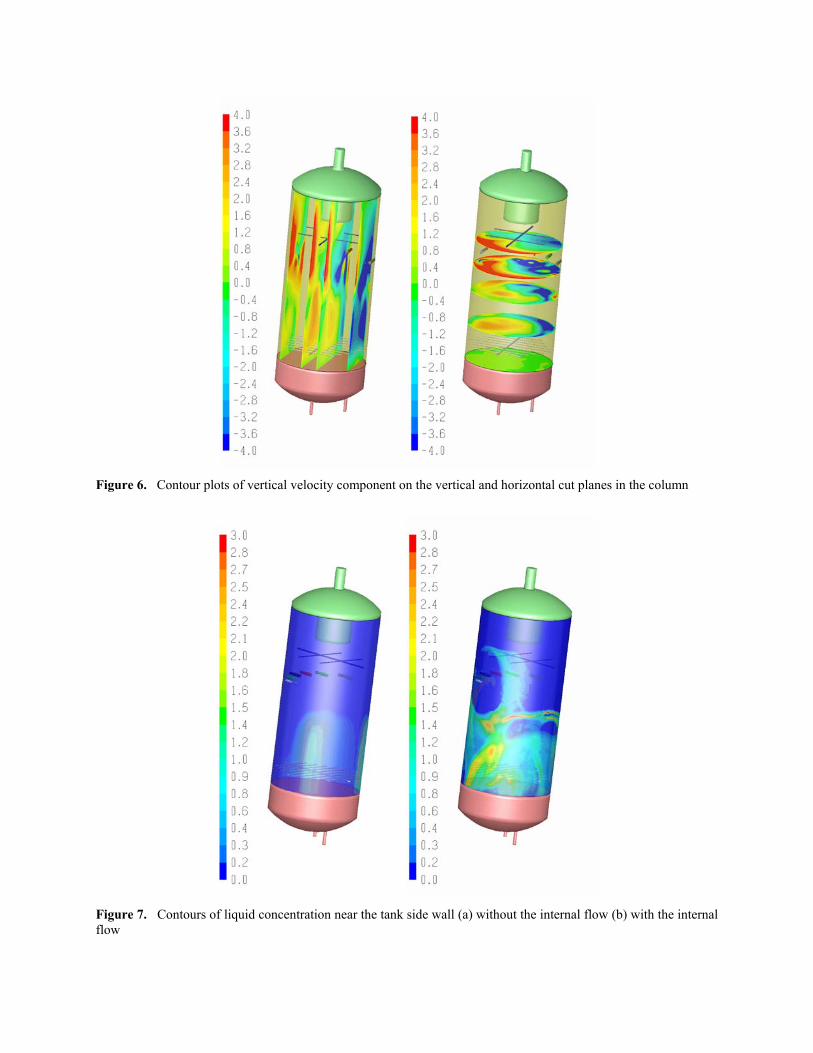
Figure 6. Contour plots of vertical velocity component on the vertical and horizontal cut planes in the column
Figure 7. Contours of liquid concentration near the tank side wall (a) without the internal flow (b) with the internal
flow
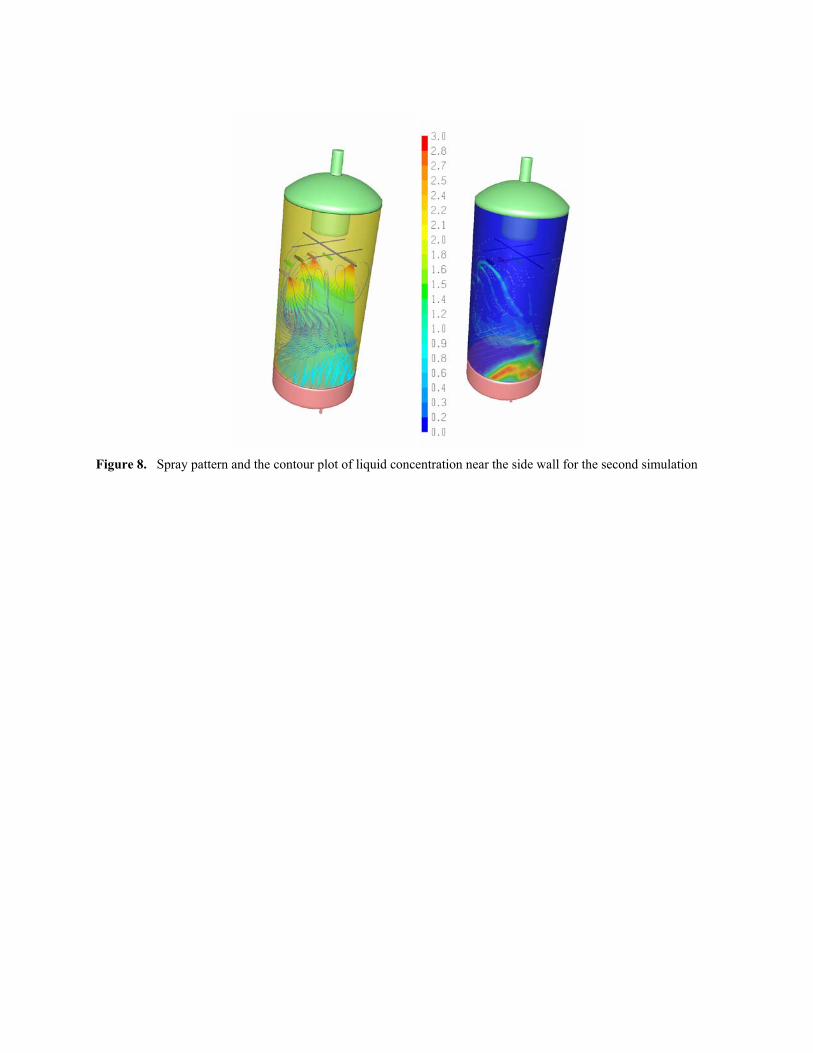
Figure 8. Spray pattern and the contour plot of liquid concentration near the side wall for the second simulation