Embed Size (px)
Citation preview


Mathematical and Computer Modelling 47 (2008) 1217–1237www.elsevier.com/locate/mcm
Numerical simulation of powder mixed electric discharge machining(PMEDM) using finite element method
H.K. Kansala,∗, Sehijpal Singhb, Pradeep Kumarc
a Department of Mechanical Engineering, SLIET Longowal, Punjab, 148001, Indiab Department of Mechanical and Production Engg, G.N.D.E.C. Ludhiana, Punjab, 147001, India
c Department of Mechanical and Industrial Engg, I.I.T. Roorkee, 247667, India
Received 14 March 2006; received in revised form 22 February 2007; accepted 22 May 2007
Abstract
In the present paper, an axisymmetric two-dimensional model for powder mixed electric discharge machining (PMEDM) hasbeen developed using the finite element method (FEM). The model utilizes the several important aspects such as temperature-sensitive material properties, shape and size of heat source (Gaussian heat distribution), percentage distribution of heat amongtool, workpiece and dielectric fluid, pulse on/off time, material ejection efficiency and phase change (enthalpy) etc. to predict thethermal behaviour and material removal mechanism in PMEDM process. The developed model first calculates the temperaturedistribution in the workpiece material using ANSYS (version 5.4) software and then material removal rate (MRR) is estimatedfrom the temperature profiles. The effect of various process parameters on temperature distributions along the radius and depth ofthe workpiece has been reported. Finally, the model has been validated by comparing the theoretical MRR with the experimentalone obtained from a newly designed experimental setup developed in the laboratory.c© 2007 Elsevier Ltd. All rights reserved.
Keywords: Powder mixed EDM; Temperature distributions; Finite element method; Material removal rate; Modeling; Simulation
1. Introduction
Electrical discharge machining (EDM) is one of most popular nonconventional machining processes used forcreating complex shapes within the parts and assemblies in the manufacturing industry [1]. Its unique feature of usingthermal energy to machine electrically conductive parts regardless of hardness has been its distinctive advantage.However, it suffers from few limitations such as low machining efficiency and poor surface finish. To overcome theselimitations, a number of efforts have been made to develop such EDM systems that have capability of high materialremoval rate (MRR), high accuracy and precision without making any major alterations in its basic principle [2–5].The techniques used in the past include (i) electrode rotating, (ii) electrode orbiting — planetary motion to toolor workpiece, (iii) applications of ultrasonic vibrations and (iv) suspension of foreign powders in the dielectric fluid.Among them, the mixing of a suitable material in powder form into the dielectric fluid is one of the latest advancement
∗ Corresponding author.E-mail addresses: [email protected] (H.K. Kansal), [email protected] (S. Singh), [email protected] (P. Kumar).
0895-7177/$ - see front matter c© 2007 Elsevier Ltd. All rights reserved.doi:10.1016/j.mcm.2007.05.016

1218 H.K. Kansal et al. / Mathematical and Computer Modelling 47 (2008) 1217–1237
for improving the capabilities of EDM process [5–8]. This process is called powder mixed EDM (PMEDM). In thisprocess, the electrically conductive powder particles are mixed in the dielectric fluid, which reduces its insulatingstrength and increases the spark gap distance between the tool and workpiece. The underlying idea is to spread theelectric discharge uniformly in all directions. As a result; the process becomes more stable thereby improving materialremoval rate (MRR) and surface finish.
The machining mechanism of EDM is complex as it involves numerous phenomena like heat conduction andradiation, phase changes, electrical forces, bubble formation and collapse, rapid solidification. Further the suspensionof powder particles into dielectric fluid makes it more complex and random. Several researchers have reported theeffect of various powder particles in dielectric fluid of EDM [9–14]. However, the key issue of machining mechanismof PMEDM i.e. the action of powder suspended into the dielectric fluid is not clearly understood. A lot of work hasbeen reported on the modeling of EDM [15–23]; however the role of powder suspended in the dielectric fluid of EDMhas to date remained unexamined.
In the present paper, an effort has been made to study the effect of powder suspended in the dielectric fluid of EDMon process performance. A standard FEM package, ANSYS version 5.4 has been used to develop a numerical modelof the PMEDM process [24]. The model considered the important aspects of the process such as temperature-sensitivematerial properties, type and nature of suspended powder, shape and size of heat source, percentage distribution ofheat between tool, workpiece and dielectric fluid, pulse on/off time, and material ejection efficiency. It accounts forphase change by introducing the enthalpy concept. The primary innovation is the two-dimensional axisymmetrictransient thermal analysis, including the study of the phase transformation due to highly localized heating and coolingeffects of the discharge phenomenon on the workpiece surface. The effect of different PMEDM process parameterson temperature distribution has also been examined. The model has been validated using experimental values.
2. Numerical solution
In PMEDM, a series of rapid, repetitive and randomly distributed discrete electric sparks occur in the gap betweentool and work electrodes for a cycle of few microseconds. Addition of powder particles into the dielectric fluid makesthis process more complex and random. The following assumptions are made without sacrificing the basic features ofthe EDM model to make the problem mathematically feasible.
2.1. Assumptions
1. The model is developed for a single spark.2. The thermal properties of workpiece material are considered as a function of temperature. It is assumed that due
to thermal expansion, density and element shape are not affected [25].3. To avoid the sharp changes in the heat capacity due to melting, enthalpy of the metal is considered as a function
of temperature [26].4. The heat source is assumed to have Gaussian distribution of heat flux on the surface of the workpiece [19,20].5. The Material flushing efficiency is assumed to be 20% [19,20].6. Conduction is considered as the mode of heat transfer to the electrodes.7. The work domain considered is axisymmetric about r–z plane.8. The composition of the material of workpiece is assumed to be homogeneous and isotropic [23].9. Temperature analysis is considered to be of transient type [23,27].
10. The workpiece is free from any type of stress before PMEDM.
2.2. Thermal model
The discharge phenomenon in EDM can be modeled as the heating of the work electrode by the incident plasmachannel. Fig. 1 shows the idealized case where workpiece is being heated by a Gaussian type of heat source. Themode of heat transfer in solid is conduction.

H.K. Kansal et al. / Mathematical and Computer Modelling 47 (2008) 1217–1237 1219
Fig. 1. Schematic sketch of Gaussian heat distribution in PMEDM.
2.2.1. Governing equationThe differential equation governing the heat conduction in an axisymmetric solid surface is given by [28]:
ρCP∂T
∂t=
[1r
∂
∂r
(Kr
∂T
∂r
)+
∂
∂z
(K
∂T
∂z
)](1)
where, ρ is the density, CP is the specific heat and K is the thermal conductivity of the work material, T is thetemperature, t is the time and r and z are coordinate axes shown in Fig. 1.
2.2.2. Heat distributionFor analytical tractability, many authors have used uniform disc heat source [15–18]. However, DiBitonto et al.
[19–21] and Bhattacharya et al. [22] have shown that Gaussian heat distribution is more realistic than disc heat source.Moreover, the assumption of Gaussian distribution is well-accepted for modeling the heat input in EDM. Therefore,Gaussian heat distribution has been considered in the present work (Fig. 1).
2.2.3. Boundary conditionsThe workpiece is symmetric about z-axis, so taking advantage of its symmetry; a small half-plane is cut from the
workpiece (CDEF) with negligible thickness. The considered workpiece domain is shown in Fig. 2. In the domain, heatflux for a single spark is applied on the surface B1 up to spark radius R using Gaussian distribution. On the remainingregion on B1 surface, the convection heat transfer takes place due to the cooling effect caused by the powder mixeddielectric fluid. As the boundaries B2 and B3 are very far from the spark radius and also the spark has been made tostrike for a very little moment, no heat transfer conditions have been assumed for them. For B4, which is the axis ofsymmetry, the heat flux has been taken as zero as there is no net heat gain or loss from this region.
In summary, the boundary conditions are given as follows:
1. For boundary B1:Up to spark radius, R:
K∂T
∂z= QW (r).
Beyond spark radius, R:
K∂T
∂z= h(T − T0).
2. For boundary B2, B3, B4:
∂T
∂n= 0
where, h is the heat transfer coefficient between the workpiece surface and powder mixed dielectric, QW (r) is the heatflux owing to the spark, T0 is the initial temperature which is equal to room temperature and T is the temperature.

1220 H.K. Kansal et al. / Mathematical and Computer Modelling 47 (2008) 1217–1237
Fig. 2. Heat transfer model for PMEDM.
2.2.4. Shape of the domainAs the tool and the workpiece have been assumed to be thermally isotropic, therefore, the heat distribution would
be Gaussian in nature on the surface of both workpiece and tool. Furthermore, the domain ∃, upon which the heat fluxis incident is assumed to grow with time.
2.2.5. Material propertiesPMEDM is a thermal process where huge thermal energy is generated. This causes instant rise in the workpiece
temperature up to boiling point of the material and a subsequent decrease to room temperature. The abrupt changein the temperature severely affects the properties of the material. In this research work, the variations in the materialproperties with temperature are taken into account. The material of the workpiece considered in this study is highcarbon high chrome (comparable to AISI D2) die steel. The chemical composition of work material and its variousproperties (mechanical and thermal) are mentioned in Table 1.
2.2.6. Heat input to workpieceEarlier EDM models assumed that the total heat supplied on the surface is transferred to the workpiece and no heat
is lost to the dielectric fluid and tool electrode [15–18,22,29]. However this assumption was not realistic. DiBitontoet al. [19] and Patel et al. [20] have assumed that a constant fraction of the total applied heat is lost to the electrodes.They predicted that about 8% of the total heat supplied is absorbed by anode; about 18% is absorbed by cathode andthe rest is discharged to the dielectric fluid. Shanker et al. has calculated that 40%–45% of the heat input is absorbedby the workpiece [27]. However all the calculations have been made using water as the dielectric fluid and at differentprocessing conditions.
As explained earlier, the powder particles suspended into the dielectric fluid increase the electrical conductivity ofthe dielectric fluid and help to spread the discharge uniformly in all directions. As a result, the fraction of the energytransferred to the workpiece (RW ) may be larger than that of EDM. However, there is no theoretical and experimentalmethod to calculate the value of RW during PMEDM. In the present model; it has been assumed that 9% of the totalheat is lost to the workpiece.
2.2.7. Material flushing efficiencyMost of the existing modeling studies on EDM have assumed that the material flushing efficiency (MFE) is 100%
i.e. all the molten metal is removed from the crater produced on the surface. However, experimental results have shownthat not all the molten metal is ejected [19,20]. In fact, only 10%–30% is actually ejected. As a result, deviations ofexperimental results from theoretical results are often observed. In the present work, the MFE is assumed to be 20%.

H.K. Kansal et al. / Mathematical and Computer Modelling 47 (2008) 1217–1237 1221
Table 1Chemical composition mechanical and thermal properties of AISID2 die steel
Chemical composition
Element C Si Mn W V Mo Cr% 1.52 0.3 0.3 0.5 0.10 0.8 12
Mechanical properties
Density, ρ 7700 kg/m3
Young’s modulus, E 208 GN/m2
Melting temperature, Tm 1984 KReference temperature, To 298 KPoisson’s ratio, υ 0.3Max. yield strength, Syield 3300 MPaLatent heat melting, Lm 2746 kJ/kgLatent heat for evaporation, Lev 1586 kJ/kg
Thermal properties
Temperature (K) Th conductivity (W/m ◦C) Coefficient of thermal expansion(/◦C)
Specific heat(J/kg/K)
298 29.0 5.71 × 10⁻⁶ 412.21673 29.5 6.90 × 10⁻⁶ 418.36
1100 30.7 10.20 × 10⁻⁶ 421.831990 32.3 12.00 × 10⁻⁶ 431.00
2.2.8. Spark radiusIt is well-established that the size of plasma channel is not a constant but it grows with time [19]. Its growth depends
upon various factors such as electrode material, electrode arrangement and polarity [30]. Some researchers have triedtheoretically and experimentally to determine the spark radius (R) in EDM [15,31]. DiBitonto et al. have calculatedthe radius of the discharge channel mathematically in the form of integral equation for rectangular pulses [19]. Erdenfurther integrated this equation and found that the radius of discharge channel R(t) is dependent on the dischargepower and time according to relationship [32]:
R(t) = Z Pm tn (2)
where, P is the discharge power, t is time and Z , m and n are empirical constants, with Z being a function of thedischarge length. Further these constants have been defined in terms of experimental coefficients L , M and N as:
Z =L
lm + 0.5N; m = M + 0.5N and n = N (3)
where, l is the discharge length.Further, to predict the two-dimensional shape of the arc of plasma channel, Ayyaswamy et al. [33] and Cohen
et al. employed a “tanh” (hyperbolic tangent) model [34]. Shanker et al. have predicted the arc radii at differentcross-sections of the plasma channel [27].
In PMEDM, the powder mixed into the dielectric fluid helps the discharge to spread uniformly in all directions,resulting in an enlarged and widened discharge channel. Experimental studies on PMEDM revealed that the sparkgap is enlarged and widened by a factor of 2 or 3 of conventional EDM [35–39]. Further, Zhao et al. haveshown that addition of powder into dielectric fluid of EDM helps to produce small and shallow craters on thesurface of workpiece [5]. However, a reliable and realistic method of determining the spark radius by eithertheoretical/experimental analysis has not been reported. In this work, the radius of the spark for PMEDM is takento be 30%–50% larger than that found by Shankar et al. [27].
2.2.9. Latent heatIn EDM, the electrode (tool) and workpiece are repeatedly heated above the melting points and are allowed to cool
in the dielectric fluid. This causes a change in the phase of the material. The phase change requires an energy input

1222 H.K. Kansal et al. / Mathematical and Computer Modelling 47 (2008) 1217–1237
Fig. 3. Spark frequency in: (a) EDM, (b) PMEDM.
equivalent to the latent heat. In the present work, the effect of latent heat is considered to make the model more realisticand reliable. Therefore, specific heat for melting and evaporation are modified as given below by incorporating thelatent heat of melting and evaporation [22].
Cm = CP +Lm
21Tfor Tm − 1T ≤ T ≤ Tm + 1T (4)
and
Cev = Cm +Lev
21Tfor Tev − 1T ≤ T ≤ Tev + 1T (5)
where, CP is specific heat of workpiece, Cm is specific heat in melting state, Cev is specific heat in evaporation state,Lm is latent heat due to melting and Lev is latent heat due to evaporation.
2.2.10. Spark frequency and breakdown voltageSpark frequency is a measure of the number of times the discharge strikes against the surface of the workpiece. In
the case of PMEDM, the powder suspended in the dielectric fluid gets energized and behaves in a zigzag fashion.The suspended powder particles enlarge and widen the spark gap between both the electrodes and change theionization–deionization characteristics of the dielectric fluid as shown in Fig. 3. With increase in the gap distance, anappropriate reduction in the breakdown voltage (electrostatic capacity) occurs, which results in more discharges perunit time (spark frequency). Experimentally, it has been found that in PMEDM, the discharge frequency is about 2–3times higher than that in EDM, whereas the breakdown voltage is about 20%–30% lower than that for EDM process [5,35,37]. The increased spark frequency and reduced voltage produce more small and shallow craters i.e. more evenmachining is achieved. The reason being that energy available for material removal during a given period is sharedby large number of powder particles and the magnitude of the impact force, which acts on the workpiece surface, issmaller than the conventional EDM. Fig. 3(a) shows that the size of the crater produced by EDM is big and its surfaceis rough. However, in PMEDM, the craters are shallow and smaller in size (see Fig. 3(b)).
To take into account the effect of powder on spark frequency and breakdown voltage, a new parameter, Kn , isintroduced into the heat flux equation (the derivation of which is presented in Section 2.2.11). The value of Kn ,depends upon the type of powder, powder properties such as shape, size, concentration etc. In the present work, theparameter Kn , is estimated empirically by conducting experiments with graphite powder mixed dielectric fluid andwithout powder (conventional EDM) under the same machining conditions.
2.2.11. Heat fluxMost researchers have considered the hemi-spherical disc heat source for thermal modeling in EDM. However, this
approximation is neither realistic nor reliable. It has been reported in [19–22] that the isothermal curves obtained forEDM thermal model can be accurately approximated by Gaussian distribution. Yadava et al. have reported a heat flux

H.K. Kansal et al. / Mathematical and Computer Modelling 47 (2008) 1217–1237 1223
Fig. 4. Gaussian distribution.
equation for EDM considering the Gaussian distribution [23]. To consider the effect of suspended powder particlesinto dielectric fluid on PMEDM, the same has been modified as given below:
The probability density function (pdf) of Gaussian distribution for a random variable r is shown in Fig. 4 and isgiven by the relation [39]:
p(r) =1
√2πσ
e−r2
2σ2 (6)
where, 1√
2πσis the peak value of the distribution and σ is the standard deviation.
Since the Gaussian curve does not mathematically become zero until infinity, it becomes necessary to select somefinite large value of its argument to represent the bottom of the crater. Usually six times of σ (−3σ to +3σ ) is taken fordropping the response to 0.25% of its initial value i.e. 99.75% of the values lies between r = µ − 3σ and r = µ + 3σ
(see Fig. 4). The profile of a three-dimensional crater can be obtained by rotating the Gaussian curve around thevertical axis.
Therefore, R = 3σ . Substituting the value of σ into Eq. (6)
p(r) =3
√2π R
e−4.5 r2
R2 . (7)
In PMEDM, p(r) is the intensity of heat imparted to the workpiece surface, which is denoted by QW and is afunction of r .
At r = 0, p(r) = Q0;
where Q0 is the maximum intensity of heat applied at the center of the workpiece. Therefore, the heat flux of thesystem (Eq. (7)) is given by
QW (r) = Q0e−4.5 r2
R2 . (8)
Thus the energy incident on the workpiece is∮Qw(r)dA =
∫ R
0Qw(r)2πrdr
=
∫ R
0Q0e−4.5 r2
R2 2πrdr

1224 H.K. Kansal et al. / Mathematical and Computer Modelling 47 (2008) 1217–1237
= −π R2
4.5Q0e−4.5 r2
R2
∣∣∣∣R
0
=π R2 Q0
4.5(1 − e−4.5)
= 0.2191π Q0 R2. (9)
The rate of energy incident on the workpiece is equal to the rate of energy supplied which is
RW Vb I Kn (10)
where, RW is the fraction of heat input to the workpiece, Vb is the breakdown voltage, I is the current and Knis new parameter introduced to take into account the effect of suspended powder particles on the spark frequencyand breakdown voltage. The value of Kn depends upon the type of powder, powder properties such as shape, size,concentration etc.
Therefore,
RW Vb I Kn = 0.2191π Q0 R2
or
Q0 =4.57Kn Vb I RW
π R2 . (11)
Upon substitution of Eq. (11) into (8),
QW (r) =4.57Kn Vb I RW
π R2 e−4.5( rR )
2. (12)
2.3. Applications of FEM in thermal modeling of PMEDM
Finite Element Method (FEM) is a powerful tool for obtaining the approximate solution of real engineeringproblems [40]. It can handle wide range of engineering problems of complex geometry, materials, loading andboundary conditions. It uses discretization of a continuum domain into finite numbers of parts called elements andseeks solution at discrete points of the domain (nodes) using certain interpolation functions to approximate the primaryvariables over various elements of the domain.
For PMEDM analysis, the heat conduction Eq. (1) is required to be converted into FEM form and can be writtenin differential form as:
ρCP
(∂T
∂t
)+ {L}
T{QW } = 0 (13)
where, ρ is density, CP is specific heat, T is temperature and t is time and
{L} =
∂
∂r1r
∂
∂θ∂
∂ Z
= Vector operator, {QW } =
QrQθ
Q Z
= Heat flux vector.
For simplified analysis, the problem is made axisymmetric and the final geometry is reduced to a two-dimensionaldomain. Therefore, the vector operator and heat flux vector are reduced to two-dimensional forms as given below:
{L} =
∂
∂r∂
∂ Z
, {QW } =
{QrQ Z
}.

H.K. Kansal et al. / Mathematical and Computer Modelling 47 (2008) 1217–1237 1225
The variable T is allowed to vary in both space and time. This dependency is separated as:
T = {N }T
{Te} (14)
where, {N } = Element shape function vector, {Te} = Element’s Nodal temperature vectorFurther, the time derivatives of Eq. (14) may be written as:
∂T
∂t= T = {N }
T {Te
}= 0. (15)
After combining {L} with T , the expression for temperature (T ) can be written as:
{L} T = [B] {Te} (16)
where, [B] = Shape function derivative matrix evaluated at the integration points
= {L} {N }T .
Further, let δT be the small change in the temperature at the node. The δT can be written in a similar form to T
δT = δT Te {N }. (17)
Now, the variational statement becomes∫V
ρCP {δTe}T{N }{N }
T{Te}dV +
∫V{δTe}
T[B]
T[K ][B]{Te}dV
=
∫∃b
{δTe}T{N }QW d∃b +
∫∃b1
{δTe}T{N }h(T − {N }
T{Te})d∃b1 (18)
where, [K ] = conductivity matrix, ρ = density, CP = specific heat, V = volume, T = temperature, h = coefficientof heat transfer, ∃b is the domain of boundary element
{Te
}and {δTe} are nodal quantities which do not vary.
In Eq. (18), all the quantities are seen to be premultiplied by the arbitrary vector {δTe}T , this term can be dropped
from the resulting equation. Thus the Eq. (18) reduces to:
ρ
∫V
CP {N }{N }T{Te}dV +
∫V[B]
T[K ][B]{Te}dV
=
∫∃b
{N }QW d∃b +
∫∃b1
{N }h(T − {N }T{Te})d∃b1 . (19)
The Eq. (19) can be written in final assembled finite element form as:
[C P e]{Te
}+ ([K d
e ]) {Te} = {Qe} +{
Qce
}(20)
where,
[C P e] = ρ
∫V
CP {N }{N }T dV = Elemental capacitance (specific heat) matrix
[K de ] =
∫V[B]
T[K ][B]dV = Element diffusion conductivity matrix
{Qe} =
∫∃b
{N }QW d∃b = Element mass flux vector
{Qc
e
}=
∫∃b1
T h{N }d∃b = Element convection surface heat flow vector.
In differential form, the Eq. (20) can be written as:
[CG]{TG} + [KG]{TG} = {QG} (21)
1226 H.K. Kansal et al. / Mathematical and Computer Modelling 47 (2008) 1217–1237
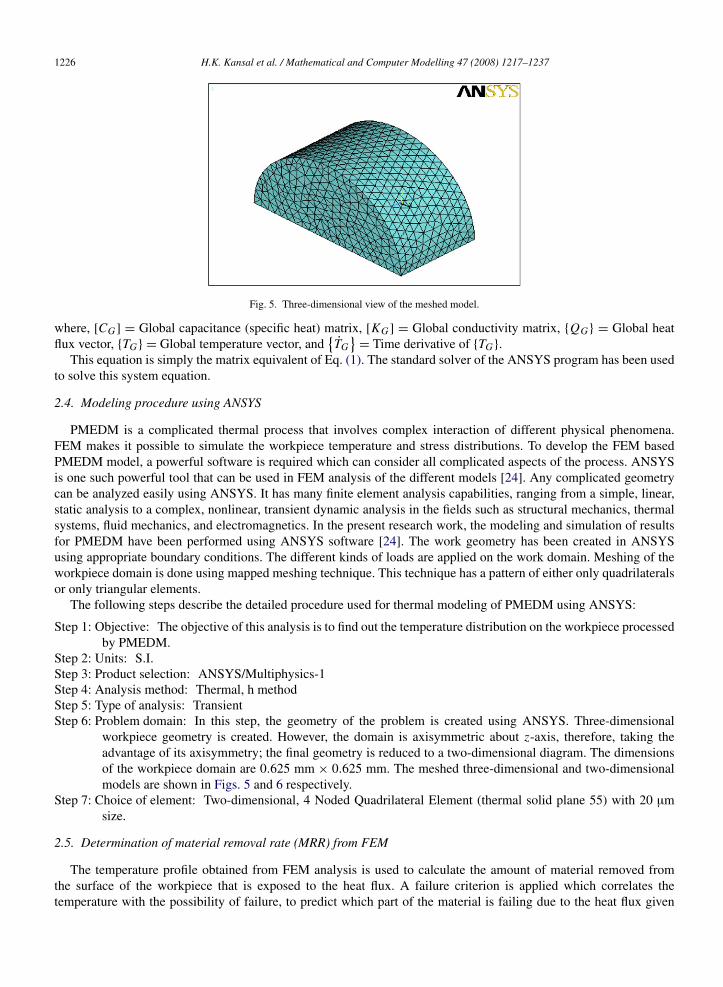
Fig. 5. Three-dimensional view of the meshed model.
where, [CG] = Global capacitance (specific heat) matrix, [KG] = Global conductivity matrix, {QG} = Global heatflux vector, {TG} = Global temperature vector, and
{TG
}= Time derivative of {TG}.
This equation is simply the matrix equivalent of Eq. (1). The standard solver of the ANSYS program has been usedto solve this system equation.
2.4. Modeling procedure using ANSYS
PMEDM is a complicated thermal process that involves complex interaction of different physical phenomena.FEM makes it possible to simulate the workpiece temperature and stress distributions. To develop the FEM basedPMEDM model, a powerful software is required which can consider all complicated aspects of the process. ANSYSis one such powerful tool that can be used in FEM analysis of the different models [24]. Any complicated geometrycan be analyzed easily using ANSYS. It has many finite element analysis capabilities, ranging from a simple, linear,static analysis to a complex, nonlinear, transient dynamic analysis in the fields such as structural mechanics, thermalsystems, fluid mechanics, and electromagnetics. In the present research work, the modeling and simulation of resultsfor PMEDM have been performed using ANSYS software [24]. The work geometry has been created in ANSYSusing appropriate boundary conditions. The different kinds of loads are applied on the work domain. Meshing of theworkpiece domain is done using mapped meshing technique. This technique has a pattern of either only quadrilateralsor only triangular elements.
The following steps describe the detailed procedure used for thermal modeling of PMEDM using ANSYS:
Step 1: Objective: The objective of this analysis is to find out the temperature distribution on the workpiece processedby PMEDM.
Step 2: Units: S.I.Step 3: Product selection: ANSYS/Multiphysics-1Step 4: Analysis method: Thermal, h methodStep 5: Type of analysis: TransientStep 6: Problem domain: In this step, the geometry of the problem is created using ANSYS. Three-dimensional
workpiece geometry is created. However, the domain is axisymmetric about z-axis, therefore, taking theadvantage of its axisymmetry; the final geometry is reduced to a two-dimensional diagram. The dimensionsof the workpiece domain are 0.625 mm × 0.625 mm. The meshed three-dimensional and two-dimensionalmodels are shown in Figs. 5 and 6 respectively.
Step 7: Choice of element: Two-dimensional, 4 Noded Quadrilateral Element (thermal solid plane 55) with 20 µmsize.
2.5. Determination of material removal rate (MRR) from FEM
The temperature profile obtained from FEM analysis is used to calculate the amount of material removed fromthe surface of the workpiece that is exposed to the heat flux. A failure criterion is applied which correlates thetemperature with the possibility of failure, to predict which part of the material is failing due to the heat flux given

H.K. Kansal et al. / Mathematical and Computer Modelling 47 (2008) 1217–1237 1227
Fig. 6. Two-dimensional view of the meshed model.
Table 2Process parameters for PMEDM
Parameter Value
Voltage, V 30 VCurrent, I 3.2–12 A with three levels (3.2, 6.5 and 12 A)Heat input to workpiece, RW 9%–20% with four levels (5%, 9%, 15% and 20%)Radius of spark, R 120 µmPulse duration, Ton 100–300 µs with three levels (100, 200 and 300 µs)Pulse off time, Toff 100–300 µs with four levels (50, 100, 200 and
300 µs)Type of flushing Side nozzle flushingPolarity +vePowder type and size Graphite, 30 µm in averageFrequency constant, Kn 2.4Powder concentration 2 g/lElectrode lift time 0.2 sTool electrode diameter 15 mm
on the workpiece surface. According to the failure criterion a region in the temperature profile is identified, where thetemperature is greater than the melting temperature of the workpiece material (1984 K). The material from that zonewhere temperature exceeds the melting temperature of the workpiece is assumed to be eroded due to spark.
3. Analysis and discussion of results
To obtain the results from the developed FEM model for PMEDM, AISID2 die steel is considered as the workpiecematerial and copper as a tool material. The AISID2 die steel is one of the most common tool steel used for EDMapplications and is machined best by copper electrode. The chemical composition, thermal and mechanical propertiesof AISID2 is mentioned in Table 1. The model is developed using the process parameters given in Table 2. Later, thedeveloped FEM model is validated by comparing the predicted theoretical results with the experimental data.
The predicted temperature isotherms for a single spark of PMEDM and EDM are shown in Figs. 7 and 8respectively. As expected, the predicted maximum temperature is located at the center, where intensity of heat fluxapplied is maximum. The magnitude of temperature decreases as we move away from the centerline.
The study of Figs. 7 and 8 reveals the following four distinct regions:
(a) boiling region (red colour),(b) liquid region (up to light green colour),(c) HAZ (up to light blue colour) and(d) Solid metal (blue colour).
It can be observed that the heat is spread to a longer distance in the workpiece machined by PMEDM as comparedto EDM under the same machining conditions. The size of the crater produced by PMEDM is longer in radial direction

1228 H.K. Kansal et al. / Mathematical and Computer Modelling 47 (2008) 1217–1237
Fig. 7. Temperature isotherms due to single spark of PMEDM process for the half-section of workpiece. (For interpretation of the references tocolour in this figure legend, the reader is referred to the web version of this article.)
Fig. 8. Temperature isotherms due to single spark of EDM process for the half-section of workpiece. (For interpretation of the references to colourin this figure legend, the reader is referred to the web version of this article.)
while the depth of crater is not changed appreciably in comparison to EDM. However, due to increase in dischargefrequency, the overlapping of craters takes place and craters look smaller in size. Therefore, it can be concluded that forthe same process parameters, smaller and shallower craters are produced by using PMEDM than by using EDM. Thisverifies the proposed machining mechanism of PMEDM i.e. the powder suspended into the dielectric fluid enlargesand widens the discharge channel which help to spread the heat uniformly in all directions, thereby improving thesurface finish at relatively high machining rates.
Further, the distribution of temperature and its level in the workpiece material depends upon various processparameters such as peak current, pulse duration, pulse off time, amount of energy input to workpiece, phase changeand type of powder suspended into the dielectric fluid of EDM. The effect of variation of these process parameters onthe temperature isotherms is explained below.
3.1. Effect of current
The variation of the surface temperature with distance (along radius and depth of workpiece) has been plotted forthree different values of peak current (3.2, 6.5 and 12 A) and is shown in Figs. 9 and 10. From these figures, it can be

H.K. Kansal et al. / Mathematical and Computer Modelling 47 (2008) 1217–1237 1229
Fig. 9. The effect of peak current on the temperature distribution along the radial direction from the centerline for PMEDM at Ton = 100 µs,Toff = 100 µs, V = 30 V, RW = 9%, and with graphite powder.
Fig. 10. The effect of peak current on the temperature distribution along depth of workpiece at the centerline for PMEDM at Ton = 100 µs,Toff = 100 µs, V = 30 V, RW = 9%, and with graphite powder.
observed that the top surface temperature goes on increasing with increase in current. This is because, the current is afunction of the heat energy transferred to the workpiece. The larger the current, the greater the heat energy generatedand transferred to the workpiece. Further, from Fig. 9, it can be seen that the distribution of temperature followsthe shape of Gaussian curve (bell shape). As expected, farther the distance from the workpiece surface, lower thetemperature. The considerable temperature gradient along the radial direction can be seen up to the radius of 140 µm.
The temperature variation along the depth of the workpiece is shown in Fig. 10. It can be observed that thetemperature is maximum at the top surface and decreases as we proceed downward. The workpiece material at thedepth of 50 µm looks very sensitive to be the house of residual stresses, because, in this region, the variation intemperature is very sharp. No variation in temperature is observed after a depth of 100 µm. Hence it can be concludedthat the material removal rate is more along the radial direction than along the depth resulting in shallow craters.
3.2. Effect of pulse duration
The effect of variation in pulse duration on surface temperature distribution in PMEDM along radius and depthare plotted in Figs. 11 and 12 respectively. From the trend of variation in surface temperature along the radius ofthe workpiece, it can be observed that with increase in pulse duration, the surface temperature also increases. It isobvious because, if heat is supplied for a longer time period, the temperature will be high. Further, near the point ofspark, the temperature is very high. It decreases slowly as we move away from the workpiece. It could be seen thatthe temperature variation is slow up to the radius of about 60 µm. Beyond 60 µm, the rate of decrement is high. Thereason being that as the heat flux is given for a longer period on workpiece surface, the temperature near the centerwill be high, but after that uniform heat dissipation occurs as the convection coefficient for the dielectric fluid is thesame.

1230 H.K. Kansal et al. / Mathematical and Computer Modelling 47 (2008) 1217–1237
Fig. 11. The effect of pulse duration on the temperature distribution along radius of workpiece from the centerline for PMEDM at I = 6.5 A,Toff = 100 µs, V = 30 V, RW = 9%, and with graphite powder.
Fig. 12. The effect of pulse duration on the temperature distribution along depth of workpiece from the centerline for PMEDM at I = 6.5 A,Toff = 100 µs, V = 30 V, RW = 9%, and with graphite powder.
Fig. 12 reveals that the temperature gradient is steeper than that along the radius. As we move deeper, the gradientfor the longer pulse duration is small as compared to the gradient for the short pulse duration. This may be attributedto the shorter time for heat dissipation which is less for each duty cycle for longer pulse duration.
3.3. Effect of pulse off time
Figs. 13 and 14 show the effect of variation of pulse off time on the temperature distribution in workpiece materialin PMEDM. The pulse off time is the time during which no energy is applied to the workpiece surface. The effectof pulse off time is studied by keeping the pulse duration constant. It is clear from the curves that the top surfacetemperature of the workpiece increases as the pulse off time decreases. This may be because, for short pulse off time,the time available for the application of heat energy on the workpiece surface will be long. Therefore, the material willbe eroded at faster rate. However, the appropriate selection of pulse off time is very important for stable machining;too short a pulse interval will result in arcing while too long an interval results in long machining times.
Further, from Fig. 14, it can be seen that the trend of distribution of temperature along the radial direction is almostsame for all the pulse off times. Very little difference is observed in temperature variation for 100 and 200 µs pulseoff times. Similar trend of temperature distribution has been obtained along the depth of the workpiece for differentpulse off values.
3.4. Effect of heat input to workpiece
As stated earlier, the heat input is the amount of heat energy transferred to the workpiece during machining. Theeffect of variation of heat input to workpiece along the radius and depth are shown in Figs. 15 and 16 respectively.From these figures, it can be observed that high surface temperature is attained at high value of energy partition.

H.K. Kansal et al. / Mathematical and Computer Modelling 47 (2008) 1217–1237 1231
Fig. 13. The effect of pulse off time on temperature distribution along radius of workpiece from the centerline for PMEDM at I = 6.5 A,Ton = 100 µs, V = 30 V, RW = 9%, and with graphite powder.
Fig. 14. The effect of pulse off time on temperature distribution along depth of workpiece from centerline for PMEDM at I = 6.5 A, Ton = 100 µs,V = 30 V, RW = 9%, and with graphite powder.
Fig. 15. The effect of heat input to workpiece on temperature distribution along radius at centerline of workpiece for PMEDM at I = 6.5 A,Ton = 100 µs, Toff = 100 µs, V = 30 V, and with graphite powder.
This is obvious because more amount of heat is transferred to the workpiece as large amount of heat is supplied to theworkpiece. Another observation that can be drawn from these figures is that with 9% of heat input to workpiece, nearly3000 K temperature is attained while, with 20% heat input, the top surface temperature is nearly 6000 K. In the formercase, surface temperature is sufficient for its proper and controlled machining as melting temperature of AISID2 isbelow 3000 K i.e. 1984 K while in the latter, huge amount of heat is generated which makes it very difficult to controlthe precise and accurate machining of the workpiece. The PMEDM machined workpieces have very smooth and glosssurface texture [35]. This would be possible only if controlled and precise machining occurs there. Therefore it canbe concluded that about 9% of heat energy partitioned to the workpiece is the sufficient amount of energy to producethe smooth craters. Further, the trend of variation in temperature is same for all the heat inputs to the workpiece.

1232 H.K. Kansal et al. / Mathematical and Computer Modelling 47 (2008) 1217–1237
Fig. 16. The effect of heat input to workpiece on temperature distribution along depth at centerline of workpiece for PMEDM at I = 6.5 A,Ton = 100 µs, Toff = 100 µs, V = 30 V, and with graphite powder.
Fig. 17. The effect of phase change on temperature distribution along radius of workpiece at I = 6.5 A, Ton = 100 µs, Toff = 100 µs, V = 30 V,RW = 9%, and with graphite powder.
The comparison of temperature distributions along radius and depth of workpiece shows that the temperature gradientis high along the radius as compared to depth. The room temperature has been attained at a radius of about 140 µm asshown in Fig. 15 while the same is attained at 100 µm distance along the depth (see Fig. 16). This confirms that theshape of craters in PMEDM is elongated along the radius than at the depth i.e. bell shape craters are produced.
3.5. Effect of phase change
EDM is the thermal process in which enormous amount of heat is generated. Due to generation of huge amountof heat energy on the workpiece surface, the change in phase of the material is expected. Figs. 17 and 18 depict theeffect of phase change on temperature distribution along radius and depth of workpiece. It can be observed that thetop surface temperature is high when the effect of phase change is not considered. The reason behind it is that no heatenergy is used to convert the state of material from solid to liquid and then to vapour. However, this does not happen inactual practice. Some part of the incident heat energy is always utilized for changing the state of the material. Further,temperature gradient is higher along the radius as compared to gradient along the depth of the workpiece when theeffect of phase change is considered.
4. Model validation
To validate the proposed model, few PMEDM experiments were conducted under the same machining conditions atwhich simulation results are obtained. The machining conditions are given in Table 2. The experiments are performedon a newly designed experimental setup developed in the laboratory. The theoretical MRR values calculated from thetemperature distributions were compared with the corresponding experimental MRR values. The experimental detailsfollow:

H.K. Kansal et al. / Mathematical and Computer Modelling 47 (2008) 1217–1237 1233
Fig. 18. The effect of phase change on temperature distribution along depth of workpiece at r = 100 µm at I = 6.5 A, Ton = 100 µs, Toff = 100 µs,V = 30 V, RW = 9%, and with graphite powder.
4.1. Experimental details
Experiments were conducted on a Mini G-30 die sinking EDM machine manufactured by ToolCraft India Ltd.Bangalore India. It is energized by A 15 type, 25-Ampere working current pulse generator and a controller to producerectangular shaped current pulses. The current dielectric circulation system of G-30 EDM machine needs about 60 lof dielectric fluid (kerosene) in circulation. The powder could not be mixed with the circulating fluid because it wouldthen be difficult to regulate the concentration of powder in the dielectric. Moreover, the system filter is liable tochoke due to the presence of powder particles and debris. To overcome these problems, a new experimental setup forPMEDM was designed and developed in the laboratory. The schematic of kinematic configuration of the PMEDMset-up is shown in Fig. 19(a) and is photographed as shown in Fig. 19(b).
The new PMEDM system was designed for 7 l of dielectric fluid for experimentation. It consists of a transparentbath-like container, called machining tank in which the machining is performed. It contains a fixture assembly forholding the workpiece. The machining tank is filled up with dielectric fluid (kerosene oil). To avoid particle settling,a stirring system is incorporated. A small dielectric circulation pump is installed there for proper circulation of thepowder mixed dielectric fluid into the discharge gap (power rating is 0.3H.P, flow rate 2 l/min and diameter of ejectornozzle is 4 mm). The pump and the stirrer are placed in the same tank in which machining is performed. The distancebetween powder mixed dielectric suction point and nozzle outlet is made short as possible (10 inches) in order toensure the complete suspension of powder in the discharge gap. Magnetic forces are used to separate the debrisfrom the dielectric fluid. For this purpose, two permanent magnets are placed at the bottom of machining tank. Theexperimental setup is demonstrated by the photograph shown in Fig. 19(b).
4.2. Workpiece and tool material
AISID2 die steel in fully annealed condition is selected as the workpiece material. The average hardness of thematerial was found to be 59HRC. Copper electrode with diameter 15 mm has been selected as the tool. The dimensionsof workpiece are 100 mm × 50 mm × 10 mm. The machining is performed in commercially available kerosene oilafter addition of graphite powder with average particle size 30 µm.
4.3. Validation
Fig. 20 presents the variation of MRR with pulse duration for EDM and PMEDM both theoretically andexperimentally. A good correlation (coefficient of correlation = 0.91) between the calculated and predicted MRRis found. This proves the validity of the present model. The values of MRR obtained for PMEDM are always higherthan the conventional EDM (both theoretically and experimentally). This is attributed to the powder suspension in thedielectric fluid of EDM that facilitates the uniform distribution of heat energy in all directions of the plasma channel.This produces relatively high machining rates.

1234 H.K. Kansal et al. / Mathematical and Computer Modelling 47 (2008) 1217–1237
Fig. 19. (a) Schematic diagram of experimental setup and (b) real photograph of experimental setup for PMEDM.
Fig. 20. Comparison between theoretical and experimental MRR for EDM and PMEDM.
5. Machining mechanism of PMEDM
On the basis of the results discussed for temperature distribution in the PMEDMed workpiece, the machiningmechanism for PMEDM is proposed.
A schematic diagram of the proposed mechanism of material removal in PMEDM is illustrated in Fig. 21. Whena voltage of 80–320 V is applied to both the electrodes, an electric field in the range 105–107 V/m is created. Thespark gap is filled up with additive particles and the gap distance between tool and the workpiece increases from

H.K. Kansal et al. / Mathematical and Computer Modelling 47 (2008) 1217–1237 1235
Fig. 21. Schematic representation of machining mechanism of PMEDM. (a) It is expected that the insulating strength of the dielectric fluiddecreases as powder is suspended into it. The spark gap distance is increased by many folds than normal EDM. It is proposed that the increase ingap might have caused wider discharge passages. (b) In a wider and enlarged plasma channel, the suspended powder particles share and redistributethe impact force. As a result, shallow, uniform and flat craters are formed on the workpiece surface.
25–50 µm to many times as shown in Fig. 21(a). The powder particles get energized and behave in a zigzag fashion.The grains come close to each other under the sparking area and gather in clusters. Under the influence of electricforces, the powder particles as shown in Fig. 21(b), arrange themselves in the form of chains at different places underthe sparking area. The chain formation helps in bridging the gap between both the electrodes. Due to the bridgingeffect, the gap voltage and insulating strength of the dielectric fluid decrease. The easy short circuit takes place, whichcauses early explosion in the gap. As a result, the ‘series discharge’ starts under the electrode area. Due to increasein frequency of discharging, the faster sparking within a discharge takes place which causes faster erosion from thework piece surface. At the same time, the added powder modifies the plasma channel. The plasma channel becomesenlarged and widened [5]. The electric density decreases; hence sparking is uniformly distributed among the powderparticles. As a result, even and more uniform distribution of the discharge takes place, which causes uniform erosion(shallow craters) on the workpiece. This results in an improvement in surface finish.
6. Conclusions
In this research paper, an axisymmetric two-dimensional thermal model was developed to predict the severalaspects of the PMEDM. Numerical calculations and experiments have been done to analyze and compare theperformance of EDM with PMEDM. The important features of the process such as temperature-sensitive materialproperties, shape and size of heat source (Gaussian heat distribution), percentage distribution of heat among tool,workpiece and dielectric fluid, pulse on/off time, material ejection efficiency and phase change (enthalpy) aretaken into account in the development of the model. Finite element method (FEM) has been used to analyze thetemperature profiles and material transformations that occur in the workpiece material due to high temperature, largedeformations and transient operation. The FEM based model has been developed and solved using software ANSYS.The simulation results show that the PMEDM produces smaller and shallower craters than EDM under the same setof machining conditions. The effect of various process parameters (such as current, pulse on time, pulse off time,energy partition and phase change) on temperature distribution for PMEDM has been analyzed. Further, from the

1236 H.K. Kansal et al. / Mathematical and Computer Modelling 47 (2008) 1217–1237
temperature distributions, the MRR is predicted. To validate the model, the predicted theoretical MRR is comparedwith the experimentally determined MRR values. An excellent agreement between experimental and theoretical resultshas been obtained.
The model developed in this research study for PMEDM can be further used to obtain the temperature distributions,residual stress distributions, metal flow and surface cracks on the PMEDMed machined workpieces. This means thatthe model can be used as an industrial tool to predict the evolution of temperature, stress, strain and cracks that mayoccur on the surface of the PMEDMed machined workpieces. The follow-up publications will consider the effect ofmultisparks and effect of various process parameters on the residual stress distributions and surface cracks.
Acknowledgements
The authors would like to acknowledge the support of M/S Electronica Machine Tools Ltd. Pune, India. We aredeeply thankful to Dr. V.K. Jain, Professor, Department of Mech. Engg; IIT Kanpur, Dr. B.K. Mishra, IIT Roorkee,Dr. V. Yadav, MNNIT, Allahabad and Er. Baljit Singh, PSEB for their guidance and expert comments in response toour queries and problems.
References
[1] O.A. Abu Zeid, On the effect of electro-discharge machining parameters on the fatigue life of AISI D6 tool steel, Journal of MaterialsProcessing Technology 68 (1) (1997) 27–32.
[2] P. Koshy, V.K. Jain, G.K. Lal, Experimental Investigations into electrical discharge machining with a rotating disc electrode, PrecisionEngineering 15 (1) (1993) 6–15.
[3] J.S. Soni, G. Chakraverti, Machining characteristics of Titanium with rotary electro-discharge machining, Wear 171 (1–2) (1994) 51–58.[4] Biing Hwa Yan, C.C. Wang, Han Ming Chow, Yan Cherng Lin, Feasibility study of rotary electrical discharge machining with ball burnishing
for Al2O3/6061Al composite, International Journal of Machine Tools and Manufacture 40 (10) (2000) 1403–1421.[5] W.S. Zhao, Q.G. Meng, Z.L. Wang, The application of research on powder mixed EDM in rough machining, Journal of Materials Processing
Technology 129 (2002) 30–33.[6] Y.F. Tzeng, C.Y. Lee, Effects of powder characteristics on electro discharge machining efficiency, International Journal of Advanced
Manufacturing Technology 17 (2001) 586–592.[7] H. Narumiya, N. Mohri, N. Saito, H. Otake, Y. Tsnekawa, T. Takawashi, K. Kobayashi, EDM by powder suspended working fluid, in: Proc.
9th International Symposium for Electrical Machining, CIRP, 1989, pp. 5–8.[8] N. Mohri, N. Saito, M. Higashi, A new process of finish machining on free surface by EDM methods, Annals of CIRP 40 (1) (1991) 207–210.[9] A. Erden, S. Bilgin, Role of impurities in electric discharge machining, in: Proc. 21st Int. Machine Tool Design and Research Conference,
Macmillan, London, 1980, pp. 345–350.[10] Q.Y. Ming, L.Y. He, Powder-suspension dielectric fluid for EDM, Journal of Material Processing Technology 52 (1995) 44–54.[11] M. Kunieda, K. Yanatori, Study on debris movement in EDM gap, International Journal of Electrical Machining 2 (1997) 43–49.[12] Y.F. Luo, The dependence of interspace discharge transitivity upon the gap debris in precision electro-discharge machining, Journal of
Materials Processing Technology 68 (1997) 127–131.[13] K Furutani, A. Saneto, H. Takezawa, N. Mohri, H. Miyake, Accertation of titanium carbide by electrical discharge machining with powder
suspended in working fluid, Precision Engineering 25 (2001) 138–144.[14] Yih-fong Tzeng, Chen Fu-chen, A simple approach for robust design of high-speed electrical-discharge machining technology, International
Journal of Machine Tool & Manufacture 43 (2003) 217–227.[15] R. Snoyes, F. Van Dijck, Investigations of EDM operations by means of thermo mathematical models, Annals of CIRP 20 (1) (1971) 35.[16] C.C. Marty, Investigations of surface temperature in electro discharge machining, Transactions of ASME, Journal of Engineering for Industry
(1977) 682–684.[17] A. Erden, B. Kaftanoglu, Heat transfer modeling of electric discharge machining, in: 21st MTDR Conference, Swansea, 1980, pp. 351–358.[18] S.T. Jilani, P.C. Pandey, Analysis and modeling of EDM parameters, Precision Engineering 4 (4) (1982) 215–221.[19] D.D. DiBitonto, P.T. Eubank, M.R. Patel, M.A. Barrufet, Theoretical models of the electrical discharge machining process. I. A simple cathode
erosion model, Journal of Applied Physics 66 (9) (1989) 4095–4103.[20] M.R. Patel, A. Barrufet, P.T. Eubank, D.D. DiBitonto, Theoretical models of the electrical discharge machining process—II: The anode
erosion model, Journal of Applied Physics 66 (9) (1989) 4104–4111.[21] P.E. Eubank, M.R. Patel, M.A. Barrufet, B. Bozkurt, Theoretical models of the electrical discharge machining process. III. The variable mass,
cylindrical plasma model, Journal of Applied Physics 73 (11) (1993) 7900–7909.[22] R. Bhattacharya, V.K. Jain, P.S. Ghoshdastidar, Numerical simulation of thermal erosion in EDM process, IE (I) Journal-PR 77 (1996) 13–19.[23] V. Yadav, V.K. Jain, P.M. Dixit, Thermal stresses due to electrical discharge machining, International Journal of Machine Tools and
Manufacturing 42 (2002) 877–888.[24] ANSYS Advanced analysis procedure manual, ANSYS 5.4, ANSYS Inc., Canonsburg, Pennsylvania c© SAS IP, Inc.[25] Shuvra Das, Mathias Klotz, F. Klocke, EDM simulation: Finite element-based calculation of deformation, microstructure and residual stresses,
Journal of Materials Processing Technology 142 (2003) 434–451.
H.K. Kansal et al. / Mathematical and Computer Modelling 47 (2008) 1217–1237 1237
[26] K. Morgan, R.W. Lewis, O.C. Zienkiewicz, An improved algorithm for heat conduction problems with phase change, International Journal ofNumerical Method Engineering 12 (7) (1978) 1191–1195.
[27] P. Shankar, V.K. Jain, T. Sundarajan, Analysis of spark profiles during EDM process, Machining Science Technology 1 (2) (1997) 195–217.[28] D.S. Kumar, Heat and Mass Transfer, 10th edition, S.K. Kataria & Sons, Delhi, 2000.[29] P. Madhu, V.K. Jain, T. Sundararajan, K.P. Rajurkar, Finite element analysis of EDM process, Processing of Advanced Materials 1 (1991)
161–173.[30] H.P. Schulze, R. Herms, H. Juhr, W. Schaetzing, G. Wollenberg, Comparison of measured and simulated crater morphology for EDM, Journal
of Materials Processing Technology 149 (2004) 316–322.[31] R. Snoyes, F. Van Dijck, Plasma channel diameter growth affects stock removal, Annals of CIRP 21 (1) (1972) 39–40.[32] A. Erden, Effect of materials on the mechanism of electric discharge machining (EDM), Transactions of ASME, Journal of Engineering
Materials and Technology 108 (1983) 247–251.[33] P.S. Ayyaswamy, G.C. Das, I.M. Cohen, Thermal and electrical characteristics of a 2D ‘Tanh’ conductivity arc, Journal of Applied Physics
49 (1) (1978) 160–165.[34] I.M. Cohen, P.S. Ayyaswamy, T. Sundararajan, Effect of plug flow on the stability of 2D arcs, IEEE Transactions of plasma Science PS-8 (4)
(1980) 390–394.[35] Y.S. Wong, L.C. Lim, Iqbal Rahuman, W.M. Tee, Near-mirror-finish phenomenon in EDM using powder-mixed dielectric, Journal of Materials
Processing Technology 79 (1998) 30–40.[36] J. Kozak, M. Rozenek, L. Dabrowski, Study of electrical discharge machining using powder suspended working media, Proceedings of
Institution of Mechanical Engineers, Part-B 217 (2003) 1597–1602.[37] P. Pecas, Almedia E. Henriques, Emerging technologies in penetration EDM, O Molde 55 (2002) 26–36.[38] Y. Uno, A. Okada, Surface generation mechanism in electrical discharge machining with silicon powder mixed fluid, International Journal of
Electro Machining 2 (1997) 13–18.[39] A. Papoulis, Probability Random Variables and Stochastic Processes, McGraw Hill, New York, 1991.[40] C.S. Desai, J.F. Abel, Introduction to the Finite Element Method, 1st edition, CBS Publishers and Distributors, Delhi, 1987.


![Experimental Investigations on Powder Mixed Electric ... › research › experimental... · II. LITERATURE REVIEW Kunieda et al [1] reports that compared to other discharge phenomena](https://img.pdfslide.us/doc/110x75/5f233e0549465c3c7c251ae5/experimental-investigations-on-powder-mixed-electric-a-research-a-experimental.jpg)
![Parametric Optimization of PMEDM Process using Chromium ... · Researchers explained the working principle of powder mixed electrical discharge machining process [1, 14]. When a voltage](https://img.pdfslide.us/doc/110x75/5fa568ac831c7430cb27d415/parametric-optimization-of-pmedm-process-using-chromium-researchers-explained.jpg)