Embed Size (px)
Citation preview
Powder Technology 205 (2011) 15–29
Contents lists available at ScienceDirect
Powder Technology
j ourna l homepage: www.e lsev ie r.com/ locate /powtec
Numerical simulation of particle breakage of angular particles using combined DEMand FEM
A. Bagherzadeh Kh. ⁎, A.A. Mirghasemi, S. MohammadiSchool of Civil Engineering, College of Engineering, University of Tehran, Tehran, Iran
⁎ Corresponding author. No.1, Khoddami Ave., VanakP.O. Box 19395-4691. Tel.: +98 21 8478 2082, fax: +98
E-mail address: [email protected] (A. Baghe
0032-5910/$ – see front matter © 2010 Elsevier B.V. Aldoi:10.1016/j.powtec.2010.07.034
a b s t r a c t
a r t i c l e i n f oArticle history:Received 21 January 2008Received in revised form 14 June 2010Accepted 29 July 2010Available online 16 August 2010
Keywords:DEMFEMParticle breakageRockfillMarsal's breakage factorq–v–p behavior
One of the effective parameters of the behavior of rockfill materials is particle breakage. As a result of particlebreakage, both the stress–strain and deformability of materials change significantly. In this article, a novelapproach for the two-dimensional numerical simulation of the phenomenon in rockfill (sharp-edgeparticles) has been developed using combined DEM and FEM. All particles are simulated by the discreteelement method (DEM) as an assembly and after each step of DEM analysis, each particle is separatelymodeled by FEM to determine its possible breakage. If the particle fulfilled the proposed breakage criteria,the breakage path is assumed to be a straight line and is determined by a full finite element stress–strainanalysis within that particle and two new particles are generated, replacing the original particle. Theseprocedures are carried out on all particles in each time step of the DEM analysis. Novel approach for thenumeric of breakage appears to produce reassuring physically consistent results that improve earlier madeunnecessary simplistic assumptions about breakage. To evaluate the effect of particle breakage on rockfill'sbehavior, two test series with and without breakable particles have been simulated under a biaxial test withdifferent confining pressures. Results indicate that particle breakage reduces the internal friction butincreases the deformability of rockfill. Review of the v–p variation of the simulated samples shows that thespecific volume has initially been reduced with the increase of mean pressures and then followed by anincrease. Also, the increase of stress level reduces the growing length of the v–p path and it means that thedilation is reduced. Generally, any increase of confining stress decreases the internal friction angle of theassembly and the sample fail at higher values of axial stresses and promotes an increase in the deformability.The comparison between the simulations and the reported experimental data shows that the numericalsimulation and experimental results are qualitatively in agreement. Overall the presented results show thatthe proposed model is capable with more accuracy to simulate the particle breakage in rockfill.
Sq., Tehran, Iran-1994753486,21 84782083.
rzadeh Kh.).
l rights reserved.
© 2010 Elsevier B.V. All rights reserved.
1. Introduction
Particle breakage, designated to describe the fracture of theconstituent components (grains) of a soil structure, has beenfrequently observed in various soil-rockfill masses such as rockfilldams. Several laboratory oriented research tests [1–4], have shownthat many engineering characteristics of granular materials such asstrength (stress–strain), deformability, pore pressure distribution andpermeability are greatly influenced by the level of breakage ofmaterials [1,2]. Marsal [3,4], who was perhaps the first to deal withthe concept of crushing of particles through large-scale triaxial tests,summarized the phenomenon of breakage in rockfills as, “It seemsthat phenomenon of fragmentation is an important factor thatimpacts shear resistance and potentiality of compaction of grain
materials and this phenomenon is effective on aforesaid parameters indifferent conditions of implementing stresses such as confiningpressure stage or stage of divertive loading in triaxial test.”
2. Breakage of particle
In a granular medium, the interaction forces are transferredthrough the contact between particles. This phenomenon becomesmore complicated because of the different geometrical shapes andvariousmineralogy of these particles. In 1921, Griffith [quoted from 4]suggested a theory for considering the breakage path within a brittleparticle based on the main assumption that fracture occurs due togradual expansion of pre-existing cracks. Studies of Joisel (1962)[quoted from 4] on crushing within a particle resulted in presenting asimple model for breakage based on the elastic modulus of differentminerals of that particle. This model could only describe the breakagepath under uniaxial pressure. In 1973, Marsal [4] presented anequation by comparing the results of the studies of Joisel and Griffithfor calculation of a load required for crushing a particle.
BC
A
Fn
sF
xFB
C
A
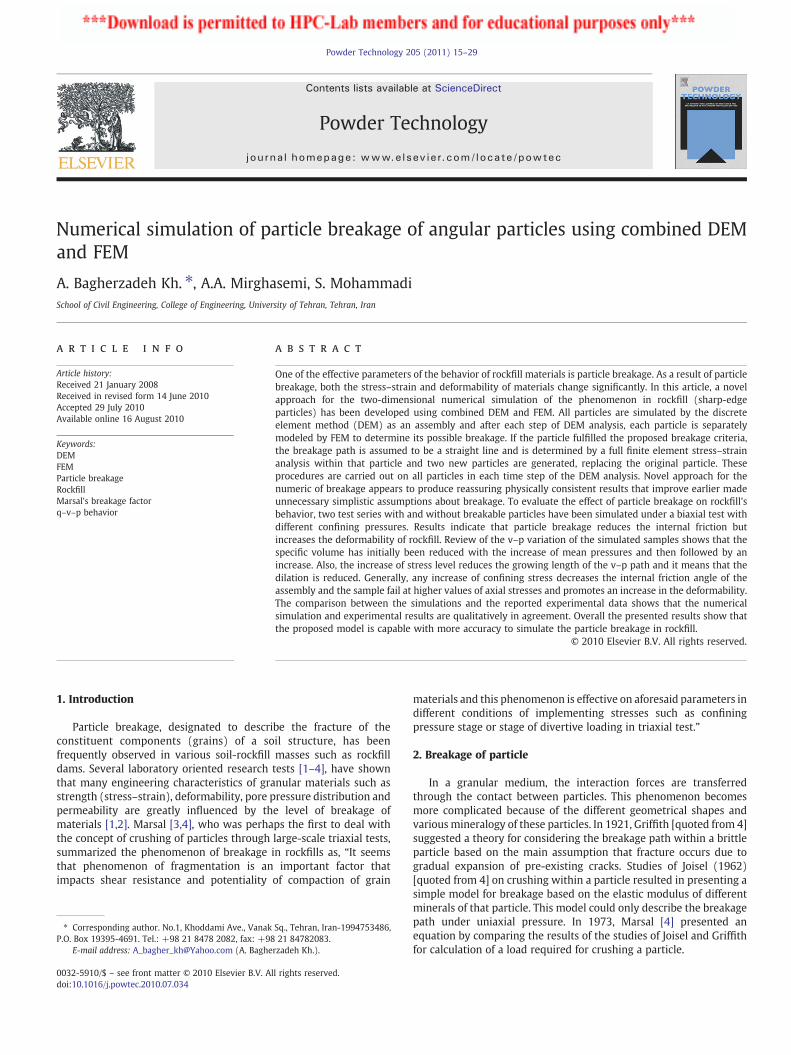
Fig. 1. Boundary and loading conditions on a particle with 3 contacts.
16 A. Bagherzadeh Kh. et al. / Powder Technology 205 (2011) 15–29
Several researchers have studied the ratio of principal stresses (σ1/σ3) imposed on different rock materials at failure by triaxial tests [5].In an overall view, the ratio of principal stresses and the quantity of sin(ϕ), which is an indicator of shear strength, reduce by an increase inthe amount of particle breakage. The mobilized internal friction angleof granular soils can then be calculated as follows [3–5]:
Sin φð Þ = σ1−σ3
σ1 + σ3=
σ1σ3
− 1σ1σ3
+ 1: ð1Þ
Other studies have concluded that any increase of particlebreakage leads to a reduction in void ratio and therefore the materialbecomes more deformable. Marsal believed that changes in void ratiowere due to new arrangement of grains after breakage and filling up ofvoid spaces with smaller broken pieces. Lade and Yamamuro came tothe conclusion from tests on sand with different confining pressures(from 0.5 to 70 MPa) that the breakage of particles played the majorrole in changing the volume of materials under high pressures [1,6].
3. A brief review on simulation of particle breakage
Cundall, a pioneer of using DEM (discrete element method) instudying the behavior of granular media and stability of rock slopes,developed the RBMC code in which the breakage mechanism of rockblocks was simulated similar to that of a Brazilian test [7,8]. In thiscode, in each cycle of simulation from the set of all point loads appliedto each block, the application point and magnitude of the twomaximum loads, which are applied in opposite directions, aredetermined.
σ1f σ1f
σ1
σ1
σ1σ1
σ3
σc
σ t
SF=
Fig. 2. Definition of the safety factor.
Potapov and Campbell [9,10] have studied the breakage induced ina single circular particle that impacts on a solid plate and the brittleparticle attrition in a shear cell. In both simulations, a breakable solidmaterial is created by attaching unbreakable and non-deformablesolid triangular elements. It is assumed that a cohesive joint can onlywithstand normal tensile stress up to some limit. If the tensile stresson any portion of the joint exceeds the limit, the cohesion along thatportion is removed and can no longer bear any tensile stress; creatinga crack along that portion.
In an alternative approach and in order to study the process offragmentation in two-dimensional brittle blocks, Kun and Hermann[11] considered each block as a mesh of inter-connected tiny cellslocated within that block. Such a cellular mesh is generated by the useof a randomprocess (Voronoi Construction). Each cell is a rigid convexpolygon that as the smallest component of the block neither breaksnor deforms and acts as a distinct element of other cells. Cells haveone rotational and two linear degrees of freedom in the block planeand their behavior in contact is simulated by DEM.
In order to study the influence of particle breakage on macro- andmicro-mechanical parameters in two-dimensional polygon-shapedparticles, Seyedi Hosseininia and Mirghasemi [12] have presented asimple DEM model, where each uniform (uncracked) particle(arbitrary convex polygon-shaped) is replaced with smaller inter-connected bonded rigid sub-particles. If the bond between sub-particles breaks, breakage will occur.
Robertson and Bolton [13] and McDowell and Harireche [14]simulated three-dimensional crushable soils by using the DEMtechnique, as implemented in PFC3D. In this method, agglomeratesare made by bonding elementary spheres in ‘crystallographic’ arrays.Stiffness bonding and slip models are included in the constitutiverepresentation of contact points between the elementary spheres. Itlimits the total normal and shear contact forces by enforcing bond-strength limits. The bond breaks if either of these limits is violated. Aslip model acts between un-bonded objects in contact, or betweenbonded objects when their contact breaks. It limits the shear forcebetween objects in contact and allows for slip to occur at a limitingshear force, governed by the Coulomb's equation. In this approach, theshear and tensile bond strengths are set equal; much higher tensilestrengths than the observed ones are assumed. Nevertheless, it hasbeen accomplished for the simulation of silica sand grains and theresults have been compared with the available test data [15]. Themethod can efficiently model the behavior of sands, whereas, itcannot be used for particles with sharp angles such as rockfills, sincethe proposed procedure for sand agglomerate consists of only smallerrounded spheres.
4. Present methodology of particle breakage
In this research, the phenomenon of particle breakage in a rockfill(sharp-edge) material is simulated under a biaxial test (pure shear)
θ
θ = π/2 − φ'
'
θ '
Directions of max.tensile stress
Directions of shearfailure surface
(a) (b)
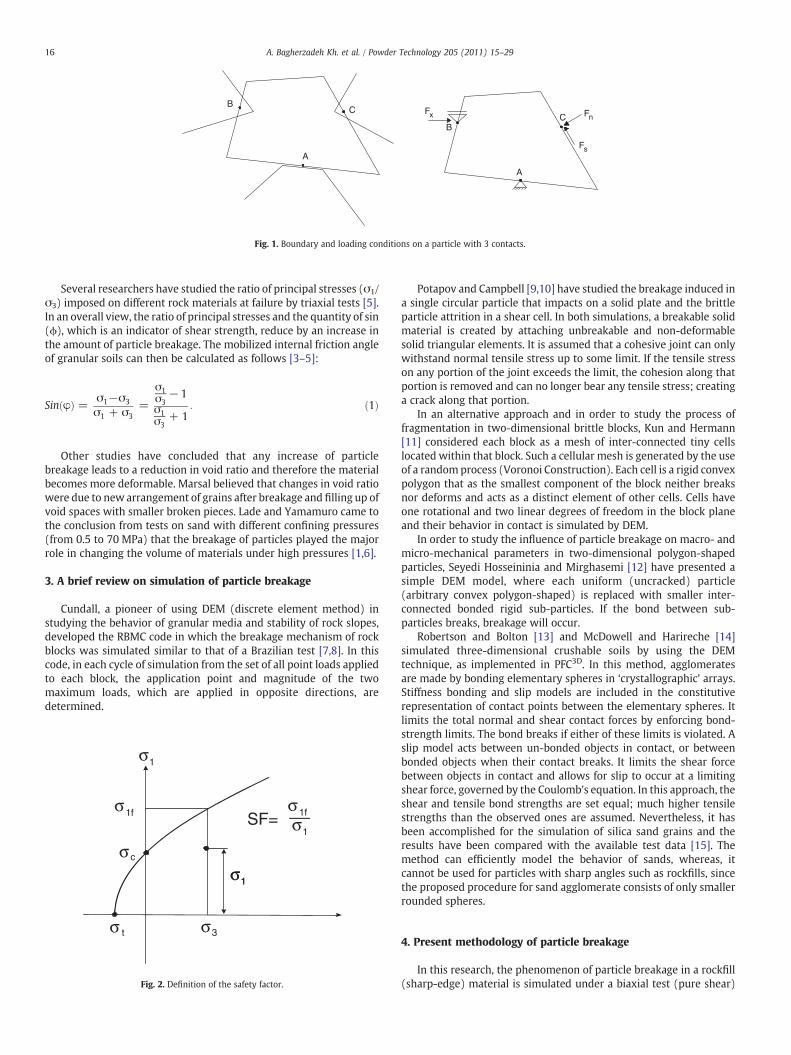
Fig. 3. Failure surfaces of tensile and shear modes. (a) Tensile mode. (b) Shear mode. * Arrows show the direction of stress on the element.
17A. Bagherzadeh Kh. et al. / Powder Technology 205 (2011) 15–29
condition by a new methodology based on a model of combined DEMand finite element method (FEM). Successful applications of thecombined discrete and finite element methods have already beenreported by a number of researchers in other applications [16–19].This novel approach has been proposed for improving the existingsimulations of the phenomenon of the breakage of polygon-shapedparticles, by removing the need for any definition or preliminaryassumptions of the breakage path in particles.
In the proposed method, all particles are simulated by DEM andafter each step of DEM analysis, each particle is separately modeled byFEM to determine its possible breakage. The breakage analysis will beperformed based on the loading conditions. If the particle is to break,the breakage path is assumed to be a straight line, determined by a fullfinite element stress–strain analysis within that particle and two newparticles are generated, replacing the original particle. These proce-dures are carried out on all particles in each time step of the DEManalysis.
(a)
Y=2.687-0
X=2.00 Cm
X=1.25 Cm
Point A
Point A
Point A
Example A: beam undergravity-vertical load atthe centre.
Example B: sampleunder unconfinedcompressive test.
Example C: sampleunder simple shear test.
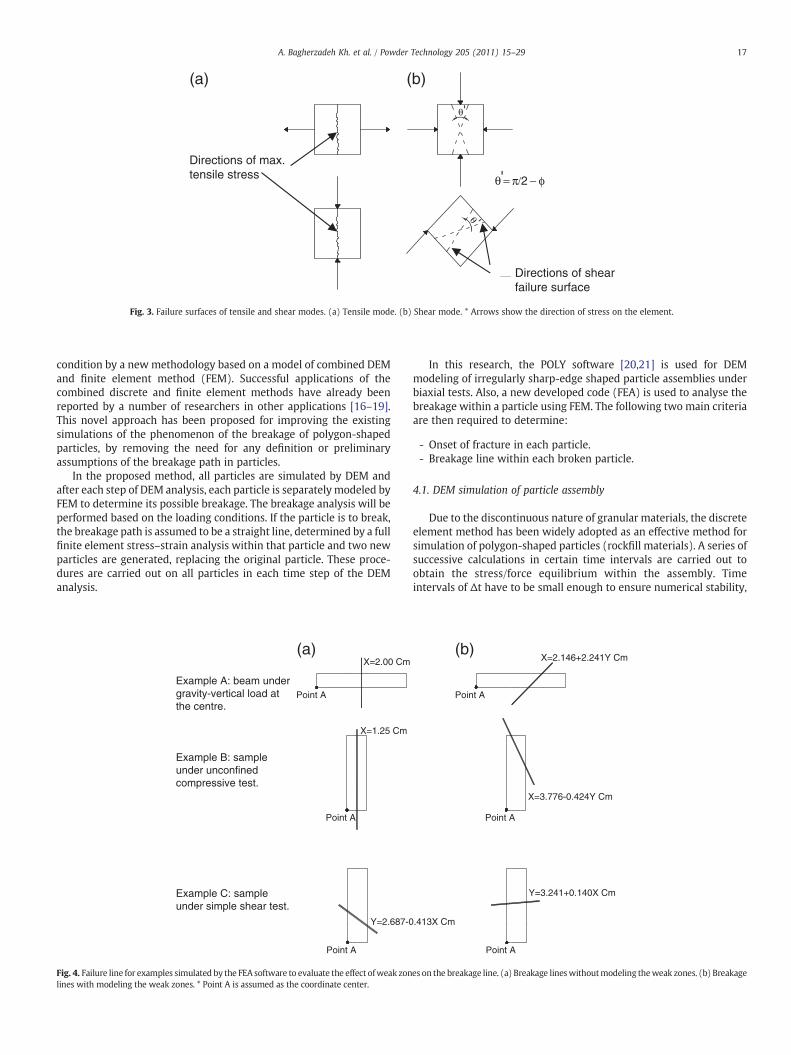
Fig. 4. Failure line for examples simulated by the FEA software to evaluate the effect ofweak zonlines with modeling the weak zones. * Point A is assumed as the coordinate center.
In this research, the POLY software [20,21] is used for DEMmodeling of irregularly sharp-edge shaped particle assemblies underbiaxial tests. Also, a new developed code (FEA) is used to analyse thebreakage within a particle using FEM. The following two main criteriaare then required to determine:
- Onset of fracture in each particle.- Breakage line within each broken particle.
4.1. DEM simulation of particle assembly
Due to the discontinuous nature of granular materials, the discreteelement method has been widely adopted as an effective method forsimulation of polygon-shaped particles (rockfill materials). A series ofsuccessive calculations in certain time intervals are carried out toobtain the stress/force equilibrium within the assembly. Timeintervals of Δt have to be small enough to ensure numerical stability,
(b)
.413X Cm
X=3.776-0.424Y Cm
X=2.146+2.241Y Cm
Y=3.241+0.140X Cm
Point A
Point A
Point A
es on the breakage line. (a) Breakage lineswithoutmodeling theweak zones. (b) Breakage
(b) (a)
Example A
Example C
Example B
4.0 Cm
7.5 Cm
7.5 Cm
0.5 Cm
2.5 Cm
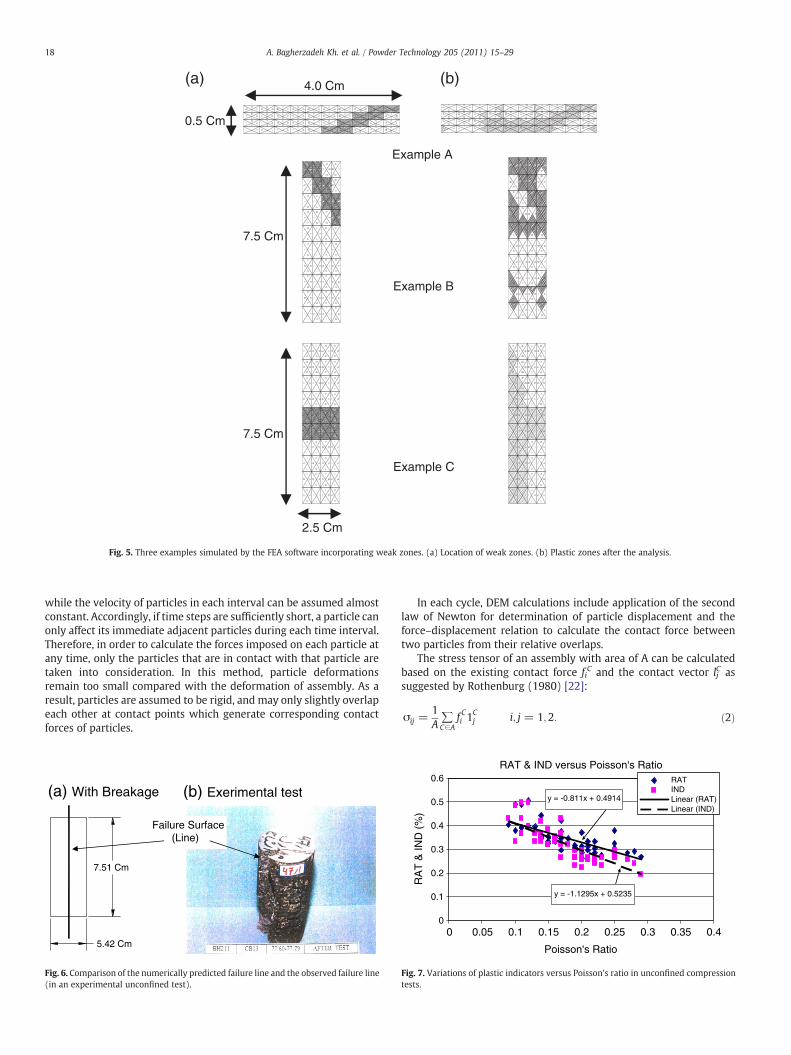
Fig. 5. Three examples simulated by the FEA software incorporating weak zones. (a) Location of weak zones. (b) Plastic zones after the analysis.
18 A. Bagherzadeh Kh. et al. / Powder Technology 205 (2011) 15–29
while the velocity of particles in each interval can be assumed almostconstant. Accordingly, if time steps are sufficiently short, a particle canonly affect its immediate adjacent particles during each time interval.Therefore, in order to calculate the forces imposed on each particle atany time, only the particles that are in contact with that particle aretaken into consideration. In this method, particle deformationsremain too small compared with the deformation of assembly. As aresult, particles are assumed to be rigid, and may only slightly overlapeach other at contact points which generate corresponding contactforces of particles.
5.42 Cm
7.51 Cm
Failure Surface(Line)
(a) With Breakage (b) Exerimental test
Fig. 6. Comparison of the numerically predicted failure line and the observed failure line(in an experimental unconfined test).
In each cycle, DEM calculations include application of the secondlaw of Newton for determination of particle displacement and theforce–displacement relation to calculate the contact force betweentwo particles from their relative overlaps.
The stress tensor of an assembly with area of A can be calculatedbased on the existing contact force fi
C and the contact vector ljC as
suggested by Rothenburg (1980) [22]:
σij =1A∑C∈A
f Ci 1Cj i; j = 1;2: ð2Þ
RAT & IND versus Poisson's Ratio
y = -0.811x + 0.4914
y = -1.1295x + 0.5235
0
0.1
0.2
0.3
0.4
0.5
0.6
0
Poisson's Ratio
RA
T &
IND
(%
)
RATINDLinear (RAT)Linear (IND)
0.40.350.30.250.20.150.10.05
Fig. 7. Variations of plastic indicators versus Poisson's ratio in unconfined compressiontests.
RAT & IND versus UnConfined Strength
y = -0.0006x + 0.3983
y = -0.0008x + 0.3932
0
0.1
0.2
0.3
0.4
0.5
0.6
0
UCS (MPa)
RA
T &
IND
(%
)
RATINDLinear (RAT)Linear (IND)
25020015010050
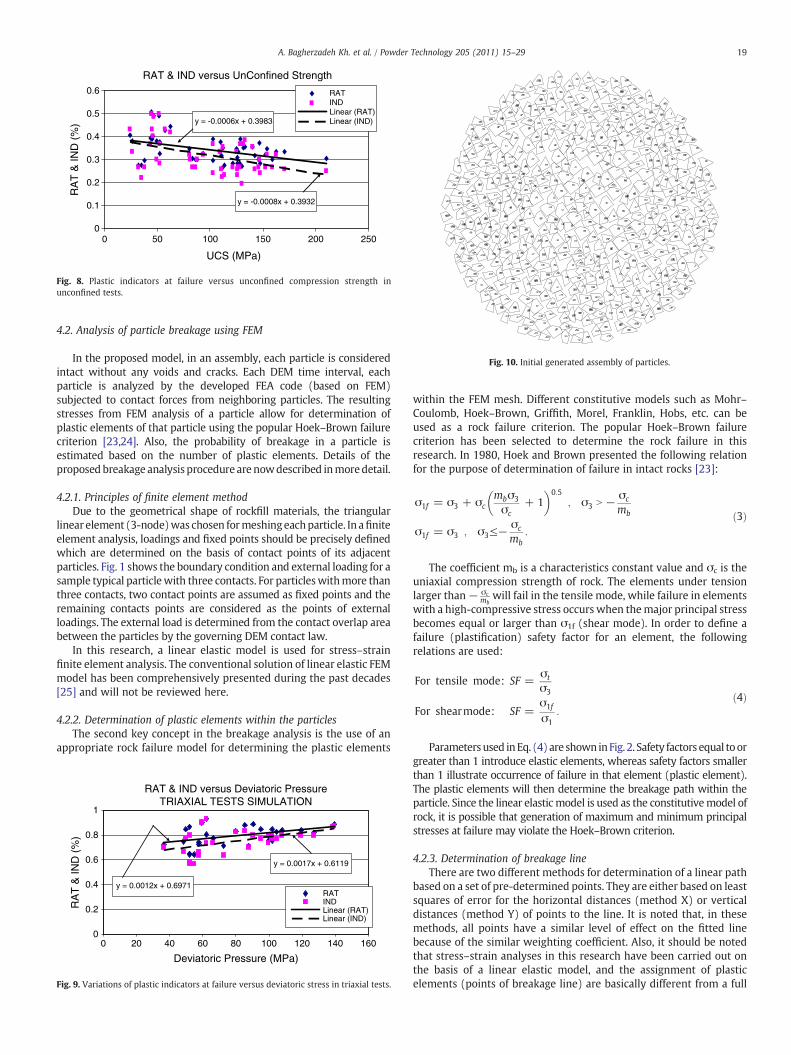
Fig. 8. Plastic indicators at failure versus unconfined compression strength inunconfined tests.
Fig. 10. Initial generated assembly of particles.
19A. Bagherzadeh Kh. et al. / Powder Technology 205 (2011) 15–29
4.2. Analysis of particle breakage using FEM
In the proposed model, in an assembly, each particle is consideredintact without any voids and cracks. Each DEM time interval, eachparticle is analyzed by the developed FEA code (based on FEM)subjected to contact forces from neighboring particles. The resultingstresses from FEM analysis of a particle allow for determination ofplastic elements of that particle using the popular Hoek–Brown failurecriterion [23,24]. Also, the probability of breakage in a particle isestimated based on the number of plastic elements. Details of theproposedbreakage analysis procedure arenowdescribed inmoredetail.
4.2.1. Principles of finite element methodDue to the geometrical shape of rockfill materials, the triangular
linear element (3-node)was chosen formeshingeachparticle. In afiniteelement analysis, loadings and fixed points should be precisely definedwhich are determined on the basis of contact points of its adjacentparticles. Fig. 1 shows the boundary condition and external loading for asample typical particlewith three contacts. For particleswithmore thanthree contacts, two contact points are assumed as fixed points and theremaining contacts points are considered as the points of externalloadings. The external load is determined from the contact overlap areabetween the particles by the governing DEM contact law.
In this research, a linear elastic model is used for stress–strainfinite element analysis. The conventional solution of linear elastic FEMmodel has been comprehensively presented during the past decades[25] and will not be reviewed here.
4.2.2. Determination of plastic elements within the particlesThe second key concept in the breakage analysis is the use of an
appropriate rock failure model for determining the plastic elements
RAT & IND versus Deviatoric PressureTRIAXIAL TESTS SIMULATION
y = 0.0012x + 0.6971
y = 0.0017x + 0.6119
0
0.2
0.4
0.6
0.8
1
0
Deviatoric Pressure (MPa)
RA
T &
IND
(%
)
RATINDLinear (RAT)Linear (IND)
16014012010080604020
Fig. 9. Variations of plastic indicators at failure versus deviatoric stress in triaxial tests.
within the FEM mesh. Different constitutive models such as Mohr–Coulomb, Hoek–Brown, Griffith, Morel, Franklin, Hobs, etc. can beused as a rock failure criterion. The popular Hoek–Brown failurecriterion has been selected to determine the rock failure in thisresearch. In 1980, Hoek and Brown presented the following relationfor the purpose of determination of failure in intact rocks [23]:
σ1f = σ3 + σcmbσ3
σc+ 1
� �0:5; σ3 N − σc
mb
σ1f = σ3 ; σ3≤− σc
mb:
ð3Þ
The coefficient mb is a characteristics constant value and σc is theuniaxial compression strength of rock. The elements under tensionlarger than− σc
mbwill fail in the tensile mode, while failure in elements
with a high-compressive stress occurs when themajor principal stressbecomes equal or larger than σ1f (shear mode). In order to define afailure (plastification) safety factor for an element, the followingrelations are used:
For tensile mode: SF =σt
σ3
For shearmode: SF =σ1f
σ1:
ð4Þ
Parametersused inEq. (4)are shown inFig. 2. Safety factors equal toorgreater than 1 introduce elastic elements, whereas safety factors smallerthan 1 illustrate occurrence of failure in that element (plastic element).The plastic elements will then determine the breakage path within theparticle. Since the linear elastic model is used as the constitutivemodel ofrock, it is possible that generation of maximum and minimum principalstresses at failure may violate the Hoek–Brown criterion.
4.2.3. Determination of breakage lineThere are two different methods for determination of a linear path
based on a set of pre-determined points. They are either based on leastsquares of error for the horizontal distances (method X) or verticaldistances (method Y) of points to the line. It is noted that, in thesemethods, all points have a similar level of effect on the fitted linebecause of the similar weighting coefficient. Also, it should be notedthat stress–strain analyses in this research have been carried out onthe basis of a linear elastic model, and the assignment of plasticelements (points of breakage line) are basically different from a full
(a)
(b)
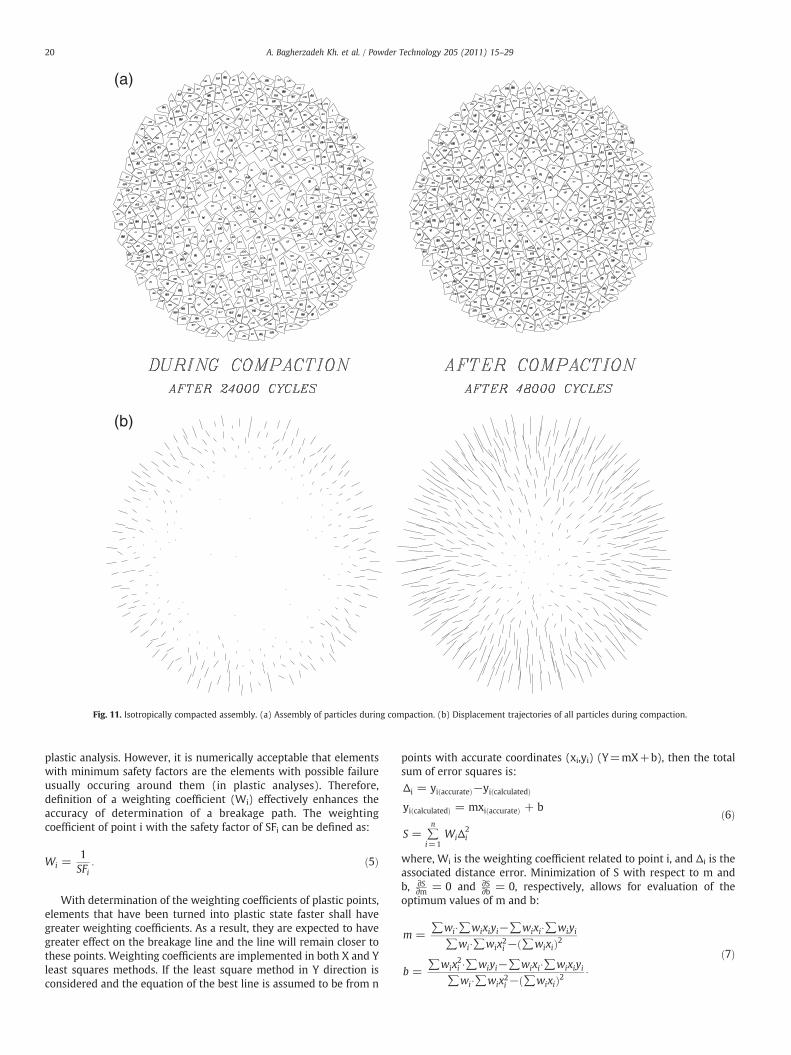
Fig. 11. Isotropically compacted assembly. (a) Assembly of particles during compaction. (b) Displacement trajectories of all particles during compaction.
20 A. Bagherzadeh Kh. et al. / Powder Technology 205 (2011) 15–29
plastic analysis. However, it is numerically acceptable that elementswith minimum safety factors are the elements with possible failureusually occuring around them (in plastic analyses). Therefore,definition of a weighting coefficient (Wi) effectively enhances theaccuracy of determination of a breakage path. The weightingcoefficient of point i with the safety factor of SFi can be defined as:
Wi =1SFi
: ð5Þ
With determination of the weighting coefficients of plastic points,elements that have been turned into plastic state faster shall havegreater weighting coefficients. As a result, they are expected to havegreater effect on the breakage line and the line will remain closer tothese points. Weighting coefficients are implemented in both X and Yleast squares methods. If the least square method in Y direction isconsidered and the equation of the best line is assumed to be from n
points with accurate coordinates (xi,yi) (Y=mX+b), then the totalsum of error squares is:
Δi = yi accurateð Þ−yi calculatedð Þ
yi calculatedð Þ = mxi accurateð Þ + b
S = ∑n
i=1WiΔ
2i
ð6Þ
where, Wi is the weighting coefficient related to point i, and Δi is theassociated distance error. Minimization of S with respect to m andb, ∂S
∂m = 0 and ∂S∂b = 0, respectively, allows for evaluation of the
optimum values of m and b:
m =∑wi
:∑wixiyi−∑wixi:∑wiyi∑wi
:∑wix2i − ∑wixið Þ2
b =∑wix
2i:∑wiyi−∑wixi:∑wixiyi
∑wi:∑wix
2i − ∑wixið Þ2
:
ð7Þ
197 196
195
194
193
192
191
190
189
188
187
186
185
184
183
182
181
180
179
178
177
176
175
174
173
172
171
170
169
168
167
166
165
164
163
162
161
160
159
158
157
156
155
154
153
152
151
150
149148
147
146
145
144143
142
141
140
139
138
137
136
135
134
133
132
131
130
129
128
127
126
125
124
123
122
121
120
119118
117
116
115
114
113
112
111
110
109
108
107
106
105
104
103
102
101
100
99
98
97
96
95
94
93
92
91
90
89
88
87
86
85
84
83
82
81
80
79
78
77
76
75
74
73
72 71
70
69
68
67
66
65
64
63
62
61
60
59 58
57
56
55
54
53
52
51
50 49
48
47
46
45
44
43
42
41
40
39
38
37
36
35
34
33
32
31
30
29
28
27
26
25
24
23
22
21
20
19 18
17
16
15
14
13
12
11
10
9
8
7
6
5
4
3
2
1
22 64
90
125
127 139
142
168
236
316
431
466
489
522
531537
580
610
623
630
694697
783
798
807
839862869
22 64
90
125
127
139
142
168
236
250
316
430
431
466
130140
147
173
233
246
304309
348
74
73
72 71
70
69
68
67
66
65
64
63
62
61
60
59 58
57
56
55
54
53
52
51
50
49
48
47
46
45
44
43
42
41
40
39
38
37
36
35
34
33
32
31
30
29
28
27 26
25
24
23
22
21
20
19 18
17
16
15 14
13
12
11
10
9
8
7
6
5
4
3
2
1
2
2
1 1
2
2
1 1
168
167
166
165
164
163
162
161
160
159
158
157
156
155
154
153
152
151
150
149148
147
146
145
144
143
142
141
140
139
138
137
136
135
134
133
132
131
130
129
128
127
126
125
124
123
122
121
120
119118
117
116
115
114
113
112
111
110
109
108
107
106
105
104
103
102
101
100
99
98
97
96
95
94
93
92
91
90
89
88
87
86
85
84
83
82
81
80
79
78
77
76
75
874
873
872
871
870
869
868
867
866
865864
863
862
861
860
859
858
857
856
855
854
853
852
851
850
849
848
847
846
845
844
843
842
841
840
839
838
837
836
835
834
833
832
831
830
829
828
827
826
825
824
823
822
821
820
819
818
817
816
815
814
813
812
811
810
809
808
807
806
805
804
803
802
801
800
799
798
797
796
795
794
793
792
791
790
789
788
787
786
785
784
783782
781
780
779
778
777
776
775
774
773
772771
770
769
768
767
766
983
982
981
980
979
978
977976
975
974
973
972
971
970
969
968
967
966
965
964
963 962
961
960
959
958
957
956
955
954
953
952
951
950
949
948
947
946
945944
943
942
941
940
939
938
937
936
935
934
933932
931
930
929
928
927
926
925
924
923
922
921
920
919
918
917
916
915
914
913
912
911
910
909
908
907
906
905
904
903
902
901
900
899
898
897
896
895
894
893
892
891
890
889
888
887
886
885
884
883
882
881
880
879
878
877
876
875
765
764
763
762
761
760
759
758
757
756
755
754
753
752
751
750
749
748
747
746
745
744
743
742
741
740
739
738
737
736
735
734
733732
731
730
729
728
727
726
725
724
723
722
721
720
719
718
717
716
715
714
713
712
711
710
709
708
707
706
705
704
703
702
701
700
699
698
697
696
695
694
693
692
691
690
689
688
687
686
685
684
683
682
681
680
679
678
677
676
675
674
673
672671
670
669
668
667
666
665
664
663
662
661
660
659
658
657
656
655 654
653
652
651
650
649
648
647
646
645
644
643
642
641640
639638
637
636
635
634
633
632
631
630
629
628
627
626
625
624
623
622
621
620
619
618
617
616
615
614
613
612
611
610
609
608
607
606
605
604
603
602
601
600
599
598
597
596
595
594
593
592
591
590
589
588587
586
585
584
583
582
581
580
579
578
577
576
575
574
573
572
571
570
569
568
567
566
565
564
563
562
561
560
559
558
557
556
555
554
553
552
551
550
549
548
547
546
545
544
543
542
541
540
539
538
537
536
535
534
533
532
531
530
529
528
527
526
525
524
523
522
521
520
519
518
517
516
515
514
513
512
511
510
509
508
507
506
505
504
503
502
501
500
499
498
497
496495
494
493
492
491
490
489
488
487486
485
484
483
482
481
480479
478
477
476
475
474
473
472
471
470
469
468
467
466
465
464
463
462
461
460
459
458
457
456
455
454
453
452
451
450
449
448
447
446
445
444
443
442
441
440
439
438
437
436435
434
433
432
431
430
429
428
427
426
425
424
423
422
421
420
419
418
417
416
415
414
413
412
411
410
409
408
407
406
405
404
403
402
401
400
399
398
397
396
395
394
393
392
391
390
389
388
387
386
385
384
383
382
381
380
379
378
377
376
375
374
373
372
371
370
369
368
367
366
365
364
363
362
361
360
359
358357
356
355
354
353
352
351
350
349
348
347346
345
344
343
342
341
340
339
338
337
336
335
334
333
332
331
330
329
328
327
326
325
324
323
322
321
320
319
318
317
316
315
314
313
312
311
310
309308
307
306
305
304
303
302
301
300
299
298
297
296
295
294
293
292
291
290
289
288
287
286
285
284
283
282
281
280
279
278
277
276275
274
273
272
271
270
269
268
267
266
265
264
263
262
261
260
259
258257
256
255
254
253
252
251
250
249
248
247
246
245
244
243
242
241
240
239
238
237
236
235
234
233
232
231
230
229
228
227
226
225
224
223
222
221
220
219
218
217
216
215
214
213
212
211
210
209
208
207206
205
204
203
202
201
200
199
198
477
476
475
474
473
472
471
470
469
468
467
466
465
464
463
462
461
460
459
458
457
456
455
454
453
452
451
450
449
448
447
446
445
444
443
442
441
440
439
438
437
436 435
434
433
432
431
430
429
428
427
426
425
424
423
422
421
420
419
418
417
416
415
414
413
412
411
410
409
408
407
406405
404
403
402
401
400
399
398
397
396
395
394
393
392
391
390
389
388
387
386
385
384
383
382
381
380
379
378
377
376
375
374
373
372
371
370
369
368
367
366
365
364
363
362
361
360
359
358357
356
355
354
353
352
351
350
349
348
347346
345
344
343
342
341
340
339
338
337
336
335
334
333
332
331
330
329
328
327
326
325
324
323
322
321
320
319
318
317
316
315
314
313
312
311
310
309
308
307
306
305
304
303
302
301
300
299
298
297
296
295
294
293
292
291
290
289
288
287
286
285
284
283
282
281
280
279
278
277
276275
274
273
272
271
270
269
268
267
266
265
264
263
262
261
260
259
258257
256
255
254
253
252
251
250
249
248
247
246
245
244
243
242
241
240
239
238
237
236
235
234
233
232
231
230
229
228
227
226225
224
223
222
221
220
219
218
217
216
215
214
213
212
211
210
209
208
207206
205
204
203
202
201
200
199
198
197196
195
194
193
192
191
190
189
188
187
186
185
184
183
182
181
180
179
178
177
176
175
174
173
172
171
170
169
358170
130
147
154
170
173
233
246
309
348
543
567
608
633
642
644647675692
699
716723
727
736
748
758762
767811
813
818
823
832
840842
851
878
906
956
968
975
(a) (b)
No Breakage
With Breakage
Approximate location ofthe shear path
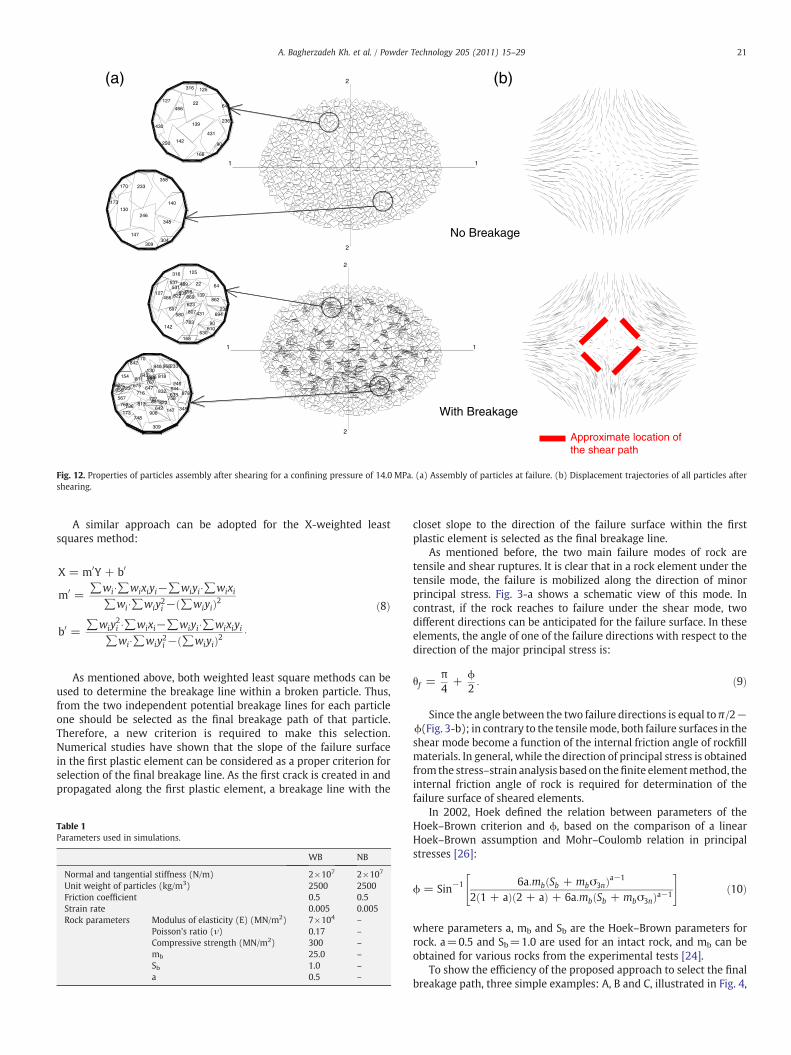
Fig. 12. Properties of particles assembly after shearing for a confining pressure of 14.0 MPa. (a) Assembly of particles at failure. (b) Displacement trajectories of all particles aftershearing.
21A. Bagherzadeh Kh. et al. / Powder Technology 205 (2011) 15–29
A similar approach can be adopted for the X-weighted leastsquares method:
X = m0Y + b0
m0 =∑wi
:∑wixiyi−∑wiyi:∑wixi∑wi
:∑wiy2i − ∑wiyið Þ2
b0 =∑wiy
2i:∑wixi−∑wiyi:∑wixiyi
∑wi:∑wiy
2i − ∑wiyið Þ2
:
ð8Þ
As mentioned above, both weighted least square methods can beused to determine the breakage line within a broken particle. Thus,from the two independent potential breakage lines for each particleone should be selected as the final breakage path of that particle.Therefore, a new criterion is required to make this selection.Numerical studies have shown that the slope of the failure surfacein the first plastic element can be considered as a proper criterion forselection of the final breakage line. As the first crack is created in andpropagated along the first plastic element, a breakage line with the
Table 1Parameters used in simulations.
WB NB
Normal and tangential stiffness (N/m) 2×10⁷ 2×10⁷
Unit weight of particles (kg/m3) 2500 2500Friction coefficient 0.5 0.5Strain rate 0.005 0.005Rock parameters Modulus of elasticity (E) (MN/m2) 7×10⁴ –
Poisson's ratio (ν) 0.17 –
Compressive strength (MN/m2) 300 –
mb 25.0 –
Sb 1.0 –
a 0.5 –
closet slope to the direction of the failure surface within the firstplastic element is selected as the final breakage line.
As mentioned before, the two main failure modes of rock aretensile and shear ruptures. It is clear that in a rock element under thetensile mode, the failure is mobilized along the direction of minorprincipal stress. Fig. 3-a shows a schematic view of this mode. Incontrast, if the rock reaches to failure under the shear mode, twodifferent directions can be anticipated for the failure surface. In theseelements, the angle of one of the failure directions with respect to thedirection of the major principal stress is:
θf =π4
+ϕ2: ð9Þ
Since the angle between the two failure directions is equal to π /2−ϕ(Fig. 3-b); in contrary to the tensilemode, both failure surfaces in theshear mode become a function of the internal friction angle of rockfillmaterials. In general, while the direction of principal stress is obtainedfrom the stress–strain analysis based on thefinite elementmethod, theinternal friction angle of rock is required for determination of thefailure surface of sheared elements.
In 2002, Hoek defined the relation between parameters of theHoek–Brown criterion and ϕ, based on the comparison of a linearHoek–Brown assumption and Mohr–Coulomb relation in principalstresses [26]:
ϕ = Sin−1 6a:mb Sb + mbσ3nð Þa−1
2 1 + að Þ 2 + að Þ + 6a:mb Sb + mbσ3nð Þa−1
" #ð10Þ
where parameters a, mb and Sb are the Hoek–Brown parameters forrock. a=0.5 and Sb=1.0 are used for an intact rock, and mb can beobtained for various rocks from the experimental tests [24].
To show the efficiency of the proposed approach to select the finalbreakage path, three simple examples: A, B and C, illustrated in Fig. 4,
Confining Pressure 2.0 MPa
0.0
1.0
2.0
3.0
4.0
5.0
6.0
7.0
0.0
Axial Strain (%)
Axial Strain (%)
σ1-σ
3 (M
Pa)
No Breakage
With Breakage
(a) Confining Pressure 2.0 MPa
0
0.1
0.2
0.3
0.4
0.5
0.6
0.7
Sin
(φ)
- M
obili
zed
Fric
tion
Ang
le
No Breakage
(b)
No Breakage
With Breakage
Confining Pressure 2.0 MPa
-2.0
-1.0
0.0
1.0
2.0
3.0
4.0
5.0
6.0
7.0
Vol
umet
ric S
trai
n(%
)
(c) Confining Pressure 2.0 MPa
0.0
5.0
10.0
15.0
20.0
25.0
30.0
35.0
40.0
Per
cent
of P
artic
le B
reak
age
(%)
(d)
Confining Pressure 2.0 MPa
-1.0
-0.5
0.0
0.5
1.0
1.5
2.0
2.5
3.0
3.5
4.0
4.5
0.0
Percent of Particle Breakage (%)
Vol
umet
ric S
trai
n (%
)
(e)
25.020.015.010.05.0
0.0 25.020.015.010.05.0
0.0
Axial Strain (%)25.020.015.010.05.0
0.0
Axial Strain (%)25.020.015.010.05.0
40.035.030.025.020.015.010.05.0
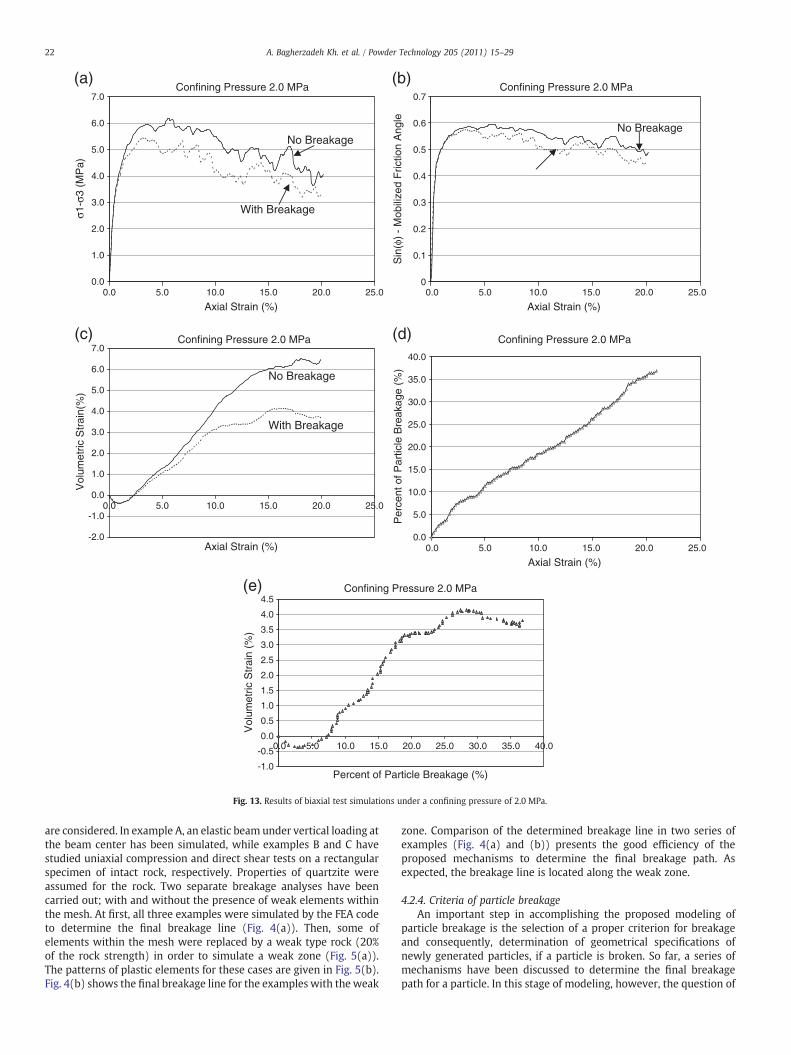
Fig. 13. Results of biaxial test simulations under a confining pressure of 2.0 MPa.
22 A. Bagherzadeh Kh. et al. / Powder Technology 205 (2011) 15–29
are considered. In example A, an elastic beam under vertical loading atthe beam center has been simulated, while examples B and C havestudied uniaxial compression and direct shear tests on a rectangularspecimen of intact rock, respectively. Properties of quartzite wereassumed for the rock. Two separate breakage analyses have beencarried out; with and without the presence of weak elements withinthe mesh. At first, all three examples were simulated by the FEA codeto determine the final breakage line (Fig. 4(a)). Then, some ofelements within the mesh were replaced by a weak type rock (20%of the rock strength) in order to simulate a weak zone (Fig. 5(a)).The patterns of plastic elements for these cases are given in Fig. 5(b).Fig. 4(b) shows the final breakage line for the examples with theweak
zone. Comparison of the determined breakage line in two series ofexamples (Fig. 4(a) and (b)) presents the good efficiency of theproposed mechanisms to determine the final breakage path. Asexpected, the breakage line is located along the weak zone.
4.2.4. Criteria of particle breakageAn important step in accomplishing the proposed modeling of
particle breakage is the selection of a proper criterion for breakageand consequently, determination of geometrical specifications ofnewly generated particles, if a particle is broken. So far, a series ofmechanisms have been discussed to determine the final breakagepath for a particle. In this stage of modeling, however, the question of
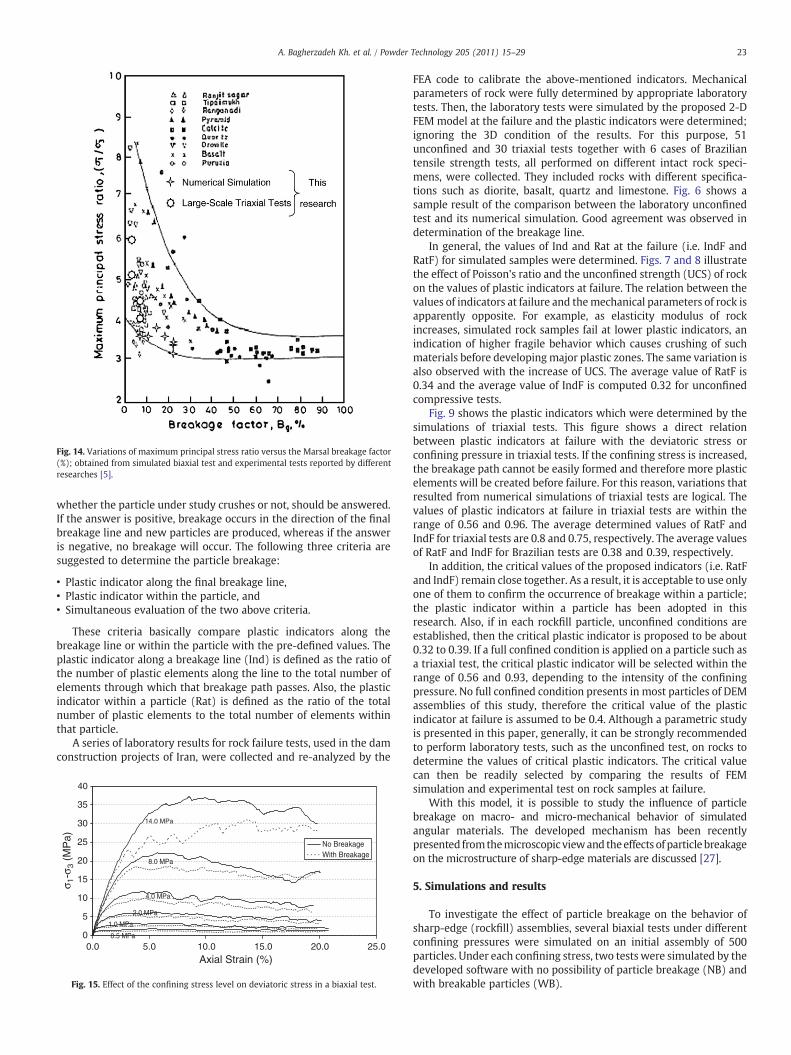
Fig. 14. Variations of maximum principal stress ratio versus the Marsal breakage factor(%); obtained from simulated biaxial test and experimental tests reported by differentresearches [5].
23A. Bagherzadeh Kh. et al. / Powder Technology 205 (2011) 15–29
whether the particle under study crushes or not, should be answered.If the answer is positive, breakage occurs in the direction of the finalbreakage line and new particles are produced, whereas if the answeris negative, no breakage will occur. The following three criteria aresuggested to determine the particle breakage:
• Plastic indicator along the final breakage line,• Plastic indicator within the particle, and• Simultaneous evaluation of the two above criteria.
These criteria basically compare plastic indicators along thebreakage line or within the particle with the pre-defined values. Theplastic indicator along a breakage line (Ind) is defined as the ratio ofthe number of plastic elements along the line to the total number ofelements through which that breakage path passes. Also, the plasticindicator within a particle (Rat) is defined as the ratio of the totalnumber of plastic elements to the total number of elements withinthat particle.
A series of laboratory results for rock failure tests, used in the damconstruction projects of Iran, were collected and re-analyzed by the
0
5
10
15
20
25
30
35
40
0.0 5.0 10.0 15.0 20.0 25.0Axial Strain (%)
No BreakageWith Breakage
14.0 MPa
2.0 MPa
8.0 MPa
4.0 MPa
1.0 MPa
0.5 MPa
σ 1-σ
3 (M
Pa)
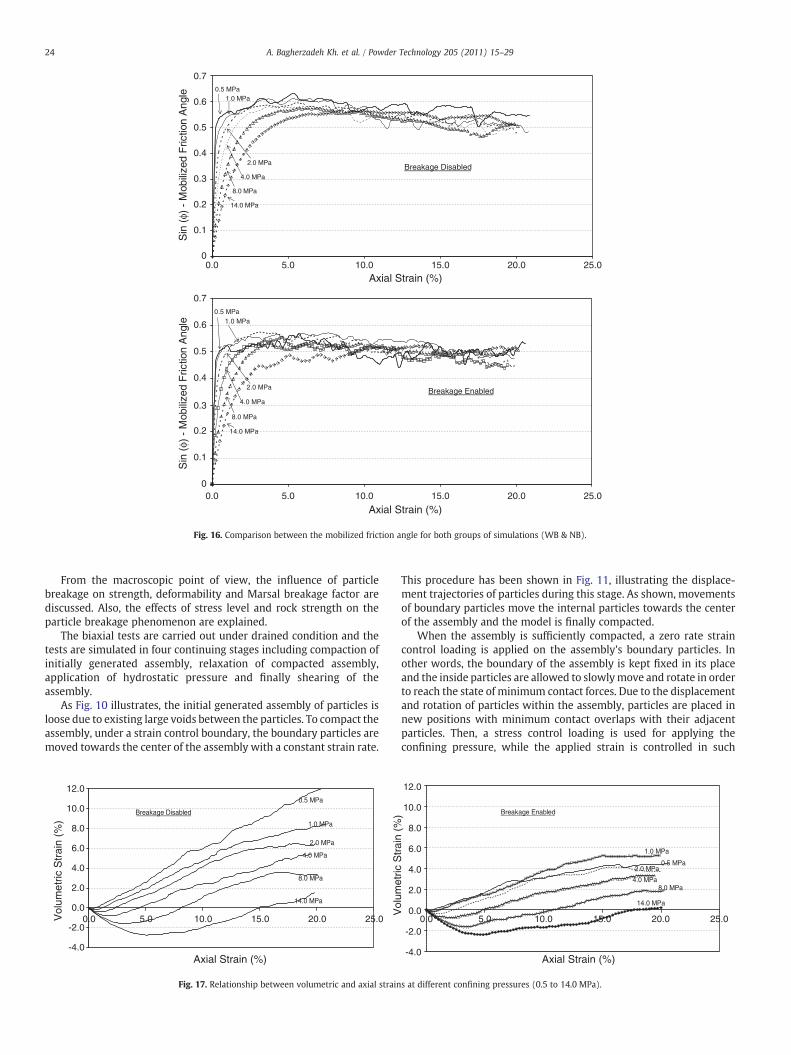
Fig. 15. Effect of the confining stress level on deviatoric stress in a biaxial test.
FEA code to calibrate the above-mentioned indicators. Mechanicalparameters of rock were fully determined by appropriate laboratorytests. Then, the laboratory tests were simulated by the proposed 2-DFEM model at the failure and the plastic indicators were determined;ignoring the 3D condition of the results. For this purpose, 51unconfined and 30 triaxial tests together with 6 cases of Braziliantensile strength tests, all performed on different intact rock speci-mens, were collected. They included rocks with different specifica-tions such as diorite, basalt, quartz and limestone. Fig. 6 shows asample result of the comparison between the laboratory unconfinedtest and its numerical simulation. Good agreement was observed indetermination of the breakage line.
In general, the values of Ind and Rat at the failure (i.e. IndF andRatF) for simulated samples were determined. Figs. 7 and 8 illustratethe effect of Poisson's ratio and the unconfined strength (UCS) of rockon the values of plastic indicators at failure. The relation between thevalues of indicators at failure and themechanical parameters of rock isapparently opposite. For example, as elasticity modulus of rockincreases, simulated rock samples fail at lower plastic indicators, anindication of higher fragile behavior which causes crushing of suchmaterials before developingmajor plastic zones. The same variation isalso observed with the increase of UCS. The average value of RatF is0.34 and the average value of IndF is computed 0.32 for unconfinedcompressive tests.
Fig. 9 shows the plastic indicators which were determined by thesimulations of triaxial tests. This figure shows a direct relationbetween plastic indicators at failure with the deviatoric stress orconfining pressure in triaxial tests. If the confining stress is increased,the breakage path cannot be easily formed and therefore more plasticelements will be created before failure. For this reason, variations thatresulted from numerical simulations of triaxial tests are logical. Thevalues of plastic indicators at failure in triaxial tests are within therange of 0.56 and 0.96. The average determined values of RatF andIndF for triaxial tests are 0.8 and 0.75, respectively. The average valuesof RatF and IndF for Brazilian tests are 0.38 and 0.39, respectively.
In addition, the critical values of the proposed indicators (i.e. RatFand IndF) remain close together. As a result, it is acceptable to use onlyone of them to confirm the occurrence of breakage within a particle;the plastic indicator within a particle has been adopted in thisresearch. Also, if in each rockfill particle, unconfined conditions areestablished, then the critical plastic indicator is proposed to be about0.32 to 0.39. If a full confined condition is applied on a particle such asa triaxial test, the critical plastic indicator will be selected within therange of 0.56 and 0.93, depending to the intensity of the confiningpressure. No full confined condition presents in most particles of DEMassemblies of this study, therefore the critical value of the plasticindicator at failure is assumed to be 0.4. Although a parametric studyis presented in this paper, generally, it can be strongly recommendedto perform laboratory tests, such as the unconfined test, on rocks todetermine the values of critical plastic indicators. The critical valuecan then be readily selected by comparing the results of FEMsimulation and experimental test on rock samples at failure.
With this model, it is possible to study the influence of particlebreakage on macro- and micro-mechanical behavior of simulatedangular materials. The developed mechanism has been recentlypresented fromthemicroscopic viewand theeffects of particle breakageon the microstructure of sharp-edge materials are discussed [27].
5. Simulations and results
To investigate the effect of particle breakage on the behavior ofsharp-edge (rockfill) assemblies, several biaxial tests under differentconfining pressures were simulated on an initial assembly of 500particles. Under each confining stress, two tests were simulated by thedeveloped software with no possibility of particle breakage (NB) andwith breakable particles (WB).
0
0.1
0.2
0.3
0.4
0.5
0.6
0.7
25.020.015.010.05.00.0
25.020.015.010.05.00.0
Axial Strain (%)
Sin
(φ)
- M
obili
zed
Fric
tion
Ang
leS
in (
φ) -
Mob
ilize
d F
rictio
n A
ngle
2.0 MPa
0.5 MPa1.0 MPa
14.0 MPa
8.0 MPa
4.0 MPaBreakage Disabled
0
0.1
0.2
0.3
0.4
0.5
0.6
0.7
Axial Strain (%)
2.0 MPa
0.5 MPa1.0 MPa
14.0 MPa
8.0 MPa
4.0 MPa
Breakage Enabled
Fig. 16. Comparison between the mobilized friction angle for both groups of simulations (WB & NB).
24 A. Bagherzadeh Kh. et al. / Powder Technology 205 (2011) 15–29
From the macroscopic point of view, the influence of particlebreakage on strength, deformability and Marsal breakage factor arediscussed. Also, the effects of stress level and rock strength on theparticle breakage phenomenon are explained.
The biaxial tests are carried out under drained condition and thetests are simulated in four continuing stages including compaction ofinitially generated assembly, relaxation of compacted assembly,application of hydrostatic pressure and finally shearing of theassembly.
As Fig. 10 illustrates, the initial generated assembly of particles isloose due to existing large voids between the particles. To compact theassembly, under a strain control boundary, the boundary particles aremoved towards the center of the assembly with a constant strain rate.
-4.0
-2.0
0.0
2.0
4.0
6.0
8.0
10.0
12.0
0.0 5.0 10.0 15.0 20.0 25.0
Axial Strain (%)
Vol
umet
ric S
trai
n (%
)
0.5 MPa
14.0 MPa
8.0 MPa
4.0 MPa
2.0 MPa
1.0 MPa
Breakage Disabled
Fig. 17. Relationship between volumetric and axial strain
This procedure has been shown in Fig. 11, illustrating the displace-ment trajectories of particles during this stage. As shown, movementsof boundary particles move the internal particles towards the centerof the assembly and the model is finally compacted.
When the assembly is sufficiently compacted, a zero rate straincontrol loading is applied on the assembly's boundary particles. Inother words, the boundary of the assembly is kept fixed in its placeand the inside particles are allowed to slowlymove and rotate in orderto reach the state of minimum contact forces. Due to the displacementand rotation of particles within the assembly, particles are placed innew positions with minimum contact overlaps with their adjacentparticles. Then, a stress control loading is used for applying theconfining pressure, while the applied strain is controlled in such
0.0 5.0 10.0 15.0 20.0 25.0
Axial Strain (%)-4.0
-2.0
0.0
2.0
4.0
6.0
8.0
10.0
12.0
Vol
umet
ric S
trai
n (%
)
0.5 MPa
14.0 MPa
8.0 MPa4.0 MPa
2.0 MPa
1.0 MPa
Breakage Enabled
s at different confining pressures (0.5 to 14.0 MPa).
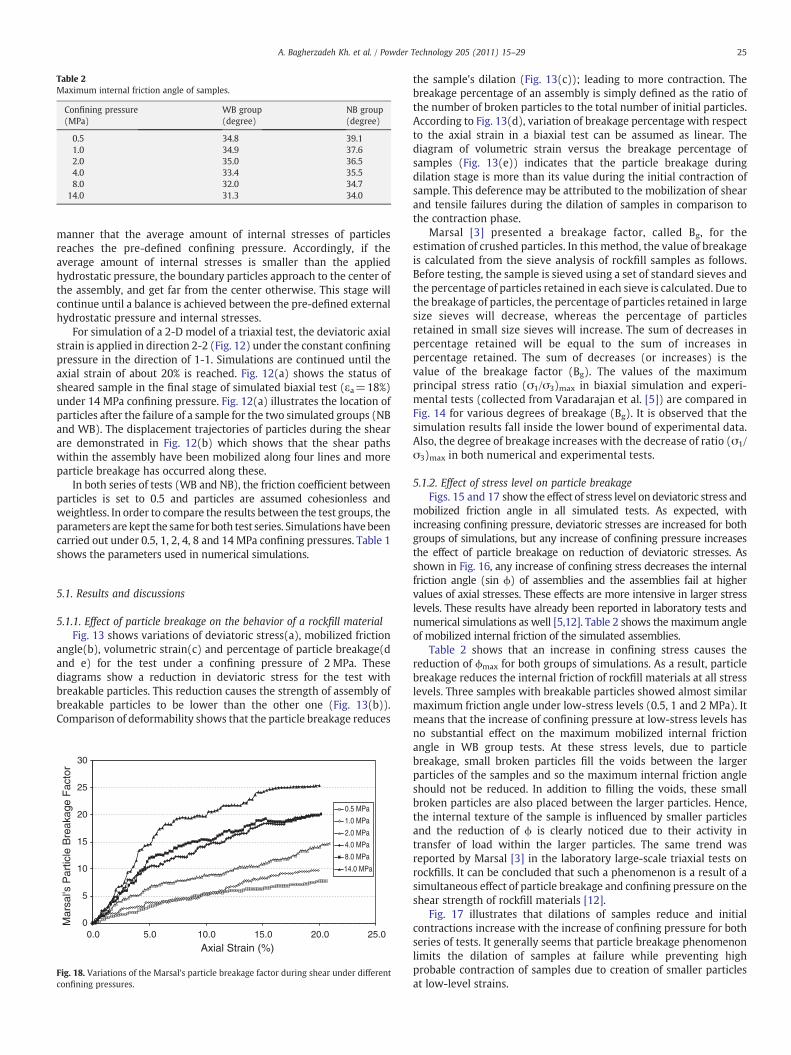
Table 2Maximum internal friction angle of samples.
Confining pressure(MPa)
WB group(degree)
NB group(degree)
0.5 34.8 39.11.0 34.9 37.62.0 35.0 36.54.0 33.4 35.58.0 32.0 34.7
14.0 31.3 34.0
25A. Bagherzadeh Kh. et al. / Powder Technology 205 (2011) 15–29
manner that the average amount of internal stresses of particlesreaches the pre-defined confining pressure. Accordingly, if theaverage amount of internal stresses is smaller than the appliedhydrostatic pressure, the boundary particles approach to the center ofthe assembly, and get far from the center otherwise. This stage willcontinue until a balance is achieved between the pre-defined externalhydrostatic pressure and internal stresses.
For simulation of a 2-D model of a triaxial test, the deviatoric axialstrain is applied in direction 2-2 (Fig. 12) under the constant confiningpressure in the direction of 1-1. Simulations are continued until theaxial strain of about 20% is reached. Fig. 12(a) shows the status ofsheared sample in the final stage of simulated biaxial test (εa=18%)under 14 MPa confining pressure. Fig. 12(a) illustrates the location ofparticles after the failure of a sample for the two simulated groups (NBand WB). The displacement trajectories of particles during the shearare demonstrated in Fig. 12(b) which shows that the shear pathswithin the assembly have been mobilized along four lines and moreparticle breakage has occurred along these.
In both series of tests (WB and NB), the friction coefficient betweenparticles is set to 0.5 and particles are assumed cohesionless andweightless. In order to compare the results between the test groups, theparameters are kept the same for both test series. Simulations havebeencarried out under 0.5, 1, 2, 4, 8 and 14 MPa confining pressures. Table 1shows the parameters used in numerical simulations.
5.1. Results and discussions
5.1.1. Effect of particle breakage on the behavior of a rockfill materialFig. 13 shows variations of deviatoric stress(a), mobilized friction
angle(b), volumetric strain(c) and percentage of particle breakage(dand e) for the test under a confining pressure of 2 MPa. Thesediagrams show a reduction in deviatoric stress for the test withbreakable particles. This reduction causes the strength of assembly ofbreakable particles to be lower than the other one (Fig. 13(b)).Comparison of deformability shows that the particle breakage reduces
0
5
10
15
20
25
30
0.0 5.0 10.0 15.0 20.0 25.0
Axial Strain (%)
Mar
sal's
Par
ticle
Bre
akag
e F
acto
r
0.5 MPa
1.0 MPa
2.0 MPa
4.0 MPa
8.0 MPa
14.0 MPa
Fig. 18. Variations of the Marsal's particle breakage factor during shear under differentconfining pressures.
the sample's dilation (Fig. 13(c)); leading to more contraction. Thebreakage percentage of an assembly is simply defined as the ratio ofthe number of broken particles to the total number of initial particles.According to Fig. 13(d), variation of breakage percentage with respectto the axial strain in a biaxial test can be assumed as linear. Thediagram of volumetric strain versus the breakage percentage ofsamples (Fig. 13(e)) indicates that the particle breakage duringdilation stage is more than its value during the initial contraction ofsample. This deference may be attributed to the mobilization of shearand tensile failures during the dilation of samples in comparison tothe contraction phase.
Marsal [3] presented a breakage factor, called Bg, for theestimation of crushed particles. In this method, the value of breakageis calculated from the sieve analysis of rockfill samples as follows.Before testing, the sample is sieved using a set of standard sieves andthe percentage of particles retained in each sieve is calculated. Due tothe breakage of particles, the percentage of particles retained in largesize sieves will decrease, whereas the percentage of particlesretained in small size sieves will increase. The sum of decreases inpercentage retained will be equal to the sum of increases inpercentage retained. The sum of decreases (or increases) is thevalue of the breakage factor (Bg). The values of the maximumprincipal stress ratio (σ1/σ3)max in biaxial simulation and experi-mental tests (collected from Varadarajan et al. [5]) are compared inFig. 14 for various degrees of breakage (Bg). It is observed that thesimulation results fall inside the lower bound of experimental data.Also, the degree of breakage increases with the decrease of ratio (σ1/σ3)max in both numerical and experimental tests.
5.1.2. Effect of stress level on particle breakageFigs. 15 and 17 show the effect of stress level on deviatoric stress and
mobilized friction angle in all simulated tests. As expected, withincreasing confining pressure, deviatoric stresses are increased for bothgroups of simulations, but any increase of confining pressure increasesthe effect of particle breakage on reduction of deviatoric stresses. Asshown in Fig. 16, any increase of confining stress decreases the internalfriction angle (sin ϕ) of assemblies and the assemblies fail at highervalues of axial stresses. These effects are more intensive in larger stresslevels. These results have already been reported in laboratory tests andnumerical simulations as well [5,12]. Table 2 shows the maximum angleof mobilized internal friction of the simulated assemblies.
Table 2 shows that an increase in confining stress causes thereduction of ϕmax for both groups of simulations. As a result, particlebreakage reduces the internal friction of rockfill materials at all stresslevels. Three samples with breakable particles showed almost similarmaximum friction angle under low-stress levels (0.5, 1 and 2 MPa). Itmeans that the increase of confining pressure at low-stress levels hasno substantial effect on the maximum mobilized internal frictionangle in WB group tests. At these stress levels, due to particlebreakage, small broken particles fill the voids between the largerparticles of the samples and so the maximum internal friction angleshould not be reduced. In addition to filling the voids, these smallbroken particles are also placed between the larger particles. Hence,the internal texture of the sample is influenced by smaller particlesand the reduction of ϕ is clearly noticed due to their activity intransfer of load within the larger particles. The same trend wasreported by Marsal [3] in the laboratory large-scale triaxial tests onrockfills. It can be concluded that such a phenomenon is a result of asimultaneous effect of particle breakage and confining pressure on theshear strength of rockfill materials [12].
Fig. 17 illustrates that dilations of samples reduce and initialcontractions increase with the increase of confining pressure for bothseries of tests. It generally seems that particle breakage phenomenonlimits the dilation of samples at failure while preventing highprobable contraction of samples due to creation of smaller particlesat low-level strains.
0.5
5.5
10.5
15.5
20.5
25.5
30.5
35.5
40.5
0.0 5.0 10.0 15.0 20.0 25.0 30.0
P (MPa)
q (M
Pa)
Breakage DisabledBreakage Enabled
0.5 MPa
14.0 MPa
8.0 MPa
4.0 MPa
2.0 MPa
1.0 MPa
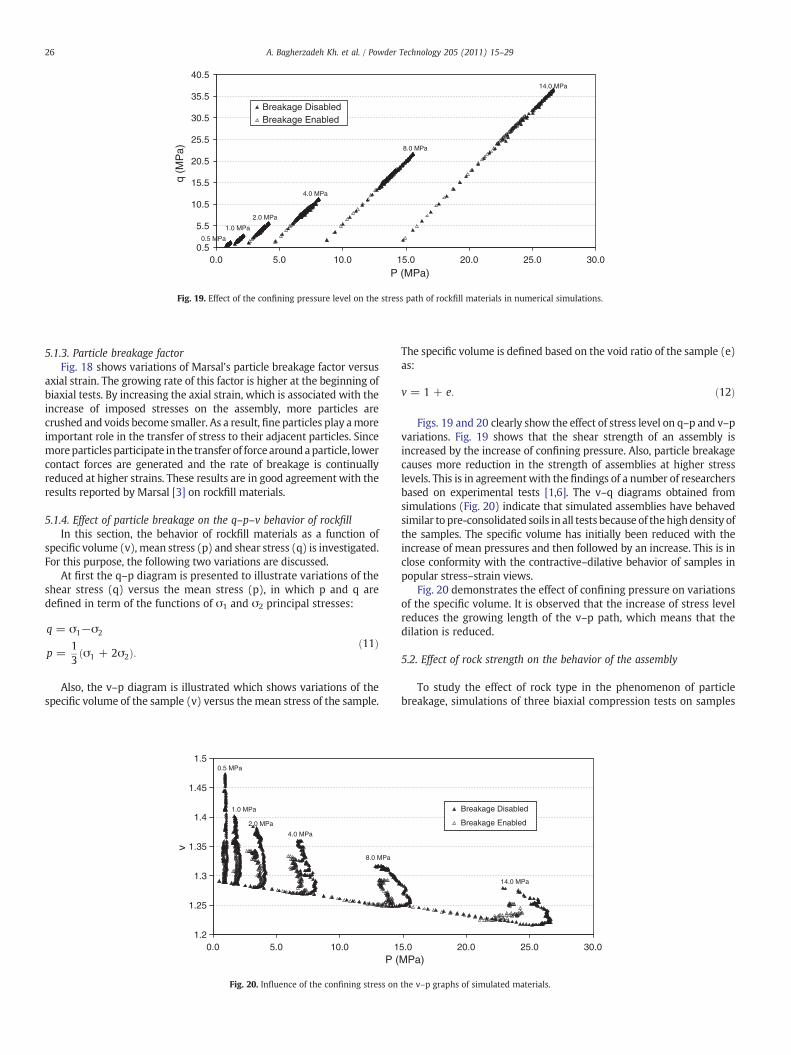
Fig. 19. Effect of the confining pressure level on the stress path of rockfill materials in numerical simulations.
26 A. Bagherzadeh Kh. et al. / Powder Technology 205 (2011) 15–29
5.1.3. Particle breakage factorFig. 18 shows variations of Marsal's particle breakage factor versus
axial strain. The growing rate of this factor is higher at the beginning ofbiaxial tests. By increasing the axial strain, which is associated with theincrease of imposed stresses on the assembly, more particles arecrushed and voids become smaller. As a result, fine particles play amoreimportant role in the transfer of stress to their adjacent particles. Sincemoreparticlesparticipate in the transfer of force aroundaparticle, lowercontact forces are generated and the rate of breakage is continuallyreduced at higher strains. These results are in good agreement with theresults reported by Marsal [3] on rockfill materials.
5.1.4. Effect of particle breakage on the q–p–v behavior of rockfillIn this section, the behavior of rockfill materials as a function of
specific volume (v), mean stress (p) and shear stress (q) is investigated.For this purpose, the following two variations are discussed.
At first the q–p diagram is presented to illustrate variations of theshear stress (q) versus the mean stress (p), in which p and q aredefined in term of the functions of σ1 and σ2 principal stresses:
q = σ1−σ2
p =13
σ1 + 2σ2ð Þ:ð11Þ
Also, the v–p diagram is illustrated which shows variations of thespecific volume of the sample (v) versus the mean stress of the sample.
1.2
1.25
1.3
1.35
1.4
1.45
1.5
0.0 5.0 10.0 1P (
v
8.0 MPa
2.0 MPa
1.0 MPa
4.0 MPa
0.5 MPa
Fig. 20. Influence of the confining stress on
The specific volume is defined based on the void ratio of the sample (e)as:
v = 1 + e: ð12Þ
Figs. 19 and 20 clearly show the effect of stress level on q–p and v–pvariations. Fig. 19 shows that the shear strength of an assembly isincreased by the increase of confining pressure. Also, particle breakagecauses more reduction in the strength of assemblies at higher stresslevels. This is in agreementwith the findings of a number of researchersbased on experimental tests [1,6]. The v–q diagrams obtained fromsimulations (Fig. 20) indicate that simulated assemblies have behavedsimilar to pre-consolidated soils in all tests because of thehighdensity ofthe samples. The specific volume has initially been reduced with theincrease of mean pressures and then followed by an increase. This is inclose conformity with the contractive–dilative behavior of samples inpopular stress–strain views.
Fig. 20 demonstrates the effect of confining pressure on variationsof the specific volume. It is observed that the increase of stress levelreduces the growing length of the v–p path, which means that thedilation is reduced.
5.2. Effect of rock strength on the behavior of the assembly
To study the effect of rock type in the phenomenon of particlebreakage, simulations of three biaxial compression tests on samples
5.0 20.0 25.0 30.0MPa)
Breakage Disabled
Breakage Enabled
14.0 MPa
the v–p graphs of simulated materials.
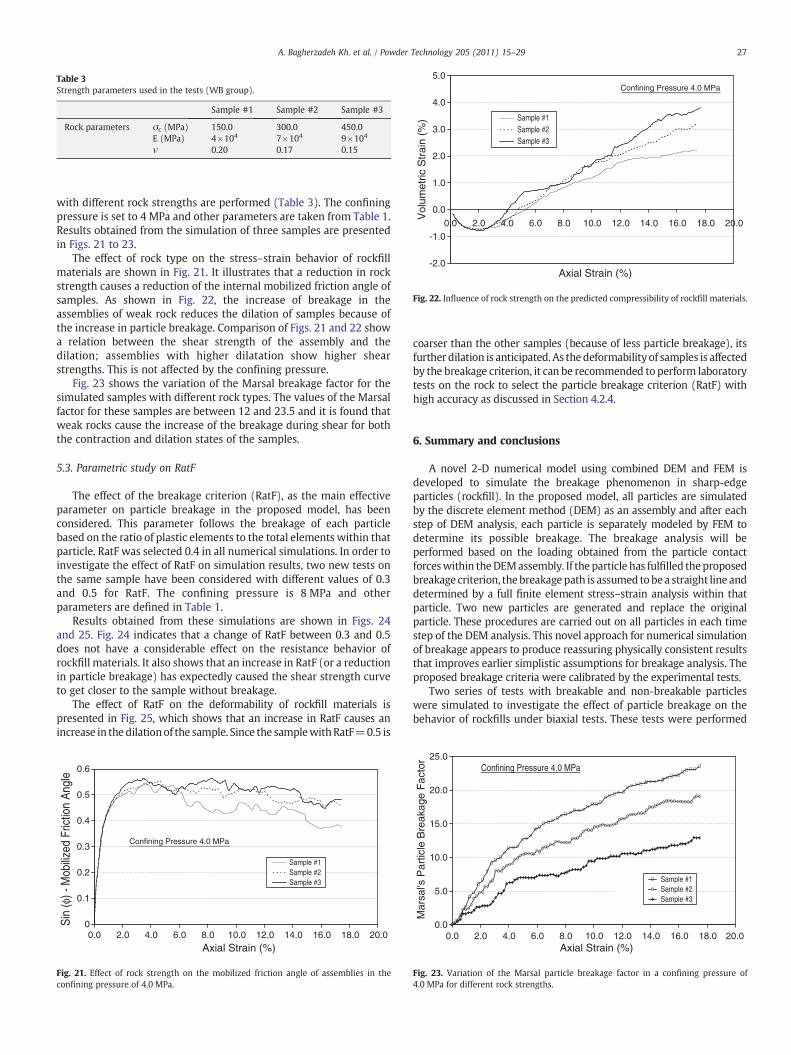
Table 3Strength parameters used in the tests (WB group).
Sample #1 Sample #2 Sample #3
Rock parameters σc (MPa) 150.0 300.0 450.0E (MPa) 4×10⁴ 7×10⁴ 9×10⁴
ν 0.20 0.17 0.15
Confining Pressure 4.0 MPa
-2.0
-1.0
0.0
1.0
2.0
3.0
4.0
5.0
0.0 2.0 4.0 6.0 8.0 10.0 12.0 14.0 16.0 18.0 20.0
Axial Strain (%)
Vol
umet
ric S
trai
n (%
) Sample #1Sample #2Sample #3
Fig. 22. Influence of rock strength on the predicted compressibility of rockfill materials.
27A. Bagherzadeh Kh. et al. / Powder Technology 205 (2011) 15–29
with different rock strengths are performed (Table 3). The confiningpressure is set to 4 MPa and other parameters are taken from Table 1.Results obtained from the simulation of three samples are presentedin Figs. 21 to 23.
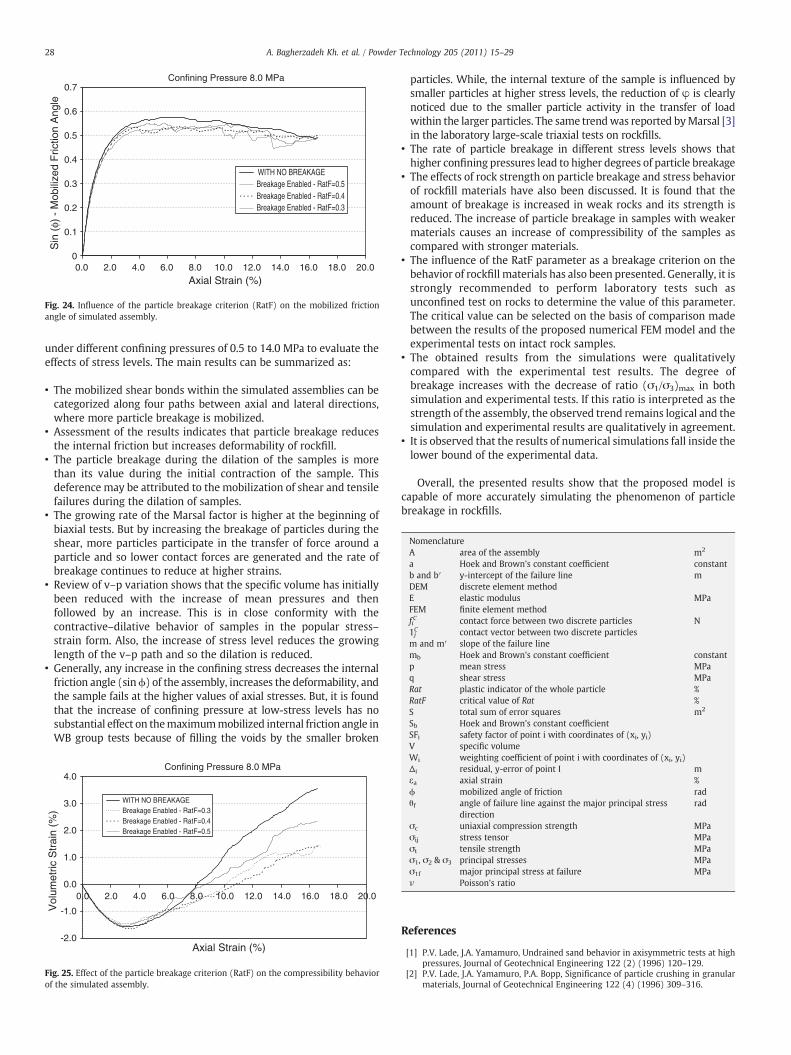
The effect of rock type on the stress–strain behavior of rockfillmaterials are shown in Fig. 21. It illustrates that a reduction in rockstrength causes a reduction of the internal mobilized friction angle ofsamples. As shown in Fig. 22, the increase of breakage in theassemblies of weak rock reduces the dilation of samples because ofthe increase in particle breakage. Comparison of Figs. 21 and 22 showa relation between the shear strength of the assembly and thedilation; assemblies with higher dilatation show higher shearstrengths. This is not affected by the confining pressure.
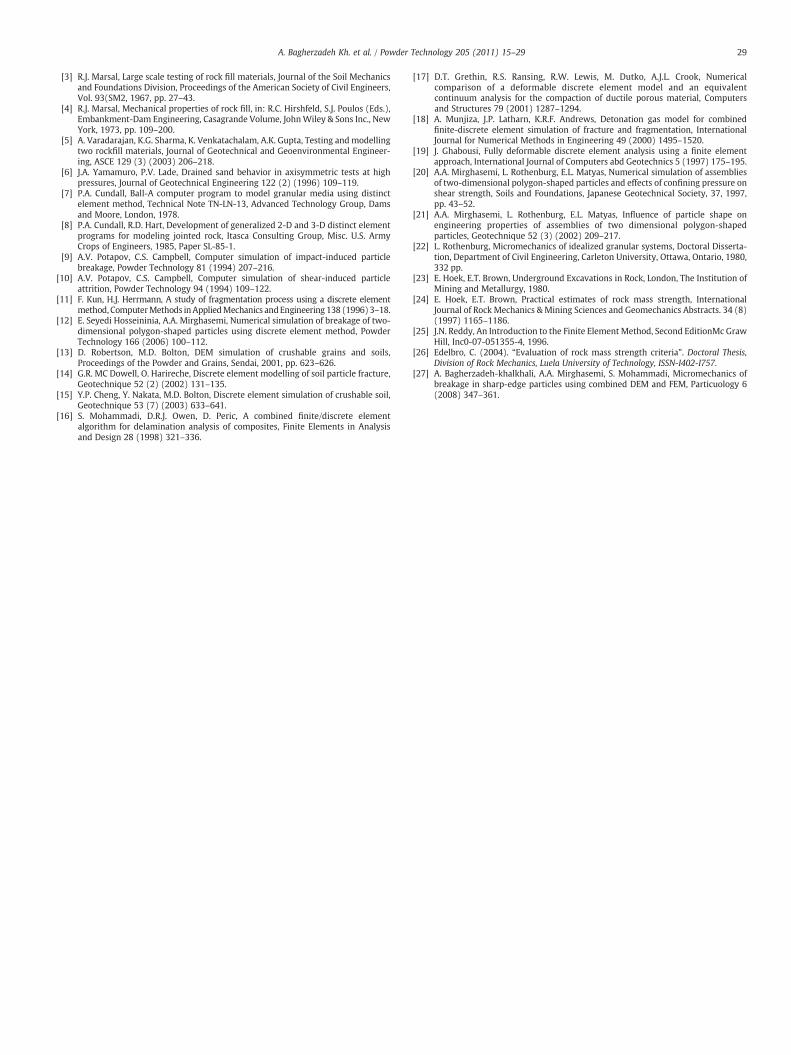
Fig. 23 shows the variation of the Marsal breakage factor for thesimulated samples with different rock types. The values of the Marsalfactor for these samples are between 12 and 23.5 and it is found thatweak rocks cause the increase of the breakage during shear for boththe contraction and dilation states of the samples.
5.3. Parametric study on RatF
The effect of the breakage criterion (RatF), as the main effectiveparameter on particle breakage in the proposed model, has beenconsidered. This parameter follows the breakage of each particlebased on the ratio of plastic elements to the total elements within thatparticle. RatF was selected 0.4 in all numerical simulations. In order toinvestigate the effect of RatF on simulation results, two new tests onthe same sample have been considered with different values of 0.3and 0.5 for RatF. The confining pressure is 8 MPa and otherparameters are defined in Table 1.
Results obtained from these simulations are shown in Figs. 24and 25. Fig. 24 indicates that a change of RatF between 0.3 and 0.5does not have a considerable effect on the resistance behavior ofrockfill materials. It also shows that an increase in RatF (or a reductionin particle breakage) has expectedly caused the shear strength curveto get closer to the sample without breakage.
The effect of RatF on the deformability of rockfill materials ispresented in Fig. 25, which shows that an increase in RatF causes anincrease in thedilationof the sample. Since the samplewithRatF=0.5 is
Confining Pressure 4.0 MPa
0
0.1
0.2
0.3
0.4
0.5
0.6
0.0 2.0 4.0 6.0 8.0 10.0 12.0 14.0 16.0 18.0 20.0Axial Strain (%)
Sin
(φ) -
Mob
ilize
d Fr
ictio
n A
ngle
Sample #1Sample #2Sample #3
Fig. 21. Effect of rock strength on the mobilized friction angle of assemblies in theconfining pressure of 4.0 MPa.
coarser than the other samples (because of less particle breakage), itsfurther dilation is anticipated. As thedeformability of samples is affectedby the breakage criterion, it can be recommended to perform laboratorytests on the rock to select the particle breakage criterion (RatF) withhigh accuracy as discussed in Section 4.2.4.
6. Summary and conclusions
A novel 2-D numerical model using combined DEM and FEM isdeveloped to simulate the breakage phenomenon in sharp-edgeparticles (rockfill). In the proposed model, all particles are simulatedby the discrete element method (DEM) as an assembly and after eachstep of DEM analysis, each particle is separately modeled by FEM todetermine its possible breakage. The breakage analysis will beperformed based on the loading obtained from the particle contactforceswithin theDEMassembly. If the particle has fulfilled theproposedbreakage criterion, the breakagepath is assumed tobea straight line anddetermined by a full finite element stress–strain analysis within thatparticle. Two new particles are generated and replace the originalparticle. These procedures are carried out on all particles in each timestep of the DEM analysis. This novel approach for numerical simulationof breakage appears to produce reassuring physically consistent resultsthat improves earlier simplistic assumptions for breakage analysis. Theproposed breakage criteria were calibrated by the experimental tests.
Two series of tests with breakable and non-breakable particleswere simulated to investigate the effect of particle breakage on thebehavior of rockfills under biaxial tests. These tests were performed
Confining Pressure 4.0 MPa
0.0
5.0
10.0
15.0
20.0
25.0
0.0 2.0 4.0 6.0 8.0 10.0 12.0 14.0 16.0 18.0 20.0Axial Strain (%)
Mar
sal's
Par
ticle
Bre
akag
e F
acto
r
Sample #1Sample #2Sample #3
Fig. 23. Variation of the Marsal particle breakage factor in a confining pressure of4.0 MPa for different rock strengths.
Confining Pressure 8.0 MPa
0
0.1
0.2
0.3
0.4
0.5
0.6
0.7
0.0 2.0 4.0 6.0 8.0 10.0 12.0 14.0 16.0 18.0 20.0
Axial Strain (%)
Sin
(φ)
- M
obili
zed
Fric
tion
Ang
le
WITH NO BREAKAGEBreakage Enabled - RatF=0.5Breakage Enabled - RatF=0.4Breakage Enabled - RatF=0.3
Fig. 24. Influence of the particle breakage criterion (RatF) on the mobilized frictionangle of simulated assembly.
28 A. Bagherzadeh Kh. et al. / Powder Technology 205 (2011) 15–29
under different confining pressures of 0.5 to 14.0 MPa to evaluate theeffects of stress levels. The main results can be summarized as:
• The mobilized shear bonds within the simulated assemblies can becategorized along four paths between axial and lateral directions,where more particle breakage is mobilized.
• Assessment of the results indicates that particle breakage reducesthe internal friction but increases deformability of rockfill.
• The particle breakage during the dilation of the samples is morethan its value during the initial contraction of the sample. Thisdeference may be attributed to the mobilization of shear and tensilefailures during the dilation of samples.
• The growing rate of the Marsal factor is higher at the beginning ofbiaxial tests. But by increasing the breakage of particles during theshear, more particles participate in the transfer of force around aparticle and so lower contact forces are generated and the rate ofbreakage continues to reduce at higher strains.
• Review of v–p variation shows that the specific volume has initiallybeen reduced with the increase of mean pressures and thenfollowed by an increase. This is in close conformity with thecontractive–dilative behavior of samples in the popular stress–strain form. Also, the increase of stress level reduces the growinglength of the v–p path and so the dilation is reduced.
• Generally, any increase in the confining stress decreases the internalfriction angle (sinϕ) of the assembly, increases the deformability, andthe sample fails at the higher values of axial stresses. But, it is foundthat the increase of confining pressure at low-stress levels has nosubstantial effect on themaximummobilized internal friction angle inWB group tests because of filling the voids by the smaller broken
Confining Pressure 8.0 MPa
-2.0
-1.0
0.0
1.0
2.0
3.0
4.0
0.0 2.0 4.0 6.0 8.0 10.0 12.0 14.0 16.0 18.0 20.0
Axial Strain (%)
Vol
umet
ric S
trai
n (%
)
WITH NO BREAKAGEBreakage Enabled - RatF=0.3Breakage Enabled - RatF=0.4Breakage Enabled - RatF=0.5
Fig. 25. Effect of the particle breakage criterion (RatF) on the compressibility behaviorof the simulated assembly.
particles. While, the internal texture of the sample is influenced bysmaller particles at higher stress levels, the reduction of φ is clearlynoticed due to the smaller particle activity in the transfer of loadwithin the larger particles. The same trendwas reported byMarsal [3]in the laboratory large-scale triaxial tests on rockfills.
• The rate of particle breakage in different stress levels shows thathigher confining pressures lead to higher degrees of particle breakage
• The effects of rock strength on particle breakage and stress behaviorof rockfill materials have also been discussed. It is found that theamount of breakage is increased in weak rocks and its strength isreduced. The increase of particle breakage in samples with weakermaterials causes an increase of compressibility of the samples ascompared with stronger materials.
• The influence of the RatF parameter as a breakage criterion on thebehavior of rockfill materials has also been presented. Generally, it isstrongly recommended to perform laboratory tests such asunconfined test on rocks to determine the value of this parameter.The critical value can be selected on the basis of comparison madebetween the results of the proposed numerical FEM model and theexperimental tests on intact rock samples.
• The obtained results from the simulations were qualitativelycompared with the experimental test results. The degree ofbreakage increases with the decrease of ratio (σ1/σ3)max in bothsimulation and experimental tests. If this ratio is interpreted as thestrength of the assembly, the observed trend remains logical and thesimulation and experimental results are qualitatively in agreement.
• It is observed that the results of numerical simulations fall inside thelower bound of the experimental data.
Overall, the presented results show that the proposed model iscapable of more accurately simulating the phenomenon of particlebreakage in rockfills.
Nomenclature
A area of the assembly m2a
Hoek and Brown's constant coefficient constant b and b′ y-intercept of the failure line m DEM discrete element method E elastic modulus MPa FEM finite element method fiC contact force between two discrete particles N 1jC contact vector between two discrete particles m and m′ slope of the failure line mb Hoek and Brown's constant coefficient constant p mean stress MPa q shear stress MPa Rat plastic indicator of the whole particle % RatF critical value of Rat % S total sum of error squares m2Sb
Hoek and Brown's constant coefficient SFi safety factor of point i with coordinates of (xi, yi) V specific volume Wi weighting coefficient of point i with coordinates of (xi, yi) Δi residual, y-error of point I m εa axial strain % ϕ mobilized angle of friction rad θf angle of failure line against the major principal stressdirection
radσc
uniaxial compression strength MPa σij stress tensor MPa σt tensile strength MPa σ1, σ2 & σ3 principal stresses MPa σ1f major principal stress at failure MPa ν Poisson's ratioReferences
[1] P.V. Lade, J.A. Yamamuro, Undrained sand behavior in axisymmetric tests at highpressures, Journal of Geotechnical Engineering 122 (2) (1996) 120–129.
[2] P.V. Lade, J.A. Yamamuro, P.A. Bopp, Significance of particle crushing in granularmaterials, Journal of Geotechnical Engineering 122 (4) (1996) 309–316.
29A. Bagherzadeh Kh. et al. / Powder Technology 205 (2011) 15–29
[3] R.J. Marsal, Large scale testing of rock fill materials, Journal of the Soil Mechanicsand Foundations Division, Proceedings of the American Society of Civil Engineers,Vol. 93(SM2, 1967, pp. 27–43.
[4] R.J. Marsal, Mechanical properties of rock fill, in: R.C. Hirshfeld, S.J. Poulos (Eds.),Embankment-Dam Engineering, Casagrande Volume, JohnWiley & Sons Inc., NewYork, 1973, pp. 109–200.
[5] A. Varadarajan, K.G. Sharma, K. Venkatachalam, A.K. Gupta, Testing andmodellingtwo rockfill materials, Journal of Geotechnical and Geoenvironmental Engineer-ing, ASCE 129 (3) (2003) 206–218.
[6] J.A. Yamamuro, P.V. Lade, Drained sand behavior in axisymmetric tests at highpressures, Journal of Geotechnical Engineering 122 (2) (1996) 109–119.
[7] P.A. Cundall, Ball-A computer program to model granular media using distinctelement method, Technical Note TN-LN-13, Advanced Technology Group, Damsand Moore, London, 1978.
[8] P.A. Cundall, R.D. Hart, Development of generalized 2-D and 3-D distinct elementprograms for modeling jointed rock, Itasca Consulting Group, Misc. U.S. ArmyCrops of Engineers, 1985, Paper SL-85-1.
[9] A.V. Potapov, C.S. Campbell, Computer simulation of impact-induced particlebreakage, Powder Technology 81 (1994) 207–216.
[10] A.V. Potapov, C.S. Campbell, Computer simulation of shear-induced particleattrition, Powder Technology 94 (1994) 109–122.
[11] F. Kun, H.J. Herrmann, A study of fragmentation process using a discrete elementmethod, ComputerMethods inAppliedMechanics andEngineering 138 (1996)3–18.
[12] E. Seyedi Hosseininia, A.A. Mirghasemi, Numerical simulation of breakage of two-dimensional polygon-shaped particles using discrete element method, PowderTechnology 166 (2006) 100–112.
[13] D. Robertson, M.D. Bolton, DEM simulation of crushable grains and soils,Proceedings of the Powder and Grains, Sendai, 2001, pp. 623–626.
[14] G.R. MC Dowell, O. Harireche, Discrete element modelling of soil particle fracture,Geotechnique 52 (2) (2002) 131–135.
[15] Y.P. Cheng, Y. Nakata, M.D. Bolton, Discrete element simulation of crushable soil,Geotechnique 53 (7) (2003) 633–641.
[16] S. Mohammadi, D.R.J. Owen, D. Peric, A combined finite/discrete elementalgorithm for delamination analysis of composites, Finite Elements in Analysisand Design 28 (1998) 321–336.
[17] D.T. Grethin, R.S. Ransing, R.W. Lewis, M. Dutko, A.J.L. Crook, Numericalcomparison of a deformable discrete element model and an equivalentcontinuum analysis for the compaction of ductile porous material, Computersand Structures 79 (2001) 1287–1294.
[18] A. Munjiza, J.P. Latharn, K.R.F. Andrews, Detonation gas model for combinedfinite-discrete element simulation of fracture and fragmentation, InternationalJournal for Numerical Methods in Engineering 49 (2000) 1495–1520.
[19] J. Ghabousi, Fully deformable discrete element analysis using a finite elementapproach, International Journal of Computers abd Geotechnics 5 (1997) 175–195.
[20] A.A. Mirghasemi, L. Rothenburg, E.L. Matyas, Numerical simulation of assembliesof two-dimensional polygon-shaped particles and effects of confining pressure onshear strength, Soils and Foundations, Japanese Geotechnical Society, 37, 1997,pp. 43–52.
[21] A.A. Mirghasemi, L. Rothenburg, E.L. Matyas, Influence of particle shape onengineering properties of assemblies of two dimensional polygon-shapedparticles, Geotechnique 52 (3) (2002) 209–217.
[22] L. Rothenburg, Micromechanics of idealized granular systems, Doctoral Disserta-tion, Department of Civil Engineering, Carleton University, Ottawa, Ontario, 1980,332 pp.
[23] E. Hoek, E.T. Brown, Underground Excavations in Rock, London, The Institution ofMining and Metallurgy, 1980.
[24] E. Hoek, E.T. Brown, Practical estimates of rock mass strength, InternationalJournal of Rock Mechanics & Mining Sciences and Geomechanics Abstracts. 34 (8)(1997) 1165–1186.
[25] J.N. Reddy, An Introduction to the Finite Element Method, Second EditionMc GrawHill, Inc0-07-051355-4, 1996.
[26] Edelbro, C. (2004). “Evaluation of rock mass strength criteria”. Doctoral Thesis,Division of Rock Mechanics, Luela University of Technology, ISSN-I402-I757.
[27] A. Bagherzadeh-khalkhali, A.A. Mirghasemi, S. Mohammadi, Micromechanics ofbreakage in sharp-edge particles using combined DEM and FEM, Particuology 6(2008) 347–361.