Embed Size (px)
Citation preview
14
Numerical Simulation of Influence of Changing a Dam Height on Liquid Steel Flow and
Behaviour of Non-metallic Inclusions in the Tundish
Adam Cwudziński Czestochowa University of Technology,
Department of Metals Extraction and Recirculation Poland
1. Introduction
The steel material is formed during the course of heterophase processes. During the
smelting, ladle treatment and casting of steel efforts are made to obtain a homogeneous
material that is free from any type of contaminants, which include both non-metallic
inclusions (NMI) and gases. Among hazardous gases causing defects in steel material are
oxygen, nitrogen, or hydrogen. NMI, on the other hand, include any types of oxides,
sulphides and nitrides (Nuspl et al., 2004; Rocabois et al., 2003; Van Ende et al., 2009;
Herrera-Trejo et al., 1998). The current state of knowledge enables steel products to be
manufactured, which meet any requirements imposed on particular steel grades.
However, the constant development of technology certainly enables searching for new
standards and the production of even purer steel grades than those currently
manufactured in production conditions. Due to the systematically depleting iron ore
deposits, the electric arc process is more and more commonly used for steel production,
which relies on scrap being the main carrier of impurities that might penetrate into the
structure of steel material. Therefore it seems justifiable to develop and improve the
processes of ladle treatment and continuous casting of liquid steel (Matsuura et al., 2007;
Tanaka et al., 1994; Lachmund & Xie, 2003; Xie et al., 2005; Gupta & Chandra, 2004; Basu et
al., 2004). Presently, the liquid metal as prepared on the ladle furnace stand has the
required metallurgical purity and temperature allowing it to be cast by the continuous
method. However, a number of interesting research works concerning tundishes have
drawn the metallurgists’ attention to this plant and contributed to perceiving the tundish
also as an effective device assisting the liquid steel refining processes (Solorio-Diaz et al.,
2005; Lopez-Ramirez et al., 2001; Hou et al., 2008; Bessho et al., 1992; Kuklev et al., 2004;
Cwudziński, 2010). This results primarily from the fact that liquid steel resides in the
tundish for a specific time, during which any phenomena that favour the refining process
can be stimulated and intensified. The present chapter reports the results of studies on the
behaviour of liquid steel and NMI in liquid steel as it flows through the tundish. The
Ansys-Fluent program was used for solved mathematical model of casting process.
www.intechopen.com
Computational Fluid Dynamics Technologies and Applications
376
Plotting of the RTD (residence time distribution) curve was possible by using a virtual
tracer and introducing it to the numerical tundish model. As a result of computations,
fields of liquid steel flow, fields of turbulence intensity, fields of steel temperature and non-
metallic inclusions growth, residence time distribution type C and F curves were obtained.
The facility under investigation is a tundish designed for casting slabs. This is a wedge-
type tundish of a nominal capacity of 30 tons. The tundish incorporates a stopper rod
system for controlling the outflow of liquid steel into the mould. Two novel constructional
solutions concerning the change in the tundish working space were designed for the
facility under examination. The dam being presently in use was made in two variants by
changing the dam height. Thus, information about the influence of dam height variation
on the process of NMI growth in the liquid metal and on liquid steel flow hydrodynamics
was obtained. The description of the above-mentioned phenomenon is important, because
the larger non-metallic inclusions, the easier they flow out to the liquid metal surface and
can be assimilated by the tundish powder. However, the NMI growth generating the
change in non-metallic inclusions size alone does not guarantee that the refining process
will be effective. Therefore, the selection of the type of liquid steel flow control device to
enhance the NMI take-out is of key importance. The intensification of liquid steel refining
processes must also have rational justification in the costs incurred for this purpose.
Therefore, the making of prototype flow control devices and their application in actual
industrial conditions should be preceded by simulation studies carried out for a particular
industrial facility, while maintaining the main technological parameters of the process
being run.
2. Testing methodology
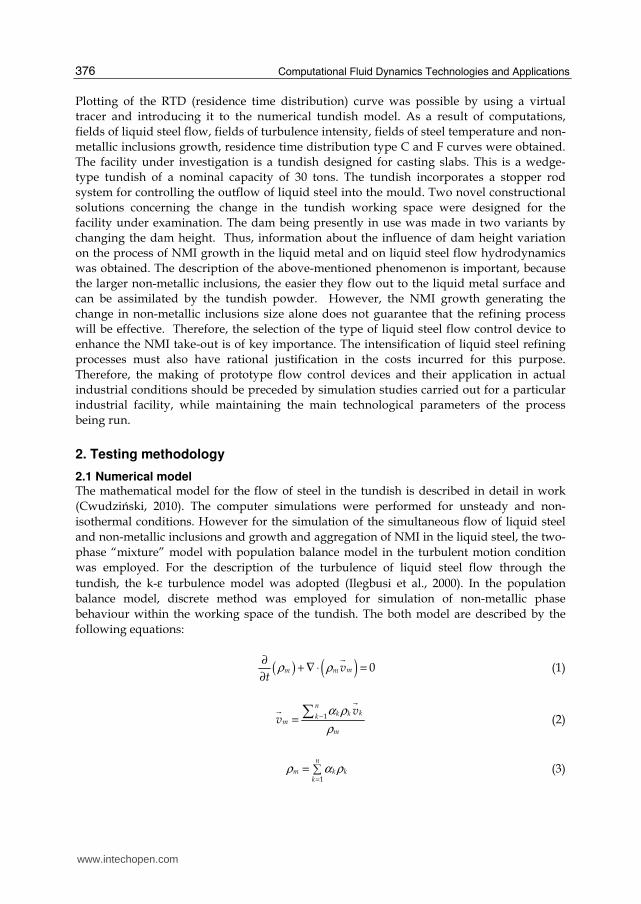
2.1 Numerical model The mathematical model for the flow of steel in the tundish is described in detail in work
(Cwudziński, 2010). The computer simulations were performed for unsteady and non-
isothermal conditions. However for the simulation of the simultaneous flow of liquid steel
and non-metallic inclusions and growth and aggregation of NMI in the liquid steel, the two-
phase “mixture” model with population balance model in the turbulent motion condition
was employed. For the description of the turbulence of liquid steel flow through the
tundish, the k-ε turbulence model was adopted (Ilegbusi et al., 2000). In the population
balance model, discrete method was employed for simulation of non-metallic phase
behaviour within the working space of the tundish. The both model are described by the
following equations:
( ) ( ) 0mm m vt
ρ ρ∂
+ ∇ ⋅ =∂
(1)
nkk kk
m
m
vv 1
α ρ
ρ−=
(2)
1
n
m k kk
ρ α ρ=
= (3)
www.intechopen.com
Numerical Simulation of Influence of Changing a Dam Height on Liquid Steel Flow and Behaviour of Non-metallic Inclusions in the Tundish
377
( ) ( ) ( )T
m m m m mm m m
n
dr k dr km k k
k
v v v p v vt
g F Kv v, ,
1
ρ ρ µ
ρ α ρ=
∂ + ∇ ⋅ = −∇ + ∇ ⋅ ∇ + ∇ + ∂
+ + ∇ ⋅
(4)
n
m k k
k 1
µ α µ=
= (5)
dr k k mv v v, = −
(6)
( ) ( )( ) ( )n n
kk k k k k k eff E
k k
E v h p k T St 1 1
α ρ α ρ= =
∂+ ∇ ⋅ + = ∇ ⋅ ∇ +
∂
(7)
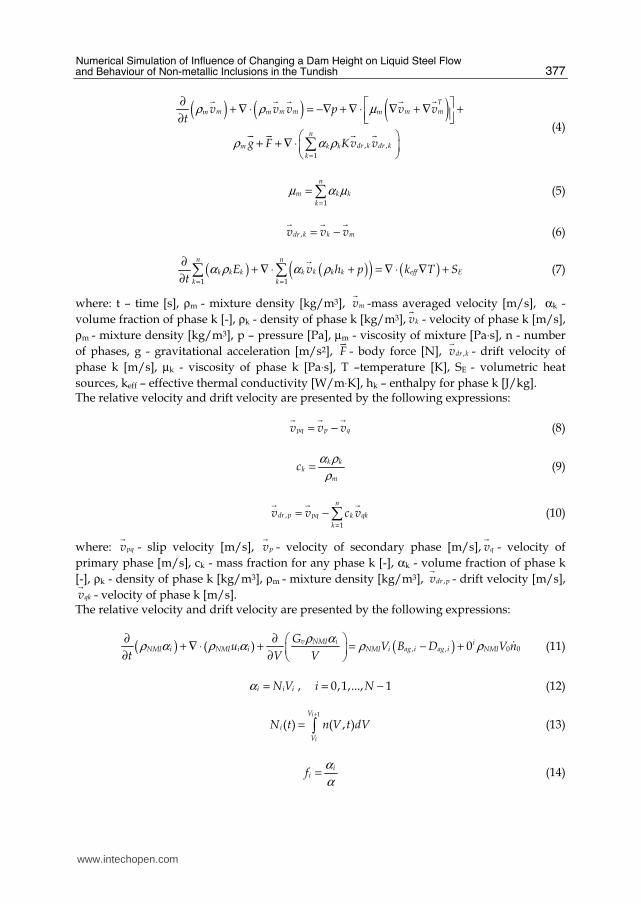
where: t – time [s], ρm - mixture density [kg/m3], mv
-mass averaged velocity [m/s], αk -
volume fraction of phase k [-], ρk - density of phase k [kg/m3], kv
- velocity of phase k [m/s],
ρm - mixture density [kg/m3], p – pressure [Pa], µm - viscosity of mixture [Pa⋅s], n - number
of phases, g - gravitational acceleration [m/s2], F
- body force [N], dr kv ,
- drift velocity of
phase k [m/s], µk - viscosity of phase k [Pa⋅s], T –temperature [K], SE - volumetric heat
sources, keff – effective thermal conductivity [W/m⋅K], hk – enthalpy for phase k [J/kg]. The relative velocity and drift velocity are presented by the following expressions:
pq p qv v v= −
(8)
k k
k
m
cα ρ
ρ= (9)
n
dr p pq qkk
k
v v c v,
1=
= − (10)
where: pqv
- slip velocity [m/s], pv
- velocity of secondary phase [m/s], qv
- velocity of
primary phase [m/s], ck - mass fraction for any phase k [-], αk - volume fraction of phase k
[-], ρk - density of phase k [kg/m3], ρm - mixture density [kg/m3], dr pv ,
- drift velocity [m/s],
qkv
- velocity of phase k [m/s]. The relative velocity and drift velocity are presented by the following expressions:
( ) ( )v NMI i iNMI i NMI i i NMI i ag i ag i NMI
Gu V B D V n
t V V, , 0 0( ) 0
ρ αρ α ρ α ρ ρ
∂ ∂ + ∇ ⋅ + = − + ∂ ∂ (11)
i i iN Vα = , i N0,1,..., 1= − (12)
i
i
V
i
V
N t n V t dV1
( ) ( , )+
= (13)
i
ifα
α= (14)
www.intechopen.com
Computational Fluid Dynamics Technologies and Applications
378
v NMI i v i i v i i
NMI i
i i i i
G G N G NV
V V V V V V
, 1 1 ,
1 1
ρ αρ − −
− +
∂ = − ∂ − − (15)
N N
ag i kj k j kj kj
k j
B a N N x,
1 1
ξ= =
= (16)
N
ag i ij i j
j
D a N N,
1=
= (17)
( )ij i ja a V V,= (18)
i ag i
kj
for V V V where i N
otherwise
11 , 1
0ξ
+ < < ≤ −=
(19)
( )ag kj i kj iV x V x V 1[ 1 ]+= + − (20)
ag i
kj
i i
V Vx
V V
1
1
+
+
−=
− (21)
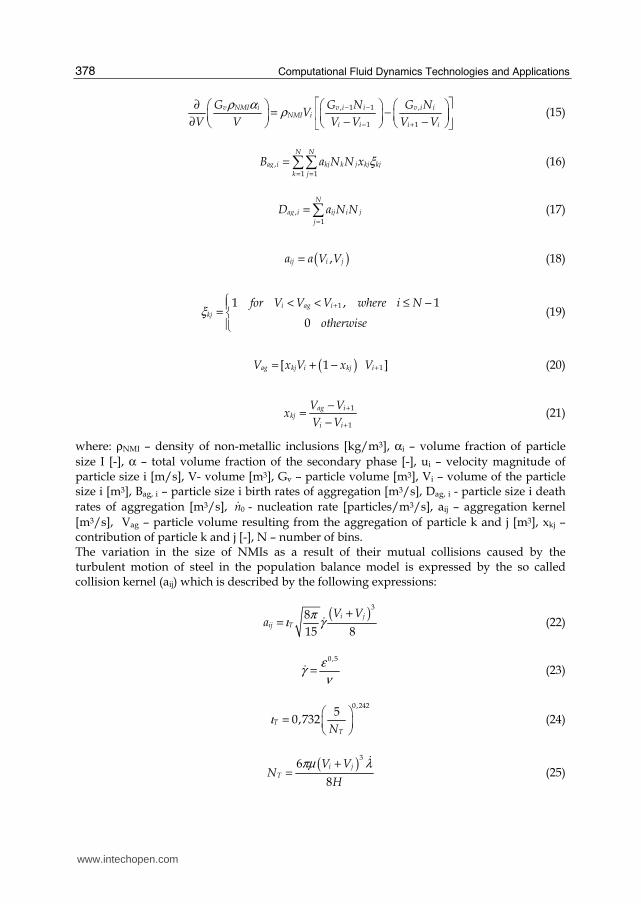
where: ρNMI – density of non-metallic inclusions [kg/m3], αi – volume fraction of particle
size I [-], α – total volume fraction of the secondary phase [-], ui – velocity magnitude of particle size i [m/s], V- volume [m3], Gv – particle volume [m3], Vi – volume of the particle size i [m3], Bag, i – particle size i birth rates of aggregation [m3/s], Dag, i - particle size i death
rates of aggregation [m3/s], n0 - nucleation rate [particles/m3/s], aij – aggregation kernel
[m3/s], Vag – particle volume resulting from the aggregation of particle k and j [m3], xkj – contribution of particle k and j [-], N – number of bins. The variation in the size of NMIs as a result of their mutual collisions caused by the turbulent motion of steel in the population balance model is expressed by the so called collision kernel (aij) which is described by the following expressions:
( )i j
ij T
V Va
38
15 8
πι γ
+= (22)
0,5ε
γν
= (23)
T
TN
0,2425
0,732ι
= (24)
( )i j
T
V VN
H
36
8
πµ λ+=
(25)
www.intechopen.com
Numerical Simulation of Influence of Changing a Dam Height on Liquid Steel Flow and Behaviour of Non-metallic Inclusions in the Tundish
379
0,54
15
ελ
πν
=
(26)
where: Tι - capture efficiency coefficient of turbulent collision, γ - shear rate, ε - turbulent
energy dissipation rate [m2/s3], ν - kinematic viscosity [m2/s], NT – ratio between viscous
force and Van der Waals force, λ - deformation rate, H – Hamaker constant for non-metallic
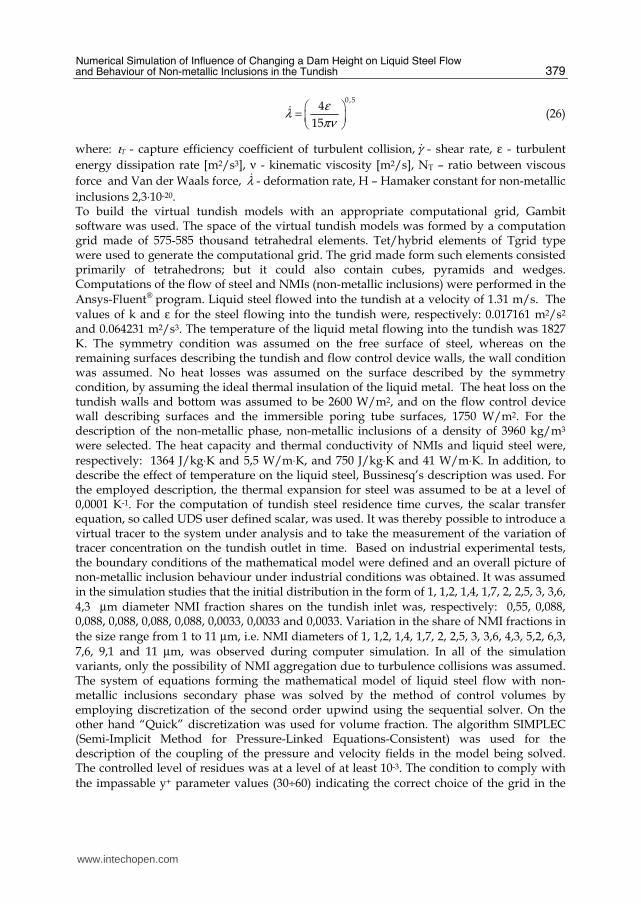
inclusions 2,3⋅10-20. To build the virtual tundish models with an appropriate computational grid, Gambit software was used. The space of the virtual tundish models was formed by a computation grid made of 575-585 thousand tetrahedral elements. Tet/hybrid elements of Tgrid type were used to generate the computational grid. The grid made form such elements consisted primarily of tetrahedrons; but it could also contain cubes, pyramids and wedges. Computations of the flow of steel and NMIs (non-metallic inclusions) were performed in the Ansys-Fluent® program. Liquid steel flowed into the tundish at a velocity of 1.31 m/s. The values of k and ε for the steel flowing into the tundish were, respectively: 0.017161 m2/s2 and 0.064231 m2/s3. The temperature of the liquid metal flowing into the tundish was 1827 K. The symmetry condition was assumed on the free surface of steel, whereas on the remaining surfaces describing the tundish and flow control device walls, the wall condition was assumed. No heat losses was assumed on the surface described by the symmetry condition, by assuming the ideal thermal insulation of the liquid metal. The heat loss on the tundish walls and bottom was assumed to be 2600 W/m2, and on the flow control device wall describing surfaces and the immersible poring tube surfaces, 1750 W/m2. For the description of the non-metallic phase, non-metallic inclusions of a density of 3960 kg/m3
were selected. The heat capacity and thermal conductivity of NMIs and liquid steel were, respectively: 1364 J/kg⋅K and 5,5 W/m⋅K, and 750 J/kg⋅K and 41 W/m⋅K. In addition, to describe the effect of temperature on the liquid steel, Bussinesq’s description was used. For the employed description, the thermal expansion for steel was assumed to be at a level of 0,0001 K-1. For the computation of tundish steel residence time curves, the scalar transfer equation, so called UDS user defined scalar, was used. It was thereby possible to introduce a virtual tracer to the system under analysis and to take the measurement of the variation of tracer concentration on the tundish outlet in time. Based on industrial experimental tests, the boundary conditions of the mathematical model were defined and an overall picture of non-metallic inclusion behaviour under industrial conditions was obtained. It was assumed in the simulation studies that the initial distribution in the form of 1, 1,2, 1,4, 1,7, 2, 2,5, 3, 3,6, 4,3 µm diameter NMI fraction shares on the tundish inlet was, respectively: 0,55, 0,088, 0,088, 0,088, 0,088, 0,088, 0,0033, 0,0033 and 0,0033. Variation in the share of NMI fractions in
the size range from 1 to 11 µm, i.e. NMI diameters of 1, 1,2, 1,4, 1,7, 2, 2,5, 3, 3,6, 4,3, 5,2, 6,3, 7,6, 9,1 and 11 µm, was observed during computer simulation. In all of the simulation variants, only the possibility of NMI aggregation due to turbulence collisions was assumed. The system of equations forming the mathematical model of liquid steel flow with non-metallic inclusions secondary phase was solved by the method of control volumes by employing discretization of the second order upwind using the sequential solver. On the other hand “Quick” discretization was used for volume fraction. The algorithm SIMPLEC (Semi-Implicit Method for Pressure-Linked Equations-Consistent) was used for the description of the coupling of the pressure and velocity fields in the model being solved. The controlled level of residues was at a level of at least 10-3. The condition to comply with
the impassable y+ parameter values (30÷60) indicating the correct choice of the grid in the
www.intechopen.com
Computational Fluid Dynamics Technologies and Applications
380
wall boundary layers was also respected. The numerical computations were made with a so called 3ddp three-dimensional double precision solver. The simulations of steel flow in the tundish furnishing variants under consideration were performed on two 64-bit computational servers, each of them being equipped with two quad core 2.4 GHz processors and an operating memory of 12 GB RAM. The assessment of flow can already be done at the stage of analysis of the graphic distribution of the RTD curve E and F (qualitative analysis). From the obtained E-type time curve distributions, it is possible to determine the values that quantitatively define the hydrodynamic conditions in the tundish (Sahai & Emi, 2008; Mazumdar & Guthrie, 1999). Thus, the ranges of the stagnant, plug, and ideal mixing flows can be determined. In this method, the stagnant flow occurs in the regions, for which the value of the dimensionless time of steel residence in the tundish exceeds the value of 2. While, the plug flow is the sum of the values of the first and the maximum times of tracer appearances on the tundish nozzle divided by two. The plug flow is most favourable for the free NMI flotation from the liquid steel, whereas the stagnant flow may lead to drops in liquid steel temperature below the level permissible for a specific steel grade. In turn, the F curve is essential for the determination of the range of the transient zone that characterizes the hydrodynamic conditions existing in the tundish during the successive casting of steel grades differing in chemical composition. In the transient zone, these is a batch of liquid metal with a composition in between those of the steel grades being cast. Hence, this is a product which is difficult to be classified and subsequently processed in the Rolling Mill's departments. The model presented in work [Clark et al.] assumes that the transient zone exist between the values 0.2 and 0.8 of the dimensionless concentration of the tracer substance used for recording the curve in the system under examination. The F curve is described by relationship 27.
tC C
FC C
0
0∞
−=
− (27)
where: C0 – initial concentration of chemical element [kg], Ct – temporary concentration of a
chemical element [kg], C∞ - final concentration of a chemical element [kg].
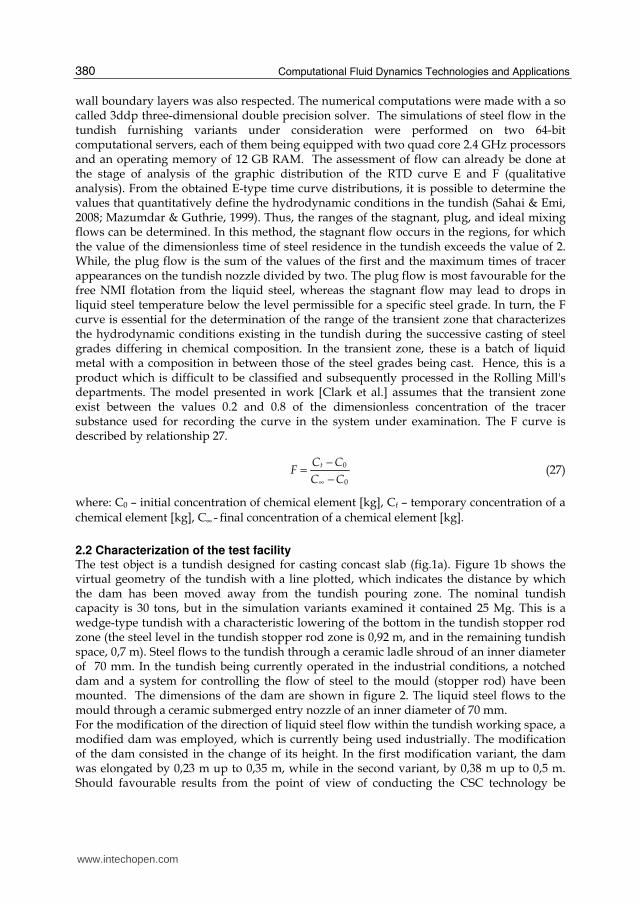
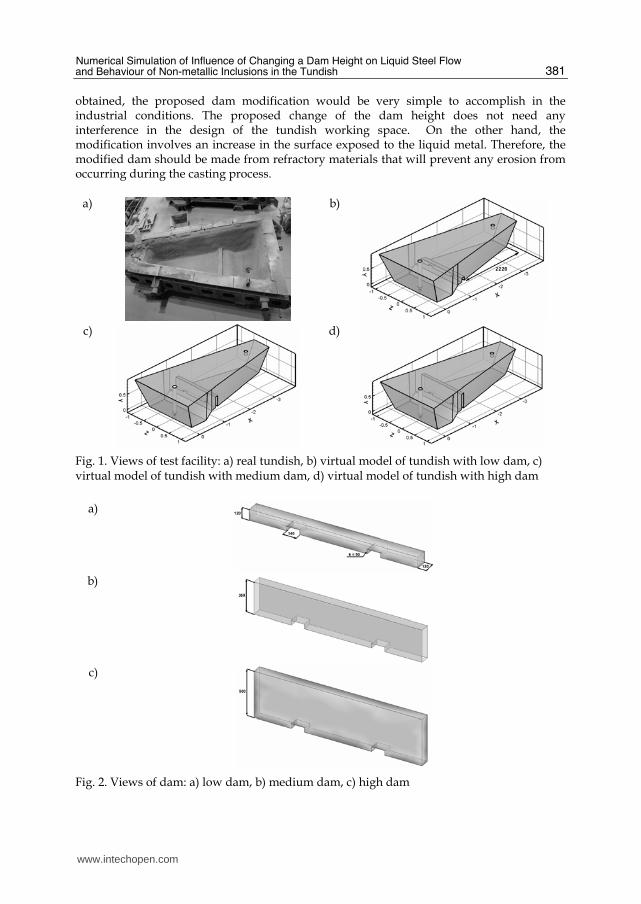
2.2 Characterization of the test facility The test object is a tundish designed for casting concast slab (fig.1a). Figure 1b shows the virtual geometry of the tundish with a line plotted, which indicates the distance by which the dam has been moved away from the tundish pouring zone. The nominal tundish capacity is 30 tons, but in the simulation variants examined it contained 25 Mg. This is a wedge-type tundish with a characteristic lowering of the bottom in the tundish stopper rod zone (the steel level in the tundish stopper rod zone is 0,92 m, and in the remaining tundish space, 0,7 m). Steel flows to the tundish through a ceramic ladle shroud of an inner diameter of 70 mm. In the tundish being currently operated in the industrial conditions, a notched dam and a system for controlling the flow of steel to the mould (stopper rod) have been mounted. The dimensions of the dam are shown in figure 2. The liquid steel flows to the mould through a ceramic submerged entry nozzle of an inner diameter of 70 mm. For the modification of the direction of liquid steel flow within the tundish working space, a modified dam was employed, which is currently being used industrially. The modification of the dam consisted in the change of its height. In the first modification variant, the dam was elongated by 0,23 m up to 0,35 m, while in the second variant, by 0,38 m up to 0,5 m. Should favourable results from the point of view of conducting the CSC technology be
www.intechopen.com
Numerical Simulation of Influence of Changing a Dam Height on Liquid Steel Flow and Behaviour of Non-metallic Inclusions in the Tundish
381
obtained, the proposed dam modification would be very simple to accomplish in the industrial conditions. The proposed change of the dam height does not need any interference in the design of the tundish working space. On the other hand, the modification involves an increase in the surface exposed to the liquid metal. Therefore, the modified dam should be made from refractory materials that will prevent any erosion from occurring during the casting process.
a)
b)
c)
d)
Fig. 1. Views of test facility: a) real tundish, b) virtual model of tundish with low dam, c) virtual model of tundish with medium dam, d) virtual model of tundish with high dam
a)
b)
c)
Fig. 2. Views of dam: a) low dam, b) medium dam, c) high dam
www.intechopen.com
Computational Fluid Dynamics Technologies and Applications
382
2.3 Description of industrial experiment The industrial experiment was aimed at verifying the steel flow hydrodynamics, as well as
the distribution of non-metallic inclusions in the steel. For the verification of the computer
simulation results for steel flow, the measurement of chemical composition of the steel was
employed, whereby so called lollipop samples were taken from the CSC machine mould.
The measurements were taken from the moment of opening until the moment of closing the
steelmaking ladle with a steel grade other than that existing in the tundish. Using a sampler,
the operator sucked in liquid steel which, after solidification, was transferred to a
quantometer where the steel was assayed for chemical composition. The samples were
taken, on the average, every 1 minute (the first 9 samples) and every 3 minutes (the
subsequent samples), depending on the casting speed (Cwudziński, 2008). Whereas, for the
verification of non-metallic inclusion distribution in the liquid steel in the tundish during
the CSC process, samples of the same type were taken from the upper part of the liquid
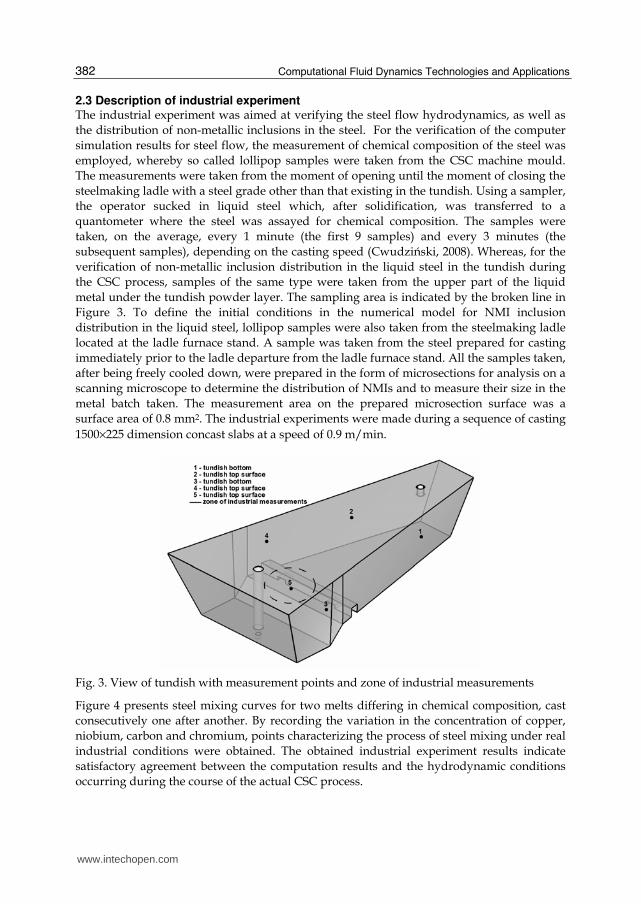
metal under the tundish powder layer. The sampling area is indicated by the broken line in
Figure 3. To define the initial conditions in the numerical model for NMI inclusion
distribution in the liquid steel, lollipop samples were also taken from the steelmaking ladle
located at the ladle furnace stand. A sample was taken from the steel prepared for casting
immediately prior to the ladle departure from the ladle furnace stand. All the samples taken,
after being freely cooled down, were prepared in the form of microsections for analysis on a
scanning microscope to determine the distribution of NMIs and to measure their size in the
metal batch taken. The measurement area on the prepared microsection surface was a
surface area of 0.8 mm2. The industrial experiments were made during a sequence of casting
1500×225 dimension concast slabs at a speed of 0.9 m/min.
Fig. 3. View of tundish with measurement points and zone of industrial measurements
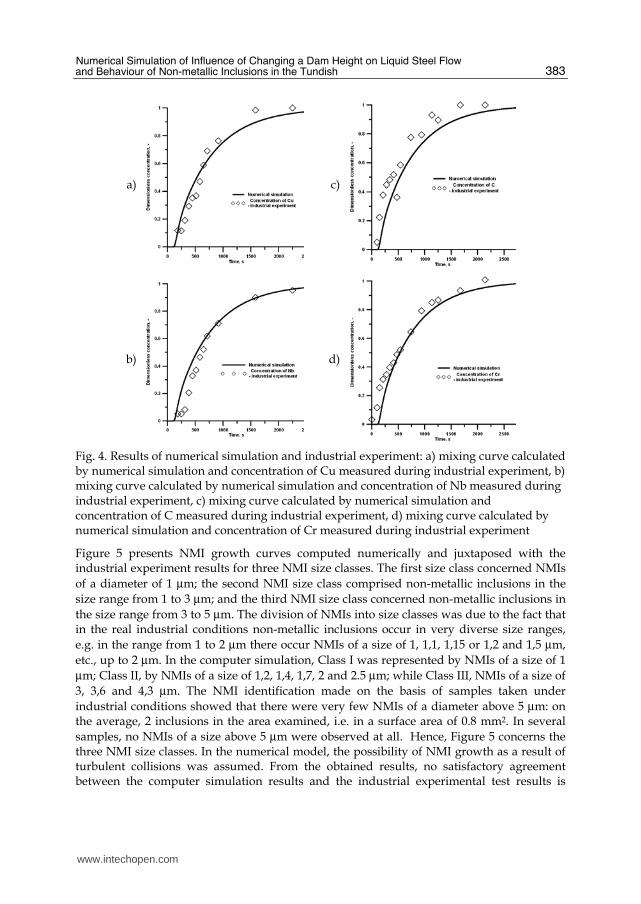
Figure 4 presents steel mixing curves for two melts differing in chemical composition, cast
consecutively one after another. By recording the variation in the concentration of copper,
niobium, carbon and chromium, points characterizing the process of steel mixing under real
industrial conditions were obtained. The obtained industrial experiment results indicate
satisfactory agreement between the computation results and the hydrodynamic conditions
occurring during the course of the actual CSC process.
www.intechopen.com
Numerical Simulation of Influence of Changing a Dam Height on Liquid Steel Flow and Behaviour of Non-metallic Inclusions in the Tundish
383
a) c)
b) d)
Fig. 4. Results of numerical simulation and industrial experiment: a) mixing curve calculated by numerical simulation and concentration of Cu measured during industrial experiment, b) mixing curve calculated by numerical simulation and concentration of Nb measured during industrial experiment, c) mixing curve calculated by numerical simulation and concentration of C measured during industrial experiment, d) mixing curve calculated by numerical simulation and concentration of Cr measured during industrial experiment
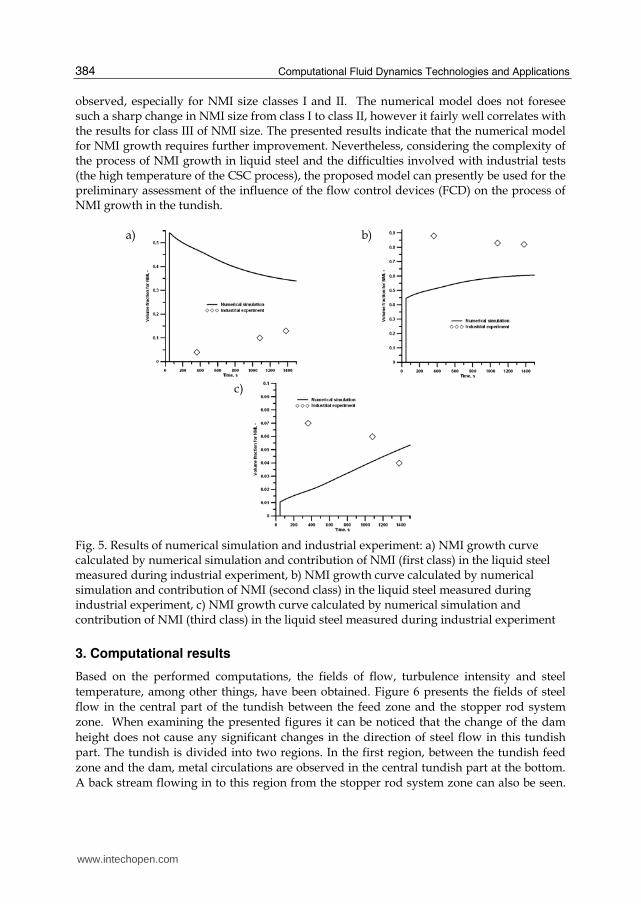
Figure 5 presents NMI growth curves computed numerically and juxtaposed with the industrial experiment results for three NMI size classes. The first size class concerned NMIs
of a diameter of 1 µm; the second NMI size class comprised non-metallic inclusions in the
size range from 1 to 3 µm; and the third NMI size class concerned non-metallic inclusions in
the size range from 3 to 5 µm. The division of NMIs into size classes was due to the fact that in the real industrial conditions non-metallic inclusions occur in very diverse size ranges,
e.g. in the range from 1 to 2 µm there occur NMIs of a size of 1, 1,1, 1,15 or 1,2 and 1,5 µm,
etc., up to 2 µm. In the computer simulation, Class I was represented by NMIs of a size of 1
µm; Class II, by NMIs of a size of 1,2, 1,4, 1,7, 2 and 2.5 µm; while Class III, NMIs of a size of
3, 3,6 and 4,3 µm. The NMI identification made on the basis of samples taken under
industrial conditions showed that there were very few NMIs of a diameter above 5 µm: on the average, 2 inclusions in the area examined, i.e. in a surface area of 0.8 mm2. In several
samples, no NMIs of a size above 5 µm were observed at all. Hence, Figure 5 concerns the three NMI size classes. In the numerical model, the possibility of NMI growth as a result of turbulent collisions was assumed. From the obtained results, no satisfactory agreement between the computer simulation results and the industrial experimental test results is
www.intechopen.com
Computational Fluid Dynamics Technologies and Applications
384
observed, especially for NMI size classes I and II. The numerical model does not foresee such a sharp change in NMI size from class I to class II, however it fairly well correlates with the results for class III of NMI size. The presented results indicate that the numerical model for NMI growth requires further improvement. Nevertheless, considering the complexity of the process of NMI growth in liquid steel and the difficulties involved with industrial tests (the high temperature of the CSC process), the proposed model can presently be used for the preliminary assessment of the influence of the flow control devices (FCD) on the process of NMI growth in the tundish.
a)
b)
c)
Fig. 5. Results of numerical simulation and industrial experiment: a) NMI growth curve calculated by numerical simulation and contribution of NMI (first class) in the liquid steel measured during industrial experiment, b) NMI growth curve calculated by numerical simulation and contribution of NMI (second class) in the liquid steel measured during industrial experiment, c) NMI growth curve calculated by numerical simulation and contribution of NMI (third class) in the liquid steel measured during industrial experiment
3. Computational results
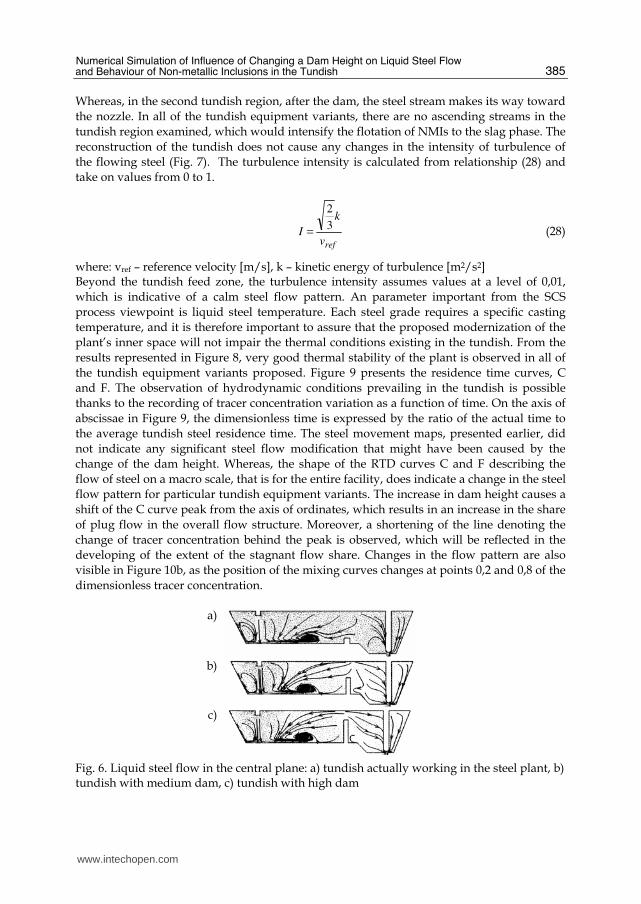
Based on the performed computations, the fields of flow, turbulence intensity and steel
temperature, among other things, have been obtained. Figure 6 presents the fields of steel
flow in the central part of the tundish between the feed zone and the stopper rod system
zone. When examining the presented figures it can be noticed that the change of the dam
height does not cause any significant changes in the direction of steel flow in this tundish
part. The tundish is divided into two regions. In the first region, between the tundish feed
zone and the dam, metal circulations are observed in the central tundish part at the bottom.
A back stream flowing in to this region from the stopper rod system zone can also be seen.
www.intechopen.com
Numerical Simulation of Influence of Changing a Dam Height on Liquid Steel Flow and Behaviour of Non-metallic Inclusions in the Tundish
385
Whereas, in the second tundish region, after the dam, the steel stream makes its way toward
the nozzle. In all of the tundish equipment variants, there are no ascending streams in the
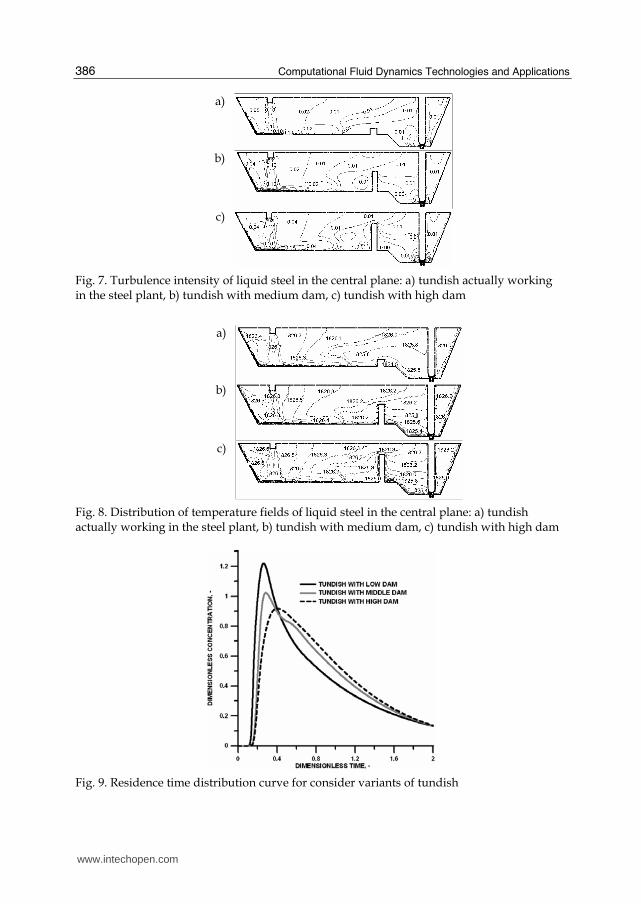
tundish region examined, which would intensify the flotation of NMIs to the slag phase. The
reconstruction of the tundish does not cause any changes in the intensity of turbulence of
the flowing steel (Fig. 7). The turbulence intensity is calculated from relationship (28) and
take on values from 0 to 1.
refv
k
I3
2
= (28)
where: vref – reference velocity [m/s], k – kinetic energy of turbulence [m2/s2] Beyond the tundish feed zone, the turbulence intensity assumes values at a level of 0,01,
which is indicative of a calm steel flow pattern. An parameter important from the SCS
process viewpoint is liquid steel temperature. Each steel grade requires a specific casting
temperature, and it is therefore important to assure that the proposed modernization of the
plant’s inner space will not impair the thermal conditions existing in the tundish. From the
results represented in Figure 8, very good thermal stability of the plant is observed in all of
the tundish equipment variants proposed. Figure 9 presents the residence time curves, C
and F. The observation of hydrodynamic conditions prevailing in the tundish is possible
thanks to the recording of tracer concentration variation as a function of time. On the axis of
abscissae in Figure 9, the dimensionless time is expressed by the ratio of the actual time to
the average tundish steel residence time. The steel movement maps, presented earlier, did
not indicate any significant steel flow modification that might have been caused by the
change of the dam height. Whereas, the shape of the RTD curves C and F describing the
flow of steel on a macro scale, that is for the entire facility, does indicate a change in the steel
flow pattern for particular tundish equipment variants. The increase in dam height causes a
shift of the C curve peak from the axis of ordinates, which results in an increase in the share
of plug flow in the overall flow structure. Moreover, a shortening of the line denoting the
change of tracer concentration behind the peak is observed, which will be reflected in the
developing of the extent of the stagnant flow share. Changes in the flow pattern are also
visible in Figure 10b, as the position of the mixing curves changes at points 0,2 and 0,8 of the
dimensionless tracer concentration.
a)
b)
c)
Fig. 6. Liquid steel flow in the central plane: a) tundish actually working in the steel plant, b) tundish with medium dam, c) tundish with high dam
www.intechopen.com
Computational Fluid Dynamics Technologies and Applications
386
a)
b)
c)
Fig. 7. Turbulence intensity of liquid steel in the central plane: a) tundish actually working in the steel plant, b) tundish with medium dam, c) tundish with high dam
a)
b)
c)
Fig. 8. Distribution of temperature fields of liquid steel in the central plane: a) tundish actually working in the steel plant, b) tundish with medium dam, c) tundish with high dam
Fig. 9. Residence time distribution curve for consider variants of tundish
www.intechopen.com
Numerical Simulation of Influence of Changing a Dam Height on Liquid Steel Flow and Behaviour of Non-metallic Inclusions in the Tundish
387
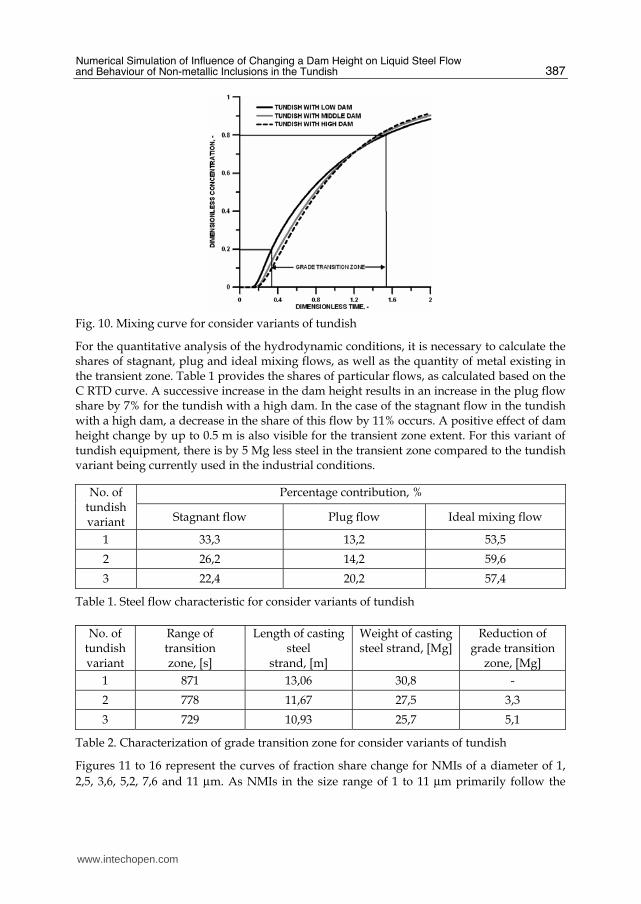
Fig. 10. Mixing curve for consider variants of tundish
For the quantitative analysis of the hydrodynamic conditions, it is necessary to calculate the shares of stagnant, plug and ideal mixing flows, as well as the quantity of metal existing in the transient zone. Table 1 provides the shares of particular flows, as calculated based on the C RTD curve. A successive increase in the dam height results in an increase in the plug flow share by 7% for the tundish with a high dam. In the case of the stagnant flow in the tundish with a high dam, a decrease in the share of this flow by 11% occurs. A positive effect of dam height change by up to 0.5 m is also visible for the transient zone extent. For this variant of tundish equipment, there is by 5 Mg less steel in the transient zone compared to the tundish variant being currently used in the industrial conditions.
Percentage contribution, % No. of tundish variant Stagnant flow Plug flow Ideal mixing flow
1 33,3 13,2 53,5
2 26,2 14,2 59,6
3 22,4 20,2 57,4
Table 1. Steel flow characteristic for consider variants of tundish
No. of tundish variant
Range of transition zone, [s]
Length of casting steel
strand, [m]
Weight of casting steel strand, [Mg]
Reduction of grade transition
zone, [Mg]
1 871 13,06 30,8 -
2 778 11,67 27,5 3,3
3 729 10,93 25,7 5,1
Table 2. Characterization of grade transition zone for consider variants of tundish
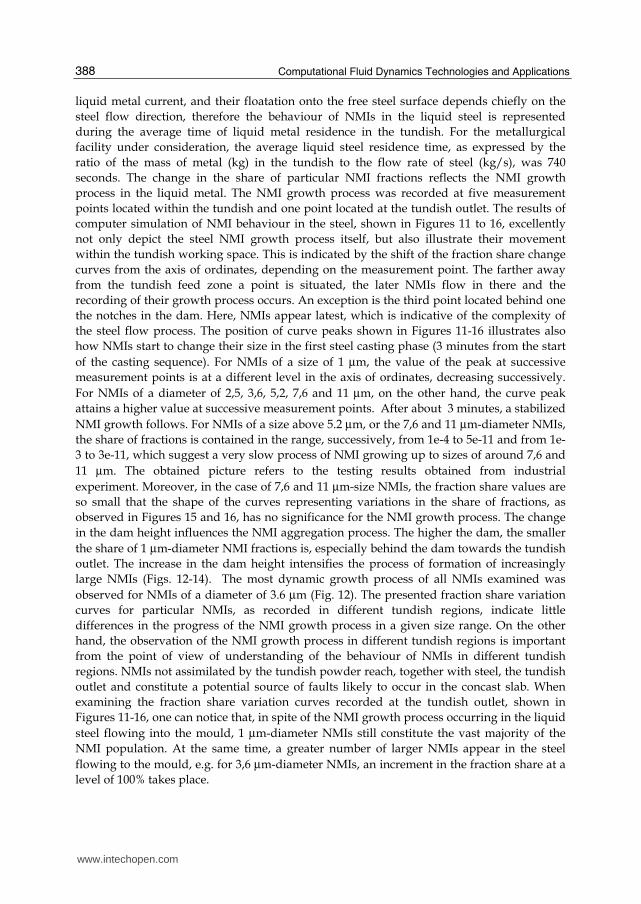
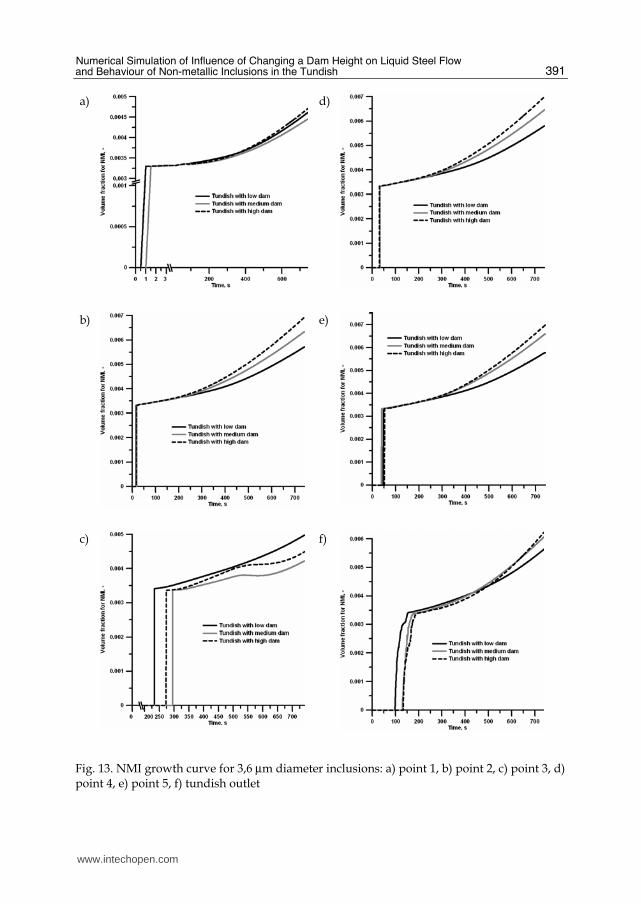
Figures 11 to 16 represent the curves of fraction share change for NMIs of a diameter of 1,
2,5, 3,6, 5,2, 7,6 and 11 µm. As NMIs in the size range of 1 to 11 µm primarily follow the
www.intechopen.com
Computational Fluid Dynamics Technologies and Applications
388
liquid metal current, and their floatation onto the free steel surface depends chiefly on the
steel flow direction, therefore the behaviour of NMIs in the liquid steel is represented
during the average time of liquid metal residence in the tundish. For the metallurgical
facility under consideration, the average liquid steel residence time, as expressed by the
ratio of the mass of metal (kg) in the tundish to the flow rate of steel (kg/s), was 740
seconds. The change in the share of particular NMI fractions reflects the NMI growth
process in the liquid metal. The NMI growth process was recorded at five measurement
points located within the tundish and one point located at the tundish outlet. The results of
computer simulation of NMI behaviour in the steel, shown in Figures 11 to 16, excellently
not only depict the steel NMI growth process itself, but also illustrate their movement
within the tundish working space. This is indicated by the shift of the fraction share change
curves from the axis of ordinates, depending on the measurement point. The farther away
from the tundish feed zone a point is situated, the later NMIs flow in there and the
recording of their growth process occurs. An exception is the third point located behind one
the notches in the dam. Here, NMIs appear latest, which is indicative of the complexity of
the steel flow process. The position of curve peaks shown in Figures 11-16 illustrates also
how NMIs start to change their size in the first steel casting phase (3 minutes from the start
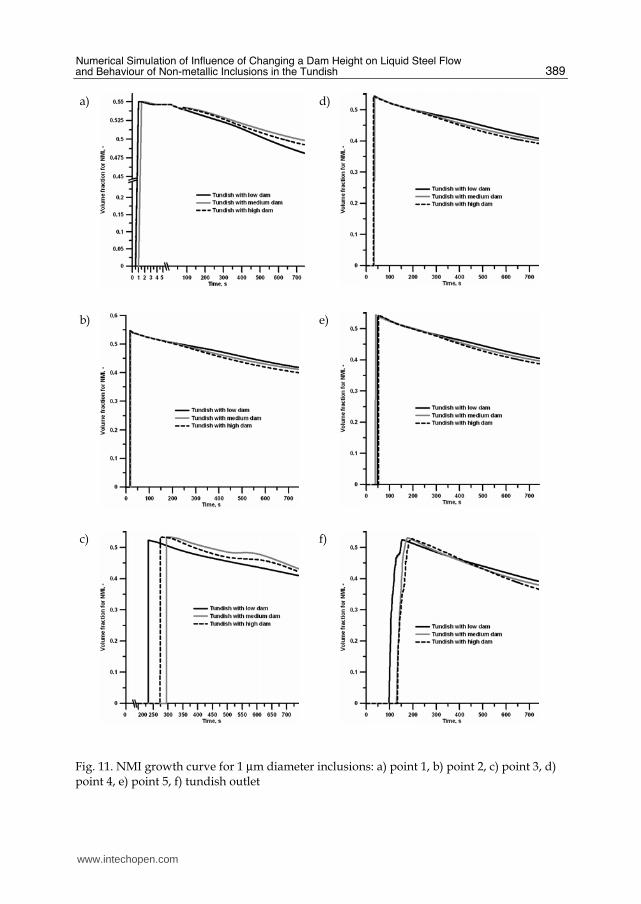
of the casting sequence). For NMIs of a size of 1 µm, the value of the peak at successive
measurement points is at a different level in the axis of ordinates, decreasing successively.
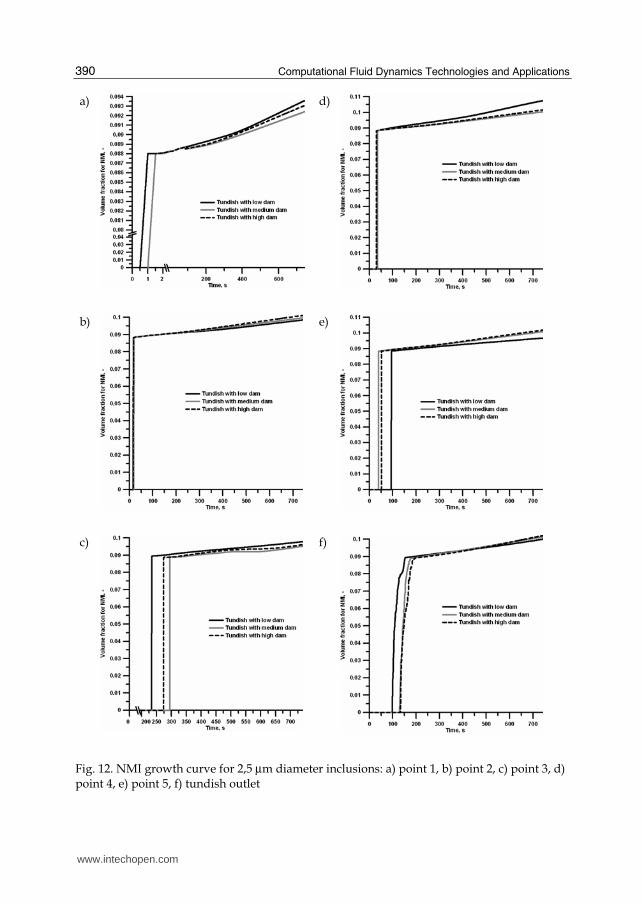
For NMIs of a diameter of 2,5, 3,6, 5,2, 7,6 and 11 µm, on the other hand, the curve peak
attains a higher value at successive measurement points. After about 3 minutes, a stabilized
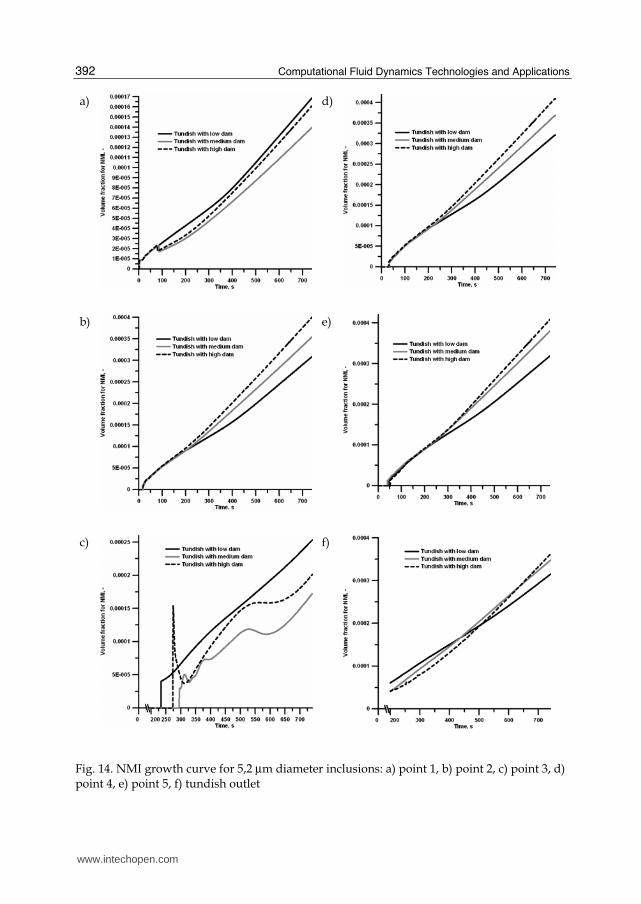
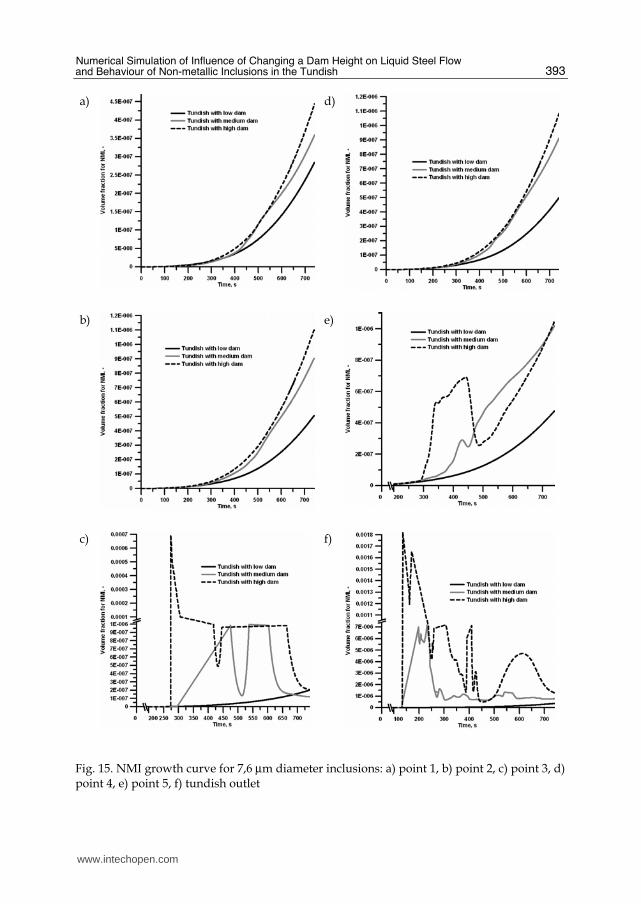
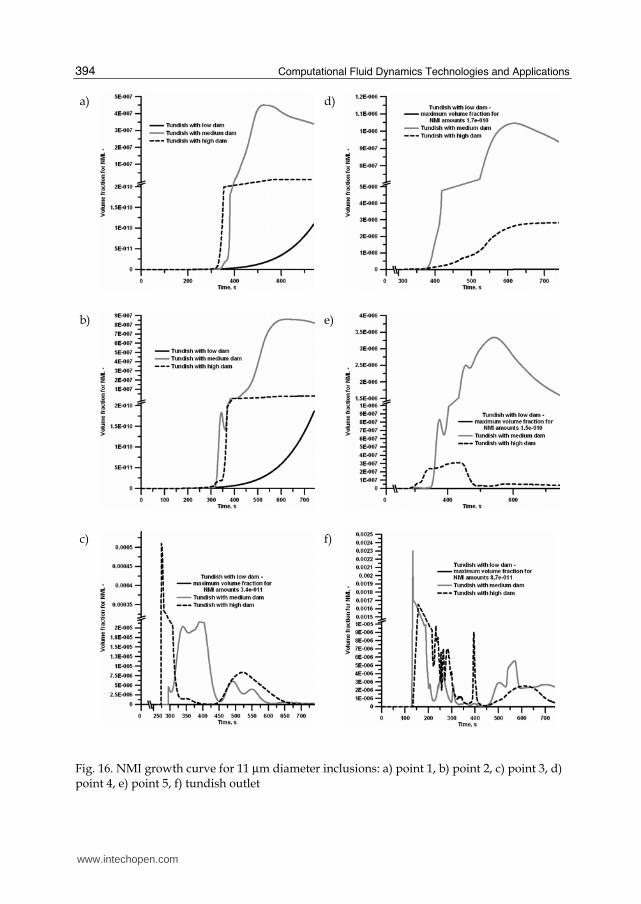
NMI growth follows. For NMIs of a size above 5.2 µm, or the 7,6 and 11 µm-diameter NMIs,
the share of fractions is contained in the range, successively, from 1e-4 to 5e-11 and from 1e-
3 to 3e-11, which suggest a very slow process of NMI growing up to sizes of around 7,6 and
11 µm. The obtained picture refers to the testing results obtained from industrial
experiment. Moreover, in the case of 7,6 and 11 µm-size NMIs, the fraction share values are
so small that the shape of the curves representing variations in the share of fractions, as
observed in Figures 15 and 16, has no significance for the NMI growth process. The change
in the dam height influences the NMI aggregation process. The higher the dam, the smaller
the share of 1 µm-diameter NMI fractions is, especially behind the dam towards the tundish
outlet. The increase in the dam height intensifies the process of formation of increasingly
large NMIs (Figs. 12-14). The most dynamic growth process of all NMIs examined was
observed for NMIs of a diameter of 3.6 µm (Fig. 12). The presented fraction share variation
curves for particular NMIs, as recorded in different tundish regions, indicate little
differences in the progress of the NMI growth process in a given size range. On the other
hand, the observation of the NMI growth process in different tundish regions is important
from the point of view of understanding of the behaviour of NMIs in different tundish
regions. NMIs not assimilated by the tundish powder reach, together with steel, the tundish
outlet and constitute a potential source of faults likely to occur in the concast slab. When
examining the fraction share variation curves recorded at the tundish outlet, shown in
Figures 11-16, one can notice that, in spite of the NMI growth process occurring in the liquid
steel flowing into the mould, 1 µm-diameter NMIs still constitute the vast majority of the
NMI population. At the same time, a greater number of larger NMIs appear in the steel
flowing to the mould, e.g. for 3,6 µm-diameter NMIs, an increment in the fraction share at a
level of 100% takes place.
www.intechopen.com
Numerical Simulation of Influence of Changing a Dam Height on Liquid Steel Flow and Behaviour of Non-metallic Inclusions in the Tundish
389
a)
d)
b)
e)
c)
f)
Fig. 11. NMI growth curve for 1 µm diameter inclusions: a) point 1, b) point 2, c) point 3, d) point 4, e) point 5, f) tundish outlet
www.intechopen.com
Computational Fluid Dynamics Technologies and Applications
390
a)
d)
b)
e)
c)
f)
Fig. 12. NMI growth curve for 2,5 µm diameter inclusions: a) point 1, b) point 2, c) point 3, d) point 4, e) point 5, f) tundish outlet
www.intechopen.com
Numerical Simulation of Influence of Changing a Dam Height on Liquid Steel Flow and Behaviour of Non-metallic Inclusions in the Tundish
391
a) d)
b)
e)
c)
f)
Fig. 13. NMI growth curve for 3,6 µm diameter inclusions: a) point 1, b) point 2, c) point 3, d) point 4, e) point 5, f) tundish outlet
www.intechopen.com
Computational Fluid Dynamics Technologies and Applications
392
a) d)
b) e)
c) f)
Fig. 14. NMI growth curve for 5,2 µm diameter inclusions: a) point 1, b) point 2, c) point 3, d) point 4, e) point 5, f) tundish outlet
www.intechopen.com
Numerical Simulation of Influence of Changing a Dam Height on Liquid Steel Flow and Behaviour of Non-metallic Inclusions in the Tundish
393
a) d)
b) e)
c)
f)
Fig. 15. NMI growth curve for 7,6 µm diameter inclusions: a) point 1, b) point 2, c) point 3, d) point 4, e) point 5, f) tundish outlet
www.intechopen.com
Computational Fluid Dynamics Technologies and Applications
394
a) d)
b) e)
c) f)
Fig. 16. NMI growth curve for 11 µm diameter inclusions: a) point 1, b) point 2, c) point 3, d) point 4, e) point 5, f) tundish outlet
www.intechopen.com
Numerical Simulation of Influence of Changing a Dam Height on Liquid Steel Flow and Behaviour of Non-metallic Inclusions in the Tundish
395
4. Conclusion
On the basis of the performed computations and industrial experiments it has been established that:
• The numerical steel flow model correctly reflects the hydrodynamic conditions of steel flow in the tundish,
• The numerical NMI growth model, in spite of the lack of satisfactory agreement with the industrial experiment results, can be used for the preliminary analysis of the influence of flow control devices on the NMI growth process,
• Increasing the dam height does not disturb the thermal stability of the tundish
• Raising the dam causes an increase in the plug flow share and a decrease in the stagnant flow share in the steel flow pattern,
• By changing the dam height, the extent of the transient zone between steel grades of different chemical composition being cast is reduced.
• The proposed upgrade of the dam will intensify the process of NMI growth in the tundish.
5. Acknowledgment
This scientific work has been financed from the resources allocated for Science in the years 2009-2011 as Research Project No. N508390437. This publication has been made with the financial support by the Foundation for Polish Science
6. References
Basu, S.; Choudhary, S. K. & Girase N. U. (2004). Nozzle clogging bahaviour of Ti-bearing Al-killed ultra low carbon steel. ISIJ International, Vol.44, No.10, pp. 1653-1660, online ISSN 1347-5460
Bessho, N.; Yamasaki, H.; Fujii, T.; Nozaki, T. & Hiwasa, S. (1992). Removal of inclusion from molten steel in continuous casting tundish. ISIJ International, Vol.32, No.1, pp. 157-163, online ISSN 1347-5460
Clark, M.; Wagner, T. & Trousset, A. Modeling for tundish applications, 01.2008, Available from http://www.foseco-steel.com/steel/downloads/technical_papers/08.pdf
Cwudziński, A. (2008). Control of steel flow in the slab tundish, PhD Thesis, Czestochowa University of Technology. (in polish)
Cwudziński, A. (2010). Numerical simulation of liquid steel flow and behaviour of non-metallic inclusions in one-strand slab tundish with subflux turbulence controller and gas permeable barrier. Ironmaking & Steelmaking, Vol.37, No.3, pp. 169-180, online ISSN 1743-2812
Gupta, N. & Chandra S. (2004). Temperature prediction model for controlling casting superheat temperature. ISIJ International, Vol.44, No.9, pp. 1517-1526, online ISSN 1347-5460
Herrera-Trejo, M.; Castro, M. R.; DMendez, J. N.; Solis, H. T.; Tena, J. M. & Guzman, E. (1998). Evolution of inclusion nature during the EAF-LF-CC process. Scandinavian Journal of Metallurgy, Vol.27, pp. 233-239, ISSN 0371-0459
www.intechopen.com
Computational Fluid Dynamics Technologies and Applications
396
Hou, Q.; Yue, Q.; Wang, H.; Zou, Z. & Yu, A. (2008). Modelling of inclusion motion and flow patterns in swirling flow tundishes with symmetrical and asymmetrical structures. ISIJ International, Vol.48, No.6, pp. 787-792, online ISSN 1347-5460
Ilegbusi, O. ; Iguchi, M. & Wahnsiedler, W. (2000). Mathematical and Physical Modeling of Materials Processing Operations, Chapman & Hall/CRC, ISBN 9781584880172
Kuklev, A. V.; Tinyakov, V. V.; Aizin, Y. M.; Gushchin V. N.; Ul’yanin V. A.; Ordin, V. G.; Lamukhin, A. M. & Zagorul’ko V. P. (2004). Optimization of the hydrodynamic characteristics of tundishes in order to remove exogeneous nonmetallic inclusions. Metallurgist, Vol.48, No.3-4, pp. 153-157, online ISSN 1573-8892
Lachmund, H. & Xie, Y. (2003). High purity steels: a challenge to improved steelmaking processes. Ironmaking & Steelmaking, Vol.30, No.2, pp. 125-129, online ISSN 1743-2812
Lopez-Ramirez, S.; Barreto, J. de J.; Palafox-Ramos, J.; Morales, R. D. & Zacharias D. (2001). Modeling study of the influence of turbulence inhibitors on the molten steel flow, tracer dispersion and inclusion trajectories in tundishes. Metallurgical and Materials Transactions B, Vol.32, August, pp. 615-627, ISSN 1073-5615
Matsuura, H.; Wang, C.; Wen, G. & Sridhar S. (2007). The transient stages of incluion evolution during Al and/or Ti additions to molten iron. ISIJ International, Vol.47, No.9, pp. 1265-1274, online ISSN 1347-5460
Mazumdar, D. & Guthrie, R. I. L. (1999). The Physical and Mathematical Modelling of Continuous Casting Tundish Systems. ISIJ International, Vol.39, No.6, pp. 524-547, online ISSN 1347-5460
Nuspl, M.; Wegscheider, W.; Dekkers, R.; Angeli, J.; Posch, W. & Mayr, M. (2004). Qualitative and quantitative determination of micro-inclusions by automated SEM/EDX analysis. Analitycal and Bioanalytical Chemistry, Vol.379, No.4, pp. 640-645, online ISSN 1618-2650
Rocabois, P.; Lehmann, J.; Gatellier, C. & Teres, J. P. (2003). Non-metallic incluions entrapment by slags: laboratory investigation. Ironmaking & Steelmaking, Vol.30, No.2, pp. 95-100, ONLINE ISSN 1743-2812
Sahai, Y. & Emi, T. (1996). Melt Flow Characterization in Continuous Casting Tundishes. ISIJ International, Vol.36, No.6, pp. 667-672, online ISSN 1347-5460
Solorio-Diaz, G.; Morales, R. D.; Palafox-Ramos, J. & Ramos-Banmderas, A. (2005). Modeling the effects of a swirling flow on temperature stratification of liquid steel and flotation of inclusions in a tundish. ISIJ International, Vol.45, No.8, pp. 1129-1137, online ISSN 1347-5460
Tanaka, H.; Nishihara, R.; Miura, R.; Tsujino, R.; Kimura, T.; Nishi, T. & Imoto T. (1994). Technology for Cleaning of molten steel in tundish. ISIJ International, Vol.34, No.11, pp. 868-875, online ISSN 1347-5460
Van Ende, M-A.; Guo, M.; Dekkers, R.; Burty, M.; Van Dyck, J.; Jones P. T.; Blanpain, B. & Wollants, P. (2009). Formation and evolution of Al-Ti oxide inclusions during secondary steel refining. ISIJ International, Vol.49, No.8, pp. 1133-1140, online ISSN 1347-5460
Xie, D.; Garlick C. & Tran, T. (2005). The wear of tundish stopper refractories by inclusion slags. ISIJ International, Vol.45, No.2, pp. 175-182, online ISSN 1347-5460
www.intechopen.com
Computational Fluid Dynamics Technologies and ApplicationsEdited by Prof. Igor Minin
ISBN 978-953-307-169-5Hard cover, 396 pagesPublisher InTechPublished online 05, July, 2011Published in print edition July, 2011
InTech EuropeUniversity Campus STeP Ri Slavka Krautzeka 83/A 51000 Rijeka, Croatia Phone: +385 (51) 770 447 Fax: +385 (51) 686 166www.intechopen.com
InTech ChinaUnit 405, Office Block, Hotel Equatorial Shanghai No.65, Yan An Road (West), Shanghai, 200040, China
Phone: +86-21-62489820 Fax: +86-21-62489821
This book is planned to publish with an objective to provide a state-of-art reference book in the area ofcomputational fluid dynamics for CFD engineers, scientists, applied physicists and post-graduate students.Also the aim of the book is the continuous and timely dissemination of new and innovative CFD research anddevelopments. This reference book is a collection of 14 chapters characterized in 4 parts: modern principles ofCFD, CFD in physics, industrial and in castle. This book provides a comprehensive overview of thecomputational experiment technology, numerical simulation of the hydrodynamics and heat transfer processesin a two dimensional gas, application of lattice Boltzmann method in heat transfer and fluid flow, etc. Severalinteresting applications area are also discusses in the book like underwater vehicle propeller, the flow behaviorin gas-cooled nuclear reactors, simulation odour dispersion around windbreaks and so on.
How to referenceIn order to correctly reference this scholarly work, feel free to copy and paste the following:
Adam Cwudzinski (2011). Numerical Simulation of Influence of Changing a Dam Height on Liquid Steel Flowand Behaviour of Non-metallic Inclusions in the Tundish, Computational Fluid Dynamics Technologies andApplications, Prof. Igor Minin (Ed.), ISBN: 978-953-307-169-5, InTech, Available from:http://www.intechopen.com/books/computational-fluid-dynamics-technologies-and-applications/numerical-simulation-of-influence-of-changing-a-dam-height-on-liquid-steel-flow-and-behaviour-of-non