Embed Size (px)
Citation preview
1(2012) 1 – 21
Numerical simulation of anisotropic polymeric foams
Abstract
This paper shows in detail the modelling of anisotropic poly-
meric foam under compression and tension loadings, includ-
ing discussions on isotropic material models and the en-
tire procedure to calibrate the parameters involved. First,
specimens of poly(vinyl chloride) (PVC) foam were investi-
gated through experimental analyses in order to understand
the mechanical behavior of this anisotropic material. Then,
isotropic material models available in the commercial soft-
ware AbaqusTMwere investigated in order to verify their abil-
ity to model anisotropic foams and how the parameters in-
volved can influence the results. Due to anisotropy, it is
possible to obtain different values for the same parameter
in the calibration process. The obtained set of parameters
are used to calibrate the model according to the applica-
tion of the structure. The models investigated showed minor
and major limitations to simulate the mechanical behavior
of anisotropic PVC foams under compression, tension and
multi-axial loadings. Results show that the calibration pro-
cess and the choice of the material model applied to the
polymeric foam can provide good quantitative results and
save project time. Results also indicate what kind and order
of error one will get if certain choices are made throughout
the modelling process. Finally, even though the developed
calibration procedure is applied to specific PVC foam, it still
outlines a very broad drill to analyze other anisotropic cel-
lular materials.
Keywords
Polymeric foams; Anisotropy; Parameters calibration; Ma-
terial models.
Volnei Tita∗ and Mauricio Fran-cisco Caliri Junior
Aeronautical Engineering Department, Engi-
neering School of Sao Carlos, University of Sao
Paulo Av. Trabalhador Sao-Carlense 400, Sao
Carlos, SP, Brazil
Received 29 Mar 2012;In revised form 28 Apr 2012
∗ Author email: [email protected]
1
1 INTRODUCTION2
Structural modelling of polymeric foams is an intricate task, especially when the cellular ma-3
terial involved presents well defined elastic and plastic anisotropic mechanical behaviors. This4
intricate task occurs for example on dynamic and quasi-static structural analyses for sandwich5
composite airplane structures, where the skins are made from composite material and the6
Latin American Journal of Solids and Structures 1(2012) 1 – 21
2 Volnei Tita et al / Numerical simulation of anisotropic polymeric foams
core is made from polymeric foams. In this case, not only the skins, but also the core shows7
anisotropic effects under multi-axial loadings, which influence the structure’s response. In fact,8
the manufacturing process of cellular materials, especially polymeric foams, might greatly influ-9
ence its phenomenological mechanical response, which is composed by the contributions from10
the micro structures (micro cells) within the material. Gong, Kyriakides and Jang[11] showed11
how the micro structure of the cells influence the structural strength and stability of a poly-12
meric foam. Also, a broad data about manufacturing processes of polymeric foams provides a13
lot of insights about the micro structure’s final shape [13]. Thus, an anisotropic mechanical14
behavior is not a very uncommon characteristic found in foams. The micro mechanisms of15
failure, which occurs in these foams, play an important role in the hardening process, because16
the mechanisms can indicate brittle, plastic or perfect plastic response of the material after its17
elastic regime and according to the type of loading applied. Besides, these materials present18
great strain energy potentials, which make them attractive to structural impact applications.19
Their low relative densities (the ratio of the cellular material density to the base material20
density) turn these materials very strategic to be applied on thermal and acoustic isolation21
as well. These particularities and other reasons have motivated many researchers into investi-22
gating cellular materials. Gibson and Ashby [8]wrote a landmark book and, besides, a whole23
micromechanical approach for cellular materials, several potential applications can be found.24
Newer and more common applications for cellular structures comprise the use of sandwich25
structures. For example, the special foams used in modern structures such as aircrafts and26
boat hulls. Thus, a lot of scientific works can be seen in the literature about the mechanical27
behavior prediction of structures made from cellular materials, using analytic and numerical28
analyses combined to experimental tests [10, 15, 17–20, 22, 26]. However, many works do not29
consider the anisotropic effects and the numeric simulations are carried out using only the30
input data (material model parameters and hardening curve) from uniaxial compression test31
for one anisotropy direction[18, 19].32
To master the modelling of such structures and materials, one must go over theories of33
elasticity and plasticity to properly manage yield surfaces and hardening laws[24]. Adding34
numerical issues from non linear FEA (Finite Element Analyses) to these different elastic-35
plastic behaviors makes the modelling of anisotropic responses a non trivial task. Engineers36
and designers often use implemented material models in FEA commercial codes to save time37
during the project development. If the particular material model available in the FEA software38
does not yield representative results, another material model can be implemented via a user39
sub-routine, but this approach depends on the FEA software resources. Furthermore, a yield40
surface, which accounts for different strengths in compression and tension, as well as different41
hardening intensities that vary with the loading path and the material direction, is rarely42
found and properly used. In addition, the models must be capable of dealing with large43
logarithmic strains (higher than 100%). Therefore, it is very important to carefully select44
and use material models implemented in FEA commercial codes, but of utmost importance is45
the calibration of the material model parameters. The main challenge is how to properly set46
parameters values to an isotropic material model in order to simulate the mechanical behavior47
Latin American Journal of Solids and Structures 1(2012) 1 – 21
Volnei Tita et al / Numerical simulation of anisotropic polymeric foams 3
of the anisotropic cellular material. It must be also mentioned that the inherent numeric issues48
from the assumptions made in the implemented material model can add up in the simulations49
rendering large errors. All these aspects are rarely discussed in the literature, because most50
of the contributions focus on assuming that the cellular materials is isotropic [18, 19] or focus51
on developing a new anisotropic material model [5–7, 9, 25, 27] without concerning whether52
or not such model is worthy applied. Isotropic material models are very important, but often,53
the anisotropy degree of cellular materials is very high to be neglected without any insights54
into the material’s micromechanics. On the other hand, anisotropic material models have a55
huge number of parameters to be identified (usually, over ten different types of experimental56
tests are required [25]). Engineers and designers prefer to use isotropic material models in57
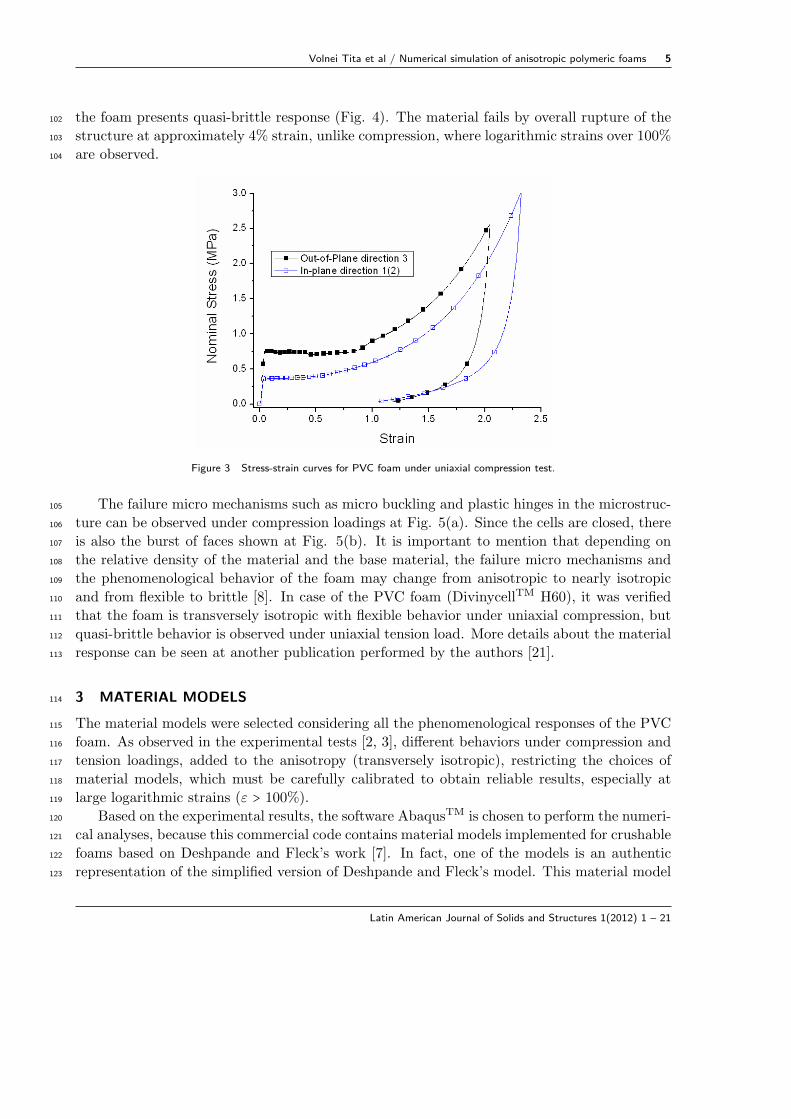
order to predict the mechanical behavior of products made from anisotropic cellular materials58
(e.g. polymeric foams), because the number of experimental tests to identify parameters does59
not demand a lot of time, specially, during the conceptual and preliminary design phases.60
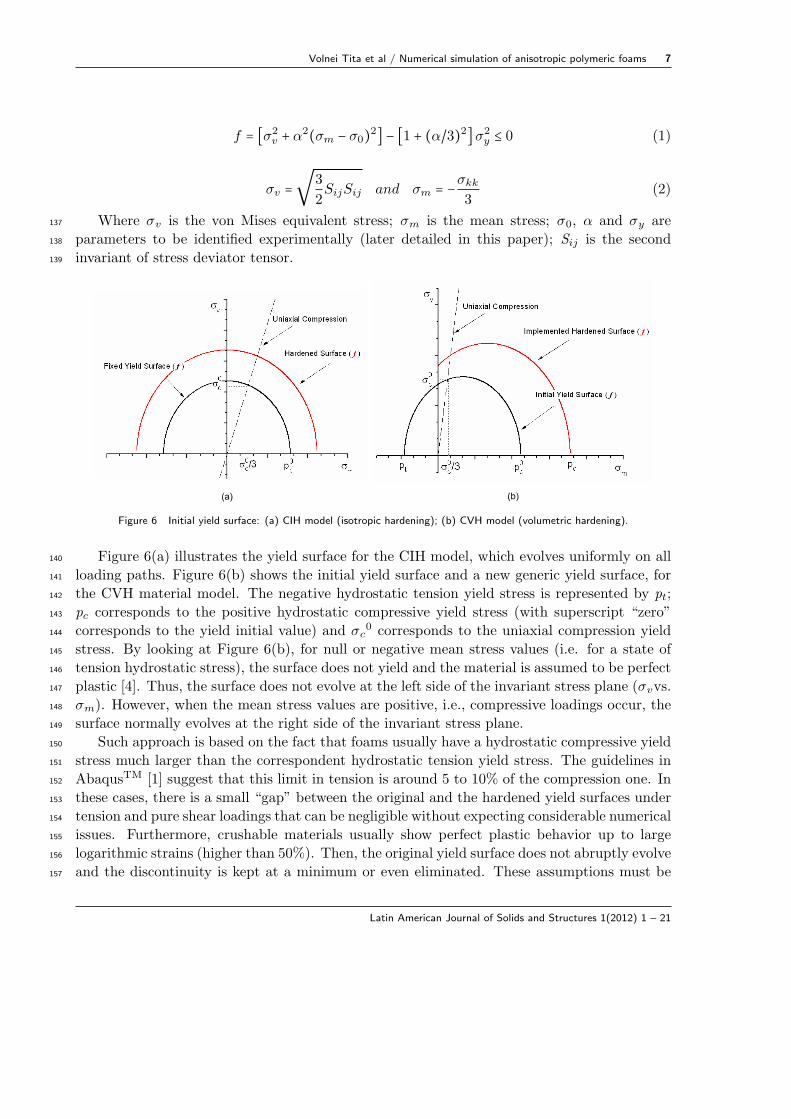
Therefore, it is very important to properly handle the parameters in these material models,61
using adequate procedures.62
Regarding the comments above, this paper shows in detail the modelling of anisotropic63
polymeric foams under compression and tension loadings, focusing on the numeric issues that64
influence the results. Also the accuracy of such results is investigated based on the calibrated65
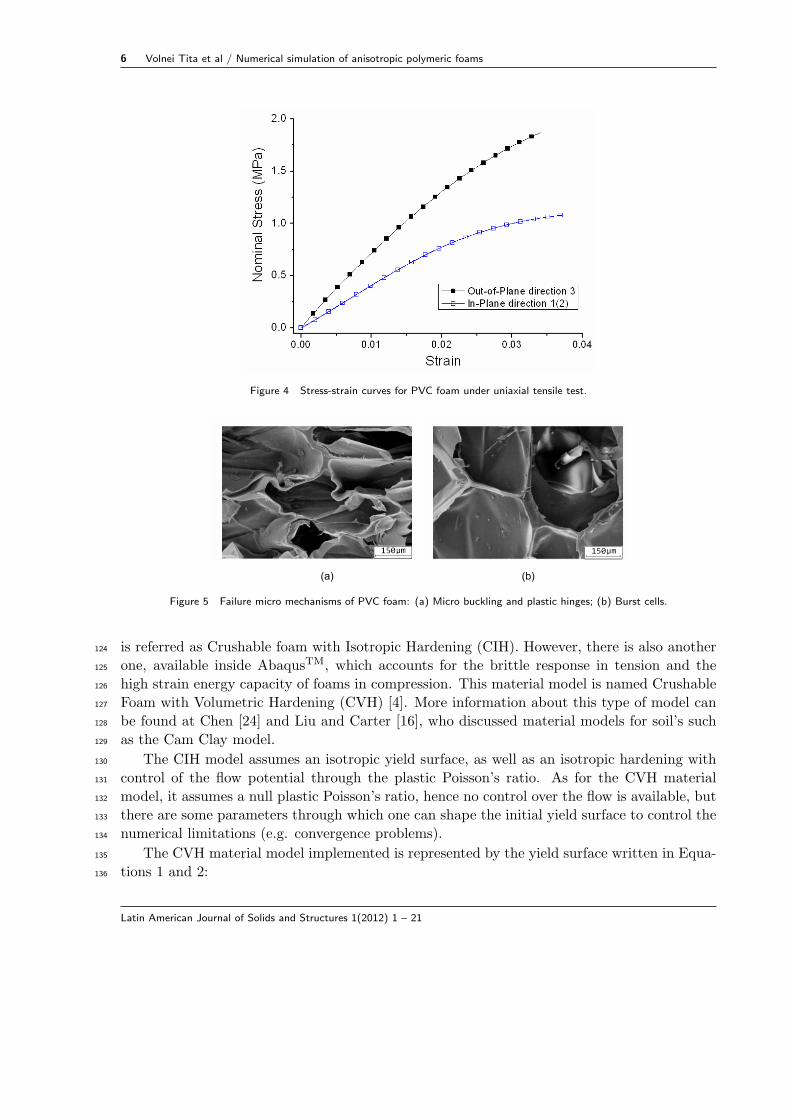
parameters. Firstly, specimens of poly(vinyl chloride) (PVC) foam, were investigated through66
experimental analyses in order to understand the mechanical behavior of this anisotropic67
material[21]. Secondly, by inspecting the experimental results and based on the Abrate’s68
[5] study on material models for cellular structures as well as observing most of the references69
in the literature, it was decided to work with two material models available in the commercial70
software AbaqusTM [1]. They are based on the work developed by Deshpande and Fleck [7] and71
are judged to yield good results; however, the ability of these models for simulating anisotropic72
structures should be shown. Naturally, there are advantages and limitations to simulate the73
mechanical behavior of PVC foam, using these material models, but they can be minimized or74
even overcome with suitable parameters calibration. Thus, for the material models chosen, a75
calibration procedure was developed in order to identify the most appropriate parameters and76
hardening curves through only three or five experimental tests. Even though the calibration77
procedure is applied for specific PVC foam, it still outlines a very broad drill to analyze other78
anisotropic cellular materials.79
2 MECHANICAL BEHAVIOR OF ANISOTROPIC POLYMERIC FOAMS80
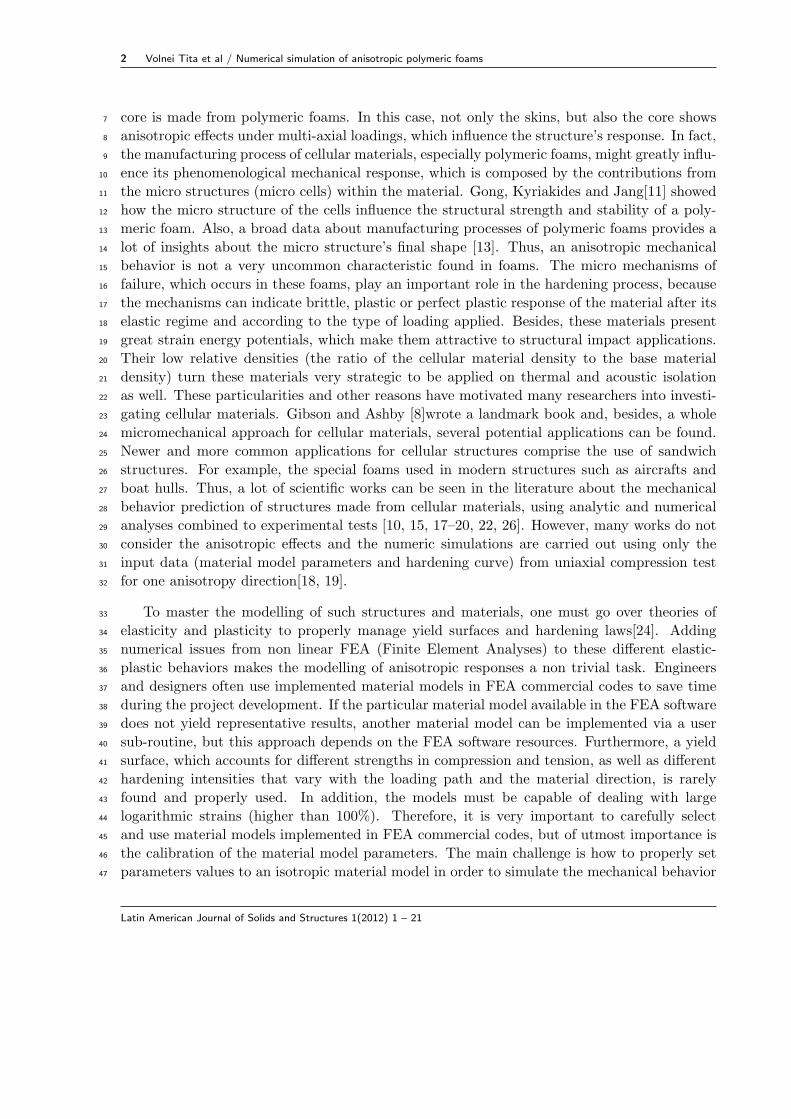
Closed-cell rigid foam, DivinycellTM H60 from DIAB [4], was investigated in this work (Fig. 1).81
The base material is the poly(vinyl chloride) (PVC) polymer, which has density of 60kg/m3 and82
relative density around 0.043 (ρPVC= 1400 kg/m3). There is also anisotropy in this material,83
which can be classified as transversely isotropic. Then, two sets of mechanical properties must84
be determined: in-plane properties (for directions 1 or 2) and out-of-plane properties (for85
direction 3) (Fig. 1).86
Latin American Journal of Solids and Structures 1(2012) 1 – 21
4 Volnei Tita et al / Numerical simulation of anisotropic polymeric foams
Figure 1 PVC foam: material axes (1-2-3). Transversely isotropic material: in-plane directions (1 and 2);
out-of-plane direction (3)
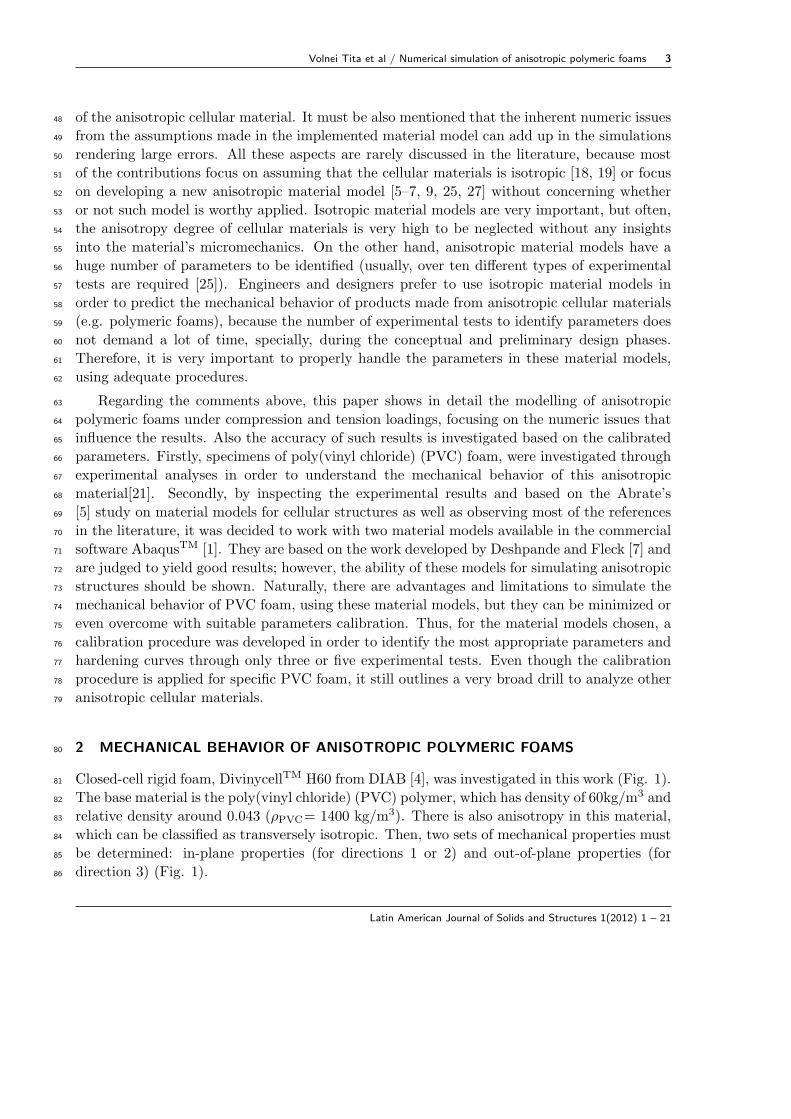
The foam’s final micro structure and its anisotropic behavior are related according to Fig.87
2(a), which shows elongated cells in direction 3, similar to oblongs. Figure 2(b) shows a nearly88
circular pattern for plane 1-2. Such disposal renders denser transversal planes to planes 1-3,89
due to the presence of more vertices and edges, as well as thicker micro structures, which90
stiffs and strengthens the material in the normal direction 3 (out-of-plane direction). This91
mechanical behavior can be confirmed by Fig. 3, which shows the phenomenological response92
for PVC foam under uniaxial compression in both directions (out-of plane direction or direction93
3; in-plane direction or direction 1 or 2).94
(a) (b)
Figure 2 Micrographs of the PVC foam highlighting the pattern of the cells: (a) plane 1-3; (b) plane 1-2.
Under uniaxial compression loadings, the material exhibits a linear elastic phase as shown95
in Fig. 3. Past the yield stress, the material behaves similarly to perfect plastic regular96
materials up to a point where almost all cells have buckled in what is known as crushing97
due to compression. Then, the densification process occurs with the self contact of the cells98
in the micro structures, which increases the strength and stiffness foam. Therefore, buckling99
no longer takes place and the foam, which is a structure, presents a mechanical behavior100
close to its base material (PVC). Under uniaxial tension loading, contrary to compression,101
Latin American Journal of Solids and Structures 1(2012) 1 – 21
Volnei Tita et al / Numerical simulation of anisotropic polymeric foams 5
the foam presents quasi-brittle response (Fig. 4). The material fails by overall rupture of the102
structure at approximately 4% strain, unlike compression, where logarithmic strains over 100%103
are observed.104
Figure 3 Stress-strain curves for PVC foam under uniaxial compression test.
The failure micro mechanisms such as micro buckling and plastic hinges in the microstruc-105
ture can be observed under compression loadings at Fig. 5(a). Since the cells are closed, there106
is also the burst of faces shown at Fig. 5(b). It is important to mention that depending on107
the relative density of the material and the base material, the failure micro mechanisms and108
the phenomenological behavior of the foam may change from anisotropic to nearly isotropic109
and from flexible to brittle [8]. In case of the PVC foam (DivinycellTM H60), it was verified110
that the foam is transversely isotropic with flexible behavior under uniaxial compression, but111
quasi-brittle behavior is observed under uniaxial tension load. More details about the material112
response can be seen at another publication performed by the authors [21].113
3 MATERIAL MODELS114
The material models were selected considering all the phenomenological responses of the PVC115
foam. As observed in the experimental tests [2, 3], different behaviors under compression and116
tension loadings, added to the anisotropy (transversely isotropic), restricting the choices of117
material models, which must be carefully calibrated to obtain reliable results, especially at118
large logarithmic strains (ε > 100%).119
Based on the experimental results, the software AbaqusTM is chosen to perform the numeri-120
cal analyses, because this commercial code contains material models implemented for crushable121
foams based on Deshpande and Fleck’s work [7]. In fact, one of the models is an authentic122
representation of the simplified version of Deshpande and Fleck’s model. This material model123
Latin American Journal of Solids and Structures 1(2012) 1 – 21
6 Volnei Tita et al / Numerical simulation of anisotropic polymeric foams
Figure 4 Stress-strain curves for PVC foam under uniaxial tensile test.
(a) (b)
Figure 5 Failure micro mechanisms of PVC foam: (a) Micro buckling and plastic hinges; (b) Burst cells.
is referred as Crushable foam with Isotropic Hardening (CIH). However, there is also another124
one, available inside AbaqusTM, which accounts for the brittle response in tension and the125
high strain energy capacity of foams in compression. This material model is named Crushable126
Foam with Volumetric Hardening (CVH) [4]. More information about this type of model can127
be found at Chen [24] and Liu and Carter [16], who discussed material models for soil’s such128
as the Cam Clay model.129
The CIH model assumes an isotropic yield surface, as well as an isotropic hardening with130
control of the flow potential through the plastic Poisson’s ratio. As for the CVH material131
model, it assumes a null plastic Poisson’s ratio, hence no control over the flow is available, but132
there are some parameters through which one can shape the initial yield surface to control the133
numerical limitations (e.g. convergence problems).134
The CVH material model implemented is represented by the yield surface written in Equa-135
tions 1 and 2:136
Latin American Journal of Solids and Structures 1(2012) 1 – 21
Volnei Tita et al / Numerical simulation of anisotropic polymeric foams 7
f = [σ2v + α2(σm − σ0)2] − [1 + (α/3)2]σ2
y ≤ 0 (1)
σv =√
3
2SijSij and σm = −
σkk
3(2)
Where σv is the von Mises equivalent stress; σm is the mean stress; σ0, α and σy are137
parameters to be identified experimentally (later detailed in this paper); Sij is the second138
invariant of stress deviator tensor.139
(a)
(b)
Figure 6 Initial yield surface: (a) CIH model (isotropic hardening); (b) CVH model (volumetric hardening).
Figure 6(a) illustrates the yield surface for the CIH model, which evolves uniformly on all140
loading paths. Figure 6(b) shows the initial yield surface and a new generic yield surface, for141
the CVH material model. The negative hydrostatic tension yield stress is represented by pt;142
pc corresponds to the positive hydrostatic compressive yield stress (with superscript “zero”143
corresponds to the yield initial value) and σc0 corresponds to the uniaxial compression yield144
stress. By looking at Figure 6(b), for null or negative mean stress values (i.e. for a state of145
tension hydrostatic stress), the surface does not yield and the material is assumed to be perfect146
plastic [4]. Thus, the surface does not evolve at the left side of the invariant stress plane (σvvs.147
σm). However, when the mean stress values are positive, i.e., compressive loadings occur, the148
surface normally evolves at the right side of the invariant stress plane.149
Such approach is based on the fact that foams usually have a hydrostatic compressive yield150
stress much larger than the correspondent hydrostatic tension yield stress. The guidelines in151
AbaqusTM [1] suggest that this limit in tension is around 5 to 10% of the compression one. In152
these cases, there is a small “gap” between the original and the hardened yield surfaces under153
tension and pure shear loadings that can be negligible without expecting considerable numerical154
issues. Furthermore, crushable materials usually show perfect plastic behavior up to large155
logarithmic strains (higher than 50%). Then, the original yield surface does not abruptly evolve156
and the discontinuity is kept at a minimum or even eliminated. These assumptions must be157
Latin American Journal of Solids and Structures 1(2012) 1 – 21
8 Volnei Tita et al / Numerical simulation of anisotropic polymeric foams
carefully followed mainly for tension and shearing loads. If the cellular material presents strong158
hardening and if the hydrostatic tension yield stress is higher than the 5-10% of the compressive159
yield stress for the respective yield surface, then, under multi-axial loadings (shearing combined160
with tension loadings), numerical issues will occur. These errors are expected due to the161
discontinuity in the yield surface, which cannot be neglected anymore. Managing element size,162
shape functions and mesh density may control the convergence of the numerical solution to163
possibly circumvent or overcome such limitation of the implemented material model. On the164
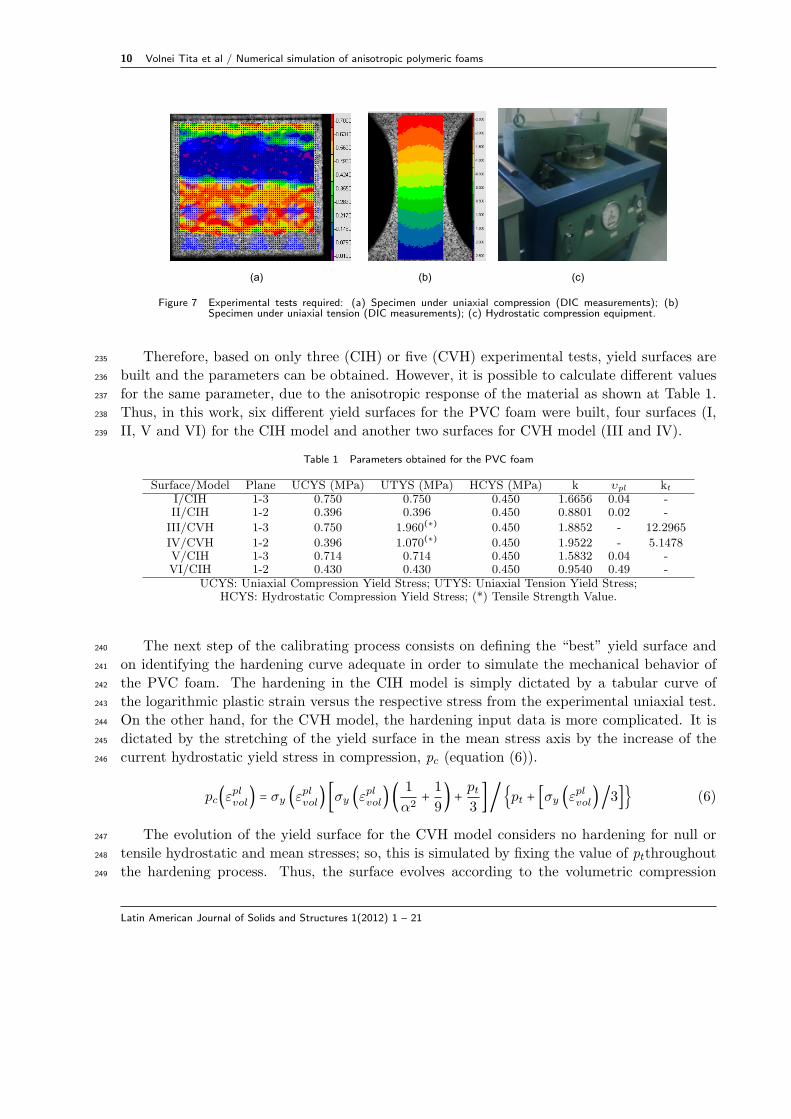
other hand, analyses under mainly compressive loadings are represented accurately.165
Finally, based on the formulation shown, despite all limitations, the authors believe that166
the CVH model can better simulate the mechanical behavior of the PVC foam herein discussed.167
Mainly, because the CVH model offers more control over the initial yield surface, which allows168
one to better represent the elastic and plastic anisotropic behavior of the cellular material.169
Hence, in this work, focus will be given to the CVH model rather than the CIH one, which poses170
no great modelling issues. However, to properly use the CVH material model, its parameters171
must be calibrated carefully and according to the application of structure in service. For this172
paper, the difficulties in calibrating the CVH model to better simulate the anisotropic rigid173
PVC foam are discussed and how accurate and trustful the results are.174
4 PARAMETERS CALIBRATION PROCEDURE175
Regarding the material models described earlier, it is not so difficult to identify σy and σ0.176
First, the material’s yield stress (σy) is evaluated using uniaxial tests. Second, σ0 is the transla-177
tion value of the yield stress in the mean stress axis (value at the abscissa coordinate). However,178
the parameter α is the most intricate one that it is defined by Equations (3-5), which show its179
relation to the shape of the yield surface [4]:180
α = 3k/√(3kt + k)(3 − k) (3)
181
k = σ0c/p0c (4)
182
kt = pt/p0c (5)
Thus, parameter α depends on the k and kt, which are the actual parameters to be cali-183
brated within AbaqusTM along with the hardening curve. As for the elastic phase, the material184
is considered isotropic; so the elastic Poisson’s ratio and Young’s modulus are required as usual.185
In the plastic regime, the CVH model assumes a null plastic Poisson’s ratio (υpl), which locks186
the control over the flow potential. A control over the shape of the yield surfaces through the187
ratio k and kt are offered instead. An initial isotropic yield surface can be defined in the CVH188
model by setting σ0 equal to “0” (zero) and kt equal to “1” (one).189
As for the CIH material model, it is only necessary to define the k ratio value, but now the190
plastic Poisson’s ratio is required. Changing the plastic Poisson’s ratio allows a better control191
over the hardening as to the hydrostatic and shear stress contributions in the plastic regime,192
even though this control is done symmetrically to the shear stress axis. Despite the fact the193
Latin American Journal of Solids and Structures 1(2012) 1 – 21
Volnei Tita et al / Numerical simulation of anisotropic polymeric foams 9
CVH locks control over the plastic Poisson’s ratio; it provides an anisotropy control with the194
introduction of the parameter kt.195
Definitions of k and kt parameters must be well understood and the consequences of their196
numeric values must be investigated. The latter is often overlooked. The first one is the197
quotient of the initial yield stress in uniaxial compression (σc0) to the initial yield stress in198
hydrostatic compression (pc0) as shown by Eq. 4. The second one is the quotient of the yield199
stress in hydrostatic tension (pt) to the initial yield stress in hydrostatic compression (pc0) as200
shown by Eq. 5. The hydrostatic tension does not carry the super script “0”, because the yield201
surface does not evolved under null or tensile mean stresses (source of possible discontinuities).202
Based on k and kt values, AbaqusTM calculates the current yield surface for each foam material203
point at the finite element model. To complete the input data set for the CIH and CVHmaterial204
models, a table containing the logarithmic plastic strain and the correspondent Cauchy stress205
must be provided for the finite element model in order to control the evolution of the yield206
surface.207
The procedure for determination of parameters consists on data from uniaxial compressive208
and tensile tests, and from hydrostatic compressive tests. Uniaxial tests are usually easy to209
perform, but hydrostatic tests are not. One could replace the hydrostatic test by a shear test to210
calibrate the third parameter. However, since the material has two sets of properties, choosing211
a plane (1-2 or 1-3(2-3)) to perform the shear test may be questionable as to which one better212
suits the current analysis; given that one is dealing with multi-axial loadings. Moreover, the213
cellular characteristic of the material implies different failure mechanisms depending on the214
loading path. Hence, due to these issues, choosing the hydrostatic compression test not only215
improves the identification of the parameters towards an isotropic value for the anisotropic216
foam, but also in regard to its failure mechanism in compressive loading.217
The uniaxial tests (compression and tension) were taken for both planes (1-2 and 1-3) with218
loading in both directions (1(or 2) and 3). Most of experimental tests followed standards tests219
[2, 3] and were supported by a Digital Image Correlation (DIC) technique [12, 21]. In this220
work, data for directions 3 and 1 were evaluated to study the anisotropic behavior of the PVC221
foam. The yield stress in uniaxial compression was set to be the maximum stress level at222
the beginning of the plateau level, usually indicated by a peak after the linear elastic regime223
(Fig. 3). Under uniaxial tension, due to the quasi-brittle response observed (Fig. 4), a yield224
stress for the foam was set to occur at 1% of total strain in this work. This assumption is225
helpful in the calibration of the material model, which requires a priori, values of yield stress,226
not strength values. In the case of the hydrostatic test, the yield stress was identified when a227
large volumetric strain began to take place in the sample with a reduction of the total pressure228
shown by the hydrostatic compression system. These tests provided the necessary data to229
determine different initial yield surfaces, from which the parameters k and kt are calculated,230
as well as different hardening curves. It is important to mention that if the CIH material231
model is chosen, then only three experimental tests are required: uniaxial compression (Fig.232
7(a)) or tension tests (Fig. 7(b)) for both material planes (1-2 and 1-3) and the hydrostatic233
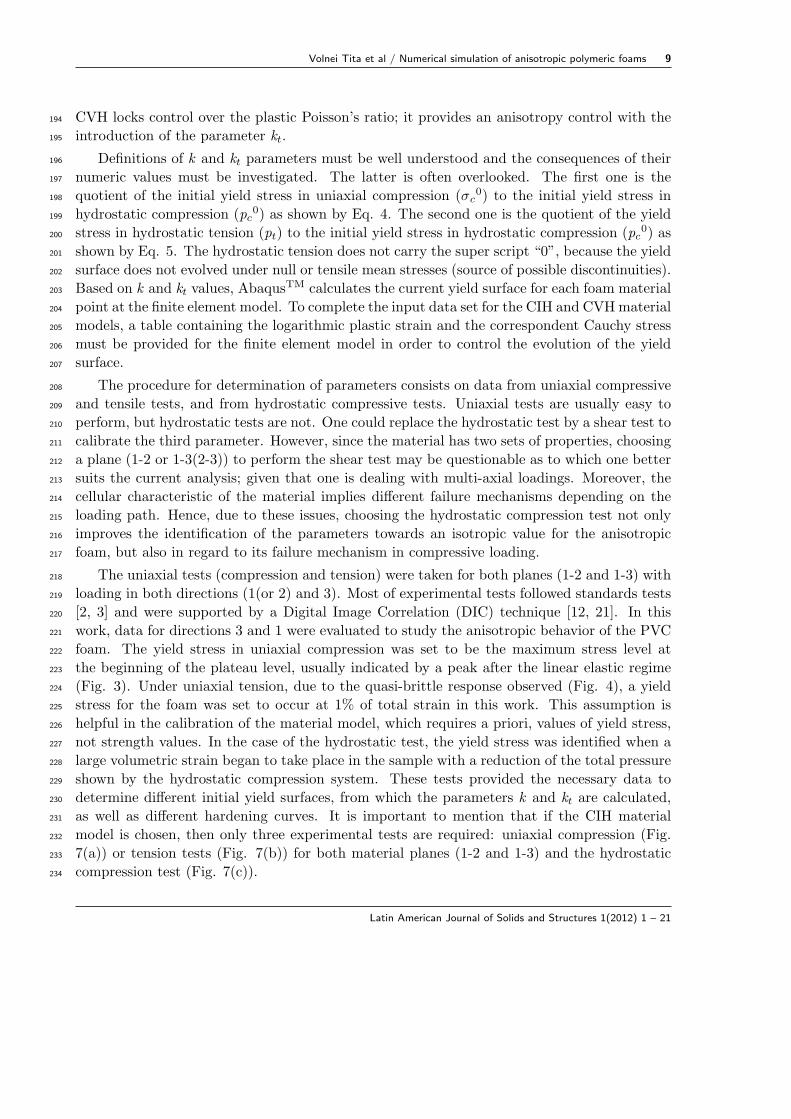
compression test (Fig. 7(c)).234
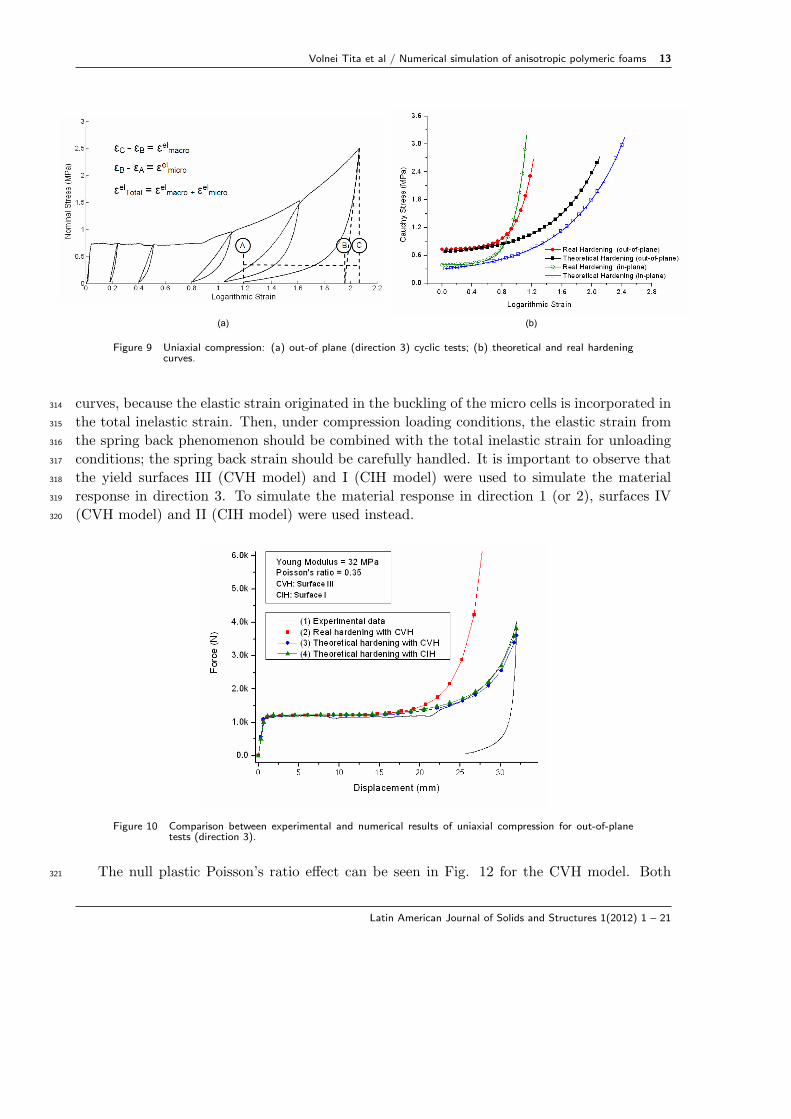
Latin American Journal of Solids and Structures 1(2012) 1 – 21
10 Volnei Tita et al / Numerical simulation of anisotropic polymeric foams
(a) (b) (c)
Figure 7 Experimental tests required: (a) Specimen under uniaxial compression (DIC measurements); (b)Specimen under uniaxial tension (DIC measurements); (c) Hydrostatic compression equipment.
Therefore, based on only three (CIH) or five (CVH) experimental tests, yield surfaces are235
built and the parameters can be obtained. However, it is possible to calculate different values236
for the same parameter, due to the anisotropic response of the material as shown at Table 1.237
Thus, in this work, six different yield surfaces for the PVC foam were built, four surfaces (I,238
II, V and VI) for the CIH model and another two surfaces for CVH model (III and IV).239
Table 1 Parameters obtained for the PVC foam
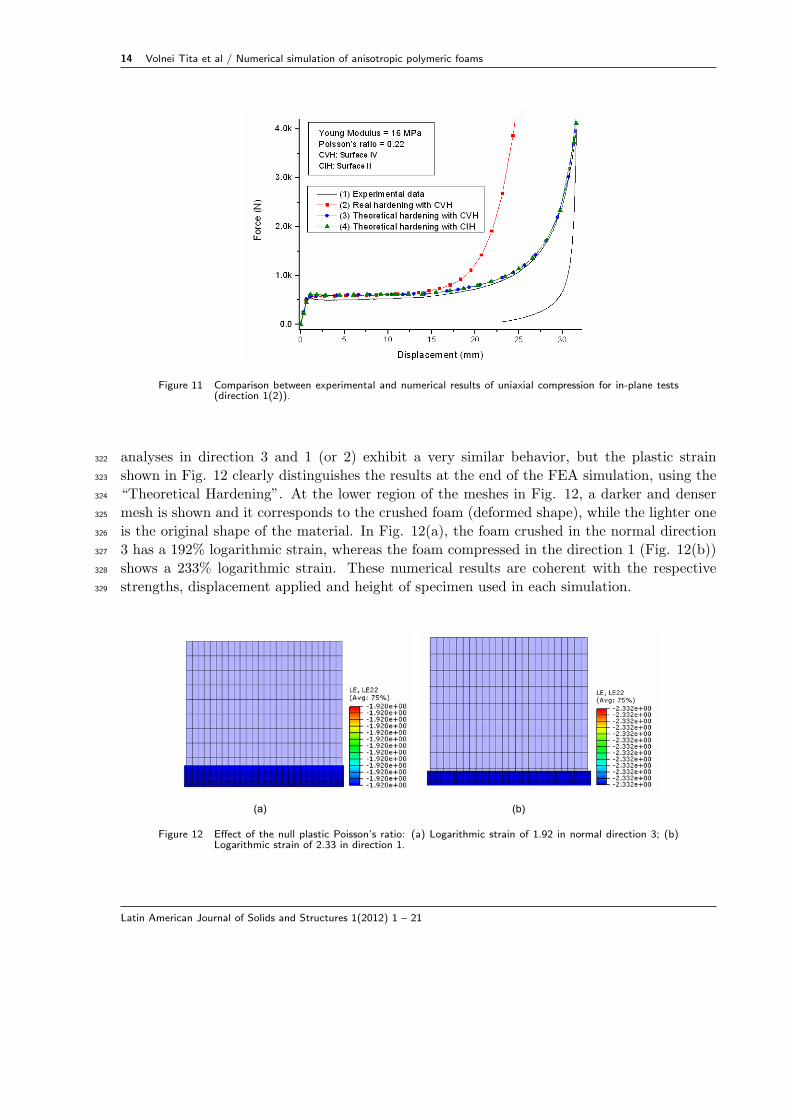
Surface/Model Plane UCYS (MPa) UTYS (MPa) HCYS (MPa) k υpl kt
I/CIH 1-3 0.750 0.750 0.450 1.6656 0.04 -II/CIH 1-2 0.396 0.396 0.450 0.8801 0.02 -
III/CVH 1-3 0.750 1.960(∗) 0.450 1.8852 - 12.2965
IV/CVH 1-2 0.396 1.070(∗) 0.450 1.9522 - 5.1478V/CIH 1-3 0.714 0.714 0.450 1.5832 0.04 -VI/CIH 1-2 0.430 0.430 0.450 0.9540 0.49 -
UCYS: Uniaxial Compression Yield Stress; UTYS: Uniaxial Tension Yield Stress;HCYS: Hydrostatic Compression Yield Stress; (*) Tensile Strength Value.
The next step of the calibrating process consists on defining the “best” yield surface and240
on identifying the hardening curve adequate in order to simulate the mechanical behavior of241
the PVC foam. The hardening in the CIH model is simply dictated by a tabular curve of242
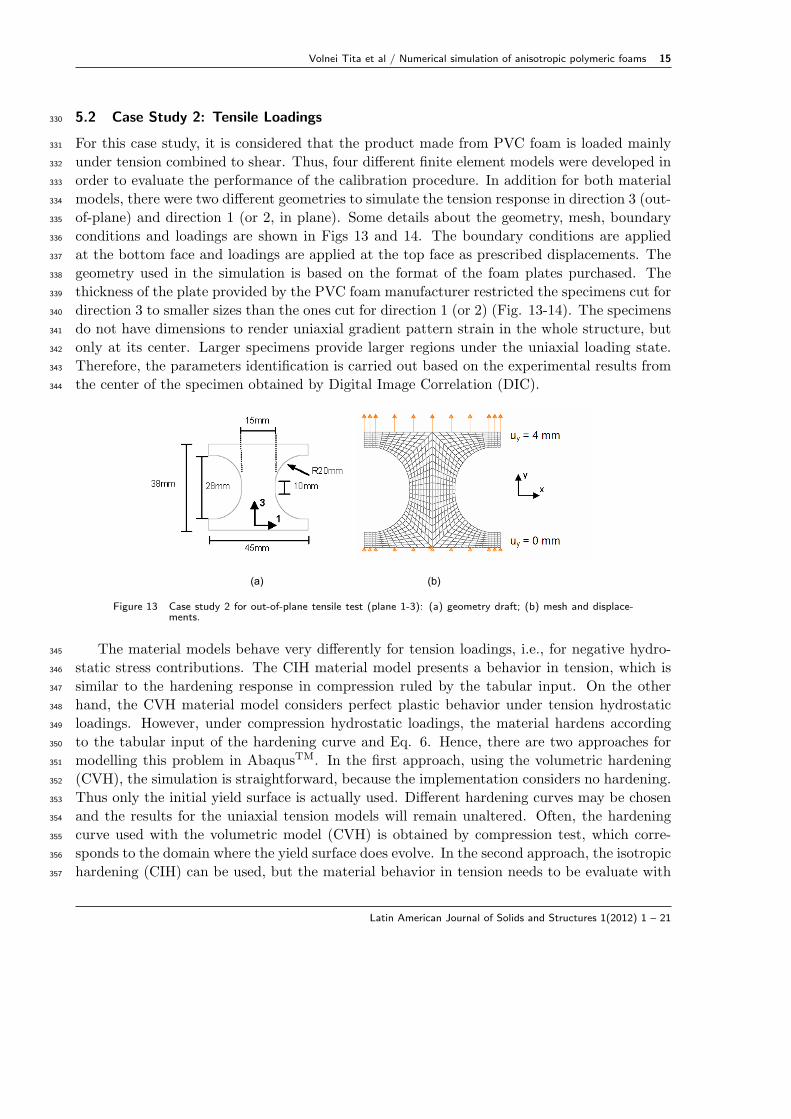
the logarithmic plastic strain versus the respective stress from the experimental uniaxial test.243
On the other hand, for the CVH model, the hardening input data is more complicated. It is244
dictated by the stretching of the yield surface in the mean stress axis by the increase of the245
current hydrostatic yield stress in compression, pc (equation (6)).246
pc(εplvol) = σy (εplvol) [σy (εplvol)(1
α2+ 1
9) + pt
3]/{pt + [σy (εplvol)/3]} (6)
The evolution of the yield surface for the CVH model considers no hardening for null or247
tensile hydrostatic and mean stresses; so, this is simulated by fixing the value of ptthroughout248
the hardening process. Thus, the surface evolves according to the volumetric compression249
Latin American Journal of Solids and Structures 1(2012) 1 – 21
Volnei Tita et al / Numerical simulation of anisotropic polymeric foams 11
stress (pc) in function of volumetric plastic strain εplvol. Equation 6 is obtained by applying Eq.250
1 to a uniaxial compression test and isolating pc. Such procedure allows for the calibration251
of the hardening curve with a uniaxial compression curve. Based on experimental results for252
foams, assuming a null plastic Poisson’s ratio is physically consistent [8, 10, 11, 14, 23]. For253
these cases, the total plastic volumetric strain in uniaxial compression equals the axial plastic254
strain in the loaded direction. Then, the hardening curve can be defined by setting a table255
with the uniaxial plastic logarithmic strain versus the associated Cauchy stress as mentioned256
earlier.257
The calibration process ends with the determination of which dataset provides the “best”258
yield surface based on numerical and experimental analyses. Depending on the limitations259
of the material model to simulate the mechanical behavior of structures made from PVC260
foam, the set of parameters for a specific application case might be different for other cases.261
Therefore, the calibration must be carried out according to the application of the foam. Thus,262
in this work, the determination of the dataset was based on regular case studies. For the first263
case study, it was considered that the product made from PVC foam is loaded mainly under264
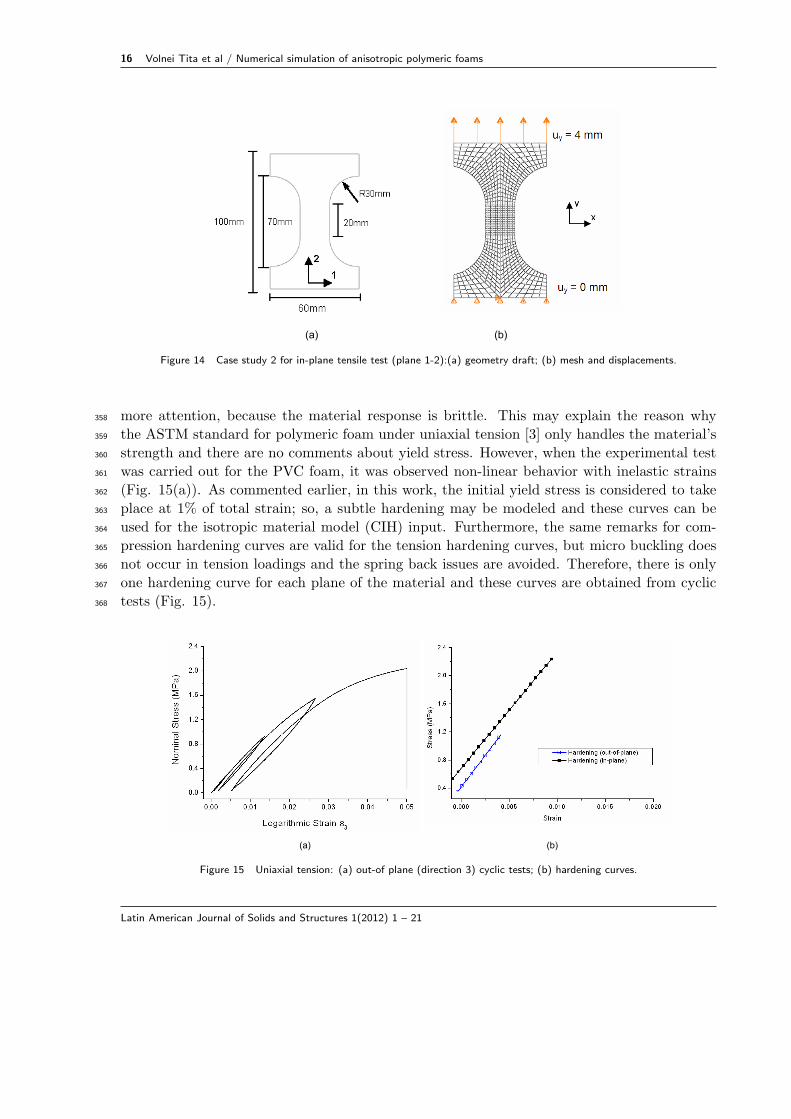
uniaxial compression, such as helmets. For the second case, the product is to be loaded mainly265
under tension loadings.266
5 CASE STUDIES267
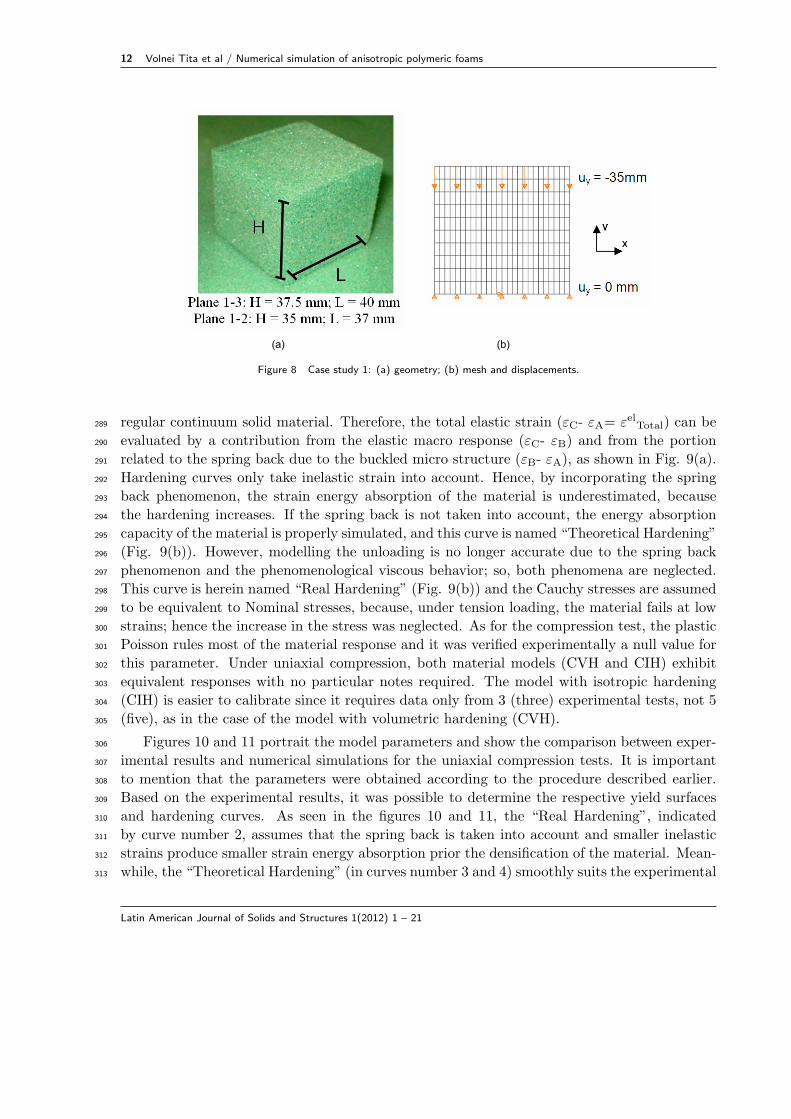
5.1 Case Study 1: Uniaxial Compression Loadings268
For this case study, it is considered that the product made from PVC foam would be loaded269
mainly uniaxial compression loadings. The finite element model had a two-dimensional sym-270
metry (Fig. 8) with boundary conditions at the bottom face and loadings (prescribed dis-271
placements at the top face), representing the experimental tests. Plane strain quadrilateral272
elements with quadratic interpolation (element CPE8 of AbaqusTM) were chosen for this case273
study. Non linear effects were expected due to the large displacements and strains (over 100%).274
Furthermore, it is important to mention that the storage matrix was set to unsymmetrical due275
to the non associative flow of the material models, increasing thereby the computational time.276
However, uniaxial compressive loading poses no restrictions in respect to the discontinuity in277
the yield surface.278
Each tested direction generated two hardening curves. One curve accounts the spring back279
phenomenon in the compressed foam and the other one does not. There is a large elastic280
return of the foam due to micro buckling in the material, which establishes the spring back281
phenomenon (Fig. 9(a)). As the stress increases, the weakest section fails by rupture of the282
cells (edges and faces) and there is an associated generation of plastic hinges due to micro283
buckling of the cells. Once most of cells have buckled, the strength and stiffness of the cellular284
material increase abruptly with the self contact of cells and the results observed approach the285
response of the base material, the PVC polymer. If the loadings are removed, the damaged286
cells exhibit a spring back phenomenon, which influences the phenomenological hardening287
curves, since the total elastic strain for this cellular material is higher than expected for a288
Latin American Journal of Solids and Structures 1(2012) 1 – 21
12 Volnei Tita et al / Numerical simulation of anisotropic polymeric foams
(a) (b)
Figure 8 Case study 1: (a) geometry; (b) mesh and displacements.
regular continuum solid material. Therefore, the total elastic strain (εC- εA= εelTotal) can be289
evaluated by a contribution from the elastic macro response (εC- εB) and from the portion290
related to the spring back due to the buckled micro structure (εB- εA), as shown in Fig. 9(a).291
Hardening curves only take inelastic strain into account. Hence, by incorporating the spring292
back phenomenon, the strain energy absorption of the material is underestimated, because293
the hardening increases. If the spring back is not taken into account, the energy absorption294
capacity of the material is properly simulated, and this curve is named “Theoretical Hardening”295
(Fig. 9(b)). However, modelling the unloading is no longer accurate due to the spring back296
phenomenon and the phenomenological viscous behavior; so, both phenomena are neglected.297
This curve is herein named “Real Hardening” (Fig. 9(b)) and the Cauchy stresses are assumed298
to be equivalent to Nominal stresses, because, under tension loading, the material fails at low299
strains; hence the increase in the stress was neglected. As for the compression test, the plastic300
Poisson rules most of the material response and it was verified experimentally a null value for301
this parameter. Under uniaxial compression, both material models (CVH and CIH) exhibit302
equivalent responses with no particular notes required. The model with isotropic hardening303
(CIH) is easier to calibrate since it requires data only from 3 (three) experimental tests, not 5304
(five), as in the case of the model with volumetric hardening (CVH).305
Figures 10 and 11 portrait the model parameters and show the comparison between exper-306
imental results and numerical simulations for the uniaxial compression tests. It is important307
to mention that the parameters were obtained according to the procedure described earlier.308
Based on the experimental results, it was possible to determine the respective yield surfaces309
and hardening curves. As seen in the figures 10 and 11, the “Real Hardening”, indicated310
by curve number 2, assumes that the spring back is taken into account and smaller inelastic311
strains produce smaller strain energy absorption prior the densification of the material. Mean-312
while, the “Theoretical Hardening” (in curves number 3 and 4) smoothly suits the experimental313
Latin American Journal of Solids and Structures 1(2012) 1 – 21
Volnei Tita et al / Numerical simulation of anisotropic polymeric foams 13
(a)
(b)
Figure 9 Uniaxial compression: (a) out-of plane (direction 3) cyclic tests; (b) theoretical and real hardeningcurves.
curves, because the elastic strain originated in the buckling of the micro cells is incorporated in314
the total inelastic strain. Then, under compression loading conditions, the elastic strain from315
the spring back phenomenon should be combined with the total inelastic strain for unloading316
conditions; the spring back strain should be carefully handled. It is important to observe that317
the yield surfaces III (CVH model) and I (CIH model) were used to simulate the material318
response in direction 3. To simulate the material response in direction 1 (or 2), surfaces IV319
(CVH model) and II (CIH model) were used instead.320
Figure 10 Comparison between experimental and numerical results of uniaxial compression for out-of-planetests (direction 3).
The null plastic Poisson’s ratio effect can be seen in Fig. 12 for the CVH model. Both321
Latin American Journal of Solids and Structures 1(2012) 1 – 21
14 Volnei Tita et al / Numerical simulation of anisotropic polymeric foams
Figure 11 Comparison between experimental and numerical results of uniaxial compression for in-plane tests(direction 1(2)).
analyses in direction 3 and 1 (or 2) exhibit a very similar behavior, but the plastic strain322
shown in Fig. 12 clearly distinguishes the results at the end of the FEA simulation, using the323
“Theoretical Hardening”. At the lower region of the meshes in Fig. 12, a darker and denser324
mesh is shown and it corresponds to the crushed foam (deformed shape), while the lighter one325
is the original shape of the material. In Fig. 12(a), the foam crushed in the normal direction326
3 has a 192% logarithmic strain, whereas the foam compressed in the direction 1 (Fig. 12(b))327
shows a 233% logarithmic strain. These numerical results are coherent with the respective328
strengths, displacement applied and height of specimen used in each simulation.329
(a) (b)
Figure 12 Effect of the null plastic Poisson’s ratio: (a) Logarithmic strain of 1.92 in normal direction 3; (b)Logarithmic strain of 2.33 in direction 1.
Latin American Journal of Solids and Structures 1(2012) 1 – 21
Volnei Tita et al / Numerical simulation of anisotropic polymeric foams 15
5.2 Case Study 2: Tensile Loadings330
For this case study, it is considered that the product made from PVC foam is loaded mainly331
under tension combined to shear. Thus, four different finite element models were developed in332
order to evaluate the performance of the calibration procedure. In addition for both material333
models, there were two different geometries to simulate the tension response in direction 3 (out-334
of-plane) and direction 1 (or 2, in plane). Some details about the geometry, mesh, boundary335
conditions and loadings are shown in Figs 13 and 14. The boundary conditions are applied336
at the bottom face and loadings are applied at the top face as prescribed displacements. The337
geometry used in the simulation is based on the format of the foam plates purchased. The338
thickness of the plate provided by the PVC foam manufacturer restricted the specimens cut for339
direction 3 to smaller sizes than the ones cut for direction 1 (or 2) (Fig. 13-14). The specimens340
do not have dimensions to render uniaxial gradient pattern strain in the whole structure, but341
only at its center. Larger specimens provide larger regions under the uniaxial loading state.342
Therefore, the parameters identification is carried out based on the experimental results from343
the center of the specimen obtained by Digital Image Correlation (DIC).344
(a) (b)
Figure 13 Case study 2 for out-of-plane tensile test (plane 1-3): (a) geometry draft; (b) mesh and displace-ments.
The material models behave very differently for tension loadings, i.e., for negative hydro-345
static stress contributions. The CIH material model presents a behavior in tension, which is346
similar to the hardening response in compression ruled by the tabular input. On the other347
hand, the CVH material model considers perfect plastic behavior under tension hydrostatic348
loadings. However, under compression hydrostatic loadings, the material hardens according349
to the tabular input of the hardening curve and Eq. 6. Hence, there are two approaches for350
modelling this problem in AbaqusTM. In the first approach, using the volumetric hardening351
(CVH), the simulation is straightforward, because the implementation considers no hardening.352
Thus only the initial yield surface is actually used. Different hardening curves may be chosen353
and the results for the uniaxial tension models will remain unaltered. Often, the hardening354
curve used with the volumetric model (CVH) is obtained by compression test, which corre-355
sponds to the domain where the yield surface does evolve. In the second approach, the isotropic356
hardening (CIH) can be used, but the material behavior in tension needs to be evaluate with357
Latin American Journal of Solids and Structures 1(2012) 1 – 21
16 Volnei Tita et al / Numerical simulation of anisotropic polymeric foams
(a) (b)
Figure 14 Case study 2 for in-plane tensile test (plane 1-2):(a) geometry draft; (b) mesh and displacements.
more attention, because the material response is brittle. This may explain the reason why358
the ASTM standard for polymeric foam under uniaxial tension [3] only handles the material’s359
strength and there are no comments about yield stress. However, when the experimental test360
was carried out for the PVC foam, it was observed non-linear behavior with inelastic strains361
(Fig. 15(a)). As commented earlier, in this work, the initial yield stress is considered to take362
place at 1% of total strain; so, a subtle hardening may be modeled and these curves can be363
used for the isotropic material model (CIH) input. Furthermore, the same remarks for com-364
pression hardening curves are valid for the tension hardening curves, but micro buckling does365
not occur in tension loadings and the spring back issues are avoided. Therefore, there is only366
one hardening curve for each plane of the material and these curves are obtained from cyclic367
tests (Fig. 15).368
(a) (b)
Figure 15 Uniaxial tension: (a) out-of plane (direction 3) cyclic tests; (b) hardening curves.
Latin American Journal of Solids and Structures 1(2012) 1 – 21
Volnei Tita et al / Numerical simulation of anisotropic polymeric foams 17
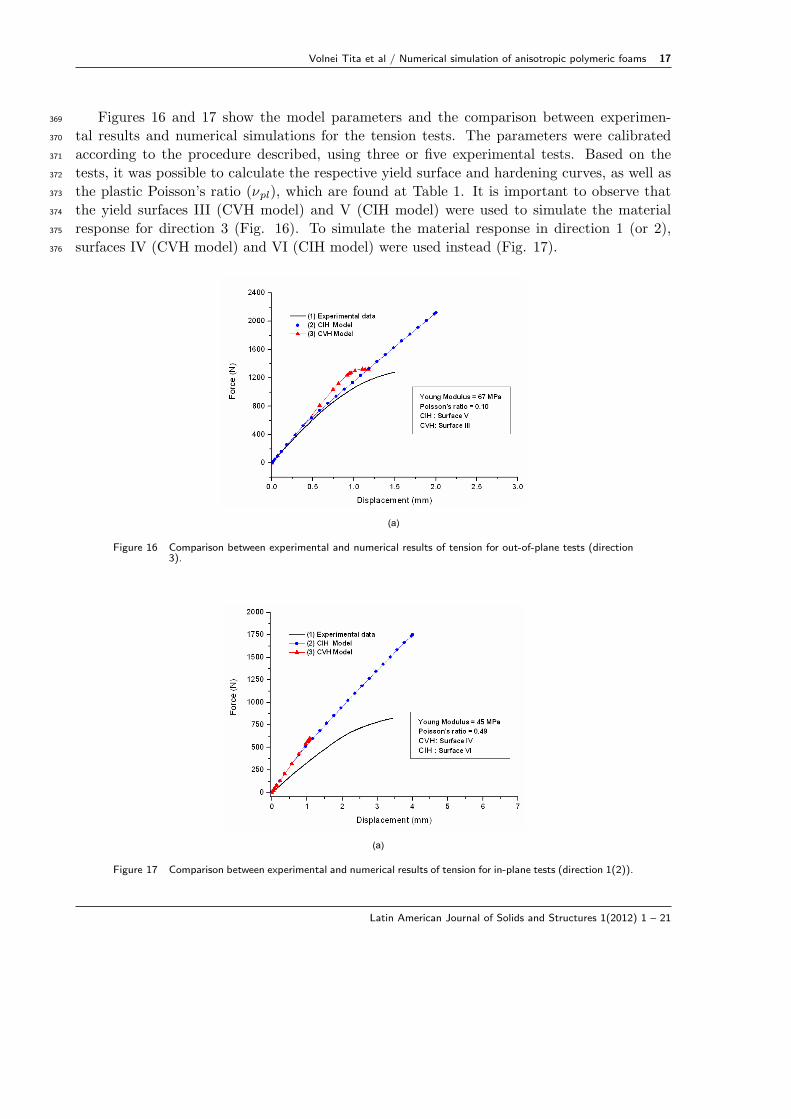
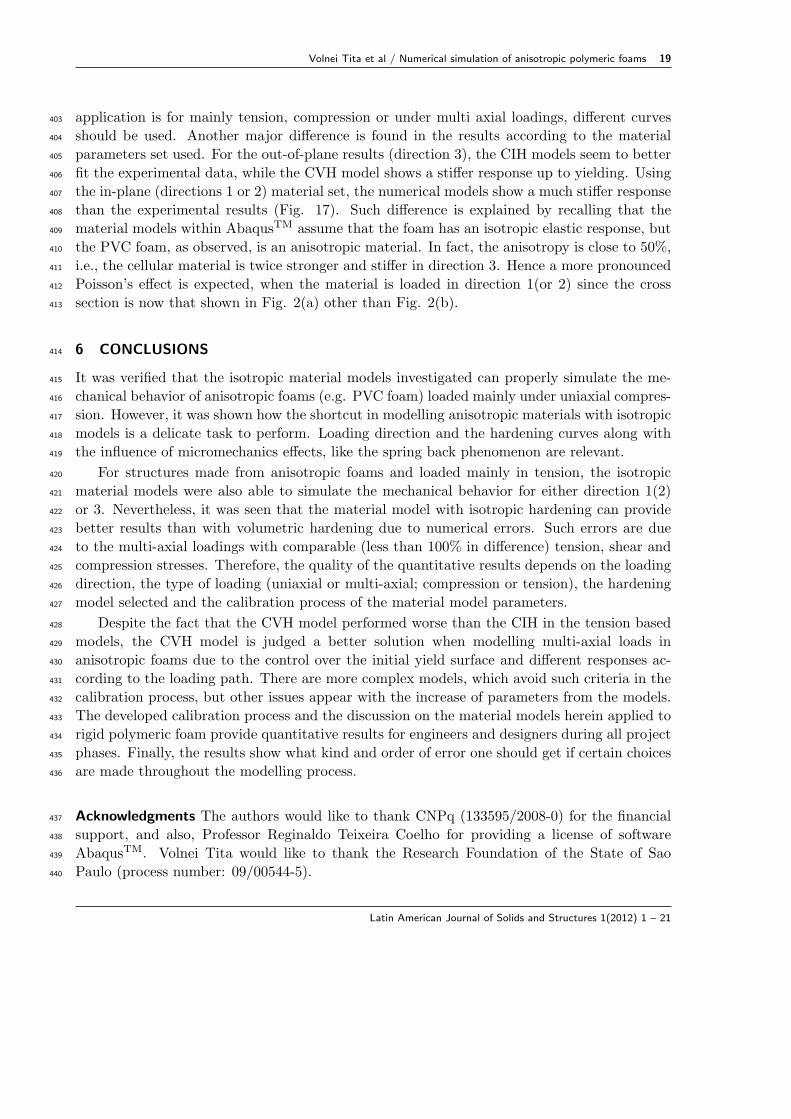
Figures 16 and 17 show the model parameters and the comparison between experimen-369
tal results and numerical simulations for the tension tests. The parameters were calibrated370
according to the procedure described, using three or five experimental tests. Based on the371
tests, it was possible to calculate the respective yield surface and hardening curves, as well as372
the plastic Poisson’s ratio (νpl), which are found at Table 1. It is important to observe that373
the yield surfaces III (CVH model) and V (CIH model) were used to simulate the material374
response for direction 3 (Fig. 16). To simulate the material response in direction 1 (or 2),375
surfaces IV (CVH model) and VI (CIH model) were used instead (Fig. 17).376
(a)
Figure 16 Comparison between experimental and numerical results of tension for out-of-plane tests (direction3).
(a)
Figure 17 Comparison between experimental and numerical results of tension for in-plane tests (direction 1(2)).
Latin American Journal of Solids and Structures 1(2012) 1 – 21
18 Volnei Tita et al / Numerical simulation of anisotropic polymeric foams
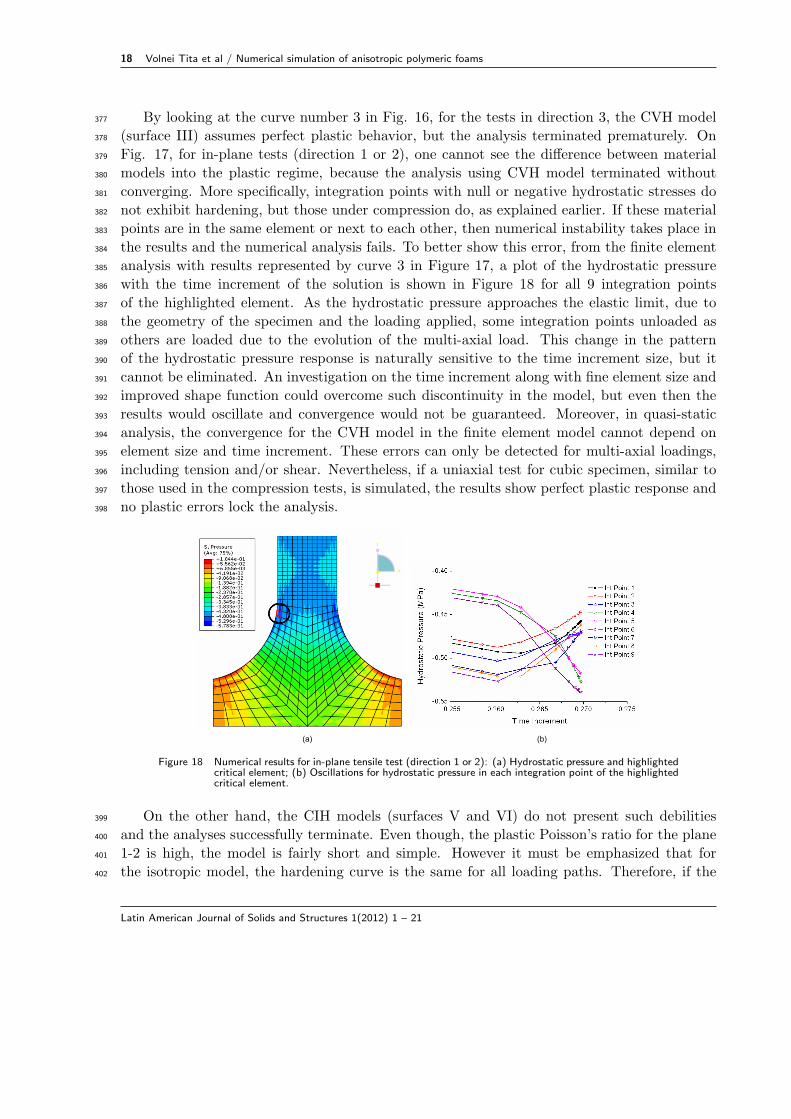
By looking at the curve number 3 in Fig. 16, for the tests in direction 3, the CVH model377
(surface III) assumes perfect plastic behavior, but the analysis terminated prematurely. On378
Fig. 17, for in-plane tests (direction 1 or 2), one cannot see the difference between material379
models into the plastic regime, because the analysis using CVH model terminated without380
converging. More specifically, integration points with null or negative hydrostatic stresses do381
not exhibit hardening, but those under compression do, as explained earlier. If these material382
points are in the same element or next to each other, then numerical instability takes place in383
the results and the numerical analysis fails. To better show this error, from the finite element384
analysis with results represented by curve 3 in Figure 17, a plot of the hydrostatic pressure385
with the time increment of the solution is shown in Figure 18 for all 9 integration points386
of the highlighted element. As the hydrostatic pressure approaches the elastic limit, due to387
the geometry of the specimen and the loading applied, some integration points unloaded as388
others are loaded due to the evolution of the multi-axial load. This change in the pattern389
of the hydrostatic pressure response is naturally sensitive to the time increment size, but it390
cannot be eliminated. An investigation on the time increment along with fine element size and391
improved shape function could overcome such discontinuity in the model, but even then the392
results would oscillate and convergence would not be guaranteed. Moreover, in quasi-static393
analysis, the convergence for the CVH model in the finite element model cannot depend on394
element size and time increment. These errors can only be detected for multi-axial loadings,395
including tension and/or shear. Nevertheless, if a uniaxial test for cubic specimen, similar to396
those used in the compression tests, is simulated, the results show perfect plastic response and397
no plastic errors lock the analysis.398
(a) (b)
Figure 18 Numerical results for in-plane tensile test (direction 1 or 2): (a) Hydrostatic pressure and highlightedcritical element; (b) Oscillations for hydrostatic pressure in each integration point of the highlightedcritical element.
On the other hand, the CIH models (surfaces V and VI) do not present such debilities399
and the analyses successfully terminate. Even though, the plastic Poisson’s ratio for the plane400
1-2 is high, the model is fairly short and simple. However it must be emphasized that for401
the isotropic model, the hardening curve is the same for all loading paths. Therefore, if the402
Latin American Journal of Solids and Structures 1(2012) 1 – 21
Volnei Tita et al / Numerical simulation of anisotropic polymeric foams 19
application is for mainly tension, compression or under multi axial loadings, different curves403
should be used. Another major difference is found in the results according to the material404
parameters set used. For the out-of-plane results (direction 3), the CIH models seem to better405
fit the experimental data, while the CVH model shows a stiffer response up to yielding. Using406
the in-plane (directions 1 or 2) material set, the numerical models show a much stiffer response407
than the experimental results (Fig. 17). Such difference is explained by recalling that the408
material models within AbaqusTM assume that the foam has an isotropic elastic response, but409
the PVC foam, as observed, is an anisotropic material. In fact, the anisotropy is close to 50%,410
i.e., the cellular material is twice stronger and stiffer in direction 3. Hence a more pronounced411
Poisson’s effect is expected, when the material is loaded in direction 1(or 2) since the cross412
section is now that shown in Fig. 2(a) other than Fig. 2(b).413
6 CONCLUSIONS414
It was verified that the isotropic material models investigated can properly simulate the me-415
chanical behavior of anisotropic foams (e.g. PVC foam) loaded mainly under uniaxial compres-416
sion. However, it was shown how the shortcut in modelling anisotropic materials with isotropic417
models is a delicate task to perform. Loading direction and the hardening curves along with418
the influence of micromechanics effects, like the spring back phenomenon are relevant.419
For structures made from anisotropic foams and loaded mainly in tension, the isotropic420
material models were also able to simulate the mechanical behavior for either direction 1(2)421
or 3. Nevertheless, it was seen that the material model with isotropic hardening can provide422
better results than with volumetric hardening due to numerical errors. Such errors are due423
to the multi-axial loadings with comparable (less than 100% in difference) tension, shear and424
compression stresses. Therefore, the quality of the quantitative results depends on the loading425
direction, the type of loading (uniaxial or multi-axial; compression or tension), the hardening426
model selected and the calibration process of the material model parameters.427
Despite the fact that the CVH model performed worse than the CIH in the tension based428
models, the CVH model is judged a better solution when modelling multi-axial loads in429
anisotropic foams due to the control over the initial yield surface and different responses ac-430
cording to the loading path. There are more complex models, which avoid such criteria in the431
calibration process, but other issues appear with the increase of parameters from the models.432
The developed calibration process and the discussion on the material models herein applied to433
rigid polymeric foam provide quantitative results for engineers and designers during all project434
phases. Finally, the results show what kind and order of error one should get if certain choices435
are made throughout the modelling process.436
Acknowledgments The authors would like to thank CNPq (133595/2008-0) for the financial437
support, and also, Professor Reginaldo Teixeira Coelho for providing a license of software438
AbaqusTM. Volnei Tita would like to thank the Research Foundation of the State of Sao439
Paulo (process number: 09/00544-5).440
Latin American Journal of Solids and Structures 1(2012) 1 – 21
20 Volnei Tita et al / Numerical simulation of anisotropic polymeric foams
References441
[1] ABAQUS/CAE User’s Manual. ABAQUS version 6.7 - documentation. © Dassault Systemes.442
[2] ASTM D 1621 - 04a: Standard test method for compressive properties of rigid cellular plastics. Technical report.443
[3] ASTM D 1623 - 03: Standard test method for tensile and tensile adhesion properties of rigid cellular plastics.444
Technical report.445
[4] DIAB Literature - Manuals. Technical Manual: Divinycell H.446
[5] S. Abrate. Criteria for yielding or failure of cellular materials. Journal of Sandwich Structures and Materials, 10:5,447
2008.448
[6] C. Chen, T. J. Lu, and N. A. Fleck. Effect of imperfections on the yielding of two-dimensional foams. Journal of the449
Mechanics and Physics of Solids, 47:2235, 1999.450
[7] V. S. Deshpande and N. A. Fleck. Isotropic constitutive models for metallic foams. Journal of the Mechanics and451
Physics of Solids, 48:1253, 2000.452
[8] L. J. Gibson and M. Ashby. Cellular solids: structures & properties. Pergamon Press-Headington Hill Hall, England,453
1988.454
[9] L. J. Gibson, M. F. Ashby, J. Zhang, and T. C. Triantafillou. Failure surfaces for cellular materials under multiaxial455
loads -i. modelling. International Journal of Mechanical Sciences, 31(9):635, 1989.456
[10] L. Gong and S. Kyriakides. Compressive response of open cell foams part ii: Initiation and evolution of crushing.457
International Journal of Solids and Structures, 42:1381, 2005.458
[11] L. Gong, S. Kyriakides, and W. Y. Jang. Compressive response of open-cell foams. International Journal of Solids459
and Structures, 42:1355, 2005.460
[12] F. Hild and S. Roux. Correli Q4: A software for ”finite-element” displacement field measurements by digital image461
correlation. Technical report, LMT-Cachan.462
[13] http://www.poliuretanos.net. Chemistry and polyurethane technology, jan. 5th 2010.463
[14] Q. M. Li and R. A. W. Mines. Strain measures for rigid crushable foam in uniaxial compression. Strain, 38:132,464
2002.465
[15] Q. M. Li, R. A. W. Mines, and R. S. Birch. The crush behaviour of rohacell-51wf structural foam. International466
Journal of Solids and Structures, 37:6321, 2000.467
[16] M. D. Liu and J. P. Carter. On the volumetric deformation of reconstituted soils. International Journal for Numerical468
and Analytical Methods in Geomechanics, 24:101, 2000.469
[17] G. P. Oliveira, R. A. Angelico, V. Tita, and N. C. Santos. An investigation of material model parameters for foams470
of composite sandwich structures. In V National Congress of Mechanical Engineering - CONEM, Salvador, Brazil.471
Proceedings of CONEM, 2008.472
[18] V. I. Rizov. Elasticplastic response of structural foams subjected to localized static loads. Materials and Design,473
27:947, 2006.474
[19] V. I. Rizov. Non-linear indentation behavior of foam core sandwich composite materials - a 2d approach. Computa-475
tional Materials Science, 35:107, 2006.476
[20] V. L. Tagarielli, N. A. Fleck, and V. S. Deshpande. Collapse of clamped and simply supported composite sandwich477
beams in three-point bending. Composites: part B, 35:523, 2004.478
[21] M. F. Caliri Jr.and V. Tita, R. A. Angelico, R. B. Canto, and G. P. Soares. Study of an anisotropic polymeric479
cellular material under compression loading. In XIX Brazilian Conference on Material Science and Engineering -480
CBECIMAT, Campos do Jordao. Brazil. Proceedings of CBECIMAT, 2010.481
[22] T. C. Triantafillou, J. Zhang, T. L. Shercliff, L. J. Gibson, and M. F. Ashby. Failure surfaces for cellular materials482
under multiaxial loads -ii. comparison of models with experiment. International Journal of Mechanical Sciences,483
31(9):665, 1989.484
[23] P. Viot. Hydrostatic compression on polypropylene foam. International Journal of Impact Engineering, 36:975, 2009.485
Latin American Journal of Solids and Structures 1(2012) 1 – 21

Volnei Tita et al / Numerical simulation of anisotropic polymeric foams 21
[24] D. J. Han W. F. Chen. Elasticplastic response of structural foams subjected to localized static loads. Materials and486
Design, 27:947, 2006.487
[25] D. A Wang and J. Pan. A non-quadratic yield function for polymeric foams. International Journal of Plasticity,488
22:434, 2006.489
[26] J. Zhang, N. Kikuchi, V. LI, A. Yee, and G. Nusholtz. Constitutive modeling of polymeric foam material subjected490
to dynamic crash loading. International Journal of Mechanical Sciences, 21(5):665, 1989.491
[27] T. Zhang. A general constitutive relation for linear elastic foams. International Journal of Mechanical Sciences,492
50:1123, 2008.493
Latin American Journal of Solids and Structures 1(2012) 1 – 21


![Composites: Part Bfiber–polymer composites [29,30,35,26] and polymeric foams [8], usually fail in a brittle manner and exhibit strong deterministic size effect. Obviously, the same](https://img.pdfslide.us/doc/110x75/6050d3726fcfd95b5c30ef50/composites-part-b-iberapolymer-composites-29303526-and-polymeric-foams.jpg)