Embed Size (px)
Citation preview
Numerical Simulation of Airflow Distribution in Electrostatic-Fabric
Integrated Precipitator
Chaofan Sun1+
, Xinglu Yu1,2
, Hongkai Liao1, Zehong Peng
1,3, Xinfeng Long
2 and Bo Lou
2
1 Electric Power Research Institute of Guangdong Power Grid Corp., Guangzhou, China, 510080
2School of Chemical Engineering, South China University of Technology, Guangzhou, China, 510640
3School of Electric Power, South China University of Technology, Guangzhou, China, 510640
Abstract: This paper focus on the airflow distribution in the Electrostatic-Fabric Integrated Precipitator
(EFIP). 3-D structure of 600MW EFIP was established and numerical simulation method was used.
Airflow distribution was studied by changing the number of flow deflector and the structure of deflectors. A
κ-ε model was used in the simulation. At the same time, the boundary of bags were defined as the Porous-
jump and a appropriate permeability was defined. The simulation results shown that: when three flow
deflectors were placed with a suitable opening rate, the airflow distribution was uniform. In another word,
the mean velocity was 0.728 m/s and the mean square velocity is 0.2799, at the same time, the speed of
airflow in the fabric area was 0.6m/s. The numerical simulation results were reasonable and could be used as
the reference to the designing of EFIP.
Keywords: electrostatic-fabric integrated precipitator, airflow distribution, numerical simulation, flow
deflector
Nomenclature
μi gas velocity, m·s-1
χi i direction
P pressure, pa
Fi electric field force, N
ut viscosity coefficient
σ the relative average
Wi the ith
velocity, m·s-1
the average of velocity, m·s-1
Re Reynolds coefficient
I Turbulence intensity
1. Introduction
Electrostatic-Fabric Integrated Precipitator (EFIP) is an effective kind of particle control technology
which combines electrostatic precipitator (ESP) with fabric filter(FF). EFIP could removal 99.0% above of
fine particles in the boiler smoke, enhance efficiency and improve the quality of atmosphere obviously.
Many factors could affect the efficiency of equipment and the life of filter because of its complex structure.
Among them, air distribution is one of the key elements. If the air distribution was bad, some unstable states,
such as severe turbulence, would appear and they would not only increase the operation pressure but also
reduce the life of bags. We could see the distribution of pressure and velocity in the EFIP directly by using
Corresponding author. Tel.: + 862085124756; fax: +862087318073.
E-mail address: [email protected]
2015 4th International Conference on Environmental, Energy and Biotechnology Volume 85 of IPCBEE (2015)
DOI:10.7763/IPCBEE. 2015. V85. 9
50
the numerical simulation method. The airflow distribution in the 300MW EFIP by using numerical
simulation method has been studied [1]-[5]. In that way, the operation pressure was reduced. Gas flow
distribution in the ESP with the simulation method has been calculated [6]-[11], also they have investigated
the vector of velocity. In their experiment, Navier-Stokes equation and κ-ε turbulence model have been used
to solve the linear calculation of the gas flow. At the same time, data coming from power plant was collected
and combined with the simulation result. According to literatures [12]-[16], if the CFD technology was used
in the design of lateral plate electrostatic precipitator, then we could calculate the airflow distribution in the
dust area with a high speed. Some results showed that the airflow went across the plate gap with a much
higher speed than usual, in that way, the rate of ion recombination reduced and the concentration of corona
ion increased while we also could find that a lower speed has produced in the back of plate, it was good to
collect the dust particles. In the meanwhile, literature [17] provided another process to probe into the
mechanism of collecting dust in the ESP, and they paid more attention to the impact of ion on the dust
removal results. According to the result, the cross-flow swirling produced in the electrostatic field had a
great influence on the ion flow direction and at the same time it also affected the efficiency of dust removal
seriously, especially, which could reduce the rate of fine particle removal. In the contrary, the efficiency of
dust removal in the ESP could increase if the airflow direction was same. Someone adjusted velocity in the
fabric filter field to reducing the impact of airflow jet on the bag by changing the structure with some
suitable methods, thereby enhanced the life of bags [18]-[21].
Therefore, this paper focus on the numerical simulation of 600MW EFIP equipped in one power plant. A
3-D structure model of EFIP was established, by which the numerical simulation of airflow distribution was
carried on, and some optimizing method for the operation of EFIP was provided.
2. Mathematical Model
2.1. Mathematical equation
Continuity equation:
i
i
u=0
χ
(1)
Momentum equation:
ι ι i
ij
u u j g i
ι ι ι
τΡ(ρ ) (ρ ι )= ρ + F
χ χ χt
(2)
As we know that the state of air flow is turbulent, so the κ-ε equation can be used. Turbulent kinetic
energy κ equation:
tj
j j κ j
ji it
j j i
μκ κρU = μ +
χ χ σ χ
U Uμ ρε
χ χ χ
U
(3)
Dissipation rate ε equation:
t
κ κ ε κ
2j1 i i
t 2
με εμ +
χ χ σ χ
UC ε U U εμ
κ κj j i
U
Cx x x
κ
ρ .
(4)
The turbulent viscosity coefficient μt is calculated according to κ and ε:
51
2
t μ
kμ = ρC
ε (5)
There are many ways to evaluate the airflow distribution now, but one method has been mainly used
which measures σ of the velocity in some planes, it is shown as follow:
n 2
i
i=1
w - w
σ =n
(6)
2.2. 3-D structure model of EFIP We attach the importance to airflow distribution of the large-scale EFIP equipped for the 600MW power
plant and the 3-D structure model of EFIP is established. There are two sets of EFIP for each 600MW unit.
Every EFIP is consisted of two ESP parts and two fabric filter parts, the ash bucket. Air chamber and central
control room are also included. The 3-D structure of EFIP is established with the Pro/Engineering. The inlet
box is 4.2 m wide and 4.1 m long. The ESP room is 14.6 m high, 15.4 m wide and 9.8 m long, while the bag
precipitators are departed into two rooms and each is 15.4 m wide, 6.3 m long, but their height is different
from each other, one is 13.3 m high and the other is 11.1 m high. Meanwhile, each part is equipped with 250
bags. And the diameter and length of each bag is 300 mm and 8 m, respectively. In the process of mesh,
tetrahedron is used in the gambit tool.
2.3. The setting of boundary conditions Velocity–inlet and pressure-outlet are defined as the model boundary. To some extent, the bag is a kind
of porous media, so we define the bags plane as the porous–jump medium. Others are set to wall-slip
boundary condition. According to the data collected from the operation, the gas velocity is 14.38 m·s-1
and
flux is 891444.96 m3·h
-1, the temperature is 20℃, dynamic viscosity υ=15.06×10
6 m
2·s
-1; the hydraulic
diameter D=4.149 m, so we could calculate Re and turbulence intensity as follows:
DυρRe =
μ (7)
Turbulence intensity:
-1/8I = 0.16Re (8)
Based on the above calculation, we make sure that the state of inlet is turbulence. We supposed that the fluid in the EFIP is steady and the time has nothing to do with the motion parameters. And the fluid can't be compressed because of its low speed. Also the whole simulation process is isothermal.
3. Simulation Results and Discussion
This paper made a deeply discussion in the purpose of investigating the airflow distribution in the EFIP. Four kinds of operating model were involved.
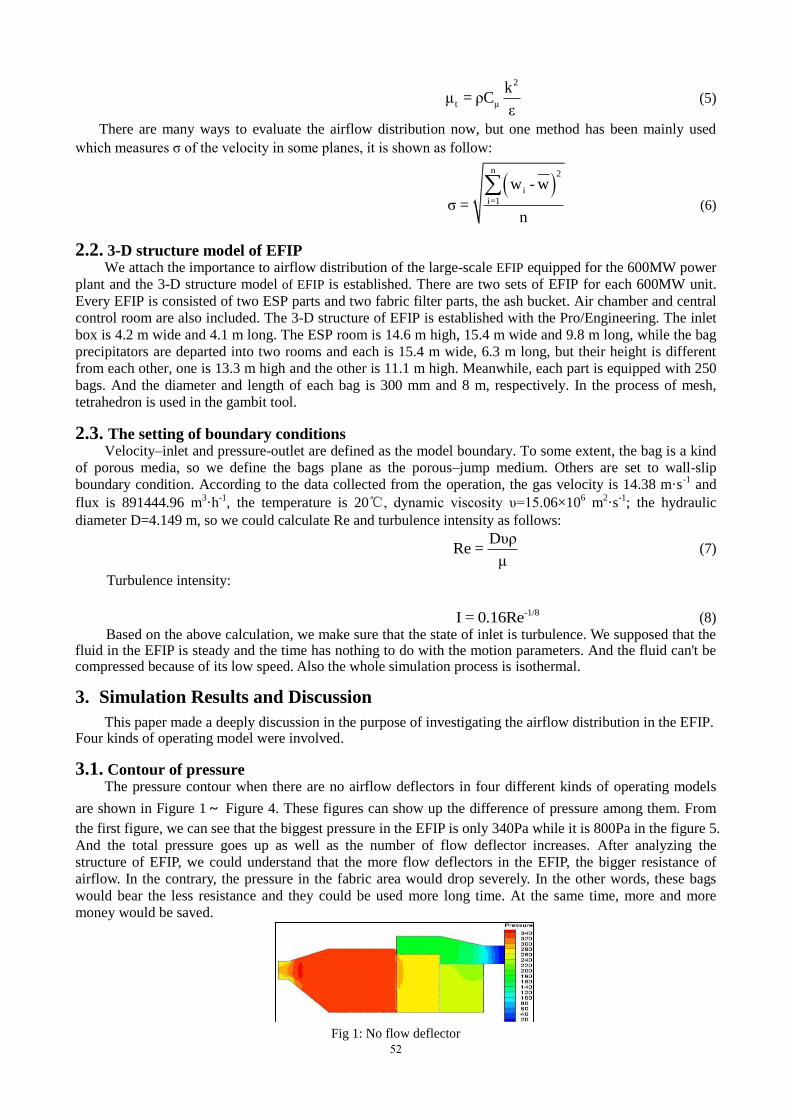
3.1. Contour of pressure The pressure contour when there are no airflow deflectors in four different kinds of operating models
are shown in Figure 1~ Figure 4. These figures can show up the difference of pressure among them. From
the first figure, we can see that the biggest pressure in the EFIP is only 340Pa while it is 800Pa in the figure 5.
And the total pressure goes up as well as the number of flow deflector increases. After analyzing the
structure of EFIP, we could understand that the more flow deflectors in the EFIP, the bigger resistance of
airflow. In the contrary, the pressure in the fabric area would drop severely. In the other words, these bags
would bear the less resistance and they could be used more long time. At the same time, more and more
money would be saved.
Fig 1: No flow deflector
52
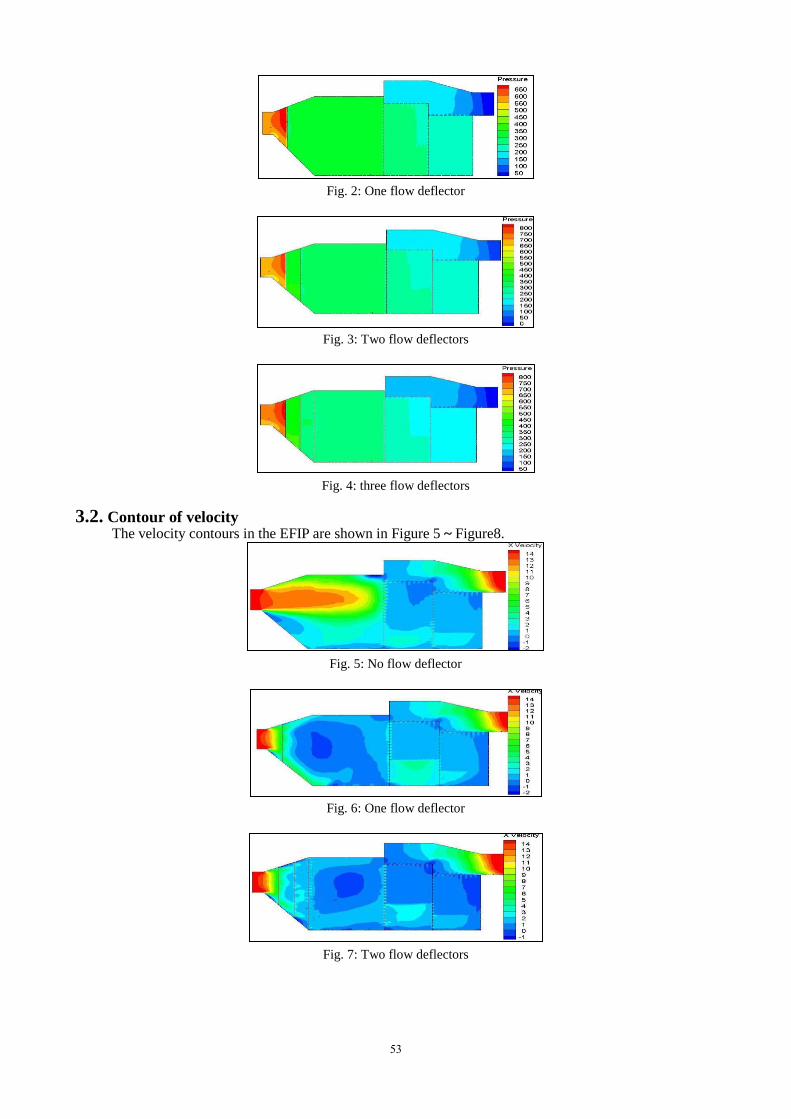
Fig. 2: One flow deflector
Fig. 3: Two flow deflectors
Fig. 4: three flow deflectors
3.2. Contour of velocity The velocity contours in the EFIP are shown in Figure 5~Figure8.
Fig. 5: No flow deflector
Fig. 6: One flow deflector
Fig. 7: Two flow deflectors
53
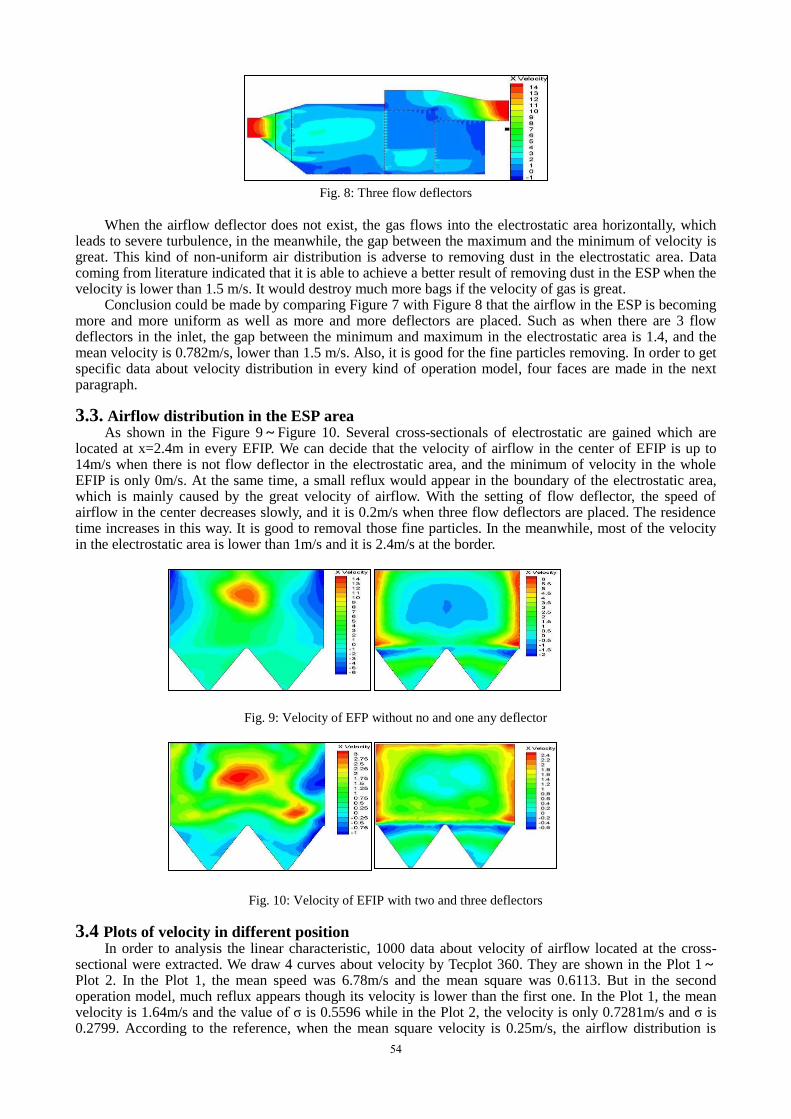
Fig. 8: Three flow deflectors
When the airflow deflector does not exist, the gas flows into the electrostatic area horizontally, which leads to severe turbulence, in the meanwhile, the gap between the maximum and the minimum of velocity is great. This kind of non-uniform air distribution is adverse to removing dust in the electrostatic area. Data coming from literature indicated that it is able to achieve a better result of removing dust in the ESP when the velocity is lower than 1.5 m/s. It would destroy much more bags if the velocity of gas is great.
Conclusion could be made by comparing Figure 7 with Figure 8 that the airflow in the ESP is becoming more and more uniform as well as more and more deflectors are placed. Such as when there are 3 flow deflectors in the inlet, the gap between the minimum and maximum in the electrostatic area is 1.4, and the mean velocity is 0.782m/s, lower than 1.5 m/s. Also, it is good for the fine particles removing. In order to get specific data about velocity distribution in every kind of operation model, four faces are made in the next paragraph.
3.3. Airflow distribution in the ESP area As shown in the Figure 9~Figure 10. Several cross-sectionals of electrostatic are gained which are
located at x=2.4m in every EFIP. We can decide that the velocity of airflow in the center of EFIP is up to 14m/s when there is not flow deflector in the electrostatic area, and the minimum of velocity in the whole EFIP is only 0m/s. At the same time, a small reflux would appear in the boundary of the electrostatic area, which is mainly caused by the great velocity of airflow. With the setting of flow deflector, the speed of airflow in the center decreases slowly, and it is 0.2m/s when three flow deflectors are placed. The residence time increases in this way. It is good to removal those fine particles. In the meanwhile, most of the velocity in the electrostatic area is lower than 1m/s and it is 2.4m/s at the border.
Fig. 9: Velocity of EFP without no and one any deflector
Fig. 10: Velocity of EFIP with two and three deflectors
3.4 Plots of velocity in different position In order to analysis the linear characteristic, 1000 data about velocity of airflow located at the cross-
sectional were extracted. We draw 4 curves about velocity by Tecplot 360. They are shown in the Plot 1~ Plot 2. In the Plot 1, the mean speed was 6.78m/s and the mean square was 0.6113. But in the second operation model, much reflux appears though its velocity is lower than the first one. In the Plot 1, the mean velocity is 1.64m/s and the value of σ is 0.5596 while in the Plot 2, the velocity is only 0.7281m/s and σ is 0.2799. According to the reference, when the mean square velocity is 0.25m/s, the airflow distribution is
54
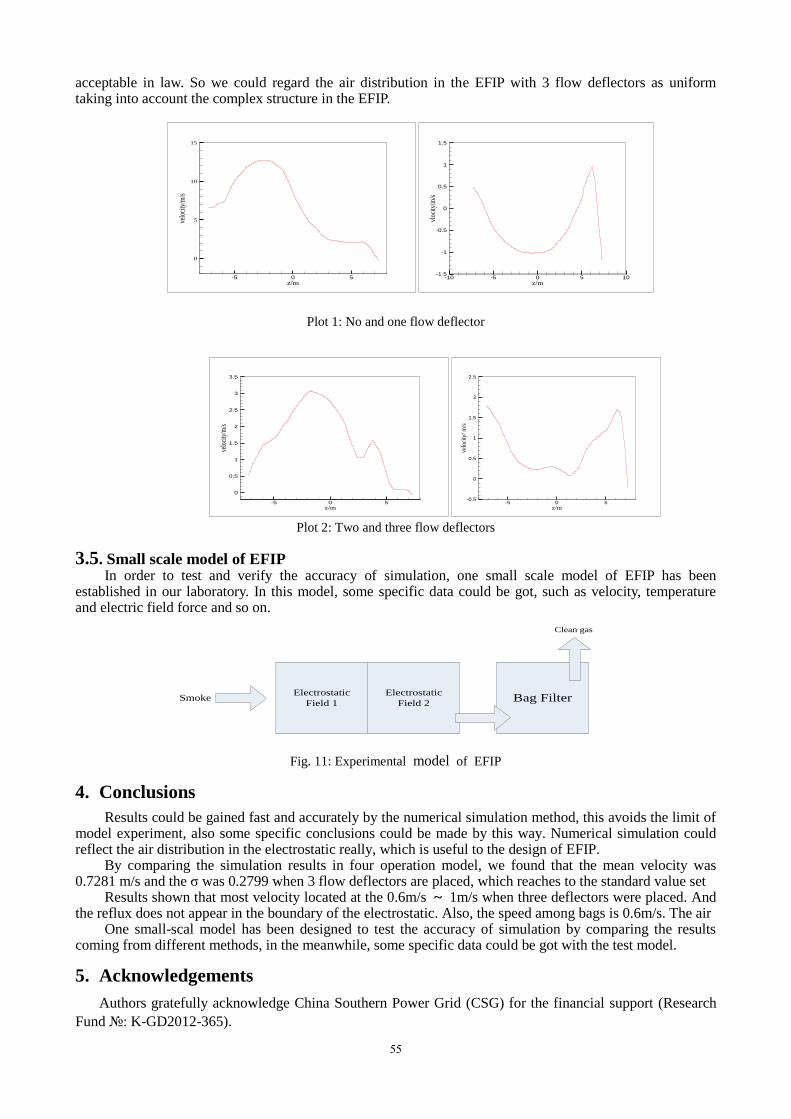
acceptable in law. So we could regard the air distribution in the EFIP with 3 flow deflectors as uniform taking into account the complex structure in the EFIP.
Plot 1: No and one flow deflector
Plot 2: Two and three flow deflectors
3.5. Small scale model of EFIP In order to test and verify the accuracy of simulation, one small scale model of EFIP has been
established in our laboratory. In this model, some specific data could be got, such as velocity, temperature and electric field force and so on.
Electrostatic
Field 2Bag Filter
Electrostatic
Field 1Smoke
Clean gas
Fig. 11: Experimental model of EFIP
4. Conclusions
Results could be gained fast and accurately by the numerical simulation method, this avoids the limit of model experiment, also some specific conclusions could be made by this way. Numerical simulation could reflect the air distribution in the electrostatic really, which is useful to the design of EFIP.
By comparing the simulation results in four operation model, we found that the mean velocity was 0.7281 m/s and the σ was 0.2799 when 3 flow deflectors are placed, which reaches to the standard value set
Results shown that most velocity located at the 0.6m/s ~ 1m/s when three deflectors were placed. And the reflux does not appear in the boundary of the electrostatic. Also, the speed among bags is 0.6m/s. The air
One small-scal model has been designed to test the accuracy of simulation by comparing the results coming from different methods, in the meanwhile, some specific data could be got with the test model.
5. Acknowledgements
Authors gratefully acknowledge China Southern Power Grid (CSG) for the financial support (Research
Fund №: K-GD2012-365).
z/m
velo
city
/m/s
-5 0 5
0
5
10
15
z/m
vloc
ity/m
/s
-10 -5 0 5 10-1.5
-1
-0.5
0
0.5
1
1.5
z/m
velo
city
/m/s
-5 0 5
0
0.5
1
1.5
2
2.5
3
3.5
z/m
velo
city
/m/s
-5 0 5-0.5
0
0.5
1
1.5
2
2.5
55
6. References
[1]. Y. Liu “Theoretiacal and Experimental Research on Elctrostatic Fabric Filter”: Northeastern University, 2009
[2]. S. Q. Qu “Numerical Simulation and Experiment on HybridDust Collector” : Northeastern University, 2004
[3]. Dou p. “Theoretical Analysis and Experimental Study on High Velocity Transverse Plate Electrostatic
Precipitator”: Jiangsu Uni. 2010.
[4]. Z. S. Liu, M. Y. Wey, C. L. Lin, “Simultaneous control of acid gases and PAHs using a spray dryer combined with
a fabric filter using different additives”, J Hazardous Materials, B91: 129-141(2002)
[5]. Z. S. Liu, M. Y. Wey, C. L. Lin “The capture of heavy metal from incineration using a spray dryer integrated with
a fabric filter with different additives”, J. AWMA ,51 (7) :983–991(2001)
[6]. Z. W. Long, Q. Yao, Q. Song, S. Q. Li “A second-order accurate finite volume method for the computation of
electrical conditions inside a wire-plate electrostatic precipitator on unstructured meshes”, J. Electrostatics,
67(5):597-604(2009)
[7]. L. Hong, L. Wang, Z. Wu, Applications of upwind and downwind schemes for calculating electrical conditions in
a wire-plate electrostatic precipitator, J. Electrostat. 193: 697–707 (2004)
[8]. T. Gary, K. Royal “A study of ionization and collection efficiencies in electrospray-based electrostatic
precipitators”, J. Aerosol. sci., 39:609-617(2008)
[9]. S. H. Kim, K. S. Woo, B. Y. H. Liu, M. R. Zachariah, “Method of measuring charge distribution of nanosized
aerosols”. J. Colloid and Interface Science, 282:46–57(2005)
[10]. M. J. Hazucha, , & A. S. Lefohn, “ Nonlinearity in human health response to ozone: Experimental laboratory
considerations”, Atmospheric Environment, 41(22):4559–4570(2007)
[11]. T. Naoto, H. Hiroyuki, O. Noriaki, O. Yasuo. “Chemical characterization of dust particles recovered from bag
filters of electric arc furnaces for steelmaking: Some factors influencing the formation of hexachlorobenzene”, J.
Hazardous Materials, 183:116-124(2010)
[12]. N. Mao, Y.P. Yao, M. Hata, M. Wada, C. Kanaoka. “Comparison of filter cleaning performance between VDI and
JIS testing rigs for cleanable fabric filter”, Powder Tehnology, 180: 109-114(2008)
[13]. B. S. Choi, C. A. J. Fletecher “ Computation of particle transport in an Electrostatic Precipitator”, J. Electrostatics,
40&41:413-418(1997)
[14]. E. H. Tanabe, P. M. Barros, K. B. Rodrigues, M. L. Aguiar. “Experimental investigation of deposition and
removal of particles during gas filtration with various fabric filters”, Separation and Purification Technology, 80:
187-195(2011)
[15]. C. B. Song, H. S. Park, “ Analytic solutions for filtration of polydisperse aerosols in fibrous filter”, Powder
Technol., 170: 64–70(2006)
[16]. G. Mauschitz, H. Rud, W. Hoflinger, “Particle deposition in the depth of nonwoven dust filter media and its effect
on filter clogging”, In: Proceedings Filtech Europa, Wiesbaden, Germany, II34–II41(2007)
[17]. H. p. J ohn, S. T. Jeffrey, L. M. Christopher, L. H. Lucinda, W. Robert, P. Sara. “Fabric lter bag investigation
following eld testing of sorbent injection for mercury control at TXU's Big Brown Station”, Fuel Processing
Technology, 90:1424-1429(2009)
[18]. N. Noda, H. Makino. “Influence of operating temperature on performance of electrostatic precipitator for
pulverized coal combustion boiler”, Advanced Powder Technology, 21: 495-499(2010)
[19]. M. E. H. Shah, M. G. Rasul, M. M. K. Khan, A. V. Deev, N. Subaschandar “Influence of the inlet velocity profiles
on the prediction of velocity distribution inside an electrostatic precipitator”, Experimental Thermal and Fluid
Science, 33: 322-328(2009)
[20]. L. Zhao, C. E. Dela, K. A damiak, A. A. Berezin, J. S. Chang “ A numerical model of a wire-plate electrostatic
precipitator under electrohydrodynamic flow conditions”, in: The 10th International Conference on Electrostatic
Precipitator, Cairns, Australia, 2006
[21]. J. P.Seok Sang, S. K. “Electrohydrodynamic flow and particle transport mechanism in electrostatic precipitator
with cavity walls”, Aerosol Science and Technology 33: 205–221(2000)
56