Embed Size (px)
Citation preview
Numerical Reasoning Test
Dr Harry Flynn LDC
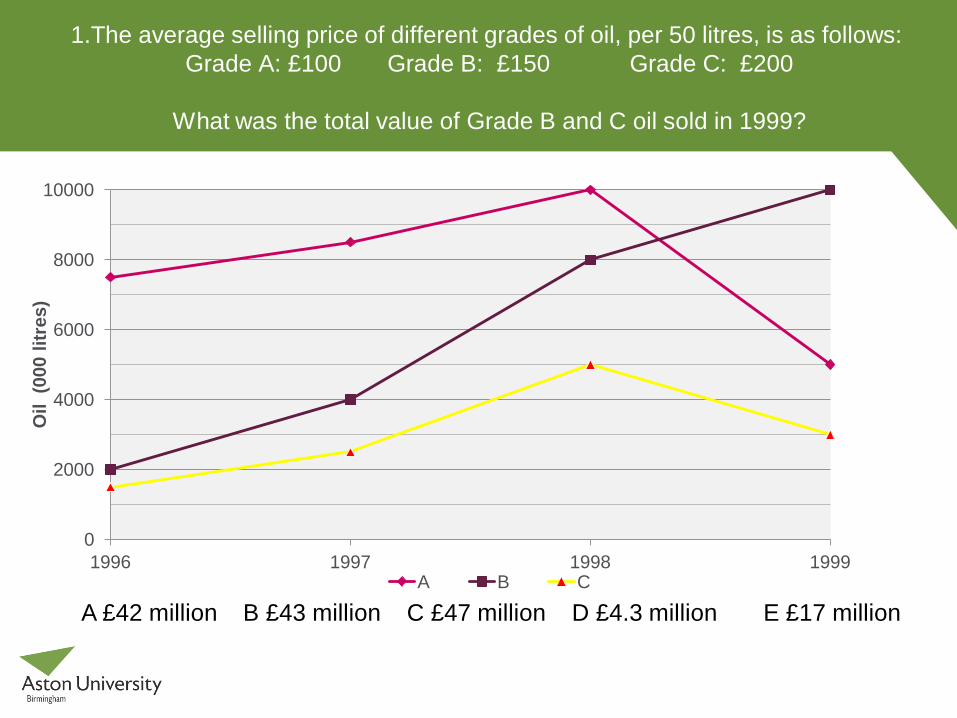
1.The average selling price of different grades of oil, per 50 litres, is as follows: Grade A: £100 Grade B: £150 Grade C: £200
What was the total value of Grade B and C oil sold in 1999?
A £42 million B £43 million C £47 million D £4.3 million E £17 million
0
2000
4000
6000
8000
10000
1996 1997 1998 1999
Oil
(000
litr
es)
A B C
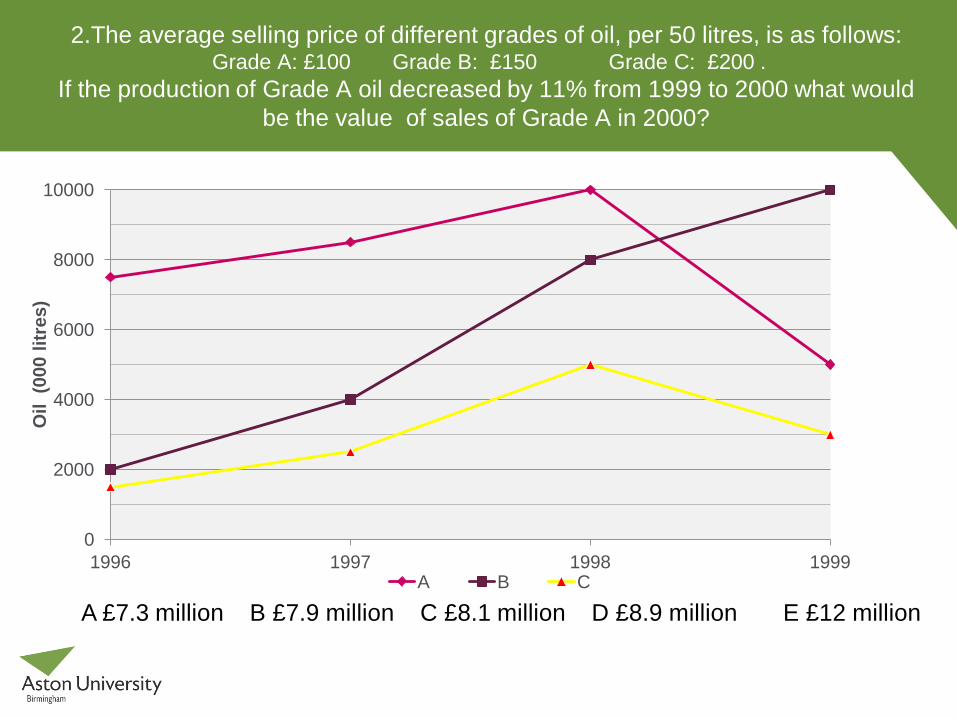
2.The average selling price of different grades of oil, per 50 litres, is as follows: Grade A: £100 Grade B: £150 Grade C: £200 .
If the production of Grade A oil decreased by 11% from 1999 to 2000 what would be the value of sales of Grade A in 2000?
0
2000
4000
6000
8000
10000
1996 1997 1998 1999
Oil
(000
litr
es)
A B C
A £7.3 million B £7.9 million C £8.1 million D £8.9 million E £12 million
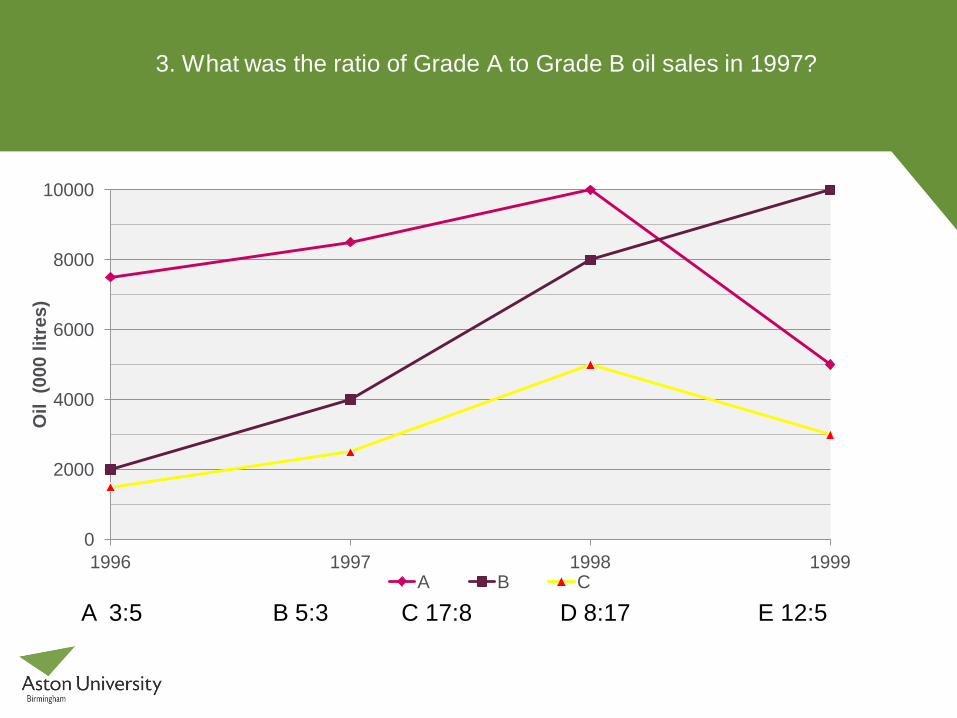
3. What was the ratio of Grade A to Grade B oil sales in 1997?
0
2000
4000
6000
8000
10000
1996 1997 1998 1999
Oil
(000
litr
es)
A B C
A 3:5 B 5:3 C 17:8 D 8:17 E 12:5

4. The number of visits to a children’s museum was monitored for five days.
What was the ratio of children to adults in this period?
0
5
10
15
20
25
Mon Tues Weds Thurs Fri
Visi
ts o
oo’s
Men Women Children
A 7:3 B 5:3 C 4:7 D 12:17 E 9:13
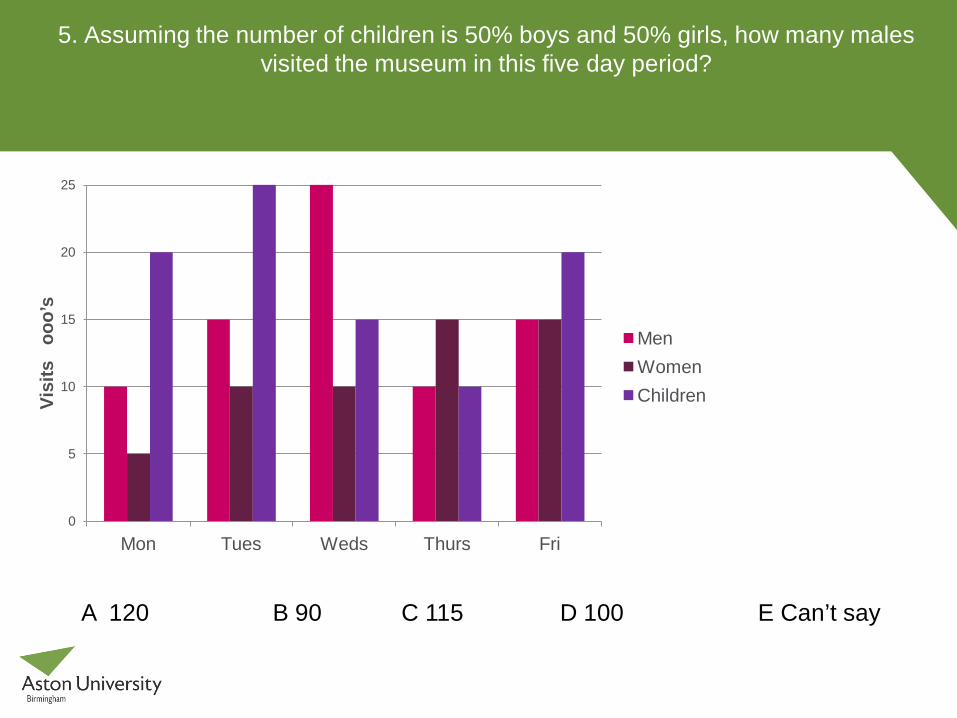
5. Assuming the number of children is 50% boys and 50% girls, how many males visited the museum in this five day period?
0
5
10
15
20
25
Mon Tues Weds Thurs Fri
Visi
ts
ooo’
s
Men Women Children
A 120 B 90 C 115 D 100 E Can’t say
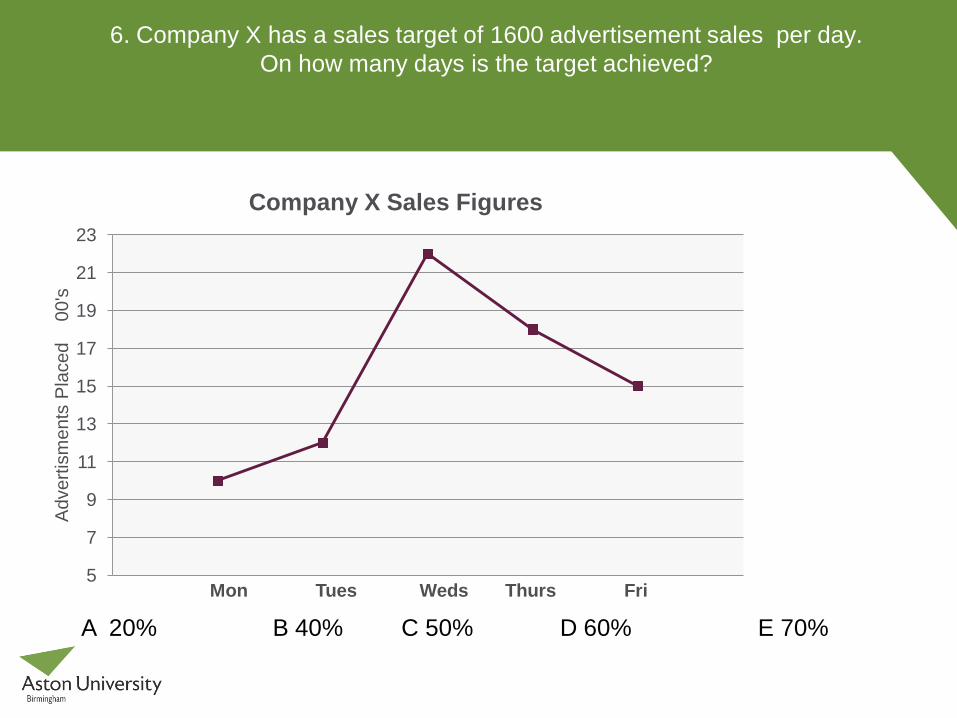
6. Company X has a sales target of 1600 advertisement sales per day. On how many days is the target achieved?
5
7
9
11
13
15
17
19
21
23
Adv
ertis
men
ts P
lace
d
00's
Mon Tues Weds Thurs Fri
Company X Sales Figures
A 20% B 40% C 50% D 60% E 70%
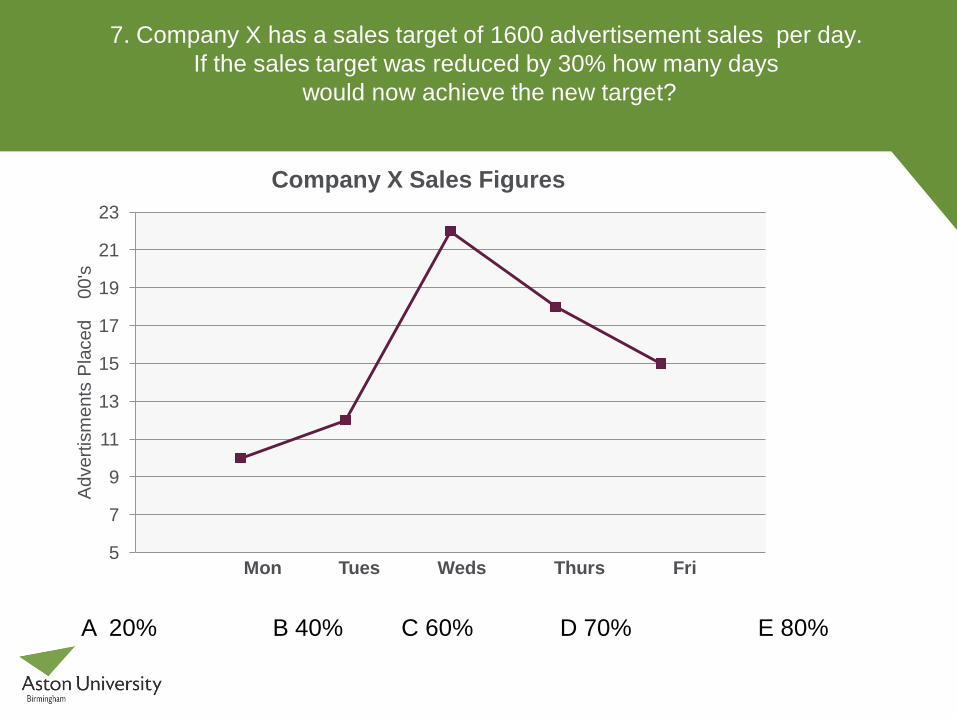
7. Company X has a sales target of 1600 advertisement sales per day. If the sales target was reduced by 30% how many days
would now achieve the new target?
5
7
9
11
13
15
17
19
21
23
Adv
ertis
men
ts P
lace
d
00's
Mon Tues Weds Thurs Fri
Company X Sales Figures
A 20% B 40% C 60% D 70% E 80%
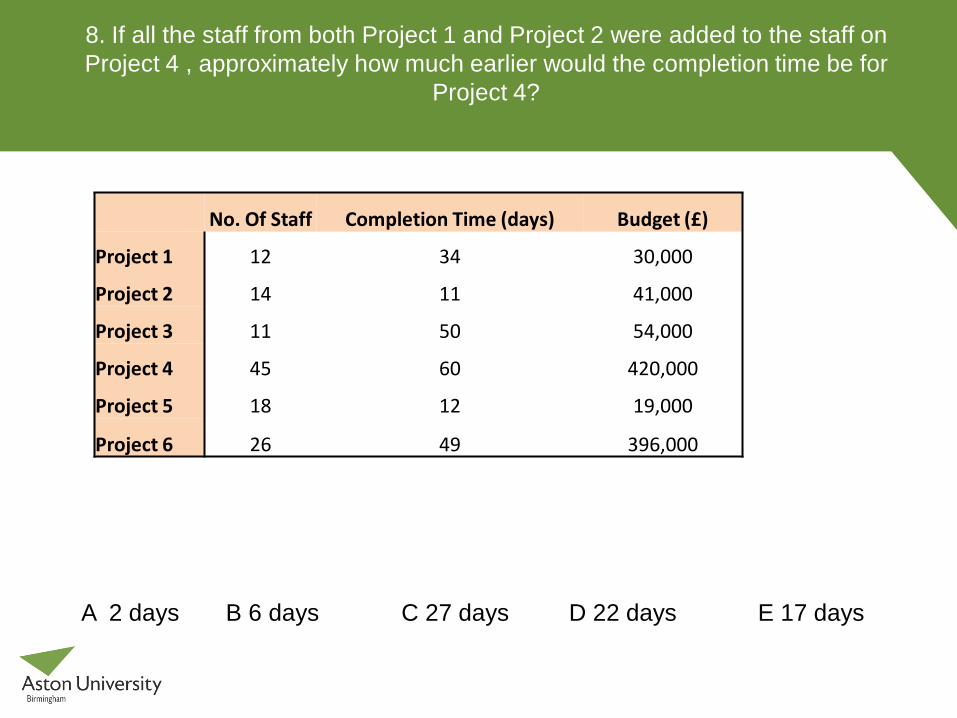
8. If all the staff from both Project 1 and Project 2 were added to the staff on Project 4 , approximately how much earlier would the completion time be for
Project 4?
No. Of Staff Completion Time (days) Budget (£)
Project 1 12 34 30,000
Project 2 14 11 41,000
Project 3 11 50 54,000
Project 4 45 60 420,000
Project 5 18 12 19,000
Project 6 26 49 396,000
A 2 days B 6 days C 27 days D 22 days E 17 days
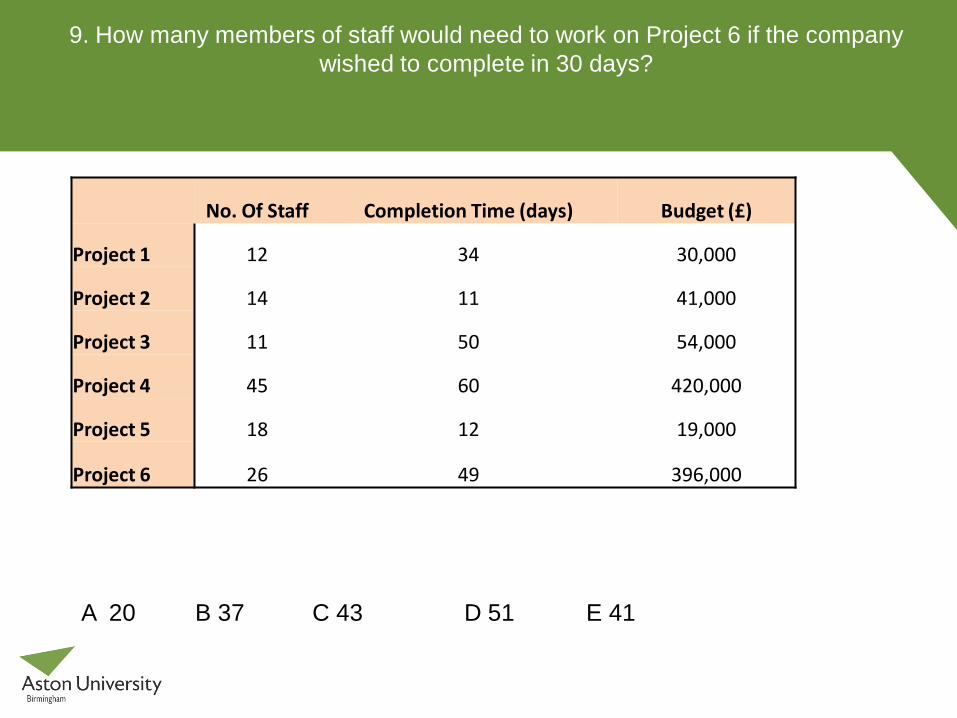
9. How many members of staff would need to work on Project 6 if the company wished to complete in 30 days?
No. Of Staff Completion Time (days) Budget (£)
Project 1 12 34 30,000
Project 2 14 11 41,000
Project 3 11 50 54,000
Project 4 45 60 420,000
Project 5 18 12 19,000
Project 6 26 49 396,000
A 20 B 37 C 43 D 51 E 41
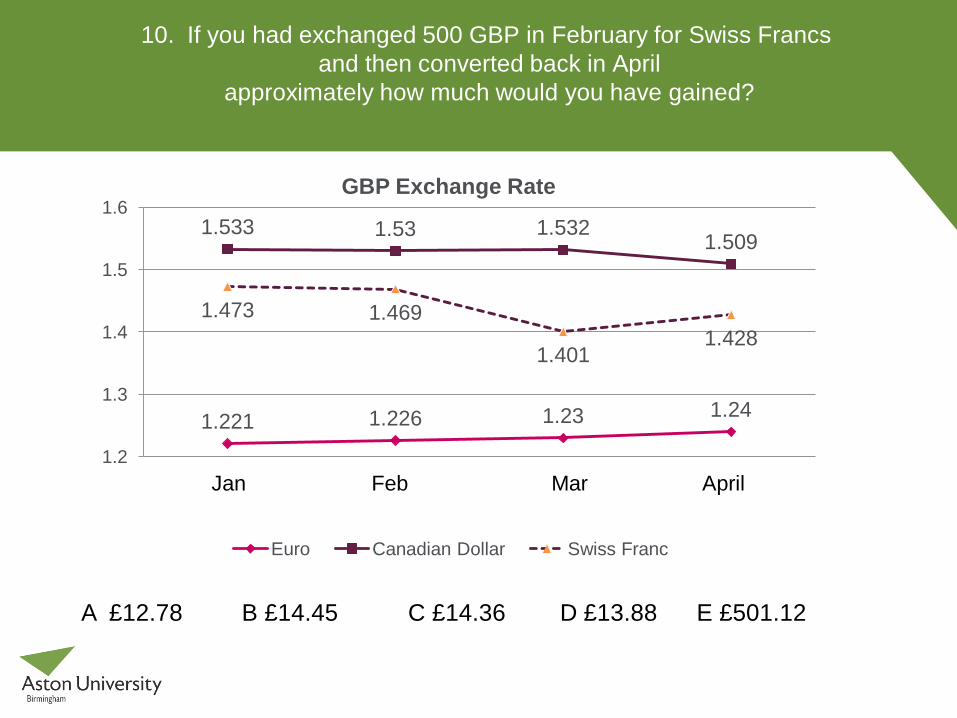
10. If you had exchanged 500 GBP in February for Swiss Francs and then converted back in April
approximately how much would you have gained?
1.221 1.226 1.23 1.24
1.533 1.53 1.532 1.509
1.473 1.469
1.401 1.428
1.2
1.3
1.4
1.5
1.6 GBP Exchange Rate
Euro Canadian Dollar Swiss Franc
Jan Feb Mar April
A £12.78 B £14.45 C £14.36 D £13.88 E £501.12
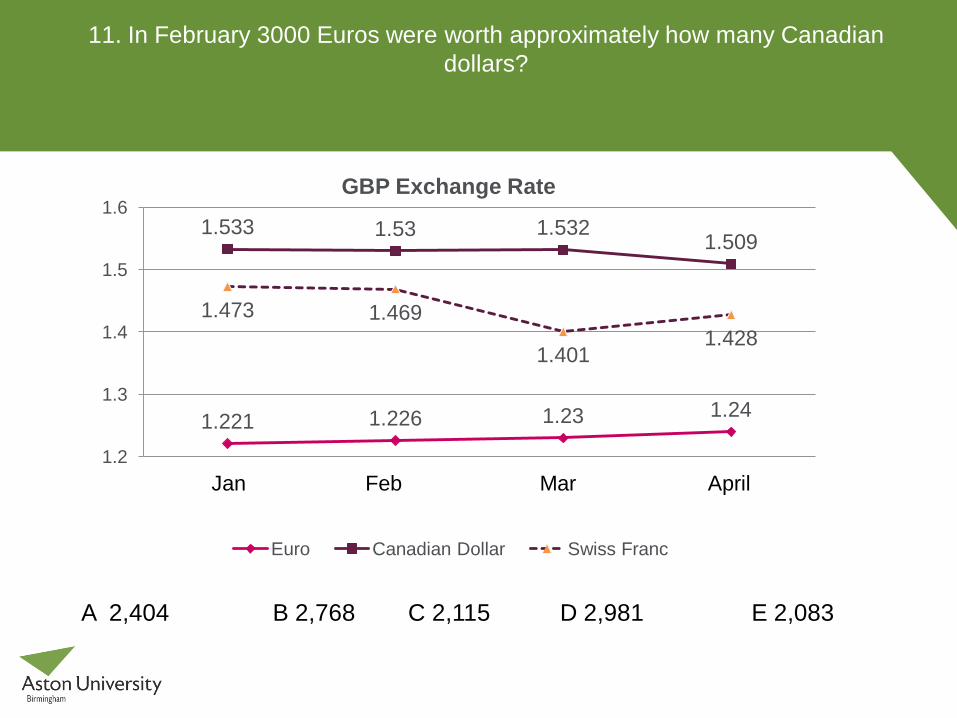
11. In February 3000 Euros were worth approximately how many Canadian dollars?
1.221 1.226 1.23 1.24
1.533 1.53 1.532 1.509
1.473 1.469
1.401 1.428
1.2
1.3
1.4
1.5
1.6 GBP Exchange Rate
Euro Canadian Dollar Swiss Franc
Jan Feb Mar April
A 2,404 B 2,768 C 2,115 D 2,981 E 2,083
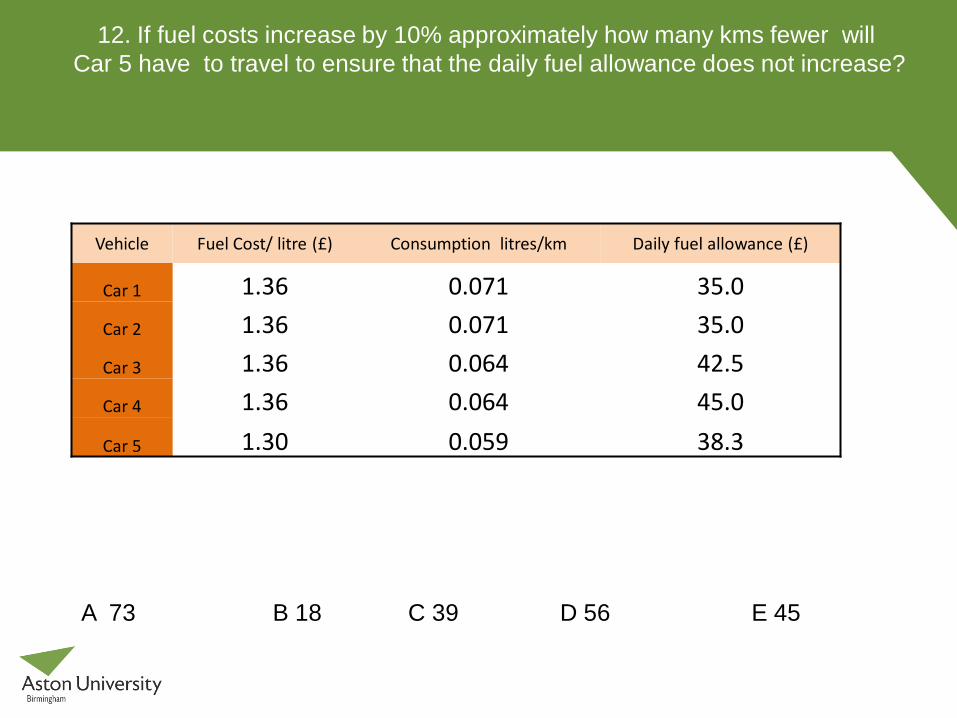
12. If fuel costs increase by 10% approximately how many kms fewer will Car 5 have to travel to ensure that the daily fuel allowance does not increase?
Vehicle Fuel Cost/ litre (£) Consumption litres/km Daily fuel allowance (£)
Car 1 1.36 0.071 35.0 Car 2 1.36 0.071 35.0 Car 3 1.36 0.064 42.5 Car 4 1.36 0.064 45.0 Car 5 1.30 0.059 38.3
A 73 B 18 C 39 D 56 E 45
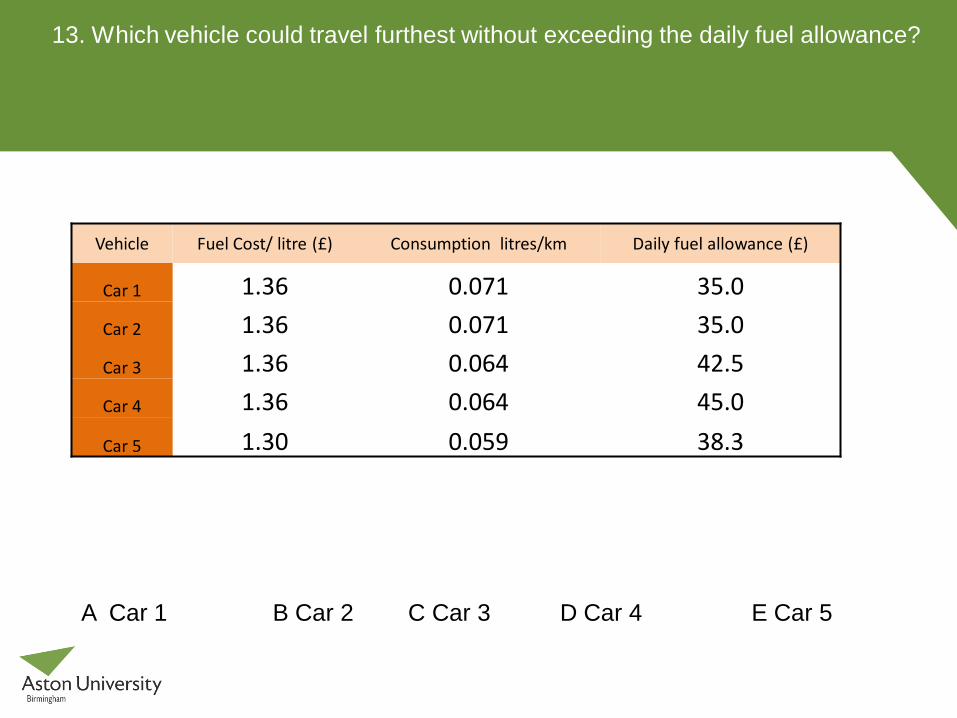
13. Which vehicle could travel furthest without exceeding the daily fuel allowance?
Vehicle Fuel Cost/ litre (£) Consumption litres/km Daily fuel allowance (£)
Car 1 1.36 0.071 35.0 Car 2 1.36 0.071 35.0 Car 3 1.36 0.064 42.5 Car 4 1.36 0.064 45.0 Car 5 1.30 0.059 38.3
A Car 1 B Car 2 C Car 3 D Car 4 E Car 5
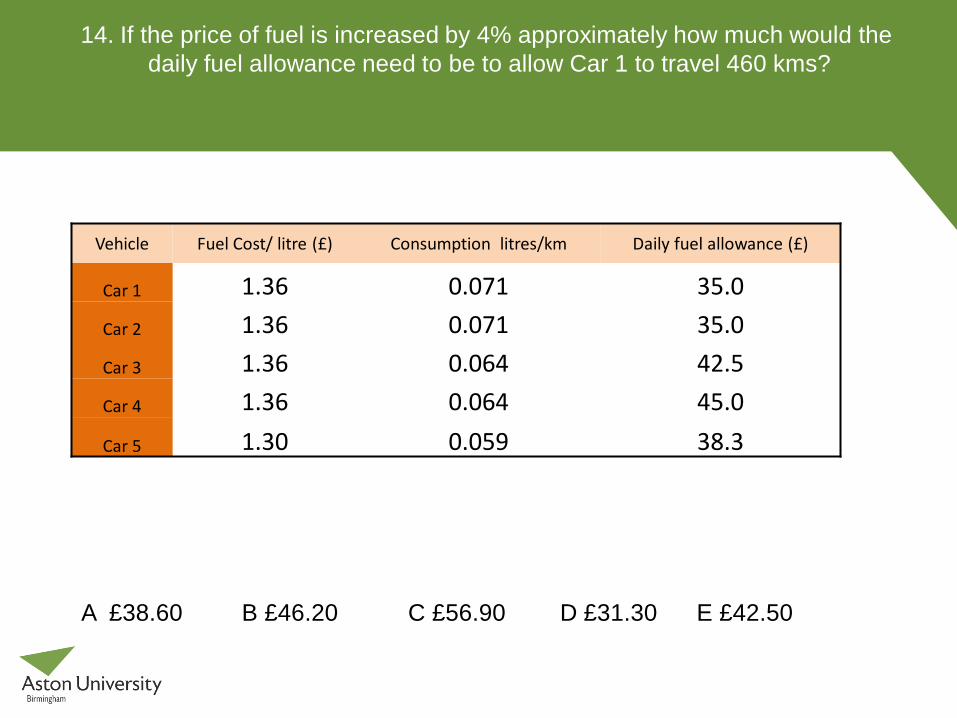
14. If the price of fuel is increased by 4% approximately how much would the daily fuel allowance need to be to allow Car 1 to travel 460 kms?
Vehicle Fuel Cost/ litre (£) Consumption litres/km Daily fuel allowance (£)
Car 1 1.36 0.071 35.0 Car 2 1.36 0.071 35.0 Car 3 1.36 0.064 42.5 Car 4 1.36 0.064 45.0 Car 5 1.30 0.059 38.3
A £38.60 B £46.20 C £56.90 D £31.30 E £42.50
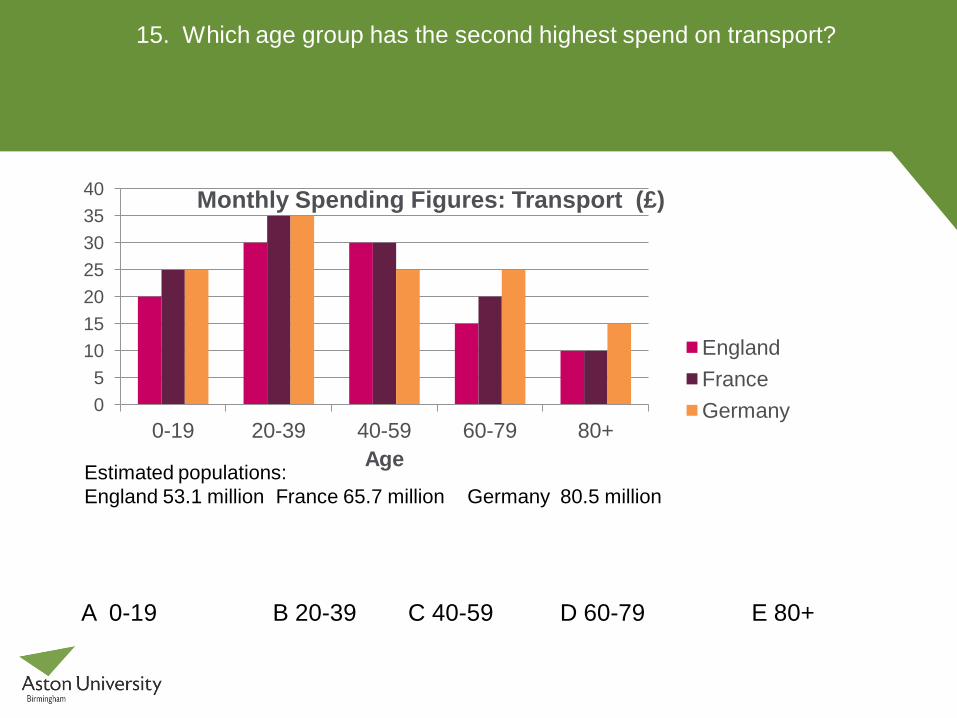
15. Which age group has the second highest spend on transport?
0 5
10 15 20 25 30 35 40
0-19 20-39 40-59 60-79 80+ Age
Monthly Spending Figures: Transport (£)
England France Germany
Estimated populations: England 53.1 million France 65.7 million Germany 80.5 million
A 0-19 B 20-39 C 40-59 D 60-79 E 80+
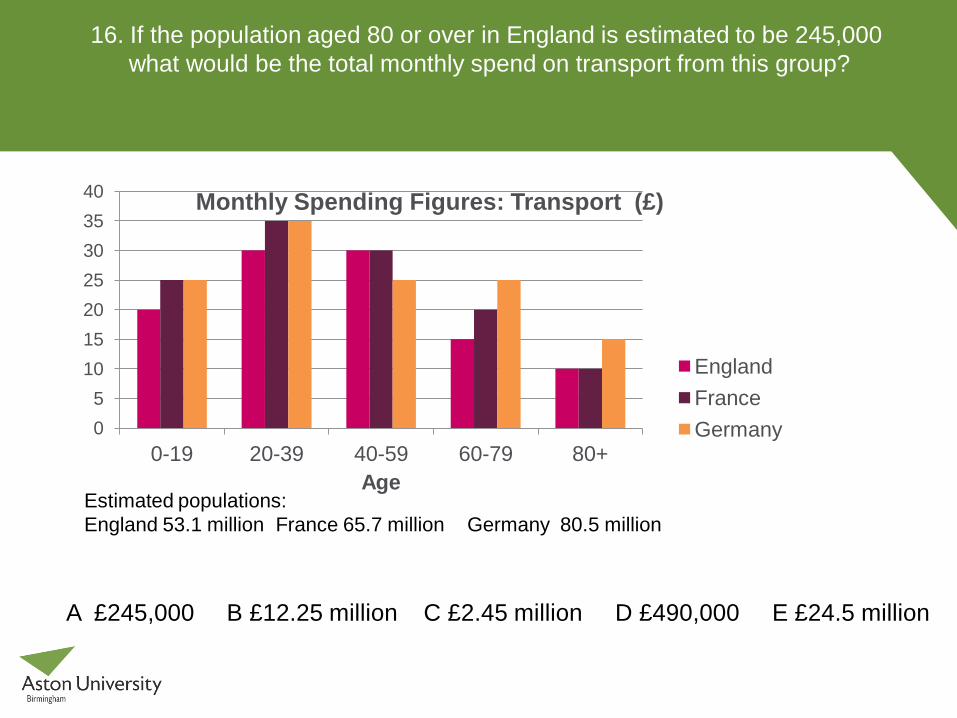
16. If the population aged 80 or over in England is estimated to be 245,000 what would be the total monthly spend on transport from this group?
0 5
10 15 20 25 30 35 40
0-19 20-39 40-59 60-79 80+ Age
Monthly Spending Figures: Transport (£)
England France Germany
Estimated populations: England 53.1 million France 65.7 million Germany 80.5 million
A £245,000 B £12.25 million C £2.45 million D £490,000 E £24.5 million
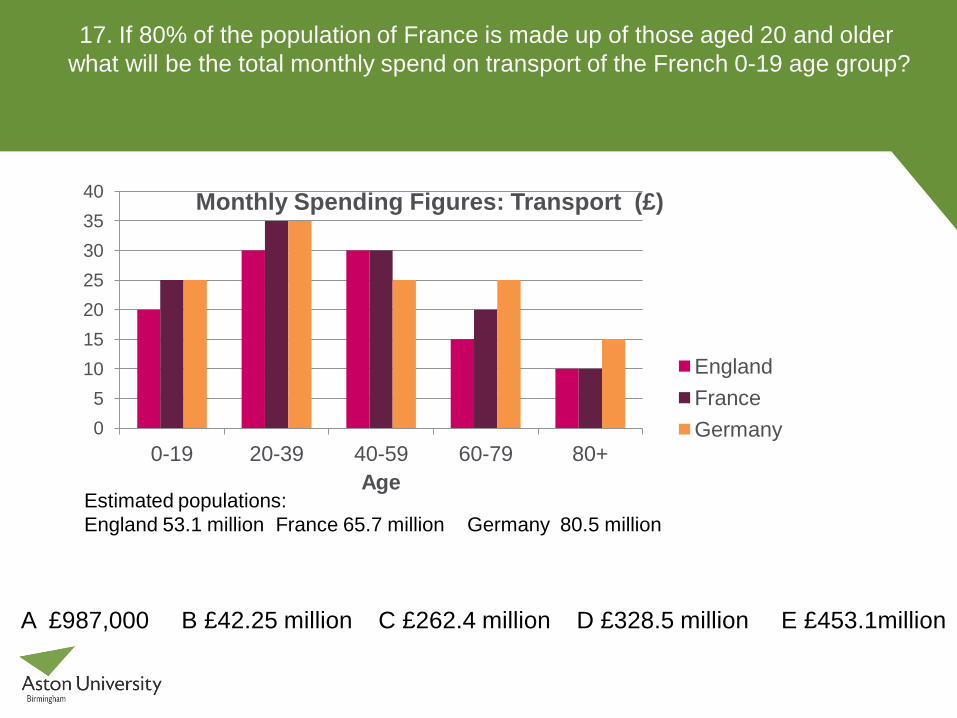
17. If 80% of the population of France is made up of those aged 20 and older what will be the total monthly spend on transport of the French 0-19 age group?
0 5
10 15 20 25 30 35 40
0-19 20-39 40-59 60-79 80+ Age
Monthly Spending Figures: Transport (£)
England France Germany
Estimated populations: England 53.1 million France 65.7 million Germany 80.5 million
A £987,000 B £42.25 million C £262.4 million D £328.5 million E £453.1million
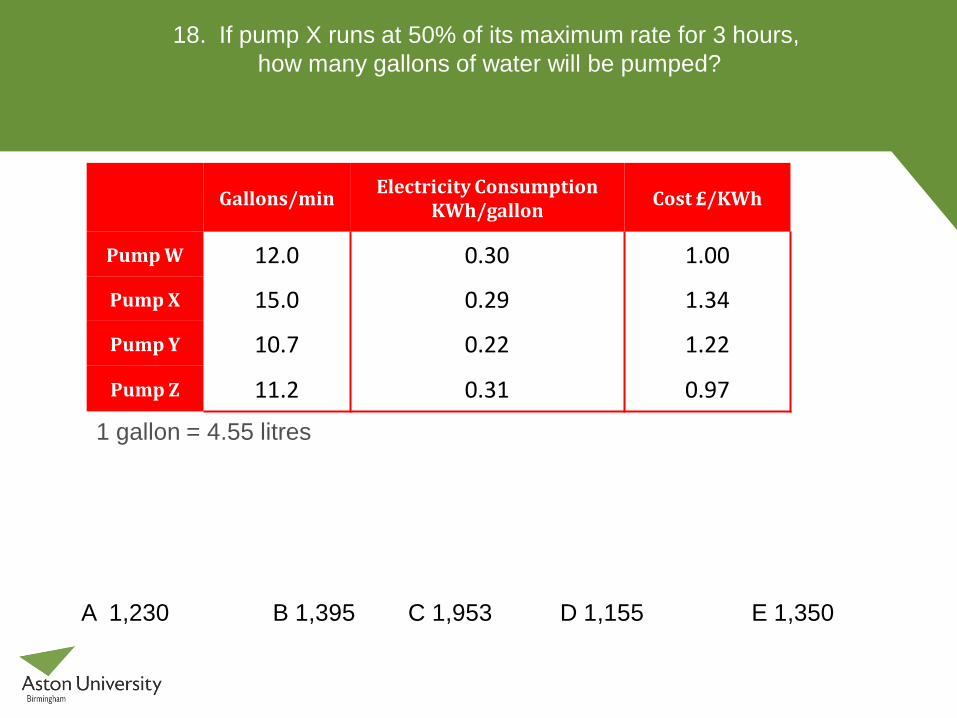
18. If pump X runs at 50% of its maximum rate for 3 hours, how many gallons of water will be pumped?
Gallons/min Electricity Consumption
KWh/gallon Cost £/KWh
Pump W 12.0 0.30 1.00
Pump X 15.0 0.29 1.34
Pump Y 10.7 0.22 1.22
Pump Z 11.2 0.31 0.97
1 gallon = 4.55 litres
A 1,230 B 1,395 C 1,953 D 1,155 E 1,350
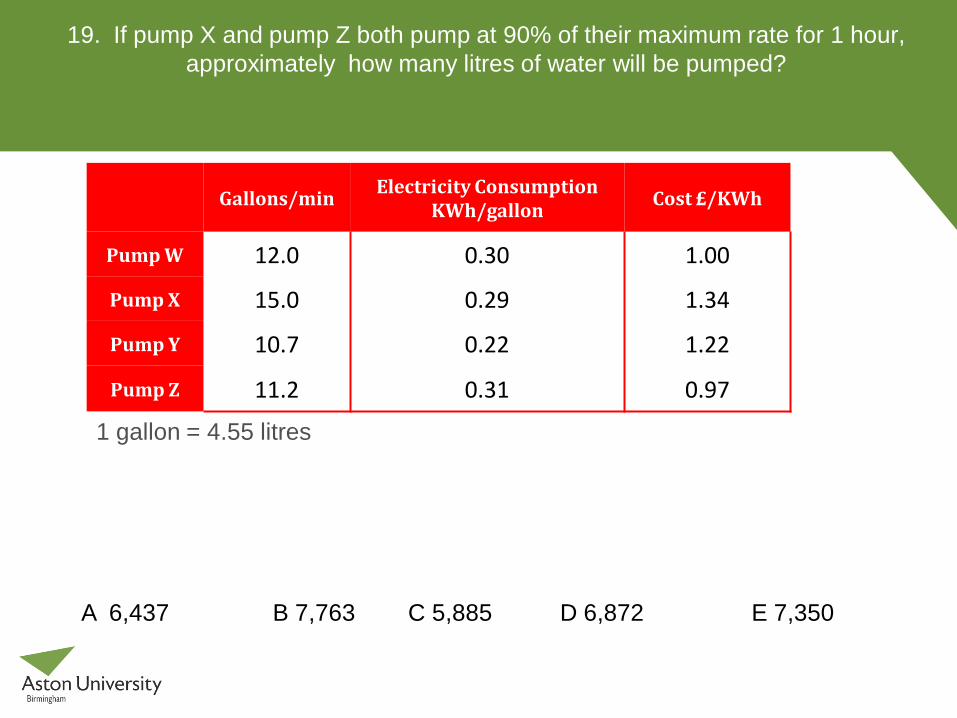
19. If pump X and pump Z both pump at 90% of their maximum rate for 1 hour, approximately how many litres of water will be pumped?
Gallons/min Electricity Consumption
KWh/gallon Cost £/KWh
Pump W 12.0 0.30 1.00
Pump X 15.0 0.29 1.34
Pump Y 10.7 0.22 1.22
Pump Z 11.2 0.31 0.97
1 gallon = 4.55 litres
A 6,437 B 7,763 C 5,885 D 6,872 E 7,350

20. Approximately how many hours will pump Y need to run at maximum capacity to pump 40,000 litres?
Gallons/min Electricity Consumption
KWh/gallon Cost £/KWh
Pump W 12.0 0.30 1.00
Pump X 15.0 0.29 1.34
Pump Y 10.7 0.22 1.22
Pump Z 11.2 0.31 0.97
1 gallon = 4.55 litres
A 12.2 B 13.7 C 15.9 D 13.1 E 12.8
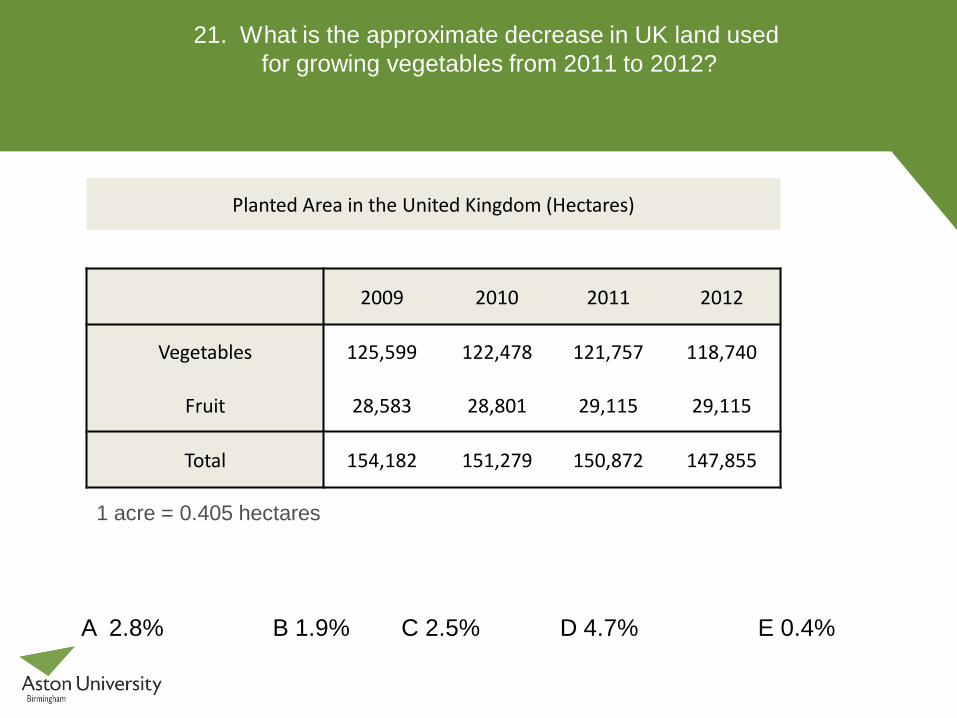
21. What is the approximate decrease in UK land used for growing vegetables from 2011 to 2012?
Planted Area in the United Kingdom (Hectares)
2009 2010 2011 2012
Vegetables 125,599 122,478 121,757 118,740
Fruit 28,583 28,801 29,115 29,115
Total 154,182 151,279 150,872 147,855
1 acre = 0.405 hectares
A 2.8% B 1.9% C 2.5% D 4.7% E 0.4%
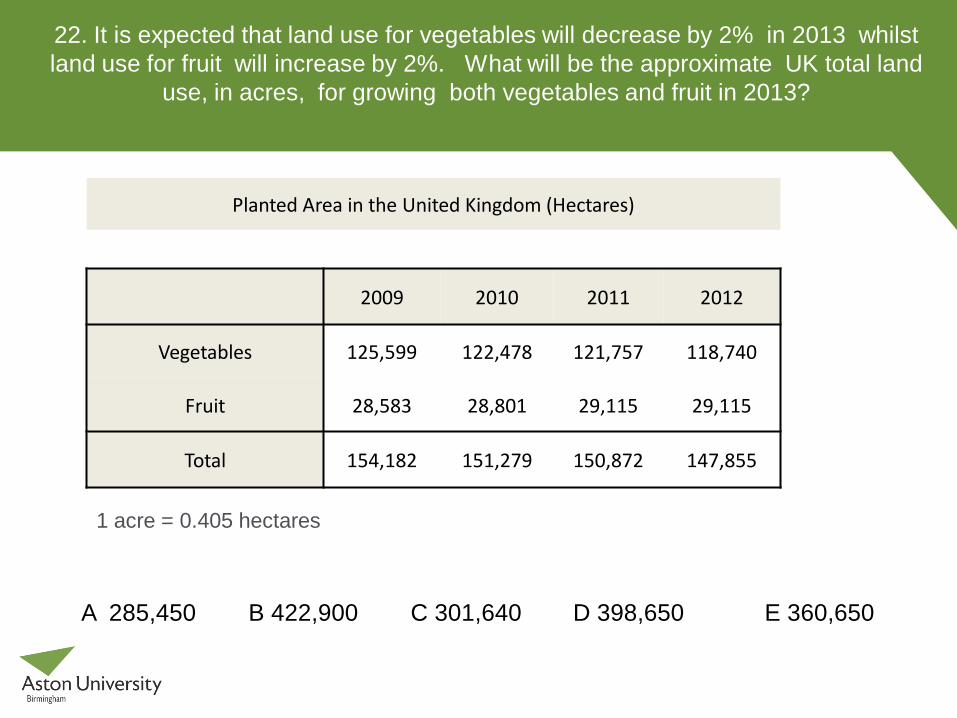
22. It is expected that land use for vegetables will decrease by 2% in 2013 whilst land use for fruit will increase by 2%. What will be the approximate UK total land
use, in acres, for growing both vegetables and fruit in 2013?
Planted Area in the United Kingdom (Hectares)
2009 2010 2011 2012
Vegetables 125,599 122,478 121,757 118,740
Fruit 28,583 28,801 29,115 29,115
Total 154,182 151,279 150,872 147,855
1 acre = 0.405 hectares
A 285,450 B 422,900 C 301,640 D 398,650 E 360,650
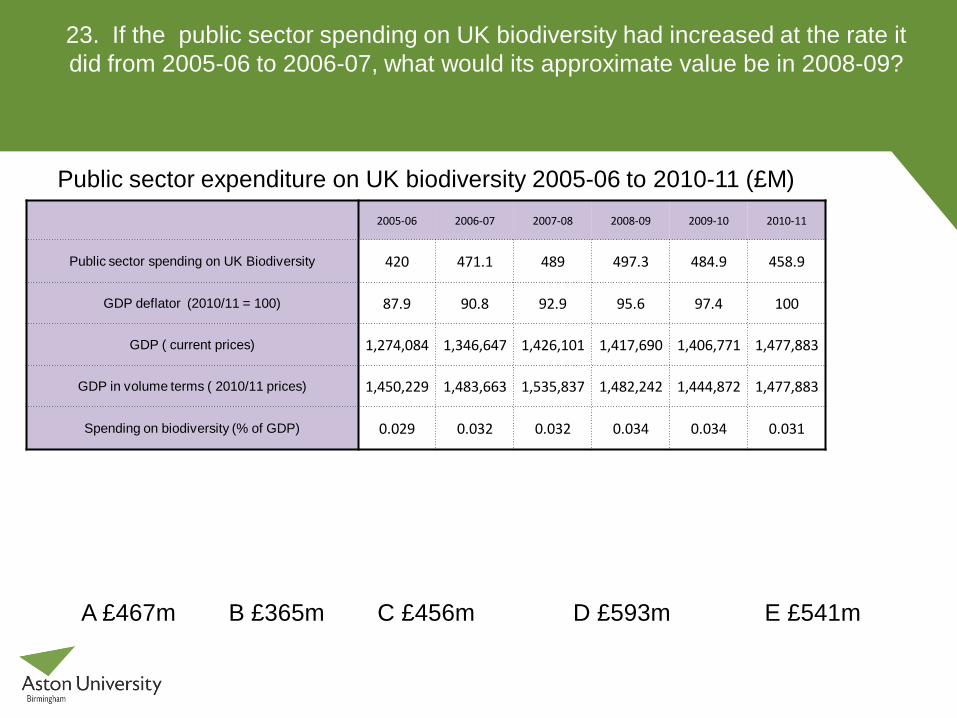
23. If the public sector spending on UK biodiversity had increased at the rate it did from 2005-06 to 2006-07, what would its approximate value be in 2008-09?
Public sector expenditure on UK biodiversity 2005-06 to 2010-11 (£M)
2005-06 2006-07 2007-08 2008-09 2009-10 2010-11
Public sector spending on UK Biodiversity 420 471.1 489 497.3 484.9 458.9
GDP deflator (2010/11 = 100) 87.9 90.8 92.9 95.6 97.4 100
GDP ( current prices) 1,274,084 1,346,647 1,426,101 1,417,690 1,406,771 1,477,883
GDP in volume terms ( 2010/11 prices) 1,450,229 1,483,663 1,535,837 1,482,242 1,444,872 1,477,883
Spending on biodiversity (% of GDP) 0.029 0.032 0.032 0.034 0.034 0.031
A £467m B £365m C £456m D £593m E £541m
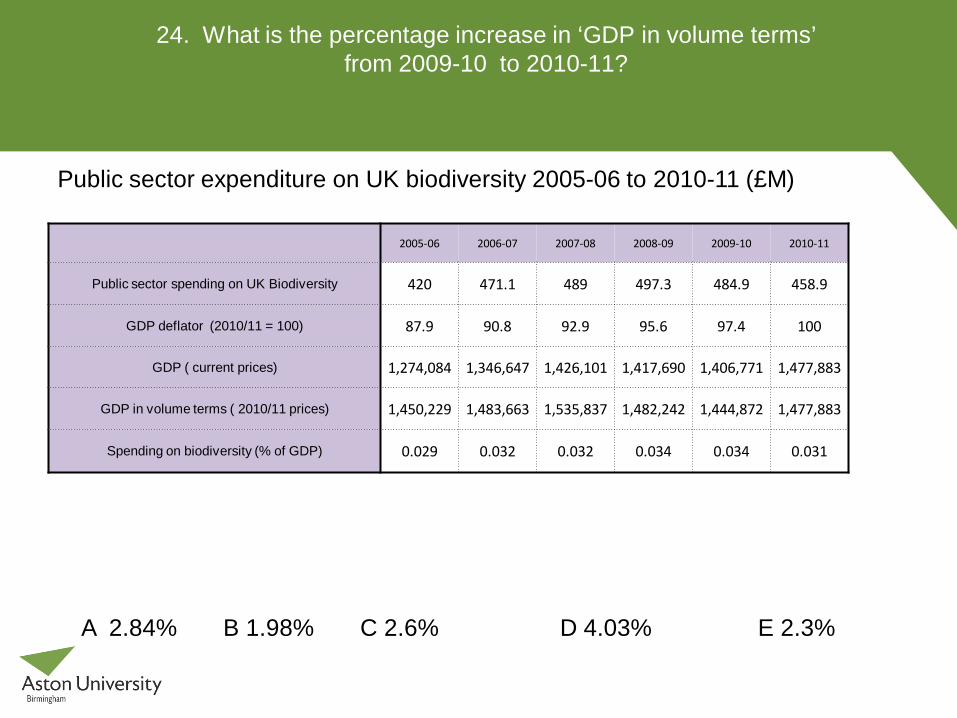
24. What is the percentage increase in ‘GDP in volume terms’ from 2009-10 to 2010-11?
Public sector expenditure on UK biodiversity 2005-06 to 2010-11 (£M)
2005-06 2006-07 2007-08 2008-09 2009-10 2010-11
Public sector spending on UK Biodiversity 420 471.1 489 497.3 484.9 458.9
GDP deflator (2010/11 = 100) 87.9 90.8 92.9 95.6 97.4 100
GDP ( current prices) 1,274,084 1,346,647 1,426,101 1,417,690 1,406,771 1,477,883
GDP in volume terms ( 2010/11 prices) 1,450,229 1,483,663 1,535,837 1,482,242 1,444,872 1,477,883
Spending on biodiversity (% of GDP) 0.029 0.032 0.032 0.034 0.034 0.031
A 2.84% B 1.98% C 2.6% D 4.03% E 2.3%
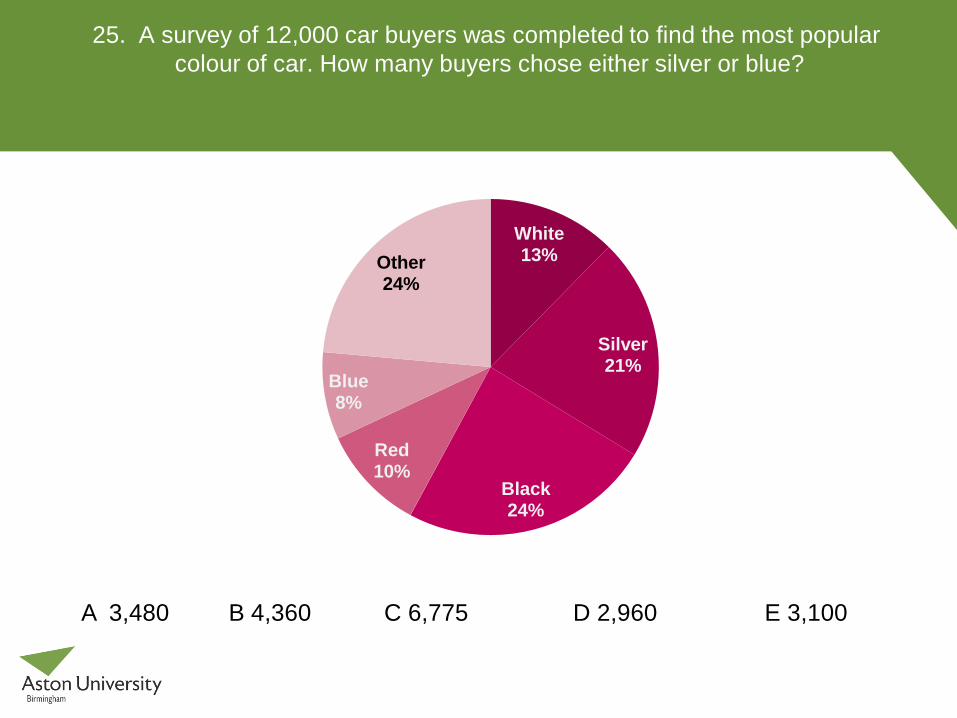
25. A survey of 12,000 car buyers was completed to find the most popular colour of car. How many buyers chose either silver or blue?
White 13%
Silver 21%
Black 24%
Red 10%
Blue 8%
Other 24%
A 3,480 B 4,360 C 6,775 D 2,960 E 3,100
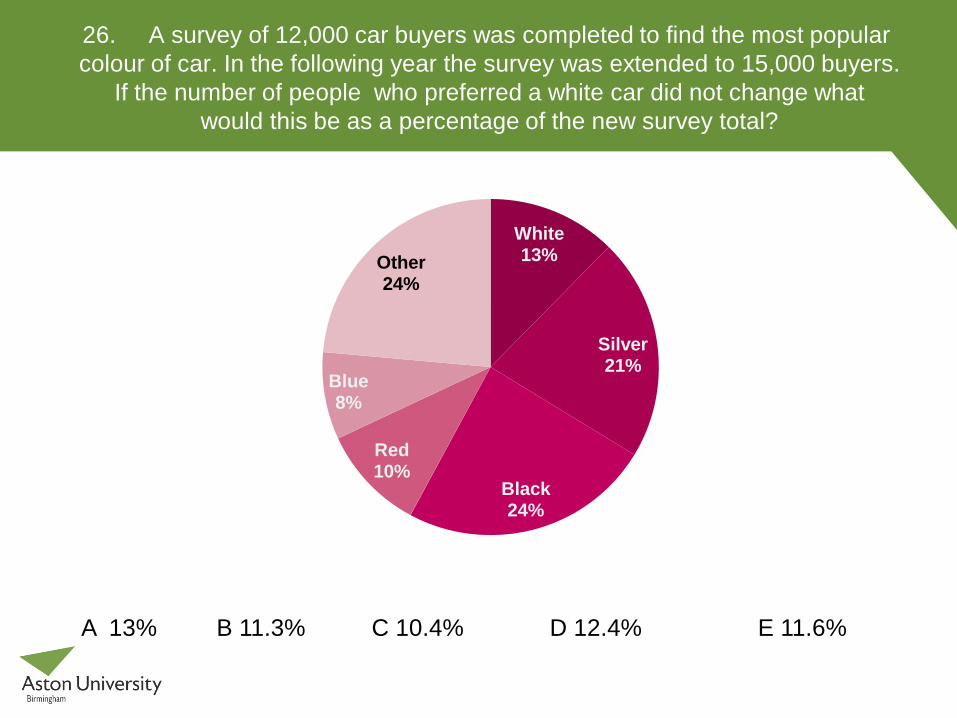
26. A survey of 12,000 car buyers was completed to find the most popular colour of car. In the following year the survey was extended to 15,000 buyers.
If the number of people who preferred a white car did not change what would this be as a percentage of the new survey total?
White 13%
Silver 21%
Black 24%
Red 10%
Blue 8%
Other 24%
A 13% B 11.3% C 10.4% D 12.4% E 11.6%
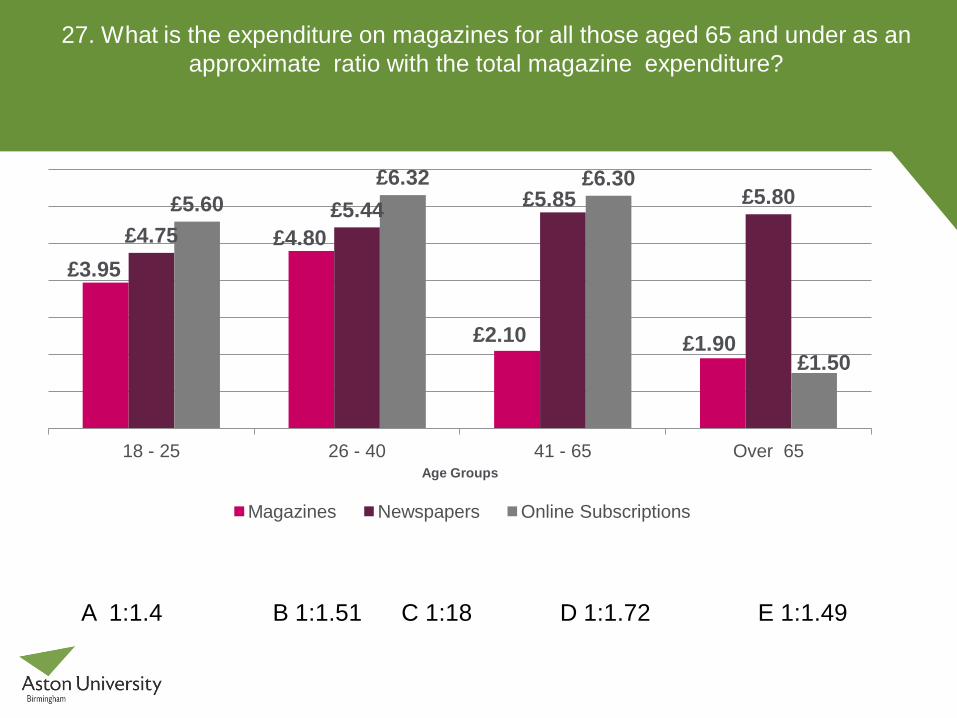
27. What is the expenditure on magazines for all those aged 65 and under as an approximate ratio with the total magazine expenditure?
£3.95 £4.80
£2.10 £1.90
£4.75 £5.44 £5.85 £5.80 £5.60
£6.32 £6.30
£1.50
18 - 25 26 - 40 41 - 65 Over 65 Age Groups
Magazines Newspapers Online Subscriptions
A 1:1.4 B 1:1.51 C 1:18 D 1:1.72 E 1:1.49
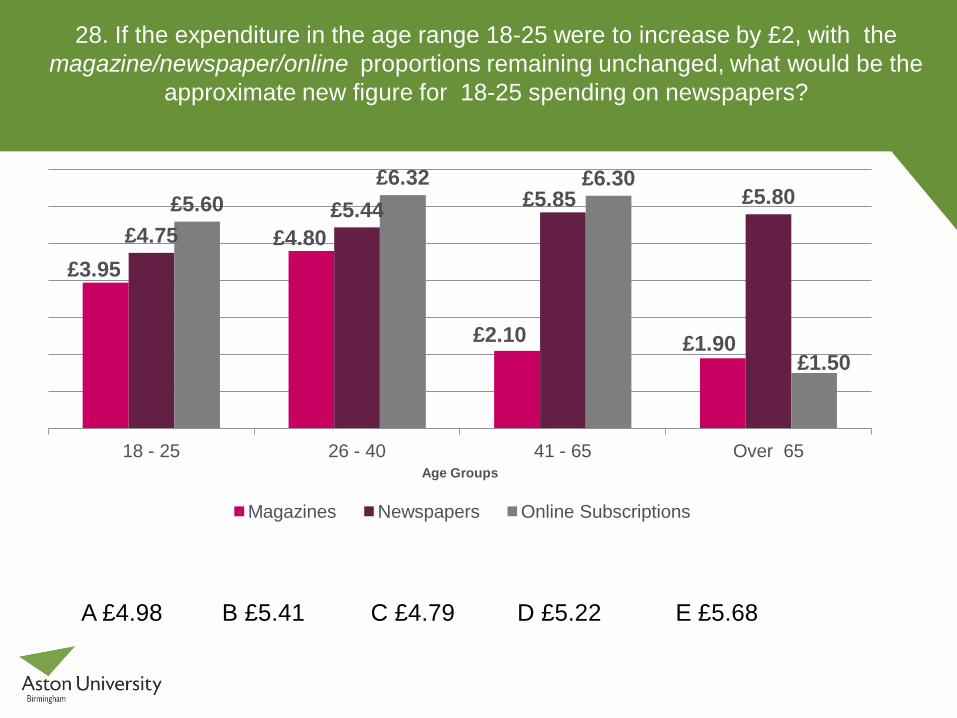
28. If the expenditure in the age range 18-25 were to increase by £2, with the magazine/newspaper/online proportions remaining unchanged, what would be the
approximate new figure for 18-25 spending on newspapers?
£3.95 £4.80
£2.10 £1.90
£4.75 £5.44 £5.85 £5.80 £5.60
£6.32 £6.30
£1.50
18 - 25 26 - 40 41 - 65 Over 65 Age Groups
Magazines Newspapers Online Subscriptions
A £4.98 B £5.41 C £4.79 D £5.22 E £5.68
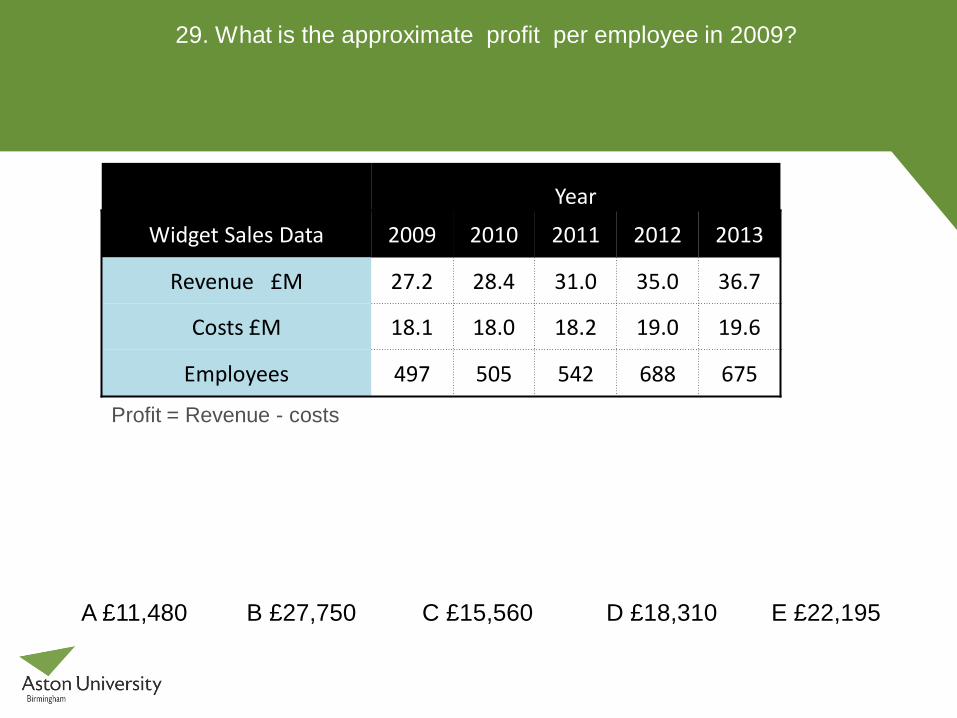
29. What is the approximate profit per employee in 2009?
Year
Widget Sales Data 2009 2010 2011 2012 2013
Revenue £M 27.2 28.4 31.0 35.0 36.7
Costs £M 18.1 18.0 18.2 19.0 19.6
Employees 497 505 542 688 675
Profit = Revenue - costs
A £11,480 B £27,750 C £15,560 D £18,310 E £22,195
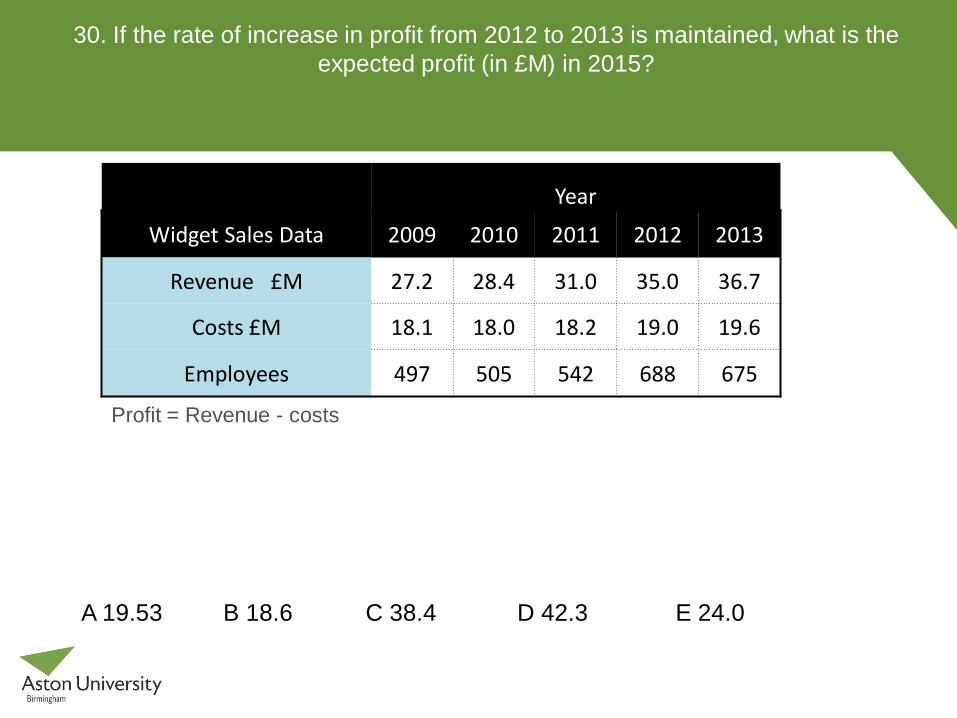
30. If the rate of increase in profit from 2012 to 2013 is maintained, what is the expected profit (in £M) in 2015?
Year
Widget Sales Data 2009 2010 2011 2012 2013
Revenue £M 27.2 28.4 31.0 35.0 36.7
Costs £M 18.1 18.0 18.2 19.0 19.6
Employees 497 505 542 688 675
Profit = Revenue - costs
A 19.53 B 18.6 C 38.4 D 42.3 E 24.0
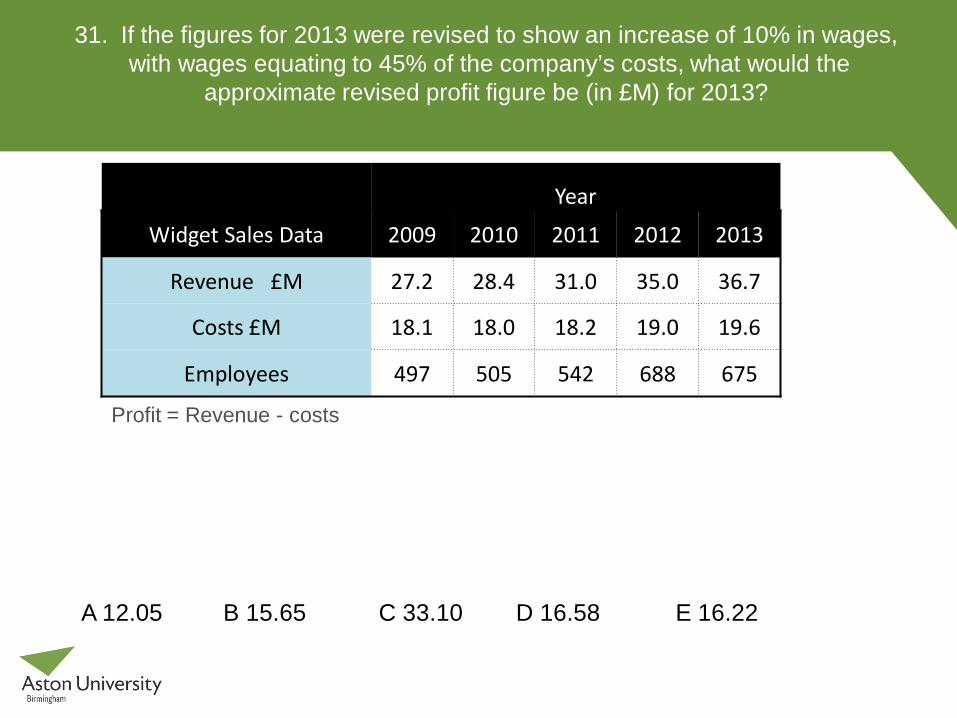
31. If the figures for 2013 were revised to show an increase of 10% in wages, with wages equating to 45% of the company’s costs, what would the
approximate revised profit figure be (in £M) for 2013?
Year
Widget Sales Data 2009 2010 2011 2012 2013
Revenue £M 27.2 28.4 31.0 35.0 36.7
Costs £M 18.1 18.0 18.2 19.0 19.6
Employees 497 505 542 688 675
Profit = Revenue - costs
A 12.05 B 15.65 C 33.10 D 16.58 E 16.22

32. What is the total number of visitors, over the two years, who came to the shopping centre by train or coach?
3%
7%
13%
27%
50%
Walk Bus Train Coach Car
4%
7%
10%
28%
51%
Walk Bus Train Coach Car
2012 2013
Total number of visitors: 340,000 Total number of visitors: 450,000
ABC Shopping Centre: Visitor Figures by Mode of Travel
A 298,000 B 401,000 C 382,000 D 307,000 E 350,000
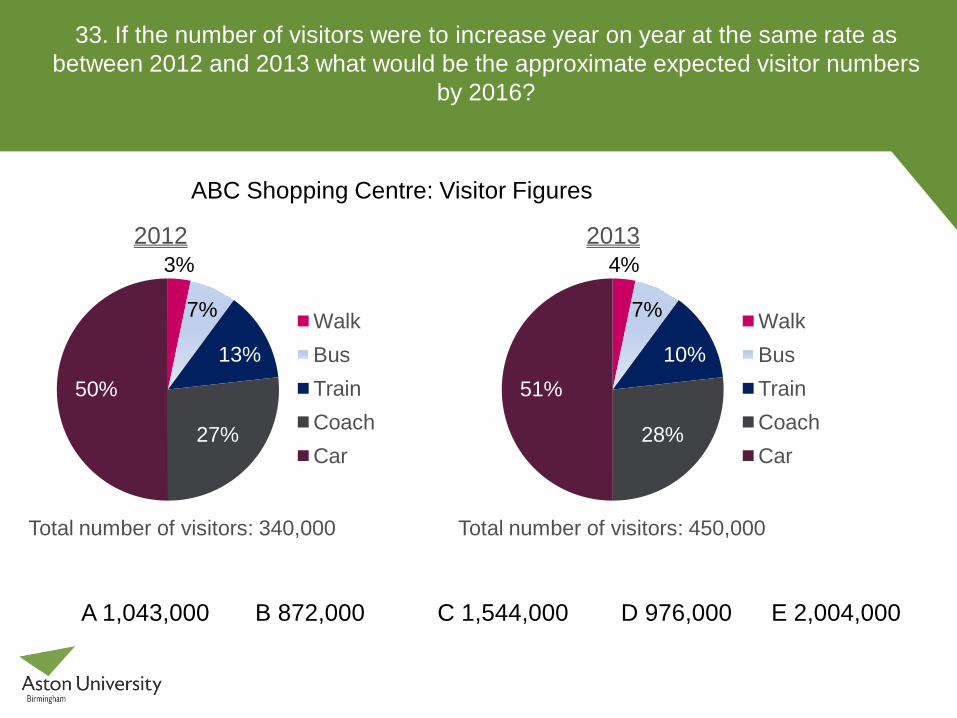
33. If the number of visitors were to increase year on year at the same rate as between 2012 and 2013 what would be the approximate expected visitor numbers
by 2016?
3%
7%
13%
27%
50%
Walk Bus Train Coach Car
4%
7%
10%
28%
51%
Walk Bus Train Coach Car
2012 2013
Total number of visitors: 340,000 Total number of visitors: 450,000
ABC Shopping Centre: Visitor Figures
A 1,043,000 B 872,000 C 1,544,000 D 976,000 E 2,004,000
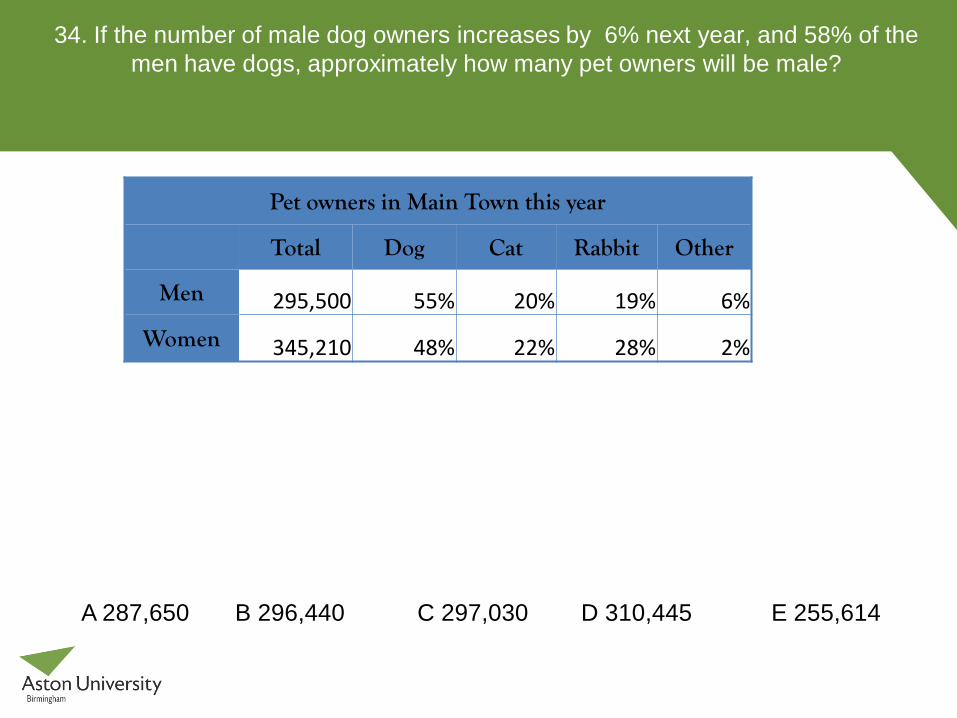
34. If the number of male dog owners increases by 6% next year, and 58% of the men have dogs, approximately how many pet owners will be male?
Pet owners in Main Town this year
Total Dog Cat Rabbit Other
Men 295,500 55% 20% 19% 6%
Women 345,210 48% 22% 28% 2%
A 287,650 B 296,440 C 297,030 D 310,445 E 255,614
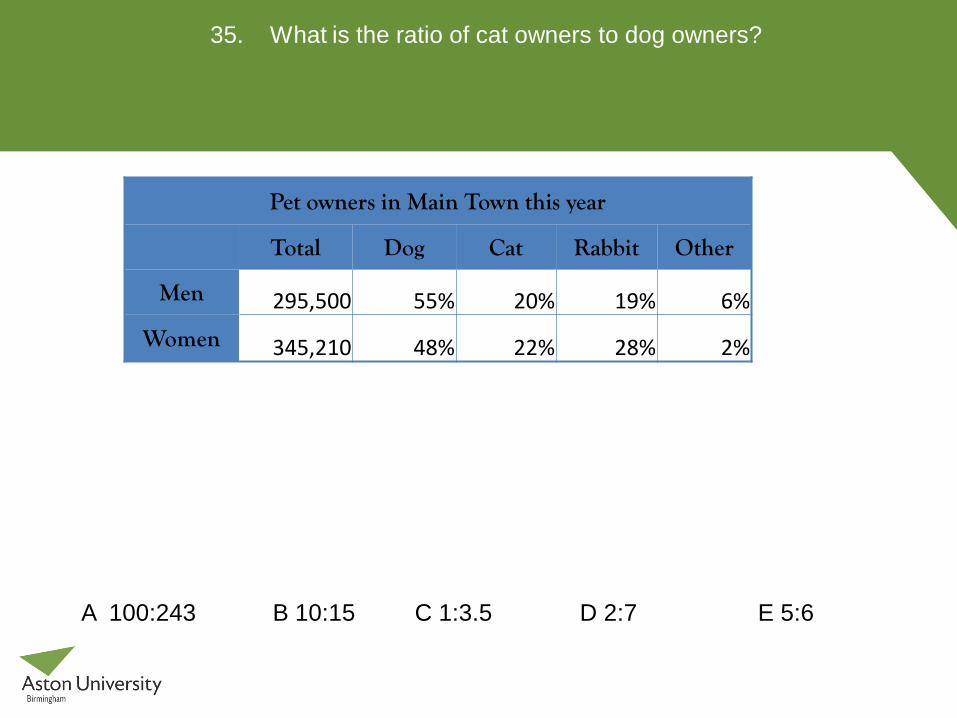
35. What is the ratio of cat owners to dog owners?
Pet owners in Main Town this year
Total Dog Cat Rabbit Other
Men 295,500 55% 20% 19% 6%
Women 345,210 48% 22% 28% 2%
A 100:243 B 10:15 C 1:3.5 D 2:7 E 5:6

36. How much money will borrowers have to repay if they borrow £5,000 over 5 years?
Repayment period
12 months 60 months
Amount Borrowed Monthly repayment Monthly repayment
£100 £11.25 £7.48 £500 £56.25 £37.37
£1,000 £112.50 £74.74 £5,000 £500.00 £207.36
£10,000 £920.00 £268.19
A £11,480.60 B £11,750.00 C £15,560.40 D £12,441.60 E £12,195.25
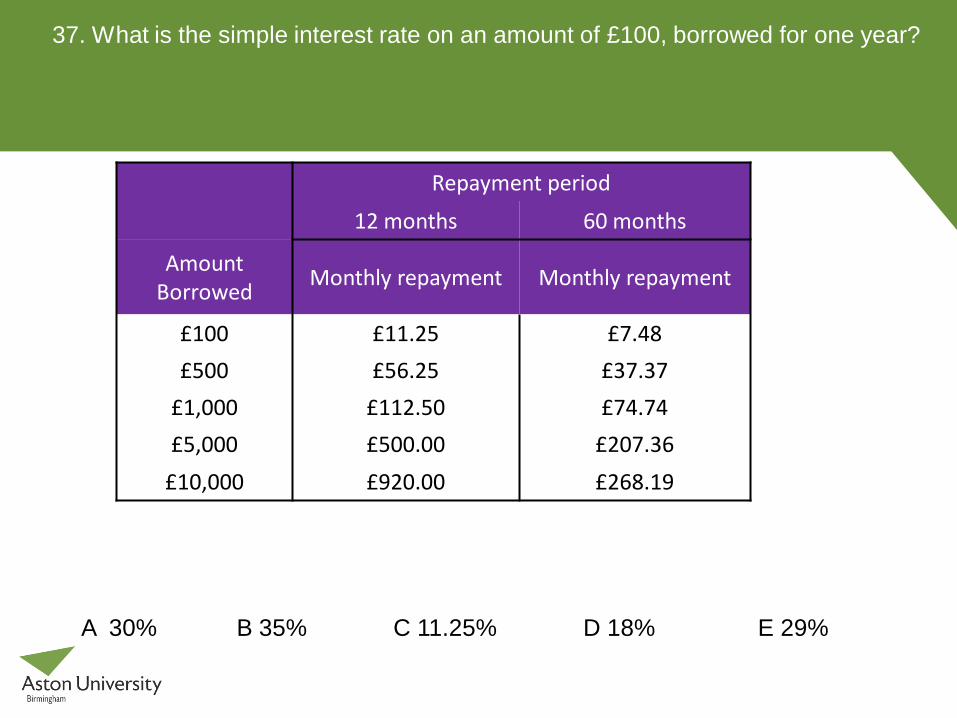
37. What is the simple interest rate on an amount of £100, borrowed for one year?
Repayment period
12 months 60 months
Amount Borrowed Monthly repayment Monthly repayment
£100 £11.25 £7.48 £500 £56.25 £37.37
£1,000 £112.50 £74.74 £5,000 £500.00 £207.36
£10,000 £920.00 £268.19
A 30% B 35% C 11.25% D 18% E 29%
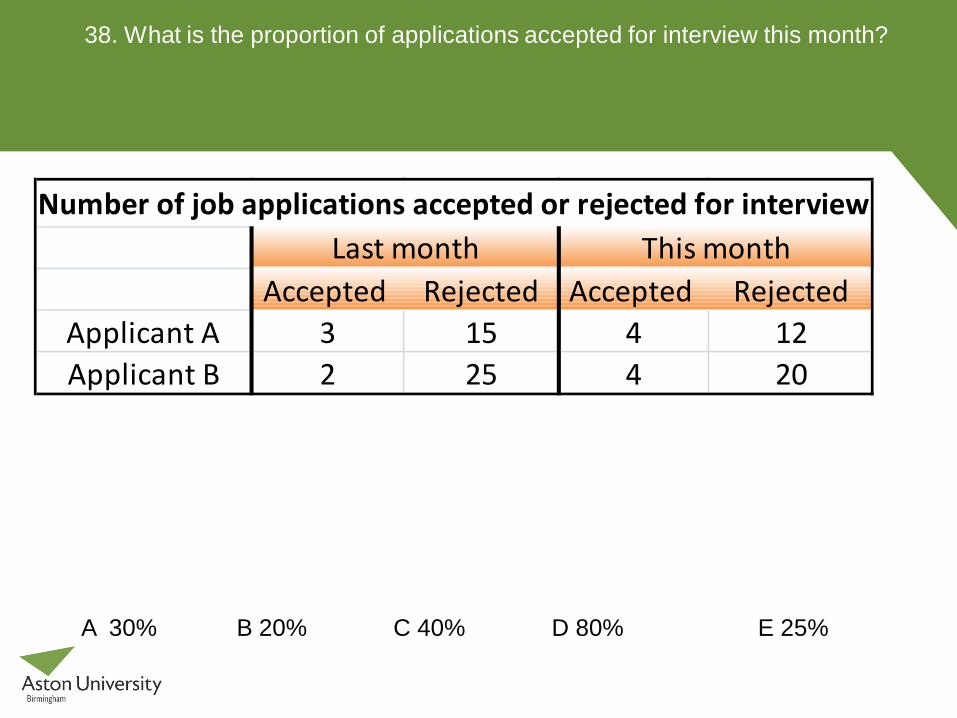
38. What is the proportion of applications accepted for interview this month?
Accepted Rejected Accepted RejectedApplicant A 3 15 4 12Applicant B 2 25 4 20
Last month This monthNumber of job applications accepted or rejected for interview
A 30% B 20% C 40% D 80% E 25%
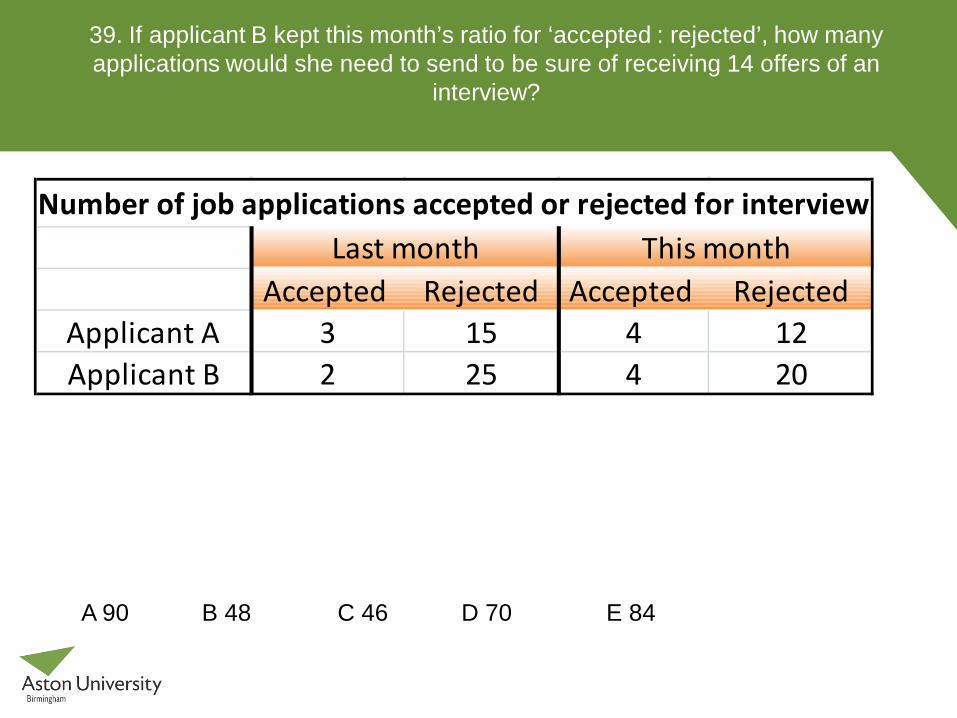
39. If applicant B kept this month’s ratio for ‘accepted : rejected’, how many applications would she need to send to be sure of receiving 14 offers of an
interview?
Accepted Rejected Accepted RejectedApplicant A 3 15 4 12Applicant B 2 25 4 20
Last month This monthNumber of job applications accepted or rejected for interview
A 90 B 48 C 46 D 70 E 84
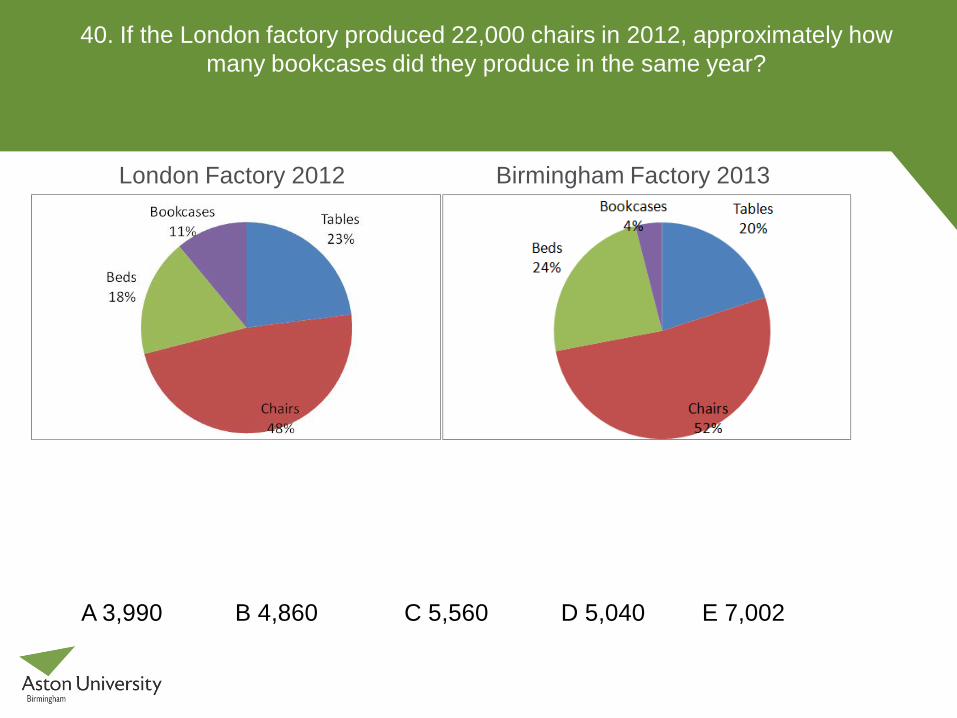
40. If the London factory produced 22,000 chairs in 2012, approximately how many bookcases did they produce in the same year?
London Factory 2012 Birmingham Factory 2013
A 3,990 B 4,860 C 5,560 D 5,040 E 7,002

41. If the London factory produced 22,000 chairs in 2012, which was 4000 less than the Birmingham factory in 2013, how many bookcases
were made in Birmingham in 2013?
London Factory 2012 Birmingham Factory 2013
A 3,000 B 4,500 C 2,000 D 5,000 E 1,500
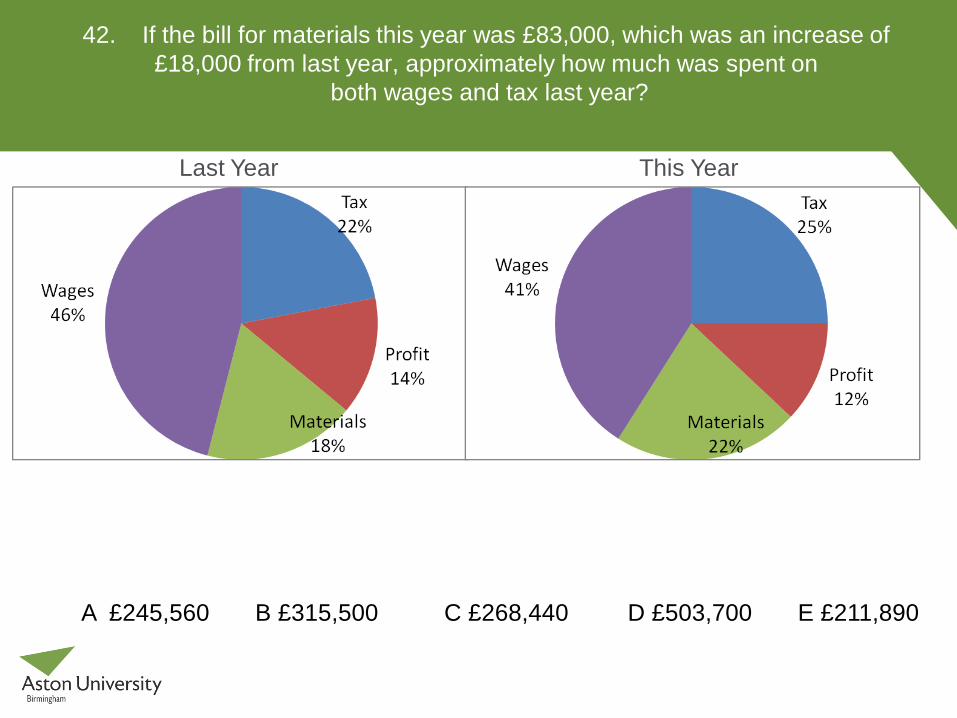
42. If the bill for materials this year was £83,000, which was an increase of £18,000 from last year, approximately how much was spent on
both wages and tax last year?
Last Year This Year
A £245,560 B £315,500 C £268,440 D £503,700 E £211,890
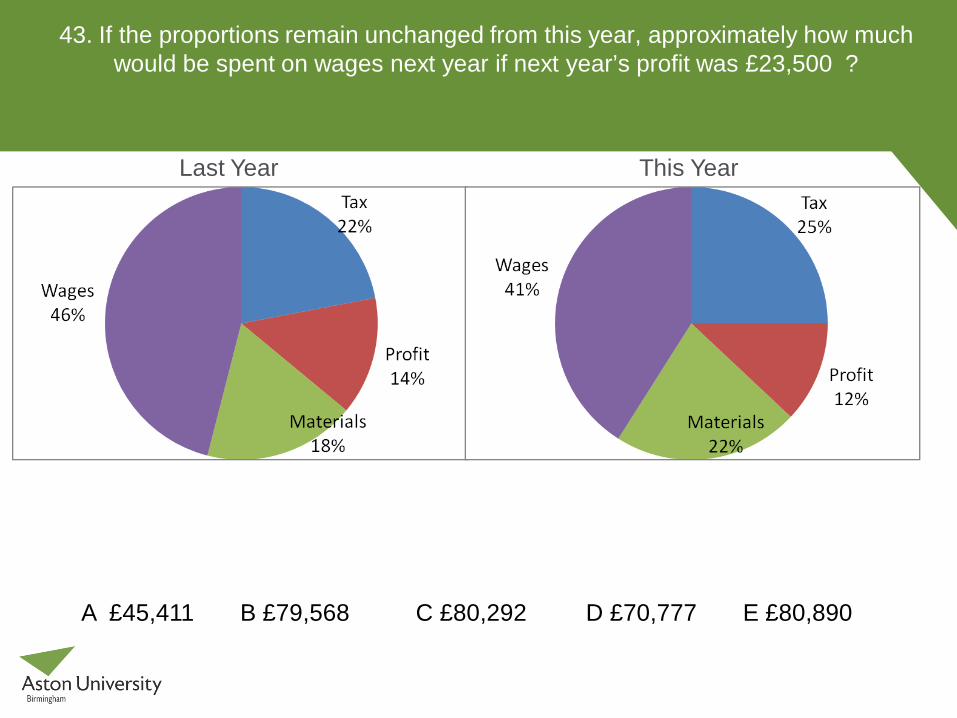
43. If the proportions remain unchanged from this year, approximately how much would be spent on wages next year if next year’s profit was £23,500 ?
Last Year This Year
A £45,411 B £79,568 C £80,292 D £70,777 E £80,890
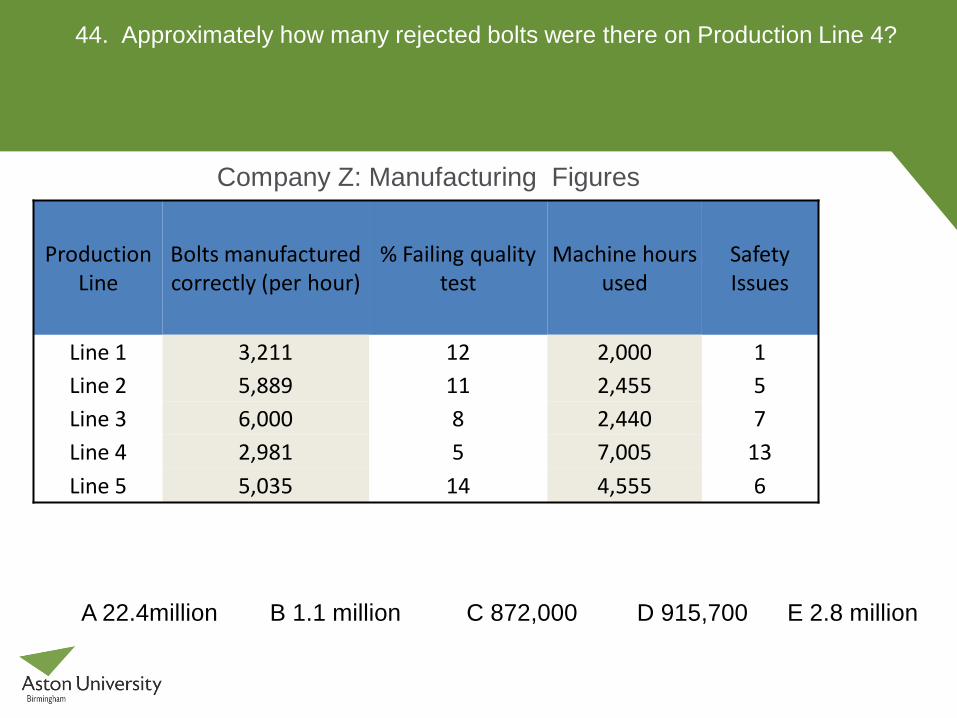
44. Approximately how many rejected bolts were there on Production Line 4?
Production Line
Bolts manufactured correctly (per hour)
% Failing quality test
Machine hours used
Safety Issues
Line 1 3,211 12 2,000 1 Line 2 5,889 11 2,455 5 Line 3 6,000 8 2,440 7 Line 4 2,981 5 7,005 13 Line 5 5,035 14 4,555 6
Company Z: Manufacturing Figures
A 22.4million B 1.1 million C 872,000 D 915,700 E 2.8 million
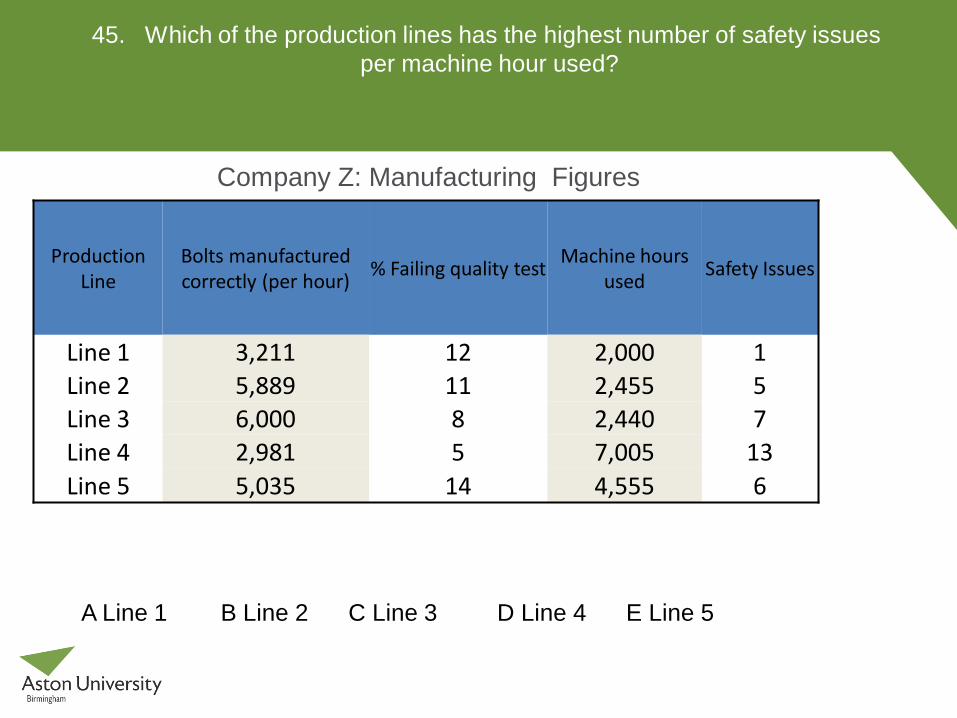
45. Which of the production lines has the highest number of safety issues per machine hour used?
Production Line
Bolts manufactured correctly (per hour) % Failing quality test Machine hours
used Safety Issues
Line 1 3,211 12 2,000 1 Line 2 5,889 11 2,455 5 Line 3 6,000 8 2,440 7 Line 4 2,981 5 7,005 13 Line 5 5,035 14 4,555 6
Company Z: Manufacturing Figures
A Line 1 B Line 2 C Line 3 D Line 4 E Line 5
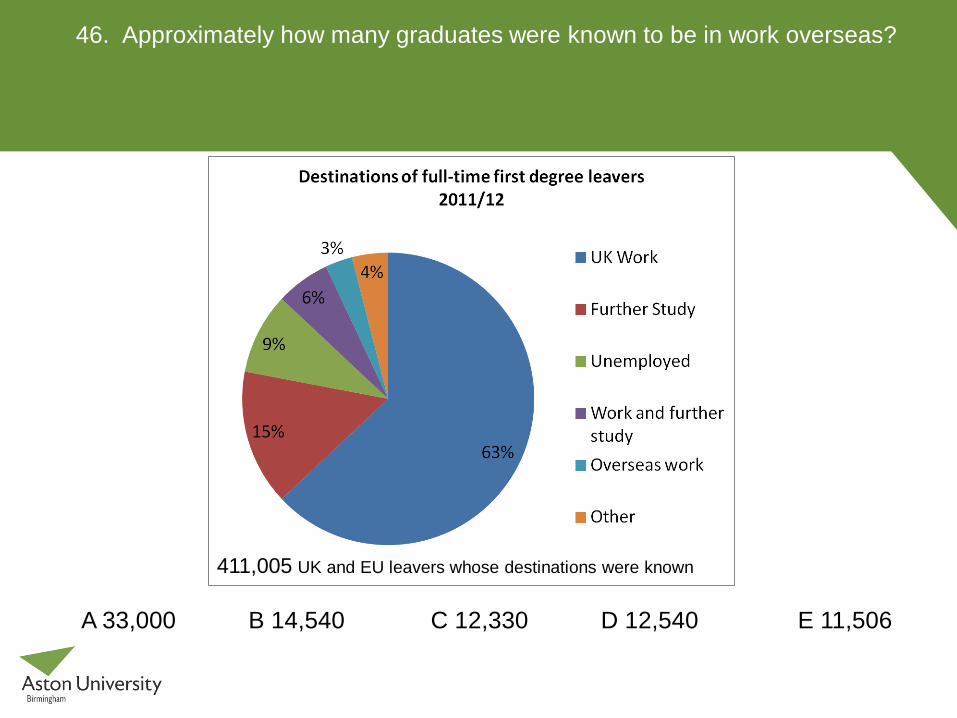
46. Approximately how many graduates were known to be in work overseas?
411,005 UK and EU leavers whose destinations were known
A 33,000 B 14,540 C 12,330 D 12,540 E 11,506
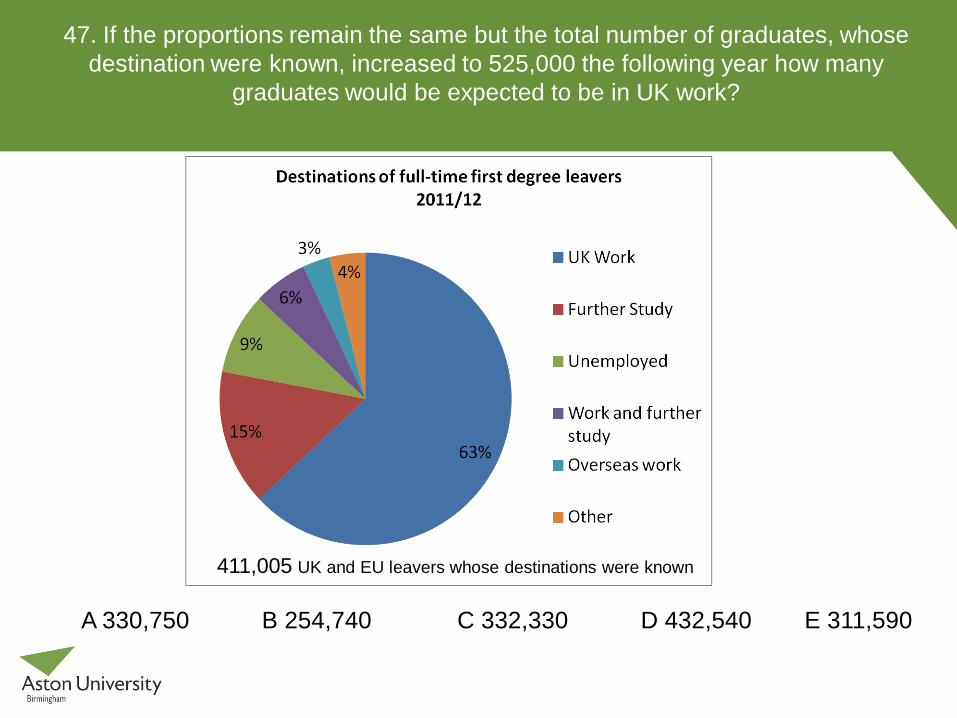
47. If the proportions remain the same but the total number of graduates, whose destination were known, increased to 525,000 the following year how many
graduates would be expected to be in UK work?
411,005 UK and EU leavers whose destinations were known
A 330,750 B 254,740 C 332,330 D 432,540 E 311,590
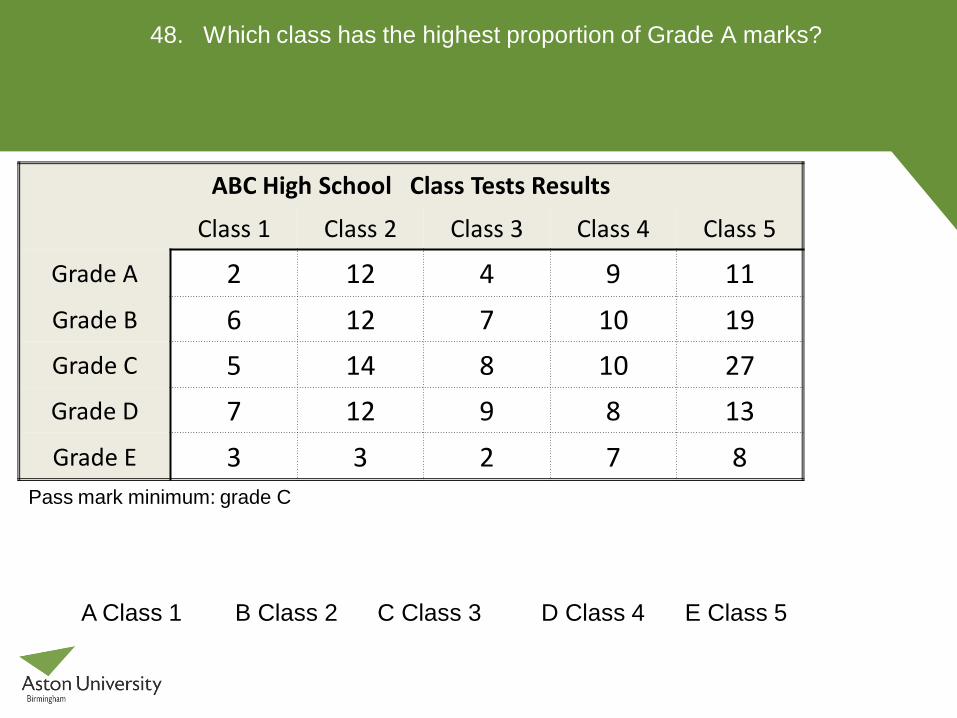
48. Which class has the highest proportion of Grade A marks?
ABC High School Class Tests Results
Class 1 Class 2 Class 3 Class 4 Class 5
Grade A 2 12 4 9 11 Grade B 6 12 7 10 19 Grade C 5 14 8 10 27 Grade D 7 12 9 8 13 Grade E 3 3 2 7 8
Pass mark minimum: grade C
A Class 1 B Class 2 C Class 3 D Class 4 E Class 5
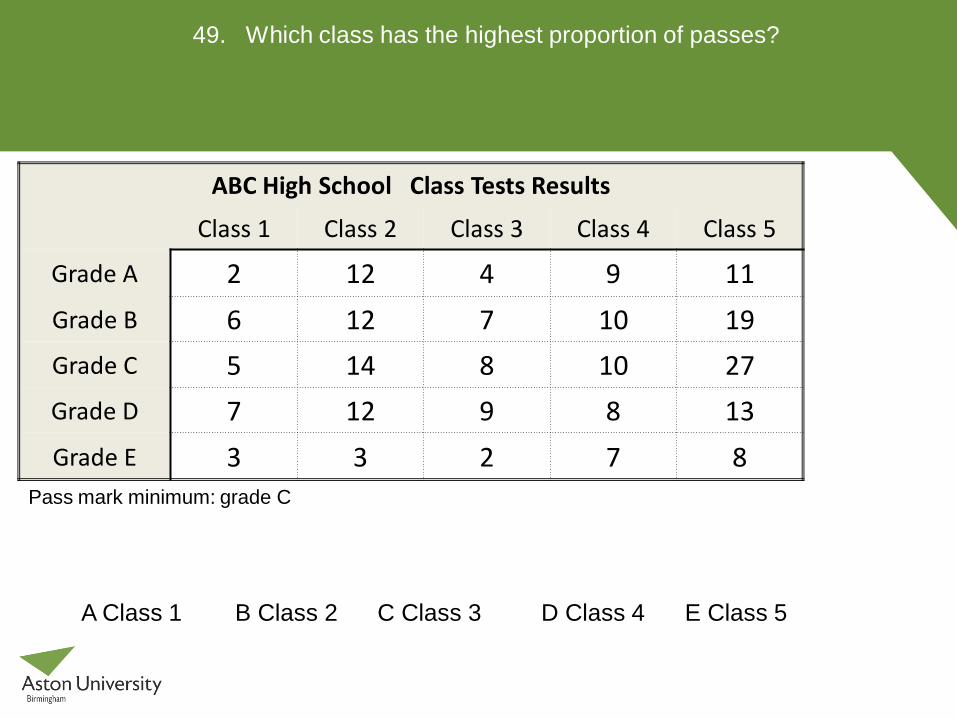
49. Which class has the highest proportion of passes?
ABC High School Class Tests Results
Class 1 Class 2 Class 3 Class 4 Class 5
Grade A 2 12 4 9 11 Grade B 6 12 7 10 19 Grade C 5 14 8 10 27 Grade D 7 12 9 8 13 Grade E 3 3 2 7 8
Pass mark minimum: grade C
A Class 1 B Class 2 C Class 3 D Class 4 E Class 5
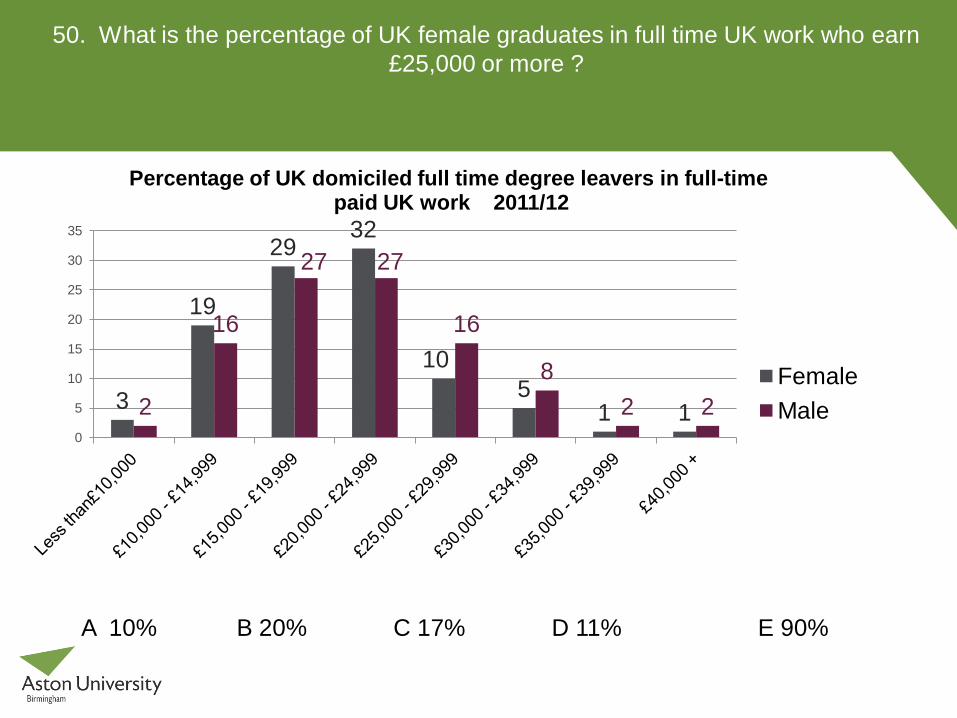
50. What is the percentage of UK female graduates in full time UK work who earn £25,000 or more ?
3
19
29 32
10 5
1 1 2
16
27 27
16
8 2 2
0
5
10
15
20
25
30
35
Percentage of UK domiciled full time degree leavers in full-time paid UK work 2011/12
Female Male
A 10% B 20% C 17% D 11% E 90%
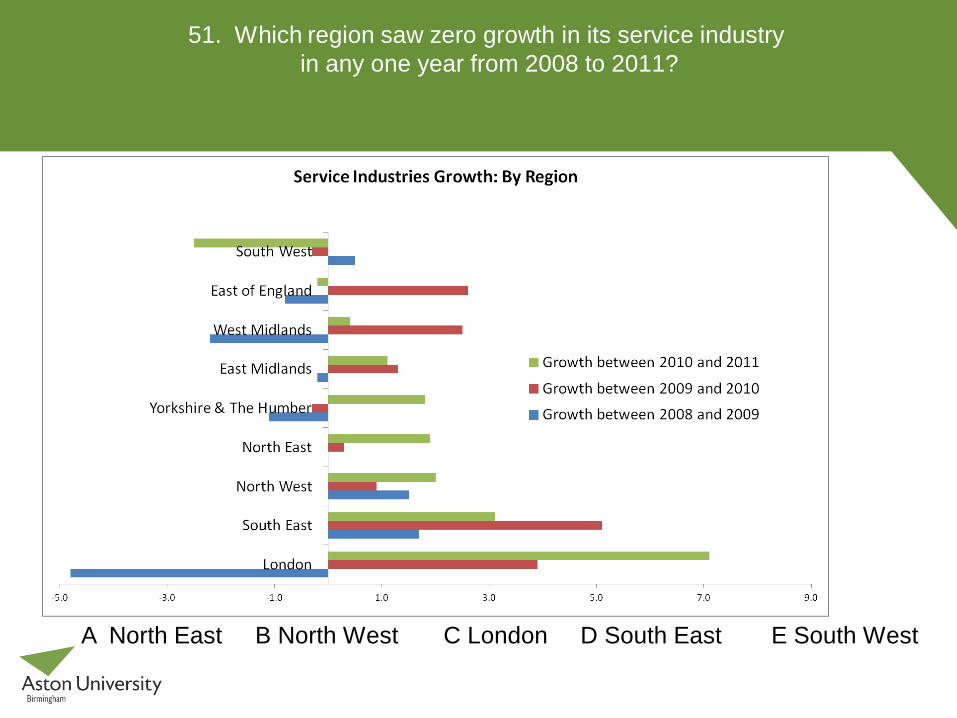
51. Which region saw zero growth in its service industry in any one year from 2008 to 2011?
A North East B North West C London D South East E South West
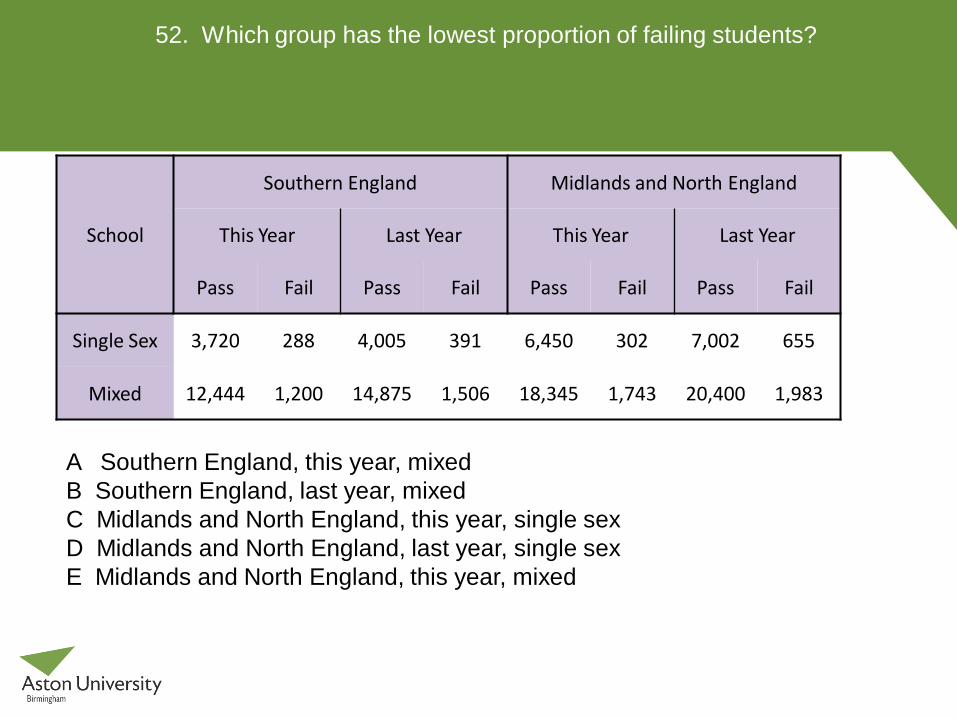
52. Which group has the lowest proportion of failing students?
School
Southern England Midlands and North England
This Year Last Year This Year Last Year
Pass Fail Pass Fail Pass Fail Pass Fail
Single Sex 3,720 288 4,005 391 6,450 302 7,002 655
Mixed 12,444 1,200 14,875 1,506 18,345 1,743 20,400 1,983
A Southern England, this year, mixed B Southern England, last year, mixed C Midlands and North England, this year, single sex D Midlands and North England, last year, single sex E Midlands and North England, this year, mixed

53. Which group had the second highest number of students?
School
Southern England Midlands and North England
This Year Last Year This Year Last Year
Pass Fail Pass Fail Pass Fail Pass Fail
Single Sex 3,720 288 4,005 391 6,450 302 7,002 655
Mixed 12,444 1,200 14,875 1,506 18,345 1,743 20,400 1,983
A Southern England, this year, mixed B Southern England, last year, mixed C Midlands and North England, this year, single sex D Midlands and North England, last year, mixed E Midlands and North England, this year, mixed
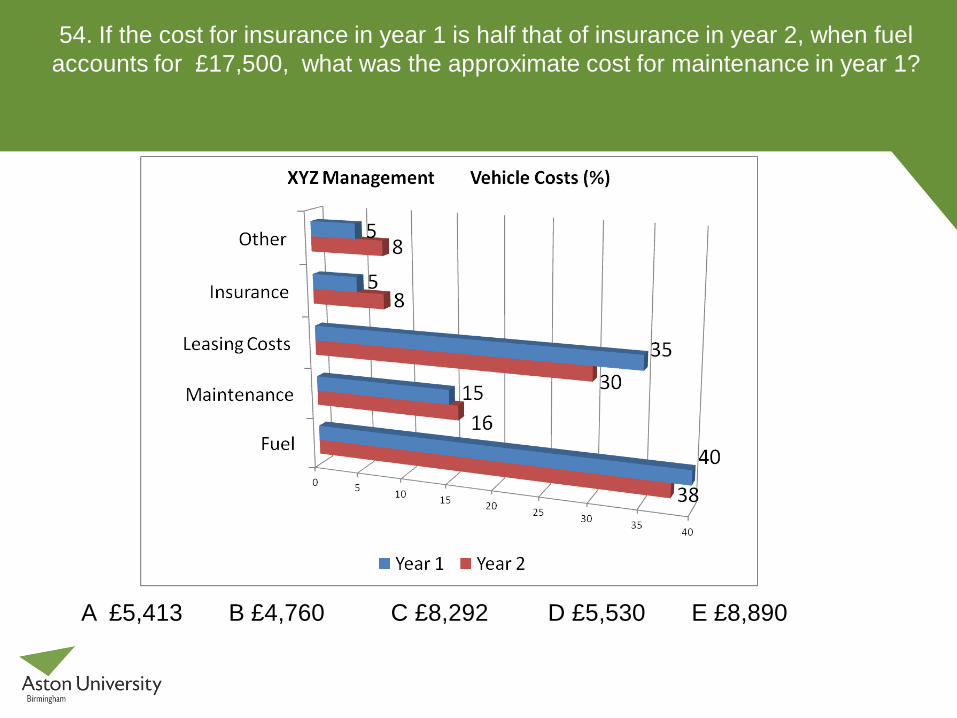
54. If the cost for insurance in year 1 is half that of insurance in year 2, when fuel accounts for £17,500, what was the approximate cost for maintenance in year 1?
A £5,413 B £4,760 C £8,292 D £5,530 E £8,890

55. Which is the most profitable site?
ABC Holdings: Financial Report (by site)
Birmingham Coventry Redditch Rugby Telford Financial Figures
(£ millions)
Sales Revenue 3.81 2.13 1.06 1.88 0.34 Operating Costs 1.44 1.09 0.59 0.84 0.11
Staffing Costs 1.21 1.02 0.12 0.45 0.1 Other Costs 0.1 0.1 0.08 0.08 0.05
Number of Staff (in hundreds) 7.35 6.22 5.1 6.04 2.32
Profit = Revenue - Costs
A Coventry B Birmingham C Redditch D Rugby E Telford
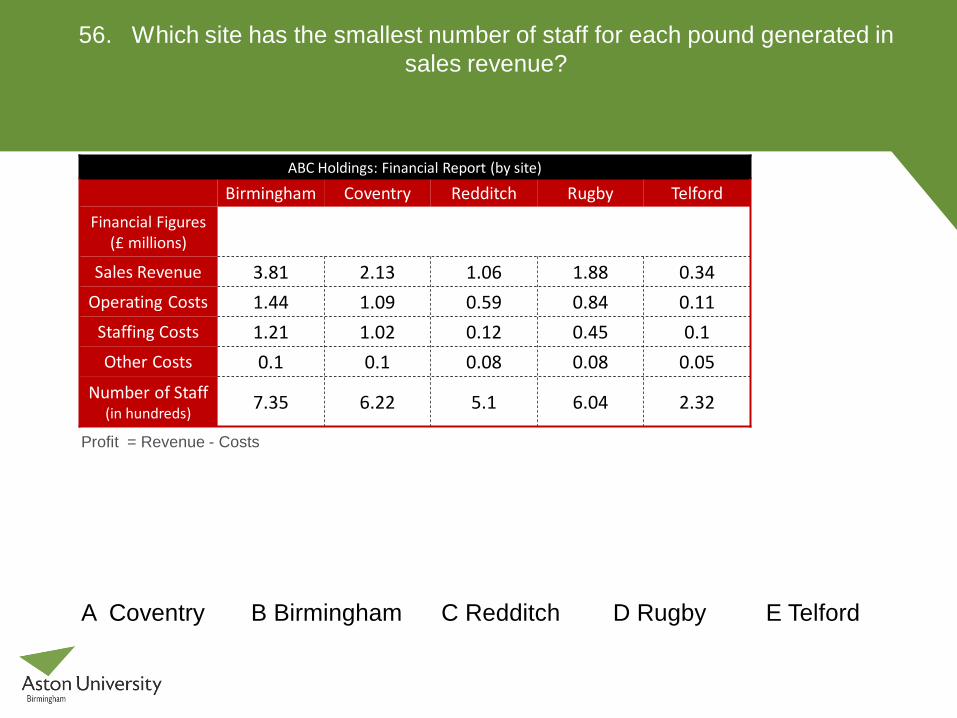
56. Which site has the smallest number of staff for each pound generated in sales revenue?
ABC Holdings: Financial Report (by site)
Birmingham Coventry Redditch Rugby Telford Financial Figures
(£ millions)
Sales Revenue 3.81 2.13 1.06 1.88 0.34 Operating Costs 1.44 1.09 0.59 0.84 0.11
Staffing Costs 1.21 1.02 0.12 0.45 0.1 Other Costs 0.1 0.1 0.08 0.08 0.05
Number of Staff (in hundreds) 7.35 6.22 5.1 6.04 2.32
Profit = Revenue - Costs
A Coventry B Birmingham C Redditch D Rugby E Telford

57. If operating costs were to increase by 30% with all other figures remaining constant which site would have the best revenue to costs ratio?
ABC Holdings: Financial Report (by site)
Birmingham Coventry Redditch Rugby Telford Financial Figures
(£ millions)
Sales Revenue 3.81 2.13 1.06 1.88 0.34 Operating Costs 1.44 1.09 0.59 0.84 0.11
Staffing Costs 1.21 1.02 0.12 0.45 0.1 Other Costs 0.1 0.1 0.08 0.08 0.05
Number of Staff (in hundreds) 7.35 6.22 5.1 6.04 2.32
Profit = Revenue - Costs
A Coventry B Birmingham C Redditch D Rugby E Telford
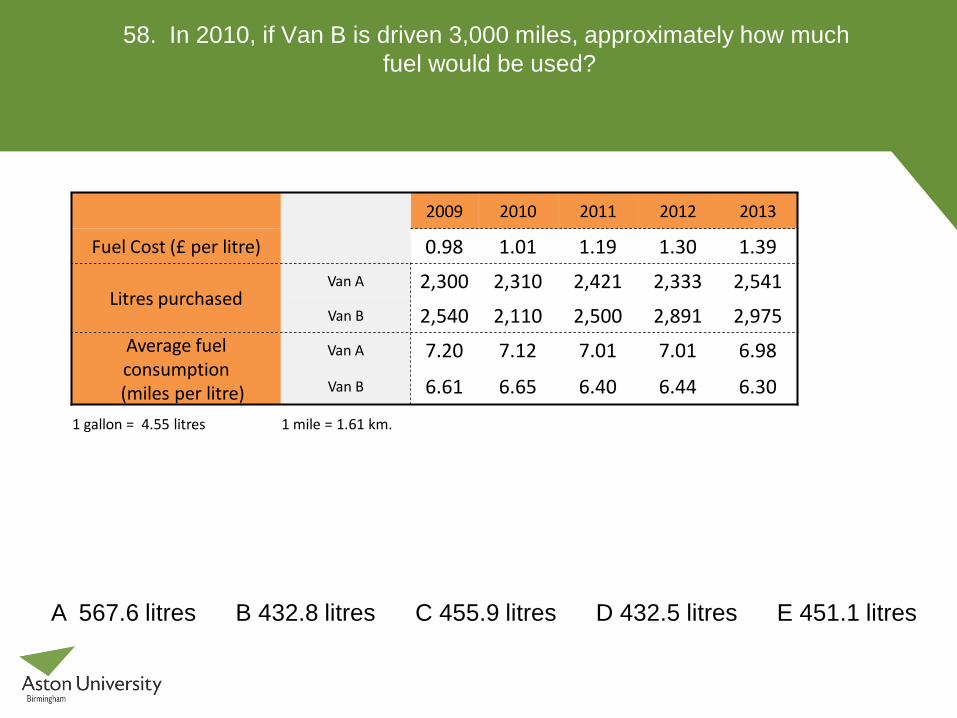
58. In 2010, if Van B is driven 3,000 miles, approximately how much fuel would be used?
2009 2010 2011 2012 2013
Fuel Cost (£ per litre) 0.98 1.01 1.19 1.30 1.39
Litres purchased Van A 2,300 2,310 2,421 2,333 2,541 Van B 2,540 2,110 2,500 2,891 2,975
Average fuel consumption
(miles per litre)
Van A 7.20 7.12 7.01 7.01 6.98
Van B 6.61 6.65 6.40 6.44 6.30
1 gallon = 4.55 litres 1 mile = 1.61 km.
A 567.6 litres B 432.8 litres C 455.9 litres D 432.5 litres E 451.1 litres
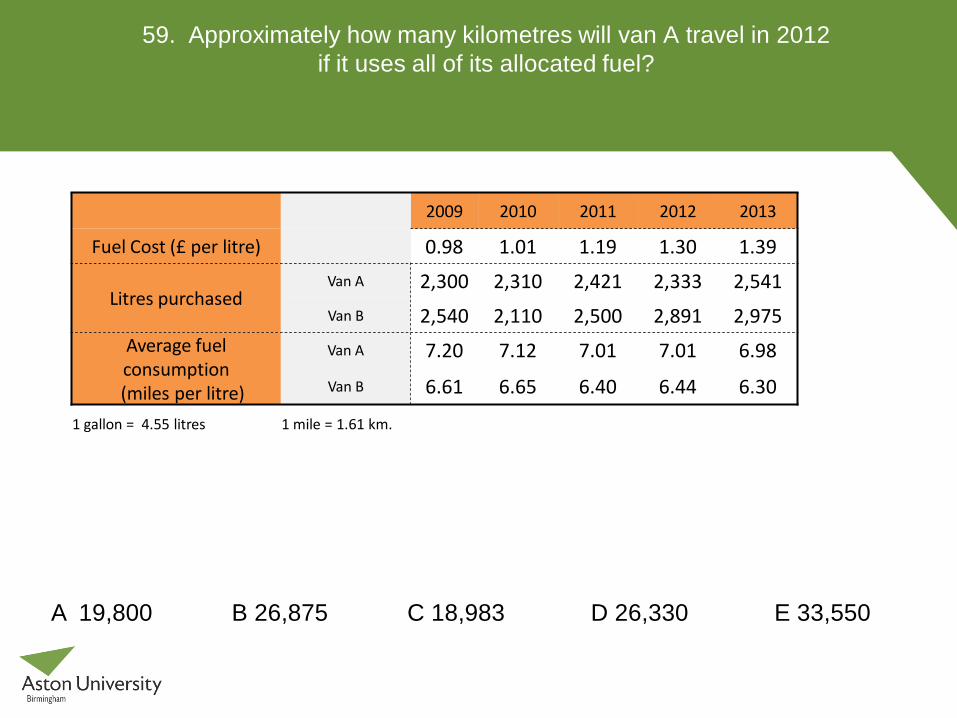
59. Approximately how many kilometres will van A travel in 2012 if it uses all of its allocated fuel?
2009 2010 2011 2012 2013
Fuel Cost (£ per litre) 0.98 1.01 1.19 1.30 1.39
Litres purchased Van A 2,300 2,310 2,421 2,333 2,541 Van B 2,540 2,110 2,500 2,891 2,975
Average fuel consumption
(miles per litre)
Van A 7.20 7.12 7.01 7.01 6.98
Van B 6.61 6.65 6.40 6.44 6.30
1 gallon = 4.55 litres 1 mile = 1.61 km.
A 19,800 B 26,875 C 18,983 D 26,330 E 33,550
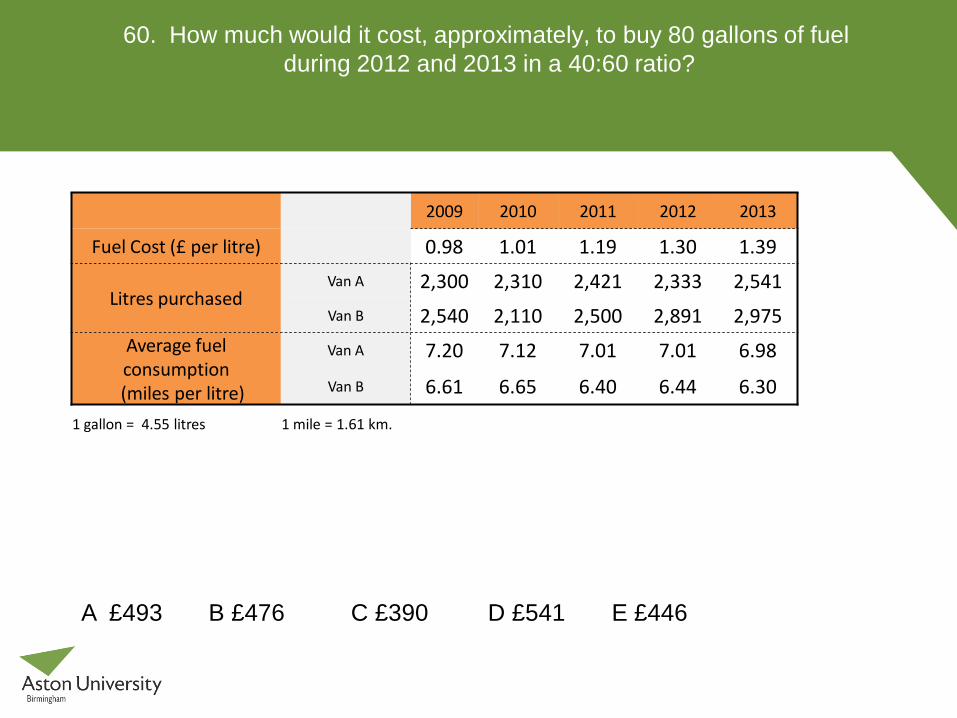
60. How much would it cost, approximately, to buy 80 gallons of fuel during 2012 and 2013 in a 40:60 ratio?
2009 2010 2011 2012 2013
Fuel Cost (£ per litre) 0.98 1.01 1.19 1.30 1.39
Litres purchased Van A 2,300 2,310 2,421 2,333 2,541 Van B 2,540 2,110 2,500 2,891 2,975
Average fuel consumption
(miles per litre)
Van A 7.20 7.12 7.01 7.01 6.98
Van B 6.61 6.65 6.40 6.44 6.30
1 gallon = 4.55 litres 1 mile = 1.61 km.
A £493 B £476 C £390 D £541 E £446
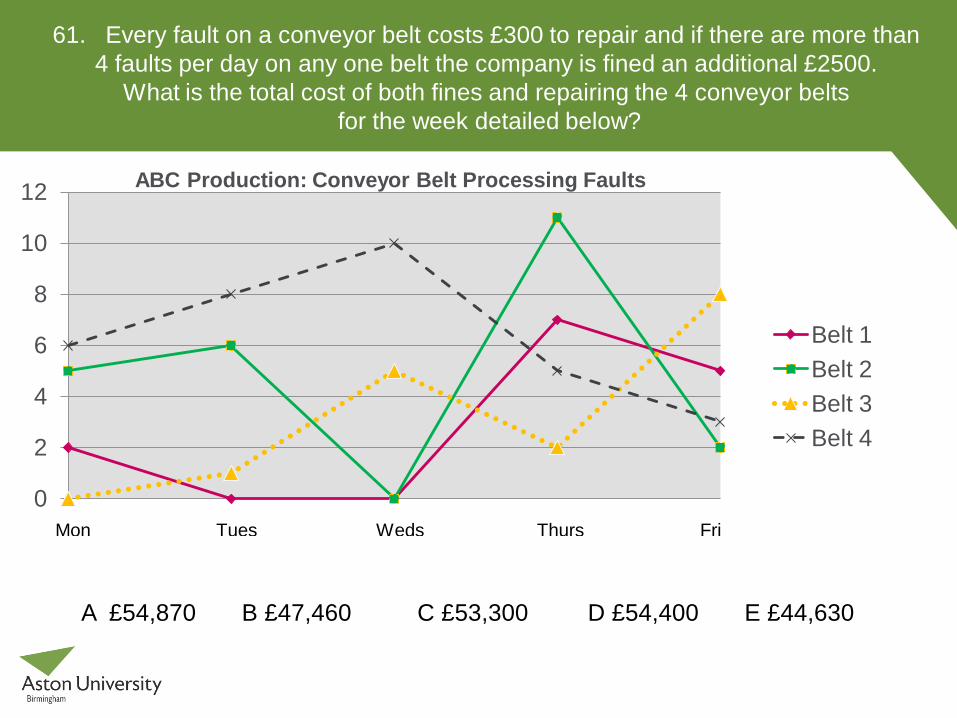
61. Every fault on a conveyor belt costs £300 to repair and if there are more than 4 faults per day on any one belt the company is fined an additional £2500.
What is the total cost of both fines and repairing the 4 conveyor belts for the week detailed below?
0
2
4
6
8
10
12 ABC Production: Conveyor Belt Processing Faults
Belt 1 Belt 2 Belt 3 Belt 4
Mon Tues Weds Thurs Fri
A £54,870 B £47,460 C £53,300 D £54,400 E £44,630

62. Which of the four conveyor belts will cost ABC Production the most money this week?
0
2
4
6
8
10
12 ABC Production: Conveyor Belt Processing Faults
Belt 1 Belt 2 Belt 3 Belt 4
Mon Tues Weds Thurs Fri
A Belt 1 B Belt 2 C Belt 3 D Belt 4 E Cannot say
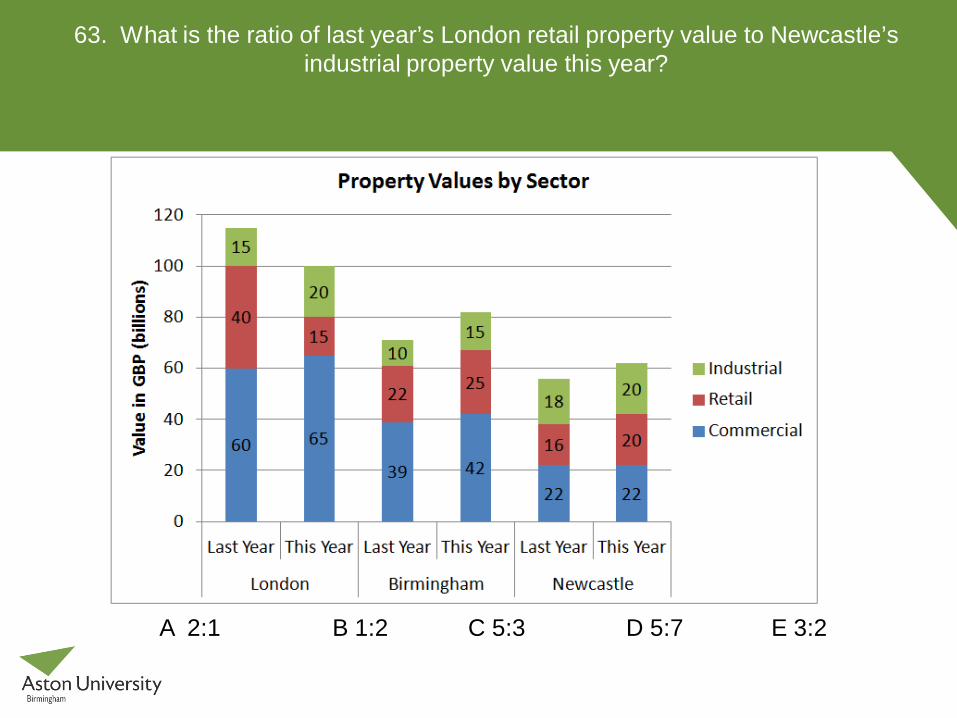
63. What is the ratio of last year’s London retail property value to Newcastle’s industrial property value this year?
A 2:1 B 1:2 C 5:3 D 5:7 E 3:2
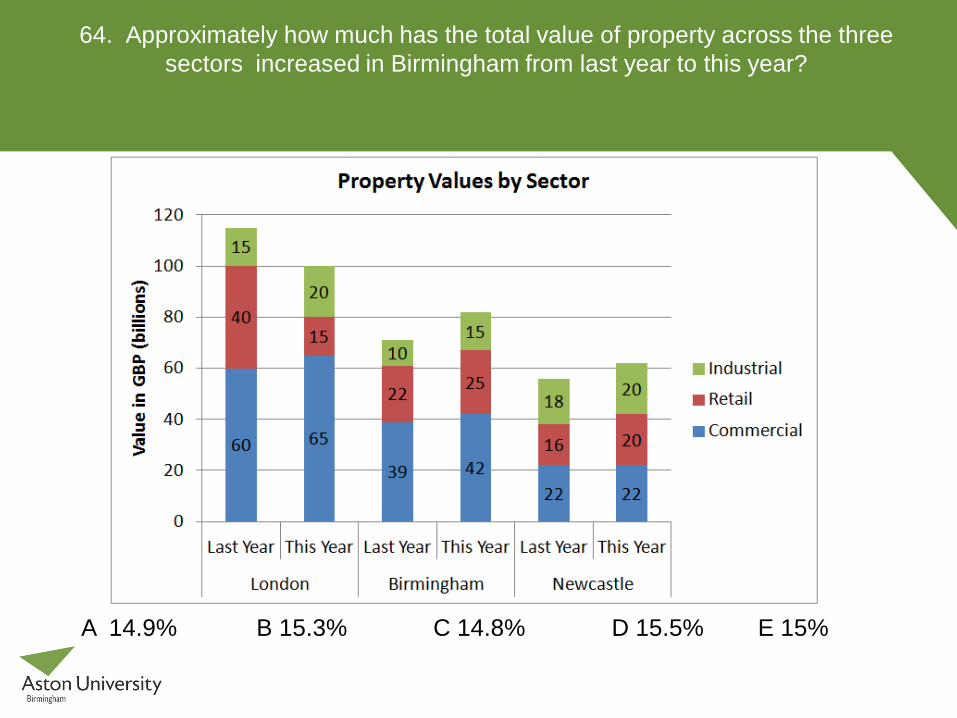
64. Approximately how much has the total value of property across the three sectors increased in Birmingham from last year to this year?
A 14.9% B 15.3% C 14.8% D 15.5% E 15%
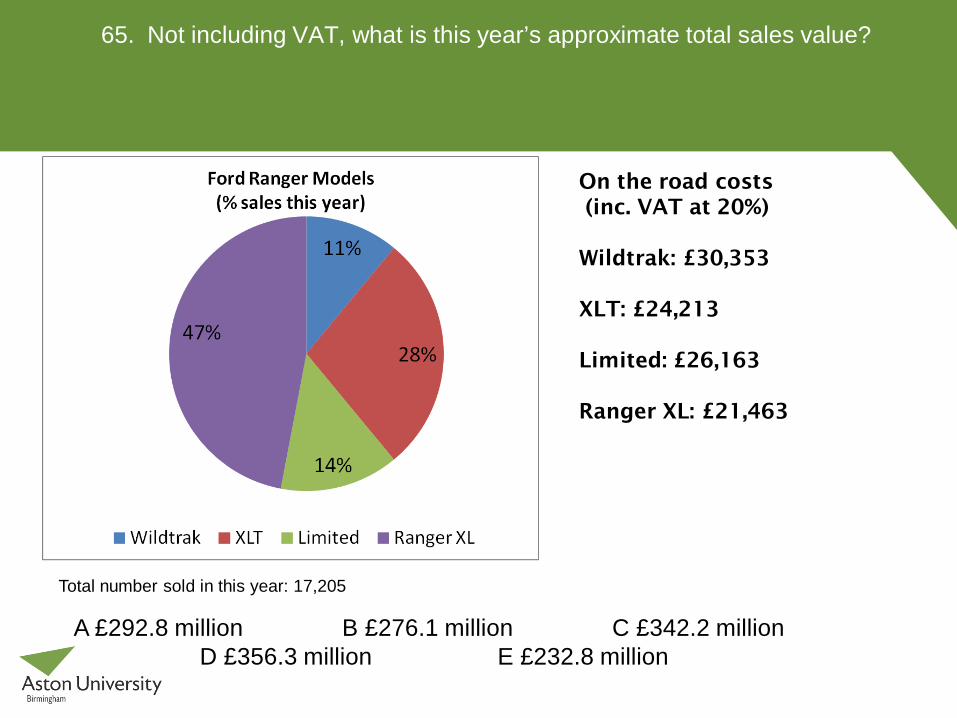
65. Not including VAT, what is this year’s approximate total sales value?
On the road costs (inc. VAT at 20%) Wildtrak: £30,353 XLT: £24,213 Limited: £26,163 Ranger XL: £21,463
Total number sold in this year: 17,205
A £292.8 million B £276.1 million C £342.2 million D £356.3 million E £232.8 million
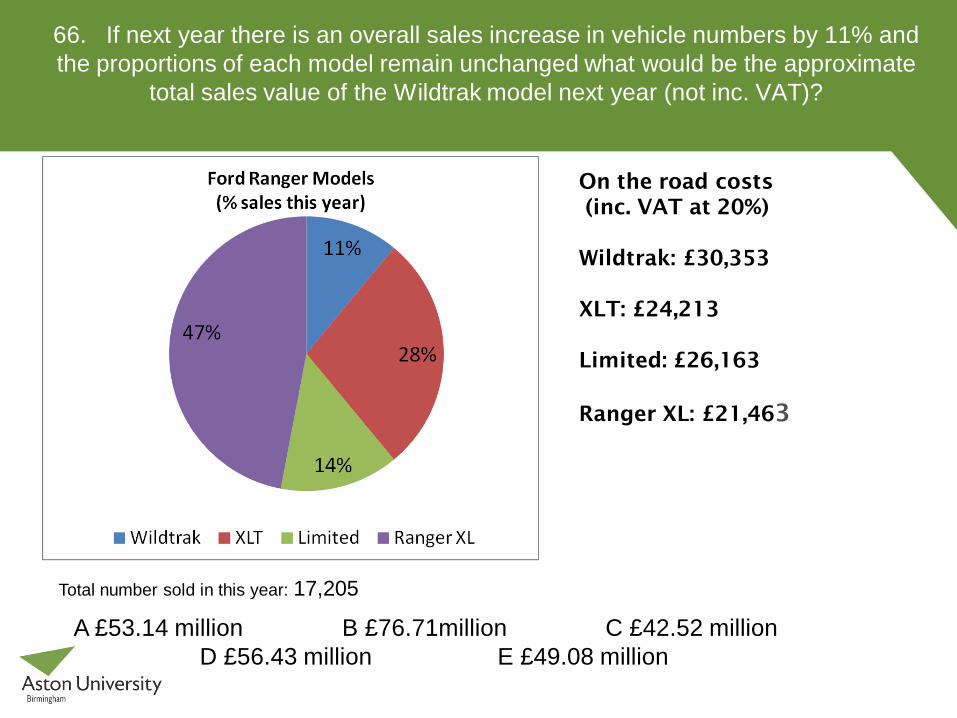
66. If next year there is an overall sales increase in vehicle numbers by 11% and the proportions of each model remain unchanged what would be the approximate
total sales value of the Wildtrak model next year (not inc. VAT)?
On the road costs (inc. VAT at 20%) Wildtrak: £30,353 XLT: £24,213 Limited: £26,163 Ranger XL: £21,463
Total number sold in this year: 17,205
A £53.14 million B £76.71million C £42.52 million D £56.43 million E £49.08 million

Don’t forget you can pop into the maths drop-in
(first floor library building) with any maths queries.


![EPro Commercial - GRAF Plastics Australia · GRAF EPro Commercial Systems Max Flow [litres] EP Total no. of tanks* (without Tertiary) Primary [litres] Secondary [litres] Tertiary](https://img.pdfslide.us/doc/110x75/5f1dcd155dc93c43ad519759/epro-commercial-graf-plastics-australia-graf-epro-commercial-systems-max-flow.jpg)