Embed Size (px)
Citation preview
Numerical Prediction of Microbubble Attachment in Biological Flows
Joshua Gosney and Jeffrey J. Heys
Chemical and Biological Engineering
Montana State University-Bozeman
Bozeman, MT 59717
Abstract
Biofilm infections pose a major threat to human health and are difficult to detect. Microbubbles provide
an effective and inexpensive method of detection for biofilm-based infections and other diseases such as
cancer. The approach studied here examines the potential of targeted microbubbles, with specific
antibodies covalently linked to their surfaces for use as ultrasound contrast agents and drug delivery
vehicle. This work presents a novel numerical model for estimating the forces on microbubble conjugates
in the vascular system. A full computational fluid dynamics simulation of biological fluid flow and the
resulting forces on attached microbubbles is presented as well as comparisons with simplified analytical
models. Both the computational and analytical predictions are compared with experimental
measurements from Takalkar et al. and Schmidt et al., and these comparisons indicate stable microbubble
attachment can be anticipated when the total hydrodynamic force on the microbubble is less than 100 pN.
Through the examination of typical biological flows, microbubble attachment can be expected up to an
average fluid velocity of 0.025𝑐𝑚
𝑠 near the microbubble (i.e., a particle Reynolds numbers on the order of
.001). The Stokes drag law was shown to predict the drag force (the dominant force) on the microbubble
within an order of magnitude of the force predicted by the numerical model. Finally, it was found that the
lift force on a microbubble was small relative to the drag force, and that the Saffman equation prediction
differed from the numerical model by more than an order of magnitude for the biological flows examined.
Keywords: microbubble attachment, ultrasound contrast agent, hydrodynamic force, computational fluid
dynamics
Introduction The NIH estimates that 80% of all microbial infections are biofilms1, which pose a significant
threat to human health. The additional expenditures caused by biofilm infections are estimated to be $0.3-
$2.3 billion a year2, 3. The current method for determining the presence of a biofilm-based infection on a
medical device or tissue is via microscopy through the use of a scanning electron or optical microscope.
While highly accurate, this method of detection is very invasive, usually requiring the removal and
destruction of an implanted device or tissue. In a study done by Passerini4, 81% of indwelling catheters
showed evidence of a biofilm on the surface of the device, but a site swab taken at the dermal entry point
only detected bacteria 6% of the time. A potential alternative approach, recently demonstrated through an
in vitro experiment5, utilizes targeted microbubbles as a contrast agent for detecting and imaging biofilm
infections. The microbubbles bind to the biofilm due to antibodies that are bound to their surface, and the
microbubbles are imaged using ultrasound due to the density difference between biological fluids and the
gas filled microbubbles. The potential advantages of this system for the detection of biofilm infections
include lower costs, avoiding invasive medical device removal, and the potential for earlier biofilm
detection.
These same microbubbles targeted at the biofilm could also potentially be used as a treatment
delivery platform. Experiments conducted in vivo have shown that microbubble destruction via sonication
is an effective delivery method for the delivery of engineered red blood cells and microsphere gene and
drug therapy agents. Targeted drug delivery to a location adjacent to the targeted tissue is often sufficient
because the treatments are often capable of diffusing to the target cells and tissues6, 7.
Conjugated microbubbles were first developed in the 1990's and have provided a new avenue for
medical imaging that has not been available in the past8-11. The combination of ultrasound imaging
techniques and targeted microbubbles is becoming more effective than ever before at detecting diseases
that express a target that the microbubbles can bind8, 9. Persistent microbial infections, carcinomas,
autoimmune disorders and amyloid plaques have proven to be difficult to detect and treat due to the
toxicity and limited effectiveness of most current allopathic treatments12. A wide range of antibodies are
commercially available that can be covalently linked to microbubbles and injected into the bloodstream to
detect relevant disease targets and deliver therapeutic agents. For example, it has previously been shown
that amyloid plaques could be targeted using biotinylated microbubbles9, squamous cell carcinomas can
be targeted with Bleomycin microbubbles7, and microbubbles can be targeted to the regulatory receptors
that cause Crohn’s disease13. Targeted microbubbles have also been experimentally tested in a flow
chamber with results indicating that microbubbles have a predictable, target specific attachment
frequency that is a function of the flow rate13-15. These experiments showed that microbubble adhesions
could be obtained below a certain flow rate.
Contrast agent implementations have been researched for the detection and treatment of
carcinomas and atherosclerotic plaque, but little research has been conducted on the detection of biofilm
infections using microbubbles10, 16-20. Experiments have shown that microbubbles will bind specifically to
S. aureus in a closed system, but no estimates have been made about the behavior and attachment
potential for microbubbles under common biological flow conditions.
There are two primary objectives for this work. The first objective is to develop a FEM model that
estimates the hydrodynamic forces that a microbubble is exposed and validate the model by comparing its
prediction of microbubble attachment to targets with experimental measurements of microbubble
adhesion under specific, controlled flow conditions. The second objective is to extend the validated FEM
model to examine the potential for microbubble attachment under various biological flow conditions.
Finally, the force obtained from the FEM-based numerical model are compared to simple analytical
approximations of the force for isolated spheres in idealized fluid flow conditions. The environment of a
microbubble in the body is somewhat different from where the analytical expressions are expect to be
valid, but the FEM model is used to assess the potential accuracy of the simple, analytical approximation
of the force for typical biological flows.
Methods For Bovine Serum Albumin (BSA) shelled microbubbles, which are a commonly used type of
microbubbles, the average shear modulus for the shell has been estimated to be in the range of 6.6 𝑀𝑃𝑎
to 16.9 𝑀𝑃𝑎, depending on the microbubble diameter21. Based on this estimate and stress-strain
calculations for a spherical shell, the microbubbles were assumed to be spherical and rigid for the flow
conditions and forces of interest within this paper. The fluids were assumed to be incompressible,
Newtonian fluids.
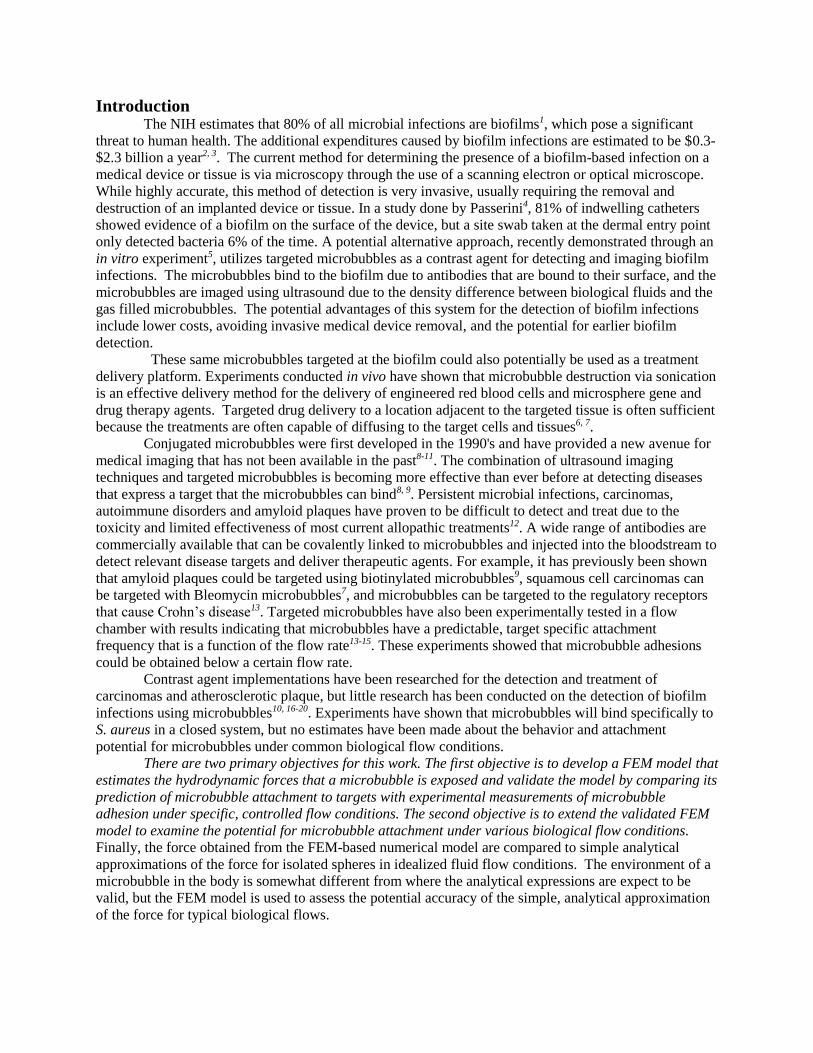
For the geometries and flows of interest
here, the microbubbles are assumed to be attached
to a surface, and the primary direction of flow is
parallel to that surface. Under these conditions,
only two components of the three-dimensional force
vector were non-negligible: one component is
parallel to the direction of flow (the drag force,
Figure 1) and the other is perpendicular to the
direction of flow and normal to the attached surface
(the lift force). The buoyancy force was neglected
as it is at least two orders of magnitude less than the
other forces for normal microbubble sizes and under
typical biological flow conditions of interest.
Numerical Model
The main objective of this research is to develop a numerical model that estimates the force on a
microbubble under various biological flow conditions and compare these estimates to the analytical
model. The numerical studies were conducted using the finite element method to approximately solve the
Navier-Stokes equations for incompressible flow22:
(1) −∇𝑝 + ∇ · 𝜇[(∇𝑢 + ∇𝑢𝑇)] = 𝜌(𝑢 · ∇𝑢 + 𝜕𝑢
𝜕𝑡)
(2) ∇ · 𝑢 = 0
where 𝑢 is the velocity vector, 𝜇 is the viscosity, 𝑝 is the pressure, and 𝜌 is the density of the fluid.
The finite element method was used for the spatial discretization of the Navier-Stokes equations,
and the mesh resolutions were varied from 88,762 – 325,000 mixed finite elements (Taylor-Hood
tetrahedral elements). Grid continuation studies indicated that the forces on a sphere attached to the wall
could be considered relatively (less than 2% change in the drag force with refinement) grid independent
for these mesh resolutions as long as the microbubble had at least 3300 elements on its surface (i.e., the
mesh had to be sufficiently refined near the microbubble). As the number of elements increased, the
microbubble geometry was captured more accurately, and the grid continuation studies showed that the
number of elements on the boundary of the microbubble was the most important factor in determining the
numerical model accuracy.
Blood was assumed to be a Newtonian fluid with a density of 1040 kg/m3 and a constant viscosity
of 3.5𝑥10−3kg/m/s. In the comparisons with previous experimental results, the fluid in the model had the
physical properties of PBS (Phosphate Buffered Saline) with a constant viscosity of 1.05𝑥10−3kg/m/s.
The forces on the microbubble were calculated by taking an approximate integral over the surface of the
microbubble.
Two computational geometries were used in this study. A parallel plate flow channel geometry is
used for comparison to previously published experimental results, and the dimensions of the model
domain match the flow channel used in the experiments14, 15. In addition, representative blood vessels
including capillaries, veins and arteries were modeled using a straight, cylindrical geometry (Table 1).
The length of the blood vessel sections used in the model ranged from 10 microns (capillaries) to 3 cm
(vein) with internal diameters ranging from 10 microns (capillaries) to 1 mm (vein). Thus, even the
Figure 1:. A microbubble attached to the surface and the
forces of interest are shown in a linear flow field (not to
scale).
smallest diameter cylinders were larger than the typical microbubble diameter, which vary from 3.5 to 6
microns.
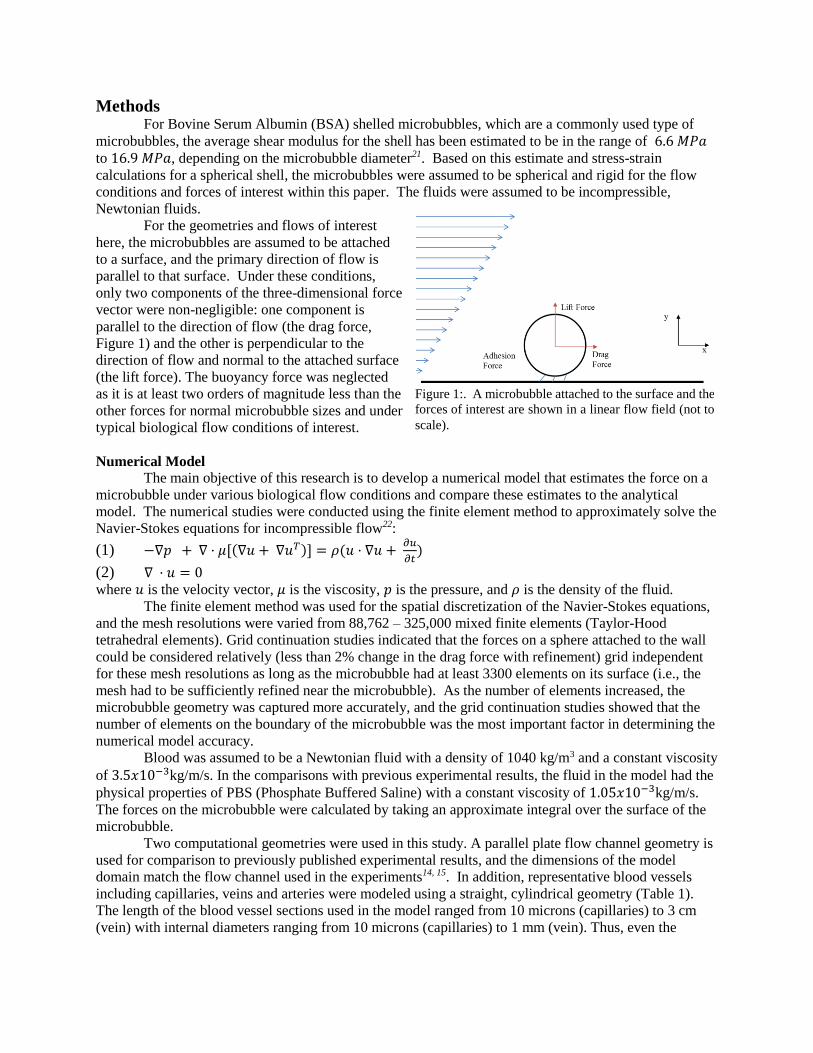
Table 1: Description of numerically assessed geometries and their flow rates.
Geometry Dimensions Average inflow velocity
Particle Reynolds number
Domain/
microbubble
size ratio
Parallel Plate (Schmidt) 0.6 mm x 8mm 𝑉𝑎𝑣𝑔 = 0.2𝑐𝑚
𝑠 𝑡𝑜 1.5
𝑐𝑚
𝑠
𝑅𝑒𝑝 = 0.00017 𝑡𝑜 0.0013
215
Parallel Plate
(Takalkar)
0.25mm x 3.5mm 𝑉𝑎𝑣𝑔 = 0.0806𝑐𝑚
𝑠 𝑡𝑜 0.4
𝑐𝑚
𝑠
𝑅𝑒𝑝 = 0.0001 𝑡𝑜 0.0008
145
Capillary Diameter = 10 µ𝑚 𝑉𝑝𝑒𝑎𝑘 = 0.0001 𝑐𝑚
𝑠 𝑡𝑜 0.03
𝑐𝑚
𝑠
𝑅𝑒𝑝 = 1 ⋅ 10−6 𝑡𝑜 1.8 ⋅ 10−4
3
Venule Diameter = 100 µ𝑚 𝑉𝑝𝑒𝑎𝑘 = 0.1 𝑐𝑚
𝑠 𝑡𝑜 0.3
𝑐𝑚
𝑠
𝑅𝑒𝑝 = 2.7 ⋅ 10−4 𝑡𝑜 8.4 ⋅ 10−4
36
Vein Diameter = 1 𝑚𝑚 𝑉𝑝𝑒𝑎𝑘 = 1𝑐𝑚
𝑠 𝑡𝑜 5
𝑐𝑚
𝑠
𝑅𝑒𝑝 = 1.5 ⋅ 10−4 𝑡𝑜 7.3 ⋅ 10−4
360
Large ranges of length scales were present in some problems where the ratio of the fluid domain
size to microbubble diameter exceed 100. In these cases, it was impossible to generate a finite element
mesh that was both computational feasible (i.e., did not require billions of elements) and did not contain
invalid elements with negative Jacobians or extremely high aspect ratios. For these problems with a large
range of length scales (i.e., for all problems where the total domain size to microbubble diameter ratio is
greater than 100), a multi-scale modeling technique is employed to separate the larger length scales from
the smaller length scales near the microbubble. When this technique is used, the larger fluid domain is
modeled first without the microbubble explicitly included in the large length scale problem because it is
significantly smaller than the individual elements. Then, after the larger length scale flow problem has
been solved, the solution from the large scale problem is used to obtaining boundary conditions for the
microbubble scale model, which only includes the fluid near the microbubble (i.e., the fluid within
approximately 20 microbubble diameters of the center of the microbubble).
The boundary conditions for the parallel plate geometries are given in the experimental
comparison section below. The capillary and venule simulations employed a range of flow rates (see
Table 1), and boundary conditions were set based on a Pouiseulle flow profile. Early simulations of flow
in the larger blood vessels (vein) included the effects of wall elasticity and displacement on both the
velocity gradients near the wall and the forces on the microbubble. These early results showed that the
largest forces would be generated with a rigid wall, consistent the observations of others23, so all results
shown below are based on the most difficult conditions for microbubble attachment: the rigid wall vessel.
Experimental Comparisons
The experimental measurements by others that are used here for numerical model validation were
assumed to be at steady state with a fully developed flow profile. The fluid shear stress near the wall in
the experimental channel can be calculated through the equation14:
(3) 𝑄 = 𝜏ℎ2𝑤
6µ
where 𝜏 is the wall shear stress, ℎ is the channel height, and 𝑤 is the channel width. The velocity in the
mathematical model was set so that the wall shear stress matched the experimental wall shear stress
values of 0.02, 0.05, 0.1 and 0.15 Pa14. The shear stresses for the second set of experiments by Takalkar et
al. were 0.02, 0.03, 0.06, 0.1 and 0.17 Pa15. The channel height, ℎ, was 0.6 and 0.254 mm for the Schmidt
et al. and Takalkar et al. experiments, respectively, and since the channel width in both experiments was
at least an order of magnitude greater than the height, a 2-dimensional model was used for the macro-
scale fluid model. (A full 3-dimensional model was used for the micro-scale model of flow around the
microbubble.) The boundary conditions used to simulate the experiments (i.e., the boundary conditions
for the macro-scale model) include:
no-slip (𝑢 = 0) at the upper and lower walls,
the normal stress in the normal direction is zero at the outlet, and
tangential velocity of zero at the inlet and outlet.
For the micro-scale model, the solution from the macro-scale model was used to specify the velocity
boundary conditions. The adhesion forces between the microbubbles and surfaces containing the targets
were estimated based on previous Atomic Force Microscope (AFM) measurements and are used as a
basis for comparisons between experiments and model predictions24.
Analytical Model The drag force on a sphere in an infinite, uniform, creeping flow can be approximated by the
well-known Stokes drag law equation:
(4) 𝐹𝐷 = 6𝜋𝑎𝜇𝑉
where 𝑎 is the radius of the microbubble, 𝑉is the characteristic velocity around the outer perimeter of the
microbubble’s surface, and 𝜇 is the viscosity. The Stokes drag law assumptions include low Reynolds
number flow (Re < 10), no particle-particle interactions, and an infinite body of fluid around the spherical
particle. The Reynolds number for this problem is defined as: 𝑅𝑒 =𝑉⋅𝐿⋅𝜌
𝜇 , where 𝑉 is characteristic
velocity (defined as the mean fluid velocity), 𝐿 is the characteristic length (the microbubble diameter
unless otherwise specified), and ρ is the fluid density7.
The Saffman equation25 can be used to estimate the lift force (i.e., the force perpendicular to the
primarily flow direction) on a spherical particle due to a velocity gradient:
(5) 𝐹𝐿 = 𝐾𝑉𝑎2 𝑘1/2
𝑣1/2
where 𝜈 is the fluid's kinematic viscosity and k is the velocity gradient. Assumptions for the lift force
estimate include symmetrical flow around the center of the sphere, and a semi-infinite body of fluid
around the sphere, meaning that the microbubble should be surrounded by ample fluid on all sides.
Results and Discussion The numerical simulation results are divided into two sections: first the results of the parallel plate
simulations are described and compared to previous experimental measurements, and then in the second
section, the results of simulations in cylindrical blood vessel geometries are presented.
Parallel Plate Simulations
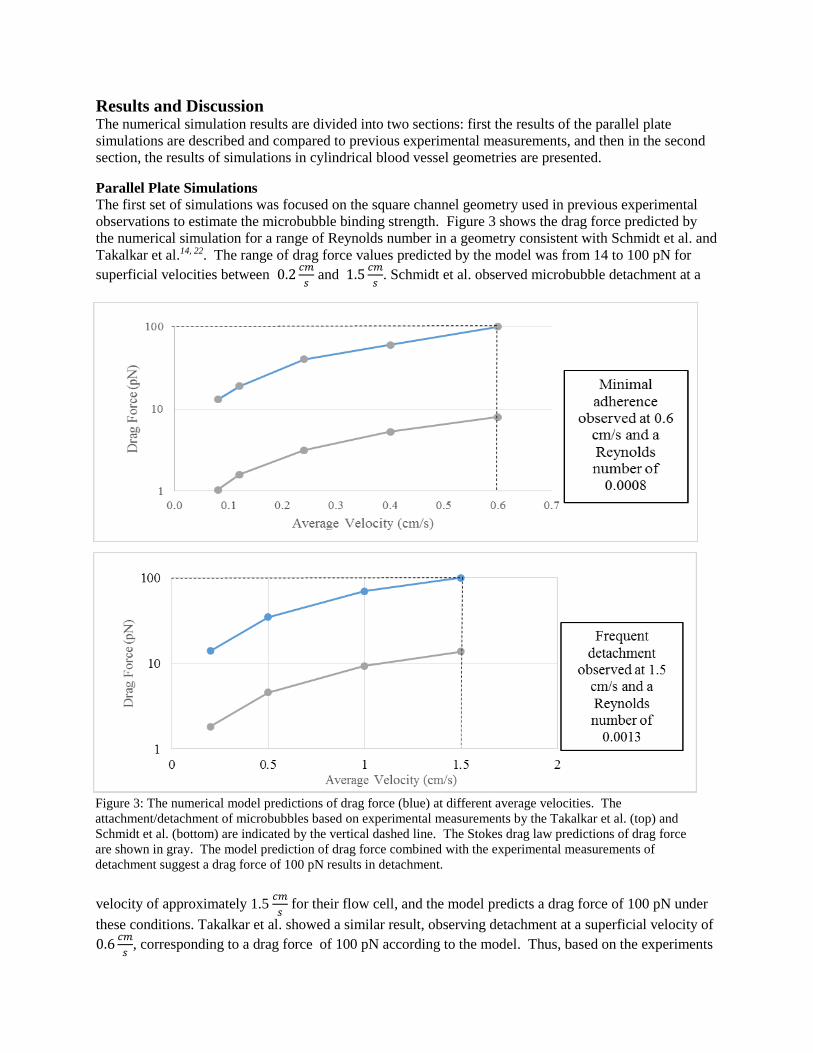
The first set of simulations was focused on the square channel geometry used in previous experimental
observations to estimate the microbubble binding strength. Figure 3 shows the drag force predicted by
the numerical simulation for a range of Reynolds number in a geometry consistent with Schmidt et al. and
Takalkar et al.14, 22. The range of drag force values predicted by the model was from 14 to 100 pN for
superficial velocities between 0.2𝑐𝑚
𝑠 and 1.5
𝑐𝑚
𝑠. Schmidt et al. observed microbubble detachment at a
velocity of approximately 1.5 𝑐𝑚
𝑠 for their flow cell, and the model predicts a drag force of 100 pN under
these conditions. Takalkar et al. showed a similar result, observing detachment at a superficial velocity of
0.6𝑐𝑚
𝑠, corresponding to a drag force of 100 pN according to the model. Thus, based on the experiments
Figure 3: The numerical model predictions of drag force (blue) at different average velocities. The
attachment/detachment of microbubbles based on experimental measurements by the Takalkar et al. (top) and
Schmidt et al. (bottom) are indicated by the vertical dashed line. The Stokes drag law predictions of drag force
are shown in gray. The model prediction of drag force combined with the experimental measurements of
detachment suggest a drag force of 100 pN results in detachment.
of Takalkar et al. and Schmidt et al., the model predicts microbubble attachment when the drag force is
100 pN or less, and no attachment when the drag force is greater than 100 pN.
Recent experiments have attempted to measure the total microbubble adhesion forces through the
use of an atomic force microscope (AFM). These experiments showed a median adhesion force of 93
pN24. This result is consistent with the drag force estimate from the numerical simulation combined with
flow cell measurements. Since the AFM measurements are believed to have measured the adhesion force
of individual bonds, the implication is that each microbubble is primarily held in place by one or a few
antibody bonds. This is intriguing since the surface density of the microbubbles has been estimated to be
approximately 2500 antibodies per 𝑚2 15, so there is the potential for multiple bonds between the
microbubble and the target. However, the formation of many bonds would require a high density of
receptors on the target and, if there were multiple bonds, their binding strengths are unlikely to be
additive because just a few bonds would be expected to be under tension as described by Ward et al.26.
The drag force on the upper part of the microbubble furthest from the surface attachment bonds is likely
to result in a ‘peeling’ or ‘unzipping’ of individual antibody bonds from each attachment sites.
Blood Flow Simulations
The second set of results is focused on predicting whether or not microbubble attachment is likely or
unlikely for a range of blood vessel sizes and a range of blood flow velocities. The goal was to evaluate a
sufficient range of vessel sizes and blood flow velocities to represent most of the conditions found in the
cardiovascular system. The results are focused on predicting microbubble attachment in a “worst case”
scenario and thus the model predictions of attachment may be conservative. The prediction of
microbubble attachment is based on three regions of the vascular system: capillaries, venules, and veins.
Additionally, these blood vessel results are compared with the predictions of the Stokes drag law. If the
Stokes drag law results are consistent with the numerical model, it would allow for the use of simplified
equations to predict microbubble behavior in a wide range of flow conditions throughout the body
without the use of computational modeling software. For all simulations, the microbubble is attached to
the vessel wall and the hydrodynamic forces on the bubble are estimated.
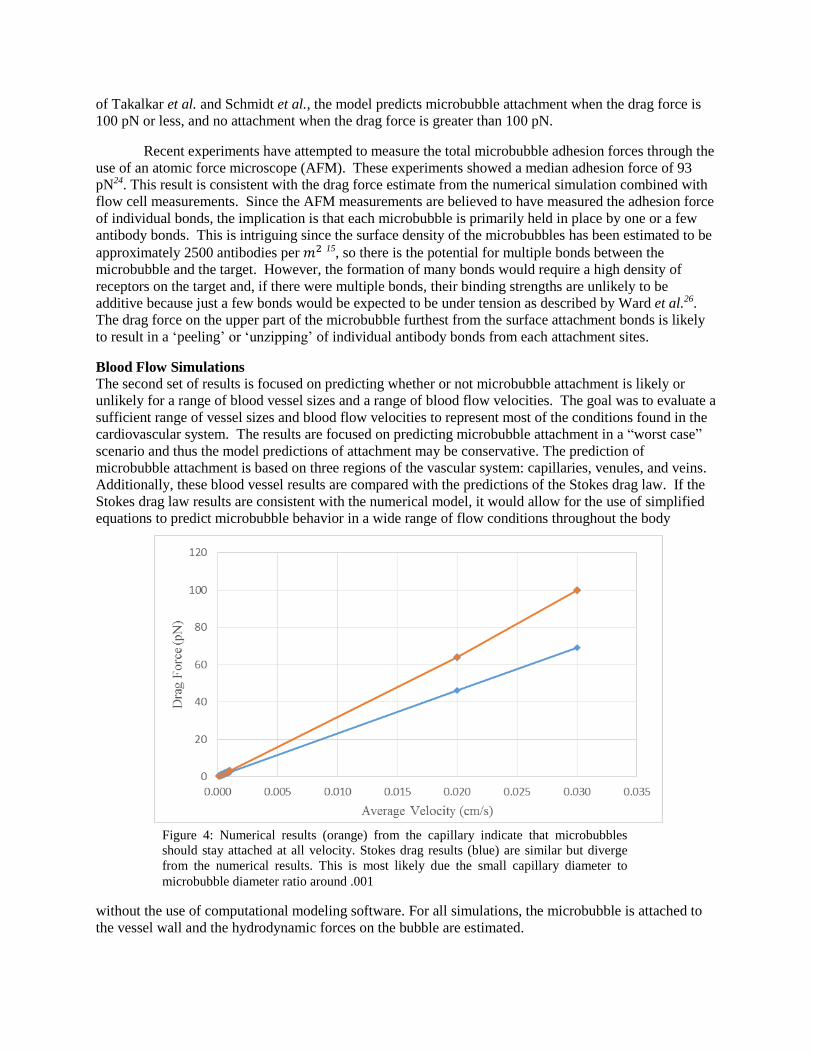
Figure 4: Numerical results (orange) from the capillary indicate that microbubbles
should stay attached at all velocity. Stokes drag results (blue) are similar but diverge
from the numerical results. This is most likely due the small capillary diameter to
microbubble diameter ratio around .001
The first vessel examined is the capillary geometry, and the force increases nearly linearly with
the Reynolds number over the range of flow rates examined (Figure 4). Although the total hydrodynamic
forces from fluid flow are unlikely to prevent attachment based for the typical range of velocities in the
capillaries (i.e., the forces are less than 100 pN), the additional force from the impact of red blood cells, or
other small particles could be significant and potentially lead to detachment. The force predictions from
the Stokes drag law differed from the more accurate numerical simulation calculation of drag by no more
than 50% at low Reynolds numbers (𝑅𝑒𝑐 ≪ 1) found within capillaries. The agreement between the
numerical simulation and Stokes drag law is somewhat unexpected because the Stokes drag law was
derived using an infinite, unbounded body of fluid. As the flow rate increases in the capillary, however, a
separation between the Stokes drag and numerical results is observed and is due to the acceleration of
additional fluid through the space between the microbubble and opposing wall.
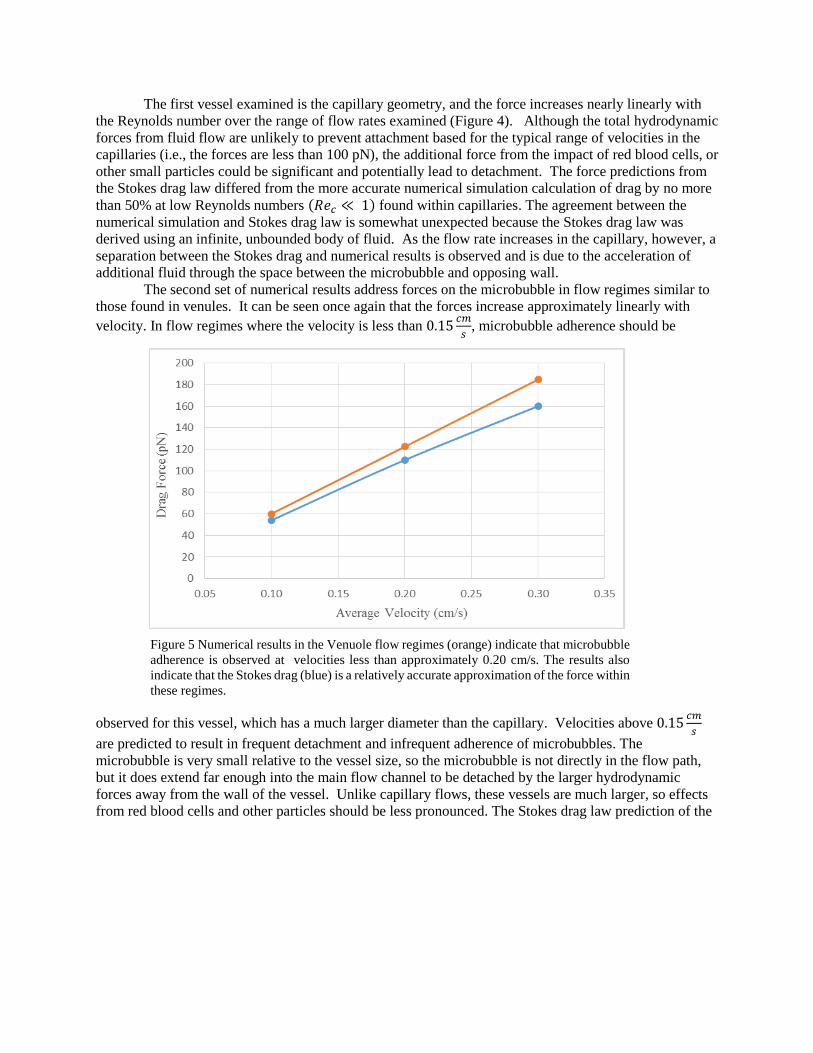
The second set of numerical results address forces on the microbubble in flow regimes similar to
those found in venules. It can be seen once again that the forces increase approximately linearly with
velocity. In flow regimes where the velocity is less than 0.15𝑐𝑚
𝑠, microbubble adherence should be
observed for this vessel, which has a much larger diameter than the capillary. Velocities above 0.15𝑐𝑚
𝑠
are predicted to result in frequent detachment and infrequent adherence of microbubbles. The
microbubble is very small relative to the vessel size, so the microbubble is not directly in the flow path,
but it does extend far enough into the main flow channel to be detached by the larger hydrodynamic
forces away from the wall of the vessel. Unlike capillary flows, these vessels are much larger, so effects
from red blood cells and other particles should be less pronounced. The Stokes drag law prediction of the
Figure 5 Numerical results in the Venuole flow regimes (orange) indicate that microbubble
adherence is observed at velocities less than approximately 0.20 cm/s. The results also
indicate that the Stokes drag (blue) is a relatively accurate approximation of the force within
these regimes.
drag force is similar to the numerical results in this regime, showing a variation of less than 10% between
the two approximations (Figure 5).
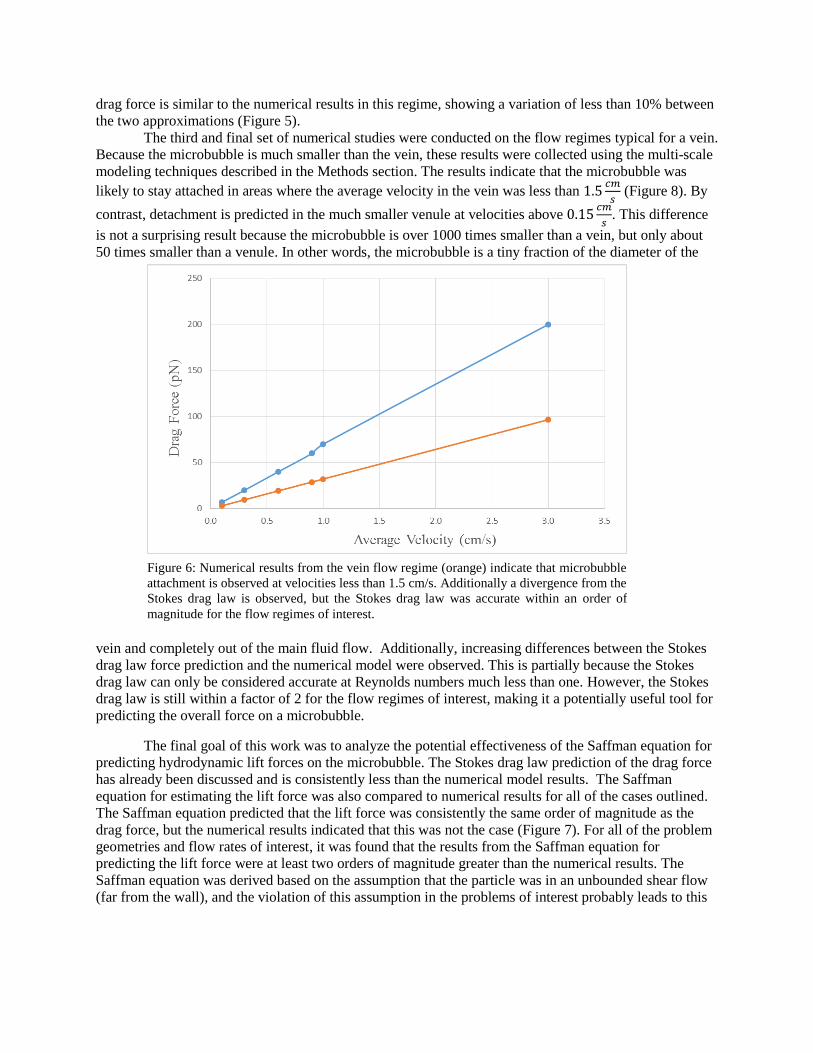
The third and final set of numerical studies were conducted on the flow regimes typical for a vein.
Because the microbubble is much smaller than the vein, these results were collected using the multi-scale
modeling techniques described in the Methods section. The results indicate that the microbubble was
likely to stay attached in areas where the average velocity in the vein was less than 1.5𝑐𝑚
𝑠 (Figure 8). By
contrast, detachment is predicted in the much smaller venule at velocities above 0.15𝑐𝑚
𝑠. This difference
is not a surprising result because the microbubble is over 1000 times smaller than a vein, but only about
50 times smaller than a venule. In other words, the microbubble is a tiny fraction of the diameter of the
vein and completely out of the main fluid flow. Additionally, increasing differences between the Stokes
drag law force prediction and the numerical model were observed. This is partially because the Stokes
drag law can only be considered accurate at Reynolds numbers much less than one. However, the Stokes
drag law is still within a factor of 2 for the flow regimes of interest, making it a potentially useful tool for
predicting the overall force on a microbubble.
The final goal of this work was to analyze the potential effectiveness of the Saffman equation for
predicting hydrodynamic lift forces on the microbubble. The Stokes drag law prediction of the drag force
has already been discussed and is consistently less than the numerical model results. The Saffman
equation for estimating the lift force was also compared to numerical results for all of the cases outlined.
The Saffman equation predicted that the lift force was consistently the same order of magnitude as the
drag force, but the numerical results indicated that this was not the case (Figure 7). For all of the problem
geometries and flow rates of interest, it was found that the results from the Saffman equation for
predicting the lift force were at least two orders of magnitude greater than the numerical results. The
Saffman equation was derived based on the assumption that the particle was in an unbounded shear flow
(far from the wall), and the violation of this assumption in the problems of interest probably leads to this
Figure 6: Numerical results from the vein flow regime (orange) indicate that microbubble
attachment is observed at velocities less than 1.5 cm/s. Additionally a divergence from the
Stokes drag law is observed, but the Stokes drag law was accurate within an order of
magnitude for the flow regimes of interest.
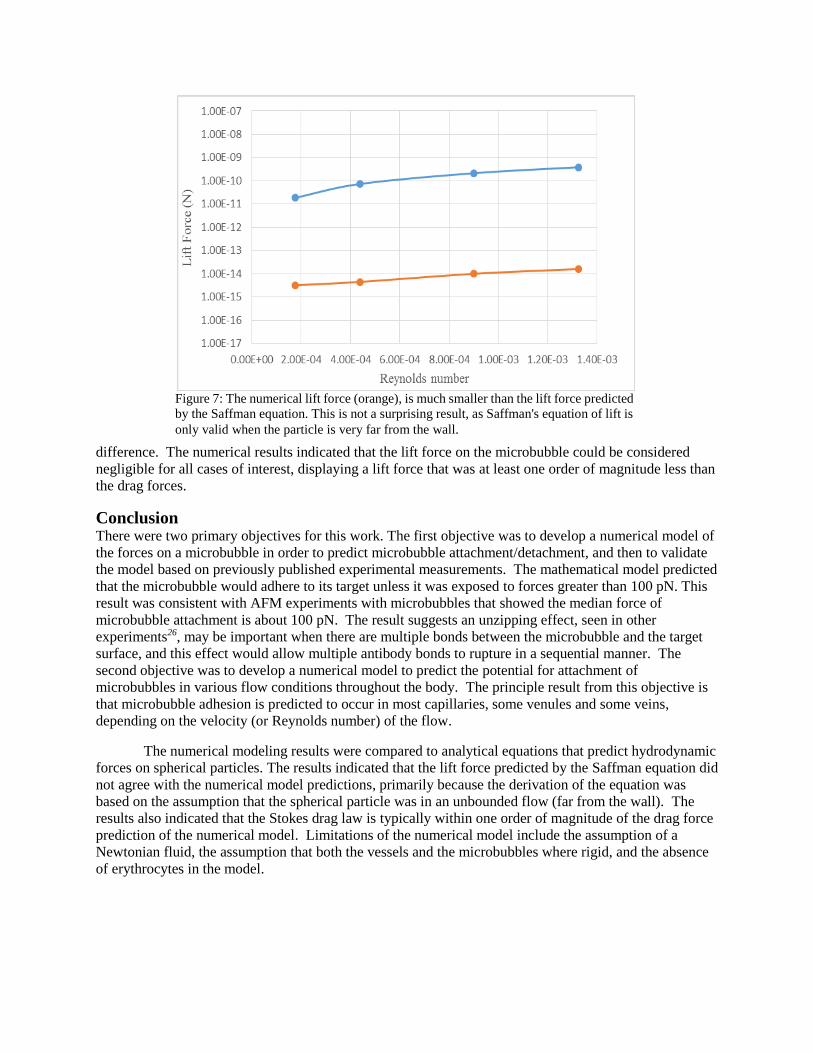
difference. The numerical results indicated that the lift force on the microbubble could be considered
negligible for all cases of interest, displaying a lift force that was at least one order of magnitude less than
the drag forces.
Conclusion There were two primary objectives for this work. The first objective was to develop a numerical model of
the forces on a microbubble in order to predict microbubble attachment/detachment, and then to validate
the model based on previously published experimental measurements. The mathematical model predicted
that the microbubble would adhere to its target unless it was exposed to forces greater than 100 pN. This
result was consistent with AFM experiments with microbubbles that showed the median force of
microbubble attachment is about 100 pN. The result suggests an unzipping effect, seen in other
experiments26, may be important when there are multiple bonds between the microbubble and the target
surface, and this effect would allow multiple antibody bonds to rupture in a sequential manner. The
second objective was to develop a numerical model to predict the potential for attachment of
microbubbles in various flow conditions throughout the body. The principle result from this objective is
that microbubble adhesion is predicted to occur in most capillaries, some venules and some veins,
depending on the velocity (or Reynolds number) of the flow.
The numerical modeling results were compared to analytical equations that predict hydrodynamic
forces on spherical particles. The results indicated that the lift force predicted by the Saffman equation did
not agree with the numerical model predictions, primarily because the derivation of the equation was
based on the assumption that the spherical particle was in an unbounded flow (far from the wall). The
results also indicated that the Stokes drag law is typically within one order of magnitude of the drag force
prediction of the numerical model. Limitations of the numerical model include the assumption of a
Newtonian fluid, the assumption that both the vessels and the microbubbles where rigid, and the absence
of erythrocytes in the model.
Figure 7: The numerical lift force (orange), is much smaller than the lift force predicted
by the Saffman equation. This is not a surprising result, as Saffman's equation of lift is
only valid when the particle is very far from the wall.
References:
1. Harro, J. M., Peters, B. M., O'May, G. A., Archer, N., Kerns, P., Prabhakara, R., and Shirtliff, M.
E. (2010) Vaccine development in Staphylococcus aureus: taking the biofilm phenotype into
consideration, FEMS Immunol Med Mic 59, 306-323.
2. Frasca, D., Dahyot-Fizelier, C., and Mimoz, O. (2010) Prevention of Central Venous Catheter-
related Infection in the Intensive Care Unit, Intensive Care Medicine: Annual Update 2010, 223-
234.
3. Mermel, L. A., Farr, B. M., Sherertz, R. J., Raad, I. I., O'Grady, N., Harris, J. S., and Craven, D.
E. (2001) Guidelines for the management of intravascular catheter-related infections, Clin Infect
Dis 32, 1249-1272.
4. Passerini, L., Lam, K., Costerton, J. W., and King, E. G. (1992) Biofilms on Indwelling Vascular
Catheters, Crit Care Med 20, 665-673.
5. Anastasiadis, P., Mojica, K. D. A., Allen, J. S., and Matter, M. L. (2014) Detection and
quantification of bacterial biofilms combining high-frequency acoustic microscopy and targeted
lipid microparticles, J Nanobiotechnol 12.
6. Shohet, R., Chen, S., Zhou, Y. T., Wang, Z. W., Meidell, R. S., Unger, R., and Grayburn, P. A.
(2000) Targeted gene delivery to the left ventricular myocardium using ultrasound-triggered
microbubble destruction, J Am Coll Cardiol 35, 444a-444a.
7. Wilkes, J. O. (2006) Fluid mechanics for chemical engineers with Microfluidics and CFD, 2nd
ed., Prentice Hall Professional Technical Reference, Upper Saddle River, NJ.
8. Chapuis, J. C., Schmaltz, R. M., Tsosie, K. S., Belohlavek, M., and Hecht, S. M. (2009)
Carbohydrate Dependent Targeting of Cancer Cells by Bleomycin-Microbubble Conjugates, J
Am Chem Soc 131, 2438-+.
9. Rand, A., Gilman, G., Kane, D., and Belohlavek, M. (2008) Biotinylated Microbubbles Targeted
to Amyloid., The Open Clinical Chemistry Journal 1, 75-78.
10. Ferrara, K., Pollard, R., and Borden, M. (2007) Ultrasound microbubble contrast agents:
Fundamentals and application to gene and drug delivery, Annu Rev Biomed Eng 9, 415-447.
11. Bloch, S. H., Dayton, P. A., and Ferrara, K. W. (2004) Targeted imaging using ultrasound
contrast agents, Ieee Eng Med Biol 23, 18-29.
12. Brady, R. A., Leid, J. G., Kofonow, J., Costerton, J. W., and Shirtliff, M. E. (2007)
Immunoglobulins to surface-associated Biofilm Immunogens provide a novel means of
visualization of methicillin-resistant Staphylococcus aureus Biofilms, Appl Environ Microb 73,
6612-6619.
13. Brobst, T., Rombola, C., Ungerleider, S., Voncannon, S., and Ward, B. (2013) Targeted
Microbubble Drug Delivery in an Experimental Treatment Model of Crohn's Disease, The
Spectra, 27-35.
14. Schmidt, B. J., Sousa, I., van Beek, A. A., and Bohmer, M. R. (2008) Adhesion and ultrasound-
induced delivery from monodisperse microbubbles in a parallel plate flow cell, J Control Release
131, 19-26.
15. Takalkar, A. M., Klibanov, A. L., Rychak, J. J., Lindner, J. R., and Ley, K. (2004) Binding and
detachment dynamics of microbubbles targeted to P-selectin under controlled shear flow, J
Control Release 96, 473-482.
16. Stride, E. P., and Coussios, C. C. (2010) Cavitation and contrast: the use of bubbles in ultrasound
imaging and therapy, P I Mech Eng H 224, 171-191.
17. Tinkov, S., Bekeredjian, R., Winter, G., and Coester, C. (2009) Microbubbles as Ultrasound
Triggered Drug Carriers, J Pharm Sci-Us 98, 1935-1961.
18. Dayton, P. A., and Rychak, J. J. (2007) Molecular ultrasound imaging using microbubble contrast
agents, Front Biosci 12, 5124-5142.
19. Klibanov, A. L., Rychak, J. J., Yang, W. C., Alikhani, S., Li, B., Acton, S., Lindner, J. R., Ley,
K., and Kaul, S. (2006) Targeted ultrasound contrast agent for molecular imaging of
inflammation in high-shear flow, Contrast Media Mol I 1, 259-266.
20. Unger, E. C., Porter, T., Culp, W., Labell, R., Matsunaga, T., and Zutshi, R. (2004) Therapeutic
applications of lipid-coated microbubbles, Adv Drug Deliver Rev 56, 1291-1314.
21. Finnoy, A. (2013) Acoustic and Mechanical Properties of Microbubbles Stabilized by Polymeric
Nanoparticles, In Department of Physics, Norwegian University of Science and Technology,
Trondheim.
22. Gresho, P. M., Sani, R. L., and Engelman, M. S. (1998) Incompressible flow and the finite
element method : advection-diffusion and isothermal laminar flow, Wiley, Chichester.
23. Box, F. M. A., van der Geest, R. J., Rutten, M. C. M., and Reiber, J. H. C. (2005) The influence
of flow, vessel diameter, and non-Newtonian blood viscosity on the wall shear stress in a carotid
bifurcation model for unsteady flow, Invest Radiol 40, 277-294.
24. Sboros, V., Glynos, E., Ross, J. A., Moran, C. M., Pye, S. D., Butler, M., McDicken, W. N.,
Brown, S. B., and Koutsos, V. (2010) Probing microbubble targeting with atomic force
microscopy, Colloid Surface B 80, 12-17.
25. Saffman, P. G. (1965) Lift on a Small Sphere in a Slow Shear Flow, J Fluid Mech 22, 385-&.
26. Ward, M. D., Dembo, M., and Hammer, D. A. (1994) Kinetics of Cell Detachment - Peeling of
Discrete Receptor Clusters, Biophys J 67, 2522-2534.
Student Authors:
Joshua Gosney:
Joshua Gosney received his A.S. degree in economics from Flathead Valley Community College in
2010. In 2012, Mr. Gosney began his academic pursuits at Montana State University, where he is
currently seeking his B.S. degree in Chemical Engineering. Mr. Gosney is conducting research in
the computational bio-fluids laboratory under the advisement of Dr. Jeffrey Heys, and their work
objective is focused around developing a targeted drug delivery system with use of Microbubble
conjugates. Mr. Gosney is a proud Native American and an active member of AICHE student
group, USGBC, Sustainability committee, Leadership Institute and the Undergraduate Scholars
Program. Joshua’s ultimate goal is to obtain his Ph. D in chemical engineering, with a focus in Bio-
medical research.
Summary
The inability to noninvasively detect some diseases such as biofilm-based infections and cancer is a
significant challenge. The combination of targeted microbubbles and ultrasound has been shown to
potentially be an effective and inexpensive method of detection for diseases such as biofilm-based
infections, cancer, and the formation of atherosclerotic plaque, among others. This study focuses on
determining the biological flow conditions where microbubbles are likely to be an effective targeting
agent in the human body versus flow conditions where microbubble attachment is unlikely due to large
hydrodynamic forces on the microbubble. The goals of this project were to develop a numerical model
predicting the forces on a microbubble, validate the model using published experimental measurements,
assess the potential for using a simplified analytical model for predicting the hydrodynamic forces, and,
finally, assess the potential for microbubble attachment under various biological flow conditions within
the human body.

![DBD plasma microbubble reactor for pre-treatment of … · DBD plasma microbubble reactor for pre-treatment of lignocellulosic biomass [poster] ... DBD plasma microbubble reactor](https://img.pdfslide.us/doc/110x75/5e4523a0e85b14090f08d100/dbd-plasma-microbubble-reactor-for-pre-treatment-of-dbd-plasma-microbubble-reactor.jpg)