Embed Size (px)
Citation preview
Numerical Models of Galaxy Evolution: Black Hole Feedback and Disk Heating
by
Jackson Eugene DeBuhr
A dissertation submitted in partial satisfaction of the
requirements for the degree of
Doctor of Philosophy
in
Physics
in the
Graduate Division
of the
University of California, Berkeley
Committee in charge:
Professor Chung-Pei Ma, Co-Chair
Professor Eliot Quataert, Co-Chair
Professor Christopher McKee
Professor Leo Blitz
Spring 2012

Numerical Models of Galaxy Evolution: Black Hole Feedback and Disk Heating
Copyright 2012
by
Jackson Eugene DeBuhr
1
Abstract
Numerical Models of Galaxy Evolution: Black Hole Feedback and Disk Heating
by
Jackson Eugene DeBuhr
Doctor of Philosophy in Physics
University of California, Berkeley
Professor Chung-Pei Ma, Co-Chair
Professor Eliot Quataert, Co-Chair
This thesis explores two topics in contemporary galaxy evolution using numericalmodels and N-body simulation: feedback in active galactic nuclei and the heating ofstellar disks.
Two numerical models of feedback from active galactic nuclei are developed andapplied to the case of a major merger between two disk galaxies. Accretion intocentral black holes is modeled via a subgrid prescription based on angular momentumtransport on unresolved scales. Feedback from black holes is modeled in two ways,both of which deposit a momentum τL/c into the surroundings, where L is theluminosity of radiation produced by the galactic nucleus. In the first model, themomentum is divided equally among the nearby gas particles to model processes likethe absorption of ultraviolet light by dust grains. The second model deposits thesame amount of momentum into the surroundings, but it does so by launching awind with a fixed speed, which only has a direct effect on a small fraction of the gasin the black hole’s vicinity. Both models successfully regulate the growth of the blackhole, reproducing, for example, the MBH − σ relationship, albeit for large amountsof momentum deposition (large τ). This regulation is largely independent of thefueling model employed, and thus is ‘demand limited’ black hole growth, rather thana ‘supply limited’ mode. However, only the model that implements an active galacticnucleus wind explicitly has an effect on large scales, quenching star formation in thehost galaxy, and driving a massive galaxy-scale outflow.
In a separate set of calculations, a method for including a stellar disk in cosmo-logical zoom-in simulation is presented and applied to a set of realistic dark matterhalos taken from the Aquarius suite of simulations. The halos are adiabatically ad-justed from z = 1.3 to z = 1.0 by a rigid disk potential, at which point the rigidpotential is replaced with a live stellar disk of particles. The halos respond to thedisks, in every orientation simulated, by contracting in their central regions and bybecoming oblate instead of prolate. The resulting disks, with few exceptions, formlarge bars which contain a fair fraction of the mass of the disk. These bars buckle and

2
dominate the dynamics of the disk, increasing not only the scale height of the disk,but also the vertical velocity dispersion. During the simulations, the disks tumblecoherently with their host halo, but can leave the outermost edges of the disk behind,creating streams that are far out of the plane of the disk. Some first steps are takento relate the evolution of the disk to the substructure in the halo, but the situationis complicated by the massive bar.

i
To Theresa
ii
Contents
1 Introduction 11.1 Overview . . . . . . . . . . . . . . . . . . . . . . . . . . . . . . . . . . 11.2 AGN Feedback . . . . . . . . . . . . . . . . . . . . . . . . . . . . . . 1
1.2.1 Observational Results . . . . . . . . . . . . . . . . . . . . . . 21.2.2 Theoretical Results . . . . . . . . . . . . . . . . . . . . . . . . 31.2.3 Numerical Results . . . . . . . . . . . . . . . . . . . . . . . . 51.2.4 Contributions . . . . . . . . . . . . . . . . . . . . . . . . . . . 6
1.3 Disk Heating . . . . . . . . . . . . . . . . . . . . . . . . . . . . . . . 71.3.1 Contributions . . . . . . . . . . . . . . . . . . . . . . . . . . . 9
2 Self-Regulated Black Hole Growth via Momentum Deposition inGalaxy Merger Simulations 112.1 Introduction . . . . . . . . . . . . . . . . . . . . . . . . . . . . . . . . 112.2 Methods . . . . . . . . . . . . . . . . . . . . . . . . . . . . . . . . . . 132.3 Results . . . . . . . . . . . . . . . . . . . . . . . . . . . . . . . . . . . 162.4 Discussion . . . . . . . . . . . . . . . . . . . . . . . . . . . . . . . . . 20
3 The Growth of Massive Black Holes in Galaxy Merger Simulationswith Feedback by Radiation Pressure 223.1 Introduction . . . . . . . . . . . . . . . . . . . . . . . . . . . . . . . . 233.2 Methodology . . . . . . . . . . . . . . . . . . . . . . . . . . . . . . . 25
3.2.1 Initial Conditions and Galaxy Parameters . . . . . . . . . . . 253.2.2 Interstellar Medium Model . . . . . . . . . . . . . . . . . . . . 283.2.3 Black Hole Accretion and Feedback . . . . . . . . . . . . . . . 293.2.4 Parameter Choices for the Black Hole Model . . . . . . . . . . 33
3.3 Galaxy Merger Simulations . . . . . . . . . . . . . . . . . . . . . . . . 343.3.1 The Fiducial Simulation . . . . . . . . . . . . . . . . . . . . . 343.3.2 Dependence on Parameters of the BH Model . . . . . . . . . . 393.3.3 Effects of the ISM Model . . . . . . . . . . . . . . . . . . . . . 443.3.4 Galaxy Parameters . . . . . . . . . . . . . . . . . . . . . . . . 46
3.4 The MBH − σ Correlation . . . . . . . . . . . . . . . . . . . . . . . . 483.5 Discussion and Conclusions . . . . . . . . . . . . . . . . . . . . . . . 53
iii
3.6 Resolution Studies . . . . . . . . . . . . . . . . . . . . . . . . . . . . 573.7 Code Verification . . . . . . . . . . . . . . . . . . . . . . . . . . . . . 59
3.7.1 Gas shells . . . . . . . . . . . . . . . . . . . . . . . . . . . . . 593.7.2 Isothermal Sphere . . . . . . . . . . . . . . . . . . . . . . . . . 62
4 Galaxy-Scale Outflows Driven by Active Galactic Nuclei 684.1 Introduction . . . . . . . . . . . . . . . . . . . . . . . . . . . . . . . . 684.2 Methodology . . . . . . . . . . . . . . . . . . . . . . . . . . . . . . . 70
4.2.1 Galaxy Models and Initial Conditions . . . . . . . . . . . . . . 704.2.2 Black Hole Accretion . . . . . . . . . . . . . . . . . . . . . . . 714.2.3 Radiation Pressure Feedback . . . . . . . . . . . . . . . . . . . 724.2.4 AGN Wind Feedback . . . . . . . . . . . . . . . . . . . . . . . 724.2.5 ISM Model and Gas Cooling . . . . . . . . . . . . . . . . . . . 74
4.3 Results . . . . . . . . . . . . . . . . . . . . . . . . . . . . . . . . . . . 754.3.1 Effects of AGN Winds . . . . . . . . . . . . . . . . . . . . . . 774.3.2 Dependence on Feedback Model Parameters . . . . . . . . . . 844.3.3 Numerical Tests . . . . . . . . . . . . . . . . . . . . . . . . . . 86
4.4 Discussion and Conclusions . . . . . . . . . . . . . . . . . . . . . . . 88
5 Stellar Disks in Aquarius Dark Matter Haloes 935.1 Introduction . . . . . . . . . . . . . . . . . . . . . . . . . . . . . . . . 935.2 Methods . . . . . . . . . . . . . . . . . . . . . . . . . . . . . . . . . . 96
5.2.1 Dark Matter Haloes . . . . . . . . . . . . . . . . . . . . . . . 965.2.2 Phase 1: Adding a Rigid Disk . . . . . . . . . . . . . . . . . . 965.2.3 Phase 2: Live Disk . . . . . . . . . . . . . . . . . . . . . . . . 975.2.4 Disk Parameters . . . . . . . . . . . . . . . . . . . . . . . . . 98
5.3 Effects of Rigid Stellar Disks on Dark Matter Haloes . . . . . . . . . 995.4 Live Stellar Disks and Bar Formation . . . . . . . . . . . . . . . . . . 103
5.4.1 Structural Properties of Live Disks . . . . . . . . . . . . . . . 1035.4.2 Stellar Bars . . . . . . . . . . . . . . . . . . . . . . . . . . . . 1075.4.3 Disk Heating and Velocity Profiles . . . . . . . . . . . . . . . 1115.4.4 Disk Reorientation . . . . . . . . . . . . . . . . . . . . . . . . 114
5.5 Alternate Disk Models . . . . . . . . . . . . . . . . . . . . . . . . . . 1185.6 Subhalos of Aquarius . . . . . . . . . . . . . . . . . . . . . . . . . . . 120
5.6.1 SUBFIND halos . . . . . . . . . . . . . . . . . . . . . . . . . . 1225.7 Discussion and Conclusions . . . . . . . . . . . . . . . . . . . . . . . 131
5.7.1 Summary of Results . . . . . . . . . . . . . . . . . . . . . . . 1315.7.2 Comparison to Observations . . . . . . . . . . . . . . . . . . . 1325.7.3 Conclusions . . . . . . . . . . . . . . . . . . . . . . . . . . . . 133
iv
Acknowledgments
Many people and institutions contributed to the work presented in this thesis and arerichly deserving of thanks. First and foremost are my advisors, Chung-Pei Ma andEliot Quataert, without whom this work would not exist, and whose guidance wasinstrumental for my time as a graduate student. Some early technical assistance wasprovided by Ian Parrish and Prateek Sharma, who are thus at least mildly responsiblefor me having completed any calculations. Some initial effort for the work in Chapter5 was done by Onsi Fakhouri, who has my thanks. Considerable effort was undertakenwith Michael Aumer to understand the unintuitive conventions of GADGET’s units.
The contents of Chapters 2-4 of this thesis were previously published by theMonthly Notices of the Royal Astronomical Society. Chapter 2 was originally pub-lished as DeBuhr et al. (2010), and was performed in collaboration with Eliot Quataert,Chung-Pei Ma and Philip Hopkins. Chapter 3 and 4 were originally published as De-Buhr et al. (2011) and DeBuhr et al. (2012) respectively, and were performed incollaboration with Eliot Quataert and Chung-Pei Ma. The work in Chapter 5 of thisthesis was performed in Collaboration with Chung-Pei Ma and Simon White, andthough it is not published, that is certainly the intent.
This thesis used many computing resources around the country, including: theAbe, Steele and Ranger systems, managed through the TeraGrid collaboration, andits successor, the XSEDE collaboration; the systems Carver, Franklin, Hopper andJacquard administered by the National Energy Research Scientific Computing Center;and the Henyey cluster at UC Berkeley supported by the NSF AST grant 0905801.
1
Chapter 1
Introduction
1.1 Overview
This thesis explores two topics in contemporary galaxy evolution theory: thefeedback hypothesis and the heating of disks due to the impact of halo substructure.The feedback hypothesis states that feedback, for example the energy produced inwinds and radiation from active galactic nuclei (AGN), can regulate the growth ofsupermassive black holes (BH) and their host galaxies producing the observed BH-galaxy relations. Disk heating is a process by which the stellar disks of galaxiesthicken due to an increase in the random motions of the stars comprising the diskbecause of, for example, halo substructure impact.
These topics have been explored through observation, theory and numerical sim-ulation. This thesis adds to the numerical work for both of these topics, so to placethis work in context, what follows is a brief review of the observational, theoreticaland numerical treatments of these problems to date.
1.2 AGN Feedback
Supermassive black holes at the centers of galaxies have often been invoked as anexplanation for many problems in galaxy formation. Among these are the suggestionthat feedback on the surrounding gas could not only regulate the growth of the blackhole itself, but might also quench star formation in the host galaxy, and that thisfeedback might drive gas out of the host and affect the properties of the intergalacticmedium.
The question of whether feedback from active galactic nuclei can perform all theroles that have been suggested is an important one. Observationally conclusions arehard to draw because interpreting the results of measurements often relies on modelingassumptions that are themselves difficult to verify. This is further complicated by thefact that theoretical treatments often make simplifying assumptions which might have
2
a large effect on the final dynamics. Numerically, the problem is recently becomingmore tractable, but the simulations often involve a vast range of time and distancescales that are difficult to treat properly.
1.2.1 Observational Results
Across a wide range of masses and types, galaxies show strong nuclear activity.The hallmark of an active galactic nucleus is its electromagnetic output over a widerange of wavelengths. Unlike a normal galaxy with a spectrum comprised primarilyof the thermal emission of the sum of all its stars, an active galaxy shows continuumemission with a non-thermal spectrum. Active galaxies often show emission lines,both with broad line widths (> 2000 km s−1) and narrow line widths (< 500 km s−1)(Sulentic et al., 2000, Netzer, 2008). Strong radio emission (Wadadekar, 2004), some-times in large lobes a significant distance from the center of the galaxy (Bridle andPerley, 1984), are another indication of a galaxy’s activity. Another hallmark of anactive galaxy is strong emission in x-rays (Suchkov et al., 2006, Shen et al., 2006),which is typically absent at the same level in star forming galaxies.
The wide variety of radiation mechanisms in active galaxies reflects an underlyingvariety in physical processes by which the radiation interacts with the material inthose galaxies. The presence of broad and narrow emission lines indicates the presenceof two classes of clouds which intercept and interact with the AGN’s radiation (Netzer,2008). Often intense infrared emission from a galaxy, as from LIRGs and ULIRGs,is present indicating that interactions with dust can play an important part in anAGN (Sanders, 1999). The presence of x-rays in a spectrum is often taken to bedue to Compton up-scatter of lower energy photons by hot electrons (Sunyaev andTitarchuk, 1980). The ‘big blue bump’ (Sanders et al., 1989) is often taken to bethermal emission from a disk which might feed the power source for an AGN (Laorand Netzer, 1989)
The intense radiation from an AGN leads immediately to the question of whatcould possibly power such an extraordinary energy output. High resolution measure-ments of the nuclei of nearby active galaxies puts the problem in sharper relief: howcan a region the size of the Solar System produce the light of a trillion stars? Thebest candidate for the power source of an AGN is accretion onto a supermassive blackhole.
The best evidence for the existence of a supermassive black hole is in our ownGalaxy (which is not itself particularly active). High resolution imaging of the Galac-tic center has allowed researchers to track the orbits of a number of stars in thecentral cluster in our Galaxy (Ghez et al., 2008). From the fitted orbits, the massof the central object, ∼ 4 × 10⁶M, and the size of the region in which it must beconfined, ∼ 120 AU, can be determined which leaves a black hole as essentially theonly possibility.
Outside of our local universe, the evidence is more inferential. Among the methods
3
of finding masses for central objects are dynamical modeling of the stellar kinematics(McConnell et al., 2012), observations of water masers’ orbits (Kuo et al., 2011)and reverberation mapping (Peterson et al., 2004). Such observations lead to theconclusion that most spheroids contain a SMBH.
The fact that every spheroid contains a SMBH leads quickly to the question of whyevery galaxy is not an active galaxy. The central SMBH powering nuclear activityrelies on accreting material to operate. This naturally leads to an epsiodic pattern ofactivity, with the nucleus lighting up only when material is falling into the black hole.The ubiquity of supermassive black holes and the relative scarcity of active galaxiessuggests that every galaxy is potentially active, and is merely waiting for an eventthat would drive material into the central SMBH. Indeed, Sanders et al. (1988) putobservations of ULIRGs into an evolutionary sequence where a major merger inducesinflow and activity which is shrouded by dust. This would explain both the infraredemission, because of the dust intercepting and re-radiating the light, and the highluminosity of such systems, because of the supermassive black hole accretion.
In addition to the prevalence of nuclear black holes, observations indicate a linkbetween the black hole and its host galaxy. One such relationship was the M-σrelation (Gebhardt et al., 2000, Ferrarese and Merritt, 2000) which relates the massof the black hole to the stellar velocity dispersion of the spheroidal components ofthe host galaxy. The mass of the SMBH is also correlated with the mass of thespheroid (Magorrian et al., 1998, Haring and Rix, 2004), and the luminosity of thebulge (Marconi and Hunt, 2003). Given the interest in these relations it is no surprisethat observers continue to refine the correlations as observations improve (Gultekinet al., 2009, Greene et al., 2010). Hopkins et al. (2007) suggests that black holes havea fundamental plane, analogous to the elliptical galaxy fundamental plane, which tiestogether the two property correlations into a correlation in a higher dimensional space.Whatever form they take, these relationships imply a link between the evolution ofthe black holes and their host galaxy.
The existence of active galaxies, the strong radiation and feedback processes, andthe ubiquity of black holes in spheroids suggest that perhaps it is the effect of theradiation on the surrounding gas that is responsible for the link between the evolutionof black holes and galaxies. This coevolution would then naturally manifest itself ascorrelations of the form seen in the black-hole galaxy relations. But can this suggestiveobservational picture be put into a theoretical framework?
1.2.2 Theoretical Results
The feedback hypothesis states that the feedback from the active galactic nucleusis what links the evolution of supermassive black holes to their host galaxy. Exactlywhat form the feedback takes, and the strength of the feedback, is still an openquestion.
The first model attempting to explain BH-Galaxy relations was Silk and Rees
4
(1998). In it, they assume that energy from the AGN is deposited into the surround-ings, as from Compton heating, and are able to reproduce the relation reported inMagorrian et al. (1998). King (2003) argued that energy deposition, though it may berelevant at large distances from the AGN and thus capable of regulating the intraclus-ter medium, is ineffective at small radii and instead used momentum driven feedbackfrom the AGN to reproduce the observed relationships. Another model (Burkert andSilk, 2001) invokes the star formation in a nuclear disk to regulate the flow of materialinto the black hole. It is interesting that such different mechanisms can reproduce theobserved relationships, and one is left wondering if BH-Galaxy relations are generalresults of any feedback that is sufficiently powerful. However, these models were allrelatively simple: they assumed simple symmetries and appealed to a single feedbackmechanism. It is likely that it is not just a single process that regulates galaxy growth,and the situation is certainly not spherically symmetric.
Further effort in one dimensional models has improved over the simple resultsabove. Ciotti and Ostriker (1997) and Ciotti and Ostriker (2001) have shown thatCompton heating, and photoionization models are sufficient to solve the cooling flowproblem (which is that intergalactic gas will cool and condense onto galaxies increasingstar formation and overall masses), producing galaxies with a much smaller mass thanwith a cooling flow alone. Interestingly, they produce an episodic accretion historywhere the inflowing material heats and is blown out by the AGN where it is able to cooland flow back into the center (Ciotti and Ostriker, 2007). Feedback via momentumand energy separately (Ciotti et al., 2009) and together (Ostriker et al., 2010) hasalso been modeled in one dimension. The results of these works indicate that onetype of feedback is generally insufficient to reproduce observations, and indeed theinclusion of momentum feedback increases the overall efficacy of the AGN’s feedback.
In addition to feedback directly from the AGN, regions of elevated star formationare also a source of feedback, which can be significant. Further, in many of the samesituations that AGN feedback is important (e.g. mergers) the increase in gas densityalso drives an increase in star formation leading to a starburst, which can drasticallyaffect the subsequent dynamics of the gas. The potential importance of star formationfeedback led Thompson et al. (2005) to consider star formation stabilized disk modelsas one possible mechanism for AGN fueling. Given such models, the issue of thepredominant feedback mechanism is far from clear.
One thing that is certain, however, is that gas needs to be brought to the centerof the systems to fuel either the AGN, the starburst, or, what is more likely, both.The primary difficulty is finding a method to remove angular momentum from thegas. Jog and Ostriker (1988) treated giant molecular clouds as essentially billiardballs and found that their interactions caused the clouds to migrate to the center ofthe galaxy. Another option is the mechanism of ‘bars within bars’ (Shlosman et al.,1989). In it, they argue that the instability that leads to the large scale bars in diskgalaxies can also operate on smaller scales, leading to a hierarchy of bar structuresthat is able to continuously torque gas to lower angular momentum. Goodman (2003)
5
finds that thin disks become self-gravitating, and thus fragment due to instabilities,at around 10−2 pc, which does not allow enough mass for the observed BH. Though,global torques, as from bars, would get around this problem by replenishing the diskwith low angular momentum gas. These and similar considerations led Shlosmanet al. (1990) to develop a unified fueling model that relies on a host of mechanismsoperating on different length scales.
With the wide range of processes that occur for interstellar gas in galaxies, itis no surprise that a complete theoretical treatment of AGN feedback has not beenperformed. The range of processes, each with their own scales over which they operate,lead to a complicated and nonlinear problem. Even should a complete descriptionbe written down, it is likely that the system of equations would require numericalsolution. Further, the ISM is complicated by virtue of its geometry and potentiallyclumpy nature. The end result of any such study is to appeal to computers to solvethe complicated interactions in non-trivial and dynamic geometries. Despite this,theory offers a catalog of potentially important interactions that can be explorednumerically.
1.2.3 Numerical Results
Numerical simulation has long been a tool for gaining understanding of astrophys-ical processes. Much of the benefit of simulation lies in the ability to handle generaldistributions of matter that would be impossible to treat analytically. Further, it isrelatively easy to add more interactions to simulations, so a wide range of possiblemodels and effects can be explored.
Galaxy mergers has been a popular target for numerical simulation in astrophysicssince the beginning of scientific computing. Toomre and Toomre (1972) was a pio-neering work on the dynamics of major mergers, and despite the low computing powerof their day, they found tidal tails and bridges are generic results of merging galax-ies. Some years later, Barnes and Hernquist (1991) used the considerably improvedcomputational resources to explain in depth the dynamical processes when both gasand collisionless material are present. In particular, the resulting tidal features areable to effectively torque gas into the center of the merging system.
With the basic picture of the dynamics of merging systems understood, the nextstep was to begin including the feedback processes that theory has indicated could bedynamically important. The first full three dimensional simulations of mergers with amodel for feedback from AGN was Springel et al. (2005a). Their simulations includeda new model for star formation treating some related feedback processes (Springel andHernquist, 2003), and a model for energy deposition into the gas surrounding the blackholes. They are able to not only reproduce the M − σ relation (Di Matteo et al.,2005), but also produce remnant elliptical galaxies that have little star formation andlittle AGN activity (Springel et al., 2005b), primarily because the feedback ejectsmuch of the star forming gas to large radii, and thus low density.
6
With the success of these simulations, many explored the results of their modelin other contexts. Hopkins et al. (2005) used the model to explore and refine thepicture of quasar evolution presented in Sanders et al. (1988). During the merger gasis torqued to the center and both powers and obscures the quasar. The feedback thenblows the gas out of the center and offers a short window during which the quasaris visible before the ejection of gas shuts off activity. Johansson et al. (2009b) andJohansson et al. (2009a) performed a large suite of simulations to test the effect ofmany galaxy parameters on the resulting BH-Galaxy relation, including orientation,galaxy type, and gas fraction as an attempt to mock up the evolution of the scalingrelations over cosmic history. The model was applied to a cosmological context byKhalatyan et al. (2008) who found that feedback was required to form a ‘red anddead’ central galaxy of a cluster. A larger sample of cosmological simulations byBooth and Schaye (2009) found that galaxies grow black holes onto the M − σ nomatter where they begin.
In addition to extensions of the Springel et al. (2005a) model, many have developedtheir own methods and models with the goal of explaining some of the same featuresas the above. The jet from the AGN was used by Vernaleo and Reynolds (2006)in an attempt to hold back the cooling flow. Kawata and Gibson (2005) includeAGN feedback in a single elliptical galaxy and able to reproduce the optical and x-ray luminosities, and are able to shut off star formation. An advanced grid basedtechnique, adaptive mesh refinement, was applied by Kim et al. (2009) to a merger.Though the results are limited, they have made a good proof of concept that AMRcan be used in the context of merging galaxies.
With few exceptions, these works share an assumption that should be explored:the feedback is through energy deposited into the surrounding gas. This assumptiondeserves exploration because dense gas, like what is found in the vicinity of supermas-sive black holes, has many ways that it can radiate away its energy. Also, Sazonovet al. (2005) find that Compton heating is ineffective out to a large radius. One wayaround these troubles is to deposit momentum into the surroundings. This wouldoccur in, for example, absorption of light by dust grains. Unlike energy, momentumcannot be radiated away, and so might be important for the dynamics of AGN.
Until very recently, there has been little work in this direction. One early work wasChang et al. (1987) who considered the momentum imparted to the UV absorbingdust. Another numerical effort along these lines (after my own) was Power et al.(2011) who used momentum feedback in their ‘Accretion Disk Particle Method.’ Also,Ciotti et al. (2009) and Ostriker et al. (2010) consider momentum feedback in theirsimple one dimensional models.
1.2.4 Contributions
A major portion of this thesis explores numerical models of AGN feedback thatoperate primarily by the deposition of momentum in the surrounding gas. In spirit,
7
the work is similar to Springel et al. (2005a), but the details and some major resultsdiffer.
In chapters 2 and 3, a sub-grid model of radiation pressure on circumnuclear gasin implemented in full three dimensional hydrodynamic simulations of major mergersof two Milky Way-like galaxies. In these chapters I will show that such a model isable to regulate the growth of the black hole and reproduce the M − σ relation, fora certain set of model parameters. However, the star formation in the galaxy is notdrastically effected by the model as the feedback operates locally to the black hole.
In chapter 4, I present another model depositing momentum due to AGN activity.Unlike the previous, which deposits momentum shared equally among all the gas inthe vicinity, this model instead launches a powerful wind by rapidly bringing somegas to large velocities. By itself, this wind is able to regulate the growth of the blackhole, but is also able to shut off star formation in the remnant. This occurs when thewind runs into much slower gas and sweeps up additional material, bringing not onlythe launched wind, but surrounding material to escape speed. In conjunction withthe previous model this model produces remnants with little active star formationand black holes with masses that agree with observations.
1.3 Disk Heating
The picture of the universe that emerges from both theory (Lacey and Cole, 1993)and observation (York et al., 2000) is one of hierarchical structure, starting from themost massive objects, clusters and super-clusters, their smaller constituents, groupsof galaxies, with their smaller individual galaxies like the Milky Way, which have alarge number of satellites that are smaller still. In this model, a given structure willexperience many merger events throughout its history, from the rarer major merger(Stewart et al., 2008), to the much more numerous minor merger events by whichmuch of the halo’s mass is accreted (Purcell et al., 2007, Zentner, 2007). Understand-ing the effects of such a construction history on the baryonic material is vital forunderstanding the process of galaxy formation as it occurs in the universe.
Major mergers between roughly equal mass objects are relatively rare today (Con-selice et al., 2003), but can have very significant effects of the galaxies in question(Bell et al., 2006). Minor mergers, on the other hand, are more frequent (Lotz et al.,2011), and are much less destructive to the larger of the two galaxies. Indeed, mostMilky Way like galaxies are host to a large number of satellite galaxies (Guo et al.,2012). Observationally, disk galaxies today are observed to be quite thin (van derKruit and Freeman, 2011). However, there is some tension between this observationand the fact that most average galaxies are accompanied by a host of smaller galaxieswhich can ultimately merge and disturb the disk.
These mergers are generally expected to deposit energy into the central galaxy. Forexample, Toth and Ostriker (1992) looked at the heating in the disk due to satellites
8
via scattering, and found that the disk gains more energy than is lost by the satellite,and placed some limits on the amount of mass accreted by the Milky Way. Bensonet al. (2004) developed a semi-analytic model of disk heating by satellites orbiting thegalaxy taking into account the internal structure, mass function and accretion rateof satellites, as well as disk growth. Though they ignore the resonant heating of thedisk, and the dynamical effects of bars and spirals, their model agrees broadly withobservations. These are only a few models of disk heating, but the general messageis that satellites have a number of dynamical mechanisms by which to deposit energyinto their host galaxy.
Given that the average history of any galaxy is going to involve many minormergers, each of which can have an impact on the dynamics of the galaxy, it issomewhat surprising that any thin disk survives to today. Simple analytical estimatescan only go so far, and the introduction of numerical techniques is an obvious step tomake.
There has been ample prior numerical work on this problem. Sellwood et al.(1998) considered the heating provided to a disk by a small satellite via a resonancebetween vertical bending waves and stellar orbits. Another early work, Velazquez andWhite (1999), ran a set of self-consistent simulations of disks and satellites, and foundboth heating of the disk, and tilting of its plane. Another work studying single minormergers is Purcell et al. (2009), who found in their set of cosmologically commonmergers that the final disk was thicker that that of the Milky Way by a factor of ∼ 3.Hopkins et al. (2009) ran simulations of mergers and developed a model characterizingthe amount of disk left after such events. The importance of the gaseous componentof the disk was pointed out by Moster et al. (2010), who showed that because the gascan absorb some of the impact energy, and can regrow the disk, the final scale heightsof Milky Way-like disks can indeed be brought into agreement with observations.Further, in Moster et al. (2011) they show that if a hot gaseous halo is included, theevolution of the thin disk scale height is dominated by the formation of a new stellardisk after a merger event.
However, studies of a single merger event are of limited utility when the fullcosmological context of real disks is considered. An average disk will experiencemany mergers throughout its lifetime, and the effects of multiple mergers should beexplored. Bournaud et al. (2007) performed simulations of disks undergoing multipleminor mergers, and found disks which became significantly more elliptical, with littleor no disk remaining. Despite their resolution being comparable to the thickness of thethin-disk component of spiral galaxies, these simulations demonstrate that the effectof multiple mergers can be much larger than that of a single merger. Kazantzidis et al.(2008, 2009) performed simulations of a thin disk galaxy subject to a set of satellitemergers whose properties were taken from a cosmological simulation. They find thatthe final disks suffer a number of dynamical effects resulting from the impactors: thedisk thickens, a bar and other non-axisymmetric features develop, and the disk tiltsand flares.
9
This picture is complicated by the fact that other processes can heat disks. Inparticular, the formation of bars, and the subsequent dynamics can have a large effecton the structure of disks. In a large series of simulations of thin disks, Saha et al.(2010a) found that bars, and transient spiral structure, can heat disks vertically.Sotnikova and Rodionov (2003) also found that the vertical buckling mode of barsplays an important role in disk heating. In a controlled series of experiments focusingon secular evolution, rather than hierarchical assembly, Debattista et al. (2006) foundthat bar buckling had the largest effect on the vertical structure of the disks. Thesesimulations show that secular effects can also have a large impact on stellar disks,and must be considered in any serious study of the problem.
For the most part, the halos in the previous works are idealized, even though theyare motivated by the full cosmological context. To study galaxy formation in thesetting in which it actually occurs, the disks will have to be included in the full cos-mological setting. One suite of simulations that has provided ripe ground for studyinggalaxy formation in a realistic context are the Aquarius simulations (Springel et al.,2008). These zoom-in simulations target Milky Way like halos with a lack of recentmajor mergers and no nearby massive companions in a large cosmological volume,and resimulate the halo at higher resolution. The simulations have provided a verydetailed example of halos, including substructure, that can be used as a laboratoryto test the effects of various processes on galaxy formation.
Indeed, a fair amount of work had gone into including baryonic material in theAquarius simulations. Scannapieco et al. (2009) performed resimulations of a numberof Aquarius halos including the effects of a realistic multi-phase, star-forming gasand found that while disks form easily, they can be destroyed by mergers or diskinstabilities. Tissera et al. (2010) expanded on the previous by focusing on the effectsof the baryons on the dark matter halos, finding that the detailed structure of thehalo depends on the specifics of how the halo was constructed. Sales et al. (2011),though not using Aquarius, explored the effects of halo parameters on the resultinggalaxy and found that the resulting morphology has more to do with the completeaccretion history rather than any property of the halo. These works, however, focuson broader issues of disk formation in the cosmological setting.
To answer the question of the effect of the full structure of a realistic dark matterhalo on the thickness of disks, a more specialized approach is called for, focusingon the stellar disk and its interaction with the subhalo impactors in the disk’s hosthalo. This avoids any complications of the relatively poorly understood and difficultto model gas physics. Of course, the full story is likely to rely on those physics, butit is worth separating out the simpler collisionless dynamics of stellar disks.
1.3.1 Contributions
Chapter 5 of this thesis presents the first results of a method for including astellar disk in realistic cosmological simulations. The dark matter halos, taken from

10
the Aquarius suite of simulations, are adjusted adiabatically by a rigid disk potentialbefore live disk particles are included in the simulations. The disks heat and thickenin general, and though often very strong bars develop which confound the signal, somefirst steps are taken to link the effects on the dark matter, including halo substructureand frequent substructure mergers, on the evolution of the stellar disk.
11
Chapter 2
Self-Regulated Black Hole Growthvia Momentum Deposition inGalaxy Merger Simulations
We perform hydrodynamical simulations of major galaxy mergers using new meth-ods for calculating the growth of massive black holes (BH) in galactic nuclei and theirimpact on the surrounding galaxy. We model BH growth by including a subgridmodel for accretion produced by angular momentum transport on unresolved scales.The impact of the BHs radiation on surrounding gas is approximated by deposit-ing momentum into the ambient gas, which produces an outward force away fromthe BH. We argue that these phenomenological models for BH growth and feedbackbetter approximate the interaction between the BH and dense gas in galaxies thanprevious models. We show that this physics leads to self-regulated black hole growth:during the peak of activity, the accretion rate onto the BH is largely determined bythe physics of BH feedback, not the subgrid accretion model. The BH significantlymodifies the gas dynamics in the galactic nucleus (. 300 pc), but does not generatelarge-scale galactic outflows. Integrated over an entire galaxy merger, BH feedbackhas little effect on the total number of stars formed, but is crucial for setting the BHsmass.
2.1 Introduction
Modern theories of galaxy formation hold that strong feedback processes regulatestar formation in galaxies across a wide range of masses. For more massive galaxies,stellar feedback processes appear to become less efficient and feedback from a cen-tral massive black hole (BH) begins to dominate. Feedback from an active galacticnucleus (AGN) has been invoked to account for many observational results in galaxyformation, including the MBH −M∗ and MBH − σ relations and the suppression of
12
star formation in elliptical galaxies (Silk and Rees, 1998, King, 2003, Di Matteo et al.,2005, Murray et al., 2005, Springel et al., 2005b, Hopkins et al., 2007).
Many recent studies developing numerical models for the effects of BHs on galacticscales have used broadly similar implementations of the uncertain physics of AGNfueling and feedback (e.g., Springel et al. 2005a, Kawata and Gibson 2005, Johanssonet al. 2009b). It is, e.g., often assumed that a BH of mass MBH accretes mass fromthe surrounding interstellar medium (ISM) at a rate proportional to the Bondi rate(Bondi, 1952),
MBondi =4πfG2M2
BHρ
c3s
, (2.1)
where ρ is the surrounding gas density, cs is the sound speed and f ∼ 10− 100 takesinto account the fact that the sphere of influence of the black hole is not alwaysresolved (Booth and Schaye, 2009). Moreover, these same calculations assume thatthe black hole’s impact on its host galaxy can be approximated by depositing thermalenergy released by accretion back into the surrounding gas. There is, however, littledetailed motivation or justification for either of these assumptions.
Eq. (2.1) is only applicable when the gas fueling the central BH has very littleangular momentum. Otherwise, the transport of angular momentum regulates theaccretion rate onto the central BH (e.g., Shlosman et al. 1990). It is generally be-lieved that gas-rich disk galaxies are the progenitors of today’s & L∗ ellipticals and,in particular, that mergers of gas-rich galaxies lead to luminous starbursts and thegrowth of central massive BHs (Sanders et al., 1988, Hopkins et al., 2005). Most ofthe gas in disk galaxies, merging galaxies, luminous starbursts (Downes and Solomon,1998, Tacconi et al., 2006), and nearby luminous AGN (Ho et al., 2008) appears toreside in a rotationally supported disk. There is therefore no strong reason to believethat the spherically-symmetric Bondi accretion rate is a reasonable estimate of theaccretion rate onto a BH in gas-rich disk galaxies.
The energy generated by a central AGN can couple to its surroundings in a varietyof ways, all of which may have a significant dynamical influence on gas in the hostgalaxy and in the surrounding intergalactic medium. For example, relativistic jetsinject energy into intracluster plasma and may be the key mechanism for suppressingcooling flows in galaxy clusters (McNamara and Nulsen, 2007), although the detailsof how the energy in the jet couples to the surrounding plasma in a volume-filling wayare not fully understood (Vernaleo and Reynolds, 2006). On galactic scales, windsfrom an accretion disk around the BH may sweep-up and drive gas out of galaxies(e.g., King 2003). And the AGN’s radiation can strongly impact the surrounding gas,both via Compton cooling/heating (e.g., Sazonov et al. 2005) and via the momentumimparted as UV radiation is absorbed by dust grains (Chang et al., 1987, Sanderset al., 1988).
The precise physical mechanism(s) responsible for AGN feedback are not fullyunderstood, particularly on galactic scales. For this reason, it is useful to distinguish
13
between two classes of models: energy and momentum injection. We believe thatmomentum injection, not energy injection, is likely the dominant form of feedbackfor the majority of the gas in a galaxy. In most circumstances, jets take the path ofleast resistance and travel relatively unimpeded out of a galaxy. Furthermore, whileradiation from an AGN can, in principle, Compton heat the surrounding gas enoughto unbind it, it can only do so for very low density gas. For example, for a BHradiating at ∼ 1046 erg s−1 with a typical quasar spectrum, only gas with n . 1 cm−3
can be heated to the Compton temperature within ∼ 100 pc. However, the mean gasdensities in the central ∼ 100 pc of ultraluminous infrared galaxies are ∼ 104cm−3
(Downes and Solomon, 1998). At these densities, the cooling time of the gas is veryshort and the gas is unable to retain any injected energy. Thus if the radiation froma BH strongly modifies the dynamics of the gas in its immediate vicinity, it must bevia the force exerted when the radiation is absorbed.
Given the uncertainties in the physics of BH accretion and feedback, it is importantto explore a range of models for the impact of BHs on galaxy formation. Towards thisend, we have carried out numerical simulations of major galaxy mergers, qualitativelytaking into account the physics of accretion induced by angular momentum transportand AGN feedback by momentum injection (radiation pressure). Our accretion andfeedback prescriptions both differ from those used in previous numerical simulationsof BH growth and feedback. The results in this Letter are taken from a larger setof calculations (DeBuhr et. al. in prep.) and represent general features of all thesimulations we have carried out.
2.2 Methods
We use a non-public update of the TreeSPH code GADGET-2 (Springel, 2005)to perform simulations of galaxy mergers with feedback from both star formationand central supermassive BHs. The code, provided by V. Springel, includes theeffective star formation model of Springel and Hernquist (2003). We describe belowthe additional modifications that we have implemented to model BH growth andfeedback.
The multiphase equation of state of Springel and Hernquist (2003) overpredictsthe “sound speed” as compared to observations of the random velocities in galaxies (inatomic or molecular gas). For example, the parameter choices TSN = 4× 10⁸K, A0 =4000, t0∗ = 8.4Gyr, and qEOS = 0.5, which have been used in previous works (Springelet al., 2005a), predicts dv ∼ 30 km s−1 at n ∼ 1 cm−3 and dv ∼ 110 km s−1 forn ∼ 103cm−3. These are too large by a factor of ∼ 2− 3 compared with the observedvalues (Downes and Solomon, 1998). To account for this difference, we reduce thepressure everywhere by a constant factor of 10. As in Springel and Hernquist (2003),we assume that ρ∗ ∼ ρ1.5 for consistency with observations (Kennicutt, 1988). Thenormalization of the star formation prescription is chosen so that a Milky Way-like
14
galaxy has a total star formation rate of about one solar mass per year; for galaxieswith different surface densities, the result is also consistent with Kennicutt (1988). Byreducing the pressure at fixed ρ by a factor of 10, the gas is more dense in hydrostaticequilibrium. This would increase the star formation rate relative to the observedvalue. To correct for this, we modify the equation of state parameters to: t∗0 = 13.86Gyr, β = 0.1, A0 = 6600, TSN = 6.6× 10⁸ K, Tc = 1000 K and qEOS = 0.5.
The simulations described in this work are all mergers of equal mass galaxies.Each model galaxy consists of a dark matter halo, a rotationally supported disk ofgas and stars, a stellar bulge, and a central BH. The galaxy parameters are similarto those in Springel et al. (2005a): each galaxy has a total mass of 1.36 × 10¹²M;the mass of the disk is 4.1% of the total, i.e., 5.57 × 10¹⁰M, where 10% of the diskmass is assigned to gas and 90% to stars; the bulge has a mass of 1.86× 10¹⁰M, i.e.,1/3 of the total disk mass. Each galaxy is made of 8.0× 10⁵ simulation particles andthe gravitational force softening is ε = 47 pc. The halo and the bulge have Hernquistdensity profiles (Hernquist, 1990), where the virial and half-mass radii of the halo are229 kpc and 102 kpc, respectively (the concentration is 9.0), and the effective radiusof the bulge is 1.27 kpc. The gaseous and stellar disks have exponential profiles withscale lengths Rd = 3.51 kpc; the scale-height of the stellar disk is 0.7 kpc, whilethe scale-height of the gaseous disk is determined by hydrostatic equilibrium. Themassive BH in each galaxy is modeled using a specially marked collisionless tracerparticle.
The initial conditions are generated as in Springel et al. (2005a), except for thedecrease in gas pressure described above. The galaxies are placed on a progradeparabolic orbit. The individual spins of the two galaxies are randomly chosen to havea relative angle of about 41 degrees. The galaxies begin at a distance of 142 kpc andthe orbit has a pericenter of 14.2 kpc.
We estimate the accretion rate onto the BH from the surrounding gas, due toviscous transport of angular momentum, using
Mvis = 3παΣc2s
Ω, (2.2)
where Σ is the mean surface density of the gas in the disk, Ω is its angular rotationalfrequency, and the free parameter α is the dimensionless viscosity; Mvis is also cappedat the Eddington rate. We compute Σ and the sound speed cs by taking an averageof the properties of the individual SPH particles in a spherical region with a radiusRacc = 4ε = 188 pc centred on the BH. Using velocity information directly fromthe simulation particles themselves to compute Ω proved to be too noisy; we thusdetermined Ω using the total mass, MT , inside Racc through Ω2 = GMT/R
3acc.
Note that in our accretion prescription, Mvis = 0 if there is no gas within 4ε ofthe BH. This feature of our model accounts for the fact that our simulations capturethe angular momentum transport produced by gravitational torques on large scales(& 4ε = Racc); we assume, as is physically reasonable but by no means proven, that
15
these must be sufficient to bring gas close to the BH (within Racc) for significant BHaccretion to proceed.
Eq. (2.2) is reminiscent of an alpha prescription of Shakura and Sunyaev (1973),but in this formulation α parameterises both the efficiency of angular momentumtransport on scales smaller than our gravitational force softening (by, e.g., gravita-tional torques) and the uncertainty due to the fraction of the inflowing mass thatturns into stars vs. accreting onto the central BH. The physical processes responsiblefor transporting gas from ∼ kpc to ∼ 0.1 pc are still not fully understood (Goodman,2003), but non-axisymmetric gravitational torques are likely responsible (Shlosmanet al., 1989). Detailed calculations of the structure of AGN disks from ∼ 0.01−100 pc,based on transport by spiral waves, show that Eq. (2.2), evaluated at radii ∼ 30−100pc, can provide a reasonable estimate of the accretion rate onto the BH in somecases (Thompson et al., 2005). Although Eq. (2.2) is only a crude approximation tothe true accretion rate onto the BH, it captures the qualitative physics of accretioninduced by angular momentum transport, and is thus, we believe, a more suitable“subgrid” model than Eq. (2.1). Our fiducial choice for α is α = 0.05, but we alsopresent results for 0.15 in Sec. 3. In the future, we intend to better calibrate ourmodel of angular momentum transport using simulations that focus on the central∼ 100 pc of galaxies (Hopkins and Quataert, 2010b).
To model the feedback onto the gas surrounding the BH, we have implementeda simple phenomenological model in which the AGN’s luminosity L is coupled backinto the surrounding gas by depositing momentum radially outward from the BH.Our goal is to account for the radiation pressure produced by the absorption andscattering of the AGN’s radiation by dust in the ISM. To accurately do so wouldrequire a radiation transport calculation, which is beyond the scope of the currentpaper. Instead, we model the impact of this radiation on the surrounding galaxy bydepositing a total momentum (per unit time) of
τL/c , where L = min(ηMvisc2, LEdd) (2.3)
radially away from the BH into every SPH particle within a distance of Racc from theBH; each particle receives the same acceleration. Note that the number of particlesthat receive this extra force, N , will change with time as particles enter and leavethe central region of radius Racc. We assume a radiative efficiency of η = 0.1. Equa-tion (2.3) models the absorption by the dust of the UV radiation from the AGN (oneL/c), and, more importantly, the subsequent diffusion of the far IR photons (τL/c).In this way, the value of τ determines the total momentum deposited and correspondsto the total far IR optical depth in the nuclear region; we choose τ = 10 in these calcu-lations. This value of τ is consistent with the fact that even the far-infrared radiationproduced by dust is optically thick at radii ∼ 100 pc during galaxy mergers (e.g.,Thompson et al. 2005). In particular, τ ∼ 10 is motivated by the surface density ofΣ ∼ 3 g cm−2 in the inner ∼ 100 pc near the peak of accretion, and a FIR opacity of

16
∼ 3 cm2 g−1. The exact value of τ does not significantly affect our conclusions, butit does normalize the values of Mvis and MBH (see Eq. 2.4 below).
The strength of the feedback on an individual particle depends not only on theluminosity, but on the number of particles, N , to which the force is being appliedin a given timestep. Our results do not depend strongly on N ; this is because themomentum is quickly shared with the rest of the gas particles via pressure forces.We carried out a number of test problems on the evolution of gaseous shells with theadditional force τL/c; these explicitly show no dependence on N (DeBuhr et. al. inprep).
Computing the accretion rate onto and the feedback from the BH in the simula-tions is prone to noise induced by the stochastic motion of the BH particle. To avoidthis “Brownian” motion, we choose a mass for the BH tracer particle of 2.8× 10⁷M,which is roughly a factor of 100 higher than the other particle masses in the simula-tion. Note that this mass is an artificial dynamical mass for simulation purposes; inaddition to this, we integrate M(t) to determine the “true” MBH . Once the two BHtracers have a separation of 4Racc or smaller, we consider that they would coalesce toform a single BH. Once the tracers merge, the two values of MBH are summed andone of the BH particles is moved to the center of mass of the two tracers, and theother is removed from the region.
2.3 Results
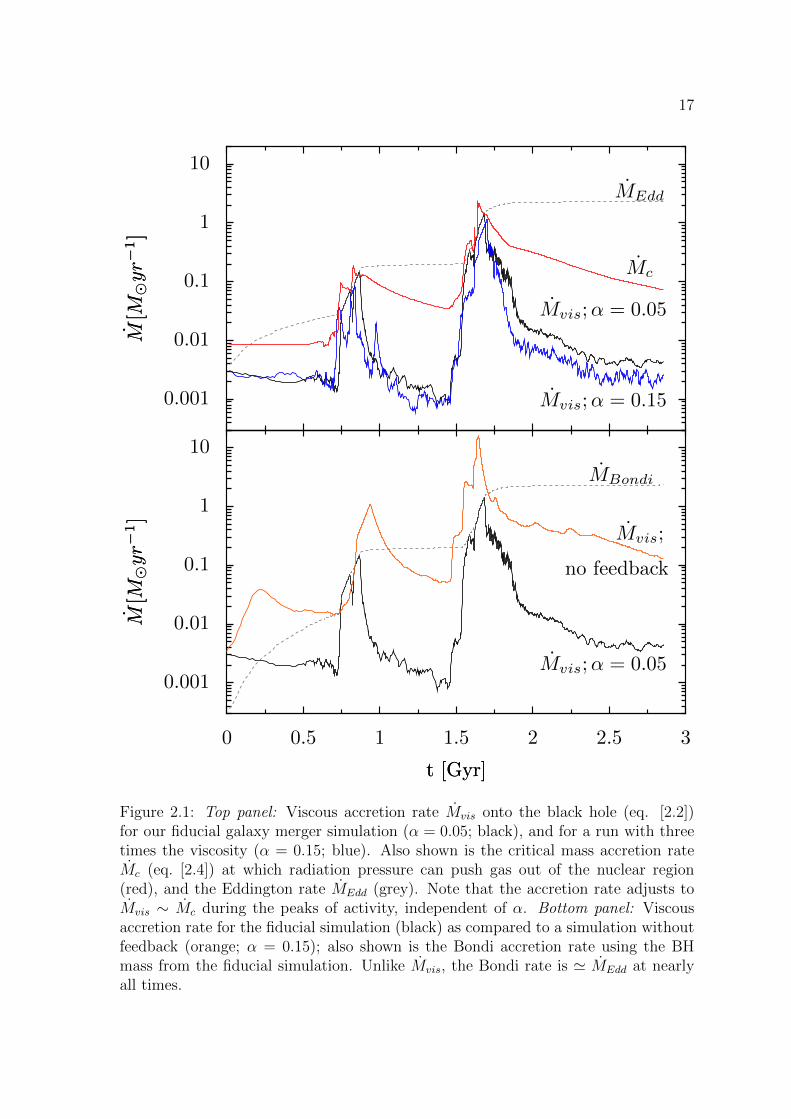
The top panel of Figure 2.1 shows the viscous accretion rate onto the BH for thefiducial run with α = 0.05 (black) and for a run with α = 0.15 (blue). For comparison,the Eddington rate MEdd ≡ LEdd/ηc
2 is shown in grey, using the BH mass as a functionof time from our fiducial simulation. The accretion rate is relatively constant at earlytimes but then peaks during the first close passage of the two galaxies at ∼ 0.75 Gyrand then even more strongly as the two galaxies complete their merger at ∼ 1.6 Gyr;note that M MEdd at both early and late times but reaches ∼ MEdd for ∼ 100Myrs near both first and final passage.
One of the interesting results in Figure 2.1 is that differences in α do not signifi-cantly change the accretion rate onto the BH, particularly near the peaks of activity.This is contrary to what one might expect from the fact that Mvis ∝ α (eq. [2.2]). Theorigin of the weak dependence of Mvis on α is that when the supply of mass is large,feedback from accretion onto the BH regulates the rate at which the BH accretes.Previous work has shown that there is a critical luminosity Lc at which the outwardradiation pressure force due to the central AGN just balances the inward force of grav-ity. For a simple spherically symmetric problem, this is given by τLc/c = 4fgσ
4/G,where fg is the gas fraction in the nuclear region and σ2 = GMt/2Racc, with Mt thetotal mass within Racc (Murray et al., 2005). This in turn implies a critical accretion
17
MBondi
Mvis;
no feedback
Mvis;α = 0.050.001
0.01
0.1
1
10
M[M
⊙yr−
1]
M[M
⊙yr−
1]
0 0.5 1 1.5 2 2.5 3
t [Gyr]t [Gyr]
MEdd
Mc
Mvis;α = 0.05
Mvis;α = 0.150.001
0.01
0.1
1
10
M[M
⊙yr−
1]
M[M
⊙yr−
1]
Figure 2.1: Top panel: Viscous accretion rate Mvis onto the black hole (eq. [2.2])for our fiducial galaxy merger simulation (α = 0.05; black), and for a run with threetimes the viscosity (α = 0.15; blue). Also shown is the critical mass accretion rateMc (eq. [2.4]) at which radiation pressure can push gas out of the nuclear region(red), and the Eddington rate MEdd (grey). Note that the accretion rate adjusts toMvis ∼ Mc during the peaks of activity, independent of α. Bottom panel: Viscousaccretion rate for the fiducial simulation (black) as compared to a simulation withoutfeedback (orange; α = 0.15); also shown is the Bondi accretion rate using the BHmass from the fiducial simulation. Unlike Mvis, the Bondi rate is ' MEdd at nearlyall times.
18
rate Mc
Mc =4fgτηcG
σ4. (2.4)
For L & Lc, the radiation force on gas in the nuclear region exceeds the inward forceof gravity, and thus gas in the vicinity of the BH will be pushed out of the nuclearregion. In our model, the accretion rate is determined by the gas properties withinRacc ' 188 pc; thus if the gas is largely pushed out of the nuclear region, the accretionrate onto the BH decreases. When L . Lc, gravitational torques can drive gas intothe nuclear region towards the BH, thus increasing Mvis. This suggests that theaccretion rate may self-adjust such that Mvis ∼ Mc. To quantify this, the top panelof Figure 2.1 shows Mc computed within 2Racc of the BH for the fiducial calculation(red). The accretion rate is indeed ∼ Mc near the peaks of activity. This highlightsthat although Mvis Mc is certainly possible if there is insufficient gas in the nuclearregions (e.g., after the merger), feedback limits the maximum rate at which the BHcan accrete to be ∼ Mc. One point that we return to below is that although feedbackdoes have a strong effect on the gas dynamics in the galactic nuclei, it is not strongenough to blow large amounts of gas out of the galaxy as a whole.
The bottom panel of Figure 2.1 compares the accretion rate for the fiducial run(black) and a similar run with no BH feedback (orange; α = 0.15). The peak accretionrate is a factor of∼ 10 higher in the case without feedback, and the duration of activityis significantly longer; moreover, Mvis in the absence of feedback is ∝ α and so canbe scaled up or down by arbitrary amounts by varying α, unlike in the presence offeedback (top panel). Also shown in the lower panel is the Bondi accretion rate (grey)with the BH mass set by that in the fiducial run (which uses Mvis). For nearly all ofthe simulation, MBondi ' MEdd, and unlike the simulations of Springel et al. (2005a)or Johansson et al. (2009b), the Bondi rate does not decrease after the final merger,because the ambient gas remains cool and dense.
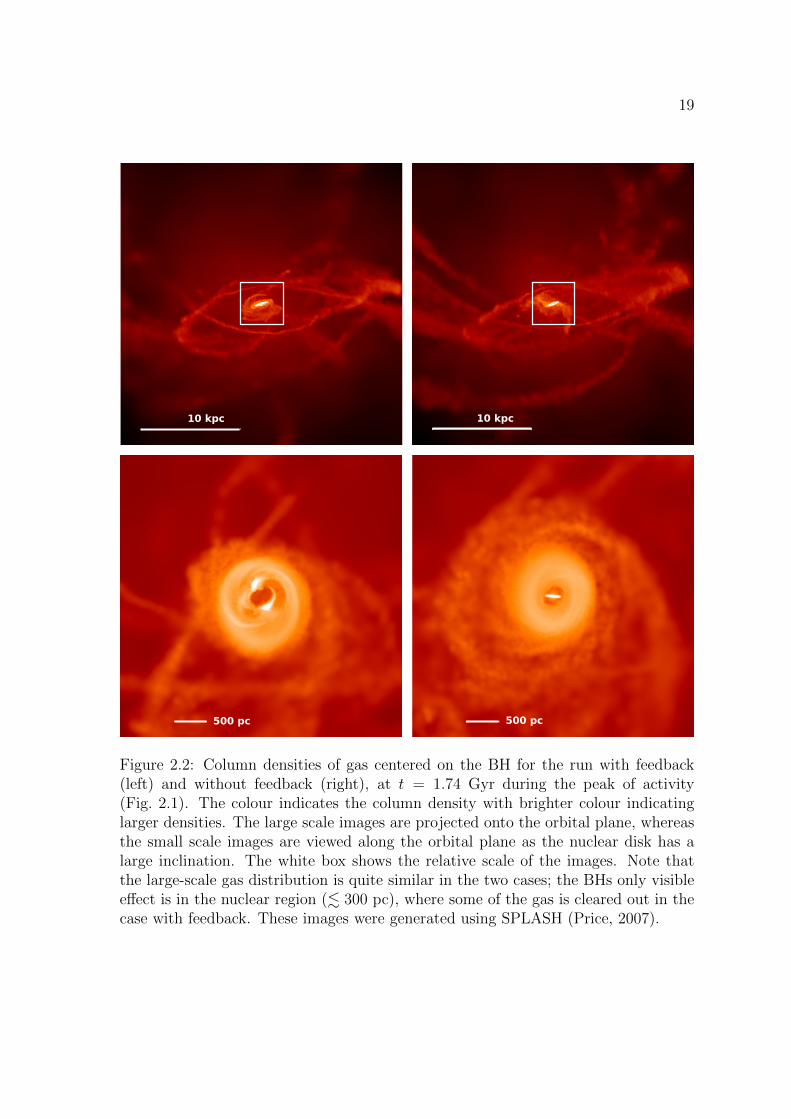
Figure 2.2 shows the column density of gas in the vicinity of the BH for the casewithout feedback (right) and the case with feedback (left) both at the same timeduring the peak of accretion at t = 1.74Gyr. The images are 28.5kpc on a sidein the top row, and 4.28kpc on a side in the bottom row. In the simulation withfeedback, one can see explicitly that the gas has been evacuated from the region nearthe BH (within ∼ Racc), as argued above. These images also demonstrate that thefeedback from the BH does not produce a large-scale blow-out of matter from thegalactic nucleus. More quantitatively, at the end of the simulation, the runs with andwithout feedback have the same mass of gas outside 4Rd to within 10%, and the massthat is at large radii is due to the merger dynamics (e.g., tidal tails) rather than theBH driving a powerful outflow. This is qualitatively consistent with observationalevidence for large reservoirs of atomic and molecular gas in nearby luminous AGNand quasars (Scoville et al., 2003), which have relatively normal kinematics (Ho et al.,2008). By contrast, previous simulations using the Bondi accretion rate and thermalfeedback find that the BH unbinds the remaining gas in the galaxy near the end of
19
10 kpc 10 kpc
500 pc 500 pc
Figure 2.2: Column densities of gas centered on the BH for the run with feedback(left) and without feedback (right), at t = 1.74 Gyr during the peak of activity(Fig. 2.1). The colour indicates the column density with brighter colour indicatinglarger densities. The large scale images are projected onto the orbital plane, whereasthe small scale images are viewed along the orbital plane as the nuclear disk has alarge inclination. The white box shows the relative scale of the images. Note thatthe large-scale gas distribution is quite similar in the two cases; the BHs only visibleeffect is in the nuclear region (. 300 pc), where some of the gas is cleared out in thecase with feedback. These images were generated using SPLASH (Price, 2007).
20
the merger (e.g., Di Matteo et al. 2005) and that this can be important for shuttingoff star formation in ellipticals (Springel et al., 2005b).
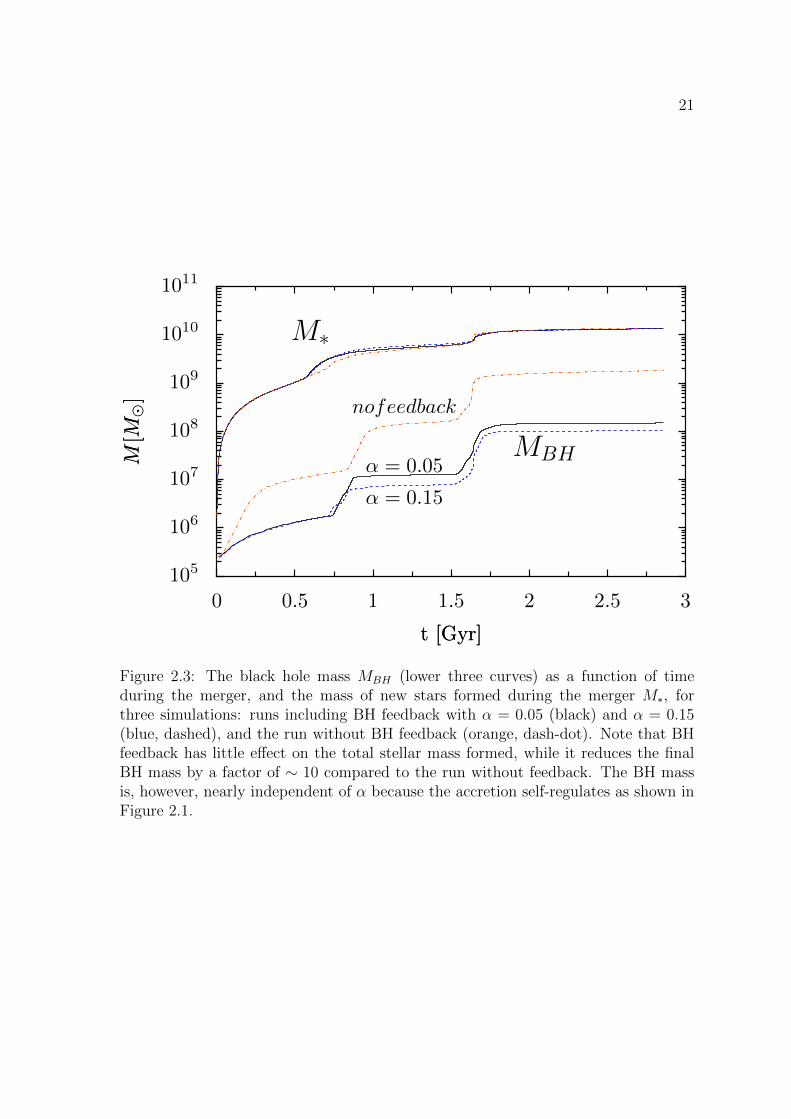
In Figure 2.3 we show the BH mass MBH and the integrated mass of stars formedduring the merger (M∗) for the fiducial simulation (black), the run without feedback(orange, dash-dot), and the run with α = 0.15 (blue, dash). The addition of feedbackchanges the total star formation during the merger by less than 1%. In addition, thefinal BH masses for the two runs with feedback differ by about 30%. This is a furtherconsequence of the self regulated accretion during most stages of the merger. Thereis, of course, freedom in choosing the initial mass of the BH in our calculations, butso long as this is sufficiently small, it does not significantly change the final massof the BH. For the simulations without feedback, the final BH mass is larger thanin the presence of feedback by a factor of ' 10, as would be expected from Figure2.1. In addition, the mass of the BH scales ∝ α in this case. Although we havenot made a quantitative comparison, the small dispersion in BH mass for differentsubgrid accretion models in the presence of feedback appears consistent with thesmall scatter in the MBH −σ relation (while models without feedback would producea larger dispersion in MBH).
2.4 Discussion
The model presented here is a necessarily simplified treatment of the physics oc-curring in the nuclear regions of galaxies. In particular, the choices of α in theaccretion model and of Racc and τ in the model of momentum deposition are some-what uncertain. Changing these values affects some of details of the gas dynamics.For instance, the accretion history of the BH change modestly as we vary Racc andτ . However, it is encouraging that many of the global results of the simulations areinsensitive to these choices. The peak luminosity occurs at the same time and alwaysreaches the Eddington limit. The total stellar mass formed during a merger is essen-tially independent of these parameters and the final BH mass is relatively insensitiveto both Racc and α. Perhaps most interestingly, the peak accretion rate is relativelyindependent of the subgrid accretion model (α) and is instead set by the structure ofthe host galaxy and the feedback physics, reaching the critical rate ∼ Mc at whichradiation pressure balances gravity in the nuclear regions of the galaxy (eq. 2.4).
A clear next step in this modeling effort is to perform radiative transfer calcula-tions simultaneously with the SPH calculation in order to more reliably determinethe radiation pressure force. This would not only eliminate the need to specify theparameters Racc and τ by hand, but would also provide information about the AGNspectrum as a function of time. Detailed comparisons between these results andobservations should allow quantitative tests of the importance of AGN feedback bymomentum deposition during BH growth and galaxy formation.
21
M∗
MBH
nofeedback
α = 0.05
α = 0.15
105
106
107
108
109
1010
1011
M[M
⊙]
M[M
⊙]
0 0.5 1 1.5 2 2.5 3
t [Gyr]t [Gyr]
Figure 2.3: The black hole mass MBH (lower three curves) as a function of timeduring the merger, and the mass of new stars formed during the merger M∗, forthree simulations: runs including BH feedback with α = 0.05 (black) and α = 0.15(blue, dashed), and the run without BH feedback (orange, dash-dot). Note that BHfeedback has little effect on the total stellar mass formed, while it reduces the finalBH mass by a factor of ∼ 10 compared to the run without feedback. The BH massis, however, nearly independent of α because the accretion self-regulates as shown inFigure 2.1.
22
Chapter 3
The Growth of Massive BlackHoles in Galaxy MergerSimulations with Feedback byRadiation Pressure
We study the growth of massive black holes (BH) in galaxies using smoothed par-ticle hydrodynamic simulations of major galaxy mergers with new implementationsof BH accretion and feedback. The effect of BH accretion on gas in its host galaxy ismodeled by depositing momentum at a rate ∼ τL/c into the ambient gas, where L isthe luminosity produced by accretion onto the BH and τ is the wavelength-averagedoptical depth of the galactic nucleus to the AGN’s radiation (a free parameter ofour model). The accretion rate onto the BH is relatively independent of our subgridaccretion model and is instead determined by the BH’s dynamical impact on its hostgalaxy: BH accretion is thus self-regulated rather than “supply limited.” We showthat the final BH mass and total stellar mass formed during a merger are more ro-bust predictions of the simulations than the time dependence of the star formationrate or BH accretion rate. In particular, the latter depend on the assumed interstel-lar medium physics, which determines when and where the gas fragments to formstar clusters; this in turn affects the fuel available for further star formation and BHgrowth. Simulations over a factor of ∼ 30 in galaxy mass are consistent with the ob-served MBH −σ relation for a mean optical depth of τ ∼ 25. This requires that mostBH growth occur when the galactic nucleus is optically thick to far-infrared radiation,consistent with the hypothesized connection between ultra-luminous infrared galaxiesand quasars. We find tentative evidence for a shallower MBH−σ relation in the lowestmass galaxies, σ . 100 km s−1. Our results demonstrate that feedback-regulated BHgrowth and consistency with the observed MBH − σ relation do not require that BHfeedback terminate star formation in massive galaxies or unbind large quantities ofcold gas.
23
3.1 Introduction
Feedback from an active galactic nucleus (AGN) has been invoked to resolve anumber of observational problems in galaxy formation: (1) to explain the tight ob-served correlations (Ferrarese and Merritt, 2000, Gebhardt et al., 2000, Haring andRix, 2004) between central black hole (BH) and galaxy properties, such as theMBH−σand MBH−M∗ relations, and the BH “fundamental plane” (Silk and Rees, 1998, King,2003, Murray et al., 2005, Di Matteo et al., 2005, Sazonov et al., 2005, Hopkins et al.,2007), (2) to shut off star formation in elliptical galaxies (e.g., by blowing gas out ofthe galaxy), thereby explaining how ellipticals become “red and dead” (e.g., Springelet al. 2005b, Ciotti et al. 2010), (3) to heat the hot intracluster plasma (ICM) ingroups and clusters, thereby suppressing cooling and star formation in these environ-ments (e.g., Tabor and Binney 1993, Ciotti and Ostriker 1997, Croton et al. 2006),and (4) to help explain “cosmic downsizing,” namely the fact that both star forma-tion and AGN activity reside in progressively lower mass halos at lower redshifts (e.g.,Scannapieco et al. 2005).
It is plausible that AGN perform the roles desired of them, but this is by no meanscertain. Understanding whether this is indeed the case requires developing moresophisticated theoretical models that can be compared quantitatively to observations.There are several key theoretical problems that must be addressed in order to betterunderstand the role of massive BHs in galaxy formation, and to understand theproperties of massive BHs themselves. The first is the problem of AGN fueling, i.e.,how is gas transferred from galactic scales (∼ 0.1 − 1 kpc) to the vicinity of themassive BH (. 0.1 pc)? A second key problem is the problem of AGN feedback: howdo energy and momentum generated by accretion onto a central BH – in the form ofradiation and outflows – couple to the surrounding gas, and how does this affect starformation and the growth of the BH itself?
Much of the recent work addressing the impact of BHs on galaxy formation hasused qualitatively similar physics (e.g., Springel et al. 2005b, Johansson et al. 2009b).For example, many calculations assume that a BH of mass MBH will accrete mass ata rate proportional to the Bondi rate (Bondi, 1952):
MBondi =4πfG2M2
BHρ
(c2s + v2)3/2
(3.1)
where ρ is the density of the surrounding gas, cs is the sound speed of that gas, v isthe speed of the black hole through the surrounding medium, and f (typically 100) isa factor taking into account the possible multi-phase structure of the gas and that thesphere of influence of the BH is often not resolved (Booth and Schaye, 2009). There is,however, little justification for using equation 3.1. The Bondi accretion rate estimateassumes that the gas surrounding the BH is spherically symmetric. When the gasis not spherically distributed, the rate of angular momentum transport determinesthe BH accretion rate (e.g., Shlosman et al. 1990). It is generally believed that the
24
progenitors of todays & L∗ ellipticals are gas-rich disk galaxies, the mergers of whichlead to luminous starbursts and the growth of the central massive BHs (Sanderset al., 1988, Hopkins et al., 2005). Most of the gas in disk galaxies, merging galaxies,luminous starbursts (Downes and Solomon, 1998, Tacconi et al., 2006), and nearbyluminous AGN (Ho et al., 2008) appears to reside in a rotationally supported disk.There is thus no reason to expect that the spherically symmetric Bondi rate providesa good estimate of the BH accretion rate in gas rich galaxies. Even in the central∼ parsec of own galaxy, where the ambient gas is hot and pressure supported, theBondi accretion rate fails by orders of magnitude to predict the accretion rate ontothe central BH (Sharma et al., 2007).
There are a number of ways that an AGN can strongly influence its surroundings(e.g., Ostriker et al. 2010). Relativistic jets inject energy into intracluster plasmaand may be the primary mechanism suppressing cooling flows in galaxy clusters (Mc-Namara and Nulsen, 2007), even though the details of how the energy in the jetcouples to the plasma in a volume filling way are not fully understood (Vernaleo andReynolds, 2006). On galactic scales, a wind from an accretion disk around the BH candrive gas out of the galaxy (e.g., King 2003) as could cosmic-ray protons produced bya radio loud AGN (Sironi and Socrates, 2010). In addition, the AGN’s radiation canstrongly affect the surrounding gas, both by Compton heating/cooling (e.g., Sazonovet al. 2005) and by the momentum imparted as UV radiation is absorbed by dustgrains (Chang et al., 1987, Sanders et al., 1988, Murray et al., 2005). The presenceof hot outflows can increase the ability of the cold gas clouds to absorb momentumfrom the AGN radiation (Hopkins and Elvis, 2010).
This diversity of feedback mechanisms can be roughly separated into two broadclasses: energy and momentum injection. We believe that momentum injection isthe dominant mode of feedback for most of the gas in a galaxy, largely because ofthe very short cooling times of dense gas. For example, if a BH radiates at ∼ 1046
erg s−1 with a typical quasar spectrum, only gas with n . 1 cm−3 can be heated tothe Compton temperature within ∼ 100 pc. However, the mean gas densities in thecentral ∼ 0.1 − 1 kpc of luminous star forming galaxies are ∼ 103−5cm−3 (Downesand Solomon, 1998, Tacconi et al., 2006). At these densities, the cooling time of gasis sufficiently short that it is unable to retain much injected energy – be it from theAGN’s radiation or from shocks powered by AGN outflows. Thus it is largely themomentum imparted by AGN outflows and by the absorption and scattering of theAGN’s radiation that dominates the impact of the AGN on dense gas in galaxies.Since it is the dense gas that fuels star formation and the growth of the BH itself, itis critical to understand the impact of momentum feedback on this gas.1
In this paper, we present simulations of major mergers of spiral galaxies usinga model for the growth of BHs that includes (1) a BH accretion rate prescription
1These conclusions do not apply to dilute plasma in the intracluster or intragroup medium. Thedensities there are sufficiently low that the plasma can be efficiently heated by an AGN.
25
motivated by the physics of angular momentum transport and (2) AGN feedback viamomentum injection (e.g., radiation pressure). Some results of this model appear ina companion Letter (DeBuhr et al., 2010). The remainder of this paper is organizedas follows. Section 3.2 presents a summary of our methods, including a description ofthe model galaxies (§3.2.1), the model for star formation and the interstellar medium(§3.2.2), our BH accretion and feedback model (§3.2.3) and a summary of our pa-rameter choices (§3.2.4). Section 3.3 shows the results of applying this model to BHgrowth and star formation in major mergers of gas-rich galaxies. In section 3.4 weshow that our model of BH growth and feedback produces a reasonably tight MBH−σcorrelation similar to that observed. Finally, in section 3.5 we discuss our results andcompare our approach to previous models in the literature. Appendix 3.6 presentsresolution tests for our fiducial simulation while Appendix 3.7 presents some of thetests used to verify the BH accretion and feedback models that we have implemented.
3.2 Methodology
We use a non-public update of the TreeSPH code GADGET-2 (Springel, 2005)provided by V. Springel to perform simulations of equal-mass mergers of galaxies.This version of the code includes the effective star formation model of Springel andHernquist (2003) but contains no AGN feedback physics. We modified the codefurther to implement models for massive BH growth and AGN feedback. The detailsof the simulations are described in the following subsections. The Appendices presentresolution tests and some of the tests we performed to verify our implementation ofthe BH accretion and feedback model.
3.2.1 Initial Conditions and Galaxy Parameters
Each model galaxy used in our major merger simulations is similar to those inSpringel et al. (2005a). They include a spherical halo of collisionless dark matter,a centrifugally supported disk of gas and stars, a stellar bulge, and a central pointmass representing a black hole. The code used to generate the initial conditions wasprovided by V. Springel and is identical to that used in Springel et al. (2005a) exceptfor one change that will be described below.
Table 1 lists the relevant galaxy and simulation parameters for the key mergersimulations we focus on in this paper. The simulations are all major mergers of equalmass galaxies. The fiducial simulation (top entry) assumes a mass of 1.94× 10¹²Mfor each merging galaxy, of which 4.1% is assigned to the gas and stars in the disk,1.36% is assigned to the stars in the bulge, and the rest is in a dark matter halo.The initial mass fraction of gas in the disk is fg = 0.1. This run uses a total ofNp = 1.6× 10⁶ particles with 6× 10⁵ dark matter particles, 2× 10⁵ particles each inthe gaseous and stellar disk, and 105 particles for the stellar bulge. This run has a
26
Plummer equivalent gravitational force softening of ε = 47 pc.To test the dependence of the results of our fiducial simulation on the model and
simulation parameters, we have run a number of additional simulations, varying thegas fraction (fg = 0.3 vs 0.1), bulge-to-disk mass ratio (0.2 vs 0.33), total galaxy mass(from 0.1 to 3 of the fiducial value), simulation particle number (from Np = 1.6× 10⁵
to 2.4×10⁶), force softening (ε = 22 to 102 pc), as well as the parameters in the blackhole model (described in § 2.4 below).
We use a Hernquist (Hernquist, 1990) density profile for the structure of the darkmatter halo:
ρhalo(r) =Mhalo
2π
a
r(r + a)3. (3.2)
The scale length a of the halo is set by requiring that the halo enclose the samemass within the virial radius as an NFW profile, and that the densities match atsmall radii. These conditions yield a relationship among the halo scale length, a,the corresponding NFW scale length, rs, and the concentration of the NFW halo, c(Navarro et al., 1996, Springel et al., 2005a): a = rs2[ln (1 + c)− c/(1 + c)]1/2. Thehalos used in this work all have a concentration of c = 9.
The stellar and gaseous disks both initially have exponential surface density pro-files:
Σ(R) =Mi
2πR2d
exp
(− R
Rd
)(3.3)
where Mi is the total mass of the component of interest and Rd is the disk scale length,which is initially the same for the stellar and gaseous disks. The disk scale lengthfor the fiducial simulation is Rd = 3.5 kpc, which corresponds to the disk havingapproximately the same angular momentum per unit mass as a halo with a spinparameter of 0.033. For simulations with different disk masses, we use Rd ∝ M
1/3d ,
which is consistent with the observed relation (Shen et al., 2003). The stellar disk’svertical structure is given by the standard sech2(z/z0) profile, where the vertical scaleheight z0 is initially set to z0 = Rd/5 at all radii. Unlike the stellar disk, the gaseousdisk’s vertical structure is determined by hydrostatic equilibrium given the assumedsound speed/equation of state of the gas (discussed below). Setting up this initialvertical hydrostatic equilibrium requires an iterative procedure that is described inSpringel et al. (2005a).
The stellar bulges also have Hernquist density profiles. The scale length of thebulge Rb is specified as a fraction of the disk scale length, Rd. In the fiducial simula-tion, Rb = Rd/5. For different bulge masses, we use the scaling relation Rb ∝ M
1/2b ,
which is motivated by the observed mass-radius relation of elliptical galaxies (Shenet al., 2003).
In our simulations, two galaxies with identical structure are placed on a progradeorbit. For simulations at our fiducial mass of 1.94 × 10¹²M (for each galaxy), theinitial separation of the two galaxies’ centers is 142.8 kpc. The orbit has approxi-mately zero total energy, which corresponds to an initial velocity for each galaxy of
27
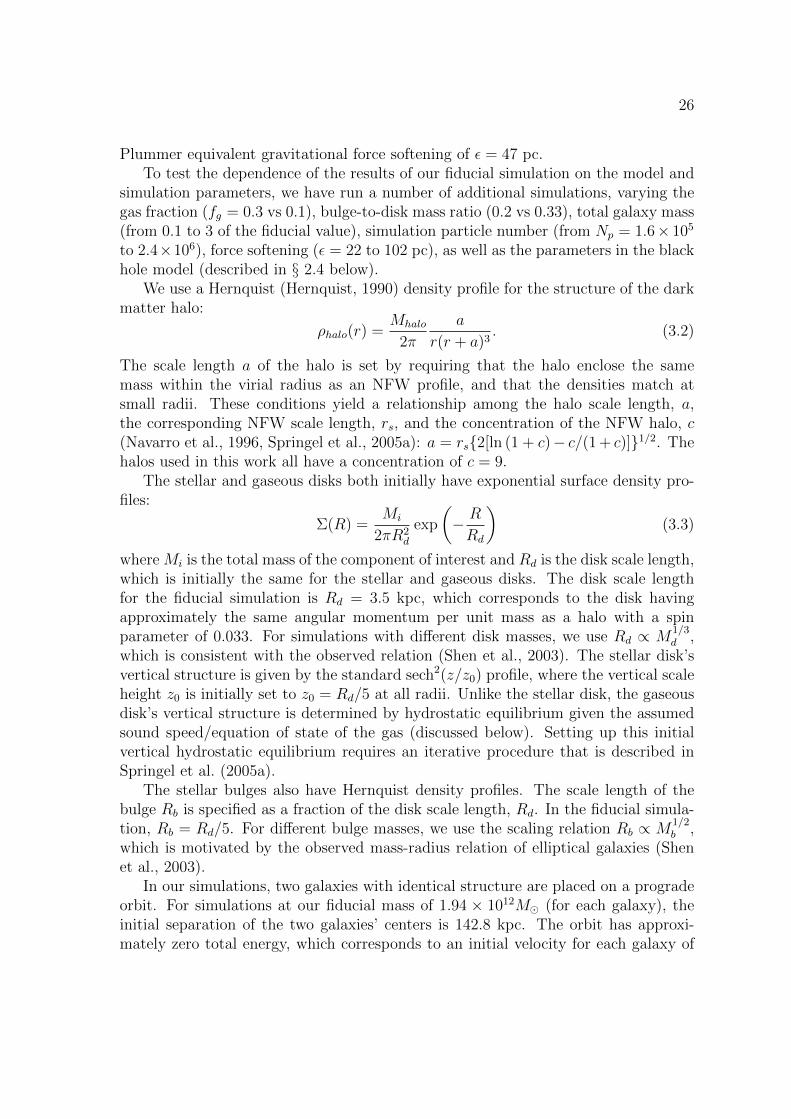
Table 3.1: Simulation ParametersRun Name Mtot fg,0
Mb
MdNp ε Racc
εα τ M∗,new MBH,f MBH,p σf
[Mfid]a [106] [pc] [1010M] [108M] [108M] [kms−1]
fid 1.0 0.1 0.33 1.6 47 4 0.05 10 1.34 1.49 1.33 169fidNofb 1.0 0.1 0.33 1.6 47 4 0.15 0 1.36 18.1 13.5 170fid3a 1.0 0.1 0.33 1.6 47 4 0.15 10 1.34 1.03 0.90 168fid6a 1.0 0.1 0.33 1.6 47 4 0.3 10 1.35 0.86 0.77 167fidTau 1.0 0.1 0.33 1.6 47 4 0.05 3 1.36 5.05 4.31 163fidt25 1.0 0.1 0.33 1.6 47 4 0.05 25 1.35 0.39 0.35 169fid8eps 1.0 0.1 0.33 1.6 47 8 0.05 10 1.35 2.70 1.76 163fidafg 1.0 0.1 0.33 1.6 47 4 *c 10 1.32 1.21 1.02 169fidq2d 1.0 0.1 0.33 1.6 47 4 0.05 10 1.30 1.40 1.16 168fidq07e 1.0 0.1 0.33 1.6 47 4 0.05 10 1.32 1.52 1.36 164big 3.0 0.1 0.33 1.6 68 4 0.05 10 3.08 6.24 5.27 232big6a 3.0 0.1 0.33 1.6 68 4 0.3 10 4.17 7.86 5.15 227mid 0.3 0.1 0.33 1.6 32 4 0.05 10 0.39 0.38 0.26 115small 0.1 0.1 0.33 1.6 22 4 0.05 10 0.13 0.24 0.13 82small6a 0.1 0.1 0.33 1.6 22 4 0.3 10 0.13 0.25 0.24 84smallq07e 0.1 0.1 0.33 1.6 22 4 0.05 10 0.12 0.06 0.05 81fg 1.0 0.3 0.33 2.4 47 4 0.05 10 4.41 7.10 5.53 159smallfg 0.1 0.3 0.33 2.4 22 4 0.05 10 0.36 0.31 0.23 98bulge 1.0 0.1 0.20 1.6 47 4 0.05 10 1.38 1.44 1.25 161LRfid 1.0 0.1 0.33 0.16 102 4 0.05 10 1.34 1.65 0.93 164MRfid 1.0 0.1 0.33 0.48 70 4 0.05 10 1.35 2.92 2.40 168MRfidNofb 1.0 0.1 0.33 0.48 70 4 0.15 0 1.34 13.5 11.4 167LRfidNofb 1.0 0.1 0.33 0.16 102 4 0.15 0 1.31 13.1 11.4 175fidvol 1.0 0.1 0.33 1.6 47 8.62 0.05 10 1.39 3.22 2.45 164MRfidvol 1.0 0.1 0.33 0.48 70 5.97 0.05 10 1.36 3.30 1.92 164
Columns are defined as follows: Mtot is the total mass in the simulation, fg,0 is theinitial gas fraction of the disk, Mb/Md is the bulge to disk mass ratio, Np is the totalnumber of particles used in the simulation, ε is the Plummer equivalent gravitationalforce softening, Racc, α and τ are the parameters of the BH accretion and feedbackmodel (§3.2.3), M∗,new is the total mass of new stars formed during the simulation,MBH,f and MBH,p are the masses of the BH at the end of the simulation and afterthe peak of accretion (defined to be when the accretion rate drops to one tenth itsmaximum value), respectively, and σf is the stellar velocity dispersion of the mergerremnant (§3.4). Differences from the fiducial simulation are indicated with bold type.
aMfid = 3.88× 10¹²M.bThese runs had no AGN feedback.cα was set by the gas fraction within Racc using α = 3f2g .dThe ISM equation of state is defined using qeos = 0.2 (see §3.2.2).eThe ISM equation of state is defined using qeos = 0.07 (see §3.2.2).
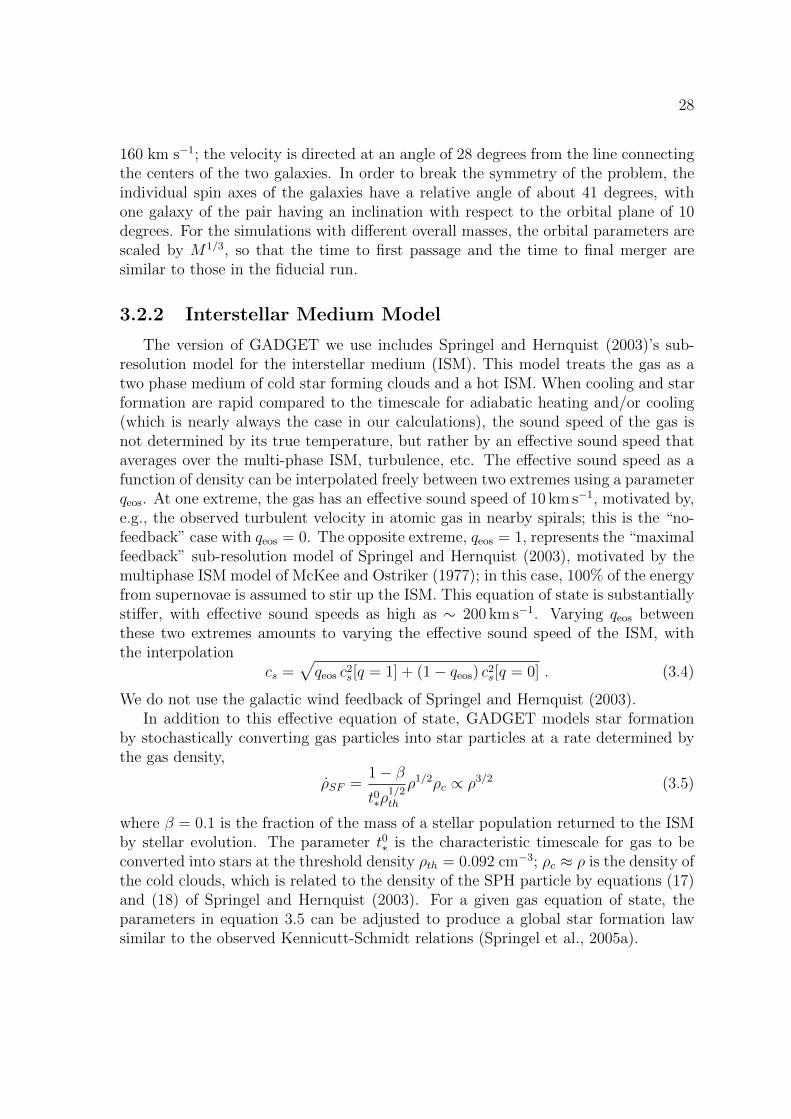
28
160 km s−1; the velocity is directed at an angle of 28 degrees from the line connectingthe centers of the two galaxies. In order to break the symmetry of the problem, theindividual spin axes of the galaxies have a relative angle of about 41 degrees, withone galaxy of the pair having an inclination with respect to the orbital plane of 10degrees. For the simulations with different overall masses, the orbital parameters arescaled by M1/3, so that the time to first passage and the time to final merger aresimilar to those in the fiducial run.
3.2.2 Interstellar Medium Model
The version of GADGET we use includes Springel and Hernquist (2003)’s sub-resolution model for the interstellar medium (ISM). This model treats the gas as atwo phase medium of cold star forming clouds and a hot ISM. When cooling and starformation are rapid compared to the timescale for adiabatic heating and/or cooling(which is nearly always the case in our calculations), the sound speed of the gas isnot determined by its true temperature, but rather by an effective sound speed thataverages over the multi-phase ISM, turbulence, etc. The effective sound speed as afunction of density can be interpolated freely between two extremes using a parameterqeos. At one extreme, the gas has an effective sound speed of 10 km s−1, motivated by,e.g., the observed turbulent velocity in atomic gas in nearby spirals; this is the “no-feedback” case with qeos = 0. The opposite extreme, qeos = 1, represents the “maximalfeedback” sub-resolution model of Springel and Hernquist (2003), motivated by themultiphase ISM model of McKee and Ostriker (1977); in this case, 100% of the energyfrom supernovae is assumed to stir up the ISM. This equation of state is substantiallystiffer, with effective sound speeds as high as ∼ 200 km s−1. Varying qeos betweenthese two extremes amounts to varying the effective sound speed of the ISM, withthe interpolation
cs =√qeos c2
s[q = 1] + (1− qeos) c2s[q = 0] . (3.4)
We do not use the galactic wind feedback of Springel and Hernquist (2003).In addition to this effective equation of state, GADGET models star formation
by stochastically converting gas particles into star particles at a rate determined bythe gas density,
ρSF =1− βt0∗ρ
1/2th
ρ1/2ρc ∝ ρ3/2 (3.5)
where β = 0.1 is the fraction of the mass of a stellar population returned to the ISMby stellar evolution. The parameter t0∗ is the characteristic timescale for gas to beconverted into stars at the threshold density ρth = 0.092 cm−3; ρc ≈ ρ is the density ofthe cold clouds, which is related to the density of the SPH particle by equations (17)and (18) of Springel and Hernquist (2003). For a given gas equation of state, theparameters in equation 3.5 can be adjusted to produce a global star formation lawsimilar to the observed Kennicutt-Schmidt relations (Springel et al., 2005a).
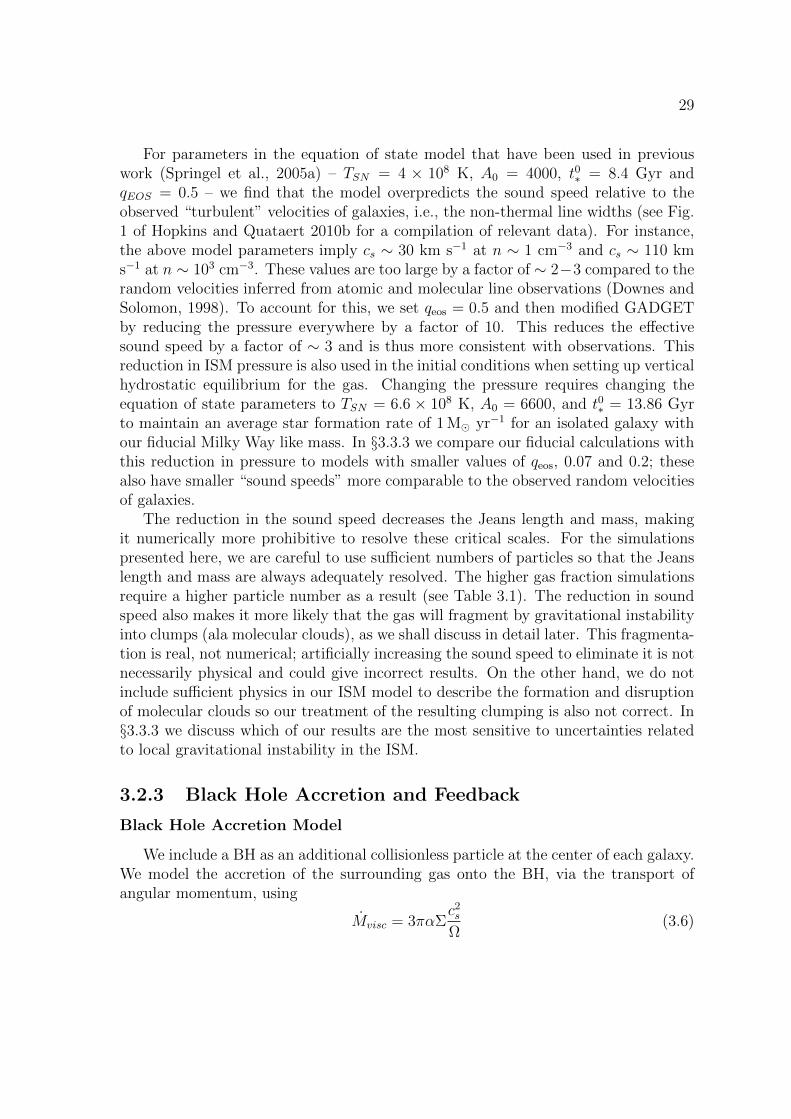
29
For parameters in the equation of state model that have been used in previouswork (Springel et al., 2005a) – TSN = 4 × 10⁸ K, A0 = 4000, t0∗ = 8.4 Gyr andqEOS = 0.5 – we find that the model overpredicts the sound speed relative to theobserved “turbulent” velocities of galaxies, i.e., the non-thermal line widths (see Fig.1 of Hopkins and Quataert 2010b for a compilation of relevant data). For instance,the above model parameters imply cs ∼ 30 km s−1 at n ∼ 1 cm−3 and cs ∼ 110 kms−1 at n ∼ 103 cm−3. These values are too large by a factor of ∼ 2−3 compared to therandom velocities inferred from atomic and molecular line observations (Downes andSolomon, 1998). To account for this, we set qeos = 0.5 and then modified GADGETby reducing the pressure everywhere by a factor of 10. This reduces the effectivesound speed by a factor of ∼ 3 and is thus more consistent with observations. Thisreduction in ISM pressure is also used in the initial conditions when setting up verticalhydrostatic equilibrium for the gas. Changing the pressure requires changing theequation of state parameters to TSN = 6.6 × 10⁸ K, A0 = 6600, and t0∗ = 13.86 Gyrto maintain an average star formation rate of 1 M yr−1 for an isolated galaxy withour fiducial Milky Way like mass. In §3.3.3 we compare our fiducial calculations withthis reduction in pressure to models with smaller values of qeos, 0.07 and 0.2; thesealso have smaller “sound speeds” more comparable to the observed random velocitiesof galaxies.
The reduction in the sound speed decreases the Jeans length and mass, makingit numerically more prohibitive to resolve these critical scales. For the simulationspresented here, we are careful to use sufficient numbers of particles so that the Jeanslength and mass are always adequately resolved. The higher gas fraction simulationsrequire a higher particle number as a result (see Table 3.1). The reduction in soundspeed also makes it more likely that the gas will fragment by gravitational instabilityinto clumps (ala molecular clouds), as we shall discuss in detail later. This fragmenta-tion is real, not numerical; artificially increasing the sound speed to eliminate it is notnecessarily physical and could give incorrect results. On the other hand, we do notinclude sufficient physics in our ISM model to describe the formation and disruptionof molecular clouds so our treatment of the resulting clumping is also not correct. In§3.3.3 we discuss which of our results are the most sensitive to uncertainties relatedto local gravitational instability in the ISM.
3.2.3 Black Hole Accretion and Feedback
Black Hole Accretion Model
We include a BH as an additional collisionless particle at the center of each galaxy.We model the accretion of the surrounding gas onto the BH, via the transport ofangular momentum, using
Mvisc = 3παΣc2s
Ω(3.6)
30
where Σ is the mean gas surface density, Ω is the rotational angular frequency, and αis the dimensionless viscosity (a free parameter of our model). We compute Σ and csby taking an average of the properties of the SPH particles in a sphere of radius Racc
centred on the BH (e.g., Σ = Mg(< Racc)/πR2acc). The radius Racc is typically set
equal to four times the gravitational force softening length, i.e., Racc = 4ε, althoughwe explore alternate choices as well. We find that estimating the rotation rate usingΩ2 ' GM(< Racc)/R
3acc is more numerically robust than actually calculating the
rotation and angular momentum of the gas particles within Racc. One importantfeature of this model is that the region over which the accretion rate is calculated isfixed to be local to the black hole. In previous work (e.g., Springel et al. 2005a), theaccretion rate was computed from the nearest N gas particles to the black hole, evenif most of those particles were physically rather far away.
Although equation (3.6) is reminiscent of the alpha prescription of Shakura andSunyaev (1973), in our formulation α characterizes not only the efficiency of angularmomentum transport, but also the uncertainty due to the fraction of the inflowinggas that is turning into stars vs. being accreted onto the central BH. The physicalmechanisms driving gas from ∼ kpc to ∼ 0.1 pc are not fully understood, but non-axisymmetric gravitational torques (Shlosman et al., 1989, Hopkins and Quataert,2010b), turbulence from supernovae (Hobbs et al., 2010), and clumpy stochastic ac-cretion (Levine et al., 2010) may all be important. Using numerical simulations thatfocus on the nuclei of galaxies (from ∼ 0.1− 100 pc) (Hopkins and Quataert, 2010b)simulate the conditions under which there is significant gas inflow to . 0.1 pc. Theyargue that the net accretion rate is not a strong function of the gas sound speed(unlike both eqns 3.1 and 3.6) because non-axisymmetric gravitational perturbationsproduce orbit crossing and strong shocks in the gas. The resulting inflow rate dependsprimarily on the non-axisymmetry in the potential, rather than the thermodynamicsof the gas. Nonetheless, equation (3.6) evaluated at ∼ 100 pc and with α ∼ 0.1approximates the accretion rate at small radii in their simulations, albeit with sub-stantial scatter (factor of ∼ 10). Given that one of our key results discussed in §3.3is that the accretion rate is not sensitive to the exact value of α, we believe thatequation (3.6) is sufficient for the exploratory calculations in this paper.
Mass of the Black Hole Particle
In our galaxy merger simulations, the two BHs are initially far apart but approacheach other in the late stages of the merger. When the BH particles have a separationof less than Racc we consider them to have merged. When this occurs, we sum theindividual masses of the two BH particles and set one of the particles to have thismass. This particle is then moved to the center of mass of the two BH system andgiven the velocity of the center of mass frame. The other BH particle is removed fromthe region.
The BH particles are subject to stochastic motion due to interaction with the
31
stellar and gaseous particles, which leads to inaccuracy in the position of the BHand noise in the estimate of the accretion rate. To reduce this numerical “Brownian”motion, the BH particles are given a large “tracer” mass of 2×10⁸M for the fiducialsimulation, and scaled with the overall mass for other simulations. As a result, theBH particle is a factor ∼ 100 more massive than the halo particles, and a factor ∼ 104
more massive than the stellar and gaseous particles. We artificially increase the BHparticle mass solely to reduce numerical relaxation effects. This does not result inspurious dynamical effects on the central stars, gas, and dark matter since the BH’ssphere of gravitational influence extends to . 10 pc for the fiducial simulation, whichis significantly smaller than our typical force softening of ∼ 50 pc.
For the results presented below, the “real” mass of the BH (≡MBH) is computedby integrating the accretion rate of equation (3.6) in time. The gas particles are notremoved as the BH mass increases. Instead, the gas particles have an additional labelthat tracks whether or not they have been “consumed.” We track how much mass theBH should have consumed via accretion at a given time, and the mass of gas that hasbeen consumed. When there is a mis-match, we tag a number of gas particles withinRacc (chosen at random) as “consumed” until the total mass accreted by the BH iscorrect. Particles that have been consumed no longer contribute to the accretion rateestimate, even if they are inside Racc. This implementation prevents any gas particlefrom providing more than its mass to the integrated mass of the BH.
Feedback from the Black Hole
In our simulations, the AGN is assumed to couple to the surrounding gas by de-positing momentum into the gas, directed radially away from the BH. This crudelyapproximates the effects of (1) strong outflows and/or cosmic-ray pressure producedby the AGN (King, 2003, Sironi and Socrates, 2010) and (2) radiation pressure pro-duced by the absorption and scattering of the AGN’s radiation by dust in the ISM(Murray et al., 2005). We focus on the latter when motivating the parameters usedin our models.
In reality, the UV radiation from the AGN may well be initially absorbed in thescale of the dusty torus near the central BH (∼ 0.01 pc). However, the optical-IR andX-ray radiation, which also carry an appreciable momentum flux, is initially absorbedat larger radii. To accurately account for the impact of the AGN’s radiation on gas inits host galaxy would require a radiative transport calculation, which is beyond thescope of the current work. Instead, we model this radiation pressure by depositing atotal momentum per unit time of
p = τL
cwhere L = min
(ηMviscc
2, LEdd
)(3.7)
radially away from the BH into the SPH particles within a distance of Racc of theBH particle representing the region over which the IR radiation is absorbed. This
32
momentum is equally distributed among the particles so that each particle experiencesthe same acceleration. We use a radiative efficiency of η = 0.1 in all simulations. Thephysical picture behind our feedback model in equation (3.7) is that the feedbackis produced by the absorption of the ultraviolet light from the AGN by dust in thesurrounding gas, and the subsequent reemission of infrared radiation that must diffuseits way out of the nuclear region. As described shortly, the parameter τ is the totalinfrared optical depth of the nuclear region.
To motivate equation (3.7) in more detail, we note that AGN radiate most of theirradiation in the ultraviolet. The opacity of dusty gas to UV radiation is κUV ∼ 103
cm2 g−1, so that only a surface density of ∼ 10−3 g cm−2 is required to absorb the UVradiation. This is far less than the typical radial column density of gas in the central∼ 0.1−1 kpc of luminous star forming galaxies, galaxy mergers, or our simulations (seeFig. 3.2 below). As a result, the UV radiation is efficiently absorbed, except perhapsalong polar lines of sight. The absorption and scattering of the UV radiation depositsa momentum per unit time of L/c into the ambient gas, assuming for simplicity thatall of the UV radiation is absorbed. If the infrared optical depth is & 1, the infraredradiation re-emitted by the dusty gas must diffuse out through the nuclear region;doing so deposits an additional momentum per unit time of τL/c, where τ ∼ κIRΣ isthe infrared optical depth and κIR ∼ few-10 cm2 g−1 is the infrared opacity for theradiation temperatures of interest ∼ 100− 1000 K. The net force due to the UV andinfrared radiation is thus p ∼ (1 + τ)L/c ' τL/c, i.e. equation (3.7), for τ & 1, whichis valid in our calculations near the peak of activity when the BH gains most of itsmass.
In our calculations we use a constant value of τ rather than a time variable τ givenby τ = κIRΣ. Given the simplicity of our feedback model relative to a true radiativetransfer calculation, this is not an unreasonable approximation. It is also easier toisolate the effects of varying τ when it is constant in time.
As noted above, we apply the force in equation (3.7) to all particles within adistance Racc of the BH. A more accurate treatment would be to apply the force outto the point where the column is ∼ κ−1
IR, i.e., to where the optical depth to infinityis ∼ 1. At many times, however, this radius is unresolved. Moreover, it is possiblethat the photons diffuse primarily along the rotation axis of the gas, rather than inthe orbital plane. As a result, the radiation pressure force will be applied primarilyat small radii. This is why we apply the force only within Racc. One consequence ofthis is that the number of SPH particles experiencing the feedback, N , will changeas gas moves in and out of Racc. Thus, the strength of feedback felt by an individualparticle will change with time. However, because the SPH particles are collisional,they readily share this momentum with neighboring gas particles. In test problemsdescribed in Appendix B the effects of our feedback model are essentially independentof N and Racc. The results are not quite so clean in our full simulations (see §3.3.2and Appendix 3.6), but nonetheless none of our major results depend sensitively onthe region over which the feedback force is applied.
33
One might worry that if the number of particles within Racc were too small, themomentum supplied to a single particle would become large enough to artificiallyaccelerate the particle to the escape velocity. The minimum N required to avoid thisis actually quite modest for the range of luminosities in our calculations, and for thesimulations presented here this concern is never an issue (although it is for some ofthe test problems in Appendix B).
3.2.4 Parameter Choices for the Black Hole Model
Our model for BH growth and feedback contains three free parameters: (1) αdetermines the magnitude of the accretion rate onto the BH; (2) τ determines thetotal radiation pressure force produced by accretion onto the BH; it is roughly theoptical depth to the far IR in the nuclear region; and (3) Racc is the radius of thespherical region within which the accretion rate is determined and the feedback isapplied. Our fiducial values for these parameters are α = 0.05, τ = 10, and Racc = 4 ε(where ε is the gravitational force softening). We now motivate these particularchoices.
The fiducial value of the viscosity used in this work is α = 0.05, motivated bythe rough consistency between the resulting M and Hopkins and Quataert (2010b)’snumerical simulations of gas inflow from ∼ 100 pc to ∼ 0.1 pc (although there isfactor of ∼ 10 scatter in the latter that is not captured here). Hopkins and Quataert(2010b)’s calculations in fact require a more complicated subgrid accretion model thatdepends on additional parameters such as the bulge to disk ratio of the galaxy (be-cause this influences the strength of non-axisymmetric torques); this will be exploredin more detail in future work. In addition to α = 0.05, we also carried out simulationswith α = 0.15 and α = 0.3, and found no significant differences, for reasons explainedbelow.
We use a constant value (with time) of τ = 10 in most of our simulations. This ismotivated by far infrared opacities of κIR ∼ 3 − 10 cm2 g−1 and surface densities ofΣ ∼ 1− 10 g cm−2 within Racc during the peak of activity in our simulations. Thesesurface densities are also consistent with those directly measured in the nuclei of ultra-luminous infrared galaxies (Downes and Solomon, 1998). Given the uncertaintiesassociated with the radiative transfer of far infrared photons in galactic nuclei, itis not possible to more accurately estimate the effective value of τ without detailedradiative transfer calculations. As we shall demonstrate explicitly, however, the exactvalue of τ is also not that critical for the qualitative effects of AGN feedback; thevalue of τ does, however, strongly affect the final value of the BH mass.
In choosing a value for Racc, we must satisfy Racc > ε in order to avoid numericalartifacts. In addition, we find that the BH particle remains within 4ε of the centre ofmass of the system at nearly all times, but it can wander around within this region.As a result, 4ε is the smallest we can make Racc without having noise induced by theBHs motion. This choice corresponds to several hundred pc in our typical simulation.
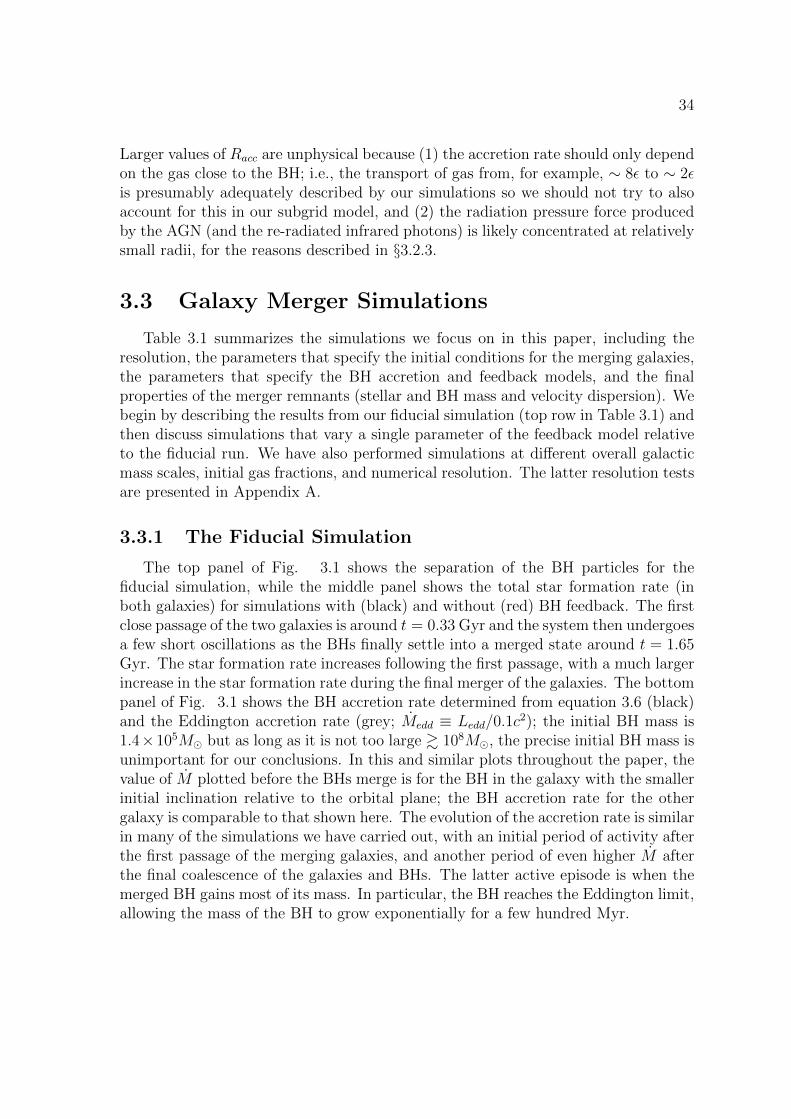
34
Larger values of Racc are unphysical because (1) the accretion rate should only dependon the gas close to the BH; i.e., the transport of gas from, for example, ∼ 8ε to ∼ 2εis presumably adequately described by our simulations so we should not try to alsoaccount for this in our subgrid model, and (2) the radiation pressure force producedby the AGN (and the re-radiated infrared photons) is likely concentrated at relativelysmall radii, for the reasons described in §3.2.3.
3.3 Galaxy Merger Simulations
Table 3.1 summarizes the simulations we focus on in this paper, including theresolution, the parameters that specify the initial conditions for the merging galaxies,the parameters that specify the BH accretion and feedback models, and the finalproperties of the merger remnants (stellar and BH mass and velocity dispersion). Webegin by describing the results from our fiducial simulation (top row in Table 3.1) andthen discuss simulations that vary a single parameter of the feedback model relativeto the fiducial run. We have also performed simulations at different overall galacticmass scales, initial gas fractions, and numerical resolution. The latter resolution testsare presented in Appendix A.
3.3.1 The Fiducial Simulation
The top panel of Fig. 3.1 shows the separation of the BH particles for thefiducial simulation, while the middle panel shows the total star formation rate (inboth galaxies) for simulations with (black) and without (red) BH feedback. The firstclose passage of the two galaxies is around t = 0.33 Gyr and the system then undergoesa few short oscillations as the BHs finally settle into a merged state around t = 1.65Gyr. The star formation rate increases following the first passage, with a much largerincrease in the star formation rate during the final merger of the galaxies. The bottompanel of Fig. 3.1 shows the BH accretion rate determined from equation 3.6 (black)and the Eddington accretion rate (grey; Medd ≡ Ledd/0.1c
2); the initial BH mass is1.4×105M but as long as it is not too large & 108M, the precise initial BH mass isunimportant for our conclusions. In this and similar plots throughout the paper, thevalue of M plotted before the BHs merge is for the BH in the galaxy with the smallerinitial inclination relative to the orbital plane; the BH accretion rate for the othergalaxy is comparable to that shown here. The evolution of the accretion rate is similarin many of the simulations we have carried out, with an initial period of activity afterthe first passage of the merging galaxies, and another period of even higher M afterthe final coalescence of the galaxies and BHs. The latter active episode is when themerged BH gains most of its mass. In particular, the BH reaches the Eddington limit,allowing the mass of the BH to grow exponentially for a few hundred Myr.
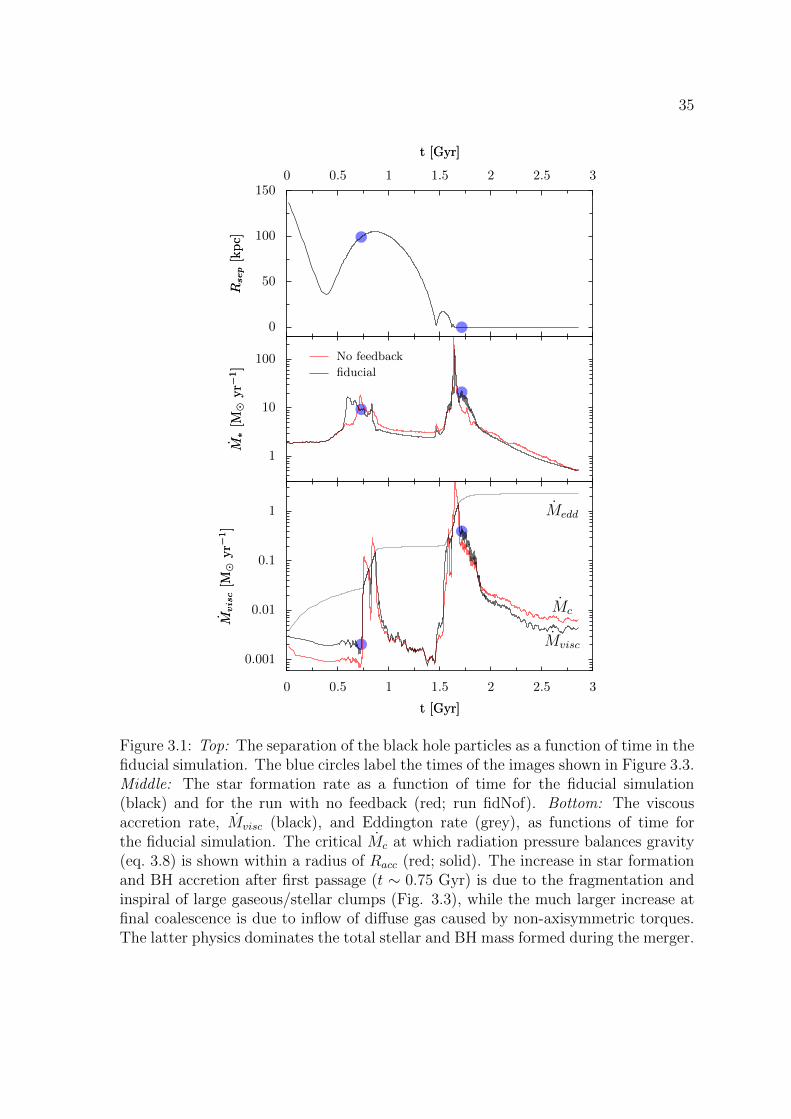
35
Medd
Mc
Mvisc
0.001
0.01
0.1
1
Mvis
c[M
⊙yr−
1]
Mvis
c[M
⊙yr−
1]
0 0.5 1 1.5 2 2.5 3
t [Gyr]t [Gyr]
1
10
100
M∗
[M⊙
yr−
1]
M∗
[M⊙
yr−
1]
No feedback
fiducial
0
50
100
150
Rsep
[kpc]
Rsep
[kpc]
0 0.5 1 1.5 2 2.5 3
t [Gyr]t [Gyr]
Figure 3.1: Top: The separation of the black hole particles as a function of time in thefiducial simulation. The blue circles label the times of the images shown in Figure 3.3.Middle: The star formation rate as a function of time for the fiducial simulation(black) and for the run with no feedback (red; run fidNof). Bottom: The viscousaccretion rate, Mvisc (black), and Eddington rate (grey), as functions of time forthe fiducial simulation. The critical Mc at which radiation pressure balances gravity(eq. 3.8) is shown within a radius of Racc (red; solid). The increase in star formationand BH accretion after first passage (t ∼ 0.75 Gyr) is due to the fragmentation andinspiral of large gaseous/stellar clumps (Fig. 3.3), while the much larger increase atfinal coalescence is due to inflow of diffuse gas caused by non-axisymmetric torques.The latter physics dominates the total stellar and BH mass formed during the merger.
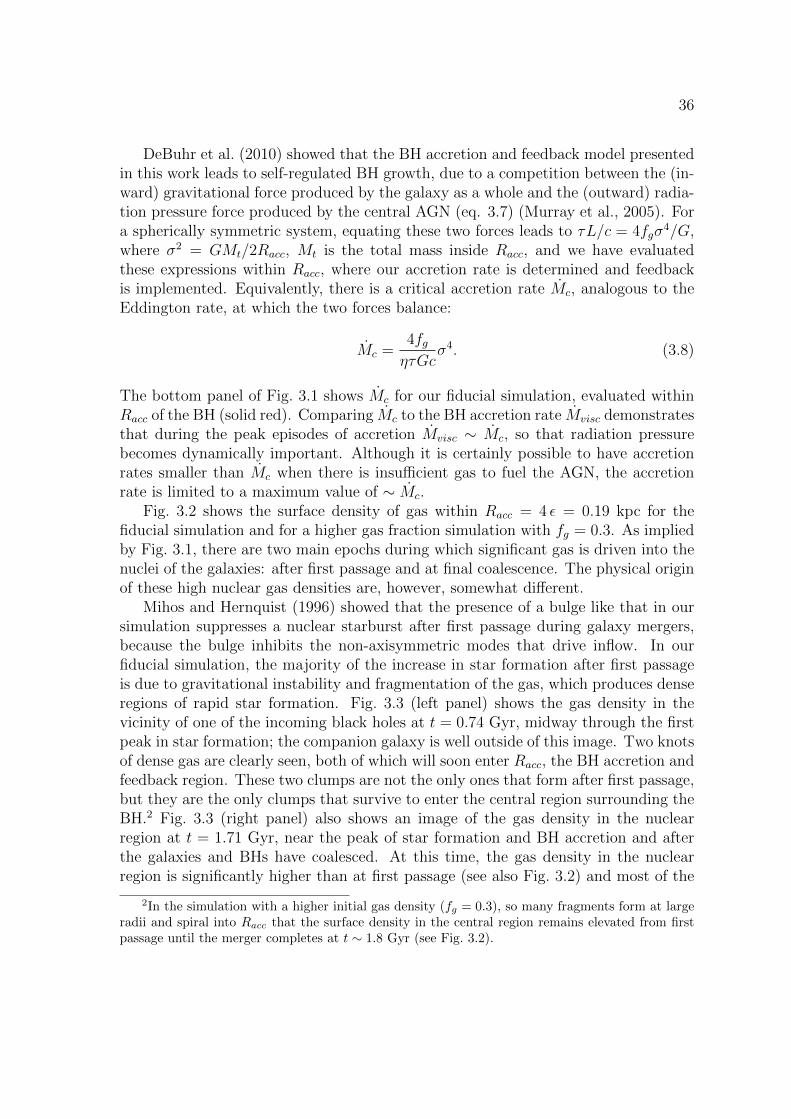
36
DeBuhr et al. (2010) showed that the BH accretion and feedback model presentedin this work leads to self-regulated BH growth, due to a competition between the (in-ward) gravitational force produced by the galaxy as a whole and the (outward) radia-tion pressure force produced by the central AGN (eq. 3.7) (Murray et al., 2005). Fora spherically symmetric system, equating these two forces leads to τL/c = 4fgσ
4/G,where σ2 = GMt/2Racc, Mt is the total mass inside Racc, and we have evaluatedthese expressions within Racc, where our accretion rate is determined and feedbackis implemented. Equivalently, there is a critical accretion rate Mc, analogous to theEddington rate, at which the two forces balance:
Mc =4fgητGc
σ4. (3.8)
The bottom panel of Fig. 3.1 shows Mc for our fiducial simulation, evaluated withinRacc of the BH (solid red). Comparing Mc to the BH accretion rate Mvisc demonstratesthat during the peak episodes of accretion Mvisc ∼ Mc, so that radiation pressurebecomes dynamically important. Although it is certainly possible to have accretionrates smaller than Mc when there is insufficient gas to fuel the AGN, the accretionrate is limited to a maximum value of ∼ Mc.
Fig. 3.2 shows the surface density of gas within Racc = 4 ε = 0.19 kpc for thefiducial simulation and for a higher gas fraction simulation with fg = 0.3. As impliedby Fig. 3.1, there are two main epochs during which significant gas is driven into thenuclei of the galaxies: after first passage and at final coalescence. The physical originof these high nuclear gas densities are, however, somewhat different.
Mihos and Hernquist (1996) showed that the presence of a bulge like that in oursimulation suppresses a nuclear starburst after first passage during galaxy mergers,because the bulge inhibits the non-axisymmetric modes that drive inflow. In ourfiducial simulation, the majority of the increase in star formation after first passageis due to gravitational instability and fragmentation of the gas, which produces denseregions of rapid star formation. Fig. 3.3 (left panel) shows the gas density in thevicinity of one of the incoming black holes at t = 0.74 Gyr, midway through the firstpeak in star formation; the companion galaxy is well outside of this image. Two knotsof dense gas are clearly seen, both of which will soon enter Racc, the BH accretion andfeedback region. These two clumps are not the only ones that form after first passage,but they are the only clumps that survive to enter the central region surrounding theBH.2 Fig. 3.3 (right panel) also shows an image of the gas density in the nuclearregion at t = 1.71 Gyr, near the peak of star formation and BH accretion and afterthe galaxies and BHs have coalesced. At this time, the gas density in the nuclearregion is significantly higher than at first passage (see also Fig. 3.2) and most of the
2In the simulation with a higher initial gas density (fg = 0.3), so many fragments form at largeradii and spiral into Racc that the surface density in the central region remains elevated from firstpassage until the merger completes at t ∼ 1.8 Gyr (see Fig. 3.2).
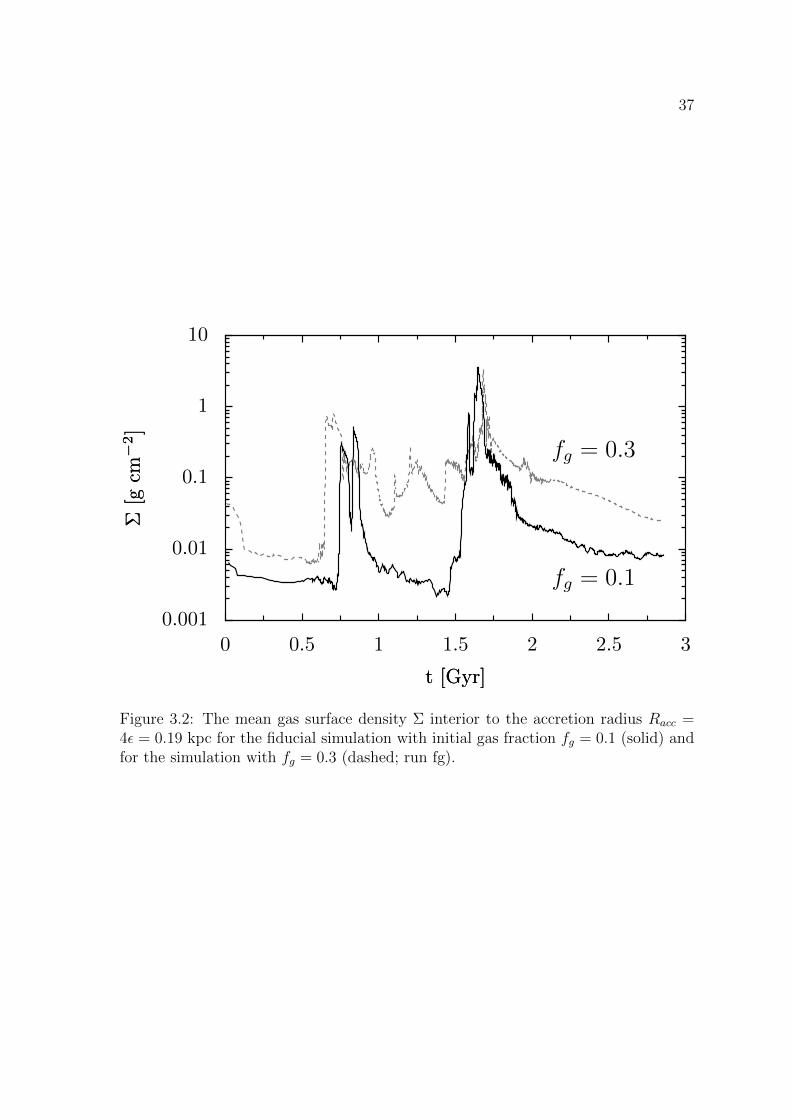
37
fg = 0.3
fg = 0.1
0.001
0.01
0.1
1
10
Σ[g
cm−
2]
Σ[g
cm−
2]
0 0.5 1 1.5 2 2.5 3
t [Gyr]t [Gyr]
Figure 3.2: The mean gas surface density Σ interior to the accretion radius Racc =4ε = 0.19 kpc for the fiducial simulation with initial gas fraction fg = 0.1 (solid) andfor the simulation with fg = 0.3 (dashed; run fg).
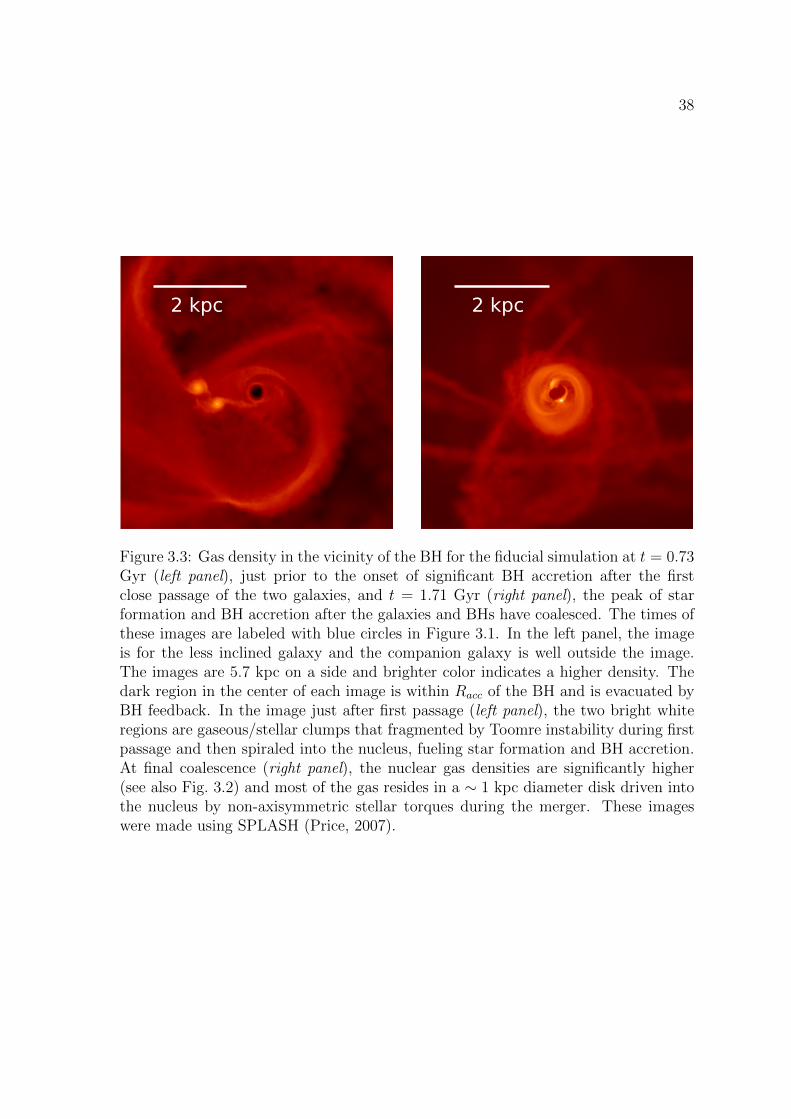
38
2 kpc 2 kpc
Figure 3.3: Gas density in the vicinity of the BH for the fiducial simulation at t = 0.73Gyr (left panel), just prior to the onset of significant BH accretion after the firstclose passage of the two galaxies, and t = 1.71 Gyr (right panel), the peak of starformation and BH accretion after the galaxies and BHs have coalesced. The times ofthese images are labeled with blue circles in Figure 3.1. In the left panel, the imageis for the less inclined galaxy and the companion galaxy is well outside the image.The images are 5.7 kpc on a side and brighter color indicates a higher density. Thedark region in the center of each image is within Racc of the BH and is evacuated byBH feedback. In the image just after first passage (left panel), the two bright whiteregions are gaseous/stellar clumps that fragmented by Toomre instability during firstpassage and then spiraled into the nucleus, fueling star formation and BH accretion.At final coalescence (right panel), the nuclear gas densities are significantly higher(see also Fig. 3.2) and most of the gas resides in a ∼ 1 kpc diameter disk driven intothe nucleus by non-axisymmetric stellar torques during the merger. These imageswere made using SPLASH (Price, 2007).
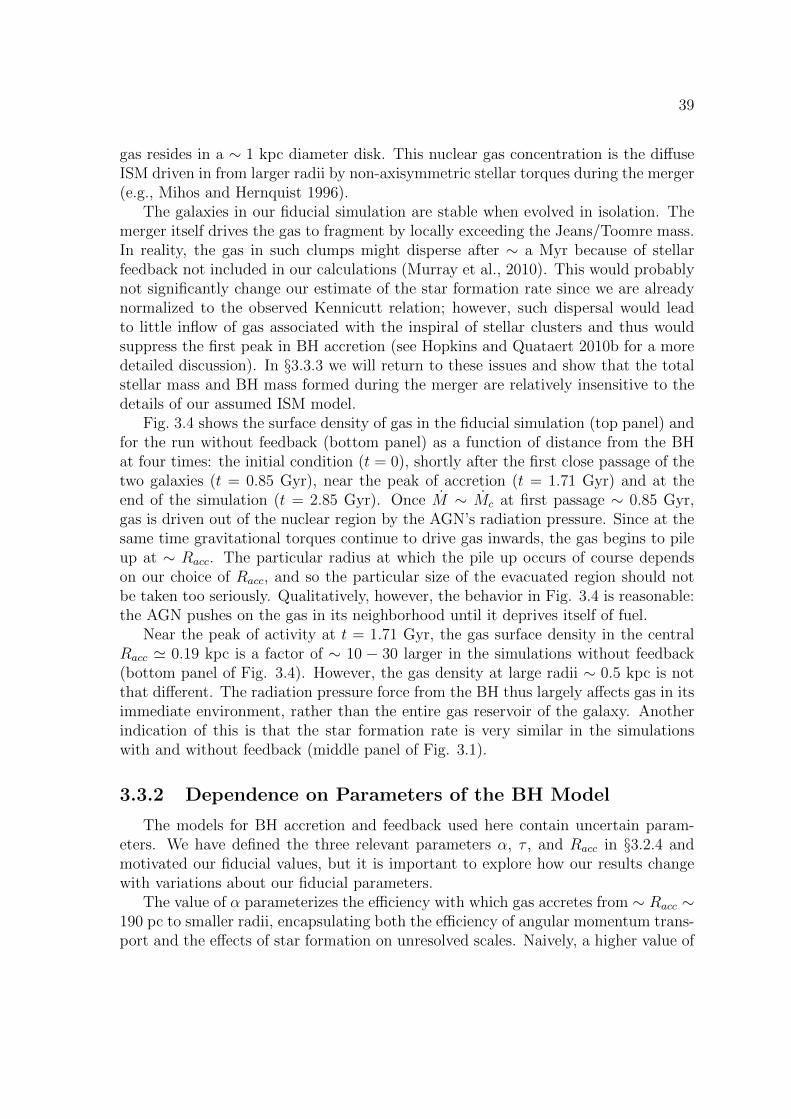
39
gas resides in a ∼ 1 kpc diameter disk. This nuclear gas concentration is the diffuseISM driven in from larger radii by non-axisymmetric stellar torques during the merger(e.g., Mihos and Hernquist 1996).
The galaxies in our fiducial simulation are stable when evolved in isolation. Themerger itself drives the gas to fragment by locally exceeding the Jeans/Toomre mass.In reality, the gas in such clumps might disperse after ∼ a Myr because of stellarfeedback not included in our calculations (Murray et al., 2010). This would probablynot significantly change our estimate of the star formation rate since we are alreadynormalized to the observed Kennicutt relation; however, such dispersal would leadto little inflow of gas associated with the inspiral of stellar clusters and thus wouldsuppress the first peak in BH accretion (see Hopkins and Quataert 2010b for a moredetailed discussion). In §3.3.3 we will return to these issues and show that the totalstellar mass and BH mass formed during the merger are relatively insensitive to thedetails of our assumed ISM model.
Fig. 3.4 shows the surface density of gas in the fiducial simulation (top panel) andfor the run without feedback (bottom panel) as a function of distance from the BHat four times: the initial condition (t = 0), shortly after the first close passage of thetwo galaxies (t = 0.85 Gyr), near the peak of accretion (t = 1.71 Gyr) and at theend of the simulation (t = 2.85 Gyr). Once M ∼ Mc at first passage ∼ 0.85 Gyr,gas is driven out of the nuclear region by the AGN’s radiation pressure. Since at thesame time gravitational torques continue to drive gas inwards, the gas begins to pileup at ∼ Racc. The particular radius at which the pile up occurs of course dependson our choice of Racc, and so the particular size of the evacuated region should notbe taken too seriously. Qualitatively, however, the behavior in Fig. 3.4 is reasonable:the AGN pushes on the gas in its neighborhood until it deprives itself of fuel.
Near the peak of activity at t = 1.71 Gyr, the gas surface density in the centralRacc ' 0.19 kpc is a factor of ∼ 10 − 30 larger in the simulations without feedback(bottom panel of Fig. 3.4). However, the gas density at large radii ∼ 0.5 kpc is notthat different. The radiation pressure force from the BH thus largely affects gas in itsimmediate environment, rather than the entire gas reservoir of the galaxy. Anotherindication of this is that the star formation rate is very similar in the simulationswith and without feedback (middle panel of Fig. 3.1).
3.3.2 Dependence on Parameters of the BH Model
The models for BH accretion and feedback used here contain uncertain param-eters. We have defined the three relevant parameters α, τ , and Racc in §3.2.4 andmotivated our fiducial values, but it is important to explore how our results changewith variations about our fiducial parameters.
The value of α parameterizes the efficiency with which gas accretes from ∼ Racc ∼190 pc to smaller radii, encapsulating both the efficiency of angular momentum trans-port and the effects of star formation on unresolved scales. Naively, a higher value of
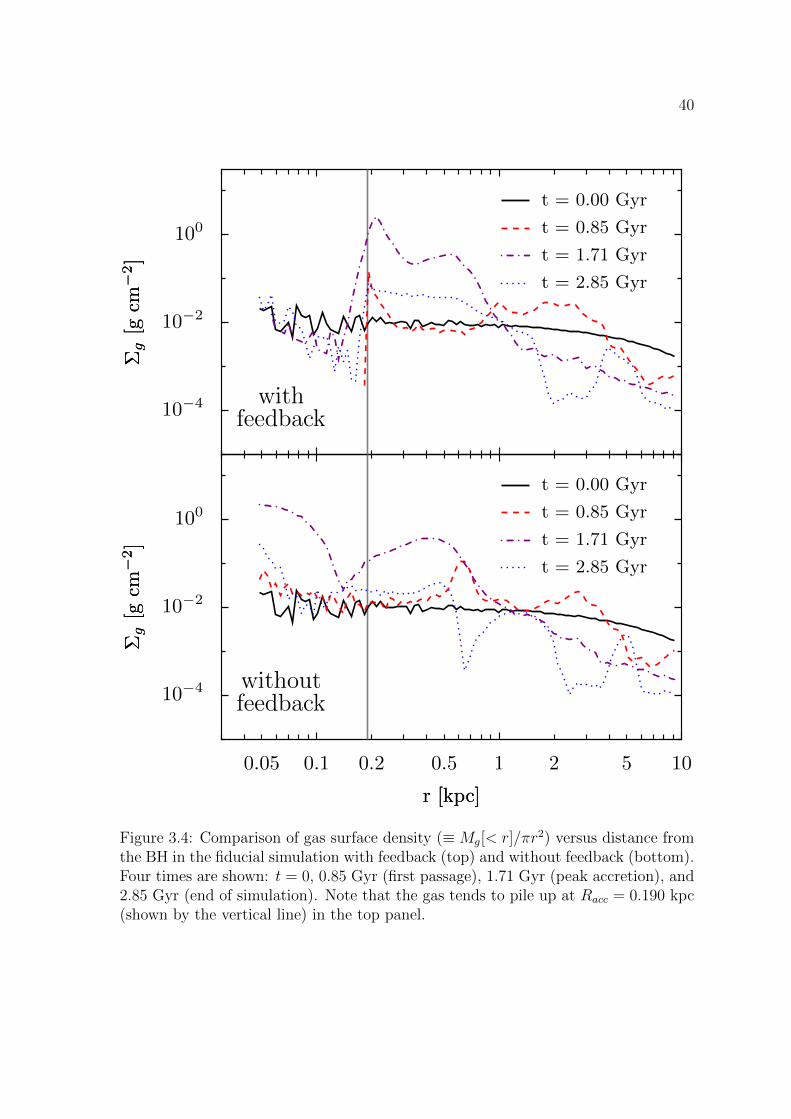
40
withoutfeedback10−4
10−2
100
Σg
[gcm
−2]
Σg
[gcm
−2]
0.05 0.1 0.2 0.5 1 2 5 10
r [kpc]r [kpc]
t = 0.00 Gyr
t = 0.85 Gyr
t = 1.71 Gyr
t = 2.85 Gyr
withfeedback10−4
10−2
100
Σg
[gcm
−2]
Σg
[gcm
−2]
t = 0.00 Gyr
t = 0.85 Gyr
t = 1.71 Gyr
t = 2.85 Gyr
Figure 3.4: Comparison of gas surface density (≡Mg[< r]/πr2) versus distance fromthe BH in the fiducial simulation with feedback (top) and without feedback (bottom).Four times are shown: t = 0, 0.85 Gyr (first passage), 1.71 Gyr (peak accretion), and2.85 Gyr (end of simulation). Note that the gas tends to pile up at Racc = 0.190 kpc(shown by the vertical line) in the top panel.
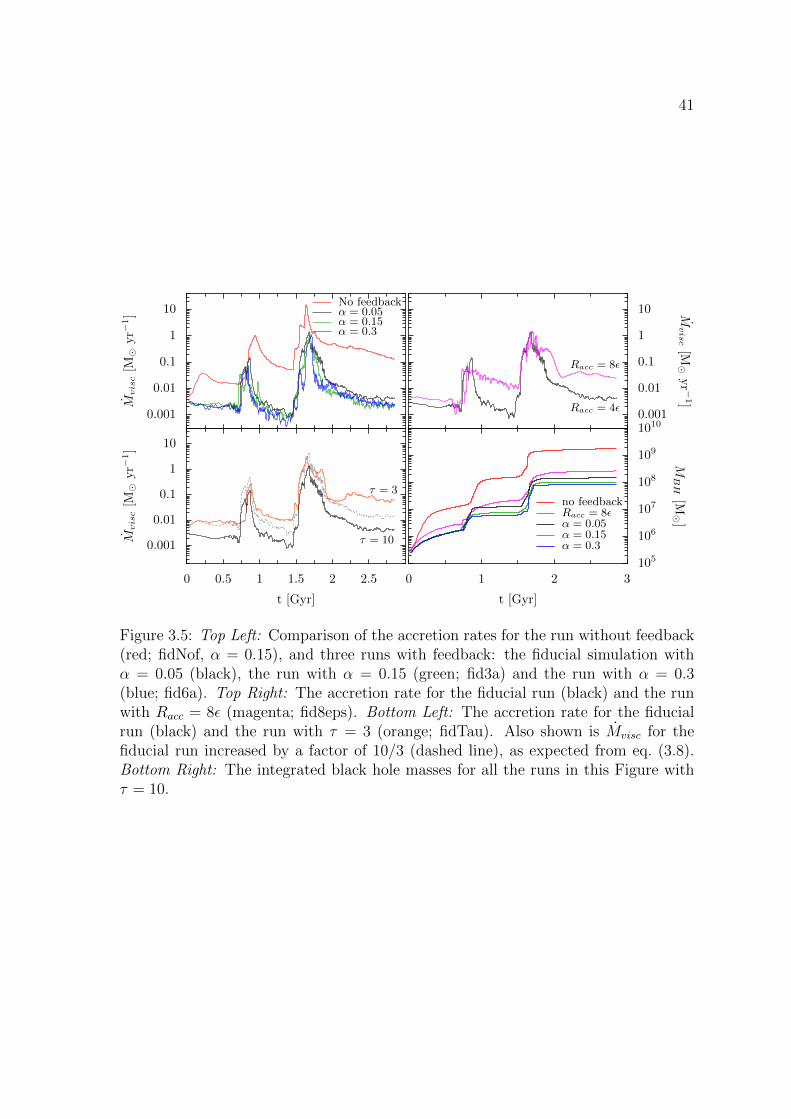
41
τ = 10
τ = 3
0.001
0.01
0.1
1
10
Mvisc[M
yr−
1]
0 0.5 1 1.5 2 2.5
t [Gyr]
0.001
0.01
0.1
1
10
Mvisc[M
yr−
1]
No feedbackα = 0.05α = 0.15α = 0.3
0 1 2 3
t [Gyr]
105
106
107
108
109
1010
MBH
[M]
no feedbackRacc = 8εα = 0.05α = 0.15α = 0.3
Racc = 4ε
Racc = 8ε
0.001
0.01
0.1
1
10 Mvisc[M
yr −
1]
Figure 3.5: Top Left: Comparison of the accretion rates for the run without feedback(red; fidNof, α = 0.15), and three runs with feedback: the fiducial simulation withα = 0.05 (black), the run with α = 0.15 (green; fid3a) and the run with α = 0.3(blue; fid6a). Top Right: The accretion rate for the fiducial run (black) and the runwith Racc = 8ε (magenta; fid8eps). Bottom Left: The accretion rate for the fiducialrun (black) and the run with τ = 3 (orange; fidTau). Also shown is Mvisc for thefiducial run increased by a factor of 10/3 (dashed line), as expected from eq. (3.8).Bottom Right: The integrated black hole masses for all the runs in this Figure withτ = 10.
42
α would lead to a more massive BH. This is, however, not the case, because during theepochs when the BH gains most of its mass, the accretion rate is set by the efficiencyof feedback (eq. 3.8) not by the available mass supply (see Figs 3.1 & 3.4). To demon-strate this more explicitly, the top left panel of Fig. 3.5 compares the BH accretionrates for three simulations with feedback, but differing values of α (0.05, 0.15, and0.3), to the simulation with no feedback, which has α = 0.15. The accretion historiesfor the three values of α are nearly identical. By contrast, the accretion rate is ingeneral much larger in simulations that neglect feedback (and is ∝ α). In addition tothe constant α runs, we tested a model in which α was time variable, set by the localgas fraction near the BH (fidafg2 in Table 3.1): α = 3f 2
g , with fg determined withinRacc (in practice α varied from ∼ 2 × 10⁻⁴ − 0.3). Although this precise functionalform is somewhat arbitrary, such a variation is motivated by analytic arguments andnumerical simulations which show that instabilities due to self-gravity dominate thetransport of gas from ∼ 100 pc inward (Shlosman et al., 1990, Hopkins and Quataert,2010b). For our α = 3f 2
g simulation, we find that the peak accretion rates and finalBH mass are very similar to the constant α simulations. This is consistent with ourconclusion that in the limit of large fuel supply, feedback, rather than the efficiencyof angular momentum transport, sets the rate at which the BH grows.
The parameter τ describes the efficacy of the feedback for a given AGN luminosity.The bottom left panel of Fig. 3.5 compares the BH accretion rate for the fiducial runwith τ = 10 (black) and a simulation with a smaller value of τ = 3 (orange). To theextent that the accretion rate is feedback limited and set by Mc in equation 3.8, Mshould decrease with increasing τ . Physically, this is because larger τ leads to a largerfeedback force, which then requires a smaller accretion rate to provide the luminositynecessary to drive away the surrounding gas. This expectation is borne out by thesimulations. To compare the numerical results with the scaling in equation 3.8, thebottom left panel of Fig. 3.5 also shows M for the fiducial simulation scaled by afactor of 10/3 (dashed line). This scaled M of the fiducial simulation is in reasonablygood agreement with the τ = 3 simulation, particularly at the first and second peaksin M , when most of the BHs mass is accumulated. This demonstrates that the valueof τ does not significantly affect any of the qualitative behavior of how the BH grows,although it does determine the overall value of the BH mass.
In the majority of the simulations presented here, the size of the region over whichwe apply the feedback and average the gas properties to calculate M , Racc, is set to4 ε. The rationale for this choice was given in §3.2.4, but it is important to considerthe effects of changing this value. The top right panel of Fig. 3.5 shows the massaccretion rate for the fiducial simulation and a simulation with Racc = 8ε = 380 pc.The peak values of M and the time of the first and second peaks are reasonablysimilar in the two cases. The principle difference is that in the simulations with thelarger value of Racc, the feedback is less effective at clearing gas out of the nuclearregion (because the force is distributed over a larger number of particles); this allowsa higher level of M to be maintained after the first passage and final coalescence.
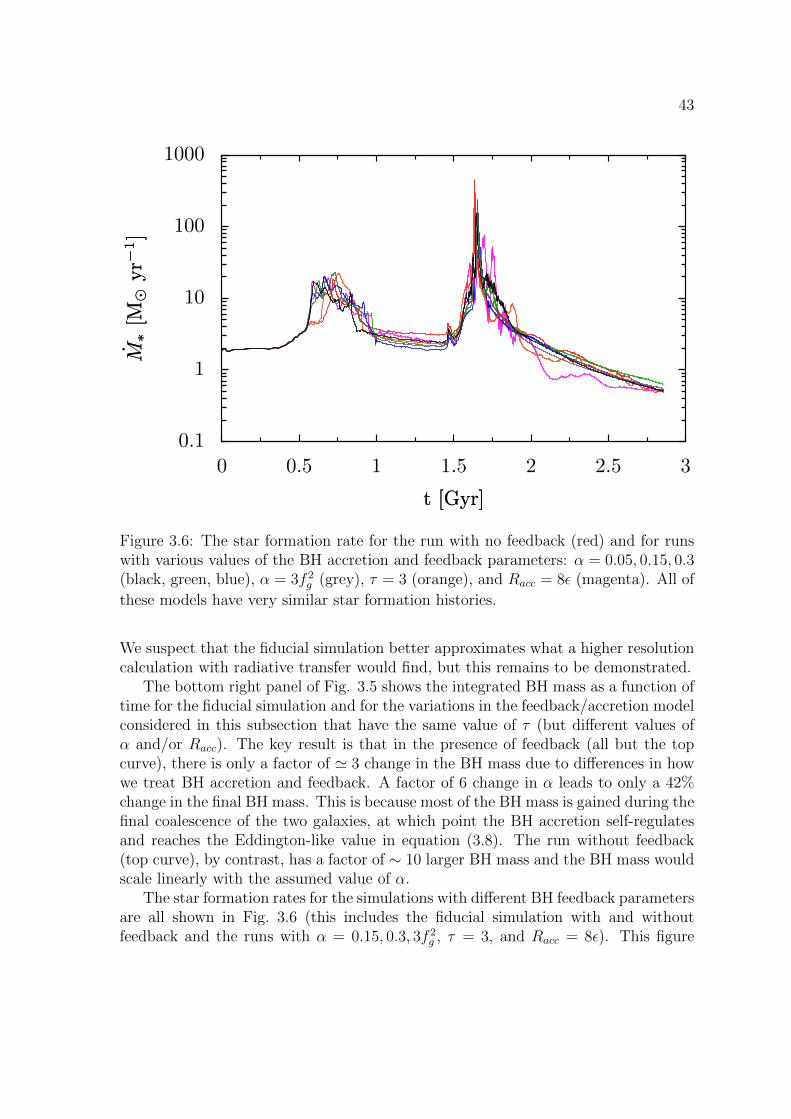
43
0.1
1
10
100
1000M
∗[M
⊙yr−
1]
M∗
[M⊙
yr−
1]
0 0.5 1 1.5 2 2.5 3
t [Gyr]t [Gyr]
Figure 3.6: The star formation rate for the run with no feedback (red) and for runswith various values of the BH accretion and feedback parameters: α = 0.05, 0.15, 0.3(black, green, blue), α = 3f 2
g (grey), τ = 3 (orange), and Racc = 8ε (magenta). All of
these models have very similar star formation histories.
We suspect that the fiducial simulation better approximates what a higher resolutioncalculation with radiative transfer would find, but this remains to be demonstrated.
The bottom right panel of Fig. 3.5 shows the integrated BH mass as a function oftime for the fiducial simulation and for the variations in the feedback/accretion modelconsidered in this subsection that have the same value of τ (but different values ofα and/or Racc). The key result is that in the presence of feedback (all but the topcurve), there is only a factor of ' 3 change in the BH mass due to differences in howwe treat BH accretion and feedback. A factor of 6 change in α leads to only a 42%change in the final BH mass. This is because most of the BH mass is gained during thefinal coalescence of the two galaxies, at which point the BH accretion self-regulatesand reaches the Eddington-like value in equation (3.8). The run without feedback(top curve), by contrast, has a factor of ∼ 10 larger BH mass and the BH mass wouldscale linearly with the assumed value of α.
The star formation rates for the simulations with different BH feedback parametersare all shown in Fig. 3.6 (this includes the fiducial simulation with and withoutfeedback and the runs with α = 0.15, 0.3, 3f 2
g , τ = 3, and Racc = 8ε). This figure
44
demonstrates that the precise parameters of the BH feedback model have little effecton the galaxy-wide properties such as the star formation rate: the total mass of starsformed in simulations with different BH feedback parameters differ by less than 5%.
In previous simulations of BH growth and feedback, AGN feedback acting on densegas in galaxies has been invoked to quench star formation (Springel et al., 2005b).Our results demonstrate, however, that this is by no means guaranteed (we referhere to ‘quasar’ feedback on cold dense gas, not the effect of AGN on hot dilute gasin galaxy groups and clusters). In our calculations BH growth is self-regulated andclosely connected to the properties of the surrounding galaxy (e.g., eq. 3.8). However,the BHs dynamical influence is centered in the galactic nucleus (. 300 pc); as a result,the BH does not significantly alter the star formation history during a merger. Inthis scenario, the merger remnant can nonetheless be relatively quiescent (“red anddead”) because the burst of star formation uses up much of the available gas.
3.3.3 Effects of the ISM Model
Motivated by observations (e.g., Downes and Solomon 1998), we have reducedthe effective sound speed in GADGET’s subgrid ISM model (see §3.2.2). There isnonetheless considerable uncertainty in the accuracy of this (or any other) subgridmodel. To study in more detail the effects of the ISM model on our results, weperformed two additional simulations at our fiducial galaxy mass with the subgridinterpolation parameter qeos = 0.2 and 0.07 (see eq. 3.4), and without the factor of 10reduction in pressure used in our fiducial simulation (an additional simulation withqeos = 0.07 at a lower galaxy mass will be discussed in §3.4).3 The three differentISM models have cs and Q within a factor of ∼ 2 of one another at all radii, with theqeos = 0.2 model having the largest values of cs and Q, and our fiducial model havingthe smallest values. The parameter Q is initially ∼ 3 for our fiducial simulation at thedisk scale length Rd, which is why the merger can induce significant fragmentationof the gas (Fig. 3.3). Given the limited physics included in the subgrid model, we donot believe that it is feasible to unambiguously conclude which of these ISM models ismore realistic. These models thus provide an indication of the systematic uncertaintyintroduced by our treatment of the ISM.
Fig. 3.7 compares the BH accretion history (top panel), the star formation rate(middle), and the integrated BH mass and mass of new stars formed during the merger(bottom) for the three runs with differing ISM models. For both the fiducial run andthe run with qEOS = 0.07 there is significant fragmentation after first passage, whichgenerates the first peak in star formation and BH accretion. By contrast, the runwith qEOS = 0.2 shows no evidence for gas fragmentation or a pronounced peak inactivity at first passage. Despite these differing initial histories, the final result of
3We used TSN = 4× 10⁸ K, A0 = 4000 and t0∗ = 8.4 Gyr for these calculations; these values aredifferent from those in our fiducial simulation, and are chosen to fix the total star formation rate forour isolated fiducial galaxy at 1M yr−1.
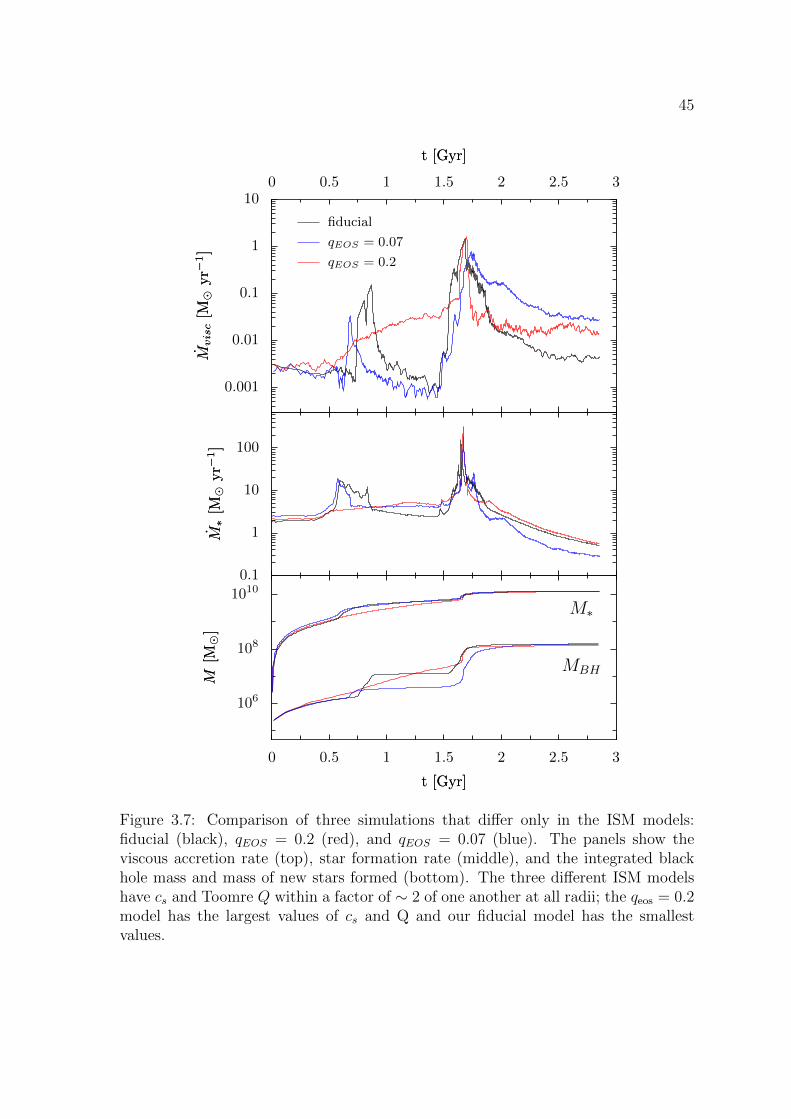
45
MBH
M∗
106
108
1010
M[M
⊙]
M[M
⊙]
0 0.5 1 1.5 2 2.5 3
t [Gyr]t [Gyr]
0.1
1
10
100
M∗
[M⊙
yr−
1]
M∗
[M⊙
yr−
1]
0 0.5 1 1.5 2 2.5 3
t [Gyr]t [Gyr]
0.001
0.01
0.1
1
10M
vis
c[M
⊙yr−
1]
Mvis
c[M
⊙yr−
1]
fiducial
qEOS = 0.07
qEOS = 0.2
Figure 3.7: Comparison of three simulations that differ only in the ISM models:fiducial (black), qEOS = 0.2 (red), and qEOS = 0.07 (blue). The panels show theviscous accretion rate (top), star formation rate (middle), and the integrated blackhole mass and mass of new stars formed (bottom). The three different ISM modelshave cs and Toomre Q within a factor of ∼ 2 of one another at all radii; the qeos = 0.2model has the largest values of cs and Q and our fiducial model has the smallestvalues.
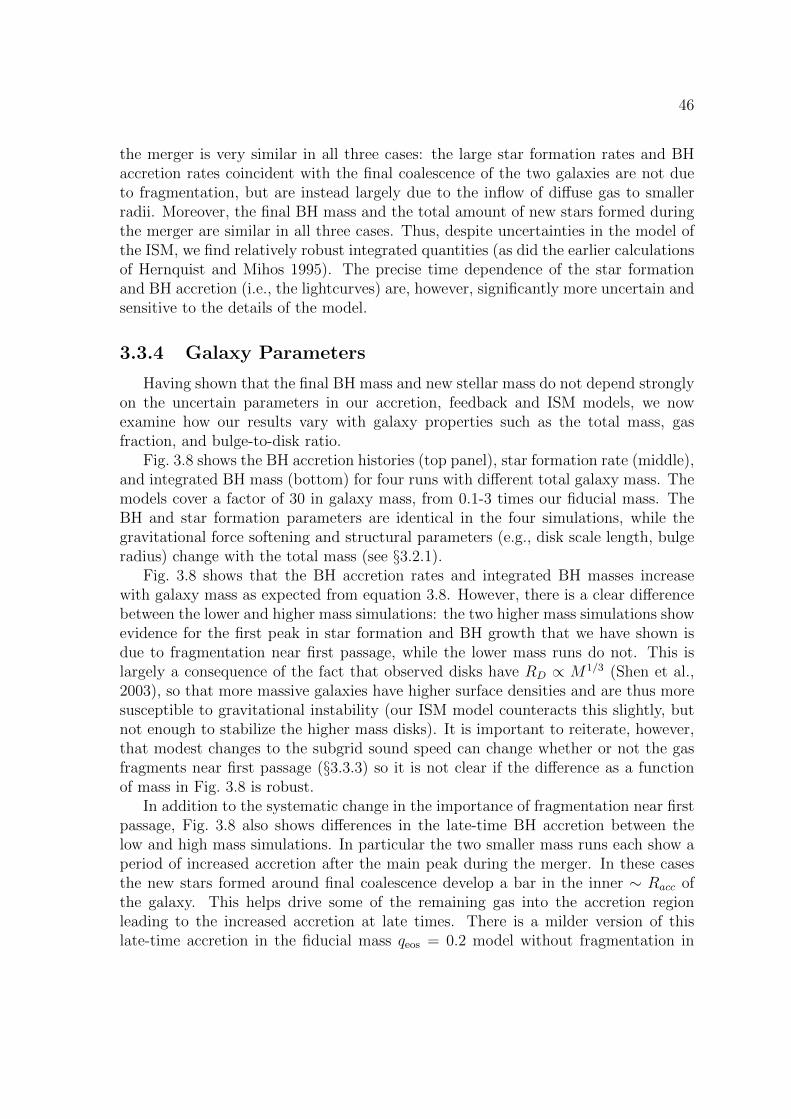
46
the merger is very similar in all three cases: the large star formation rates and BHaccretion rates coincident with the final coalescence of the two galaxies are not dueto fragmentation, but are instead largely due to the inflow of diffuse gas to smallerradii. Moreover, the final BH mass and the total amount of new stars formed duringthe merger are similar in all three cases. Thus, despite uncertainties in the model ofthe ISM, we find relatively robust integrated quantities (as did the earlier calculationsof Hernquist and Mihos 1995). The precise time dependence of the star formationand BH accretion (i.e., the lightcurves) are, however, significantly more uncertain andsensitive to the details of the model.
3.3.4 Galaxy Parameters
Having shown that the final BH mass and new stellar mass do not depend stronglyon the uncertain parameters in our accretion, feedback and ISM models, we nowexamine how our results vary with galaxy properties such as the total mass, gasfraction, and bulge-to-disk ratio.
Fig. 3.8 shows the BH accretion histories (top panel), star formation rate (middle),and integrated BH mass (bottom) for four runs with different total galaxy mass. Themodels cover a factor of 30 in galaxy mass, from 0.1-3 times our fiducial mass. TheBH and star formation parameters are identical in the four simulations, while thegravitational force softening and structural parameters (e.g., disk scale length, bulgeradius) change with the total mass (see §3.2.1).
Fig. 3.8 shows that the BH accretion rates and integrated BH masses increasewith galaxy mass as expected from equation 3.8. However, there is a clear differencebetween the lower and higher mass simulations: the two higher mass simulations showevidence for the first peak in star formation and BH growth that we have shown isdue to fragmentation near first passage, while the lower mass runs do not. This islargely a consequence of the fact that observed disks have RD ∝ M1/3 (Shen et al.,2003), so that more massive galaxies have higher surface densities and are thus moresusceptible to gravitational instability (our ISM model counteracts this slightly, butnot enough to stabilize the higher mass disks). It is important to reiterate, however,that modest changes to the subgrid sound speed can change whether or not the gasfragments near first passage (§3.3.3) so it is not clear if the difference as a functionof mass in Fig. 3.8 is robust.
In addition to the systematic change in the importance of fragmentation near firstpassage, Fig. 3.8 also shows differences in the late-time BH accretion between thelow and high mass simulations. In particular the two smaller mass runs each show aperiod of increased accretion after the main peak during the merger. In these casesthe new stars formed around final coalescence develop a bar in the inner ∼ Racc ofthe galaxy. This helps drive some of the remaining gas into the accretion regionleading to the increased accretion at late times. There is a milder version of thislate-time accretion in the fiducial mass qeos = 0.2 model without fragmentation in
47
105
106
107
108
109
MB
H[M
⊙]
MB
H[M
⊙]
0 0.5 1 1.5 2 2.5 3
t [Gyr]t [Gyr]
0.01
0.1
1
10
100
M∗
[M⊙
]M
∗[M
⊙]
0 0.5 1 1.5 2 2.5 3
t [Gyr]t [Gyr]
10−4
10−3
10−2
10−1
100
101
Mvis
c[M
⊙yr−
1]
Mvis
c[M
⊙yr−
1]
Mtot = 3Mfid
Mtot = Mfid
Mtot = 0.3Mfid
Mtot = 0.1Mfid
Figure 3.8: Comparison of four simulations that differ only in the total galaxy mass:Mfid = 3.88 × 10¹²M (fiducial; black), 3Mfid (red), 0.3Mfid (blue), and 0.1Mfid
(magenta). The three panels show the viscous accretion rate (top), star formationrate (middle), and the integrated black hole mass (bottom). The same parametersare used in the BH accretion and feedback models.
48
Fig. 3.7. Interestingly, there is no analogous late-time inflow of gas to within Racc
in our low mass galaxy simulations without BH feedback. The late-time activity isalso particularly sensitive to the accretion model at a time when the non-axisymmetryproduced by the merger has died away (so that α may in reality decrease significantly).For these reasons, we regard the late time growth in Fig. 3.8 as an interesting deviationfrom self-similarity in the dynamics, but not necessarily a particularly robust one. Oneimportant point that this highlights, however, is that because our implementation ofBH growth and feedback does not unbind a significant amount of cold gas at latetimes (unlike calculations by Springel et al. 2005b), the predictions of our model aremore sensitive to the post galaxy coalescence physics.
In addition to the fiducial gas fraction (fg = 0.1) simulations that we have largelyfocused on, we performed simulations with an initial gas fraction of fg = 0.3 for ourfiducial galaxy mass and at one tenth this mass. The qualitative difference in behaviorwith galaxy mass in Fig. 3.8 persists in the higher gas fraction runs. In particular,in the low mass fg = 0.3 simulation, the gas does not fragment, while it does in thehigher mass fg = 0.3 simulation. Fig. 3.2 – discussed in §3.3.1 – explicitly shows theincrease in the gas surface density within Racc produced by this at early times.
A final property of the galaxy model that we varied was the bulge to disk massratio. The majority of our runs include a bulge with one third the mass of the disk;we also ran one simulation with an initial bulge of one fifth the disk mass, at thefiducial galaxy mass. The final BH mass and total mass of stars formed differ by lessthan 3% each compared to the fiducial simulation.
3.4 The MBH − σ Correlation
Previous numerical studies using models of BH growth and feedback different fromthose considered here have reproduced a number of the observed correlations betweenmassive BHs and their host galaxies (e.g., Di Matteo et al. 2005, Sazonov et al. 2005,Younger et al. 2008). Younger et al. (2008) argue that the galaxy-BH correlations insimulations (in particular, the BH fundamental plane) are relatively independent ofthe trigger of BH growth, be it minor mergers, major mergers, or global instabilitiesof galactic disks. Based on the calculations to date, however, it is unclear to whatextent the simulated BH-galaxy correlations depend on the details of the BH feedbackor accretion models. In this section we assess this question by quantifying the MBH
- σ relation produced in our models.We define σ of our model galaxies using a method analogous to that of observers:
we first project the mass density of the stellar particles into cylindrical bins, andcompute the half-mass(light) radius Re. We then compute the velocity dispersion
49
weighted by the surface brightness via
σ2 =
∫ Re
Rminσ2los(R)I(R)RdR∫ Re
RminI(R)RdR
(3.9)
where I(R) is the projected 2-d stellar mass profile, σlos is the line of sight velocitydispersion, and Rmin = 2ε to ensure that there are that no artificial effects introducedby the force softening. We repeat this calculation along 1000 lines of sight withrandom viewing angles through the center of mass of the merger remnant. The σquoted in this paper and listed in Table 1 is the median value over the 1000 lines ofsight.
Fig. 3.9 shows the correlation between the final BH mass MBH,f and the σ ofthe merged galaxy for most of the simulations in Table 3.1: different total galaxymasses (black; fid, small, mid, big), different values of the accretion parameter α (redcircle; fid3a, fid6a, fidafg, big6a, small6a), alternate ISM models (red x; fidq2, fidq07,smallq07), higher gas fraction (blue square; fg, smallfg), alternate bulge mass (redsquare; bulge), different values of τ (blue circle; fidTau, fidt25), and the resolutionstudies in Appendix A (grey; LRfid, MRfid, MRfidvol, fid8eps, fidvol). The solid lineindicates the mean relation from the compilation of observational results in Gultekinet al. (2009) while the dotted lines are the 1−σ error bars. We have linearly rescaledall of our final BH masses to a value of τ = 25, using the fact that both the analyticand numerical results are consistent with Mvisc and MBH,f being ∝ τ−1. The valueof τ = 25 is chosen so that the rescaled fiducial simulation lies approximately on theMBH − σ relation of Gultekin et al. (2009). For our fiducial simulation carried outwith τ = 3 and τ = 10, a linear scaling of MBH,f with τ−1 is accurate to about 2%(e.g., Table 3.1 and Fig. 3.5). We also carried out our fiducial simulation with τ = 25;this is consistent with a linear scaling of MBH,f from τ = 3 to ∼ 50% (Table 3.1).For nearly all of our simulations, rescaling to τ = 25 amounts to dividing the finalBH mass by a factor of 2.5.
Previous analytic arguments were able to reproduce the MBH − σ relation withτ ∼ 1, rather than requiring τ ∼ 25 as we do here (e.g., King 2003, Murray et al.2005). These calculations, however, assumed fg = 0.1. While perhaps appropriate onaverage, this is not appropriate in galactic nuclei where the gas densities are higher.The analytic derivations also assumed that BH growth terminated when the systemreached the luminosity (accretion rate) at which radiation pressure balances gravity(eq. 3.8). In reality, however, the luminosity must exceed this critical value by a factorof several in order for gas to be efficiently pushed around in the galactic nucleus (asshown explicitly in the test problems in the Appendix). Moreover, the BH continuesto accrete some mass even after reaching Mc. Fig. 3.10 shows this explicitly via theratio of the final BH mass to the BH mass at the peak of activity for all of thesimulations in Fig. 3.9.4 The net effect of the differences between our simulations and
4To account for the fluctuating nature of the BH accretion rate in some of the simulations, we
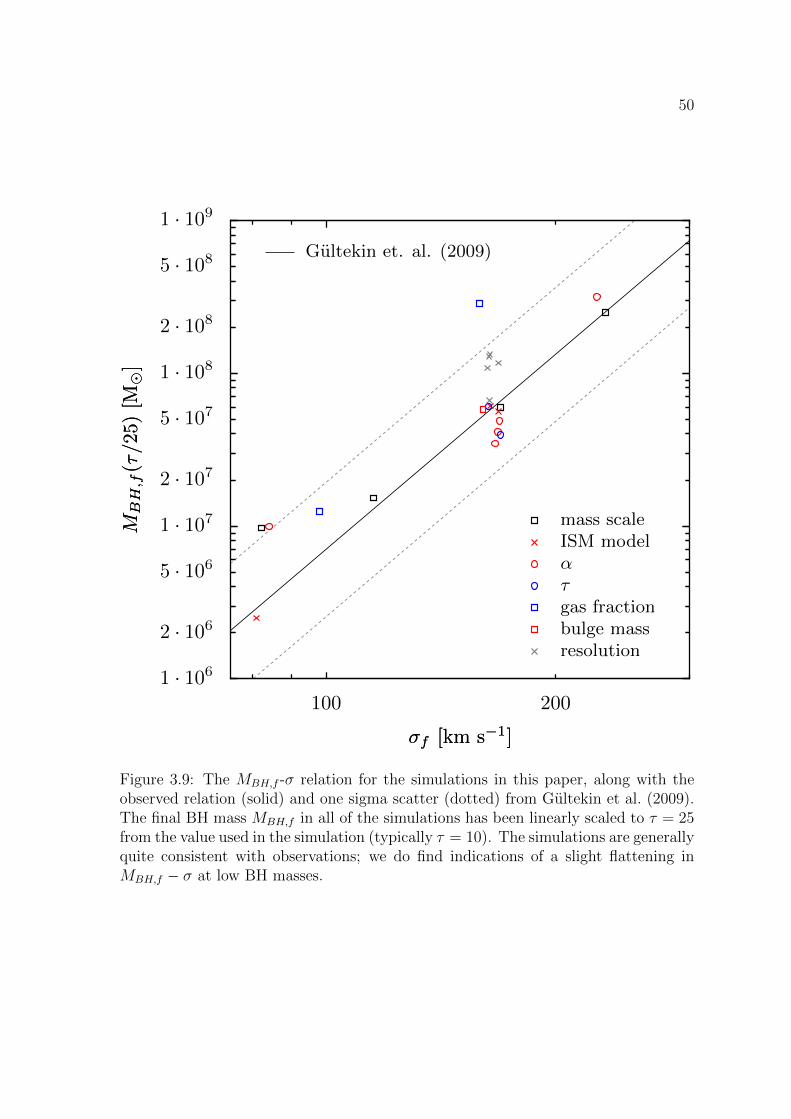
50
1 · 106
2 · 106
5 · 106
1 · 107
2 · 107
5 · 107
1 · 108
2 · 108
5 · 108
1 · 109
MB
H,f
(τ/25)
[M⊙
]M
BH
,f(τ
/25
)[M
⊙]
100 200
σf [km s−1]σf [km s−1]
Gultekin et. al. (2009)
mass scaleISM modelατgas fractionbulge massresolution
Figure 3.9: The MBH,f -σ relation for the simulations in this paper, along with theobserved relation (solid) and one sigma scatter (dotted) from Gultekin et al. (2009).The final BH mass MBH,f in all of the simulations has been linearly scaled to τ = 25from the value used in the simulation (typically τ = 10). The simulations are generallyquite consistent with observations; we do find indications of a slight flattening inMBH,f − σ at low BH masses.
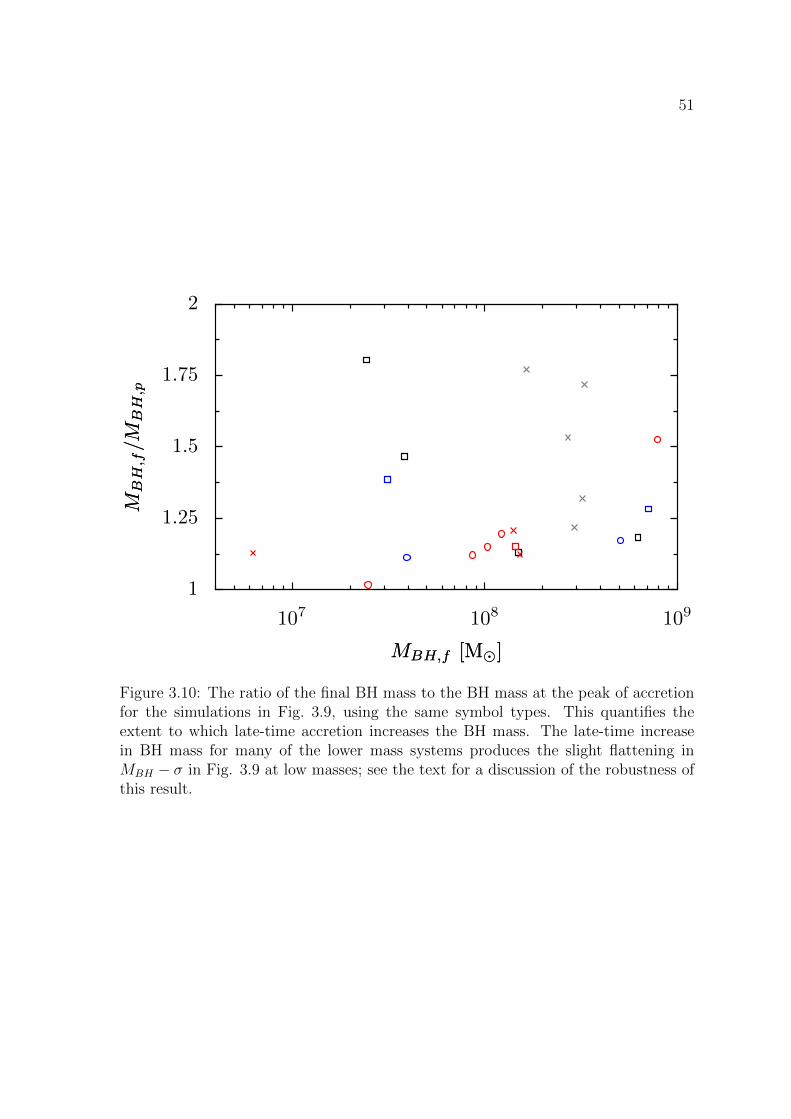
51
1
1.25
1.5
1.75
2
MB
H,f
/MB
H,p
MB
H,f
/MB
H,p
107 108 109
MBH,f [M⊙]MBH,f [M⊙]
Figure 3.10: The ratio of the final BH mass to the BH mass at the peak of accretionfor the simulations in Fig. 3.9, using the same symbol types. This quantifies theextent to which late-time accretion increases the BH mass. The late-time increasein BH mass for many of the lower mass systems produces the slight flattening inMBH − σ in Fig. 3.9 at low masses; see the text for a discussion of the robustness ofthis result.
52
the simple analytic calculations is that a much larger feedback force per unit BH mass(τ ∼ 25, not ∼ 1) is required for consistency with the observed MBH − σ relation.The physical implications of this larger value of τ for models of AGN feedback willbe discussed in § 3.5.
The scatter in BH mass in Fig. 3.9 at our fiducial mass scale of σ ∼ 175 km s−1
is reasonably consistent with the observed scatter. In the simulations we have variedthe BH accretion model (α), the ISM model, numerical resolution, size of the feed-back/accretion region Racc, and galaxy properties such as the total mass, gas fraction,and bulge to disk ratio. It is encouraging that all of these simulations produce BHmasses within a factor of few of each other. The largest BH mass at σ ∼ 175 km s−1 isthe simulation with an initial gas fraction of fg = 0.3; since this run has a larger gasdensity at small radii close to the BH (Fig. 3.2), it should probably also have a largerτ , which would reduce the BH mass further, in better agreement with the data. It isdifficult to make this comparison to the observed scatter more quantitative given thelimitation that our simulations are all equal-mass non-cosmological binary mergerson the same orbit.
The numerical results in Fig. 3.9 suggest a slight flattening of the MBH−σ relationat σ . 100 km s−1. This is in large part a consequence of the additional mass gainedby the lower mass BHs after their peak of activity (see Figs. 3.8 & 3.10, in particularthe fiducial simulations labeled by black squares in Fig. 3.10). This change in behaviorat lower masses is primarily due to the fact that the lower mass galaxies are less proneto fragmentation than the more massive galaxies (§3.3.4). Without the fragmentationafter first passage, more gas is available to feed the BH at late times leading to theslightly higher BH mass. As discussed in §3.3.4, it is unclear how robust this latetime accretion is. In fact, a low mass galaxy simulation with an alternate ISM model(qeos = 0.07) does not show significant late-time accretion, leading to a BH mass ingood agreement with the extrapolation from higher σ (red x at low mass in Figs. 3.9 &3.10). We thus regard the case for flattening ofMBH−σ at low masses in our models assomewhat tentative; our results may instead indicate enhanced scatter at low massesrather than a change in the mean relation. More comprehensive numerical studies ofthese lower mass systems will be needed to distinguish these two possibilities.
In addition to the MBH − σ correlation, the masses of supermassive black holesscale with the stellar mass of their host spheroid (Magorrian et al., 1998). Thesimulations presented here also produce such a correlation, with a similar slope butoffset to smaller black hole masses by a factor of ∼ 4. The source of this discrepencyis in part related to the fact that the merger remnants do not satisfy the size-massrelation of Shen et al. (2003): the slope of our relation is too shallow. A similar effectwas seen in Robertson et al. (2006) for low gas fraction (. 0.3) mergers. By changingthe parameters of the galaxy mergers to values appropriate for higher redshift mergers,in particular the gas fraction as a function of galaxy mass, they were able to reproduce
define the BH mass at “peak” to be the mass when M drops by a factor of 10 from its peak value.
53
the Faber-Jackson relation, the size-mass relation, and the fundamental plane ofelliptical.
Our simulations generally produce remnants that are too large relative to obser-vations (becasue the gas fraction is small and thus there is not enough stellar massformed at small radii in the starburst). As a result, the effective σ is small. Becausethe BH growth is self-regulating and determined by the potential of the galaxy, thisleads to black holes that are below the observed MBH −M∗ relation. With mergerparameters more like those in Robertson et al. (2006), we would end up with physi-cally smaller galaxies (for a given mass) and thus larger values of σ. Because the BHgrowth is self-regulating, the increase in σ would lead to an increase in MBH alongthe mean relation in Fig. 3.9.
3.5 Discussion and Conclusions
We have presented a new method for simulating the growth of massive BHs ingalaxies and the impact of AGN activity on gas in its host galaxy (see also ourrelated Letter; DeBuhr et al. 2010). In this method, we use a local viscous estimateto determine the accretion rate onto a BH given conditions in the surrounding galaxy(eq. 3.6), and we model the effect of BH feedback on ambient gas by depositingmomentum radially away from the BH into the surrounding gas (eq. 3.7).
Our accretion model qualitatively takes into account the angular momentum re-distribution required for accretion of cold gas in galaxies and is thus more appropriatethan the spherical accretion estimate that has been used extensively in the literature.In our feedback model, the applied force is given by τL/c, where the AGN’s luminos-ity L is determined by our BH accretion model, and the net efficiency of the feedbackis determined by the total optical depth τ of the galactic gas to the AGN’s radiation,which is a free parameter of our model. Previous calculations have demonstrated thatonly when the gas fraction in a galaxy decreases to . 0.01 can the AGN’s radiationCompton heat matter to high temperatures (Sazonov et al., 2005). More generally,the cooling times in gas-rich galaxies are so short that the primary dynamical impactof the AGN on surrounding gas is via the momentum imparted by the AGN’s out-flows or radiation. It is thus not physically well-motivated to model AGN feedbackby depositing energy, but not momentum, into surrounding gas, as many calculationshave done (e.g., Di Matteo et al. 2005, Springel et al. 2005b, Kawata and Gibson2005); see Ostriker et al. 2010 for related points.
Throughout this paper, we have focused on BH growth during major mergersof spiral galaxies. As demonstrated in DeBuhr et al. (2010), our model leads toa self-regulated mode of BH accretion in which the BH accretion rate is relativelyindependent of the details of the BH accretion model (see Fig. 3.5). This is becausethe accretion rate self-adjusts so that the radiation pressure force is comparable tothe inward gravitational force produced by the host galaxy (see eq. 3.8). This self-
54
regulated mode of BH accretion is a robust feature of all of our simulations duringperiods of time when there is a significant nuclear gas reservoir – it thus appliesprecisely when the BH gains most of its mass.
One important consequence of this self-regulated accretion is that AGN feedbackdoes not drive significant large-scale outflows of gas (in contrast to the models ofSpringel et al. 2005b). For example, the surface density profiles in Fig. 3.4 show thatAGN feedback causes gas to pile up at a few hundred pc rather than being completelyunbound from the galaxy – this precise radius should not be taken too literally sinceit is a direct consequence of the fact that we implement feedback and determine theBH accretion rate only within a radius Racc ∼ few hundred pc. Nonetheless, webelieve that this general result may well be generic: because the BH accretion rateis determined by the gas content close to the BH, the AGN can shut off its ownaccretion before depositing sufficient energy to unbind all of the gas in the galaxy. Ifwe artificially hold the luminosity of the AGN constant in time at a value exceedingthe critical value in equation (3.8), then the AGN does eventually unbind all of thesurrounding gas (see, e.g., Figs. 3.12 & 3.14 in Appendix B). However, both ourisothermal sphere test problem (Fig. 3.17) and our full merger calculations show thatwhen the BH accretion rate is self-consistently determined by the gas properties inthe central ∼ 100 pc of the galaxy, the AGN simply never stays ‘on’ long enough tounbind all the gas.
Our results do not, of course, preclude that AGN drive galactic winds. For ex-ample, some gas may be unbound by a high speed wind/jet produced by the centralaccretion disk (which is not in our simulations). In addition, at later stages of amerger or at large radii the gas fraction can be sufficiently low (. 0.01) that gas canbe Compton heated to high temperatures and potentially unbound (e.g., Ciotti et al.2010). This may in fact be sufficient to quench star formation at late times, but onlyonce most of the gas has already been consumed into stars (so that fg . 0.01). Ourresults do suggest that AGN feedback does not quench star formation by unbinding asignificant fraction of the cold dense gas in a galaxies interstellar medium (in contrastto, e.g., Springel et al. 2005b). In future work it will be important to assess whethervariability in the accretion rate on smaller scales than we can resolve (e.g., Hopkinsand Quataert 2010b, Levine et al. 2010) modifies this conclusion; such variabilitycould produce some epochs during which AGN feedback has a significantly largereffect on the surrounding gas. Another improvement would be to carry out radiativetransfer calculations and assess what fraction of the AGN’s radiation is absorbed atlarge radii in a galaxy (∼ kpc) where the gas has a lower surface density and is thuseasier to unbind.
Our simulations cover a factor of ∼ 30 in galaxy mass. The final BH mass inour calculations is ∝ τ−1 since a larger value of τ corresponds to a larger momentumdeposition per unit BH mass. We find reasonable consistency with the normalizationof the observed MBH−σ relation for τ ∼ 25. To compare this result to previous workby Di Matteo et al. (2005), we note that a momentum deposition of P corresponds
55
to an energy deposition rate of E ' P σ when the feedback is able to move the gasat a speed comparable to the velocity dispersion σ (which is required for efficientself-regulation of the BH growth). For τ ' 25, our results thus correspond to E '25Lσ/c ' 0.02L (σ/200 km s−1). This is similar to the results of Di Matteo et al.(2005), who found that depositing∼ 5% of the BH accretion energy in the surroundinggas was required to explain the MBH − σ relation. It is encouraging that these twodifferent sets of simulations, with different BH accretion and feedback models, agreeat the factor of ∼ 2 − 3 level on the energetics required to reproduce the MBH − σrelation.
The value of τ ∼ 25 required to explain the normalization of the MBH−σ relationhas strong implications for the dominant physics regulating BH growth. The simplestmodels of super-Eddington winds from an accretion disk close to the BH are ruledout because they typically have τ ∼ 1, i.e., a momentum flux comparable to thatof the initial radiation field (King, 2003). Note, however, that observations of broadabsorption line quasar outflows suggest values of τ ∼ 5 − 10 in several cases (Moeet al., 2009, Dunn et al., 2010), thought it is unclear how generic these results are.The radiation pressure force produced solely by the scattering and absorption of theAGN’s UV radiation by dust corresponds to τ ∼ 1 (Murray et al., 2005) and isthus not sufficient to account for the level of feedback required here. Rather, ourresults suggest that most BH growth happens when the nuclear regions are opticallythick to the re-radiated dust emission in the near and far-infrared, so that τ 1.This is consistent with observational evidence in favor of a connection between BHgrowth, quasars and luminous dust-enshrouded starbursts such as ULIRGs and sub-mm galaxies (e.g., Sanders et al. 1988, Dasyra et al. 2006, Alexander et al. 2008).Quantitatively, the observed stellar densities at radii ∼ 1−100 pc in elliptical galaxiesreach ∼ 20 g cm−2 (Hopkins et al., 2010), implying τ ∼ 100 if a significant fraction ofthe stars were formed in a single gas-rich epoch. It is encouraging that this is withinan order of magnitude of (and larger than!) the value of τ we find is required toexplain the observed MBH − σ relation.
A fixed value of τ ∼ 25 independent of galaxy mass produces an MBH−σ relationwith a slope and scatter in reasonable agreement with observations (see Fig. 3.9).Assessing the scatter more quantitatively will require a wider survey of merger orbits.We do find some tentative evidence for a shallower slope in the MBH − σ relation atthe lowest galaxy masses, corresponding to σ . 100 km s−1. This range of masses isprecisely where the observational situation is particularly unclear, with, e.g., possibledifferences between the BH-galaxy correlations in classical bulges and pseudo-bulges(Graham, 2008, Hu, 2008, Greene et al., 2008). It is also unclear whether majormergers are the dominant mechanism for BH growth in these lower mass galaxies(e.g., Younger et al. 2008).
Our simulations show that fragmentation of a galactic disk into clumps can beefficiently induced by a merger (e.g., Fig. 3.3), even when an isolated galaxy withsame properties is Toomre stable (see, e.g., Wetzstein et al. 2007 for related ideas

56
in the context of dwarf galaxy formation in tidal tails). As Figure 3.7 demonstrates,this fragmentation can produce a significant increase in star formation during the firstclose passage of galaxies even when there is little inflow of the diffuse ISM (becausesuch inflow is suppressed by a bulge until later in the merger; Mihos and Hernquist1996). In our simulations we often see a corresponding increase in the BH accretionrate due to the inspiral of dense gas-rich clumps (Fig. 3.3). The inflow of gas bythis process may, however, be overestimated: stellar feedback not included in oursimulations can unbind the gas in star clusters on a timescale of ∼ a Myr, returningmost of the gas to the diffuse ISM (e.g., Murray et al. 2010, Hopkins and Quataert2010b).
Another feedback process that was not included in these simulations was galacticwinds. Including this would would reduce the available gas supply at small radii.Our results demonstrate, however, that over a wide range of values of the angularmomentum transport efficiency α, the BH accretion rate is nearly independent ofα (Fig. 3.5). The self-regulated BH accretion rate (eq. 3.8) is linearly proportionalto the gas fraction in the nuclear region. Thus a lower gas fraction due to galacticwinds might require a somewhat smaller value of τ for consistency with the MBH −σrelation.
Our calculations use subgrid sound speeds motivated by the observed turbulentvelocities in galaxies (§3.2.2). We thus believe that our ISM model is physically well-motivated, even though the use of a subgrid sound speed necessarily introduces someuncertainty. Overall, the presence/absence of large-scale clumping of the ISM doesnot significantly change the final BH mass or the mass of new stars formed in oursimulations. It can, however, change the star formation rate and BH accretion rateas a function of time, particularly near the first close passage during a merger.
The tentative change in the MBH − σ relation we find for lower mass galaxies islargely due to our treatment of the ISM, rather than our BH feedback or accretionmodel. For a given gas fraction, lower mass galaxies have a lower gas surface densityand thus the ISM is less prone to fragmentation (§3.3.4 and Fig. 3.8). Without thefragmentation after first passage, more gas is available to feed the BH at late timesleading to somewhat higher BH mass (Fig. 3.10).
The BH accretion and feedback models used in this paper can be significantlyimproved in future work, allowing a more detailed comparison to observations. Forexample, Hopkins and Quataert (2010b) carried out a large number of simulations ofgas inflow in galactic nuclei from ∼ 100 pc to . 0.1 pc (see, e.g., Levine et al. 2010for related work). These can be used to provide a more accurate estimate of the BHaccretion rate given conditions at larger radii in a galaxy (Hopkins and Quataert,2010a). Another important improvement would be to use a radiative transfer calcu-lation to self-consistently determine the infrared radiation field produced by a centralAGN (and distributed star formation). This could then be used to calculate the radi-ation pressure force on surrounding gas, eliminating the need for our parameterizationof the force in terms of the optical depth τ .
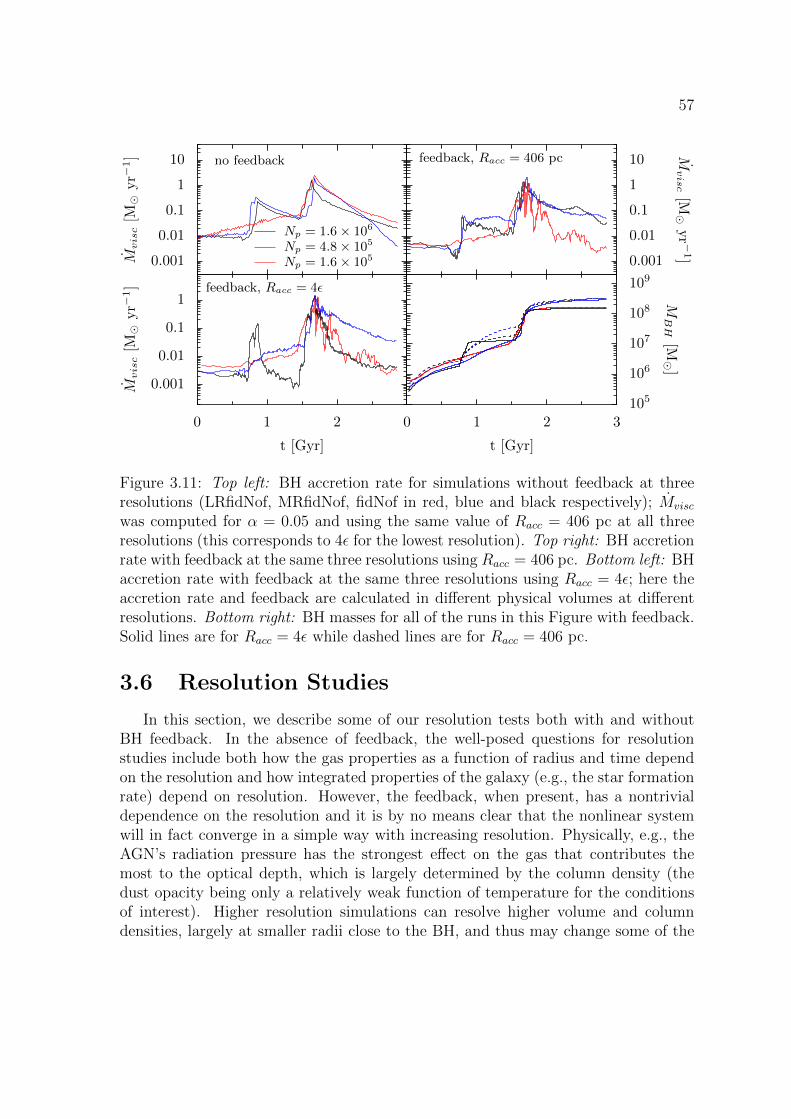
57
feedback, Racc = 4ε
0.001
0.01
0.1
1
Mvisc[M
yr−
1]
0 1 2
t [Gyr]
no feedback
0.001
0.01
0.1
1
10
Mvisc[M
yr−
1]
Np = 1.6× 10⁶
Np = 4.8× 10⁵
Np = 1.6× 10⁵
0 1 2 3
t [Gyr]
105
106
107
108
109
MBH
[M]
feedback, Racc = 406 pc
0.001
0.01
0.1
1
10
Mvisc[M
yr −
1]
Figure 3.11: Top left: BH accretion rate for simulations without feedback at threeresolutions (LRfidNof, MRfidNof, fidNof in red, blue and black respectively); Mvisc
was computed for α = 0.05 and using the same value of Racc = 406 pc at all threeresolutions (this corresponds to 4ε for the lowest resolution). Top right: BH accretionrate with feedback at the same three resolutions using Racc = 406 pc. Bottom left: BHaccretion rate with feedback at the same three resolutions using Racc = 4ε; here theaccretion rate and feedback are calculated in different physical volumes at differentresolutions. Bottom right: BH masses for all of the runs in this Figure with feedback.Solid lines are for Racc = 4ε while dashed lines are for Racc = 406 pc.
3.6 Resolution Studies
In this section, we describe some of our resolution tests both with and withoutBH feedback. In the absence of feedback, the well-posed questions for resolutionstudies include both how the gas properties as a function of radius and time dependon the resolution and how integrated properties of the galaxy (e.g., the star formationrate) depend on resolution. However, the feedback, when present, has a nontrivialdependence on the resolution and it is by no means clear that the nonlinear systemwill in fact converge in a simple way with increasing resolution. Physically, e.g., theAGN’s radiation pressure has the strongest effect on the gas that contributes themost to the optical depth, which is largely determined by the column density (thedust opacity being only a relatively weak function of temperature for the conditionsof interest). Higher resolution simulations can resolve higher volume and columndensities, largely at smaller radii close to the BH, and thus may change some of the
58
details of the BH feedback. Indeed, Fig. 3.4 shows that the column density increasestowards smaller radii in our simulations.
We first consider the question of how the nuclear gas properties depend on nu-merical resolution in the absence of feedback. To this end, the top left panel ofFig. 3.11 shows the BH accretion rate Mvisc calculated for three different particlenumbers Np = 1.6 × 10⁵, 4.8 × 10⁵, and 1.6 × 10⁶, with the gravitational force soft-
ening ε ∝ N1/3p .5 To make a fair comparison, the accretion rate is evaluated within
a fixed volume (R = 406 pc) and for α = 0.05 for all of the simulations. This choicecorresponds to R = 4ε for the lowest resolution run, but is R ' 8.6ε for our fiducialresolution simulation. Fig. 3.11 shows that the lowest resolution simulation (red)does not adequately resolve the fragmentation of the gas, and the resulting peakin the accretion rate, near first passage. The medium and higher (= our fiducial)resolution simulations, however, agree reasonably well, except for a slight differencein the slope of Mvisc(t) at late times. Computed over a larger volume (∼ kpc), theagreement between these runs improves.
To assess the convergence in the presence of feedback, the top right panel ofFig. 3.11 shows the BH accretion rate Mvisc evaluated just as in the top left panel,i.e., using a fixed Racc = 406 pc, in simulations with the same three particle numbersand force softening. Again the lowest resolution (red) simulation is clearly not ade-quate, but the medium (blue) and high (black) resolution simulations agree well; theintegrated BH mass differs only by 2% in the latter two simulations.
As a final resolution test, the bottom left panel of Fig. 3.11 shows the BH accretionrate as a function of time in simulations with the same three resolutions and forcesoftening, but in which Racc = 4ε. Thus in this case the accretion rate is determined,and the feedback applied, on increasingly small spatial scales in the higher resolutionsimulations. This is probably the most physically realistic (see §3.2.4). This panelshows that the large peak of accretion at final coalescence (t ∼ 1.8 Gyr) is quite similarin all three cases. This is set by the physics of feedback by momentum deposition andis a robust property of all of our simulations. A corollary of this is that the final BHmass, as shown in the bottom right panel of Fig. 3.11, is the same to within a factorof ∼ 2 for the three different resolutions. However, the results in the lower left panelof Fig. 3.11 also clearly demonstrate that the detailed evolution of the accretion rateis sensitive to the resolution. This is not particularly surprising: at fixed resolution,Fig. 3.5 has already demonstrated that the details of Mvisc(t) depend on the value ofRacc – although, again, neither the integrated BH mass or star formation rate do. Oneimplication of these results is that it is difficult for current simulations of BH growthto make quantitative predictions about the light curves of AGN activity triggered bymergers.
5In Fig. 3.11, Mvisc for the simulations without feedback (upper left) is calculated from the sim-ulation snapshots and the accretion rate is not Eddington limited. The data outputs were relativelyinfrequent and attempting to integrate the BH mass over such large timesteps was inaccurate.
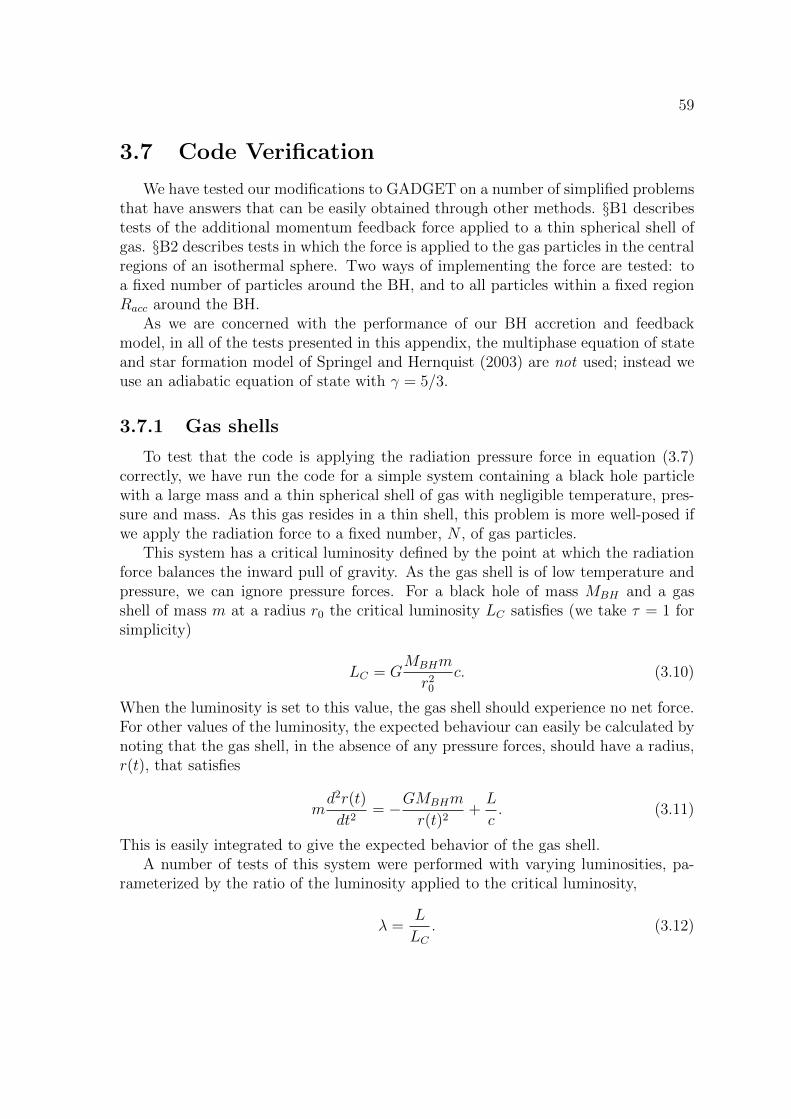
59
3.7 Code Verification
We have tested our modifications to GADGET on a number of simplified problemsthat have answers that can be easily obtained through other methods. §B1 describestests of the additional momentum feedback force applied to a thin spherical shell ofgas. §B2 describes tests in which the force is applied to the gas particles in the centralregions of an isothermal sphere. Two ways of implementing the force are tested: toa fixed number of particles around the BH, and to all particles within a fixed regionRacc around the BH.
As we are concerned with the performance of our BH accretion and feedbackmodel, in all of the tests presented in this appendix, the multiphase equation of stateand star formation model of Springel and Hernquist (2003) are not used; instead weuse an adiabatic equation of state with γ = 5/3.
3.7.1 Gas shells
To test that the code is applying the radiation pressure force in equation (3.7)correctly, we have run the code for a simple system containing a black hole particlewith a large mass and a thin spherical shell of gas with negligible temperature, pres-sure and mass. As this gas resides in a thin shell, this problem is more well-posed ifwe apply the radiation force to a fixed number, N , of gas particles.
This system has a critical luminosity defined by the point at which the radiationforce balances the inward pull of gravity. As the gas shell is of low temperature andpressure, we can ignore pressure forces. For a black hole of mass MBH and a gasshell of mass m at a radius r0 the critical luminosity LC satisfies (we take τ = 1 forsimplicity)
LC = GMBHm
r20
c. (3.10)
When the luminosity is set to this value, the gas shell should experience no net force.For other values of the luminosity, the expected behaviour can easily be calculated bynoting that the gas shell, in the absence of any pressure forces, should have a radius,r(t), that satisfies
md2r(t)
dt2= −GMBHm
r(t)2+L
c. (3.11)
This is easily integrated to give the expected behavior of the gas shell.A number of tests of this system were performed with varying luminosities, pa-
rameterized by the ratio of the luminosity applied to the critical luminosity,
λ =L
LC. (3.12)
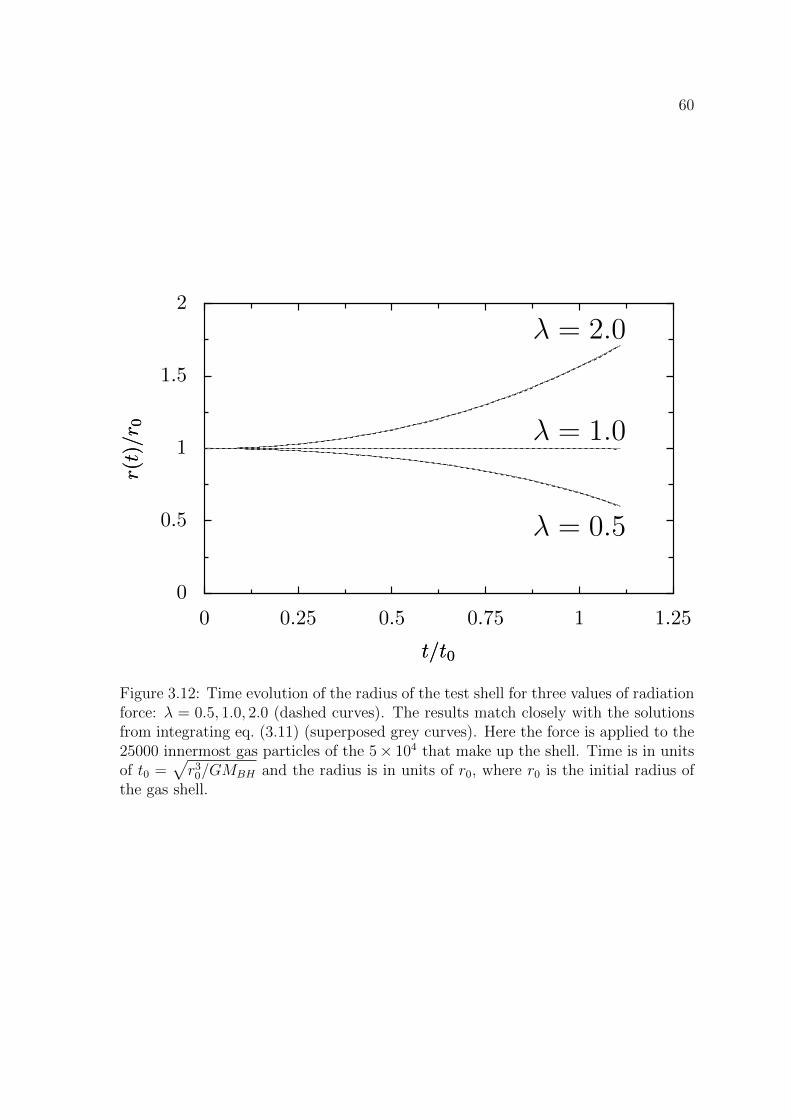
60
λ = 0.5
λ = 1.0
λ = 2.0
0
0.5
1
1.5
2
r(t)
/r 0
r(t)
/r0
0 0.25 0.5 0.75 1 1.25
t/t0t/t0
Figure 3.12: Time evolution of the radius of the test shell for three values of radiationforce: λ = 0.5, 1.0, 2.0 (dashed curves). The results match closely with the solutionsfrom integrating eq. (3.11) (superposed grey curves). Here the force is applied to the25000 innermost gas particles of the 5× 10⁴ that make up the shell. Time is in unitsof t0 =
√r3
0/GMBH and the radius is in units of r0, where r0 is the initial radius ofthe gas shell.
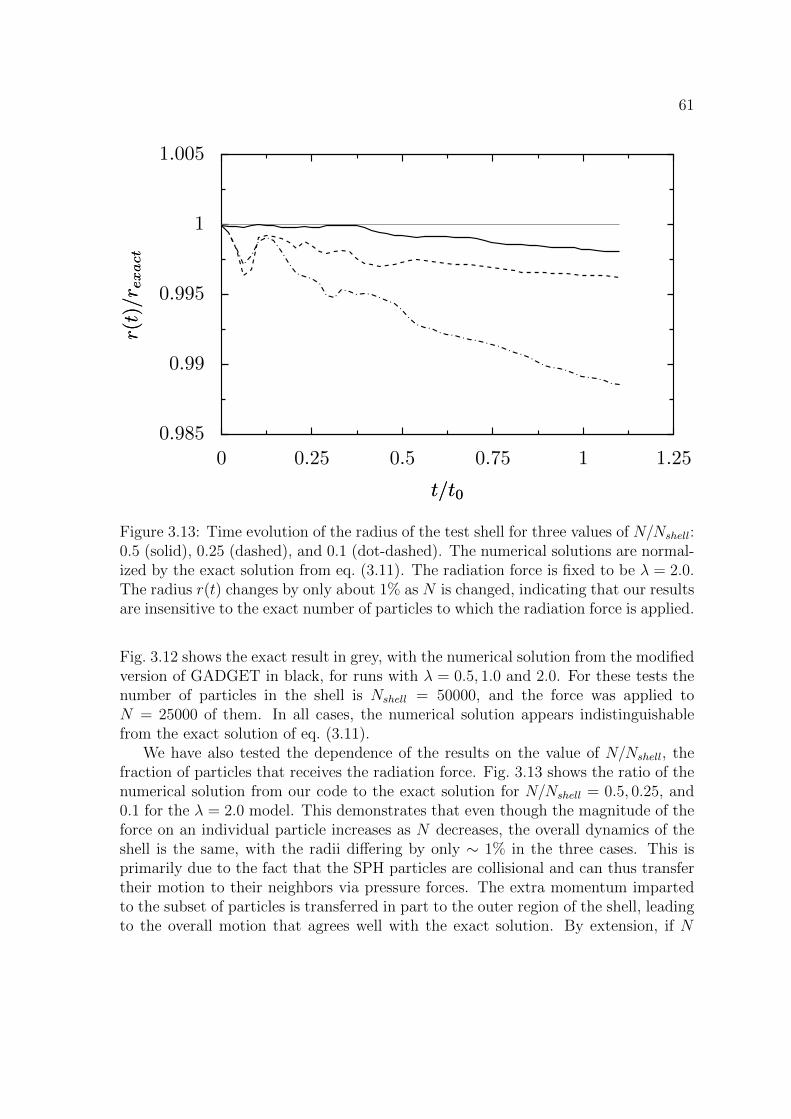
61
0.985
0.99
0.995
1
1.005r(
t)/r e
xact
r(t)
/r e
xact
0 0.25 0.5 0.75 1 1.25
t/t0t/t0
Figure 3.13: Time evolution of the radius of the test shell for three values of N/Nshell:0.5 (solid), 0.25 (dashed), and 0.1 (dot-dashed). The numerical solutions are normal-ized by the exact solution from eq. (3.11). The radiation force is fixed to be λ = 2.0.The radius r(t) changes by only about 1% as N is changed, indicating that our resultsare insensitive to the exact number of particles to which the radiation force is applied.
Fig. 3.12 shows the exact result in grey, with the numerical solution from the modifiedversion of GADGET in black, for runs with λ = 0.5, 1.0 and 2.0. For these tests thenumber of particles in the shell is Nshell = 50000, and the force was applied toN = 25000 of them. In all cases, the numerical solution appears indistinguishablefrom the exact solution of eq. (3.11).
We have also tested the dependence of the results on the value of N/Nshell, thefraction of particles that receives the radiation force. Fig. 3.13 shows the ratio of thenumerical solution from our code to the exact solution for N/Nshell = 0.5, 0.25, and0.1 for the λ = 2.0 model. This demonstrates that even though the magnitude of theforce on an individual particle increases as N decreases, the overall dynamics of theshell is the same, with the radii differing by only ∼ 1% in the three cases. This isprimarily due to the fact that the SPH particles are collisional and can thus transfertheir motion to their neighbors via pressure forces. The extra momentum impartedto the subset of particles is transferred in part to the outer region of the shell, leadingto the overall motion that agrees well with the exact solution. By extension, if N
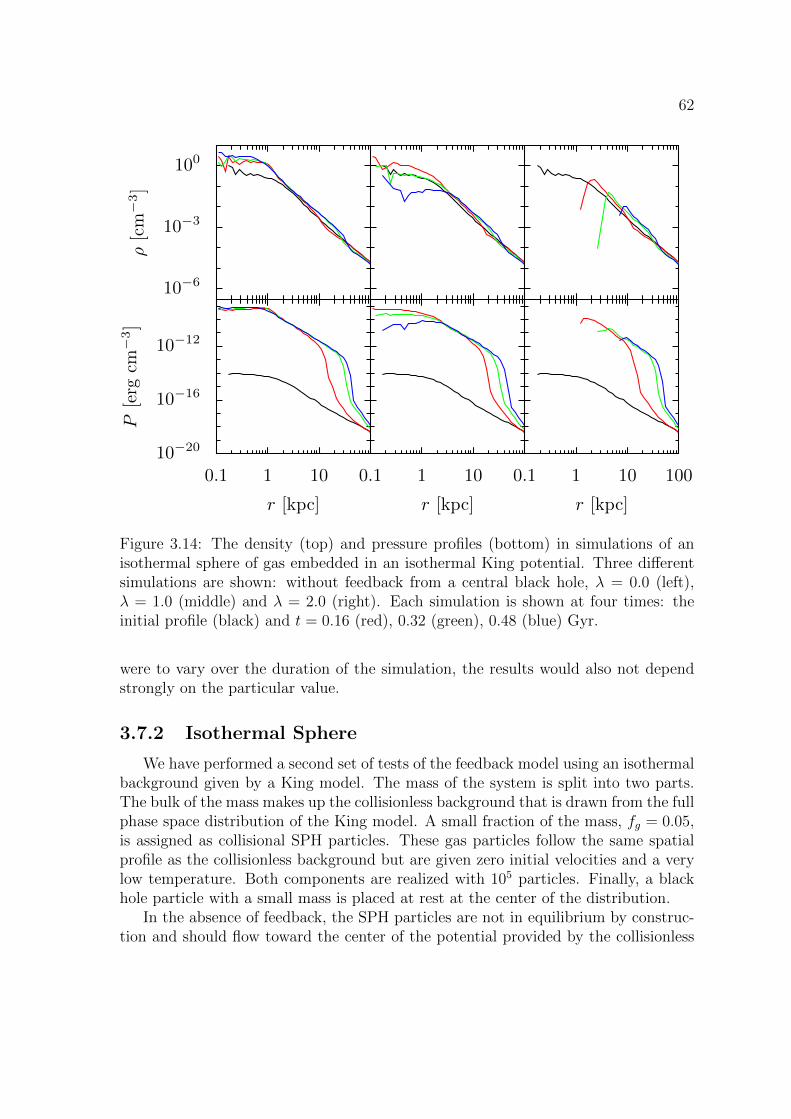
62
10−20
10−16
10−12
P[erg
cm−3]
0.1 1 10
r [kpc]
10−6
10−3
100ρ[cm
−3]
0.1 1 10
r [kpc]
0.1 1 10 100
r [kpc]
Figure 3.14: The density (top) and pressure profiles (bottom) in simulations of anisothermal sphere of gas embedded in an isothermal King potential. Three differentsimulations are shown: without feedback from a central black hole, λ = 0.0 (left),λ = 1.0 (middle) and λ = 2.0 (right). Each simulation is shown at four times: theinitial profile (black) and t = 0.16 (red), 0.32 (green), 0.48 (blue) Gyr.
were to vary over the duration of the simulation, the results would also not dependstrongly on the particular value.
3.7.2 Isothermal Sphere
We have performed a second set of tests of the feedback model using an isothermalbackground given by a King model. The mass of the system is split into two parts.The bulk of the mass makes up the collisionless background that is drawn from the fullphase space distribution of the King model. A small fraction of the mass, fg = 0.05,is assigned as collisional SPH particles. These gas particles follow the same spatialprofile as the collisionless background but are given zero initial velocities and a verylow temperature. Both components are realized with 105 particles. Finally, a blackhole particle with a small mass is placed at rest at the center of the distribution.
In the absence of feedback, the SPH particles are not in equilibrium by construc-tion and should flow toward the center of the potential provided by the collisionless
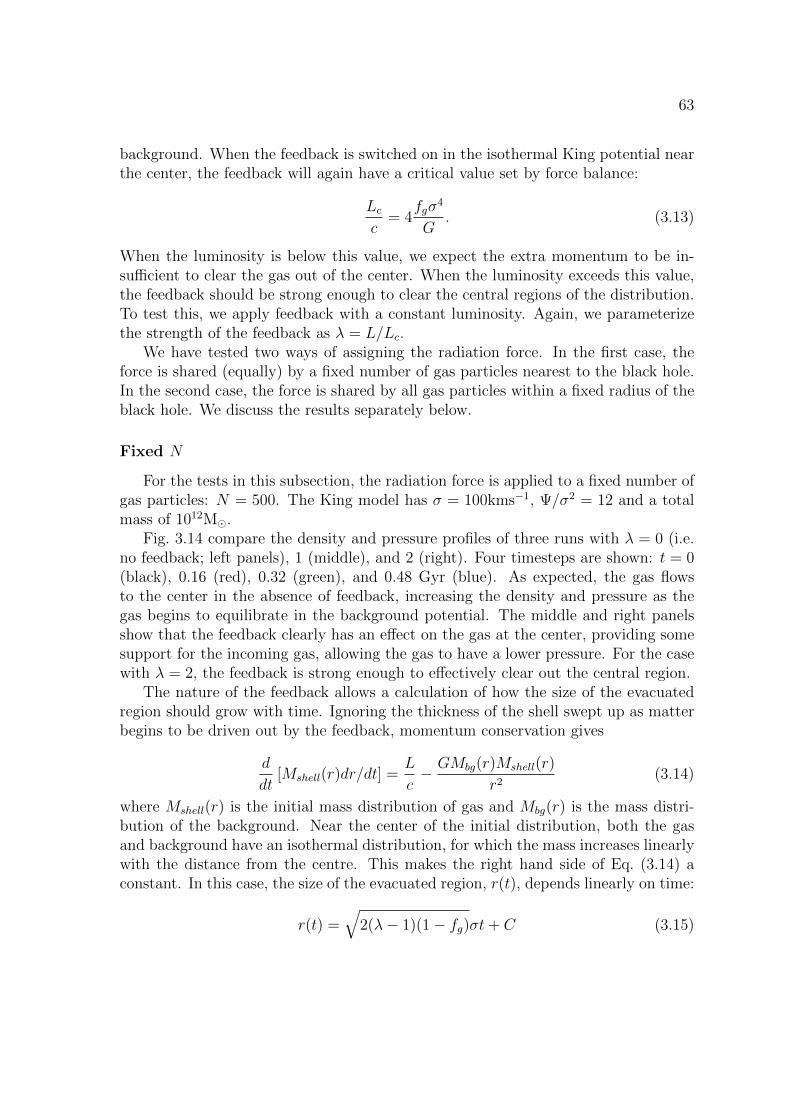
63
background. When the feedback is switched on in the isothermal King potential nearthe center, the feedback will again have a critical value set by force balance:
Lcc
= 4fgσ
4
G. (3.13)
When the luminosity is below this value, we expect the extra momentum to be in-sufficient to clear the gas out of the center. When the luminosity exceeds this value,the feedback should be strong enough to clear the central regions of the distribution.To test this, we apply feedback with a constant luminosity. Again, we parameterizethe strength of the feedback as λ = L/Lc.
We have tested two ways of assigning the radiation force. In the first case, theforce is shared (equally) by a fixed number of gas particles nearest to the black hole.In the second case, the force is shared by all gas particles within a fixed radius of theblack hole. We discuss the results separately below.
Fixed N
For the tests in this subsection, the radiation force is applied to a fixed number ofgas particles: N = 500. The King model has σ = 100kms−1, Ψ/σ2 = 12 and a totalmass of 1012M.
Fig. 3.14 compare the density and pressure profiles of three runs with λ = 0 (i.e.no feedback; left panels), 1 (middle), and 2 (right). Four timesteps are shown: t = 0(black), 0.16 (red), 0.32 (green), and 0.48 Gyr (blue). As expected, the gas flowsto the center in the absence of feedback, increasing the density and pressure as thegas begins to equilibrate in the background potential. The middle and right panelsshow that the feedback clearly has an effect on the gas at the center, providing somesupport for the incoming gas, allowing the gas to have a lower pressure. For the casewith λ = 2, the feedback is strong enough to effectively clear out the central region.
The nature of the feedback allows a calculation of how the size of the evacuatedregion should grow with time. Ignoring the thickness of the shell swept up as matterbegins to be driven out by the feedback, momentum conservation gives
d
dt[Mshell(r)dr/dt] =
L
c− GMbg(r)Mshell(r)
r2(3.14)
where Mshell(r) is the initial mass distribution of gas and Mbg(r) is the mass distri-bution of the background. Near the center of the initial distribution, both the gasand background have an isothermal distribution, for which the mass increases linearlywith the distance from the centre. This makes the right hand side of Eq. (3.14) aconstant. In this case, the size of the evacuated region, r(t), depends linearly on time:
r(t) =√
2(λ− 1)(1− fg)σt+ C (3.15)
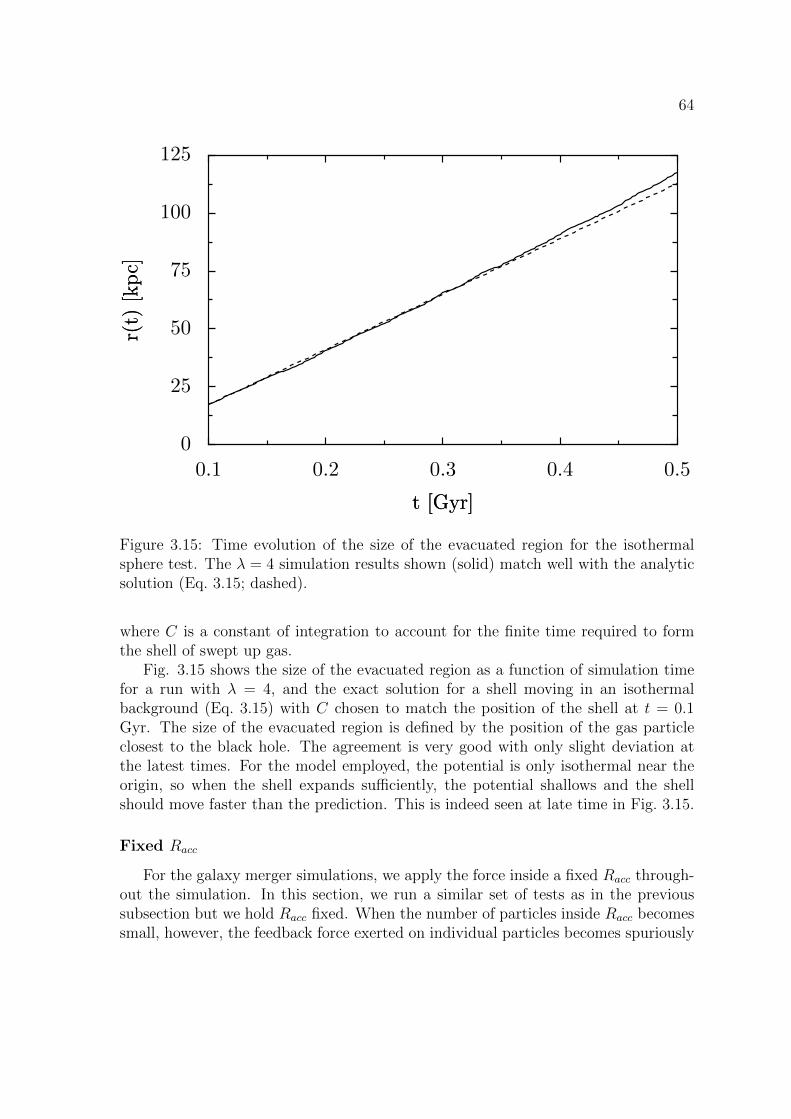
64
0
25
50
75
100
125r(
t)[k
pc]
r(t)
[kpc]
0.1 0.2 0.3 0.4 0.5
t [Gyr]t [Gyr]
Figure 3.15: Time evolution of the size of the evacuated region for the isothermalsphere test. The λ = 4 simulation results shown (solid) match well with the analyticsolution (Eq. 3.15; dashed).
where C is a constant of integration to account for the finite time required to formthe shell of swept up gas.
Fig. 3.15 shows the size of the evacuated region as a function of simulation timefor a run with λ = 4, and the exact solution for a shell moving in an isothermalbackground (Eq. 3.15) with C chosen to match the position of the shell at t = 0.1Gyr. The size of the evacuated region is defined by the position of the gas particleclosest to the black hole. The agreement is very good with only slight deviation atthe latest times. For the model employed, the potential is only isothermal near theorigin, so when the shell expands sufficiently, the potential shallows and the shellshould move faster than the prediction. This is indeed seen at late time in Fig. 3.15.
Fixed Racc
For the galaxy merger simulations, we apply the force inside a fixed Racc through-out the simulation. In this section, we run a similar set of tests as in the previoussubsection but we hold Racc fixed. When the number of particles inside Racc becomessmall, however, the feedback force exerted on individual particles becomes spuriously
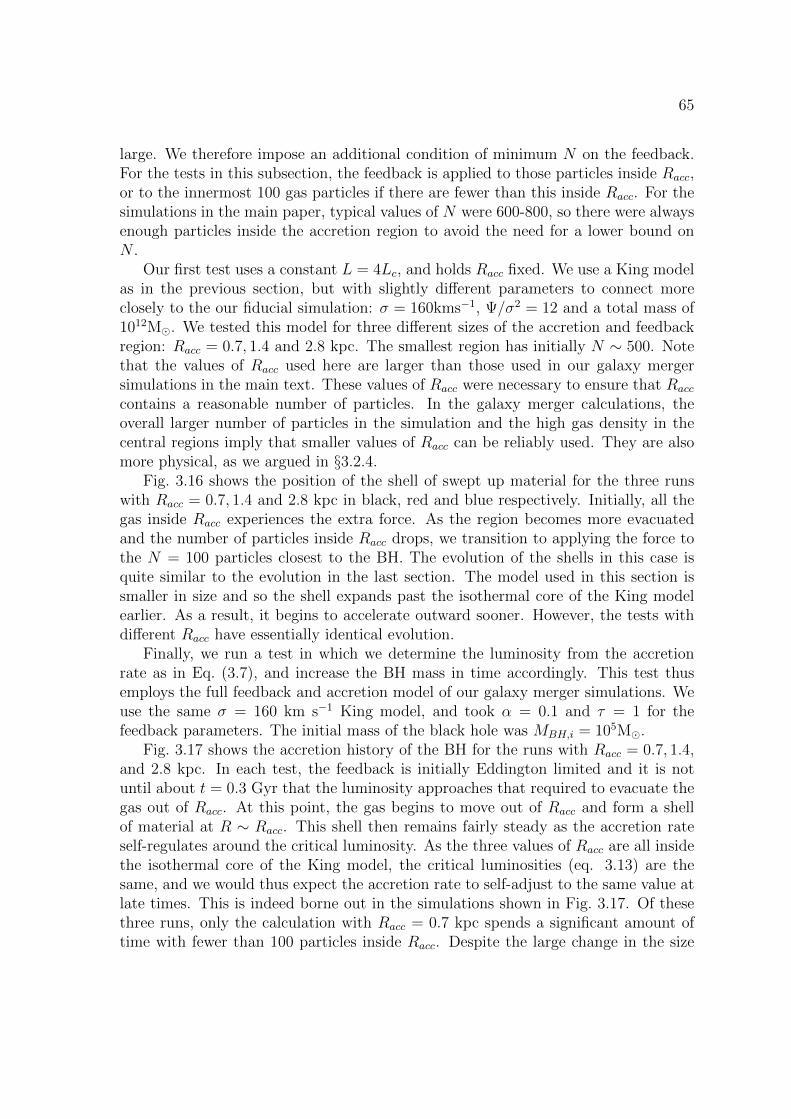
65
large. We therefore impose an additional condition of minimum N on the feedback.For the tests in this subsection, the feedback is applied to those particles inside Racc,or to the innermost 100 gas particles if there are fewer than this inside Racc. For thesimulations in the main paper, typical values of N were 600-800, so there were alwaysenough particles inside the accretion region to avoid the need for a lower bound onN .
Our first test uses a constant L = 4Lc, and holds Racc fixed. We use a King modelas in the previous section, but with slightly different parameters to connect moreclosely to the our fiducial simulation: σ = 160kms−1, Ψ/σ2 = 12 and a total mass of1012M. We tested this model for three different sizes of the accretion and feedbackregion: Racc = 0.7, 1.4 and 2.8 kpc. The smallest region has initially N ∼ 500. Notethat the values of Racc used here are larger than those used in our galaxy mergersimulations in the main text. These values of Racc were necessary to ensure that Racc
contains a reasonable number of particles. In the galaxy merger calculations, theoverall larger number of particles in the simulation and the high gas density in thecentral regions imply that smaller values of Racc can be reliably used. They are alsomore physical, as we argued in §3.2.4.
Fig. 3.16 shows the position of the shell of swept up material for the three runswith Racc = 0.7, 1.4 and 2.8 kpc in black, red and blue respectively. Initially, all thegas inside Racc experiences the extra force. As the region becomes more evacuatedand the number of particles inside Racc drops, we transition to applying the force tothe N = 100 particles closest to the BH. The evolution of the shells in this case isquite similar to the evolution in the last section. The model used in this section issmaller in size and so the shell expands past the isothermal core of the King modelearlier. As a result, it begins to accelerate outward sooner. However, the tests withdifferent Racc have essentially identical evolution.
Finally, we run a test in which we determine the luminosity from the accretionrate as in Eq. (3.7), and increase the BH mass in time accordingly. This test thusemploys the full feedback and accretion model of our galaxy merger simulations. Weuse the same σ = 160 km s−1 King model, and took α = 0.1 and τ = 1 for thefeedback parameters. The initial mass of the black hole was MBH,i = 105M.
Fig. 3.17 shows the accretion history of the BH for the runs with Racc = 0.7, 1.4,and 2.8 kpc. In each test, the feedback is initially Eddington limited and it is notuntil about t = 0.3 Gyr that the luminosity approaches that required to evacuate thegas out of Racc. At this point, the gas begins to move out of Racc and form a shellof material at R ∼ Racc. This shell then remains fairly steady as the accretion rateself-regulates around the critical luminosity. As the three values of Racc are all insidethe isothermal core of the King model, the critical luminosities (eq. 3.13) are thesame, and we would thus expect the accretion rate to self-adjust to the same value atlate times. This is indeed borne out in the simulations shown in Fig. 3.17. Of thesethree runs, only the calculation with Racc = 0.7 kpc spends a significant amount oftime with fewer than 100 particles inside Racc. Despite the large change in the size
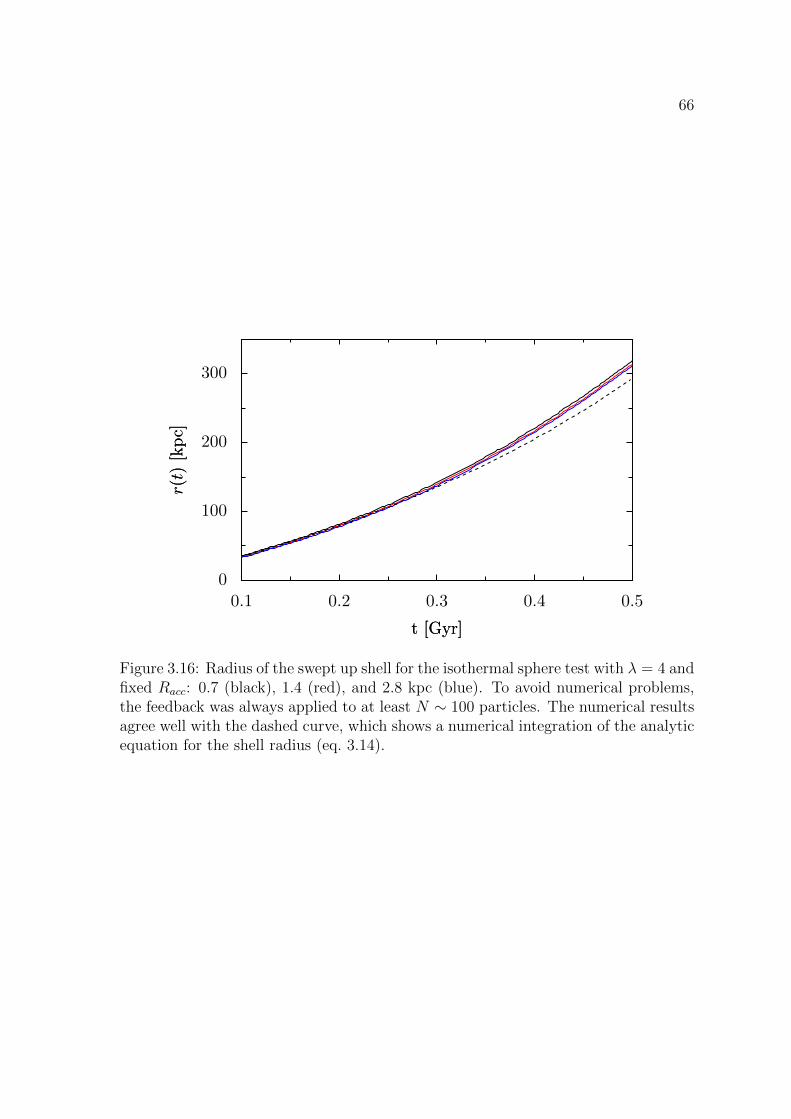
66
0
100
200
300
r(t)
[kpc]
r(t)
[kpc]
0.1 0.2 0.3 0.4 0.5
t [Gyr]t [Gyr]
Figure 3.16: Radius of the swept up shell for the isothermal sphere test with λ = 4 andfixed Racc: 0.7 (black), 1.4 (red), and 2.8 kpc (blue). To avoid numerical problems,the feedback was always applied to at least N ∼ 100 particles. The numerical resultsagree well with the dashed curve, which shows a numerical integration of the analyticequation for the shell radius (eq. 3.14).
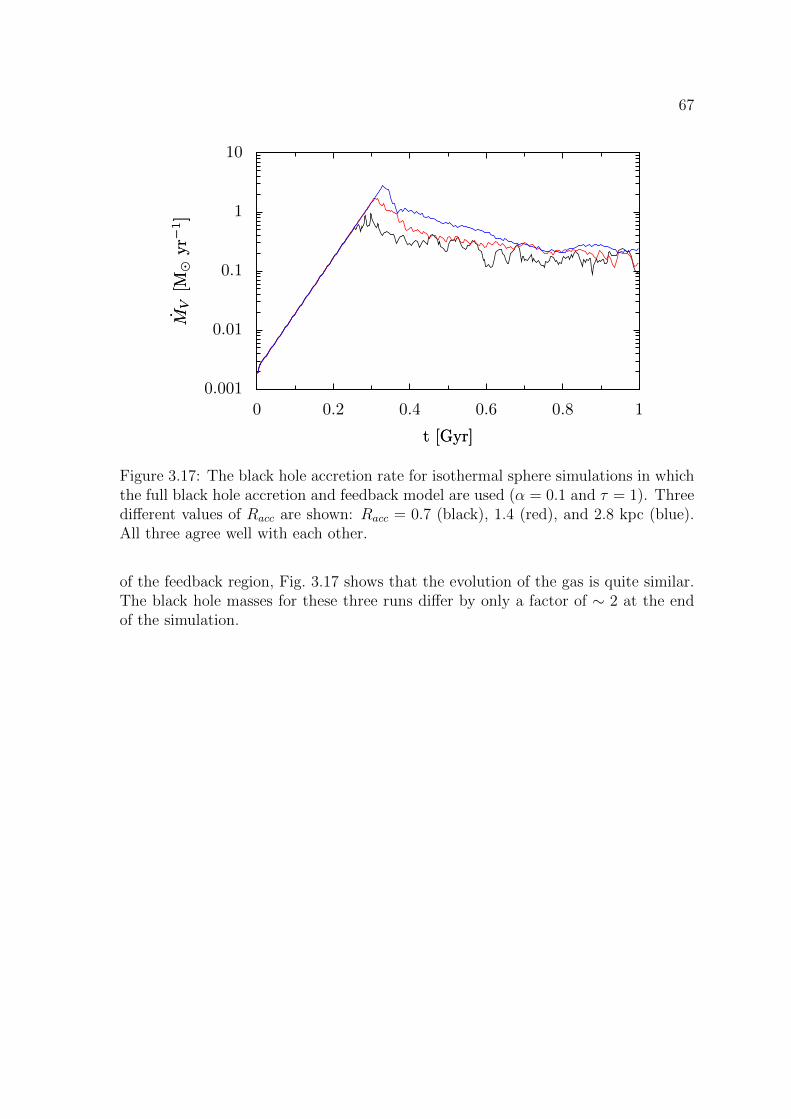
67
0.001
0.01
0.1
1
10
MV
[M⊙
yr−
1]
MV
[M⊙
yr−
1]
0 0.2 0.4 0.6 0.8 1
t [Gyr]t [Gyr]
Figure 3.17: The black hole accretion rate for isothermal sphere simulations in whichthe full black hole accretion and feedback model are used (α = 0.1 and τ = 1). Threedifferent values of Racc are shown: Racc = 0.7 (black), 1.4 (red), and 2.8 kpc (blue).All three agree well with each other.
of the feedback region, Fig. 3.17 shows that the evolution of the gas is quite similar.The black hole masses for these three runs differ by only a factor of ∼ 2 at the endof the simulation.
68
Chapter 4
Galaxy-Scale Outflows Driven byActive Galactic Nuclei
We present hydrodynamical simulations of major mergers of galaxies and studythe effects of winds produced by active galactic nuclei (AGN) on interstellar gas inthe AGN’s host galaxy. We consider winds with initial velocities ∼ 10, 000 km s−1
and an initial momentum (energy) flux of ∼ τwL/c (∼ 0.01 τw L), with τw ∼ 1 − 10.The AGN wind sweeps up and shock heats the surrounding interstellar gas, leadingto a galaxy-scale outflow with velocities ∼ 1000 km s−1, peak mass outflow ratescomparable to the star formation rate, and a total ejected gas mass ∼ 3 × 10⁹M.Large momentum fluxes, τw & 3, are required for the AGN-driven galactic outflow tosuppress star formation and accretion in the black hole’s host galaxy. Less powerfulAGN winds (τw . 3) still produce a modest galaxy-scale outflow, but the outflowhas little global effect on the ambient interstellar gas. We argue that this mechanismof AGN feedback can plausibly produce the high velocity outflows observed in post-starburst galaxies and the massive molecular and atomic outflows observed in localultra-luminous infrared galaxies. Moreover, the outflows from local ultra-luminousinfrared galaxies are inferred to have τw ∼ 10, comparable to what we find is requiredfor AGN winds to regulate the growth of black holes and set the MBH − σ relation.We conclude by discussing theoretical mechanisms that can lead to AGN wind mass-loading and momentum/energy fluxes large enough to have a significant impact ongalaxy formation.
4.1 Introduction
Accretion onto a central massive black hole (BH) in a galactic nucleus producesenergy in the form of radiation, relativistic jets, and wider angle (less-collimated)non-relativistic (v ∼ 104 km s−1) outflows (Krolik, 1999). The coupling of this en-ergy output to gas in galaxies and in the intergalactic medium is believed to play
69
an important role in galaxy formation, potentially regulating the growth of massivegalaxies and the thermal properties of the intracluster medium in galaxy groups andclusters (e.g., Silk and Rees 1998, Croton et al. 2006).
The impact of this ‘feedback’ on the gas in galaxies is particularly uncertain, bothbecause the interstellar (ISM) gas is denser, and thus more difficult to affect dynam-ically, and because much of the ISM subtends a relatively modest solid angle relativeto a central active galactic nucleus (AGN). However, analytic estimates and numeri-cal simulations have demonstrated that if a modest fraction of the energy producedby accretion onto a central BH can couple to the surrounding gas, it can unbindthe interstellar gas (e.g., Silk and Rees 1998, Di Matteo et al. 2005). The physicalprocesses most likely to produce such an effect are winds (King, 2003, King et al.,2011), radiation pressure (Murray et al., 2005), and/or Compton heating (Sazonovet al., 2004) from a central AGN. Understanding how this works in detail is one ofthe major challenges in our understanding of the connection between AGN physicsand galaxy formation.
In this paper, we assess the influence of AGN winds on gas in the AGN’s hostgalaxy using three-dimensional numerical simulations. Previous analytic work andone and two-dimensional simulations have demonstrated that AGN winds can inprinciple sweep up and drive gas out of galaxies, potentially explaining the MBH − σrelation and the dearth of gas and ongoing star formation in massive, early-type,galaxies (e.g., King 2005, King et al. 2011, Novak et al. 2011, Ostriker et al. 2010 andreferences therein).
Observationally, there is strong evidence that AGN indeed drive powerful outflows.Broad-absorption line (BAL) quasars, which show blue-shifted absorption lines in therest-frame ultraviolet with inferred outflow velocities ∼ 10, 000− 40, 000 km s−1, rep-resent over ∼ 40% of quasars in infrared selected samples (Dai et al., 2008). A similarfraction of radio-quiet quasars show evidence for high velocity outflows in X-ray ab-sorption line spectroscopy (Tombesi et al., 2010). It is likely that all quasars possesssuch outflows but that they are only observed when the system is viewed modestlyedge-on (Murray et al., 1995). However, determining the mass-loss rate from spatiallyunresolved absorption-line observations is notoriously difficult given uncertainties inthe radius of the absorbing gas. In a handful of low-ionization BAL quasars (inparticular, FeLoBALs) this degeneracy has been broken, suggesting mass loss ratessignificantly larger than the black hole accretion rate (Moe et al., 2009, Bautistaet al., 2010, Dunn et al., 2010, Faucher-Giguere et al., 2011). These observationstrace absorbers at large distances from the BH (∼ kpc), in contrast to most of thehigh ionization UV and X-ray absorption seen in BAL quasars, which arises at . 1pc. In addition to these well-characterized outflows, it is possible that quasars driveeven more powerful outflows during phases of super-Eddington accretion (King andPounds, 2003, King et al., 2011) or during obscured phases when the AGN’s radiationis trapped in the galactic nucleus, enhancing the force on the ambient gas (DeBuhret al., 2010, 2011).
70
To characterize the impact of AGN winds on their host galaxy, we carry out nu-merical simulations of major galaxy mergers with models for BH growth and feedback.Although it is by no means certain that all quasars are associated with mergers, thisprovides a convenient and well-posed model in which to study gas inflow in galac-tic nuclei. It also allows us to readily compare our results to the extensive previousliterature on AGN feedback during mergers.
In the next section (§4.2) we summarize our methods, emphasizing our implemen-tation of AGN winds and our treatment of ISM cooling. We then describe our keyresults in §4.3. We conclude in §4.4 by discussing the implications of our results formodels of AGN feedback and for galactic winds driven by AGN. We also compareour results to observations of high-velocity outflows from post-starburst galaxies andultra-luminous infrared galaxies and summarize the theoretical processes that canproduce the large mass-loading and momentum fluxes we find are necessary for AGNwinds to have a substantial impact on the surrounding ISM.
4.2 Methodology
We use a modified version of the TreeSPH code GADGET-2 (Springel, 2005) toperform simulations of equal-mass galaxy mergers. This version of the code includesthe effective star formation model of Springel and Hernquist (2003) and the radiationpressure AGN feedback model of DeBuhr et al. (2011). As described below, wemodified the code further to implement a model of feedback via AGN winds, and toimplement a more physical model of how the interstellar gas cools.
4.2.1 Galaxy Models and Initial Conditions
We carry out simulations of major mergers of two equal mass galaxies. We sim-ulate only a single galaxy mass and focus our resources on studying the effects offeedback via AGN winds produced at small radii. Each galaxy model has a rotation-ally supported disk of gas and stars and a stellar bulge, all embedded in a halo ofdark matter. Both the stellar and gaseous disks have an exponential radial profilewith a scale length of 3.51 kpc. The vertical profile of the stellar disk is that of anisothermal sheet with a scale height of 702 pc. The vertical structure of the gas diskis set by hydrostatic equilibrium. The halo and stellar bulge both have Hernquist(Hernquist, 1990) profiles with a halo virial and half mass radius of 229 and 102kpc, respectively (a concentration of 9.0) and with a bulge effective radius of 1.27kpc. Each galaxy has a total dynamical mass of 1.94× 10¹²M, a total disk mass of7.96× 1010M and a bulge of mass 2.66× 10¹⁰M; 10% of the disk mass is gas. Wehave performed an additional simulation with a disk gas fraction of 30 %; this rungives qualitatively similar results and so is not discussed in detail. The black holesare modeled as additional collisionless particles with initial masses of 105M.
71
For our fiducial simulations, each galaxy is formed from 2.4 × 10⁵ particles: thehalo has 9 × 10⁴ dark matter particles, the disk has 6 × 10⁴ stellar particles and6 × 104 gas particles, and the bulge has 3 × 10⁴ stellar particles. The gravitationalforce softening length is ε = 70 pc for the disk and bulge particles and ε = 176 pc forthe halo particles. We describe resolution tests in § 3.3.
For the merger simulations, the two equal mass galaxies are placed on a progradeorbit with an initial separation of 142.8 kpc and an initial velocity of each galaxy of160 km s−1 directed at an angle of 28 from the line connecting the galaxies. Thecorresponding orbital energy is approximately zero. The spin of the two galaxiesare not aligned with the orbital angular momentum of the system; the relative anglebetween the spin directions is 41, with one galaxy’s spin making an angle of 10
degrees relative to the orbital angular momentum.
4.2.2 Black Hole Accretion
In this section we briefly review the sub-grid accretion model presented in detailin DeBuhr et al. (2011). The sub-grid accretion rate on scales smaller than ourresolution (both gravitational force softening and SPH smoothing) is estimated witha model motivated by the redistribution of angular momentum in the gas. For gaswith a surface density Σ, a sound speed cs and a rotational angular frequency Ω, themass accretion rate into the nuclear region is:
Mvisc = 3παΣc2s
Ω. (4.1)
Here α is a free parameter of the model characterizing not only the efficiency ofangular momentum transport, but also the amount of gas that turns into stars (onscales below our resolution) instead of falling into the black hole. Our fiducial valuesof α range from 0.05−0.15, motivated (at the order of magnitude level) by comparisonto the simulations of gas inflow from ∼ 0.1−100 pc of Hopkins and Quataert (2010b).Over this range of α, there is little dependence of our simulation results on α (seeDeBuhr et al. 2011).
To perform the sub-grid estimate of the gas properties in equation (4.1), we takeaverages of the properties of the SPH particles inside a region of radius Racc ∼ 300pc centered on the black hole. For reasons described in DeBuhr et al. (2011) we takethis radius to be four times the gravitational force softening, ε, of the particles in thesimulation.
The BHs in our simulation are modeled as specially marked collisionless particles.To minimize the unavoidable spurious stochastic motion of the BH particles due togravitational interactions with the stellar and gas particles, we assign the BH particlesa (fixed) tracer mass of 2× 10⁸M, which is ∼ 102-104 times more massive than theother particles in the simulation. During each simulation, we also compute separatelythe ‘real’ mass of the BH that grows according to the accretion rate at small radii
72
(with an initial mass of 105M). Details of this step were given in § 2.3.2 of DeBuhret al. (2011).
4.2.3 Radiation Pressure Feedback
The luminosity of the black hole is taken to be a fraction, η = 0.1, of the restmass energy of the accreted material:
L = min(ηMinc
2, Ledd
). (4.2)
The net accretion rate Min onto the black hole need not equal the viscous inflow rateMvisc at ∼ 100 pc in equation (4.1) if there are significant outflows on scales . 100pc (roughly our resolution); we return to this point in § 2.4.
In the radiation pressure feedback model introduced in DeBuhr et al. (2011), theaccretion luminosity is coupled back into the surrounding gas by adding a total force
prad = τL
c, (4.3)
which is shared equally by all SPH particles inside Racc. The added force is directedradially away from the BH particle. Here τ is a free parameter of the model, rep-resenting the optical depth to infrared (IR) radiation in the nuclear region. Ourfiducial choice for τ in this work is 20. DeBuhr et al. (2011) showed that τ ∼ 20 wasrequired to reproduce the observed normalization of the MBH− σ correlation in theirsimulations.
4.2.4 AGN Wind Feedback
In addition to the radiation pressure feedback described by equation (4.3), ac-cretion onto the black hole can explicitly drive a wind at radii well beneath ourresolution. Our treatment of such a wind is motivated in particular by observationsof BAL quasars, which have ∼ 10, 000 km s−1 outflows launched from near the broadline region at ∼ 0.1 pc (e.g., Murray et al. 1995). In our model, the AGN winds atsmall radii carry a momentum flux given by
pw = τwL
c, (4.4)
where τw is a further parameter of the model representing the total momentum fluxin the wind. The wind is launched at a fixed speed vw. Thus, the rate at which massis added to the wind is given by
Mw = τwL
cvw= τwη
c
vwMin. (4.5)
73
where we have linked the luminosity of the black hole to the accretion rate as inequation (4.2). In the presence of significant AGN winds, not all of the materialentering the nuclear region, Mvisc, actually reaches the black hole. Instead, the netaccretion rate into the black hole, Min, must be reduced by the mass of the outflow(see Ostriker et al. 2010): Min = Mvisc − Mw, which implies that the true black holeaccretion rate is given by
Min = min
(Mvisc
1 + τwηc/vw,Leddηc2
)(4.6)
Note that equation (4.6), not equation (4.1), determines the AGN luminosity andthus the magnitude of the feedback in equations (4.3) and (4.4).
To deposit the wind momentum, we give kicks to particles inside Racc. Particlesreceiving a kick are selected stochastically with each particle having an equal prob-ability of being added to the wind. The probability of a kick is chosen to ensurethat the time average of the mass kicked in a given timestep ∆t is given by Mw∆t.The kick is implemented by adding a velocity vw to the current velocity of each se-lected particle. The direction of this imparted velocity is chosen to be more heavilyweighted toward the surrounding disk: if θ is the angle between the imparted mo-mentum and the disk normal, the probability distribution over x = cos θ is given byp(x) = 3(1 − x2)/4. For this purpose, the disk normal is defined to be the directionof the total orbital angular momentum about the black hole of all the gas particlesinside Racc. This modest equatorial bias in the wind direction is motivated by modelsof BAL quasars (Murray et al., 1995). Nonetheless, this choice is not that critical:the efficacy of the feedback is largely determined by the outflow momentum/energyflux that is directed within the solid angle subtended by the surrounding ISM. Forour fiducial model, ∼ 40% of the momentum flux is directed within one scale-heightof the disk at ∼ 100 pc. Models with isotropic kicks require slightly large values ofτw to give results similar to our fiducial model because less of the feedback is directedtowards the surrounding ISM.
Despite the similarity between equations (4.3) and (4.4), our two feedback pro-cesses affect the gas particles within Racc in different ways. In the case of our simpleradiation pressure model, all gas particles within Racc receive an additional accelera-tion set by equation (4.3) and are pushed outward from the BH. As shown in DeBuhret al. (2011), this feedback process evacuates the central gas reservoir and lowers theBH accretion rate and the final BH mass, but the velocities of the gas particles arenot so large as to produce significant large-scale galactic outflows. In our AGN windmodel, by contrast, a small fraction (. 5%) of gas particles within Racc receives aninstantaneous large wind velocity of 3000 to 10, 000 km s−1. These particles leave Racc
within . 105 years and, as we show below, can drive a galaxy-scale outflow via theirinteraction with the ambient ISM.
Our implementation of wind feedback adds two additional input parameters to thesimulation. The first, vw, describes the launch speed of the winds while the second, τw,
74
describes the total momentum flux in the wind. Our default wind speed is motivatedin part by observations of BAL quasars and theoretical models of the origin of suchwinds via line driving in the accretion disk at ∼ 0.1 pc (though our model shouldnot be taken as a literal implementation of this physics). Observed wind velocitiesare ∼ 10, 000 km s−1. Models of line driving lead to momentum fluxes in the wind of. L/c, i.e., τw . 1 because the lines do not typically completely cover the continuum(Murray et al., 1995). As we show below, however, larger values of τw are requiredfor AGN outflows to have a significant effect on the gas dynamics and star formationhistory in galactic nuclei.
Observationally, momentum fluxes are difficult to infer in most cases because ofambiguities in the absolute density/radial scale at which the absorption occurs. In ahandful of low-ionization BALs (in particular, FeLoBALs), this degeneracy has beenbroken, implying momentum fluxes ∼ 0.3− 5L/c, i.e., τw ∼ 0.3− 5 (with significantuncertainties; see Moe et al. 2009, Bautista et al. 2010, Dunn et al. 2010, Faucher-Giguere et al. 2011). It remains uncertain whether these values of τw are representativeof the entire BAL-quasar population. We take τw ' 5 as our fiducial value but alsoexplore the range 1 ≤ τw ≤ 10. Our fiducial value of τw = 5 was chosen for threereasons that will become clear later in the paper: (1) the AGN wind then leads toa galaxy-scale outflow that significantly influences the surrounding ISM dynamics,(2) the final BH mass in the simulations is reasonably consistent with the observedMBH−σ relation for τw ' 5−10. (3) Observations of high speed atomic and molecularoutflows in local ULIRGs suggest τw ∼ 10 (Feruglio et al., 2010, Chung et al., 2011,Rupke and Veilleux, 2011, Sturm et al., 2011). We discuss physical mechanisms thatcan produce such powerful AGN winds in §4.4.
4.2.5 ISM Model and Gas Cooling
In the subgrid ISM model of Springel and Hernquist (2003), gas with densitiesabove the star formation threshold approaches an effective thermal energy, ueff , setby a balance between cooling and the feedback from star formation. If processes suchas shocks or adiabatic expansion/compression cause the internal energy to deviatefrom ueff , the differences decay on the timescale given by eq. (12) of Springel andHernquist (2003). This decay timescale is set by the subgrid model rather than thetrue cooling time of the gas.
One consequence of Springel and Hernquist (2003)’s ISM model is that sufficientlydense shock heated gas does not cool on its cooling timescale. In this paper we showthat AGN winds can shock heat gas in the ISM to above the escape speed – thiscontributes to driving a galactic wind. To ensure that the cooling of the shock heatedgas is correct, we modified the ISM model of Springel and Hernquist (2003) to bettermatch the expected cooling rate for gas with roughly a solar metallicity. To computethe local cooling rate we use a fit to Sutherland and Dopita (1993) for gas with solarmetallicity. The fit is essentially eq. (12) of Sharma et al. (2010) but with the cooling
75
rate increased by a factor of two when the temperature is between ∼ 3× 10⁴ K and3 × 107 K (to account for solar metallicity). From this cooling rate we compute acooling time, tcool; differences between the thermal energy and the subgrid ueff decayon trelax = tcool. For most of the relevant range of temperature and density in oursimulations, this cooling time is shorter than the relaxation time of Springel andHernquist (2003).
In addition to the above modification to the cooling rate, we also consider therole of inverse Compton cooling/heating. To do so, we modify the cooling/relaxationtimescale of the gas to be
t−1relax = t−1
cool + t−1C . (4.7)
where the (non-relativistic) Compton time is given by
tC = 107yr
(R
300 pc
)2(L
1046 erg s−1
)−1
, (4.8)
with R the distance to the BH and L the associated AGN luminosity. We do notconsider any radiative transfer effects in this paper, which in reality can modify boththe luminosity L seen at a given radius and the local Compton temperature at a givenradius. Instead, we take the Compton temperature to be that appropriate for themean spectrum of luminous AGN, including the effects of obscuration: TC ' 2× 10⁷
K (Sazonov et al., 2004).In the limit that the Compton timescale is short compared to the two-body cooling
time, we no longer relax the thermal energy of the gas to the effective equation ofstate value for the energy, ueff , but rather to uC = 3/2kTC . To transition betweenthese two limits, we in general let the thermal energy of gas relax to:
urelax =tcooluC + tCueff
tC + tcool. (4.9)
For dense gas, atomic cooling dominates and the gas rather quickly approachesthe sound speed associated with the effective equation of state. For gas densitiescharacteristic of the ISM in the central kpc of our model galaxies (∼ 10− 103 cm−3)the sound speeds are ∼ 40 km s−1 and thus the gas is primarily rotationally supportedrather than pressure supported. This justifies our use of the viscous accretion rate inequation 4.1.
4.3 Results
Table 4.1 lists the parameters of the galaxy merger simulations presented in thiswork. We consider a single galaxy mass and merger orbit (see § 4.2.1), and explore theeffects of including AGN wind feedback, both with and without radiation pressure.For the AGN winds, we vary both the total momentum flux in the wind (τw) and thewind speed vw, with fiducial values of τw = 5 and vw = 10, 000 km s−1.
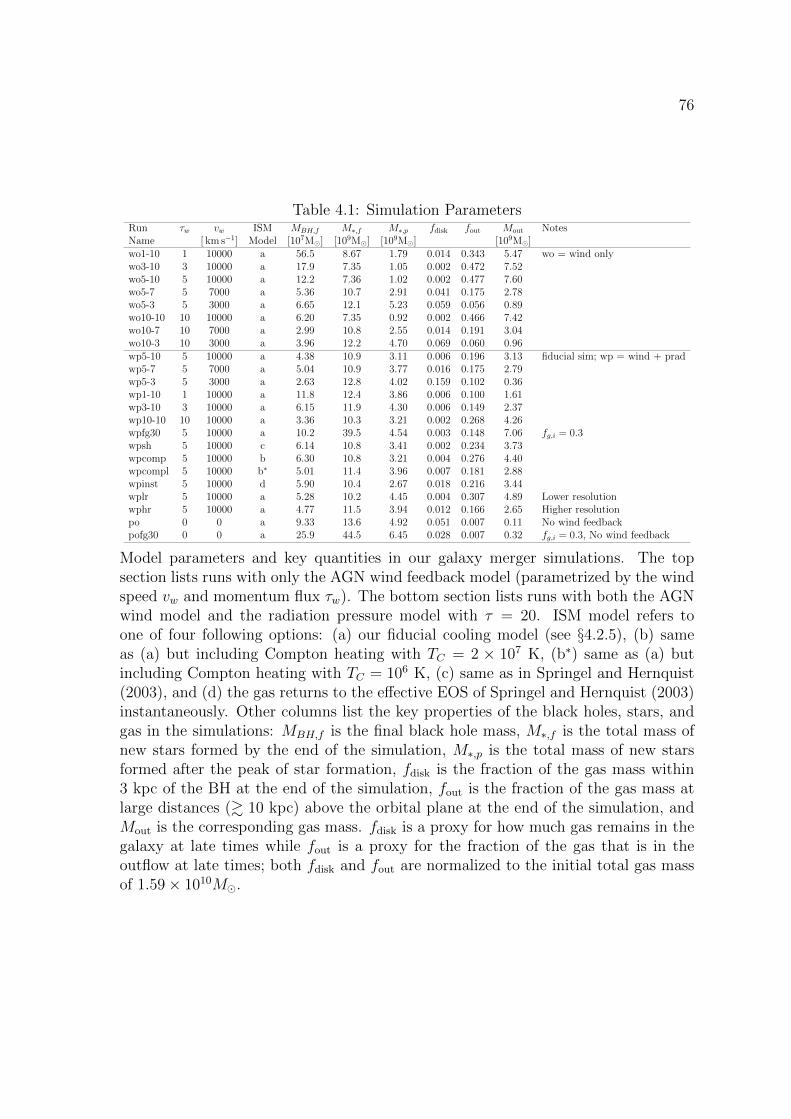
76
Table 4.1: Simulation ParametersRun τw vw ISM MBH,f M∗,f M∗,p fdisk fout Mout NotesName [ km s−1] Model [107M] [109M] [109M] [109M]wo1-10 1 10000 a 56.5 8.67 1.79 0.014 0.343 5.47 wo = wind onlywo3-10 3 10000 a 17.9 7.35 1.05 0.002 0.472 7.52wo5-10 5 10000 a 12.2 7.36 1.02 0.002 0.477 7.60wo5-7 5 7000 a 5.36 10.7 2.91 0.041 0.175 2.78wo5-3 5 3000 a 6.65 12.1 5.23 0.059 0.056 0.89wo10-10 10 10000 a 6.20 7.35 0.92 0.002 0.466 7.42wo10-7 10 7000 a 2.99 10.8 2.55 0.014 0.191 3.04wo10-3 10 3000 a 3.96 12.2 4.70 0.069 0.060 0.96wp5-10 5 10000 a 4.38 10.9 3.11 0.006 0.196 3.13 fiducial sim; wp = wind + pradwp5-7 5 7000 a 5.04 10.9 3.77 0.016 0.175 2.79wp5-3 5 3000 a 2.63 12.8 4.02 0.159 0.102 0.36wp1-10 1 10000 a 11.8 12.4 3.86 0.006 0.100 1.61wp3-10 3 10000 a 6.15 11.9 4.30 0.006 0.149 2.37wp10-10 10 10000 a 3.36 10.3 3.21 0.002 0.268 4.26wpfg30 5 10000 a 10.2 39.5 4.54 0.003 0.148 7.06 fg,i = 0.3wpsh 5 10000 c 6.14 10.8 3.41 0.002 0.234 3.73wpcomp 5 10000 b 6.30 10.8 3.21 0.004 0.276 4.40wpcompl 5 10000 b∗ 5.01 11.4 3.96 0.007 0.181 2.88wpinst 5 10000 d 5.90 10.4 2.67 0.018 0.216 3.44wplr 5 10000 a 5.28 10.2 4.45 0.004 0.307 4.89 Lower resolutionwphr 5 10000 a 4.77 11.5 3.94 0.012 0.166 2.65 Higher resolutionpo 0 0 a 9.33 13.6 4.92 0.051 0.007 0.11 No wind feedbackpofg30 0 0 a 25.9 44.5 6.45 0.028 0.007 0.32 fg,i = 0.3, No wind feedback
Model parameters and key quantities in our galaxy merger simulations. The topsection lists runs with only the AGN wind feedback model (parametrized by the windspeed vw and momentum flux τw). The bottom section lists runs with both the AGNwind model and the radiation pressure model with τ = 20. ISM model refers toone of four following options: (a) our fiducial cooling model (see §4.2.5), (b) sameas (a) but including Compton heating with TC = 2 × 10⁷ K, (b∗) same as (a) butincluding Compton heating with TC = 106 K, (c) same as in Springel and Hernquist(2003), and (d) the gas returns to the effective EOS of Springel and Hernquist (2003)instantaneously. Other columns list the key properties of the black holes, stars, andgas in the simulations: MBH,f is the final black hole mass, M∗,f is the total mass ofnew stars formed by the end of the simulation, M∗,p is the total mass of new starsformed after the peak of star formation, fdisk is the fraction of the gas mass within3 kpc of the BH at the end of the simulation, fout is the fraction of the gas mass atlarge distances (& 10 kpc) above the orbital plane at the end of the simulation, andMout is the corresponding gas mass. fdisk is a proxy for how much gas remains in thegalaxy at late times while fout is a proxy for the fraction of the gas that is in theoutflow at late times; both fdisk and fout are normalized to the initial total gas massof 1.59× 10¹⁰M.
77
In varying the AGN wind parameters, we are not guaranteed that the resultingBH mass will be consistent with the MBH − σ relation. In such cases, the effectsof the AGN wind might not be realistic because of the unphysical BH mass. Toquantify this, we present results with and without the radiation pressure feedbackmodel explored in DeBuhr et al. (2011). Our simple model of radiation pressurefeedback produces model galaxies roughly on the observed MBH − σ correlation forτ ∼ 20, the value used here (DeBuhr et al., 2011). For the present purposes thesecalculations are useful primarily because they allow us to study the effects of AGNwind feedback for systems in which the BH is guaranteed to be approximately onthe MBH − σ relation. We also separately carry out simulations with wind feedbackalone.
4.3.1 Effects of AGN Winds
Black hole accretion and star formation rates
Figure 4.1 shows the net accretion rate into the black hole, Min, and the star for-mation rate, M∗, as a function of time (summed over both galaxies) for three differentsimulations: the fiducial simulation (black curve) with radiation pressure (τ = 20)and AGN wind feedback (τw = 5 and vw = 10, 000 km s−1), a run identical to thefiducial run but without the wind feedback (gray), and a run with both wind andradiation pressure feedback that includes Compton heating/cooling in the thermo-dynamics of the gas (blue). We first describe the effects of the AGN wind and laterreturn to the role of Compton heating/cooling.
The inclusion of the wind feedback has little effect on either the accretion or starformation rate before the final coalescence of the two galaxies at t ∼ 1.7 Gyr. This isa priori surprising because equation (4.6) implies that for a given set of conditions atlarge radii (that determines Mvisc) the BH accretion rate at small radii is a factor of1+τwηc/vw = 16 smaller for the simulation with AGN winds than for the run with justradiation pressure. After a small number of time steps, however, the feedback due toradiation pressure is so effective in all of the simulations in Figure 4.1 that the physicalconditions at small radii quickly adjust so that there is a balance between radiationpressure and gravity. This sets the BH accretion rate Min to be ∼ fgσ
4/(τηcG)(DeBuhr et al., 2010) independent of the presence of the AGN wind removing massfrom the nuclear region (where fg and σ are the gas fraction and velocity dispersionat small radii, respectively).
Although the AGN wind feedback has little effect on the early time star formationand BH accretion, Figure 4.1 shows that after final coalescence both the BH accretionrate and the star formation rate decrease significantly more rapidly with the inclusionof the AGN wind. The effects of the BHs feedback are maximized at and after finalcoalescence because this is when the BH reaches its final mass (to within a factor ofa few) and when the BH accretion rate is largest. Thus, the dynamics at and after
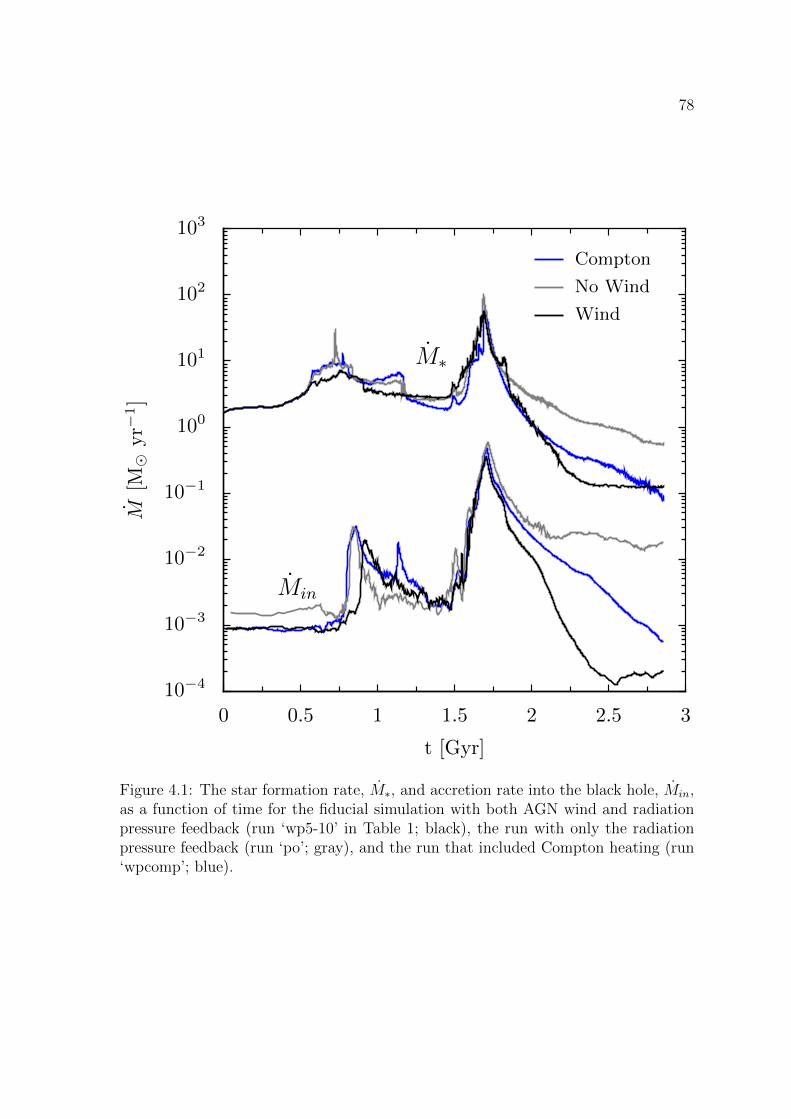
78
M∗
Min
10−4
10−3
10−2
10−1
100
101
102
103
M[M
⊙yr−
1]
0 0.5 1 1.5 2 2.5 3
t [Gyr]
Compton
No Wind
Wind
Figure 4.1: The star formation rate, M∗, and accretion rate into the black hole, Min,as a function of time for the fiducial simulation with both AGN wind and radiationpressure feedback (run ‘wp5-10’ in Table 1; black), the run with only the radiationpressure feedback (run ‘po’; gray), and the run that included Compton heating (run‘wpcomp’; blue).
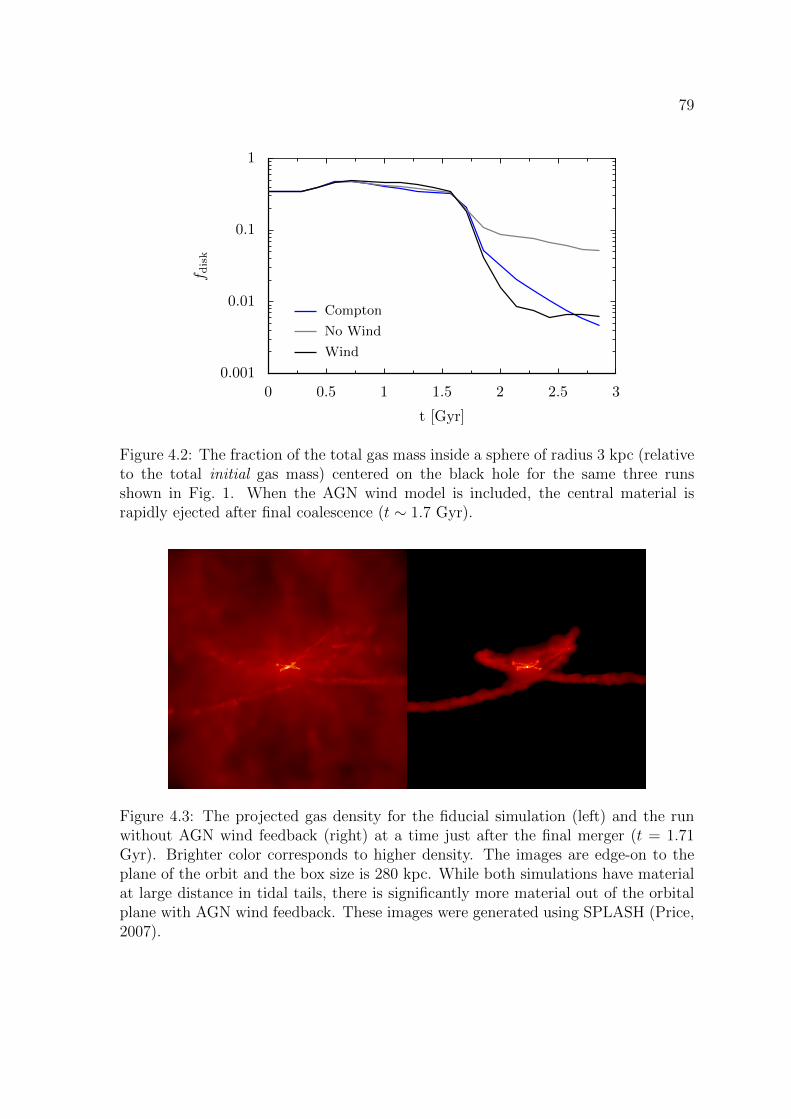
79
0.001
0.01
0.1
1
f dis
k
0 0.5 1 1.5 2 2.5 3
t [Gyr]
Compton
No Wind
Wind
Figure 4.2: The fraction of the total gas mass inside a sphere of radius 3 kpc (relativeto the total initial gas mass) centered on the black hole for the same three runsshown in Fig. 1. When the AGN wind model is included, the central material israpidly ejected after final coalescence (t ∼ 1.7 Gyr).
Figure 4.3: The projected gas density for the fiducial simulation (left) and the runwithout AGN wind feedback (right) at a time just after the final merger (t = 1.71Gyr). Brighter color corresponds to higher density. The images are edge-on to theplane of the orbit and the box size is 280 kpc. While both simulations have materialat large distance in tidal tails, there is significantly more material out of the orbitalplane with AGN wind feedback. These images were generated using SPLASH (Price,2007).

80
final coalescence is the most sensitive to the details of the feedback physics.To assess why the late-time accretion and star formation are suppressed by the
inclusion of the AGN wind, Figure 4.2 shows the gas mass fraction (normalized to thegas mass at the start of the simulation) within 3 kpc of the BH as a function of time,for the same three simulations as in Figure 4.1.1 Tidal interactions drive gas intothe center of the two galaxies (or the merged remnant) after the first close passage(t ∼ 0.5 Gyr) and at final coalescence (t ∼ 1.7 Gyr), maintaining a large nucleargas fraction in spite of the intense star formation. The resulting increase in the BHaccretion rate (seen also in Fig. 4.1) significantly increases the strength of the AGNfeedback. In the simulation including AGN winds, this feedback efficiently removesmaterial from the central regions of the galaxy, reducing the amount of gas insidethe central 3 kpc of the merged system by a factor of ∼ 10 relative to the simulationwithout explicit AGN winds.
Figure 4.3 shows images of the projected gas density for the fiducial simulation(left) and the corresponding simulation without the AGN wind (right) at t = 1.71 Gyr,shortly after final coalescence. The images are 280 kpc on a side and show a roughlyedge-on view of the orbital plane of the two galaxies. While there is material at largedistances in the simulation without the AGN wind, these features are the tidal tailsgenerated during the merger and most of this material is near the orbital plane. Thusour simple implementation of radiation pressure feedback is not efficient at unbindinggas from the galaxy, though it is very effective at regulating the growth of the BH itself(DeBuhr et al., 2011). By contrast, in the simulation with the AGN wind, Figure 4.3(left panel) shows that there is significantly more material blown out of the galaxy,especially in the directions perpendicular to the orbital plane. Quantitatively, atthe end of the simulation the mass of gas at large distances (|z| > 10 kpc) fromthe orbital plane is ' 3 × 10⁹M in the simulation including the AGN wind, about20 times larger than in the simulation with only radiation pressure feedback (seeTable 4.1 and Fig. 4.6 below). A corollary of this efficient removal of gas by the AGNwind is that the total stellar mass formed during the simulation is ∼ 20% smaller inthe case with the AGN wind; most of this suppression in star formation happens atlate times, after the final coalescence of the two galaxies (see Fig. 4.1).
Impact on the ISM
The evacuation of the central part of the galaxy by the AGN wind would not besurprising if the majority of the material ejected was explicitly added to the wind byour deposition of momentum (i.e., if the unbound mass was primarily material thatwas explicitly ’kicked’). We find that this is not the case. At the end of the fiducialsimulation (t = 2.85 Gyr), of the 33,028 gas particles at large transverse position(|z| > 10 kpc), only 8,904 of the particles have been explicitly kicked. The other 72%
1The precise choice of 3 kpc is somewhat arbitrary but the results in Figure 4.2 are relativelyrobust to changes in this choice.
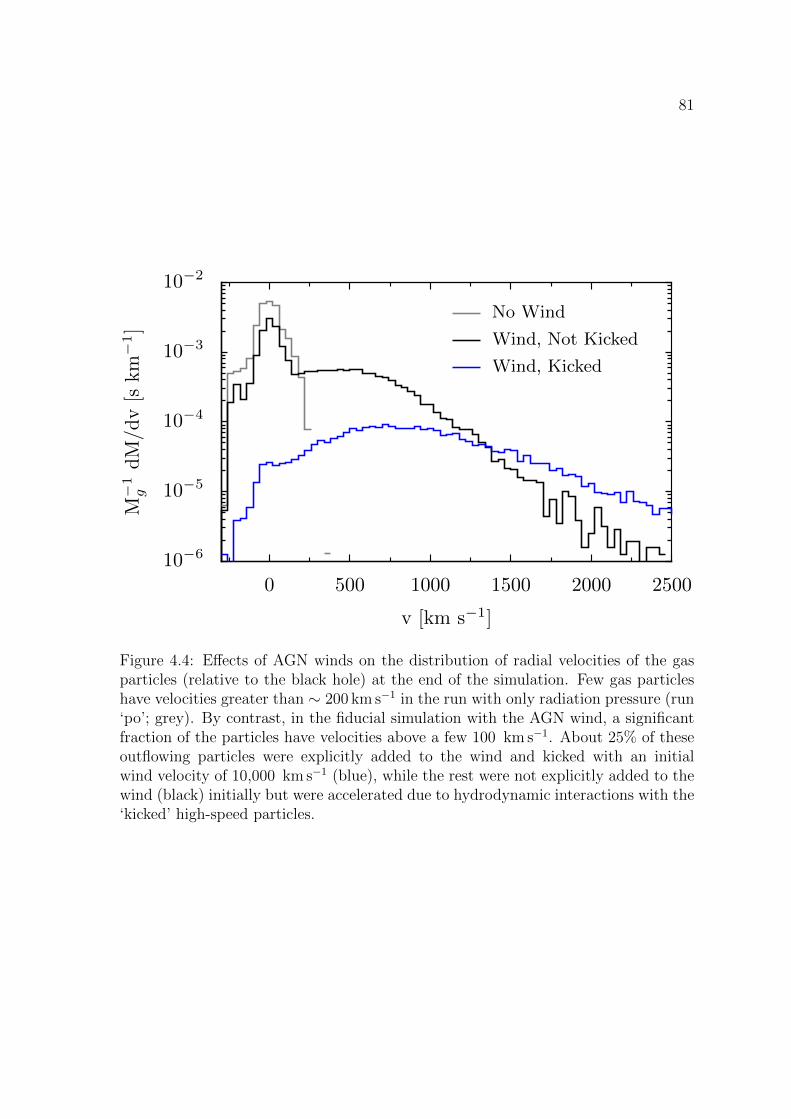
81
10−6
10−5
10−4
10−3
10−2
M−
1g
dM
/dv
[skm
−1]
0 500 1000 1500 2000 2500
v [km s−1]
No Wind
Wind, Not Kicked
Wind, Kicked
Figure 4.4: Effects of AGN winds on the distribution of radial velocities of the gasparticles (relative to the black hole) at the end of the simulation. Few gas particleshave velocities greater than ∼ 200 km s−1 in the run with only radiation pressure (run‘po’; grey). By contrast, in the fiducial simulation with the AGN wind, a significantfraction of the particles have velocities above a few 100 km s−1. About 25% of theseoutflowing particles were explicitly added to the wind and kicked with an initialwind velocity of 10,000 km s−1 (blue), while the rest were not explicitly added to thewind (black) initially but were accelerated due to hydrodynamic interactions with the‘kicked’ high-speed particles.
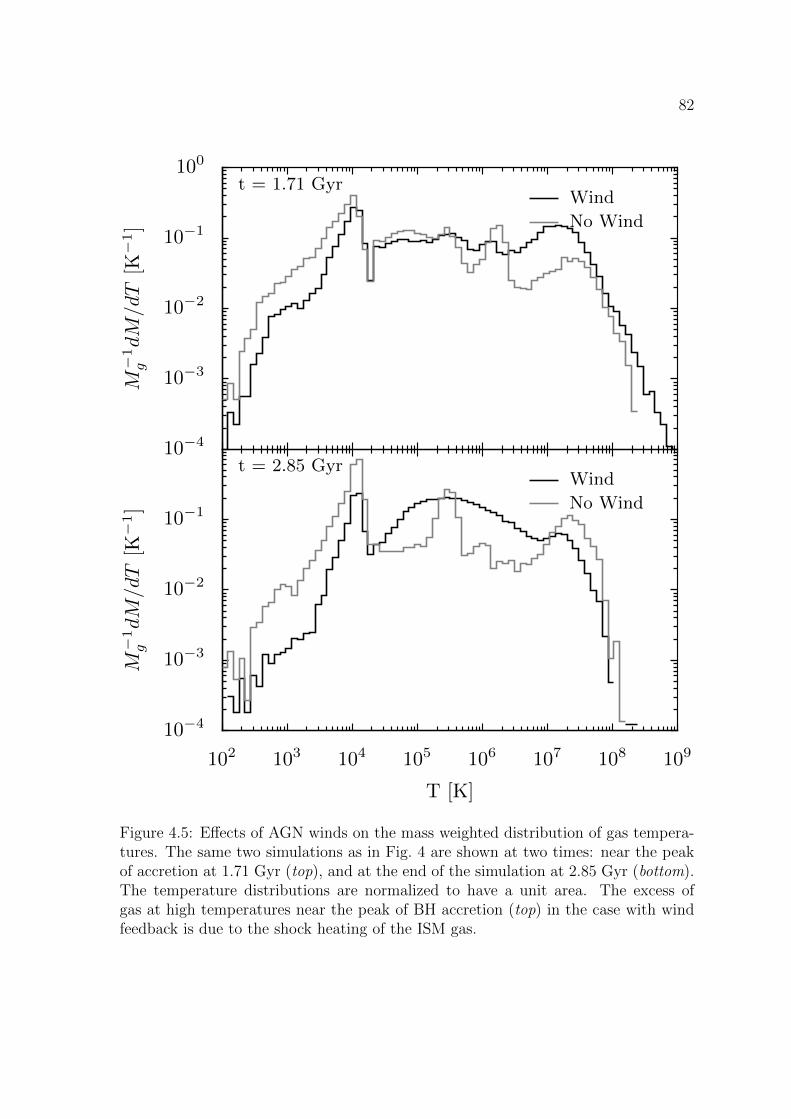
82
t = 1.71 Gyr
10−4
10−3
10−2
10−1
M−
1g
dM
/dT
[K−
1]
102 103 104 105 106 107 108 109
T [K]
Wind
No Wind
t = 2.85 Gyr10−4
10−3
10−2
10−1
100
M−
1g
dM
/dT
[K−
1]
Wind
No Wind
Figure 4.5: Effects of AGN winds on the mass weighted distribution of gas tempera-tures. The same two simulations as in Fig. 4 are shown at two times: near the peakof accretion at 1.71 Gyr (top), and at the end of the simulation at 2.85 Gyr (bottom).The temperature distributions are normalized to have a unit area. The excess ofgas at high temperatures near the peak of BH accretion (top) in the case with windfeedback is due to the shock heating of the ISM gas.
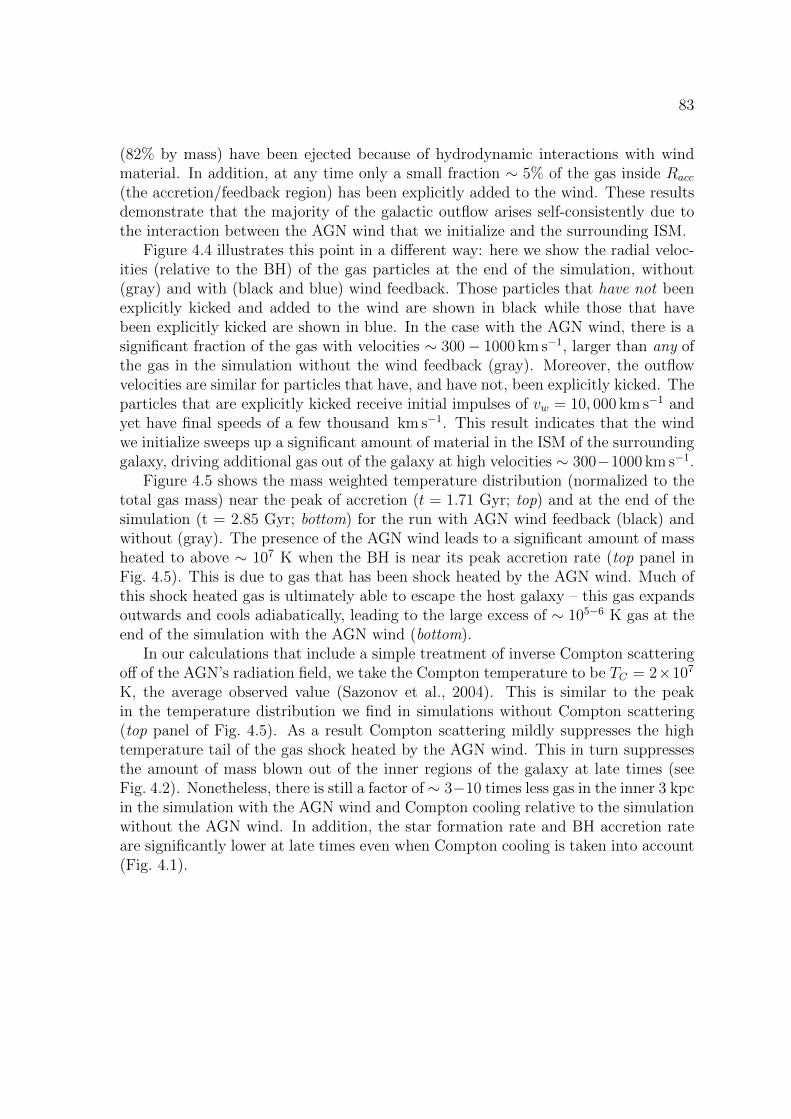
83
(82% by mass) have been ejected because of hydrodynamic interactions with windmaterial. In addition, at any time only a small fraction ∼ 5% of the gas inside Racc
(the accretion/feedback region) has been explicitly added to the wind. These resultsdemonstrate that the majority of the galactic outflow arises self-consistently due tothe interaction between the AGN wind that we initialize and the surrounding ISM.
Figure 4.4 illustrates this point in a different way: here we show the radial veloc-ities (relative to the BH) of the gas particles at the end of the simulation, without(gray) and with (black and blue) wind feedback. Those particles that have not beenexplicitly kicked and added to the wind are shown in black while those that havebeen explicitly kicked are shown in blue. In the case with the AGN wind, there is asignificant fraction of the gas with velocities ∼ 300− 1000 km s−1, larger than any ofthe gas in the simulation without the wind feedback (gray). Moreover, the outflowvelocities are similar for particles that have, and have not, been explicitly kicked. Theparticles that are explicitly kicked receive initial impulses of vw = 10, 000 km s−1 andyet have final speeds of a few thousand km s−1. This result indicates that the windwe initialize sweeps up a significant amount of material in the ISM of the surroundinggalaxy, driving additional gas out of the galaxy at high velocities ∼ 300−1000 km s−1.
Figure 4.5 shows the mass weighted temperature distribution (normalized to thetotal gas mass) near the peak of accretion (t = 1.71 Gyr; top) and at the end of thesimulation (t = 2.85 Gyr; bottom) for the run with AGN wind feedback (black) andwithout (gray). The presence of the AGN wind leads to a significant amount of massheated to above ∼ 107 K when the BH is near its peak accretion rate (top panel inFig. 4.5). This is due to gas that has been shock heated by the AGN wind. Much ofthis shock heated gas is ultimately able to escape the host galaxy – this gas expandsoutwards and cools adiabatically, leading to the large excess of ∼ 105−6 K gas at theend of the simulation with the AGN wind (bottom).
In our calculations that include a simple treatment of inverse Compton scatteringoff of the AGN’s radiation field, we take the Compton temperature to be TC = 2×10⁷
K, the average observed value (Sazonov et al., 2004). This is similar to the peakin the temperature distribution we find in simulations without Compton scattering(top panel of Fig. 4.5). As a result Compton scattering mildly suppresses the hightemperature tail of the gas shock heated by the AGN wind. This in turn suppressesthe amount of mass blown out of the inner regions of the galaxy at late times (seeFig. 4.2). Nonetheless, there is still a factor of ∼ 3−10 times less gas in the inner 3 kpcin the simulation with the AGN wind and Compton cooling relative to the simulationwithout the AGN wind. In addition, the star formation rate and BH accretion rateare significantly lower at late times even when Compton cooling is taken into account(Fig. 4.1).
84
4.3.2 Dependence on Feedback Model Parameters
In the previous section we demonstrated that an AGN wind generated at smallradii can produce a galaxy-wide outflow that unbinds several 109M of gas andsuppresses star formation in its host galaxy. In this section we explore in more detailhow this phenomenon depends on the properties of the AGN wind.
To quantify the effects of the AGN wind, we calculate the following quantities inall of our simulations and list the results in Table 4.1: (1) the final BH mass MBH,f ,(2) the total mass of new stars formed by the end of the simulation, M∗,f , (3) the totalmass of new stars formed after the peak of star formation,2 M∗,p, (4) the fraction of thegas mass within 3 kpc of the BH at the end of the simulation, fdisk = Mg,r<3kpc/Mg,tot,and (5) the fraction of the gas mass at large distances (& 10 kpc) above the orbitalplane at the end of the simulation, fout = Mg,|z|>10kpc/Mg,tot. The fractions fdisk andfout are both normalized to the initial total gas mass of 1.59 × 10¹⁰M (from bothgalaxies); fdisk is a proxy for how much gas remains in the galaxy while fout is a proxyfor the fraction of the gas that is in the outflow at late times. Table 4.1 also quotesMout, the absolute mass in the outflow at the end of the simulation.
Figure 4.6 compares these key quantities for simulations utilizing only the AGNwind feedback model (triangles) and for simulations with both radiation pressure andAGN wind (crosses). For comparison, we also show the results of the simulation withonly radiation pressure feedback, taking τ = 20 (dotted lines). In the left set ofpanels, we fix τw = 5 and vary the wind speed from 3, 000 − 10, 000 km s−1. In theright set of panels, we fix vw = 10, 000 km s−1 and vary τw from 1− 10.
Figure 4.6 (left panel) shows that the final BH mass is relatively independent ofthe speed of the AGN wind for a given value of τw. By contrast, for simulations withthe AGN wind model alone, the right panel shows that the final BH mass decreasesby a factor of ∼ 10 as τw increases from 1− 10.3 This is consistent with the analyticresults of King (2003) and Murray et al. (2005), and the numerical results of DeBuhret al. (2011), in which the final BH mass decreases linearly with the total momentumsupplied by the AGN, be it in the form of a wind or radiation. In particular, whenthe accretion rate is Eddington limited, the net force associated with the feedbackis ∝ τwLedd ∝ τwMBH (eq. 4.4). Thus the BH mass at which feedback is able toovercome the gravity of the gas in the galactic nuclei scales as MBH ∝ τ−1
w .Although the BH mass is only a weak function of vw at fixed τw, the properties
of the gas at the end of the simulation depend strongly on vw (bottom, left panels inFig. 4.6). Specifically, a larger wind speed vw at fixed τw leads to more efficient blowout of gas from the galaxy at late times (smaller fdisk and larger fout). For a givenvalue of τw, the momentum flux in the outflow (pw = τwL/c; eq. 4.4) is independent
2We distinguish between M∗,p and M∗,f because Figure 4.1 shows that the AGN wind’s largesteffect on the star formation history is at late times, after the peak of BH accretion and star formation.
3The same effect is much less evident in the simulations with radiation pressure and the AGNwind (crosses in the right panels) because the former largely sets the BH mass.
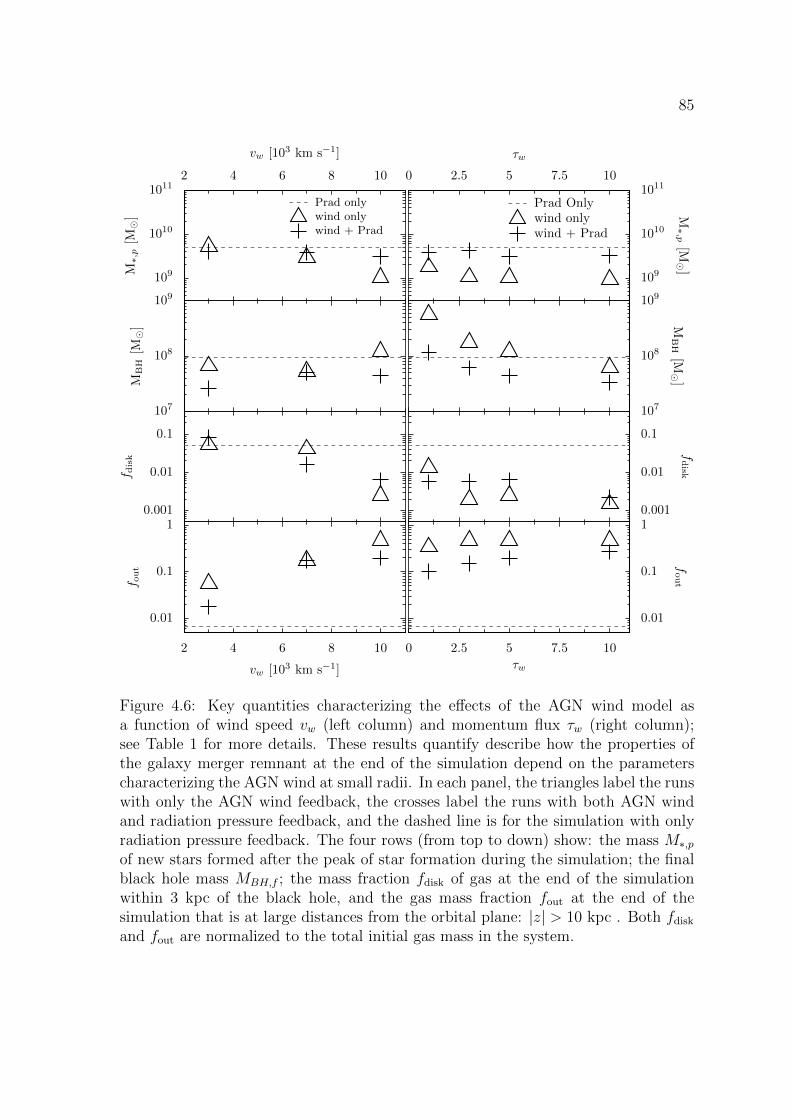
85
0.01
0.1
1
f out
2 4 6 8 10
vw [103 km s−1]
0.001
0.01
0.1
f disk
107
108
109
MBH[M
]
2 4 6 8 10
vw [103 km s−1]
109
1010
1011
M∗,p[M
]
Prad onlywind onlywind + Prad
0 2.5 5 7.5 10
τw
0.01
0.1
1
fout
0.001
0.01
0.1
fdisk
107
108
109
MBH[M
]
0 2.5 5 7.5 10
τw
109
1010
1011
M∗,p
[M]
Prad Onlywind onlywind + Prad
Figure 4.6: Key quantities characterizing the effects of the AGN wind model asa function of wind speed vw (left column) and momentum flux τw (right column);see Table 1 for more details. These results quantify describe how the properties ofthe galaxy merger remnant at the end of the simulation depend on the parameterscharacterizing the AGN wind at small radii. In each panel, the triangles label the runswith only the AGN wind feedback, the crosses label the runs with both AGN windand radiation pressure feedback, and the dashed line is for the simulation with onlyradiation pressure feedback. The four rows (from top to down) show: the mass M∗,pof new stars formed after the peak of star formation during the simulation; the finalblack hole mass MBH,f ; the mass fraction fdisk of gas at the end of the simulationwithin 3 kpc of the black hole, and the gas mass fraction fout at the end of thesimulation that is at large distances from the orbital plane: |z| > 10 kpc . Both fdisk
and fout are normalized to the total initial gas mass in the system.
86
of vw. By contrast, the energy flux in the outflow (Ew = pwvw) increases for a largerwind speed. Thus a larger wind speed leads to more efficient shock heating of the gasin the galactic nucleus. A larger value of τw has a similar effect, increasing both themomentum and energy fluxes in the wind, and producing a more powerful galaxy-scaleoutflow (bottom, right panels in Fig. 4.6).
Overall, then, the galaxy-wide outflow is a consequence of both the wind launchedfrom small radii sweeping up and driving out ambient gas and the wind generating ashock that heats and unbinds ambient gas. This is why the gas content in the outflow– as measured by fout in Figure 4.6 – increases with both increasing vw and increasingτw. In general the simulations with AGN wind feedback alone have somewhat higheroutflow rates than the simulations with AGN winds and radiation pressure. Thereason is that the feedback is then provided entirely by the wind, enabling it to bemore effective and unbind a larger amount of gas.
The mass of new stars formed in our simulations decreases for larger vw and/or τw(top panels in Fig. 4.6). This is a simple consequence of the galaxy-scale outflow beingmore powerful for larger vw and/or τw. The net effect of the outflow on the stellarmass formed in the simulation is, however, relatively modest (typically ∼ 10− 20%).The AGN wind’s most prominent effect on the star formation history is that it cansuppress the late-time star formation, as highlighted in Figure 4.1. It is also importantto note, however, that the outflow does not always have this effect. For example, thetop left panel of Figure 4.6 shows that simulations with outflows having τw = 5 andvw = 3000 km s−1 form a very similar amount of new stars (both in total and afterthe peak of star formation) to simulations with the radiation pressure feedback modelalone. This is consistent with the fact that for these parameters, the outflow does notappreciably change the gas content in the galactic disk (fdisk in Fig. 4.6), although itdoes unbind a modest amount of additional gas ∼ 3×10⁸M (see fout in Fig. 4.6 andMout in Table 4.1).
4.3.3 Numerical Tests
We argued in §4.3.1 and 4.3.2 that the galactic outflow seen in our simulationsis a consequence of both the AGN wind sweeping up ambient gas (momentum con-servation) and the AGN wind shock heating ambient gas and unbinding it (energyconservation). The former mechanism does not depend sensitively on the thermo-dynamics of the gas, while the latter does. As described in §4.2.5 we modified theISM equation of state of Springel and Hernquist (2003) in order to include two-bodycooling at solar metallicity; we also included a simple treatment of inverse Comptonscattering off of the AGN’s radiation field in some of our simulations (see Fig. 4.1).
To further assess the sensitivity of our results to the thermodynamics of the gas,we carried out a number of additional tests. In particular, two extremes are to usethe Springel and Hernquist (2003) model as is (in which gas that deviates from theequilibrium equation of state relaxes back on a timescale different from, and typically
87
Table 4.2: Resolution Test
Property High Fid LowM∗,t [109M] 11.5 10.9 10.2MBH,f [107M] 4.77 4.38 5.28fdisk 0.012 0.006 0.004fout 0.166 0.196 0.307Mout [109M] 2.65 3.13 4.89
Simulation properties are the same as those of the fiducial simulation in Table 1.The three simulations differ only in the mass resolution, with a total of 1.6× 10⁵
(low), 4.8× 10⁵ (fid), and 1.6× 10⁶ (high) particles.
longer than, the true cooling time), or to force gas to return to the effective equation ofstate of Springel and Hernquist (2003) instantaneously (thus removing the possibilityof strong shock heating unbinding gas). The results of these calculations with ourstandard AGN wind parameters are given in Table 4.1, labeled wpsh and wpinst,respectively. In both cases, the AGN wind drives a galaxy-scale outflow with anejected mass ∼ 3 × 10⁹M, very similar to our fiducial simulation. However, these’extreme’ ISM models have effects that are not surprising: Springel and Hernquist(2003)’s equation of state (in which the gas effectively cools more slowly) is moreeffective at suppressing star formation and clearing gas out of the nucleus (wpsh),while the simulation with instantaneous cooling (wpinst) retains a larger nuclear gasdisk at the end. Overall, however, these differences are modest – they are smaller,e.g., than the uncertainties introduced by the relatively poor current constraints onthe total momentum/energy flux in AGN winds (τw). This test demonstrates that ourtreatment of the ISM thermodynamics is probably sufficiently accurate to assess theimpact of AGN winds at the order of magnitude level. However, future calculationsthat incorporate a more realistic multi-phase, turbulent ISM (e.g., Hopkins et al.2011) will be very valuable.
Recently, Durier and Dalla Vecchia (2011) showed that after injection of energy,either thermally or kinetically, inaccuracies can arise in the subsequent evolution ofthe SPH particles when each is assigned a separate timestep, as occurs in GADGET.To ascertain if our feedback is subject to the innacuracies they report, we reran thefiducial simulation with an implementation of their timestep limiter. All of our keyqualitative conclusions are unchanged, though there is a modest (∼ 30 %) change inthe post merger star formation and disk fraction (fdisk).
Figure 4.7 shows the radial velocities of the SPH particles (relative to the BH)at the end of the simulation for three runs that differ only in the mass resolutionwith 1.6, 4.8, and 16.0 ×10⁵ particles, respectively. For the two higher resolutionsimulations, the distributions are quite similar for the bulk of the disk (v ∼ 0) andoutflow (v ∼ 500−1000 km s−1), though the high velocity tails differ somewhat. Table4.2 compares the integrated quantities shown in Figure 4.6. The biggest difference
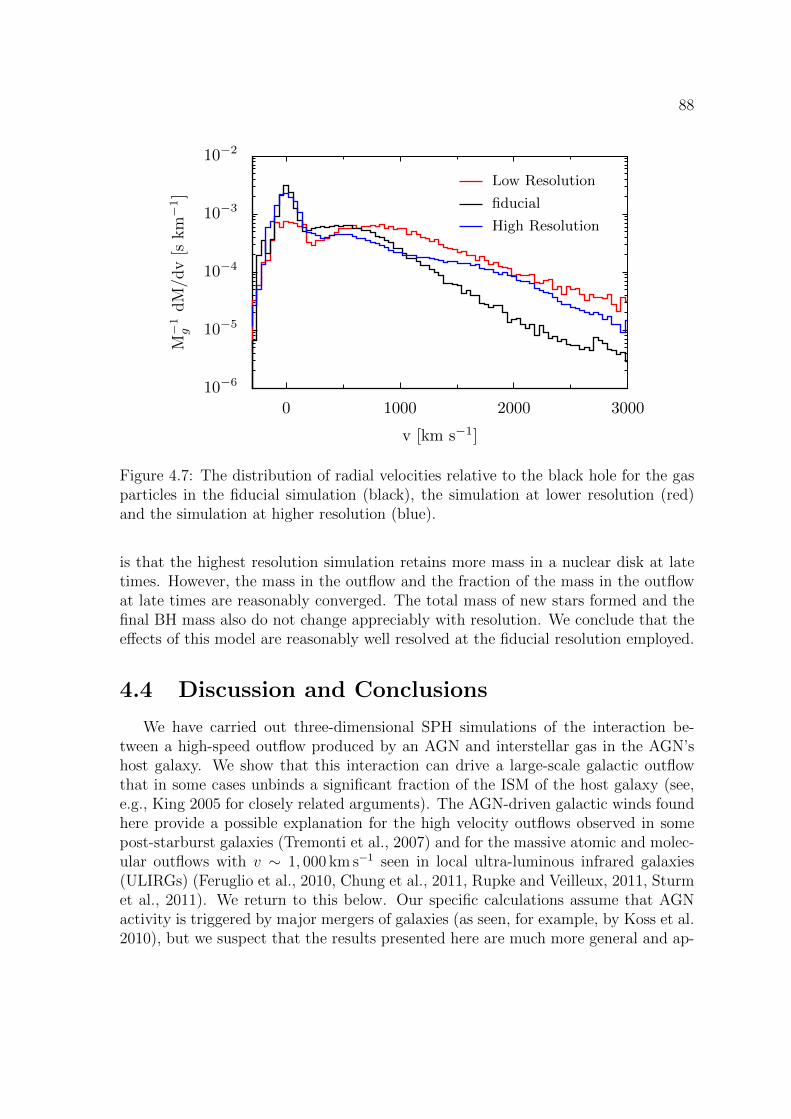
88
10−6
10−5
10−4
10−3
10−2
M−
1g
dM
/dv
[skm
−1]
0 1000 2000 3000
v [km s−1]
Low Resolution
fiducial
High Resolution
Figure 4.7: The distribution of radial velocities relative to the black hole for the gasparticles in the fiducial simulation (black), the simulation at lower resolution (red)and the simulation at higher resolution (blue).
is that the highest resolution simulation retains more mass in a nuclear disk at latetimes. However, the mass in the outflow and the fraction of the mass in the outflowat late times are reasonably converged. The total mass of new stars formed and thefinal BH mass also do not change appreciably with resolution. We conclude that theeffects of this model are reasonably well resolved at the fiducial resolution employed.
4.4 Discussion and Conclusions
We have carried out three-dimensional SPH simulations of the interaction be-tween a high-speed outflow produced by an AGN and interstellar gas in the AGN’shost galaxy. We show that this interaction can drive a large-scale galactic outflowthat in some cases unbinds a significant fraction of the ISM of the host galaxy (see,e.g., King 2005 for closely related arguments). The AGN-driven galactic winds foundhere provide a possible explanation for the high velocity outflows observed in somepost-starburst galaxies (Tremonti et al., 2007) and for the massive atomic and molec-ular outflows with v ∼ 1, 000 km s−1 seen in local ultra-luminous infrared galaxies(ULIRGs) (Feruglio et al., 2010, Chung et al., 2011, Rupke and Veilleux, 2011, Sturmet al., 2011). We return to this below. Our specific calculations assume that AGNactivity is triggered by major mergers of galaxies (as seen, for example, by Koss et al.2010), but we suspect that the results presented here are much more general and ap-
89
ply relatively independent of the physical mechanism(s) that drive gas into the central∼ 100 pc of galaxies. The physically-motivated model utilized here for AGN windfeedback is easy to implement (§4.2.4) and could readily be applied in other contexts,including high resolution simulations of galactic nuclei and cosmological simulationsof BH growth and evolution.
Our results provide a quantitative mapping between the properties of an AGNwind in the vicinity of the BH and the resulting large-scale galaxy-wide outflow (Table4.1 and Fig. 4.6). We have parametrized the AGN wind at small radii in terms ofits speed vw and momentum flux pw = τwL/c – the corresponding energy flux in thewind is Ew = 0.5 pw vw = 0.5 τw(vw/c)L.
We find that an AGN wind with vw ∼ 10, 000 km s−1 – typical of, e.g., broad-absorption line quasars – produces a galactic outflow with velocities ∼ 1, 000 km s−1.This reduction in velocity is a consequence of the AGN wind sweeping up and drivingout ∼ 5− 10 times as much mass as was in the wind initially (e.g., Fig. 4.4). Quan-titatively, we find that the AGN-driven galactic outflow unbinds ∼ 1 − 5 × 10⁹Mof gas, ∼ 10 − 40% of the initial gas in the two merging galaxies (which are MilkyWay-like spirals in our calculations). This is true for a wide range of outflow mod-els, covering τw ∼ 1 − 10, vw ∼ 7, 000 − 10, 000 km s−1, and with and without theradiation pressure feedback model from DeBuhr et al. (2010, 2011). Not surprisingly,AGN winds with larger momentum and energy fluxes (larger τw and vw) are moreeffective at driving galaxy-scale outflows (Fig. 4.6).
The mass outflow rate from the vicinity of the galaxy is somewhat noisy and thusdifficult to directly measure in the simulations. The average outflow rate relative tothe star formation rate can, however, be readily estimated by comparing the totalunbound mass (Mout in Table 4.1) with the mass in new stars formed in the simula-tion (M∗,f and M∗,p in Table 4.1, where M∗,f is the total mass of new stars formedand M∗,p is the mass of new stars formed after the peak of star formation). Thiscomparison implies that the average mass outflow rate is typically comparable to thestar formation rate; after the peak of star formation in the merger, which is when theBH reaches its final mass, the average outflow rate often exceeds the correspondingstar formation rate by factors of a few.
Physically, we find that the properties of the galaxy-wide outflow are determinedby both the momentum and energy fluxes in the AGN wind at small radii. A largermomentum flux implies that more mass can be swept out of the galaxy while a largerenergy flux in the wind (e.g., larger vw at fixed pw) leads to more shock heating of theambient ISM. This shocked gas partially cools but retains enough thermal energy tocontribute to driving the galaxy-wide outflow. For quantitatively accurate results wefind that it is necessary to modify the Springel and Hernquist (2003) equation of stateto properly include metal-line cooling and Compton heating/cooling as processes bywhich gas relaxes back to the effective equation of state that is used to calculate theISM pressure (see §4.2.5).
To produce a galaxy at the end of the simulation that is on the MBH − σ relation
90
using only feedback by our AGN wind model, we require τw & 5− 10 (see Table 4.1and Fig. 4.6; the velocity dispersion of the remnant galaxy is ' 170 km s−1 so thatMBH ' 7 × 10⁷M for galaxies on the mean MBH − σ relation). This requiredmomentum flux is comparable to, although somewhat smaller than, the requiredmomentum flux of p ∼ 20L/c that DeBuhr et al. (2011) found using a simple modelof radiation pressure feedback in which all particles in the vicinity of the BH feel aforce ∝ τ L/c. The energy flux corresponding to τw ∼ 5− 10 and vw ∼ 10, 000 km s−1
is E ∼ 0.1L, similar to the energy injection rate of ∼ 0.05L that Di Matteo et al.(2005) found was required to reproduce the MBH−σ relation (although they depositedthermal energy into ambient gas while we supply kinetic energy to a wind).
One important distinction that we find is between AGN driving galactic outflowsand AGN outflows regulating the growth of the BH. For example, in our models withτw = 1 and vw = 10, 000 km s−1, the final BH mass is a factor of ∼ 10 above themean MBH − σ relation in calculations that only include AGN wind feedback. Alsoincluding the simple radiation pressure feedback model from DeBuhr et al. (2011)in the simulation resolves this discrepancy; the same AGN wind model then unbinds∼ 109M of gas, ∼ 10% of the initial gas mass in the system. However, in spite of thisoutflow, the AGN wind neither regulates the BH growth nor has a significant effecton the average star formation in the system. This demonstrates that very powerfulAGN outflows with τw ∼ 3−10 are required for the BH to have a substantial effect oneither its own accretion history or the star formation in the surrounding galaxy. Thisconclusion is similar to that of Silk and Nusser (2010), who required a comparablemomentum to eject gas from their model galaxies, and to that of Kaviraj et al. (2011),who found that simple models for the color evolution of early type galaxies requiredfeedback similar in strength (E of a few percent) and duration (∼ 200 Myr) to whatwe find here.
The galactic outflows found in our simulations with vw ∼ 10, 000 km s−1 and τw &3 have properties broadly similar to those observed in some massive post-starburstgalaxies (Tremonti et al., 2007) and in local ULIRGs (Feruglio et al., 2010, Chunget al., 2011, Rupke and Veilleux, 2011, Sturm et al., 2011). Moreover, it is striking thatSturm et al. (2011) inferred pw ∼ 10L/c, i.e., τw ∼ 10, for the molecular outflowsin local ULIRGs (these values are uncertain at the factor of ∼ 3 level; see, e.g.,Sturm et al. 2011 for more details). This is comparable to the outflow momentumflux we find is required to both suppress late time star formation during galaxymergers and produce remnants approximately on the observed MBH − σ relation.This correspondence is encouraging, though it does not directly address the questionof what mechanism powers such outflows in the first place. The relative role ofstar formation and AGN in powering the ∼ 1000 km s−1 molecular outflows is alsounclear, with Sturm et al. (2011) presenting evidence from OH observations in favorof AGN, while Chung et al. (2011) argue that star-formation is the dominant powersource based on their CO observations. In addition, in some samples of post-starburstgalaxies, the observed outflows appear consistent with those driven by star formation
91
(Coil et al., 2011).From the theoretical perspective, the biggest uncertainty in applying our results
is the uncertainty in the absolute momentum/energy flux in AGN outflows at smallradii. This uncertainty remains even for the most well-characterized outflows, thoseof broad-absorption line (BAL) quasars. In theoretical models in which BAL outflowsare produced by radiation pressure on lines in the vicinity of the broad-line region, thepredicted momentum flux is typically . L/c, i.e., τw . 1 (Murray et al., 1995). Thisfollows from the fact that (observationally) the lines do not cover the entire contin-uum and thus cannot absorb the entire continuum momentum flux. This constraintis less clear for low-ionization BALs (in which the lines cover more of the continuum),but probably remains reasonably accurate. One way out of this conclusion is if mag-netic fields contribute to accelerating BAL outflows (as in, e.g., Proga 2003) sincethis can increase both the mass flux and terminal velocity of the outflow. There areobservational estimates that the momentum flux in some low-ionization BAL out-flows may indeed be & L/c (Moe et al., 2009, Bautista et al., 2010, Dunn et al.,2010), though these are difficult observations to interpret and they have complicatedselection effects.
In addition to line-driven winds, it is possible that even more powerful outflowsare driven during evolutionary phases distinct from optically bright quasars. Thetwo most promising from our point of view are: (1) outflows driven by radiationpressure on dust during phases when the ISM around the AGN is optically thick tofar-infrared radiation (Murray et al., 2005, DeBuhr et al., 2010). In this case themomentum flux in a small-scale AGN wind can in principle reach ∼ τL/c, where τis the infrared optical depth of the galactic nucleus. Such an outflow is not directlyseen in DeBuhr et al. (2011)’s simple implementation of radiation pressure feedback.However, this could easily be a limitation of the lack of a proper treatment of theinfrared radiative transfer. Indeed, we expect that radiation pressure will inevitablydrive a high-speed outflow off of the nuclear disk (‘torus’) at ∼ 1 − 10 pc. (2) Anadditional source of powerful high-speed outflows can be produced if the fueling rateof the central AGN significantly exceeds Eddington (e.g., King 2003). In this case,the accretion disk becomes radiatively inefficient and much of the nominally inflowingmass is likely unbound (e.g., Blandford and Begelman 1999). The disparity in spatialscales between the horizon and where the AGN accretion rate is set (∼ 1 − 10 pc;e.g., Hopkins and Quataert 2010b) implies that it is very likely that there is a phaseof super-Eddington fueling. The critical question is whether this phase lasts longenough to dominate the integrated properties of a black hole’s outflow.
All of the calculations presented in this paper utilize the effective equation of statemodel of Springel and Hernquist (2003) (modified as in §4.2.5) to pressurize the ISMand prevent runaway gravitational fragmentation. This is a very simplistic treatmentof ISM physics and in the future it is important to study the interaction between acentral AGN and the surrounding ISM using more realistic models that approximatethe turbulent, multi-phase structure of the ISM (e.g., Dobbs et al. 2011, Hopkins

92
et al. 2011).
93
Chapter 5
Stellar Disks in Aquarius DarkMatter Haloes
We investigate the evolution of stellar disks inserted into Aquarius dark matterhalos and evolved in a full cosmological environment. We introduce the stellar disksinto the Aquarius halos by first evolving the halo under the influence of a growingrigid disk potential from z = 1.3 to z = 1.0. The rigid potential is then replacedwith live particles and evolved in the dark matter halo to z = 0.0. Regardless of theinitial orientation of the disk, the inner parts of the halos contract under the actionof the disk and change from prolate to oblate as the disk grows to the full size, Wefind that the majority of the stellar disks form bars that dominate the dynamics ofthe disk within the inner few scale radii. The disks heat continuously throughout thesimulation and suffer a sharp increase in thickness and vertical velocity dispersionwhen the massive bars buckle. The heating signal is confounded by the bar, and nostrong statements can be made linking the disk evolution to the halo substructure.
5.1 Introduction
The Aquarius suite of simulations (Springel et al., 2008) have proved very usefulfor numerical explorations of galaxy formation. Scannapieco et al. (2009) performedresimulations of a number of Aquarius halos including the effects of a realistic multi-phase, star-forming gas and found that disks form easily, but can be destroyed bymergers or disk instabilities. Expanding on the previous by focusing on the effects ofthe baryons on the dark matter halos, Tissera et al. (2010) found that the detailedstructure of the halo depends on the specifics of how the halo was constructed. Anew method of including idealized disks Aumer and White (2012), starting with acollapsing spherical cloud of cooling, star-forming gas, has recently been developedand applied to the Aquarius halos. Though not using Aquarius, Sales et al. (2011)used similarly selected dark matter halos to explore the effects of halo parameters on
94
the resulting galaxy, and found that the resulting galaxy morphology had more to dowith the complete history of accretion rather than any property of the dark matterhalo.
However, many of these studies have difficulty in reproducing galaxies as observedtoday. The simulated galaxies often end with too large a mass (Guo et al., 2010),or without the right amount of star formation (Scannapieco et al., 2009). Further,substructure can easily destroy disks, leaving too little mass in a disk component. Ob-servationally, disk galaxies are thin (van der Kruit and Freeman, 2011). Numerically,however, they are startling easy to destroy or thicken (Purcell et al., 2009, Velazquezand White, 1999, Hopkins et al., 2009). Given the ease of destroying disks, one isleft wondering how any disks survive to today, especially when the frequent impactof halo substructure is taken into account.
In this paper, we present simulations of stellar disks inserted into a number of theAquarius halos. Rather than focusing on the full growth of the disk throughout thehistory of the halo, we consider the effects of the realistic setting of the Aquarius haloson a stellar disk that has already formed. The method presented can be thought of asa means to test the evolution of disk properties as they relate to the specific historyof the dark matter halo in which they are embedded.
Much earlier work has studied stellar disks in a cosmological setting. Dark mat-ter halos in ΛCDM cosmologies are found numerically to be generally triaxial (see,e.g., Bullock 2002, Allgood et al. 2006). This asymmetry in the halo can triggerthe formation of bars (Heller et al., 2007a,b), which have important effects on thesubsequent evolution of the disk. Bars can also form as a result of interactions withsubstructure (Romano-Dıaz et al., 2008). Given this, it is no surprise that a largenumber of works easily produce bars. In a series of papers Curir et al. (2006) inves-tigated disks, comprised of stars both with and without a gas component insertedinto a cosmological context, albeit at a resolution lower than what we employ in thiswork, and find their model generically grows a bar. Both the effect of a stellar bar onthe halo’s evolution (Berentzen and Shlosman, 2006), and the effect of the halo on astellar bar’s evolution (Berentzen et al., 2006) have been considered in realistic darkmatter halos. Including a live dark matter halo supports (rather than suppresses)bar formation (Athanassoula, 2002). Machado and Athanassoula (2010) consider thegrowth of bars in both circular and elliptical disks inserted into dark matter halosand the resulting loss of triaxiality in the halo. Stellar bars are also susceptible tothe buckling instability, which has a dramatic effect on the dynamics of disks (Debat-tista et al., 2006, Martinez-Valpuesta et al., 2006, Martinez-Valpuesta and Shlosman,2004).
Bars are not the only possible source of disk heating. Simulations of isolatedhalos with single mergers (Velazquez and White, 1999, Purcell et al., 2009, Hopkinset al., 2009, Moster et al., 2010), for cosmologically motivated histories of multiplemergers (Bournaud et al., 2007, Kazantzidis et al., 2008, 2009), and also including gasdynamics (Moster et al., 2010, 2011) all lead to the conclusion that substructure is
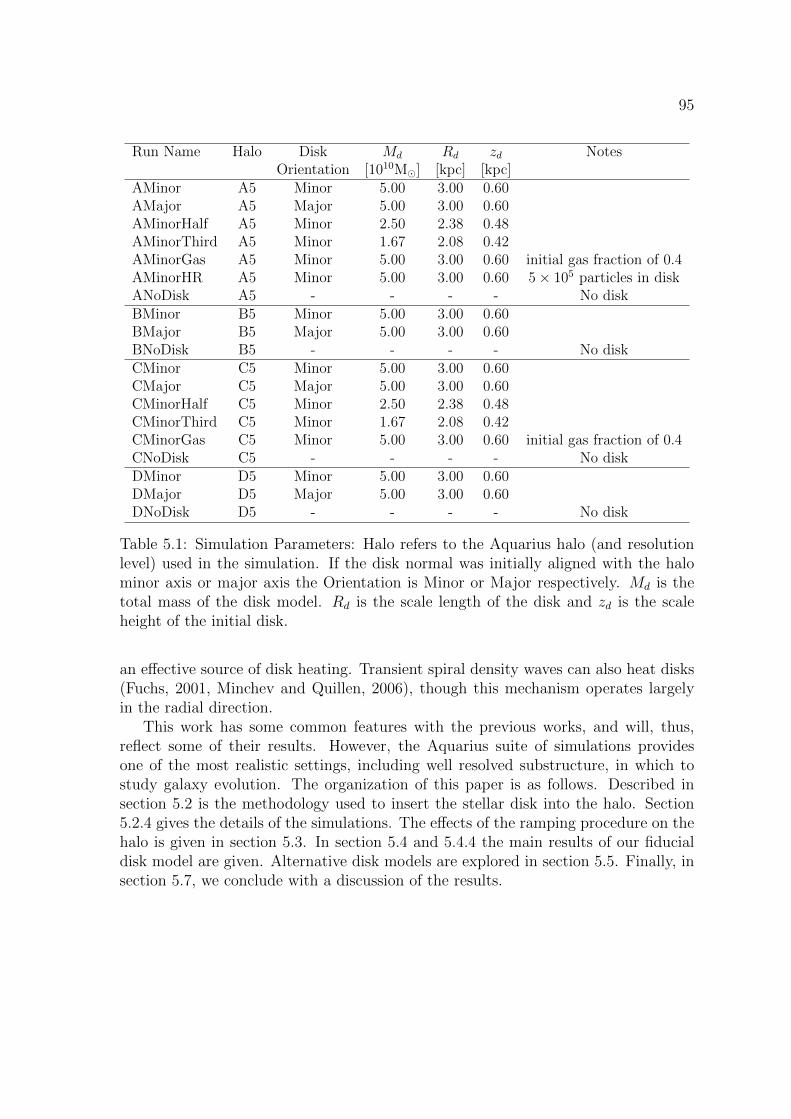
95
Run Name Halo Disk Md Rd zd NotesOrientation [1010M] [kpc] [kpc]
AMinor A5 Minor 5.00 3.00 0.60AMajor A5 Major 5.00 3.00 0.60AMinorHalf A5 Minor 2.50 2.38 0.48AMinorThird A5 Minor 1.67 2.08 0.42AMinorGas A5 Minor 5.00 3.00 0.60 initial gas fraction of 0.4AMinorHR A5 Minor 5.00 3.00 0.60 5× 10⁵ particles in diskANoDisk A5 - - - - No diskBMinor B5 Minor 5.00 3.00 0.60BMajor B5 Major 5.00 3.00 0.60BNoDisk B5 - - - - No diskCMinor C5 Minor 5.00 3.00 0.60CMajor C5 Major 5.00 3.00 0.60CMinorHalf C5 Minor 2.50 2.38 0.48CMinorThird C5 Minor 1.67 2.08 0.42CMinorGas C5 Minor 5.00 3.00 0.60 initial gas fraction of 0.4CNoDisk C5 - - - - No diskDMinor D5 Minor 5.00 3.00 0.60DMajor D5 Major 5.00 3.00 0.60DNoDisk D5 - - - - No disk
Table 5.1: Simulation Parameters: Halo refers to the Aquarius halo (and resolutionlevel) used in the simulation. If the disk normal was initially aligned with the halominor axis or major axis the Orientation is Minor or Major respectively. Md is thetotal mass of the disk model. Rd is the scale length of the disk and zd is the scaleheight of the initial disk.
an effective source of disk heating. Transient spiral density waves can also heat disks(Fuchs, 2001, Minchev and Quillen, 2006), though this mechanism operates largelyin the radial direction.
This work has some common features with the previous works, and will, thus,reflect some of their results. However, the Aquarius suite of simulations providesone of the most realistic settings, including well resolved substructure, in which tostudy galaxy evolution. The organization of this paper is as follows. Described insection 5.2 is the methodology used to insert the stellar disk into the halo. Section5.2.4 gives the details of the simulations. The effects of the ramping procedure on thehalo is given in section 5.3. In section 5.4 and 5.4.4 the main results of our fiducialdisk model are given. Alternative disk models are explored in section 5.5. Finally, insection 5.7, we conclude with a discussion of the results.
96
5.2 Methods
To study the evolution of stellar disks in a full cosmological environment, webegin with a suite of dark matter haloes from the Aquarius simulations (Springelet al., 2008). We then add a stellar disk to each Aquarius halo in two phases. Duringthe first phase – starting at z = 1.3 and ending at z = 1.0 – the dark matter isallowed to react to a rigid disk potential whose mass increases from zero at z = 1.3to the desired final mass at z = 1. At the start of the second ‘live’ phase (at z = 1.0),the rigid disk is replaced with live simulation particles. This live disk is then evolvedself-consistently along with all the dark matter particles to z = 0. Below we describeeach step in detail.
5.2.1 Dark Matter Haloes
The high-resolution zoom-in simulations of dark matter haloes in the Aquariusproject are chosen from a cosmological box that assumed a ΛCDM universe withΩΛ = 0.75, Ωm = 0.25, Ωb = 0.04, σ8 = 0.9 and H0 = 73 km s−1Mpc−1.
In this work we select haloes A, B, C and D at the resolution level 5. Thisresolution level corresponds to dark matter particle masses of ≈ 3 × 10⁶M, and acomoving gravitational force softening length of 685 pc. The virial mass of the fourdark matter haloes at z = 0 is 1.49 × 10¹²M, 7.11 × 10¹¹M, 1.61 × 10¹²M, and1.49 × 1012M, respectively. Despite their comparable final masses, the four haloeshave different merger histories. While each halo has a fair number of small subhalomergers, the level of activity for infalling satellites above one tenth the disk mass Md
(chosen to be 5×10¹⁰M for the fiducial disk model) varies from halo to halo. HaloesA and B are relatively quiet after z ∼ 0.7 when a subhalo of mass ∼ 0.3Md impactsin each. Halo C has a number of larger subhaloes in the latter part of our simulation(z < 0.5), where the most two massive subhaloes have masses of 0.22Md and 0.16Md.Halo D has the most active history, with appreciable encounters spread throughoutthe simulation.
Scannapieco et al. (2009) resimulated these haloes with gas and found the z = 0disk-to-bulge ratios to vary significantly. Halo C and D each had a disk-to-bulgeratio of around 0.25, whereas halos A and B had a ratio of less than 0.1 at the endof their simulations because of extended periods of strong mis-alignment betweenthe cold gaseous and stellar components. These values were based on kinematicdecompositions; a photometric decomposition generally gives larger values.
5.2.2 Phase 1: Adding a Rigid Disk
We modified a version of GADGET-2 (Springel, 2005) to add a rigid stellar diskpotential to the existing dark matter particles. The potential corresponds to an
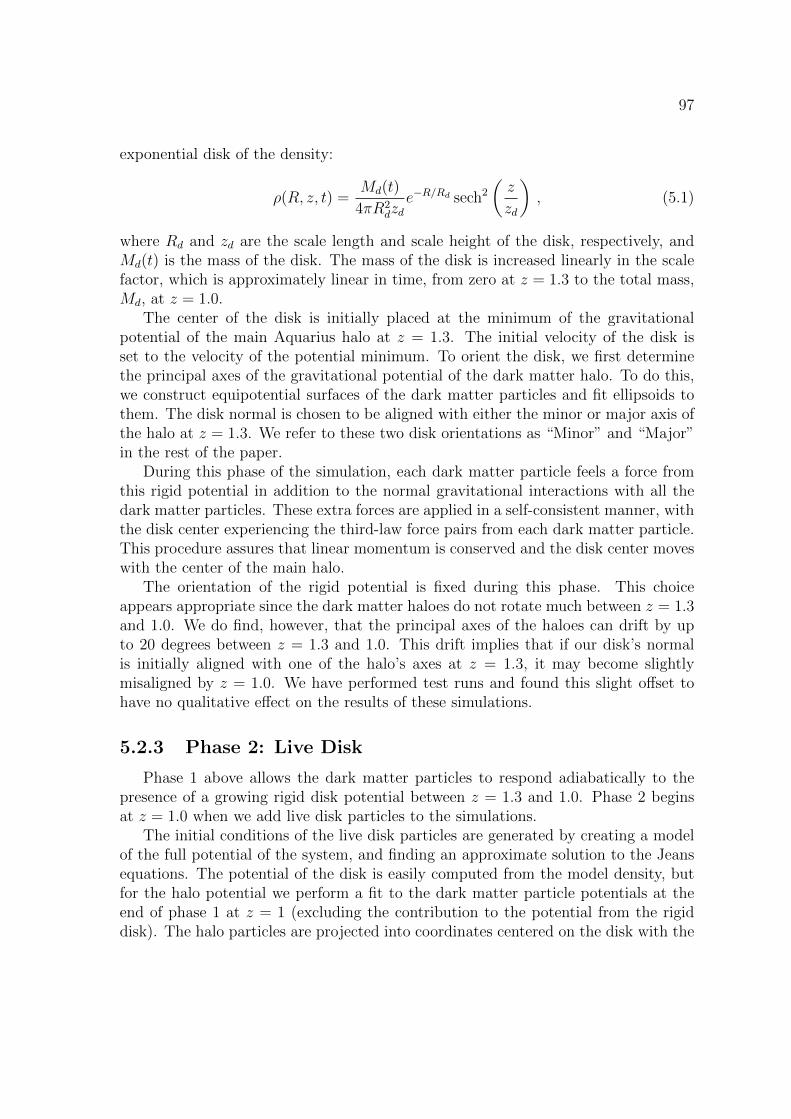
97
exponential disk of the density:
ρ(R, z, t) =Md(t)
4πR2dzd
e−R/Rd sech2
(z
zd
), (5.1)
where Rd and zd are the scale length and scale height of the disk, respectively, andMd(t) is the mass of the disk. The mass of the disk is increased linearly in the scalefactor, which is approximately linear in time, from zero at z = 1.3 to the total mass,Md, at z = 1.0.
The center of the disk is initially placed at the minimum of the gravitationalpotential of the main Aquarius halo at z = 1.3. The initial velocity of the disk isset to the velocity of the potential minimum. To orient the disk, we first determinethe principal axes of the gravitational potential of the dark matter halo. To do this,we construct equipotential surfaces of the dark matter particles and fit ellipsoids tothem. The disk normal is chosen to be aligned with either the minor or major axis ofthe halo at z = 1.3. We refer to these two disk orientations as “Minor” and “Major”in the rest of the paper.
During this phase of the simulation, each dark matter particle feels a force fromthis rigid potential in addition to the normal gravitational interactions with all thedark matter particles. These extra forces are applied in a self-consistent manner, withthe disk center experiencing the third-law force pairs from each dark matter particle.This procedure assures that linear momentum is conserved and the disk center moveswith the center of the main halo.
The orientation of the rigid potential is fixed during this phase. This choiceappears appropriate since the dark matter haloes do not rotate much between z = 1.3and 1.0. We do find, however, that the principal axes of the haloes can drift by upto 20 degrees between z = 1.3 and 1.0. This drift implies that if our disk’s normalis initially aligned with one of the halo’s axes at z = 1.3, it may become slightlymisaligned by z = 1.0. We have performed test runs and found this slight offset tohave no qualitative effect on the results of these simulations.
5.2.3 Phase 2: Live Disk
Phase 1 above allows the dark matter particles to respond adiabatically to thepresence of a growing rigid disk potential between z = 1.3 and 1.0. Phase 2 beginsat z = 1.0 when we add live disk particles to the simulations.
The initial conditions of the live disk particles are generated by creating a modelof the full potential of the system, and finding an approximate solution to the Jeansequations. The potential of the disk is easily computed from the model density, butfor the halo potential we perform a fit to the dark matter particle potentials at theend of phase 1 at z = 1 (excluding the contribution to the potential from the rigiddisk). The halo particles are projected into coordinates centered on the disk with the
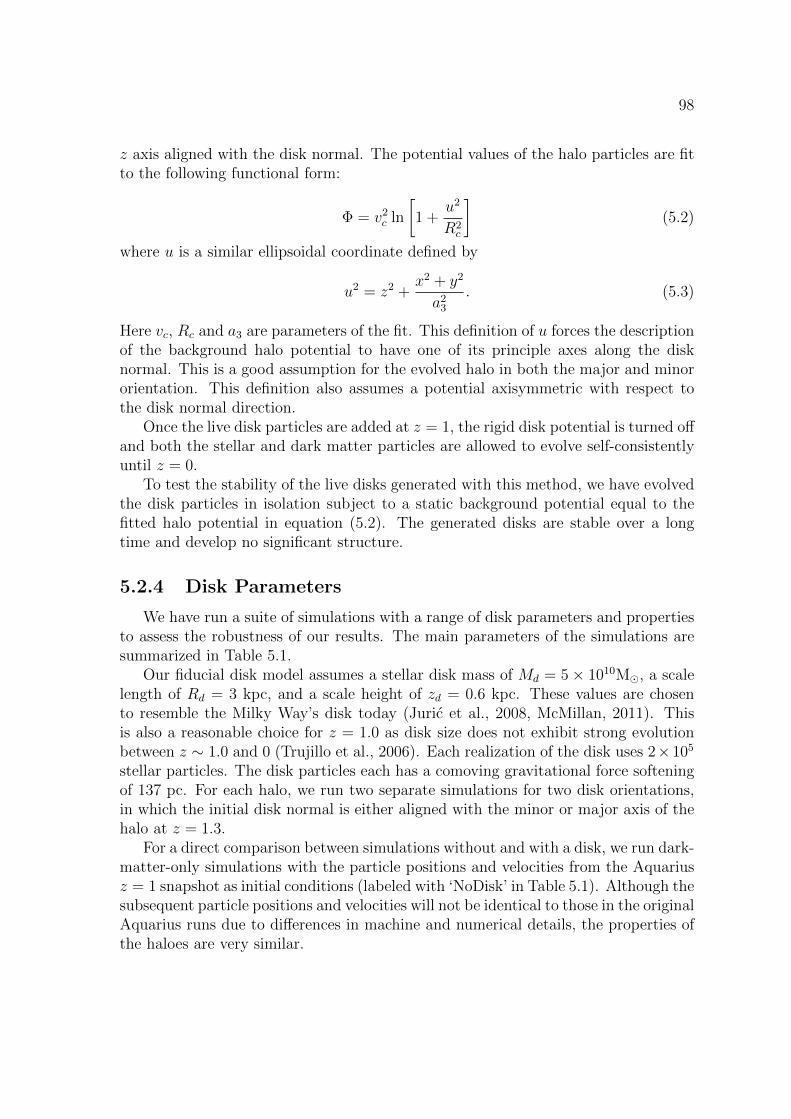
98
z axis aligned with the disk normal. The potential values of the halo particles are fitto the following functional form:
Φ = v2c ln
[1 +
u2
R2c
](5.2)
where u is a similar ellipsoidal coordinate defined by
u2 = z2 +x2 + y2
a23
. (5.3)
Here vc, Rc and a3 are parameters of the fit. This definition of u forces the descriptionof the background halo potential to have one of its principle axes along the disknormal. This is a good assumption for the evolved halo in both the major and minororientation. This definition also assumes a potential axisymmetric with respect tothe disk normal direction.
Once the live disk particles are added at z = 1, the rigid disk potential is turned offand both the stellar and dark matter particles are allowed to evolve self-consistentlyuntil z = 0.
To test the stability of the live disks generated with this method, we have evolvedthe disk particles in isolation subject to a static background potential equal to thefitted halo potential in equation (5.2). The generated disks are stable over a longtime and develop no significant structure.
5.2.4 Disk Parameters
We have run a suite of simulations with a range of disk parameters and propertiesto assess the robustness of our results. The main parameters of the simulations aresummarized in Table 5.1.
Our fiducial disk model assumes a stellar disk mass of Md = 5× 10¹⁰M, a scalelength of Rd = 3 kpc, and a scale height of zd = 0.6 kpc. These values are chosento resemble the Milky Way’s disk today (Juric et al., 2008, McMillan, 2011). Thisis also a reasonable choice for z = 1.0 as disk size does not exhibit strong evolutionbetween z ∼ 1.0 and 0 (Trujillo et al., 2006). Each realization of the disk uses 2×10⁵
stellar particles. The disk particles each has a comoving gravitational force softeningof 137 pc. For each halo, we run two separate simulations for two disk orientations,in which the initial disk normal is either aligned with the minor or major axis of thehalo at z = 1.3.
For a direct comparison between simulations without and with a disk, we run dark-matter-only simulations with the particle positions and velocities from the Aquariusz = 1 snapshot as initial conditions (labeled with ‘NoDisk’ in Table 5.1). Although thesubsequent particle positions and velocities will not be identical to those in the originalAquarius runs due to differences in machine and numerical details, the properties ofthe haloes are very similar.
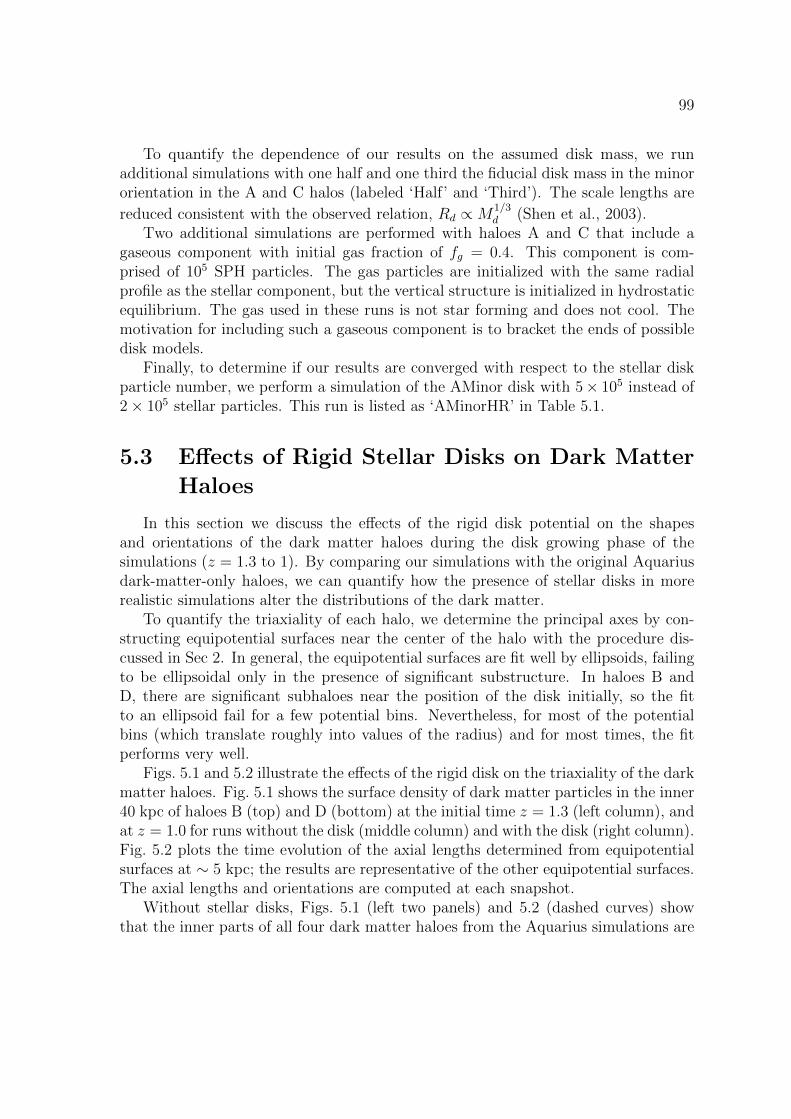
99
To quantify the dependence of our results on the assumed disk mass, we runadditional simulations with one half and one third the fiducial disk mass in the minororientation in the A and C halos (labeled ‘Half’ and ‘Third’). The scale lengths are
reduced consistent with the observed relation, Rd ∝M1/3d (Shen et al., 2003).
Two additional simulations are performed with haloes A and C that include agaseous component with initial gas fraction of fg = 0.4. This component is com-prised of 105 SPH particles. The gas particles are initialized with the same radialprofile as the stellar component, but the vertical structure is initialized in hydrostaticequilibrium. The gas used in these runs is not star forming and does not cool. Themotivation for including such a gaseous component is to bracket the ends of possibledisk models.
Finally, to determine if our results are converged with respect to the stellar diskparticle number, we perform a simulation of the AMinor disk with 5× 10⁵ instead of2× 105 stellar particles. This run is listed as ‘AMinorHR’ in Table 5.1.
5.3 Effects of Rigid Stellar Disks on Dark Matter
Haloes
In this section we discuss the effects of the rigid disk potential on the shapesand orientations of the dark matter haloes during the disk growing phase of thesimulations (z = 1.3 to 1). By comparing our simulations with the original Aquariusdark-matter-only haloes, we can quantify how the presence of stellar disks in morerealistic simulations alter the distributions of the dark matter.
To quantify the triaxiality of each halo, we determine the principal axes by con-structing equipotential surfaces near the center of the halo with the procedure dis-cussed in Sec 2. In general, the equipotential surfaces are fit well by ellipsoids, failingto be ellipsoidal only in the presence of significant substructure. In haloes B andD, there are significant subhaloes near the position of the disk initially, so the fitto an ellipsoid fail for a few potential bins. Nevertheless, for most of the potentialbins (which translate roughly into values of the radius) and for most times, the fitperforms very well.
Figs. 5.1 and 5.2 illustrate the effects of the rigid disk on the triaxiality of the darkmatter haloes. Fig. 5.1 shows the surface density of dark matter particles in the inner40 kpc of haloes B (top) and D (bottom) at the initial time z = 1.3 (left column), andat z = 1.0 for runs without the disk (middle column) and with the disk (right column).Fig. 5.2 plots the time evolution of the axial lengths determined from equipotentialsurfaces at ∼ 5 kpc; the results are representative of the other equipotential surfaces.The axial lengths and orientations are computed at each snapshot.
Without stellar disks, Figs. 5.1 (left two panels) and 5.2 (dashed curves) showthat the inner parts of all four dark matter haloes from the Aquarius simulations are
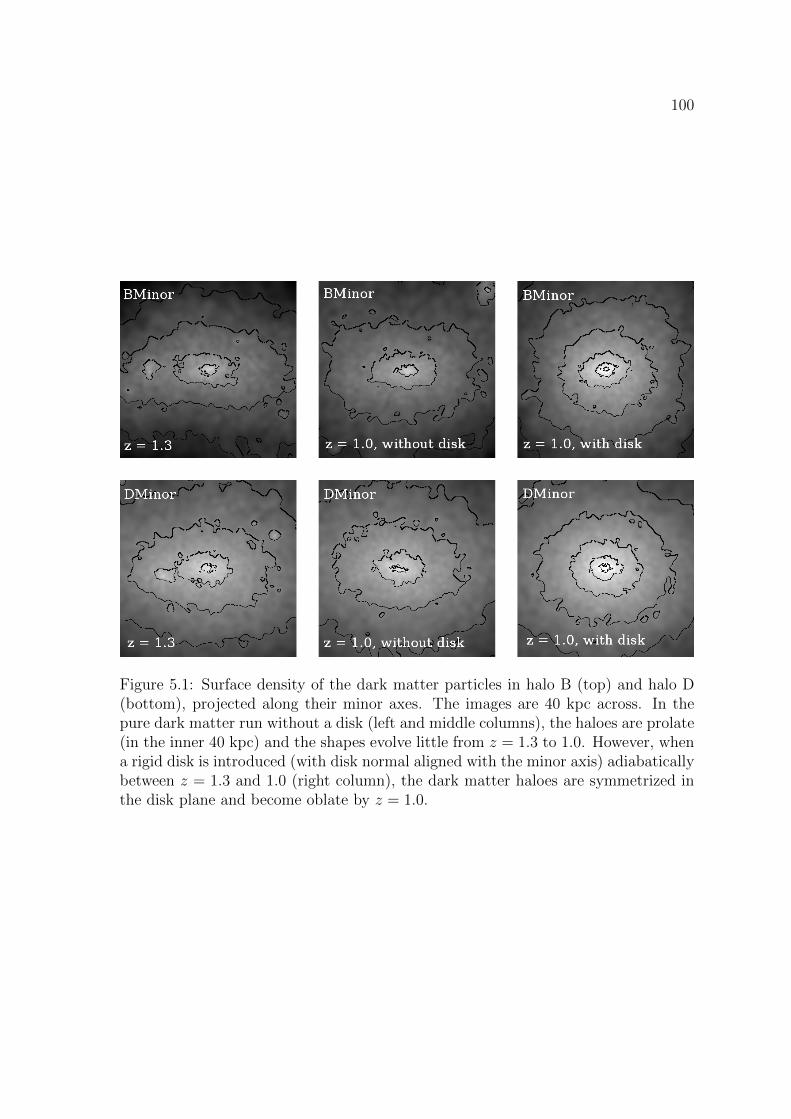
100
Figure 5.1: Surface density of the dark matter particles in halo B (top) and halo D(bottom), projected along their minor axes. The images are 40 kpc across. In thepure dark matter run without a disk (left and middle columns), the haloes are prolate(in the inner 40 kpc) and the shapes evolve little from z = 1.3 to 1.0. However, whena rigid disk is introduced (with disk normal aligned with the minor axis) adiabaticallybetween z = 1.3 and 1.0 (right column), the dark matter haloes are symmetrized inthe disk plane and become oblate by z = 1.0.
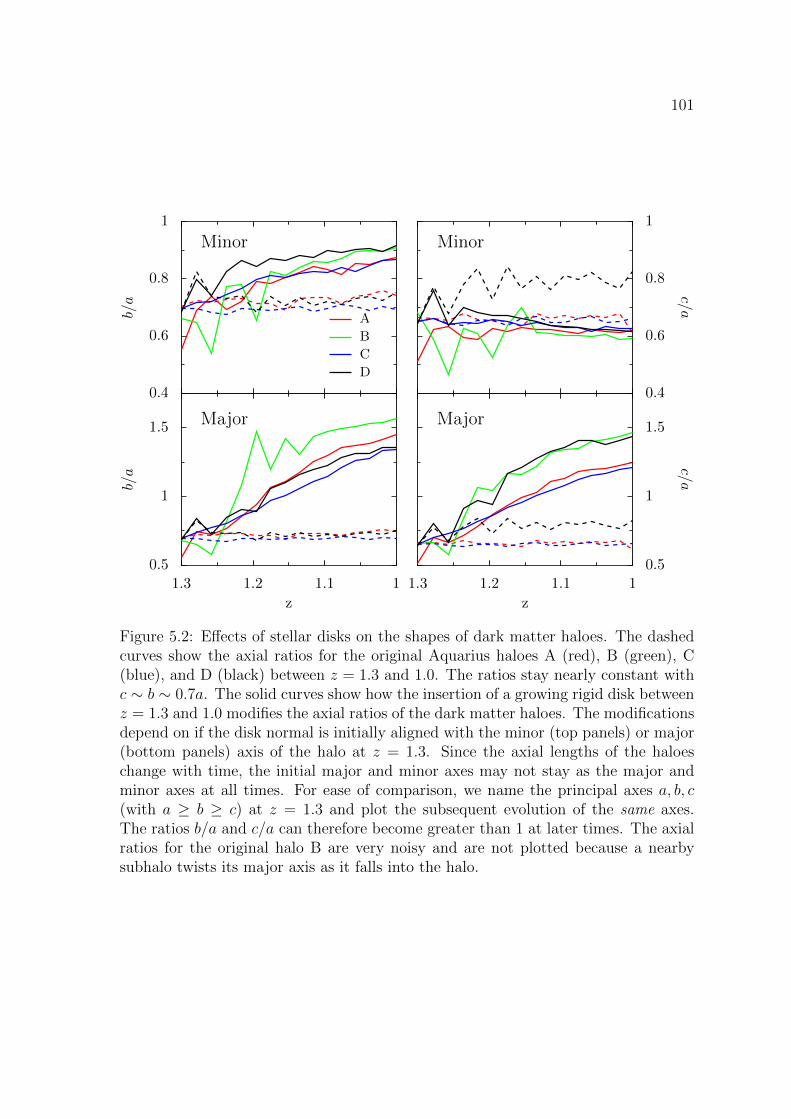
101
Major
0.5
1
1.5
b/a
11.11.21.3
z
Major
11.11.21.3
z
0.5
1
1.5
c/a
Minor
0.4
0.6
0.8
1
b/a
A
B
C
D
Minor
0.4
0.6
0.8
1
c/a
Figure 5.2: Effects of stellar disks on the shapes of dark matter haloes. The dashedcurves show the axial ratios for the original Aquarius haloes A (red), B (green), C(blue), and D (black) between z = 1.3 and 1.0. The ratios stay nearly constant withc ∼ b ∼ 0.7a. The solid curves show how the insertion of a growing rigid disk betweenz = 1.3 and 1.0 modifies the axial ratios of the dark matter haloes. The modificationsdepend on if the disk normal is initially aligned with the minor (top panels) or major(bottom panels) axis of the halo at z = 1.3. Since the axial lengths of the haloeschange with time, the initial major and minor axes may not stay as the major andminor axes at all times. For ease of comparison, we name the principal axes a, b, c(with a ≥ b ≥ c) at z = 1.3 and plot the subsequent evolution of the same axes.The ratios b/a and c/a can therefore become greater than 1 at later times. The axialratios for the original halo B are very noisy and are not plotted because a nearbysubhalo twists its major axis as it falls into the halo.
102
prolate with axial ratios of c ∼ b ∼ 0.7a. The ratios stay quite constant betweenz = 1.3 and 1.0.
How the halo responds to the disk depends on the orientation of the disk. Whenthe disk normal is initially aligned with the minor axis of the halo, we find the presenceof the disk to nearly symmetrize the axial ratio of the dark matter halo in the diskplane, as shown by the rounder contours in the right panels of Fig. 5.1. The solidcurves in the upper two panels of Fig. 5.2 show the corresponding evolution in theaxial ratios: b/a evolves from ∼ 0.7 towards 0.9, while c/a remains relatively constantat ∼ 0.6 to 0.7 between z = 1.3 and 1.0. The inner ∼ 50 kpc of the haloes thereforechange from being prolate to nearly oblate in the presence of a disk in the minororientation.
When the disk normal is initially aligned with the major axis of the halo, the haloin the disk plane starts out quite symmetric since b ∼ c at z = 1.3. As the solid curvesin the lower panels of Fig. 5.2 show, the presence of the disk significantly increasesb/a and c/a as the initial major axis a contracts, but the ratio of b/c is relativelyconstant. The haloes become nearly spherical at z ∼ 1.2, after which the initial majoraxis becomes the minor axis as b/a and c/a both exceed unity. Note that for easeof comparison, we name the principal axes a, b, c (with a ≥ b ≥ c) at z = 1.3 andplot the subsequent evolution of the same axes. The haloes therefore again evolvefrom being prolate to oblate in the presence of a disk in the major orientation. Thedifference here is the disk normal that was initially aligned with the halo’s major axisat z = 1.3 ends up being aligned with the halo’s minor axis at z = 1, and this occursbecause of changes in the axial lengths of the halo rather than re-orientation of thedisk.
Our results for the shapes of haloes without and with a stellar disk are in broadagreement with previous work. Dark matter haloes in N -body simulations generallyhave a range of shapes with a preference for prolateness over oblateness (Bett et al.,2007). The shapes can also depend on the radius, exhibiting a variation from prolatein the inner regions to triaxial or oblate in the outer parts (Vera-Ciro et al., 2011).To study the effects of disks on haloes, Kazantzidis et al. (2010) use mergers ofidealized haloes to create an initially triaxial halo and find that a triaxial or prolatehalo becomes more spherical under the effects of the rigid disk potential. Their disksin the major orientation end up more spherical than oblate as in our case, but thatcould be an effect of having an isolated halo. Infalling material in a fully cosmologicalsimulation such as the Aquarius can easily modify the results. Berentzen andShlosman (2006) performed simulations of disks growing in a cosmological setting, andalso found that the growing disk washed out the prolateness of the halo. Interestingly,while the change in halo shape was sensitive to the total disk mass, it was not sensitiveto how the mass was introduced, be it gradually or abruptly.
In addition to changes in the axial ratios, adding a stellar disk can also reorientthe halo’s equipotential surfaces between z = 1.3 and 1.0. Comparing the haloes inour simulations with disks and those in the original Aquarius simulations, we find
103
that with the exception of halo B, the major axis of the halo does not experiencesignificant reorientation in the presence of a growing disk. In halo B, a subhalo isvisible at ∼ 15 kpc from the disk center at z = 1.3 in Fig. 5.1. In the original Aquariushalo, this subhalo twists the major axis of halo B as it falls into the halo. The axiallength for halo B is therefore quite noisy and is not plotted in Fig. 5.2. When a stellardisk is added, we find the major axis to be more stable due to the influence of therigid disk.
5.4 Live Stellar Disks and Bar Formation
In this section we present the results for the evolution of the live stellar disks inthe Aquarius dark matter haloes from z = 1.0 to 0.
5.4.1 Structural Properties of Live Disks
Images of the final (z = 0) surface densities of the live disks are plotted in Fig. 5.3.For completeness, we show both the face-on and edge-on views of each disk in thefour haloes. The left two columns show the disks that are initially aligned with theminor axis of the halo; the right two columns show the major axis runs. The images(43 kpc on a side) clearly show that a bar extending to at least 2Rd has formed ineach disk, with halo C containing the weakest bar. We will further quantify the barstrength and evolution in § 4.2.
The edge-on images of the disks in Fig. 5.3 reveal a large variation in the amountof material outside the disk plane. The CMinor, DMinor, AMajor, and CMajor haloescontain a prominent diffuse component of stars extending to tens of kpc outside thedisk plane, whereas this component is nearly absent in the other four haloes. We willexamine the kinematic properties of these stars in § 4.3 and their correlation withouter warps of the disk plane in § 4.4.
Fig. 5.4 shows snapshots of the disk surface density (left) and mean vertical height(middle) between z = 1 and 0, and the z = 0 vertical profile (right) for the four“Minor” disks (from top down). Fig. 5.5 shows the same quantities for the four“Major” disks. The central surface density of the disk in the left column is seen toincrease with time when a stellar bar forms. In addition, there is a slight enhancementat large radii in each case. This effect is most pronounced in the B disks and leastpronounced in the C disks. The increase of material at large radii tends to increasethe best fit scale length Rd of the disk, but we find the effect to be at most at the∼ 20% level: Rd increases from the initial value of 3 kpc at z = 1 to ∼ 3.4, 3.7, and3.3 kpc at z = 0 for haloes A, B, and D, respectively. The scale length for halo C, bycontrast, stays quite constant. We note, however, that the surface density profiles ofBMajor and BMinor in Figs. 5.4 and 5.5 exhibit noticeable deviations from the initialexponential form by the end of the simulation.
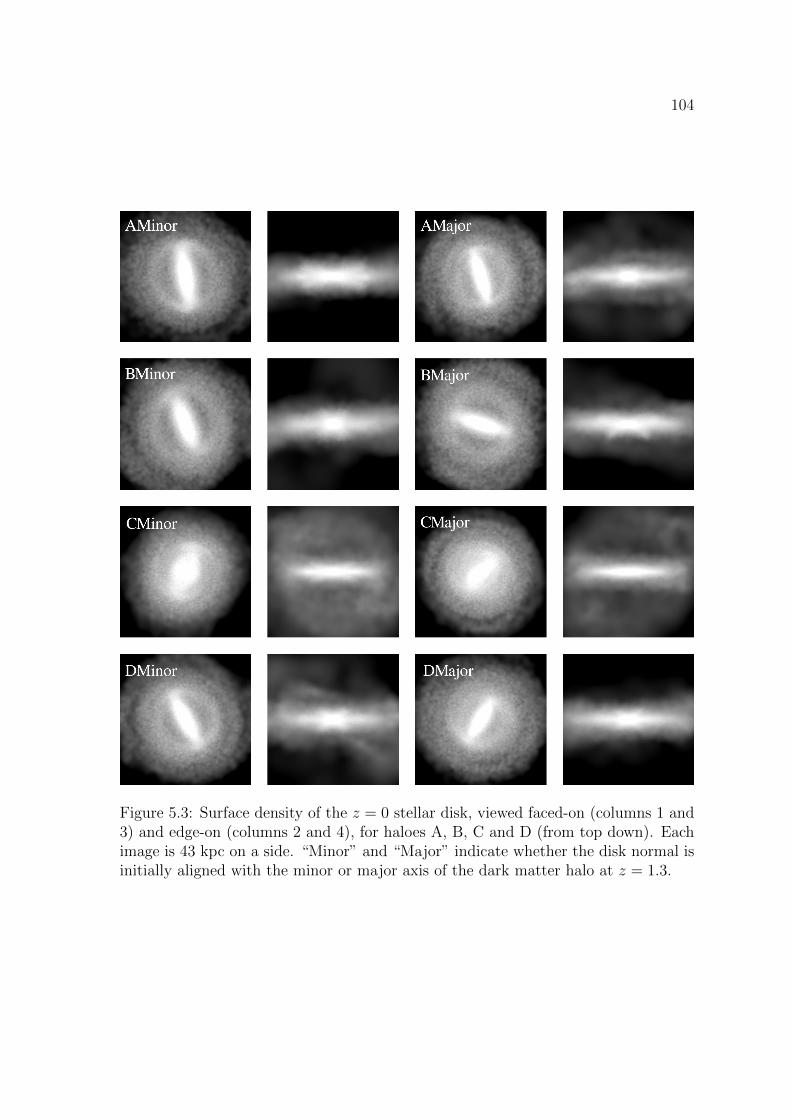
104
Figure 5.3: Surface density of the z = 0 stellar disk, viewed faced-on (columns 1 and3) and edge-on (columns 2 and 4), for haloes A, B, C and D (from top down). Eachimage is 43 kpc on a side. “Minor” and “Major” indicate whether the disk normal isinitially aligned with the minor or major axis of the dark matter halo at z = 1.3.
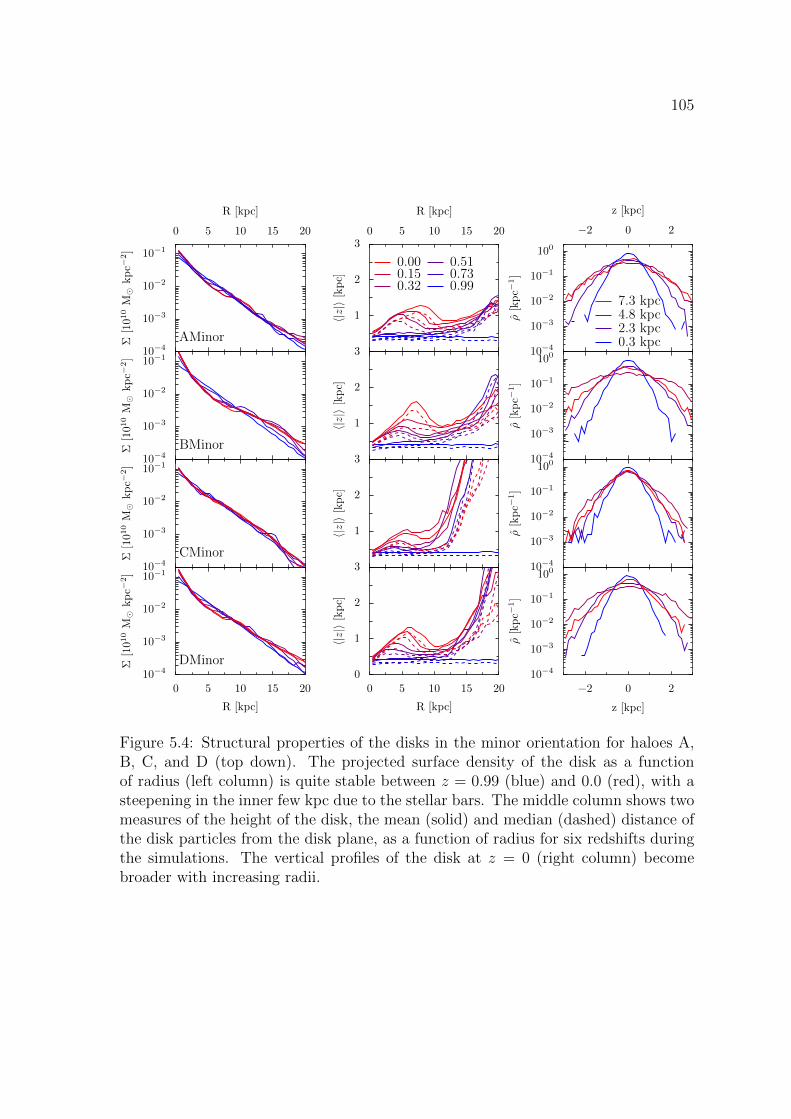
105
DMinor10−4
10−3
10−2
10−1
Σ[101
0M
kpc−
2]
0 5 10 15 20
R [kpc]
10−4
10−3
10−2
10−1
100
ρ[kpc−
1]
−2 0 2
z [kpc]
0
1
2
3
〈|z|〉[kpc]
0 5 10 15 20
R [kpc]
AMinor
0 5 10 15 20
R [kpc]
10−4
10−3
10−2
10−1
Σ[1010M
kpc−
2]
−2 0 2
z [kpc]
10−4
10−3
10−2
10−1
100
ρ[kpc−
1]
7.3 kpc4.8 kpc2.3 kpc0.3 kpc
0 5 10 15 20
R [kpc]
1
2
3
〈|z|〉[kpc]
0.000.150.32
0.510.730.99
BMinor10−4
10−3
10−2
10−1
Σ[1010M
kpc−
2]
10−4
10−3
10−2
10−1
100
ρ[kpc−
1]
1
2
3
〈|z|〉[kpc]
CMinor10−4
10−3
10−2
10−1
Σ[101
0M
kpc−
2]
10−4
10−3
10−2
10−1
100
ρ[kpc−
1]
1
2
3
〈|z|〉[kpc]
Figure 5.4: Structural properties of the disks in the minor orientation for haloes A,B, C, and D (top down). The projected surface density of the disk as a functionof radius (left column) is quite stable between z = 0.99 (blue) and 0.0 (red), with asteepening in the inner few kpc due to the stellar bars. The middle column shows twomeasures of the height of the disk, the mean (solid) and median (dashed) distance ofthe disk particles from the disk plane, as a function of radius for six redshifts duringthe simulations. The vertical profiles of the disk at z = 0 (right column) becomebroader with increasing radii.
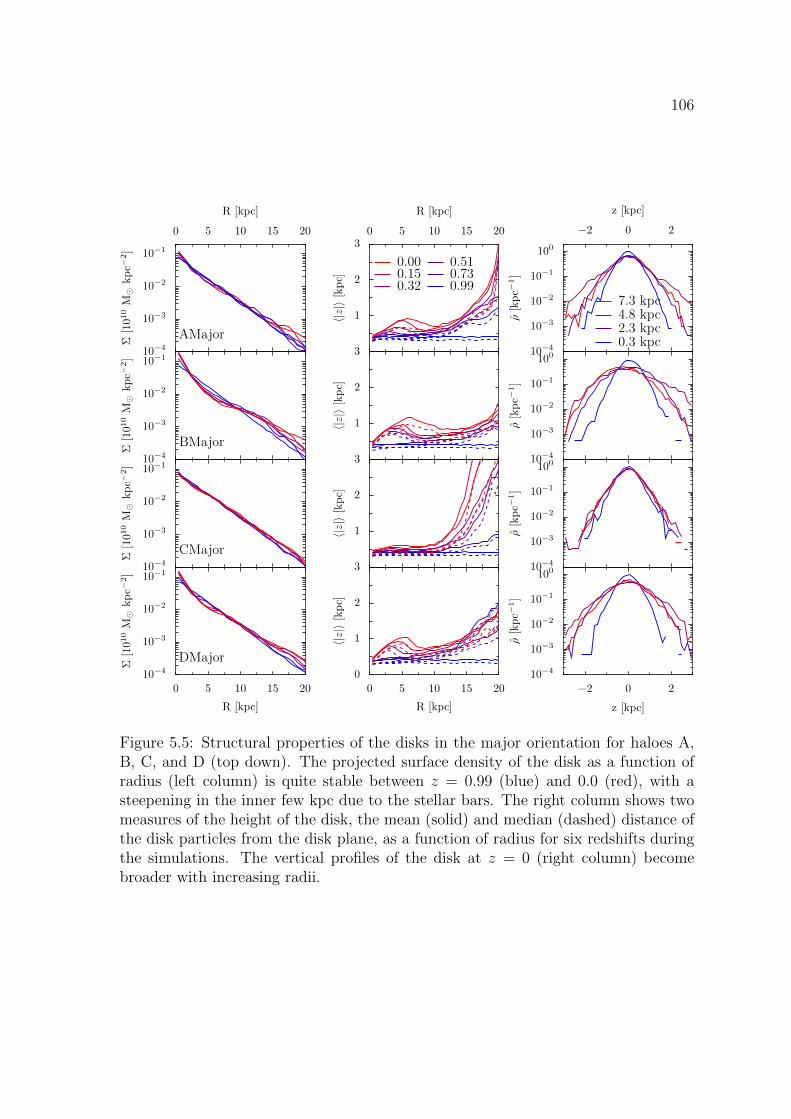
106
DMajor10−4
10−3
10−2
10−1
Σ[101
0M
kpc−
2]
0 5 10 15 20
R [kpc]
10−4
10−3
10−2
10−1
100
ρ[kpc−
1]
−2 0 2
z [kpc]
0
1
2
3
〈|z|〉[kpc]
0 5 10 15 20
R [kpc]
AMajor
0 5 10 15 20
R [kpc]
10−4
10−3
10−2
10−1
Σ[1010M
kpc−
2]
−2 0 2
z [kpc]
10−4
10−3
10−2
10−1
100
ρ[kpc−
1]
7.3 kpc4.8 kpc2.3 kpc0.3 kpc
0 5 10 15 20
R [kpc]
1
2
3
〈|z|〉[kpc]
0.000.150.32
0.510.730.99
BMajor10−4
10−3
10−2
10−1
Σ[1010M
kpc−
2]
10−4
10−3
10−2
10−1
100
ρ[kpc−
1]
1
2
3
〈|z|〉[kpc]
CMajor10−4
10−3
10−2
10−1
Σ[101
0M
kpc−
2]
10−4
10−3
10−2
10−1
100
ρ[kpc−
1]
1
2
3
〈|z|〉[kpc]
Figure 5.5: Structural properties of the disks in the major orientation for haloes A,B, C, and D (top down). The projected surface density of the disk as a function ofradius (left column) is quite stable between z = 0.99 (blue) and 0.0 (red), with asteepening in the inner few kpc due to the stellar bars. The right column shows twomeasures of the height of the disk, the mean (solid) and median (dashed) distance ofthe disk particles from the disk plane, as a function of radius for six redshifts duringthe simulations. The vertical profiles of the disk at z = 0 (right column) becomebroader with increasing radii.
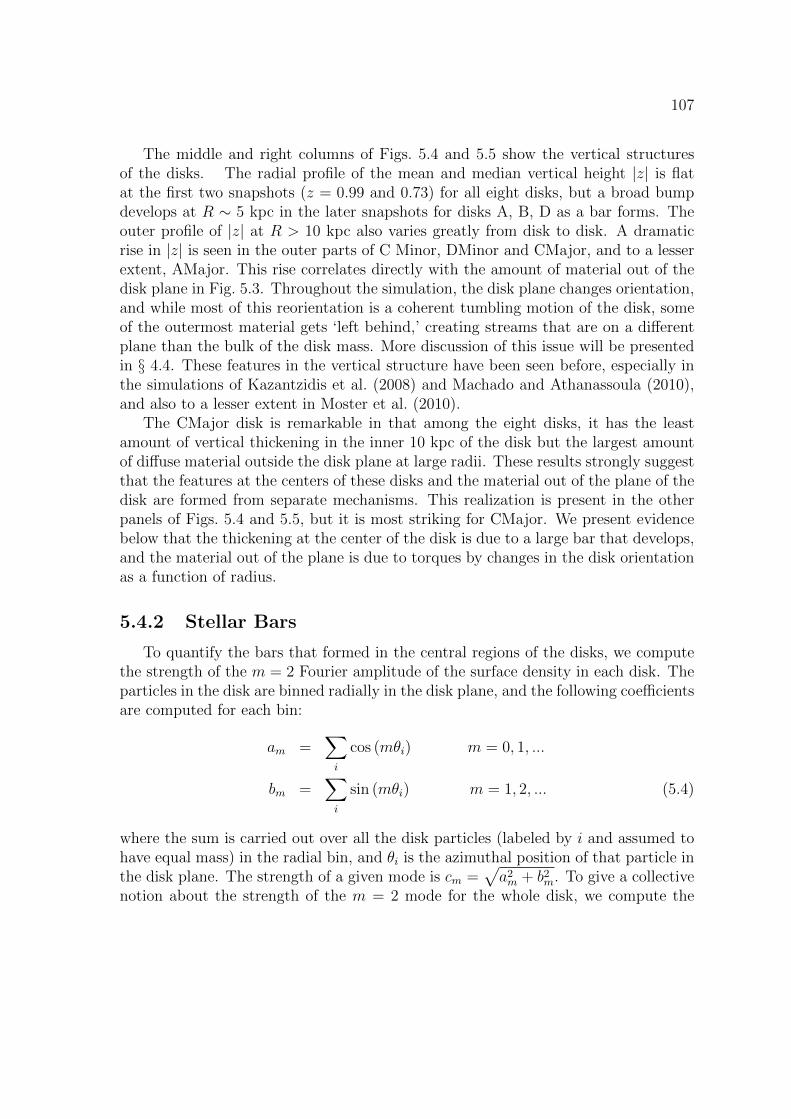
107
The middle and right columns of Figs. 5.4 and 5.5 show the vertical structuresof the disks. The radial profile of the mean and median vertical height |z| is flatat the first two snapshots (z = 0.99 and 0.73) for all eight disks, but a broad bumpdevelops at R ∼ 5 kpc in the later snapshots for disks A, B, D as a bar forms. Theouter profile of |z| at R > 10 kpc also varies greatly from disk to disk. A dramaticrise in |z| is seen in the outer parts of C Minor, DMinor and CMajor, and to a lesserextent, AMajor. This rise correlates directly with the amount of material out of thedisk plane in Fig. 5.3. Throughout the simulation, the disk plane changes orientation,and while most of this reorientation is a coherent tumbling motion of the disk, someof the outermost material gets ‘left behind,’ creating streams that are on a differentplane than the bulk of the disk mass. More discussion of this issue will be presentedin § 4.4. These features in the vertical structure have been seen before, especially inthe simulations of Kazantzidis et al. (2008) and Machado and Athanassoula (2010),and also to a lesser extent in Moster et al. (2010).
The CMajor disk is remarkable in that among the eight disks, it has the leastamount of vertical thickening in the inner 10 kpc of the disk but the largest amountof diffuse material outside the disk plane at large radii. These results strongly suggestthat the features at the centers of these disks and the material out of the plane of thedisk are formed from separate mechanisms. This realization is present in the otherpanels of Figs. 5.4 and 5.5, but it is most striking for CMajor. We present evidencebelow that the thickening at the center of the disk is due to a large bar that develops,and the material out of the plane is due to torques by changes in the disk orientationas a function of radius.
5.4.2 Stellar Bars
To quantify the bars that formed in the central regions of the disks, we computethe strength of the m = 2 Fourier amplitude of the surface density in each disk. Theparticles in the disk are binned radially in the disk plane, and the following coefficientsare computed for each bin:
am =∑i
cos (mθi) m = 0, 1, ...
bm =∑i
sin (mθi) m = 1, 2, ... (5.4)
where the sum is carried out over all the disk particles (labeled by i and assumed tohave equal mass) in the radial bin, and θi is the azimuthal position of that particle inthe disk plane. The strength of a given mode is cm =
√a2m + b2
m. To give a collectivenotion about the strength of the m = 2 mode for the whole disk, we compute the
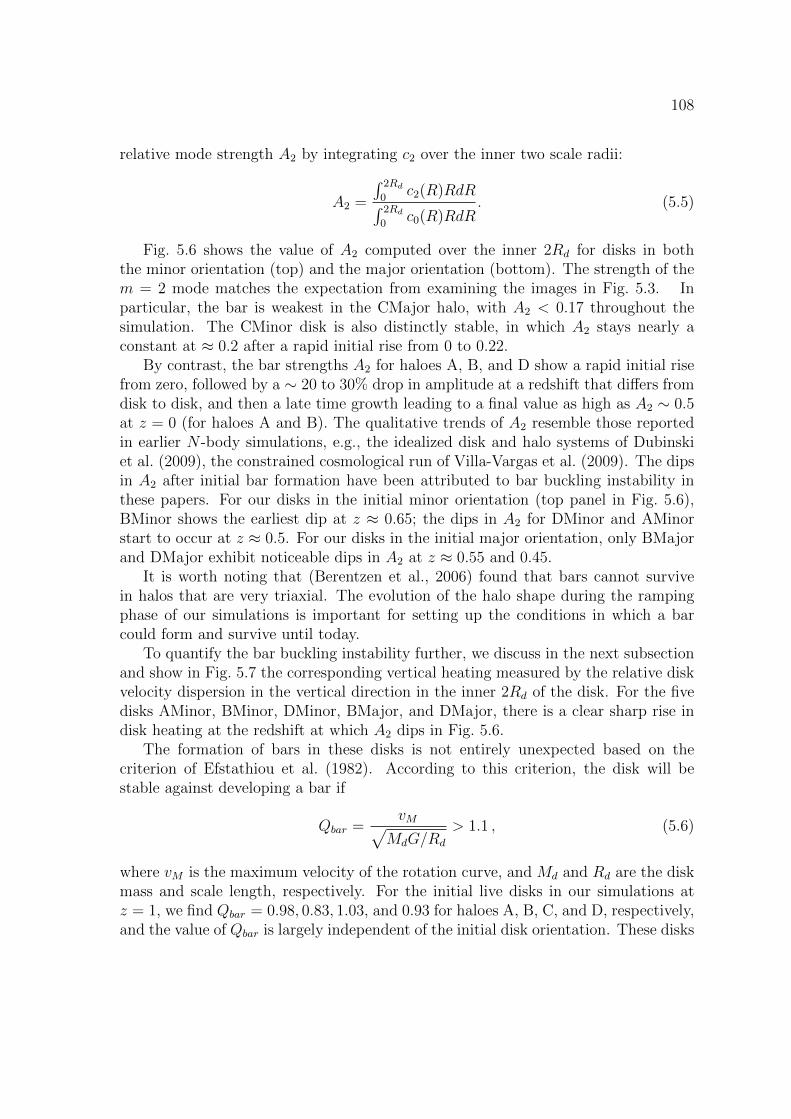
108
relative mode strength A2 by integrating c2 over the inner two scale radii:
A2 =
∫ 2Rd
0c2(R)RdR∫ 2Rd
0c0(R)RdR
. (5.5)
Fig. 5.6 shows the value of A2 computed over the inner 2Rd for disks in boththe minor orientation (top) and the major orientation (bottom). The strength of them = 2 mode matches the expectation from examining the images in Fig. 5.3. Inparticular, the bar is weakest in the CMajor halo, with A2 < 0.17 throughout thesimulation. The CMinor disk is also distinctly stable, in which A2 stays nearly aconstant at ≈ 0.2 after a rapid initial rise from 0 to 0.22.
By contrast, the bar strengths A2 for haloes A, B, and D show a rapid initial risefrom zero, followed by a ∼ 20 to 30% drop in amplitude at a redshift that differs fromdisk to disk, and then a late time growth leading to a final value as high as A2 ∼ 0.5at z = 0 (for haloes A and B). The qualitative trends of A2 resemble those reportedin earlier N -body simulations, e.g., the idealized disk and halo systems of Dubinskiet al. (2009), the constrained cosmological run of Villa-Vargas et al. (2009). The dipsin A2 after initial bar formation have been attributed to bar buckling instability inthese papers. For our disks in the initial minor orientation (top panel in Fig. 5.6),BMinor shows the earliest dip at z ≈ 0.65; the dips in A2 for DMinor and AMinorstart to occur at z ≈ 0.5. For our disks in the initial major orientation, only BMajorand DMajor exhibit noticeable dips in A2 at z ≈ 0.55 and 0.45.
It is worth noting that (Berentzen et al., 2006) found that bars cannot survivein halos that are very triaxial. The evolution of the halo shape during the rampingphase of our simulations is important for setting up the conditions in which a barcould form and survive until today.
To quantify the bar buckling instability further, we discuss in the next subsectionand show in Fig. 5.7 the corresponding vertical heating measured by the relative diskvelocity dispersion in the vertical direction in the inner 2Rd of the disk. For the fivedisks AMinor, BMinor, DMinor, BMajor, and DMajor, there is a clear sharp rise indisk heating at the redshift at which A2 dips in Fig. 5.6.
The formation of bars in these disks is not entirely unexpected based on thecriterion of Efstathiou et al. (1982). According to this criterion, the disk will bestable against developing a bar if
Qbar =vM√
MdG/Rd
> 1.1 , (5.6)
where vM is the maximum velocity of the rotation curve, and Md and Rd are the diskmass and scale length, respectively. For the initial live disks in our simulations atz = 1, we find Qbar = 0.98, 0.83, 1.03, and 0.93 for haloes A, B, C, and D, respectively,and the value of Qbar is largely independent of the initial disk orientation. These disks
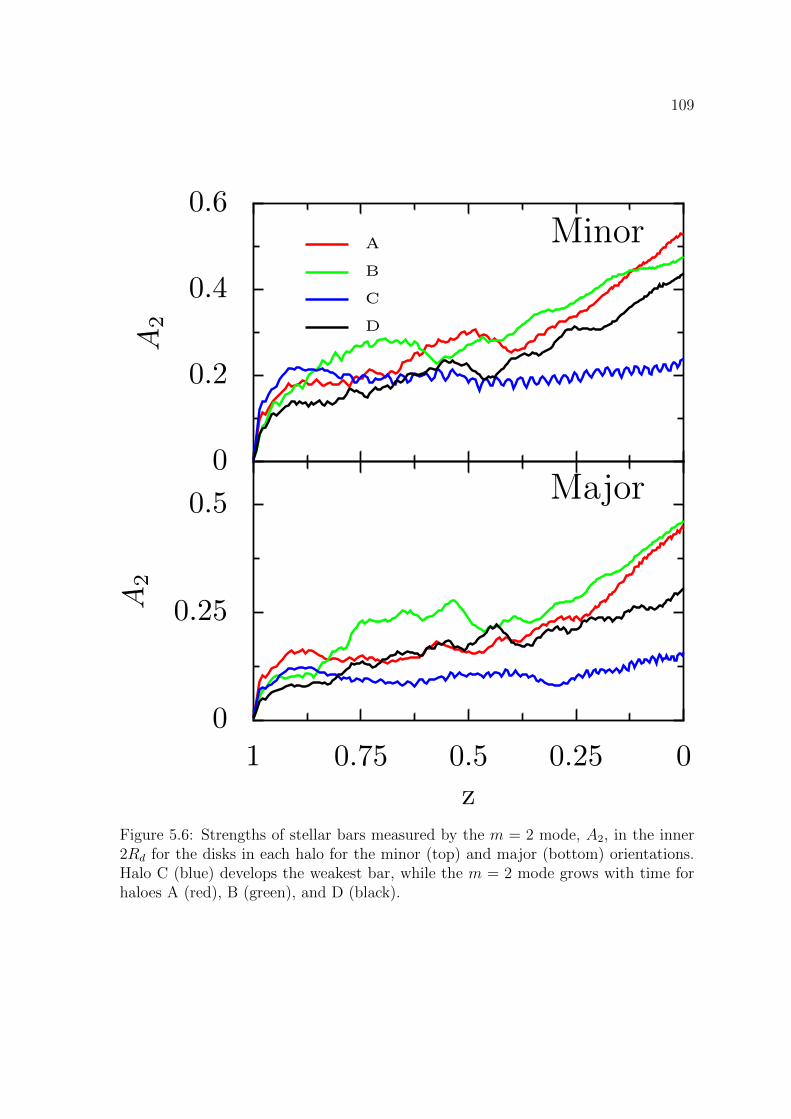
109
Major
0
0.25
0.5
A2
00.250.50.751
z
Minor
0
0.2
0.4
0.6
A2
A
B
C
D
Figure 5.6: Strengths of stellar bars measured by the m = 2 mode, A2, in the inner2Rd for the disks in each halo for the minor (top) and major (bottom) orientations.Halo C (blue) develops the weakest bar, while the m = 2 mode grows with time forhaloes A (red), B (green), and D (black).
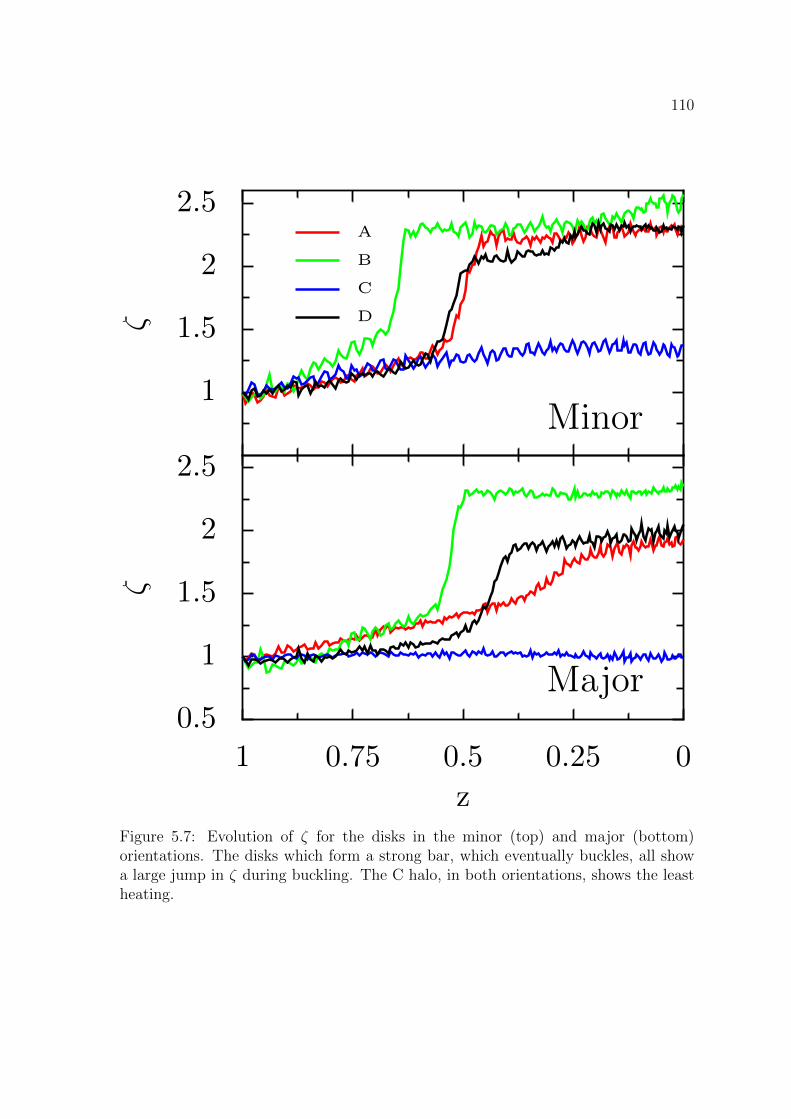
110
Major0.5
1
1.5
2
2.5
ζ
00.250.50.751
z
Minor1
1.5
2
2.5
ζ
A
B
C
D
Figure 5.7: Evolution of ζ for the disks in the minor (top) and major (bottom)orientations. The disks which form a strong bar, which eventually buckles, all showa large jump in ζ during buckling. The C halo, in both orientations, shows the leastheating.
111
are therefore unstable against a bar forming, as seen in Fig. 5.3. Moreover, halo Chas the weakest bar since its Qbar value is closest to the threshold for stability.
In comparison, we find Qbar to be greater than 1.1 in our simulations in which thedisk masses are lowered by a factor of 2 and 3 (see Sec 5 below); the correspondingQbar is 1.13 and 1.23 for halo A, and 1.15 and 1.26 for halo C. The increase in Qbar
for decreasing disk mass indicates stronger stability against bar formation in lowermass disks. These smaller disks indeed appear mostly free of bars, as shown belowin Fig. 5.12. The m = 2 coefficient is also small, with A2 < 0.2 (right panels ofFig. 5.13).
We note that equation (5.6) is approximate since it treats only the self-gravity ofthe disk and does not consider the velocity dispersion (Athanassoula, 2008). For thedisks studied here, however, equation (5.6) appears to work well.
5.4.3 Disk Heating and Velocity Profiles
In addition to the shape of the disk, the velocity structure of the disk evolvesduring the simulation. We define the following quantity to characterize the verticalheating of the disk. For a cumulative radial disk mass profile M(R) and a verticalvelocity dispersion profile σz(R), we use
ζ =
∫ 2Rd
0dMdRσ2z(R)dR∫ 2Rd
0dM0
dRσ2z,0(R)dR
(5.7)
where subscript “0” in the denominator denotes that these quantities are evaluatedfor the initial redshift of the live phase (z = 1.0). The limit of integration is set totwice the scale radii, the same as in the A2 definition above.
The evolution of ζ with redshift is given in Fig. 5.7 for disks in the minor (top)and major (bottom) orientations. The halo-to-halo variation is striking. Once again,vertical heating is negligible in the CMajor disk, in which ζ stays at unity throughoutthe simulation. The CMinor disk experiences a gradual increase of only ∼ 30% in ζbetween z = 1 and 0. By contrast, ζ jumps from 1 to 2-2.5 suddenly at z ∼ 0.5 to0.7 for the disks in the other three haloes. This jump in ζ is accompanied by a dipin the bar strength A2 at a similar redshift, as a result of bar buckling (see Fig. 5.6and previous subsection). Similar jumps in the velocity structure of barred disks havebeen reported before (e.g., Fig. 6 of Martinez-Valpuesta et al. 2006, Sotnikova andRodionov 2003), taking place over a similar timescale as seen in our simulations.
The complete set of profiles of the stellar velocity dispersions in three directionsabout the disk plane is shown in Fig. 5.8 and 5.9 for the disks in the minor and majororientation, respectively. In each figure, the three columns show the azimuthal (left),radial (middle), and vertical (right) components of the stellar velocity dispersion.Within each panel, six snapshots between z = 1 and 0 are plotted.
In the vertical direction, jumps in σz are clearly seen between z ∼ 0.7 and 0.5for the five disks AMinor, BMinor, DMinor, BMajor and DMajor, as was shown in
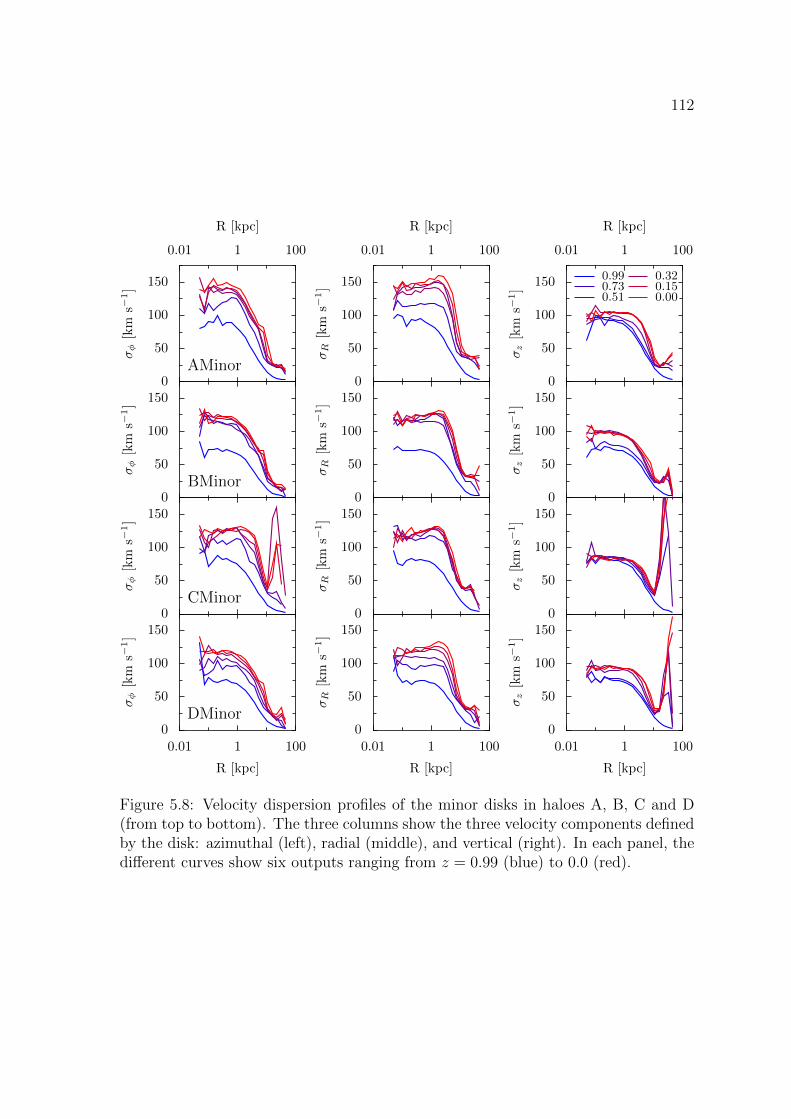
112
DMinor0
50
100
150
σφ[km
s−1]
0.01 1 100
R [kpc]
0
50
100
150
σR[km
s−1]
0.01 1 100
R [kpc]
0
50
100
150
σz[km
s−1]
0.01 1 100
R [kpc]
AMinor
0.01 1 100
R [kpc]
0
50
100
150
σφ[km
s−1]
0.01 1 100
R [kpc]
0
50
100
150
σR[km
s−1]
0.01 1 100
R [kpc]
0
50
100
150
σz[km
s−1]
0.990.730.51
0.320.150.00
BMinor0
50
100
150
σφ[km
s−1]
0
50
100
150
σR[km
s−1]
0
50
100
150
σz[km
s−1]
CMinor0
50
100
150
σφ[km
s−1]
0
50
100
150
σR[km
s−1]
0
50
100
150σz[km
s−1]
Figure 5.8: Velocity dispersion profiles of the minor disks in haloes A, B, C and D(from top to bottom). The three columns show the three velocity components definedby the disk: azimuthal (left), radial (middle), and vertical (right). In each panel, thedifferent curves show six outputs ranging from z = 0.99 (blue) to 0.0 (red).
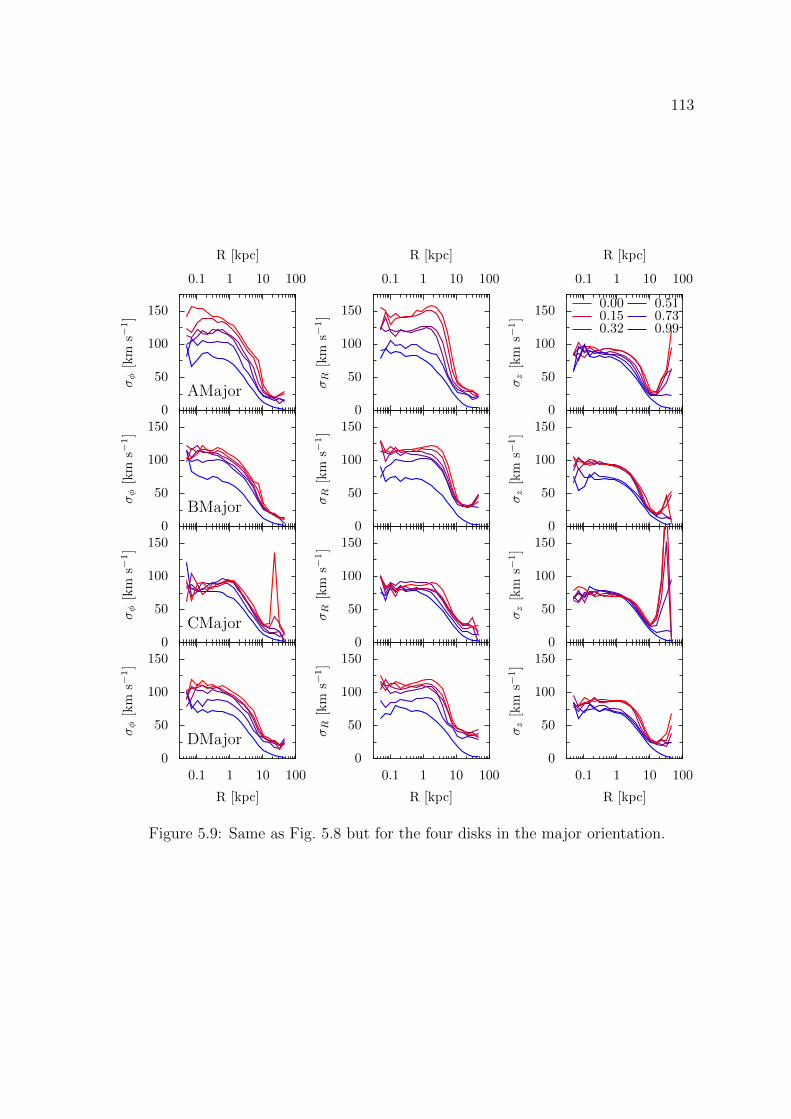
113
DMajor0
50
100
150
σφ[km
s−1]
0.1 1 10 100
R [kpc]
0
50
100
150
σR[km
s−1]
0.1 1 10 100
R [kpc]
0
50
100
150
σz[km
s−1]
0.1 1 10 100
R [kpc]
AMajor
0.1 1 10 100
R [kpc]
0
50
100
150
σφ[km
s−1]
0.1 1 10 100
R [kpc]
0
50
100
150σR[km
s−1]
0.1 1 10 100
R [kpc]
0
50
100
150
σz[km
s−1]
0.000.150.32
0.510.730.99
BMajor0
50
100
150
σφ[km
s−1]
0
50
100
150
σR[km
s−1]
0
50
100
150
σz[km
s−1]
CMajor0
50
100
150
σφ[km
s−1]
0
50
100
150
σR[km
s−1]
0
50
100
150
σz[km
s−1]
Figure 5.9: Same as Fig. 5.8 but for the four disks in the major orientation.
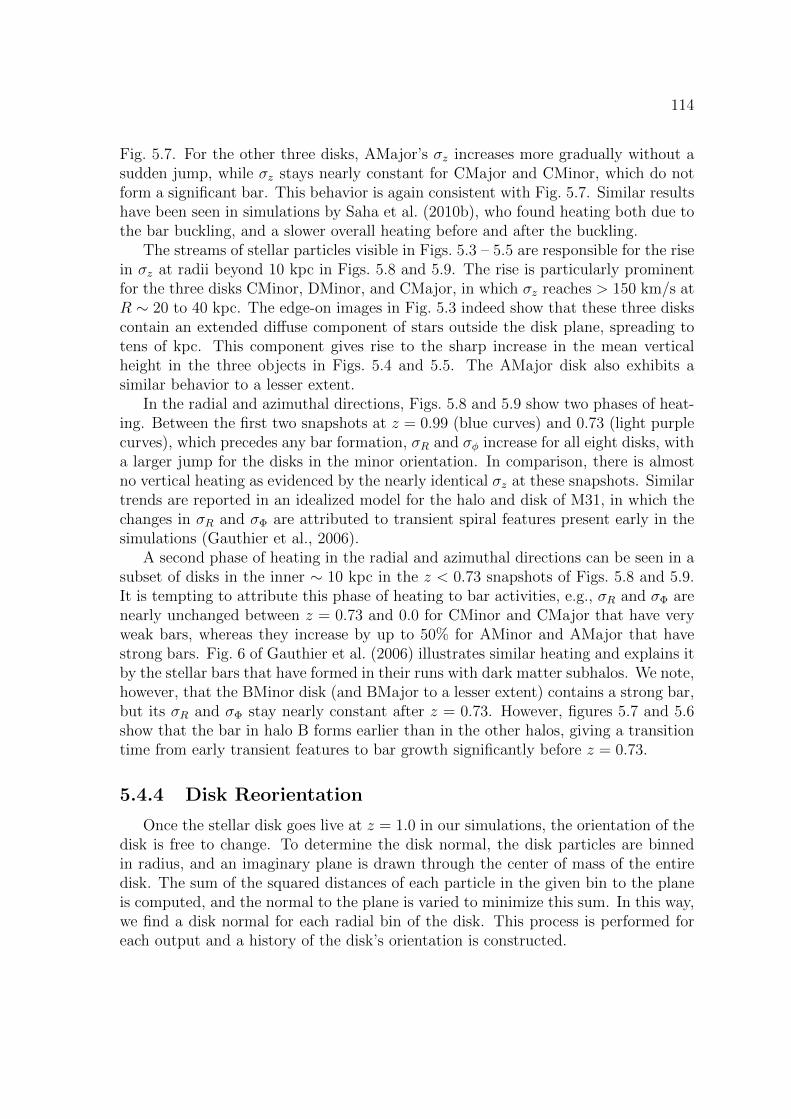
114
Fig. 5.7. For the other three disks, AMajor’s σz increases more gradually without asudden jump, while σz stays nearly constant for CMajor and CMinor, which do notform a significant bar. This behavior is again consistent with Fig. 5.7. Similar resultshave been seen in simulations by Saha et al. (2010b), who found heating both due tothe bar buckling, and a slower overall heating before and after the buckling.
The streams of stellar particles visible in Figs. 5.3 – 5.5 are responsible for the risein σz at radii beyond 10 kpc in Figs. 5.8 and 5.9. The rise is particularly prominentfor the three disks CMinor, DMinor, and CMajor, in which σz reaches > 150 km/s atR ∼ 20 to 40 kpc. The edge-on images in Fig. 5.3 indeed show that these three diskscontain an extended diffuse component of stars outside the disk plane, spreading totens of kpc. This component gives rise to the sharp increase in the mean verticalheight in the three objects in Figs. 5.4 and 5.5. The AMajor disk also exhibits asimilar behavior to a lesser extent.
In the radial and azimuthal directions, Figs. 5.8 and 5.9 show two phases of heat-ing. Between the first two snapshots at z = 0.99 (blue curves) and 0.73 (light purplecurves), which precedes any bar formation, σR and σφ increase for all eight disks, witha larger jump for the disks in the minor orientation. In comparison, there is almostno vertical heating as evidenced by the nearly identical σz at these snapshots. Similartrends are reported in an idealized model for the halo and disk of M31, in which thechanges in σR and σΦ are attributed to transient spiral features present early in thesimulations (Gauthier et al., 2006).
A second phase of heating in the radial and azimuthal directions can be seen in asubset of disks in the inner ∼ 10 kpc in the z < 0.73 snapshots of Figs. 5.8 and 5.9.It is tempting to attribute this phase of heating to bar activities, e.g., σR and σΦ arenearly unchanged between z = 0.73 and 0.0 for CMinor and CMajor that have veryweak bars, whereas they increase by up to 50% for AMinor and AMajor that havestrong bars. Fig. 6 of Gauthier et al. (2006) illustrates similar heating and explains itby the stellar bars that have formed in their runs with dark matter subhalos. We note,however, that the BMinor disk (and BMajor to a lesser extent) contains a strong bar,but its σR and σΦ stay nearly constant after z = 0.73. However, figures 5.7 and 5.6show that the bar in halo B forms earlier than in the other halos, giving a transitiontime from early transient features to bar growth significantly before z = 0.73.
5.4.4 Disk Reorientation
Once the stellar disk goes live at z = 1.0 in our simulations, the orientation of thedisk is free to change. To determine the disk normal, the disk particles are binnedin radius, and an imaginary plane is drawn through the center of mass of the entiredisk. The sum of the squared distances of each particle in the given bin to the planeis computed, and the normal to the plane is varied to minimize this sum. In this way,we find a disk normal for each radial bin of the disk. This process is performed foreach output and a history of the disk’s orientation is constructed.
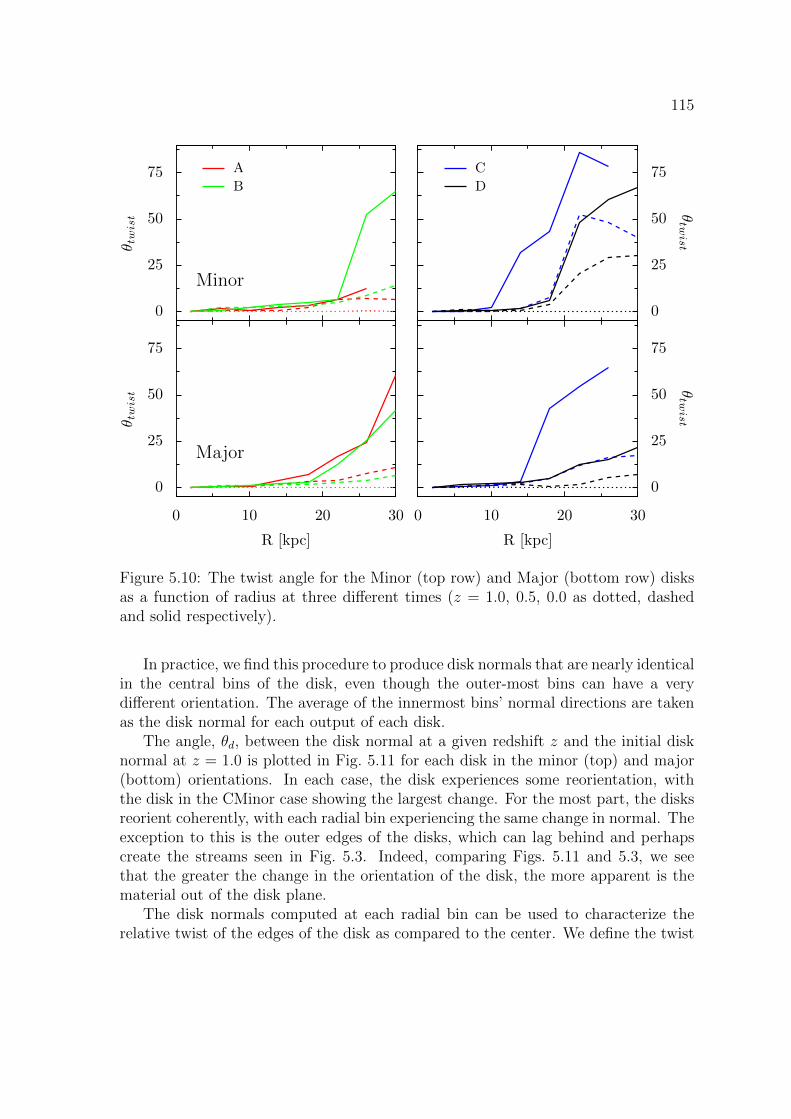
115
Major
Minor
0
25
50
75
θ twist
0 10 20 30
R [kpc]
0 10 20 30
R [kpc]
0
25
50
75
θtw
ist
0
25
50
75
θ twist
A
B
0
25
50
75
θtw
ist
C
D
Figure 5.10: The twist angle for the Minor (top row) and Major (bottom row) disksas a function of radius at three different times (z = 1.0, 0.5, 0.0 as dotted, dashedand solid respectively).
In practice, we find this procedure to produce disk normals that are nearly identicalin the central bins of the disk, even though the outer-most bins can have a verydifferent orientation. The average of the innermost bins’ normal directions are takenas the disk normal for each output of each disk.
The angle, θd, between the disk normal at a given redshift z and the initial disknormal at z = 1.0 is plotted in Fig. 5.11 for each disk in the minor (top) and major(bottom) orientations. In each case, the disk experiences some reorientation, withthe disk in the CMinor case showing the largest change. For the most part, the disksreorient coherently, with each radial bin experiencing the same change in normal. Theexception to this is the outer edges of the disks, which can lag behind and perhapscreate the streams seen in Fig. 5.3. Indeed, comparing Figs. 5.11 and 5.3, we seethat the greater the change in the orientation of the disk, the more apparent is thematerial out of the disk plane.
The disk normals computed at each radial bin can be used to characterize therelative twist of the edges of the disk as compared to the center. We define the twist
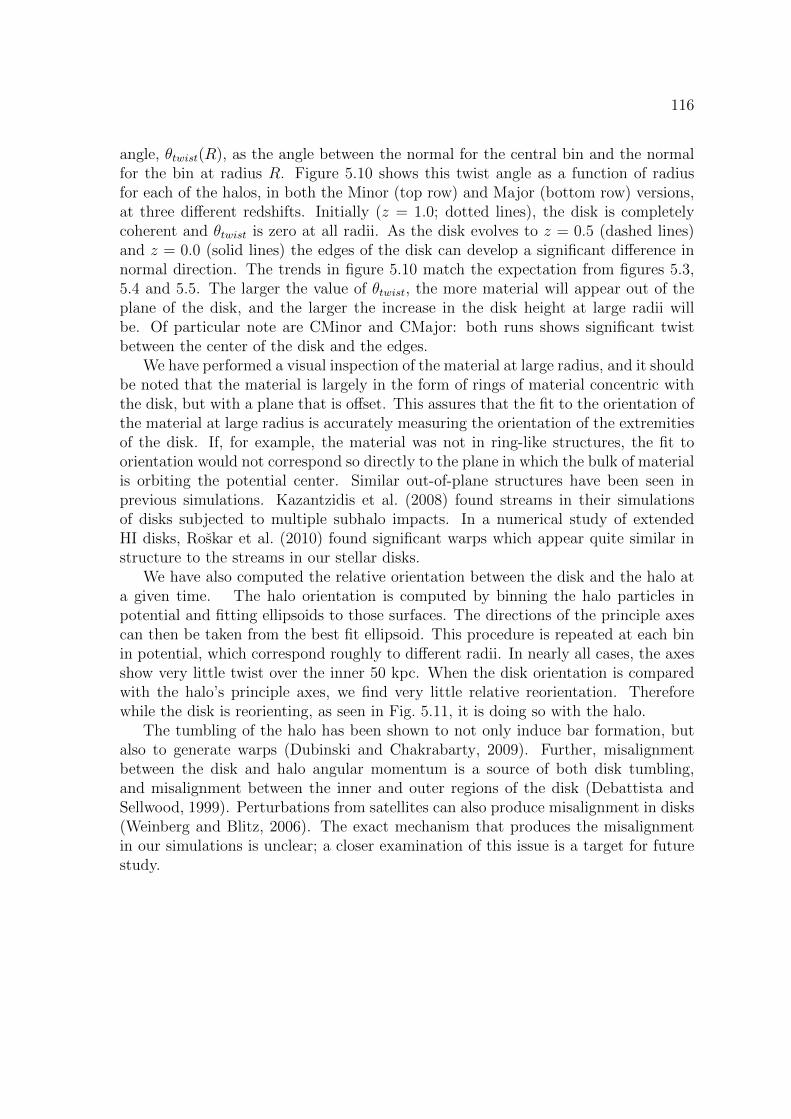
116
angle, θtwist(R), as the angle between the normal for the central bin and the normalfor the bin at radius R. Figure 5.10 shows this twist angle as a function of radiusfor each of the halos, in both the Minor (top row) and Major (bottom row) versions,at three different redshifts. Initially (z = 1.0; dotted lines), the disk is completelycoherent and θtwist is zero at all radii. As the disk evolves to z = 0.5 (dashed lines)and z = 0.0 (solid lines) the edges of the disk can develop a significant difference innormal direction. The trends in figure 5.10 match the expectation from figures 5.3,5.4 and 5.5. The larger the value of θtwist, the more material will appear out of theplane of the disk, and the larger the increase in the disk height at large radii willbe. Of particular note are CMinor and CMajor: both runs shows significant twistbetween the center of the disk and the edges.
We have performed a visual inspection of the material at large radius, and it shouldbe noted that the material is largely in the form of rings of material concentric withthe disk, but with a plane that is offset. This assures that the fit to the orientation ofthe material at large radius is accurately measuring the orientation of the extremitiesof the disk. If, for example, the material was not in ring-like structures, the fit toorientation would not correspond so directly to the plane in which the bulk of materialis orbiting the potential center. Similar out-of-plane structures have been seen inprevious simulations. Kazantzidis et al. (2008) found streams in their simulationsof disks subjected to multiple subhalo impacts. In a numerical study of extendedHI disks, Roskar et al. (2010) found significant warps which appear quite similar instructure to the streams in our stellar disks.
We have also computed the relative orientation between the disk and the halo ata given time. The halo orientation is computed by binning the halo particles inpotential and fitting ellipsoids to those surfaces. The directions of the principle axescan then be taken from the best fit ellipsoid. This procedure is repeated at each binin potential, which correspond roughly to different radii. In nearly all cases, the axesshow very little twist over the inner 50 kpc. When the disk orientation is comparedwith the halo’s principle axes, we find very little relative reorientation. Thereforewhile the disk is reorienting, as seen in Fig. 5.11, it is doing so with the halo.
The tumbling of the halo has been shown to not only induce bar formation, butalso to generate warps (Dubinski and Chakrabarty, 2009). Further, misalignmentbetween the disk and halo angular momentum is a source of both disk tumbling,and misalignment between the inner and outer regions of the disk (Debattista andSellwood, 1999). Perturbations from satellites can also produce misalignment in disks(Weinberg and Blitz, 2006). The exact mechanism that produces the misalignmentin our simulations is unclear; a closer examination of this issue is a target for futurestudy.
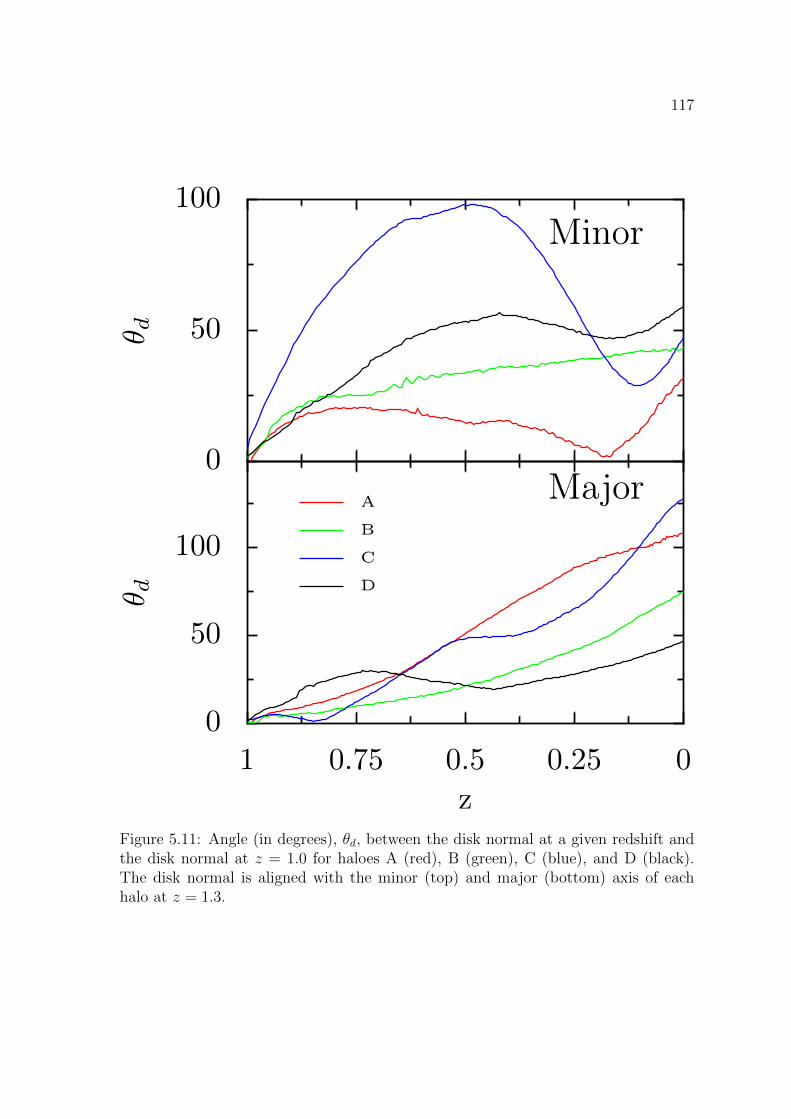
117
Major
0
50
100
θ d
00.250.50.751
z
A
B
C
D
Minor
0
50
100
θ d
Figure 5.11: Angle (in degrees), θd, between the disk normal at a given redshift andthe disk normal at z = 1.0 for haloes A (red), B (green), C (blue), and D (black).The disk normal is aligned with the minor (top) and major (bottom) axis of eachhalo at z = 1.3.
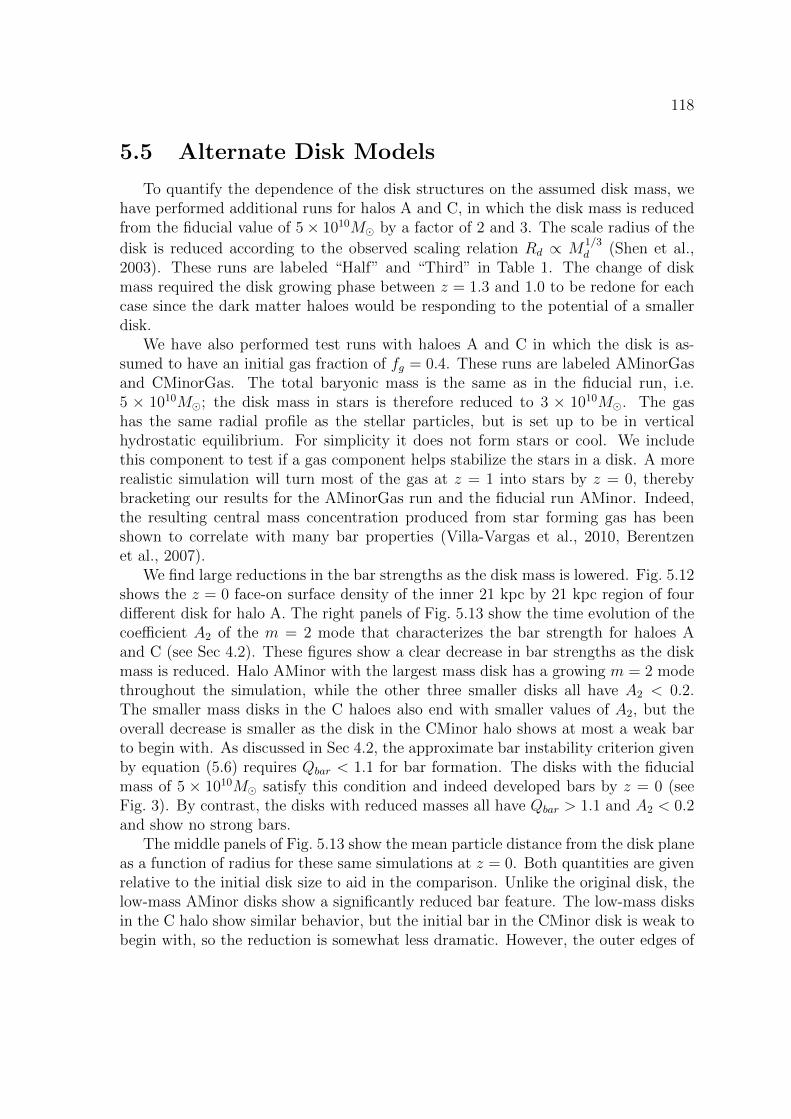
118
5.5 Alternate Disk Models
To quantify the dependence of the disk structures on the assumed disk mass, wehave performed additional runs for halos A and C, in which the disk mass is reducedfrom the fiducial value of 5× 10¹⁰M by a factor of 2 and 3. The scale radius of the
disk is reduced according to the observed scaling relation Rd ∝ M1/3d (Shen et al.,
2003). These runs are labeled “Half” and “Third” in Table 1. The change of diskmass required the disk growing phase between z = 1.3 and 1.0 to be redone for eachcase since the dark matter haloes would be responding to the potential of a smallerdisk.
We have also performed test runs with haloes A and C in which the disk is as-sumed to have an initial gas fraction of fg = 0.4. These runs are labeled AMinorGasand CMinorGas. The total baryonic mass is the same as in the fiducial run, i.e.5 × 1010M; the disk mass in stars is therefore reduced to 3 × 10¹⁰M. The gashas the same radial profile as the stellar particles, but is set up to be in verticalhydrostatic equilibrium. For simplicity it does not form stars or cool. We includethis component to test if a gas component helps stabilize the stars in a disk. A morerealistic simulation will turn most of the gas at z = 1 into stars by z = 0, therebybracketing our results for the AMinorGas run and the fiducial run AMinor. Indeed,the resulting central mass concentration produced from star forming gas has beenshown to correlate with many bar properties (Villa-Vargas et al., 2010, Berentzenet al., 2007).
We find large reductions in the bar strengths as the disk mass is lowered. Fig. 5.12shows the z = 0 face-on surface density of the inner 21 kpc by 21 kpc region of fourdifferent disk for halo A. The right panels of Fig. 5.13 show the time evolution of thecoefficient A2 of the m = 2 mode that characterizes the bar strength for haloes Aand C (see Sec 4.2). These figures show a clear decrease in bar strengths as the diskmass is reduced. Halo AMinor with the largest mass disk has a growing m = 2 modethroughout the simulation, while the other three smaller disks all have A2 < 0.2.The smaller mass disks in the C haloes also end with smaller values of A2, but theoverall decrease is smaller as the disk in the CMinor halo shows at most a weak barto begin with. As discussed in Sec 4.2, the approximate bar instability criterion givenby equation (5.6) requires Qbar < 1.1 for bar formation. The disks with the fiducialmass of 5 × 10¹⁰M satisfy this condition and indeed developed bars by z = 0 (seeFig. 3). By contrast, the disks with reduced masses all have Qbar > 1.1 and A2 < 0.2and show no strong bars.
The middle panels of Fig. 5.13 show the mean particle distance from the disk planeas a function of radius for these same simulations at z = 0. Both quantities are givenrelative to the initial disk size to aid in the comparison. Unlike the original disk, thelow-mass AMinor disks show a significantly reduced bar feature. The low-mass disksin the C halo show similar behavior, but the initial bar in the CMinor disk is weak tobegin with, so the reduction is somewhat less dramatic. However, the outer edges of
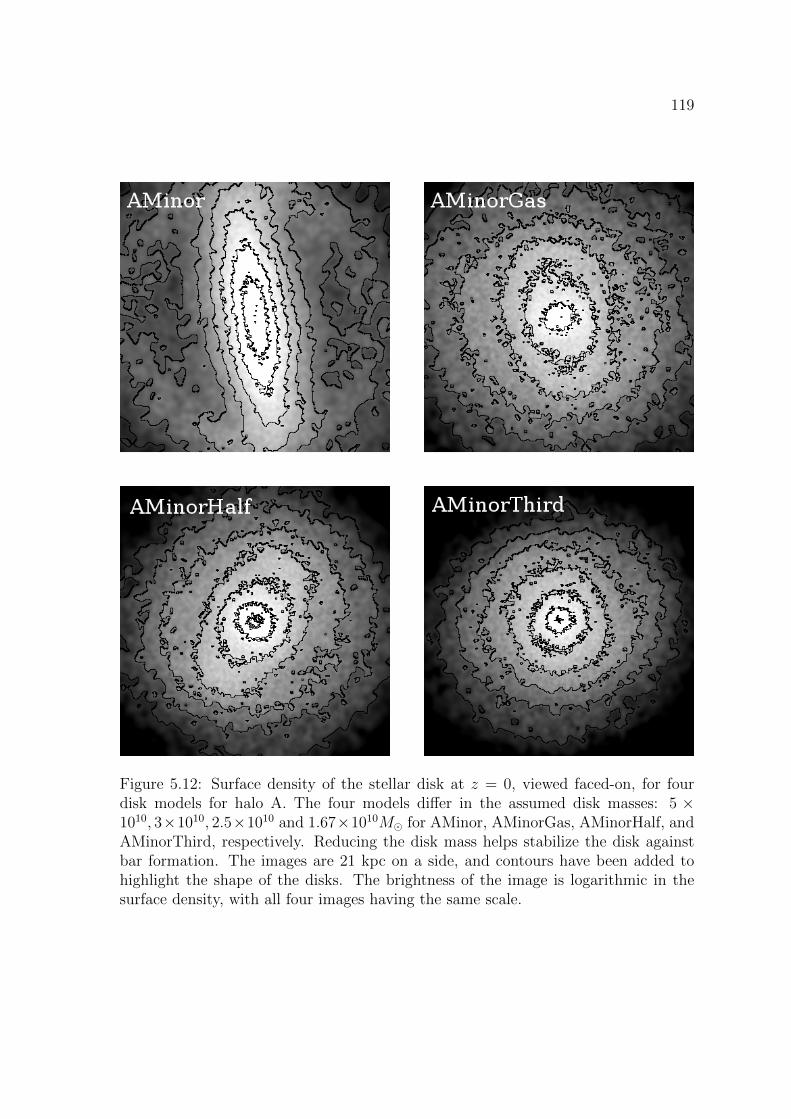
119
Figure 5.12: Surface density of the stellar disk at z = 0, viewed faced-on, for fourdisk models for halo A. The four models differ in the assumed disk masses: 5 ×10¹⁰, 3×10¹⁰, 2.5×10¹⁰ and 1.67×10¹⁰M for AMinor, AMinorGas, AMinorHalf, andAMinorThird, respectively. Reducing the disk mass helps stabilize the disk againstbar formation. The images are 21 kpc on a side, and contours have been added tohighlight the shape of the disks. The brightness of the image is logarithmic in thesurface density, with all four images having the same scale.
120
the smaller mass disks are more easily brought out of the central disk plane, leadingto streamers that are originally closer in to the center of the disk. Indeed, since theoriginal mass CMinor disk show the most of this material, the low mass C halos wereworse, showing almost a complete shell at large radii comprised of stars that beganin the outer reaches of the initial disks.
In contrast to the strong dependence of bar strengths on disk mass, we find thata factor of 3 reduction in the disk mass hardly affects the dark matter halo betweenz = 1.3 and 1.0 as the rigid disk is introduced. The left panels of Fig. 5.13 showthat the axial ratio b/a for both haloes A and C is driven towards unity, while c/a islargely preserved as the rigid disk is brought to its final mass, nearly symmetrizingthe halo in the disk plane. The effects on the halo shape do not weaken as the finaldisk mass is reduced by a factor of three. The axial ratios are shown for a particularequipotential surface, chosen to be about five kpc from the center of the disk.
The alternate mass disks also reorient themselves during the evolution. All fourAMinor disks have similar reorientation histories, showing at most a 12 degree offsetbetween the disk orientations. The alternate CMinor runs, however, had more diver-gent reorientation histories. The angle between the original CMinor disk normal andthe disk normal in the alternate CMinor runs was typically around 30 degrees, risingas high as 60-80 temporarily near z ∼ 0.7.
The runs that include gas show drastically reduced signatures of bars, and theassociated heating. The strong effect of this massive gas component is expectedbecause the gas offers support against self-gravity via its pressure. The extra supportprovided in these simulations in likely an overestimate, as realistic gas cools and formsstars, but the ability of a simple gas model to suppress the bar points to the needto include a realistic gas component. The lack of a strong bar also means that thesubsequent bar buckling cannot occur and the central thickness of the disk is smallerat the end of the simulation.
To assess the degree of convergence of these results with the resolution of thestellar disk particles, we have run a disk in the AMinor orientation with 5 × 10⁵
particles instead of 2 × 10⁵, labeled AMinorHR in Table 5.1. The results of thissimulation, e.g., the values of A2 and ζ, agree to within 5% of the run at our fiducialresolution. A similar degree of convergence is also reported in the detailed study ofDubinski et al. (2009). Quantities such as the bar strength, pattern speed, and haloresponse to disk in their simulation with 106 dark matter particles and 1.8× 10⁵ diskparticles are very similar to those in runs with 10 and 100 times more particles.
5.6 Subhalos of Aquarius
To link the evolution of the disks in these simulations to the history of subhaloimpactors on the Aquarius halos, a catalog of subhalo properties is needed. To getan initial feel for the level of activity in the four halos used, we examined the outputs
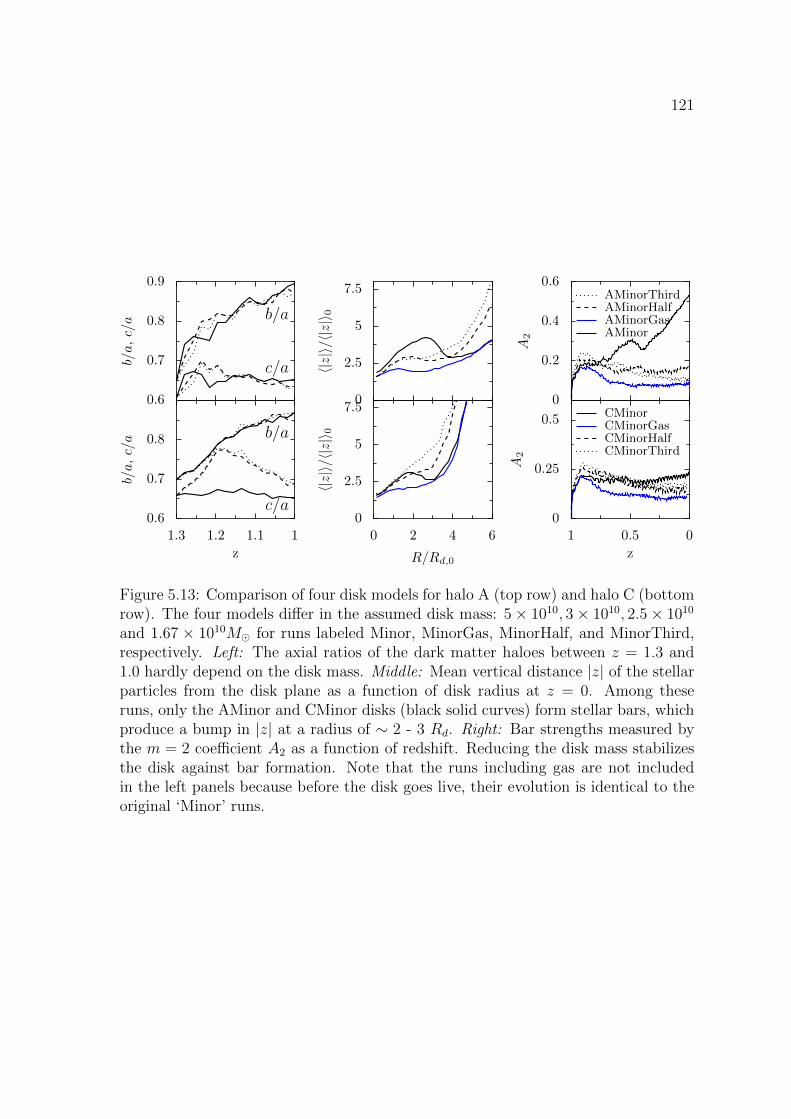
121
b/a
c/a0.6
0.7
0.8
b/a,c/a
11.11.21.3
z
0
2.5
5
7.5
〈|z|〉/
〈|z|〉 0
0 2 4 6
R/Rd,0
0
0.25
0.5
A2
00.51
z
CMinorCMinorGasCMinorHalfCMinorThird
b/a
c/a
0.6
0.7
0.8
0.9
b/a,c/a
0
2.5
5
7.5
〈|z|〉/
〈|z|〉 0
0
0.2
0.4
0.6
A2
AMinorThirdAMinorHalfAMinorGasAMinor
Figure 5.13: Comparison of four disk models for halo A (top row) and halo C (bottomrow). The four models differ in the assumed disk mass: 5× 10¹⁰, 3× 10¹⁰, 2.5× 10¹⁰
and 1.67 × 10¹⁰M for runs labeled Minor, MinorGas, MinorHalf, and MinorThird,respectively. Left: The axial ratios of the dark matter haloes between z = 1.3 and1.0 hardly depend on the disk mass. Middle: Mean vertical distance |z| of the stellarparticles from the disk plane as a function of disk radius at z = 0. Among theseruns, only the AMinor and CMinor disks (black solid curves) form stellar bars, whichproduce a bump in |z| at a radius of ∼ 2 - 3 Rd. Right: Bar strengths measured bythe m = 2 coefficient A2 as a function of redshift. Reducing the disk mass stabilizesthe disk against bar formation. Note that the runs including gas are not includedin the left panels because before the disk goes live, their evolution is identical to theoriginal ‘Minor’ runs.
122
of SUBFIND (Springel et al., 2001) for the original Aquarius halos A5, B5, C5 andD5 and created a merger history for all the subhalos in these catalogs. More detailedstatements about the effects of the substructure on the disks, or the disks on thesubstructure require a halo finder to be run on the actual results of the simulation.These two approaches are described below.
5.6.1 SUBFIND halos
In this section we describe the results of the original SUBFIND outputs for theAquarius simulation. We construct merger histories, and identify subhalos that arecapable of affecting the stellar disk.
The SUBFIND algorithm (Springel et al., 2001) identifies substructure of a halo intwo steps. The first is to run a normal friends-of-friends halo finder to identify particlegroups. These groups are then given as inputs to the subhalo finding procedure.Subhalos are identifies as gravitationally bound sets of particles which are locallyover-dense. This algorithm assigns each dark matter particle to one substructure anddetailed information about the merger history of the halo and its substructure caneasily be generated.
The SUBFIND outputs provide a list of all subhalos present in the Aquariussimulations, at each output redshift. But not all of these subhalos will be interestingfor our purposes; those that are far away or those that are very low in mass cannot have a significant impact on the disk. Further, the SUBFIND catalogs give onlyinstantaneous information about the subhalos, and will not, in general, include thedistance of closest approach as the subhalos move in the potential of the host halo.Determining if a given subhalo is interesting then requires the construction of itshistory over the entire simulation time.
The main problem is to associate each halo at a time t1 to halos at a later timet2, and thereby creating a history for each subhalo in the relevant volume of oursimulation. For each subhalo that is within ten disk radii, and which is larger thanone thousandth the disk mass, we construct a history both forward and backward intime in the following way.
For the subhalo of interest, the overlap between particle membership at the currenttime is computed with each subhalo in the next SUBFIND output. The halo with thelargest number of particles common to the initial subhalo is taken to be the descendantof the initial subhalo. This process is then repeated at the subsequent output. Theresult of this procedure, applied to each subhalo which passes the proximity and masscuts, is a tree structure that links each subhalo at time t1 to a subhalo at a later time.
In will be the case that multiple progenitor halos can have the same descendant.Indeed, this is exactly the result when two subhalos merge, or when, as is morecommon, a subhalo merges with the main halo. By tracing through this tree, ahistory of the halos’ position and mass can be constructed.
In a few cases, the matching forward in time is difficult to achieve because subhalos
123
might temporarily pass close to a much larger structure, and lose their resolution. Formost of these cases, matching the current subhalo to a subhalo two snapshots removedwill solve the issue, as the subhalo often will move out of the central regions of themassive object and be counted as a separate object once more. Another difficulty isthat the process of tidal stripping can often lead to very low overlap between a haloand its descendant. These cases are relatively easy to handle by also performing thematching backwards in time, as often the central core of the subhalo survives closepassages intact, and it is only the outer edges of the subhalo that are stripped.
Once each interesting subhalo has a history, the times where the subhalo makesa close passage to the central halo, and thus the stellar disk, can be examined moreclosely. For each subhalo passing within 10 disk radii of the center, we compute orbitalparameters of the halo’s trajectory. The position of the subhalo at the three timesnearest to each close passage of the center are used to construct orbital parameters forthe subhalo. The method is general enough to find elliptical, parabolic or hyperbolicorbits. The distance of closest approach can then easily be found for the given orbitfit. The history of each main Aquarius halo is constructed from the collection of thesefits, and a picture of the main events involving halo substructure develops.
Figures 5.14-5.17 show the most massive subhalo impactors in each of the fourAquarius halos used in this work. Each figure gives the distance of the subhalo fromthe disk center (in units of the initial disk scale length), the mass of the subhalo(in units of the disk mass) and the path of the subhalo relative to the disk position,projected into the disk plane.
Figures 5.18-5.21 give another view of the subhalo merger history. Each figureshows the pericenter distance and mass of the major subhalo events for each Aquariushalo. As can be seen in the previous figures, a subhalo can have many close passages ofthe disk. The symbols in these figures show each such passage. To aid in comparison,the colors in these figures match the colors in the previous figures.
The picture that develops from these figures is that the level of activity in thehalos hosting our disk simulations vary significantly in the level and strength of theirsubstructure impact history. In halos A and B, the most significant close passageshave only a mass of a few percent of the stellar disk mass. Halos C and D, on theother hand, each have an encounter with a body larger than one tenth of the diskmass. Such encounters are cosmologically common and can destroy a disk (Purcellet al., 2009) for some values of the subhalo orbital parameters. By far, halo D hasthe most active history between z = 1.0 and today.
In addition to the subhalos having an effect on the disk, the simulations alsoallow interactions in the other direction, with the disk influencing the subhalos. Thesubhalo histories above are constructed from the SUBFIND outputs of the originalunmodified Aquarius simulations, and will not strictly apply in the presence of thedisk. However, the particles in the subhalos in these original SUBFIND catalogs canbe easily found in the simulations including the disk, and the resulting structures canbe examined. In only a few cases are the SUBFIND halos completely disrupted in
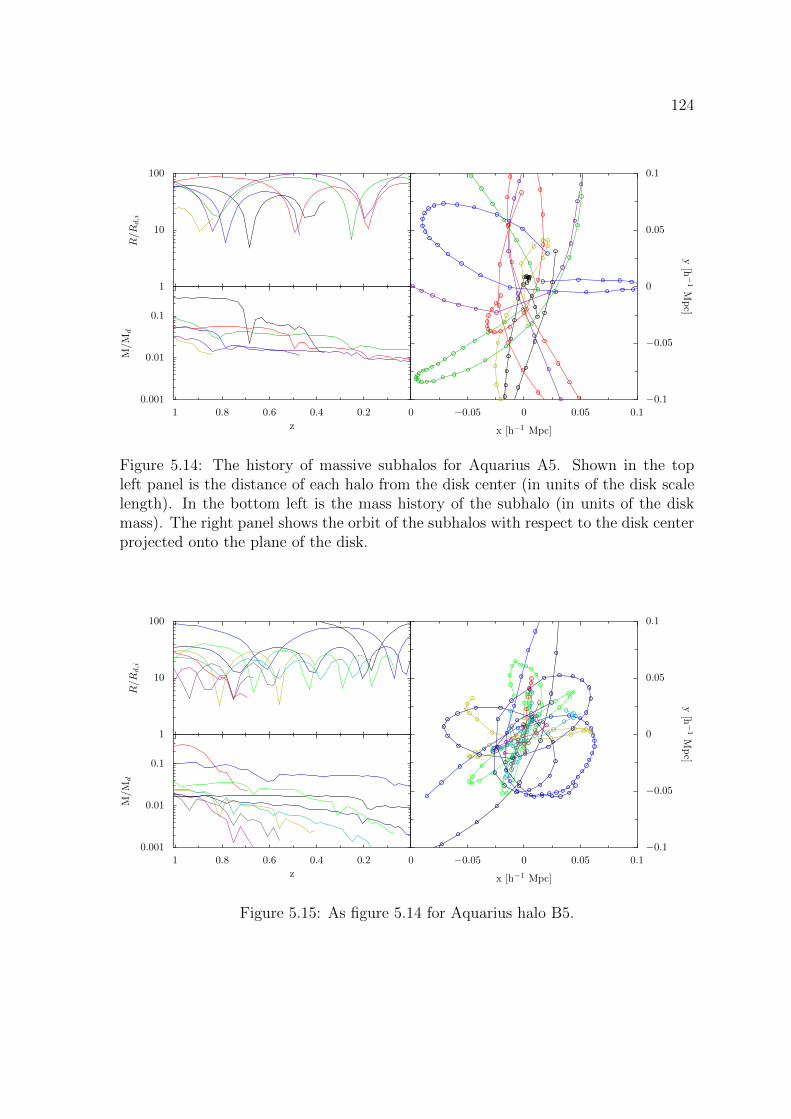
124
0.001
0.01
0.1
M/M
d
00.20.40.60.81
z
1
10
100
R/R
d,i
−0.05 0 0.05 0.1
x [h−1 Mpc]
−0.1
−0.05
0
0.05
0.1
y[h
−1
Mpc]
Figure 5.14: The history of massive subhalos for Aquarius A5. Shown in the topleft panel is the distance of each halo from the disk center (in units of the disk scalelength). In the bottom left is the mass history of the subhalo (in units of the diskmass). The right panel shows the orbit of the subhalos with respect to the disk centerprojected onto the plane of the disk.
0.001
0.01
0.1
M/M
d
00.20.40.60.81
z
1
10
100
R/R
d,i
−0.05 0 0.05 0.1
x [h−1 Mpc]
−0.1
−0.05
0
0.05
0.1
y[h
−1
Mpc]
Figure 5.15: As figure 5.14 for Aquarius halo B5.

125
0.001
0.01
0.1
M/M
d
00.20.40.60.81
z
1
10
100
R/R
d,i
−0.05 0 0.05 0.1
x [h−1 Mpc]
−0.1
−0.05
0
0.05
0.1
y[h
−1
Mpc]
Figure 5.16: As figure 5.14 for Aquarius halo C5.
0.001
0.01
0.1
M/M
d
00.20.40.60.81
z
1
10
100
R/R
d,i
−0.05 0 0.05 0.1
x [h−1 Mpc]
−0.1
−0.05
0
0.05
0.1
y[h
−1
Mpc]
Figure 5.17: As figure 5.14 for Aquarius halo D5.
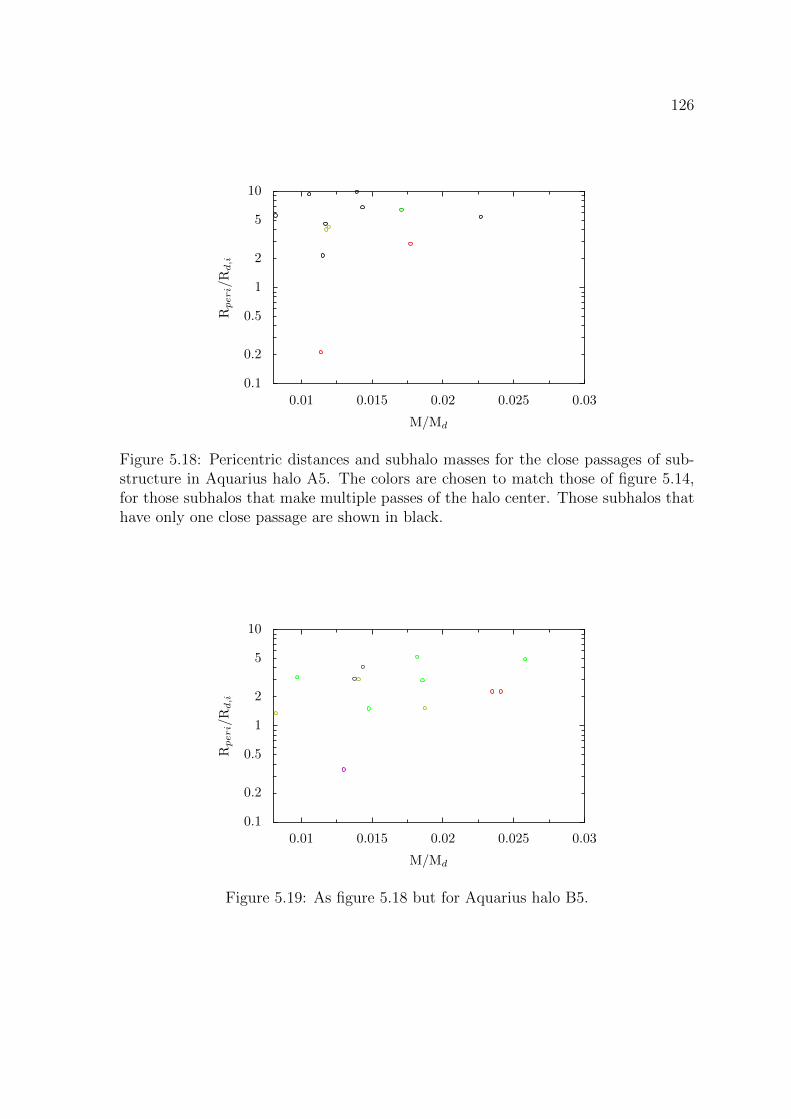
126
0.1
0.2
0.5
1
2
5
10
Rperi/
Rd,i
0.01 0.015 0.02 0.025 0.03
M/Md
Figure 5.18: Pericentric distances and subhalo masses for the close passages of sub-structure in Aquarius halo A5. The colors are chosen to match those of figure 5.14,for those subhalos that make multiple passes of the halo center. Those subhalos thathave only one close passage are shown in black.
0.1
0.2
0.5
1
2
5
10
Rperi/
Rd,i
0.01 0.015 0.02 0.025 0.03
M/Md
Figure 5.19: As figure 5.18 but for Aquarius halo B5.
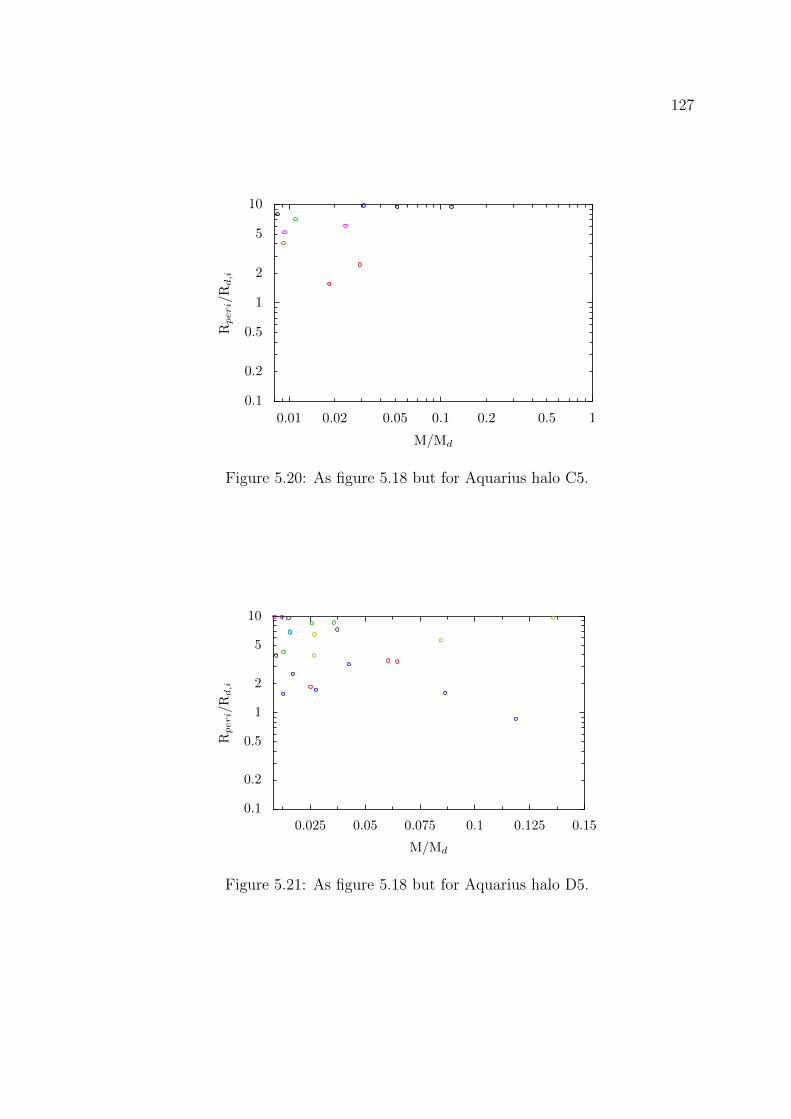
127
0.1
0.2
0.5
1
2
5
10
Rperi/
Rd,i
0.01 0.02 0.05 0.1 0.2 0.5 1
M/Md
Figure 5.20: As figure 5.18 but for Aquarius halo C5.
0.1
0.2
0.5
1
2
5
10
Rperi/
Rd,i
0.025 0.05 0.075 0.1 0.125 0.15
M/Md
Figure 5.21: As figure 5.18 but for Aquarius halo D5.
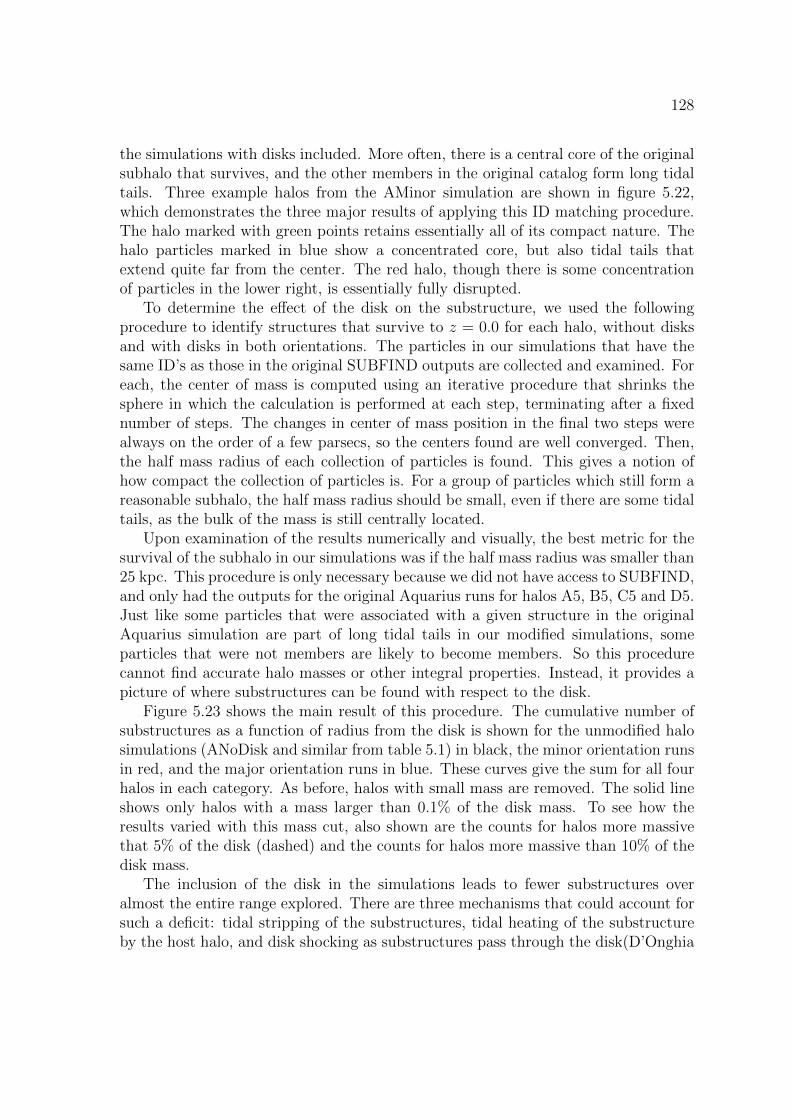
128
the simulations with disks included. More often, there is a central core of the originalsubhalo that survives, and the other members in the original catalog form long tidaltails. Three example halos from the AMinor simulation are shown in figure 5.22,which demonstrates the three major results of applying this ID matching procedure.The halo marked with green points retains essentially all of its compact nature. Thehalo particles marked in blue show a concentrated core, but also tidal tails thatextend quite far from the center. The red halo, though there is some concentrationof particles in the lower right, is essentially fully disrupted.
To determine the effect of the disk on the substructure, we used the followingprocedure to identify structures that survive to z = 0.0 for each halo, without disksand with disks in both orientations. The particles in our simulations that have thesame ID’s as those in the original SUBFIND outputs are collected and examined. Foreach, the center of mass is computed using an iterative procedure that shrinks thesphere in which the calculation is performed at each step, terminating after a fixednumber of steps. The changes in center of mass position in the final two steps werealways on the order of a few parsecs, so the centers found are well converged. Then,the half mass radius of each collection of particles is found. This gives a notion ofhow compact the collection of particles is. For a group of particles which still form areasonable subhalo, the half mass radius should be small, even if there are some tidaltails, as the bulk of the mass is still centrally located.
Upon examination of the results numerically and visually, the best metric for thesurvival of the subhalo in our simulations was if the half mass radius was smaller than25 kpc. This procedure is only necessary because we did not have access to SUBFIND,and only had the outputs for the original Aquarius runs for halos A5, B5, C5 and D5.Just like some particles that were associated with a given structure in the originalAquarius simulation are part of long tidal tails in our modified simulations, someparticles that were not members are likely to become members. So this procedurecannot find accurate halo masses or other integral properties. Instead, it provides apicture of where substructures can be found with respect to the disk.
Figure 5.23 shows the main result of this procedure. The cumulative number ofsubstructures as a function of radius from the disk is shown for the unmodified halosimulations (ANoDisk and similar from table 5.1) in black, the minor orientation runsin red, and the major orientation runs in blue. These curves give the sum for all fourhalos in each category. As before, halos with small mass are removed. The solid lineshows only halos with a mass larger than 0.1% of the disk mass. To see how theresults varied with this mass cut, also shown are the counts for halos more massivethat 5% of the disk (dashed) and the counts for halos more massive than 10% of thedisk mass.
The inclusion of the disk in the simulations leads to fewer substructures overalmost the entire range explored. There are three mechanisms that could account forsuch a deficit: tidal stripping of the substructures, tidal heating of the substructureby the host halo, and disk shocking as substructures pass through the disk(D’Onghia
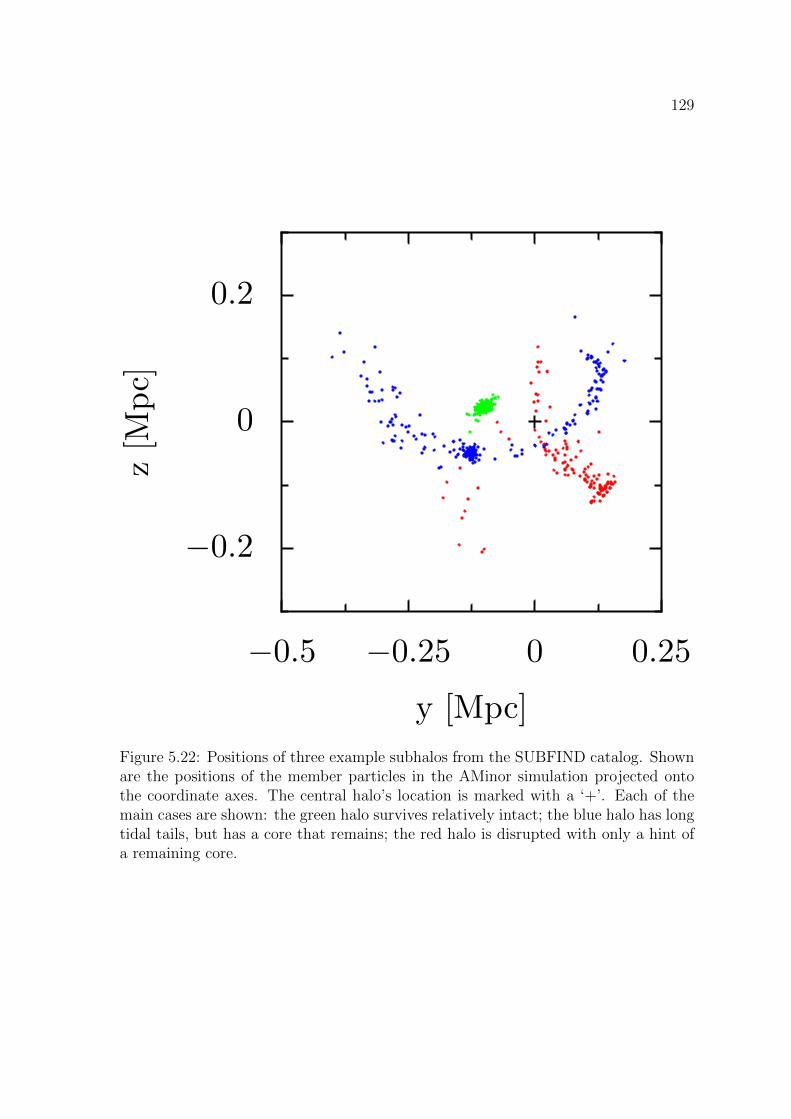
129
−0.2
0
0.2
z[M
pc]
−0.5 −0.25 0 0.25
y [Mpc]
Figure 5.22: Positions of three example subhalos from the SUBFIND catalog. Shownare the positions of the member particles in the AMinor simulation projected ontothe coordinate axes. The central halo’s location is marked with a ‘+’. Each of themain cases are shown: the green halo survives relatively intact; the blue halo has longtidal tails, but has a core that remains; the red halo is disrupted with only a hint ofa remaining core.
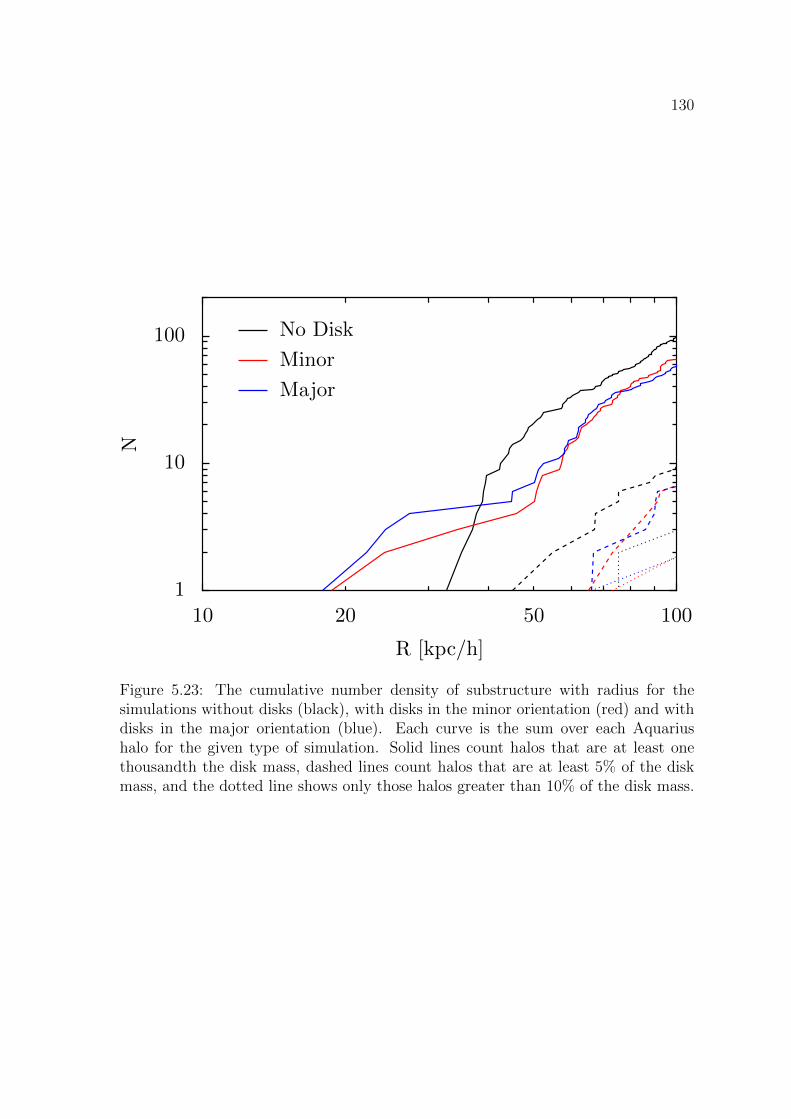
130
1
10
100
N
10 20 50 100
R [kpc/h]
No Disk
Minor
Major
Figure 5.23: The cumulative number density of substructure with radius for thesimulations without disks (black), with disks in the minor orientation (red) and withdisks in the major orientation (blue). Each curve is the sum over each Aquariushalo for the given type of simulation. Solid lines count halos that are at least onethousandth the disk mass, dashed lines count halos that are at least 5% of the diskmass, and the dotted line shows only those halos greater than 10% of the disk mass.
131
et al., 2010). The first two mechanisms are present in both runs with and withoutdisks, though they can be exacerbated by the alterations to the main halo’s potentialwith a disk included. Disk shocking can only occur in the runs with a disk, andit would be interesting to do a more careful study of the subhalos’ interaction withthe disk. However, without access to SUBFIND, any such attempt would be fraughtwith difficulty. Several publicly available halo finders exist, but comparison to thecanonical results from the original Aquarius simulations would be made more difficult.
5.7 Discussion and Conclusions
5.7.1 Summary of Results
We have presented the results of simulation of live stellar disks in the fully cosmo-logical setting of the Aquarius simulations. The simulations take place in two phases,first by preparing the halo for the live disk with a rigid disk potential, and then byinserting a live disk of particles which are evolved to today. We explored a range ofhalos, and multiple disk models.
Generically, the halos are initially triaxial and symmetrize during the ramping, andsubsequent live phases of the evolution. Similar results have been seen in both isolatedhalos (Berentzen et al., 2006) and in cosmological settings (Berentzen and Shlosman,2006, Machado and Athanassoula, 2010). During the ramping phase, the halos donot experience significant reorientation, though in the B and D halos substructureimpacts twist the unmodified halo.
With the exception of the disks in the C halo, the live disks form massive barsthat dominate the dynamics of the star particles. The bars, which grow throughoutthe simulation, eventually buckle and demonstrate the typical x-shaped structure(Martinez-Valpuesta et al., 2006). The disk scale length grows in the disks with abar, primarily as a result of a single component model no longer applying. In everydisk the scale height increased during the evolution, and for those disks with barsthere was a significant increase in disk height near the center of the disk after the barbuckles.
In every disk there was a gradual overall vertical heating, and for those disks withbars, a relatively sudden increase in vertical velocity dispersion. The appearance ofa strong bar also heats the stellar particles in the plane of the disk.
In addition to the change in structure of each disk, the disk normal evolves duringthe simulation. The reorientation of the disk follows the change in orientation of thehalo figure axes. So while the disk does reorient, it does so in a way that is consistentwith the dark matter halo. As the disk reorients, the extremities of the disk are leftbehind and end up as streams that are significantly out of the plane of the centraldisk. These streams show up in the height of the disk at large radius, and in thevertical and azimuthal velocity dispersions at large radius.
132
Alternate disk models were able to stabilize the disk against the bar by decreasingthe mass of the stellar component. The primary reason for this stabilization is that thedrop in mass reduces the self-gravity of the disk, and the halo’s potential can thendominate the disk’s dynamics. Including a gaseous component of the disk allowsstabilization without reducing the mass of the disk. However, the gas in this workincluded no star formation, cooling or feedback, so the support provided by this gasis an over-estimate. The purely stellar disk and the disks with an initial gaseouscomponent can be thought of as two ends bracketing the results for a more realisticgas model.
5.7.2 Comparison to Observations
The disks presented in these simulations share many features with observed diskgalaxies. Though our statistics are not good enough to perform detailed comparisons,there are some general features of disk galaxies in the local universe captured by oursimulations.
By construction, the mass of the disk models presented agrees with recent mea-surements of the mass of the Milky Way (McMillan, 2011). Also by construction,we agree with measurements of the scale length and scale height of the Milky Way(McMillan, 2011, Juric et al., 2008). With these relatively few data as inputs, oursimulations were able to reproduce a number of observations of real galaxies.
In the local universe, observations indicate that as many as 2/3 of disk galax-ies host a bar (Knapen et al., 2000, Marinova and Jogee, 2007). With only a fewexceptions, our simulations easily form bars, and most of the simulated disks hosta bar as early as z ∼ 0.75. Though the evolution of the bar fraction with redshiftis still a subject of ongoing debate (e.g., Jogee et al. 2004, Sheth et al. 2008), thefraction of barred disks is non-negligible out to z ∼ 1. In addition to the prevalenceof bars, observations indicate a large number of galaxies with x-shaped structures,or peanut-shaped bulges (Bureau and Freeman, 1999, Bureau et al., 2006, Kuijkenand Merrifield, 1995, Whitmore and Bell, 1988). One explanation for these features,which are also seen in our simulations (e.g., figure 5.3) is the buckling of a bar (Rahaet al., 1991).
One conspicuous feature of our simulations is the misalignment between the orien-tation of the inner portions of the disk with the outer portions. By eye, the structuresappear very much like observed warps in disk galaxies (Sancisi, 1976), which are quitecommon in the local universe, as seen in optical surveys (Reshetnikov and Combes,1998, Sanchez-Saavedra et al., 1990) and neutral hydrogen, both in our own (Weinbergand Blitz, 2006, Levine et al., 2006) and other galaxies (Garcıa-Ruiz et al., 2002).
Some features of the velocity structure of our disks are also broadly in agreementwith measurements of the Milky Way. The circular velocity of the Milky Way is∼ 230 km s−1 near a radius of 10 kpc (McMillan, 2011, Xue et al., 2008), which isin rough agreement with the disks in our simulations. Also, our disks heat in the
133
vertical direction continuously, consistent with measurements done on local stars inMilky Way (Aumer and Binney, 2009). This heating should be distinguished fromthe rapid increase in σz seen as a result of the bar buckling. In particular, the CMajordisk showed no evidence of a bar and still showed gradual heating at the solar radius(see figure 5.9).
However, there are some shortcomings to the modeling employed here. Disk galax-ies often show a thick-thin disk decomposition (Juric et al., 2008). Our simulatedgalaxies showed no strong evidence for a thick-thin decomposition. Though, there isevidence that the thin disk stars are a different population than those of the thickdisk (for example, chemically Navarro et al. 2011), leading one to suspect that aproper treatment of star formation is required to reproduce both a thick and thindisk in simulations. Further, most disks have roughly constant vertical scale heightwith radius van der Kruit and Searle (1981), Comeron et al. (2011), which ours failto have (e.g., figures 5.4 and 5.5).
5.7.3 Conclusions
The stellar disks we have evolved in four Aquarius halos reproduced many of thefeatures of local disk galaxies. However, while the Aquarius halos are a very realisticsetting in which to explore numerically issues in galaxy formation, their realism canalso confound analysis.
There are a number of ways to generate bars, be it halo triaxiality (Heller et al.,2007a,b), the tumbling of the halo figure (Dubinski and Chakrabarty, 2009) or per-turbations from substructure (Kazantzidis et al., 2008). The presence of all of thesephenomena makes determining which is the primary mechanism difficult. Similarly,the heating experienced by the disk can come from many sources: the intrinsic heat-ing of the stellar particles by the bar (Saha et al., 2010b, Sotnikova and Rodionov,2003), transient spiral structure (Fuchs, 2001, Minchev and Quillen, 2006) or fromsubstructure impact (Benson et al., 2004, Toth and Ostriker, 1992). Like real galaxies,the disks in this work showed warps, but like other morphological features, there area number of mechanisms that can support their growth. Halo tumbling can torquethe stellar disk (Dubinski and Chakrabarty, 2009), misalignment between the diskand halo angular momentum can cause warps (Debattista and Sellwood, 1999), andsubstructure can also bring material out of the plane of the disk (Weinberg and Blitz,2006).
The profound effect of the formation of a bar on the stellar disk precludes anystrong statement from being made linking the evolution of these model disks to theproperties of the host halo, be it the main halo itself, or the substructure whichimpacts on the disk. In the future, one extension of this work is to begin with diskmodels that are stable against bar formation. Though such disks might not be themost realistic, it would allow a test of the effect of a realistic pattern of substructureimpact on a stellar disk, eliminating any heating from bar generation in the disk.
134
Another possible extension of this work is to include a realistic gas component whichis star forming. The simple exploration of an inert gas component in this work showedthat it is possible that the gas will stabilize the disk, both from the increased pressuresupport and the fact that gas can absorb some of the impact energy (Moster et al.,2010). However, correctly modeling the physics of star forming gas is difficult, andso our focus on the stellar components of the disk does not have to contend with anyof the uncertainty in star formation feedback physics.
135
Bibliography
D. M. Alexander, W. N. Brandt, I. Smail, A. M. Swinbank, F. E. Bauer, A. W. Blain,S. C. Chapman, K. E. K. Coppin, R. J. Ivison, and K. Menendez-Delmestre. Weigh-ing the Black Holes in z ˜ 2 Submillimeter-Emitting Galaxies Hosting Active Galac-tic Nuclei. AJ, 135:1968–1981, May 2008. doi: 10.1088/0004-6256/135/5/1968.
B. Allgood, R. A. Flores, J. R. Primack, A. V. Kravtsov, R. H. Wechsler, A. Fal-tenbacher, and J. S. Bullock. The shape of dark matter haloes: dependence onmass, redshift, radius and formation. MNRAS, 367:1781–1796, April 2006. doi:10.1111/j.1365-2966.2006.10094.x.
E. Athanassoula. Bar-Halo Interaction and Bar Growth. ApJ, 569:L83–L86, April2002. doi: 10.1086/340784.
E. Athanassoula. Disc instabilities and semi-analytic modelling of galaxy formation.MNRAS, 390:L69–L72, October 2008. doi: 10.1111/j.1745-3933.2008.00541.x.
M. Aumer and J. J. Binney. Kinematics and history of the solar neighbour-hood revisited. MNRAS, 397:1286–1301, August 2009. doi: 10.1111/j.1365-2966.2009.15053.x.
M. Aumer and S. D. M. White. Idealized models for galactic disk formation andevolution in ’realistic’ LambdaCDM haloes. ArXiv e-prints, March 2012.
J. E. Barnes and L. E. Hernquist. Fueling starburst galaxies with gas-rich mergers.ApJ, 370:L65–L68, April 1991. doi: 10.1086/185978.
M. A. Bautista, J. P. Dunn, N. Arav, K. T. Korista, M. Moe, and C. Benn. Distanceto Multiple Kinematic Components of Quasar Outflows: Very Large TelescopeObservations of QSO 2359-1241 and SDSS J0318-0600. ApJ, 713:25–31, April2010. doi: 10.1088/0004-637X/713/1/25.
E. F. Bell, S. Phleps, R. S. Somerville, C. Wolf, A. Borch, and K. Meisenheimer. Themerger rate of massive galaxies. astro-ph/0602038, February 2006.
136
A. J. Benson, C. G. Lacey, C. S. Frenk, C. M. Baugh, and S. Cole. Heating ofgalactic discs by infalling satellites. MNRAS, 351:1215–1236, July 2004. doi:10.1111/j.1365-2966.2004.07870.x.
I. Berentzen and I. Shlosman. Growing Live Disks within Cosmologically Assem-bling Asymmetric Halos: Washing Out the Halo Prolateness. ApJ, 648:807–819,September 2006. doi: 10.1086/506016.
I. Berentzen, I. Shlosman, and S. Jogee. Stellar Bar Evolution in Cuspy and Flat-coredTriaxial CDM Halos. ApJ, 637:582–597, February 2006. doi: 10.1086/498493.
I. Berentzen, I. Shlosman, I. Martinez-Valpuesta, and C. H. Heller. Gas Feedback onStellar Bar Evolution. ApJ, 666:189–200, September 2007. doi: 10.1086/520531.
P. Bett, V. Eke, C. S. Frenk, A. Jenkins, J. Helly, and J. Navarro. The spin and shapeof dark matter haloes in the Millennium simulation of a Λ cold dark matter universe.MNRAS, 376:215–232, March 2007. doi: 10.1111/j.1365-2966.2007.11432.x.
R. D. Blandford and M. C. Begelman. On the fate of gas accreting at a low rateon to a black hole. MNRAS, 303:L1–L5, February 1999. doi: 10.1046/j.1365-8711.1999.02358.x.
H. Bondi. On spherically symmetrical accretion. MNRAS, 112:195–+, 1952.
C. M. Booth and J. Schaye. Cosmological simulations of the growth of supermassiveblack holes and feedback from active galactic nuclei: method and tests. MNRAS,398:53–74, September 2009. doi: 10.1111/j.1365-2966.2009.15043.x.
F. Bournaud, C. J. Jog, and F. Combes. Multiple minor mergers: formation ofelliptical galaxies and constraints for the growth of spiral disks. A&A, 476:1179–1190, December 2007. doi: 10.1051/0004-6361:20078010.
A. H. Bridle and R. A. Perley. Extragalactic Radio Jets. ARA&A, 22:319–358, 1984.doi: 10.1146/annurev.aa.22.090184.001535.
J. S. Bullock. Shapes of Dark Matter Halos. In P. Natarajan, editor, The Shapes ofGalaxies and their Dark Halos, pages 109–113, March 2002.
M. Bureau and K. C. Freeman. The Nature of Boxy/Peanut-Shaped Bulges in SpiralGalaxies. AJ, 118:126–138, July 1999. doi: 10.1086/300922.
M. Bureau, G. Aronica, E. Athanassoula, R.-J. Dettmar, A. Bosma, and K. C.Freeman. K-band observations of boxy bulges - I. Morphology and surfacebrightness profiles. MNRAS, 370:753–772, August 2006. doi: 10.1111/j.1365-2966.2006.10471.x.
137
A. Burkert and J. Silk. Star Formation-Regulated Growth of Black Holes in Proto-galactic Spheroids. ApJ, 554:L151–L154, June 2001. doi: 10.1086/321698.
C. A. Chang, A. V. R. Schiano, and A. M. Wolfe. The effect of a quasi-stellarobject on its host galaxy - Dynamical and physical processes in the interstellarmedium around a quasi-stellar object. ApJ, 322:180–200, November 1987. doi:10.1086/165714.
A. Chung, M. S. Yun, G. Naraynan, M. Heyer, and N. R. Erickson. Evidence for 1000km s−1 Molecular Outflows in the Local ULIRG Population. ApJ, 732:L15+, May2011. doi: 10.1088/2041-8205/732/1/L15.
L. Ciotti and J. P. Ostriker. Cooling Flows and Quasars: Different Aspects ofthe Same Phenomenon? I. Concepts. ApJ, 487:L105+, October 1997. doi:10.1086/310902.
L. Ciotti and J. P. Ostriker. Cooling Flows and Quasars. II. Detailed Modelsof Feedback-modulated Accretion Flows. ApJ, 551:131–152, April 2001. doi:10.1086/320053.
L. Ciotti and J. P. Ostriker. Radiative Feedback from Massive Black Holes in EllipticalGalaxies: AGN Flaring and Central Starburst Fueled by Recycled Gas. ApJ, 665:1038–1056, August 2007. doi: 10.1086/519833.
L. Ciotti, J. P. Ostriker, and D. Proga. Feedback from Central Black Holes in EllipticalGalaxies. I. Models with Either Radiative or Mechanical Feedback but not Both.ApJ, 699:89–104, July 2009. doi: 10.1088/0004-637X/699/1/89.
L. Ciotti, J. P. Ostriker, and D. Proga. Feedback from Central Black Holes in EllipticalGalaxies. III. Models with Both Radiative and Mechanical Feedback. ApJ, 717:708–723, July 2010. doi: 10.1088/0004-637X/717/2/708.
A. L. Coil, B. J. Weiner, D. E. Holz, M. C. Cooper, R. Yan, and J. Aird. OutflowingGalactic Winds in Post-starburst and Active Galactic Nucleus Host Galaxies at 0.2< z < 0.8. ApJ, 743:46, December 2011. doi: 10.1088/0004-637X/743/1/46.
S. Comeron, B. G. Elmegreen, J. H. Knapen, H. Salo, E. Laurikainen, J. Laine,E. Athanassoula, A. Bosma, K. Sheth, M. W. Regan, J. L. Hinz, A. Gil de Paz,K. Menendez-Delmestre, T. Mizusawa, J.-C. Munoz-Mateos, M. Seibert, T. Kim,D. M. Elmegreen, D. A. Gadotti, L. C. Ho, B. W. Holwerda, J. Lappalainen,E. Schinnerer, and R. Skibba. Thick Disks of Edge-on Galaxies Seen through theSpitzer Survey of Stellar Structure in Galaxies (S4G): Lair of Missing Baryons?ApJ, 741:28, November 2011. doi: 10.1088/0004-637X/741/1/28.
138
C. J. Conselice, M. A. Bershady, M. Dickinson, and C. Papovich. A Direct Measure-ment of Major Galaxy Mergers at z ¡ 3. AJ, 126:1183–1207, September 2003. doi:10.1086/377318.
D. J. Croton, V. Springel, S. D. M. White, G. De Lucia, C. S. Frenk, L. Gao, A. Jenk-ins, G. Kauffmann, J. F. Navarro, and N. Yoshida. The many lives of active galacticnuclei: cooling flows, black holes and the luminosities and colours of galaxies. MN-RAS, 365:11–28, January 2006. doi: 10.1111/j.1365-2966.2005.09675.x.
A. Curir, P. Mazzei, and G. Murante. Bar instability in cosmological halos. A&A,447:453–463, February 2006. doi: 10.1051/0004-6361:20053418.
X. Dai, F. Shankar, and G. R. Sivakoff. 2MASS Reveals a Large Intrinsic Fraction ofBALQSOs. ApJ, 672:108–114, January 2008. doi: 10.1086/523688.
K. M. Dasyra, L. J. Tacconi, R. I. Davies, R. Genzel, D. Lutz, T. Naab, D. B. Sanders,S. Veilleux, and A. J. Baker. Probing for evolutionary links between local ULIRGsand QSOs using NIR spectroscopy. New Astronomy Review, 50:720–724, November2006. doi: 10.1016/j.newar.2006.06.079.
V. P. Debattista and J. A. Sellwood. Warped Galaxies from Misaligned AngularMomenta. ApJ, 513:L107–L110, March 1999. doi: 10.1086/311913.
V. P. Debattista, L. Mayer, C. M. Carollo, B. Moore, J. Wadsley, and T. Quinn. TheSecular Evolution of Disk Structural Parameters. ApJ, 645:209–227, July 2006.doi: 10.1086/504147.
J. DeBuhr, E. Quataert, C.-P. Ma, and P. Hopkins. Self-regulated black hole growthvia momentum deposition in galaxy merger simulations. MNRAS, 406:L55–L59,July 2010. doi: 10.1111/j.1745-3933.2010.00881.x.
J. DeBuhr, E. Quataert, and C.-P. Ma. The growth of massive black holes in galaxymerger simulations with feedback by radiation pressure. MNRAS, 412:1341–1360,April 2011. doi: 10.1111/j.1365-2966.2010.17992.x.
J. DeBuhr, E. Quataert, and C.-P. Ma. Galaxy-scale outflows driven by activegalactic nuclei. MNRAS, 420:2221–2231, March 2012. doi: 10.1111/j.1365-2966.2011.20187.x.
T. Di Matteo, V. Springel, and L. Hernquist. Energy input from quasars regulatesthe growth and activity of black holes and their host galaxies. Nature, 433:604–607,February 2005. doi: 10.1038/nature03335.
C. L. Dobbs, A. Burkert, and J. E. Pringle. The properties of the interstellar mediumin disc galaxies with stellar feedback. MNRAS, 417:1318–1334, October 2011. doi:10.1111/j.1365-2966.2011.19346.x.
139
E. D’Onghia, V. Springel, L. Hernquist, and D. Keres. Substructure Depletion inthe Milky Way Halo by the Disk. ApJ, 709:1138–1147, February 2010. doi:10.1088/0004-637X/709/2/1138.
D. Downes and P. M. Solomon. Rotating Nuclear Rings and Extreme Starbursts inUltraluminous Galaxies. ApJ, 507:615–654, November 1998. doi: 10.1086/306339.
J. Dubinski and D. Chakrabarty. Warps and Bars from the External Tidal Torquesof Tumbling Dark Halos. ApJ, 703:2068–2081, October 2009. doi: 10.1088/0004-637X/703/2/2068.
J. Dubinski, I. Berentzen, and I. Shlosman. Anatomy of the Bar Instability inCuspy Dark Matter Halos. ApJ, 697:293–310, May 2009. doi: 10.1088/0004-637X/697/1/293.
J. P. Dunn, M. Bautista, N. Arav, M. Moe, K. Korista, E. Costantini, C. Benn,S. Ellison, and D. Edmonds. The Quasar Outflow Contribution to AGN Feedback:VLT Measurements of SDSS J0318-0600. ApJ, 709:611–631, February 2010. doi:10.1088/0004-637X/709/2/611.
F. Durier and C. Dalla Vecchia. Implementation of feedback in SPH: towards con-cordance of methods. ArXiv e-prints, May 2011.
G. Efstathiou, G. Lake, and J. Negroponte. The stability and masses of disc galaxies.MNRAS, 199:1069–1088, June 1982.
C. . Faucher-Giguere, E. Quataert, and N. Murray. A Physical Model of FeLoBALs:Implications for Quasar Feedback. ArXiv e-prints, August 2011.
L. Ferrarese and D. Merritt. A Fundamental Relation between Supermassive BlackHoles and Their Host Galaxies. ApJ, 539:L9–L12, August 2000.
C. Feruglio, R. Maiolino, E. Piconcelli, N. Menci, H. Aussel, A. Lamastra, andF. Fiore. Quasar feedback revealed by giant molecular outflows. A&A, 518:L155+,July 2010. doi: 10.1051/0004-6361/201015164.
B. Fuchs. Density waves in the shearing sheet - III. Disc heating. MNRAS, 325:1637–1642, August 2001. doi: 10.1046/j.1365-8711.2001.04549.x.
I. Garcıa-Ruiz, R. Sancisi, and K. Kuijken. Neutral hydrogen and optical observationsof edge-on galaxies: Hunting for warps. A&A, 394:769–789, November 2002. doi:10.1051/0004-6361:20020976.
J.-R. Gauthier, J. Dubinski, and L. M. Widrow. Substructure around M31: Evolutionand Effects. ApJ, 653:1180–1193, December 2006. doi: 10.1086/508860.

140
K. Gebhardt, R. Bender, G. Bower, A. Dressler, S. M. Faber, A. V. Filippenko,R. Green, C. Grillmair, L. C. Ho, J. Kormendy, T. R. Lauer, J. Magorrian,J. Pinkney, D. Richstone, and S. Tremaine. A Relationship between Nuclear BlackHole Mass and Galaxy Velocity Dispersion. ApJ, 539:L13–L16, August 2000.
A. M. Ghez, S. Salim, N. N. Weinberg, J. R. Lu, T. Do, J. K. Dunn, K. Matthews,M. R. Morris, S. Yelda, E. E. Becklin, T. Kremenek, M. Milosavljevic, andJ. Naiman. Measuring Distance and Properties of the Milky Way’s Central Su-permassive Black Hole with Stellar Orbits. ApJ, 689:1044–1062, December 2008.doi: 10.1086/592738.
J. Goodman. Self-gravity and quasi-stellar object discs. MNRAS, 339:937–948, March2003. doi: 10.1046/j.1365-8711.2003.06241.x.
A. W. Graham. Fundamental Planes and the Barless Mbh-σ Relation for SupermassiveBlack Holes. ApJ, 680:143–153, June 2008. doi: 10.1086/587473.
J. E. Greene, L. C. Ho, and A. J. Barth. Black Holes in Pseudobulges and Spheroidals:A Change in the Black Hole-Bulge Scaling Relations at Low Mass. ApJ, 688:159–179, November 2008. doi: 10.1086/592078.
J. E. Greene, C. Y. Peng, M. Kim, C.-Y. Kuo, J. A. Braatz, C. M. Violette Impel-lizzeri, J. J. Condon, K. Y. Lo, C. Henkel, and M. J. Reid. Precise Black HoleMasses from Megamaser Disks: Black Hole-Bulge Relations at Low Mass. ApJ,721:26–45, September 2010. doi: 10.1088/0004-637X/721/1/26.
K. Gultekin, D. O. Richstone, K. Gebhardt, T. R. Lauer, S. Tremaine, M. C. Aller,R. Bender, A. Dressler, S. M. Faber, A. V. Filippenko, R. Green, L. C. Ho, J. Ko-rmendy, J. Magorrian, J. Pinkney, and C. Siopis. The M-σ and M-L Relations inGalactic Bulges, and Determinations of Their Intrinsic Scatter. ApJ, 698:198–221,June 2009. doi: 10.1088/0004-637X/698/1/198.
Q. Guo, S. White, C. Li, and M. Boylan-Kolchin. How do galaxies populatedark matter haloes? MNRAS, 404:1111–1120, May 2010. doi: 10.1111/j.1365-2966.2010.16341.x.
Q. Guo, S. Cole, V. Eke, and C. Frenk. Satellite Galaxy Number Density Profiles inthe Sloan Digital Sky Survey. ArXiv e-prints, January 2012.
N. Haring and H. Rix. On the Black Hole Mass-Bulge Mass Relation. ApJ, 604:L89–L92, April 2004.
C. H. Heller, I. Shlosman, and E. Athanassoula. Structure Formation inside TriaxialDark Matter Halos: Galactic Disks, Bulges, and Bars. ApJ, 671:226–242, December2007a. doi: 10.1086/523260.
141
C. H. Heller, I. Shlosman, and E. Athanassoula. Induced Nested Galactic Barsinside Assembling Dark Matter Halos. ApJ, 657:L65–L68, March 2007b. doi:10.1086/513104.
L. Hernquist. An analytical model for spherical galaxies and bulges. ApJ, 356:359–364, June 1990. doi: 10.1086/168845.
L. Hernquist and J. C. Mihos. Excitation of Activity in Galaxies by Minor Mergers.ApJ, 448:41–+, July 1995. doi: 10.1086/175940.
L. C. Ho, J. Darling, and J. E. Greene. Properties of Active Galaxies Deduced fromH I Observations. ApJ, 681:128–140, July 2008. doi: 10.1086/588207.
A. Hobbs, S. Nayakshin, C. Power, and A. King. On the role of supernovae-driventurbulence in the feeding of supermassive black holes. ArXiv e-prints, January2010.
P. F. Hopkins and M. Elvis. Quasar feedback: more bang for your buck. MNRAS,401:7–14, January 2010. doi: 10.1111/j.1365-2966.2009.15643.x.
P. F. Hopkins and E. Quataert. An Analytic Model of Angular Momentum Transportby Gravitational Torques: From Galaxies to Massive Black Holes. ArXiv e-prints,July 2010a.
P. F. Hopkins and E. Quataert. How do massive black holes get their gas? MNRAS,407:1529–1564, September 2010b. doi: 10.1111/j.1365-2966.2010.17064.x.
P. F. Hopkins, L. Hernquist, T. J. Cox, T. Di Matteo, P. Martini, B. Robertson,and V. Springel. Black Holes in Galaxy Mergers: Evolution of Quasars. ApJ, 630:705–715, September 2005. doi: 10.1086/432438.
P. F. Hopkins, L. Hernquist, T. J. Cox, B. Robertson, and E. Krause. An Ob-served Fundamental Plane Relation for Supermassive Black Holes. ApJ, 669:67–73,November 2007. doi: 10.1086/521601.
P. F. Hopkins, T. J. Cox, J. D. Younger, and L. Hernquist. How do DisksSurvive Mergers? ApJ, 691:1168–1201, February 2009. doi: 10.1088/0004-637X/691/2/1168.
P. F. Hopkins, N. Murray, E. Quataert, and T. A. Thompson. A maximum stellarsurface density in dense stellar systems. MNRAS, 401:L19–L23, January 2010. doi:10.1111/j.1745-3933.2009.00777.x.
P. F. Hopkins, E. Quataert, and N. Murray. Self-regulated star formation in galaxiesvia momentum input from massive stars. MNRAS, 417:950–973, October 2011.doi: 10.1111/j.1365-2966.2011.19306.x.
142
J. Hu. The black hole mass-stellar velocity dispersion correlation: bulges ver-sus pseudo-bulges. MNRAS, 386:2242–2252, June 2008. doi: 10.1111/j.1365-2966.2008.13195.x.
C. J. Jog and J. P. Ostriker. The velocity dispersion of the giant molecular clouds -A viscous origin. ApJ, 328:404–426, May 1988. doi: 10.1086/166302.
S. Jogee, F. D. Barazza, H.-W. Rix, I. Shlosman, M. Barden, C. Wolf, J. Davies,I. Heyer, S. V. W. Beckwith, E. F. Bell, A. Borch, J. A. R. Caldwell, C. J. Conselice,T. Dahlen, B. Haussler, C. Heymans, K. Jahnke, J. H. Knapen, S. Laine, G. M.Lubell, B. Mobasher, D. H. McIntosh, K. Meisenheimer, C. Y. Peng, S. Ravin-dranath, S. F. Sanchez, R. S. Somerville, and L. Wisotzki. Bar Evolution over theLast 8 Billion Years: A Constant Fraction of Strong Bars in the GEMS Survey.ApJ, 615:L105–L108, November 2004. doi: 10.1086/426138.
P. H. Johansson, A. Burkert, and T. Naab. The Evolution of Black Hole Scaling Rela-tions in Galaxy Mergers. ApJ, 707:L184–L189, December 2009a. doi: 10.1088/0004-637X/707/2/L184.
P. H. Johansson, T. Naab, and A. Burkert. Equal- and Unequal-Mass Mergers ofDisk and Elliptical Galaxies with Black Holes. ApJ, 690:802–821, January 2009b.doi: 10.1088/0004-637X/690/1/802.
M. Juric, Z. Ivezic, A. Brooks, R. H. Lupton, D. Schlegel, D. Finkbeiner, N. Padman-abhan, N. Bond, B. Sesar, C. M. Rockosi, G. R. Knapp, J. E. Gunn, T. Sumi, D. P.Schneider, J. C. Barentine, H. J. Brewington, J. Brinkmann, M. Fukugita, M. Har-vanek, S. J. Kleinman, J. Krzesinski, D. Long, E. H. Neilsen, Jr., A. Nitta, S. A.Snedden, and D. G. York. The Milky Way Tomography with SDSS. I. Stellar Num-ber Density Distribution. ApJ, 673:864–914, February 2008. doi: 10.1086/523619.
S. Kaviraj, K. Schawinski, J. Silk, and S. S. Shabala. A simple model for AGNfeedback in nearby early-type galaxies. MNRAS, 415:3798–3806, August 2011. doi:10.1111/j.1365-2966.2011.19002.x.
D. Kawata and B. K. Gibson. Self-regulated active galactic nuclei heating inelliptical galaxies. MNRAS, 358:L16–L20, March 2005. doi: 10.1111/j.1745-3933.2005.00018.x.
S. Kazantzidis, J. S. Bullock, A. R. Zentner, A. V. Kravtsov, and L. A. Mous-takas. Cold Dark Matter Substructure and Galactic Disks. I. Morphological Signa-tures of Hierarchical Satellite Accretion. ApJ, 688:254–276, November 2008. doi:10.1086/591958.
143
S. Kazantzidis, A. R. Zentner, A. V. Kravtsov, J. S. Bullock, and V. P. Debattista.Cold Dark Matter Substructure and Galactic Disks. II. Dynamical Effects of Hier-archical Satellite Accretion. ApJ, 700:1896–1920, August 2009. doi: 10.1088/0004-637X/700/2/1896.
S. Kazantzidis, M. G. Abadi, and J. F. Navarro. The Sphericalization of Dark MatterHalos by Galaxy Disks. ApJ, 720:L62–L66, September 2010. doi: 10.1088/2041-8205/720/1/L62.
R. C. Kennicutt, Jr. Properties of H II region populations in galaxies. I - The first-ranked H II regions. ApJ, 334:144–158, November 1988. doi: 10.1086/166825.
A. Khalatyan, A. Cattaneo, M. Schramm, S. Gottlober, M. Steinmetz, andL. Wisotzki. Is AGN feedback necessary to form red elliptical galaxies? MNRAS,387:13–30, June 2008. doi: 10.1111/j.1365-2966.2008.13093.x.
J.-h. Kim, J. H. Wise, and T. Abel. Galaxy Mergers with Adaptive Mesh Refinement:Star Formation and Hot Gas Outflow. ApJ, 694:L123–L127, April 2009. doi:10.1088/0004-637X/694/2/L123.
A. King. Black Holes, Galaxy Formation, and the MBH-σ Relation. ApJ, 596:L27–L29, October 2003. doi: 10.1086/379143.
A. King. The AGN-Starburst Connection, Galactic Superwinds, and MBH-σ. ApJ,635:L121–L123, December 2005. doi: 10.1086/499430.
A. R. King and K. A. Pounds. Black hole winds. MNRAS, 345:657–659, October2003. doi: 10.1046/j.1365-8711.2003.06980.x.
A. R. King, K. Zubovas, and C. Power. Large-scale outflows in galaxies. MNRAS,415:L6–L10, July 2011. doi: 10.1111/j.1745-3933.2011.01067.x.
J. H. Knapen, I. Shlosman, and R. F. Peletier. A Subarcsecond Resolution Near-Infrared Study of Seyfert and “Normal” Galaxies. II. Morphology. ApJ, 529:93–100,January 2000. doi: 10.1086/308266.
M. Koss, R. Mushotzky, S. Veilleux, and L. Winter. Merging and Clustering of theSwift BAT AGN Sample. ApJ, 716:L125–L130, June 2010. doi: 10.1088/2041-8205/716/2/L125.
J. H. Krolik. Active galactic nuclei : from the central black hole to the galacticenvironment. Princeton University Press, 1999.
K. Kuijken and M. R. Merrifield. Establishing the connection between peanut-shapedbulges and galactic bars. ApJ, 443:L13–L16, April 1995. doi: 10.1086/187824.
144
C. Y. Kuo, J. A. Braatz, J. J. Condon, C. M. V. Impellizzeri, K. Y. Lo, I. Zaw,M. Schenker, C. Henkel, M. J. Reid, and J. E. Greene. The Megamaser Cosmol-ogy Project. III. Accurate Masses of Seven Supermassive Black Holes in ActiveGalaxies with Circumnuclear Megamaser Disks. ApJ, 727:20, January 2011. doi:10.1088/0004-637X/727/1/20.
C. Lacey and S. Cole. Merger rates in hierarchical models of galaxy formation.MNRAS, 262:627–649, June 1993.
A. Laor and H. Netzer. Massive thin accretion discs. I - Calculated spectra. MNRAS,238:897–916, June 1989.
E. S. Levine, L. Blitz, and C. Heiles. The Vertical Structure of the Outer Milky WayH I Disk. ApJ, 643:881–896, June 2006. doi: 10.1086/503091.
R. Levine, N. Y. Gnedin, and A. J. S. Hamilton. Measuring Gas Accretion andAngular Momentum Near Simulated Supermassive Black Holes. ApJ, 716:1386–1396, June 2010. doi: 10.1088/0004-637X/716/2/1386.
J. M. Lotz, P. Jonsson, T. J. Cox, D. Croton, J. R. Primack, R. S. Somerville, andK. Stewart. The Major and Minor Galaxy Merger Rates at z ¡ 1.5. ApJ, 742:103,December 2011. doi: 10.1088/0004-637X/742/2/103.
R. E. G. Machado and E. Athanassoula. Loss of halo triaxiality due to bar formation.MNRAS, 406:2386–2404, August 2010. doi: 10.1111/j.1365-2966.2010.16890.x.
J. Magorrian, S. Tremaine, D. Richstone, R. Bender, G. Bower, A. Dressler, S. M.Faber, K. Gebhardt, R. Green, C. Grillmair, J. Kormendy, and T. Lauer. TheDemography of Massive Dark Objects in Galaxy Centers. AJ, 115:2285–2305, June1998.
A. Marconi and L. K. Hunt. The Relation between Black Hole Mass, Bulge Mass, andNear-Infrared Luminosity. ApJ, 589:L21–L24, May 2003. doi: 10.1086/375804.
I. Marinova and S. Jogee. Characterizing Bars at z ˜ 0 in the Optical and NIR:Implications for the Evolution of Barred Disks with Redshift. ApJ, 659:1176–1197,April 2007. doi: 10.1086/512355.
I. Martinez-Valpuesta and I. Shlosman. Why Buckling Stellar Bars Weaken in DiskGalaxies. ApJ, 613:L29–L32, September 2004. doi: 10.1086/424876.
I. Martinez-Valpuesta, I. Shlosman, and C. Heller. Evolution of Stellar Bars in LiveAxisymmetric Halos: Recurrent Buckling and Secular Growth. ApJ, 637:214–226,January 2006. doi: 10.1086/498338.
145
N. J. McConnell, C.-P. Ma, J. D. Murphy, K. Gebhardt, T. R. Lauer, J. R. Graham,S. A. Wright, and D. O. Richstone. Dynamical Measurements of Black Hole Massesin Four Brightest Cluster Galaxies at 100 Mpc. ArXiv e-prints, March 2012.
C. F. McKee and J. P. Ostriker. A theory of the interstellar medium - Three com-ponents regulated by supernova explosions in an inhomogeneous substrate. ApJ,218:148–169, November 1977. doi: 10.1086/155667.
P. J. McMillan. Mass models of the Milky Way. MNRAS, 414:2446–2457, July 2011.doi: 10.1111/j.1365-2966.2011.18564.x.
B. R. McNamara and P. E. J. Nulsen. Heating Hot Atmospheres with Ac-tive Galactic Nuclei. ARA&A, 45:117–175, September 2007. doi: 10.1146/an-nurev.astro.45.051806.110625.
J. C. Mihos and L. Hernquist. Gasdynamics and Starbursts in Major Mergers. ApJ,464:641–+, June 1996. doi: 10.1086/177353.
I. Minchev and A. C. Quillen. Radial heating of a galactic disc by multiplespiral density waves. MNRAS, 368:623–636, May 2006. doi: 10.1111/j.1365-2966.2006.10129.x.
M. Moe, N. Arav, M. A. Bautista, and K. T. Korista. Quasar Outflow Contributionto AGN Feedback: Observations of QSO SDSS J0838+2955. ApJ, 706:525–534,November 2009. doi: 10.1088/0004-637X/706/1/525.
B. P. Moster, A. V. Maccio, R. S. Somerville, P. H. Johansson, and T. Naab. Cangas prevent the destruction of thin stellar discs by minor mergers? MNRAS, 403:1009–1019, April 2010. doi: 10.1111/j.1365-2966.2009.16190.x.
B. P. Moster, A. V. Maccio’, R. S. Somerville, T. Naab, and T. J. Cox. The effectsof a hot gaseous halo on disc thickening in galaxy minor mergers. ArXiv e-prints,August 2011.
N. Murray, J. Chiang, S. A. Grossman, and G. M. Voit. Accretion Disk Winds fromActive Galactic Nuclei. ApJ, 451:498–+, October 1995. doi: 10.1086/176238.
N. Murray, E. Quataert, and T. A. Thompson. On the Maximum Luminosity ofGalaxies and Their Central Black Holes: Feedback from Momentum-driven Winds.ApJ, 618:569–585, January 2005. doi: 10.1086/426067.
N. Murray, E. Quataert, and T. A. Thompson. The Disruption of Giant MolecularClouds by Radiation Pressure & the Efficiency of Star Formation in Galaxies. ApJ,709:191–209, January 2010. doi: 10.1088/0004-637X/709/1/191.
146
J. F. Navarro, C. S. Frenk, and S. D. M. White. The Structure of Cold Dark MatterHalos. ApJ, 462:563–+, May 1996. doi: 10.1086/177173.
J. F. Navarro, M. G. Abadi, K. A. Venn, K. C. Freeman, and B. Anguiano. Throughthick and thin: kinematic and chemical components in the solar neighbourhood.MNRAS, 412:1203–1209, April 2011. doi: 10.1111/j.1365-2966.2010.17975.x.
H. Netzer. Ionized gas in active galactic nuclei. New A Rev., 52:257–273, August2008. doi: 10.1016/j.newar.2008.06.009.
G. S. Novak, J. P. Ostriker, and L. Ciotti. Feedback from Central Black Holes in El-liptical Galaxies: Two-dimensional Models Compared to One-dimensional Models.ApJ, 737:26, August 2011. doi: 10.1088/0004-637X/737/1/26.
J. P. Ostriker, E. Choi, L. Ciotti, G. S. Novak, and D. Proga. Momentum Driving:Which Physical Processes Dominate Active Galactic Nucleus Feedback? ApJ, 722:642–652, October 2010. doi: 10.1088/0004-637X/722/1/642.
B. M. Peterson, L. Ferrarese, K. M. Gilbert, S. Kaspi, M. A. Malkan, D. Maoz,D. Merritt, H. Netzer, C. A. Onken, R. W. Pogge, M. Vestergaard, and A. Wan-del. Central Masses and Broad-Line Region Sizes of Active Galactic Nuclei. II.A Homogeneous Analysis of a Large Reverberation-Mapping Database. ApJ, 613:682–699, October 2004. doi: 10.1086/423269.
C. Power, S. Nayakshin, and A. King. The accretion disc particle method for simula-tions of black hole feeding and feedback. MNRAS, 412:269–276, March 2011. doi:10.1111/j.1365-2966.2010.17901.x.
D. J. Price. splash: An Interactive Visualisation Tool for Smoothed Particle Hydro-dynamics Simulations. Publications of the Astronomical Society of Australia, 24:159–173, October 2007. doi: 10.1071/AS07022.
D. Proga. Numerical Simulations of Mass Outflows Driven from Accretion Disksby Radiation and Magnetic Forces. ApJ, 585:406–417, March 2003. doi:10.1086/345897.
C. W. Purcell, J. S. Bullock, and A. R. Zentner. Shredded Galaxies as the Source ofDiffuse Intrahalo Light on Varying Scales. ApJ, 666:20–33, September 2007. doi:10.1086/519787.
C. W. Purcell, S. Kazantzidis, and J. S. Bullock. The Destruction of Thin StellarDisks Via Cosmologically Common Satellite Accretion Events. ApJ, 694:L98–L102,April 2009. doi: 10.1088/0004-637X/694/2/L98.
N. Raha, J. A. Sellwood, R. A. James, and F. D. Kahn. A dynamical instability ofbars in disk galaxies. Nature, 352:411, August 1991. doi: 10.1038/352411a0.
147
V. Reshetnikov and F. Combes. Statistics of optical WARPS in spiral disks. A&A,337:9–16, September 1998.
B. Robertson, T. J. Cox, L. Hernquist, M. Franx, P. F. Hopkins, P. Martini, andV. Springel. The Fundamental Scaling Relations of Elliptical Galaxies. ApJ, 641:21–40, April 2006. doi: 10.1086/500360.
E. Romano-Dıaz, I. Shlosman, C. Heller, and Y. Hoffman. Disk Evolution and BarTriggering Driven by Interactions with Dark Matter Substructure. ApJ, 687:L13–L16, November 2008. doi: 10.1086/593168.
R. Roskar, V. P. Debattista, A. M. Brooks, T. R. Quinn, C. B. Brook, F. Governato,J. J. Dalcanton, and J. Wadsley. Misaligned angular momentum in hydrodynamiccosmological simulations: warps, outer discs and thick discs. MNRAS, 408:783–796,October 2010. doi: 10.1111/j.1365-2966.2010.17178.x.
D. S. N. Rupke and S. Veilleux. Integral Field Spectroscopy of Massive, Kiloparsec-scale Outflows in the Infrared-luminous QSO Mrk 231. ApJ, 729:L27+, March2011. doi: 10.1088/2041-8205/729/2/L27.
K. Saha, Y.-H. Tseng, and R. E. Taam. The Effect of Bars and Transient Spirals onthe Vertical Heating in Disk Galaxies. ApJ, 721:1878–1890, October 2010a. doi:10.1088/0004-637X/721/2/1878.
K. Saha, Y.-H. Tseng, and R. E. Taam. The Effect of Bars and Transient Spirals onthe Vertical Heating in Disk Galaxies. ApJ, 721:1878–1890, October 2010b. doi:10.1088/0004-637X/721/2/1878.
L. V. Sales, J. F. Navarro, T. Theuns, J. Schaye, S. D. M. White, C. S. Frenk, R. A.Crain, and C. Dalla Vecchia. The Origin of Disks and Spheroids in SimulatedGalaxies. ArXiv e-prints, December 2011.
M. L. Sanchez-Saavedra, E. Battaner, and E. Florido. Frequency of Warped SpiralGalaxies at Visible Wavelengths. MNRAS, 246:458, October 1990.
R. Sancisi. Warped HI Disks in Galaxies. A&A, 53:159, December 1976.
D. B. Sanders. Infrared Emission from AGN. In Y. Terzian, E. Khachikian, &D. Weedman, editor, Activity in Galaxies and Related Phenomena, volume 194 ofIAU Symposium, page 25, 1999.
D. B. Sanders, B. T. Soifer, J. H. Elias, B. F. Madore, K. Matthews, G. Neugebauer,and N. Z. Scoville. Ultraluminous infrared galaxies and the origin of quasars. ApJ,325:74–91, February 1988. doi: 10.1086/165983.
148
D. B. Sanders, E. S. Phinney, G. Neugebauer, B. T. Soifer, and K. Matthews. Contin-uum energy distribution of quasars - Shapes and origins. ApJ, 347:29–51, December1989. doi: 10.1086/168094.
S. Y. Sazonov, J. P. Ostriker, and R. A. Sunyaev. Quasars: the characteristic spectrumand the induced radiative heating. MNRAS, 347:144–156, January 2004. doi:10.1111/j.1365-2966.2004.07184.x.
S. Y. Sazonov, J. P. Ostriker, L. Ciotti, and R. A. Sunyaev. Radiative feedback fromquasars and the growth of massive black holes in stellar spheroids. MNRAS, 358:168–180, March 2005. doi: 10.1111/j.1365-2966.2005.08763.x.
C. Scannapieco, S. D. M. White, V. Springel, and P. B. Tissera. The formation andsurvival of discs in a ΛCDM universe. MNRAS, 396:696–708, June 2009. doi:10.1111/j.1365-2966.2009.14764.x.
E. Scannapieco, J. Silk, and R. Bouwens. AGN Feedback Causes Downsizing. ApJ,635:L13–L16, December 2005. doi: 10.1086/499271.
N. Z. Scoville, D. T. Frayer, E. Schinnerer, and M. Christopher. The Host Galaxiesof Optically Bright Quasi-stellar Objects: Molecular Gas in z ¡ 0.1 Palomar-GreenQuasi-stellar Objects. ApJ, 585:L105–L108, March 2003. doi: 10.1086/374544.
J. A. Sellwood, R. W. Nelson, and S. Tremaine. Resonant Thickening of Disks bySmall Satellite Galaxies. ApJ, 506:590–599, October 1998. doi: 10.1086/306280.
N. I. Shakura and R. A. Sunyaev. Black holes in binary systems. Observationalappearance. A&A, 24:337–355, 1973.
P. Sharma, E. Quataert, G. W. Hammett, and J. M. Stone. Electron Heating in HotAccretion Flows. ApJ, 667:714–723, October 2007. doi: 10.1086/520800.
P. Sharma, I. J. Parrish, and E. Quataert. Thermal Instability with AnisotropicThermal Conduction and Adiabatic Cosmic Rays: Implications for Cold Fila-ments in Galaxy Clusters. ApJ, 720:652–665, September 2010. doi: 10.1088/0004-637X/720/1/652.
S. Shen, H. J. Mo, S. D. M. White, M. R. Blanton, G. Kauffmann, W. Voges,J. Brinkmann, and I. Csabai. The size distribution of galaxies in the SloanDigital Sky Survey. MNRAS, 343:978–994, August 2003. doi: 10.1046/j.1365-8711.2003.06740.x.
S. Shen, S. D. M. White, H. J. Mo, W. Voges, G. Kauffmann, C. Tremonti, and S. F.Anderson. The soft X-ray properties of quasars in the Sloan Digital Sky Survey.MNRAS, 369:1639–1653, July 2006. doi: 10.1111/j.1365-2966.2006.10463.x.
149
K. Sheth, D. M. Elmegreen, B. G. Elmegreen, P. Capak, R. G. Abraham, E. Athanas-soula, R. S. Ellis, B. Mobasher, M. Salvato, E. Schinnerer, N. Z. Scoville, L. Spals-bury, L. Strubbe, M. Carollo, M. Rich, and A. A. West. Evolution of the BarFraction in COSMOS: Quantifying the Assembly of the Hubble Sequence. ApJ,675:1141–1155, March 2008. doi: 10.1086/524980.
I. Shlosman, J. Frank, and M. C. Begelman. Bars within bars - A mechanism for fu-elling active galactic nuclei. Nature, 338:45–47, March 1989. doi: 10.1038/338045a0.
I. Shlosman, M. C. Begelman, and J. Frank. The fuelling of active galactic nuclei.Nature, 345:679–686, June 1990. doi: 10.1038/345679a0.
J. Silk and A. Nusser. The Massive-black-hole-Velocity-dispersion Relation and theHalo Baryon Fraction: A Case for Positive Active Galactic Nucleus Feedback. ApJ,725:556–560, December 2010. doi: 10.1088/0004-637X/725/1/556.
J. Silk and M. J. Rees. Quasars and galaxy formation. A&A, 331:L1–L4, March 1998.
L. Sironi and A. Socrates. The Eddington Limit in Cosmic Rays: An Explanation forthe Observed Lack of Low-Mass Radio-Loud Quasars and The M-Msstarf Relation.ApJ, 710:891–902, February 2010. doi: 10.1088/0004-637X/710/2/891.
N. Y. Sotnikova and S. A. Rodionov. Mechanisms of the Vertical Secular Heating ofa Stellar Disk. Astronomy Letters, 29:321–335, May 2003. doi: 10.1134/1.1573281.
V. Springel. The cosmological simulation code GADGET-2. MNRAS, 364:1105–1134,December 2005. doi: 10.1111/j.1365-2966.2005.09655.x.
V. Springel and L. Hernquist. Cosmological smoothed particle hydrodynamics sim-ulations: a hybrid multiphase model for star formation. MNRAS, 339:289–311,February 2003. doi: 10.1046/j.1365-8711.2003.06206.x.
V. Springel, S. D. M. White, G. Tormen, and G. Kauffmann. Populating a cluster ofgalaxies - I. Results at [formmu2]z=0. MNRAS, 328:726–750, December 2001.
V. Springel, T. Di Matteo, and L. Hernquist. Modelling feedback from stars and blackholes in galaxy mergers. MNRAS, 361:776–794, August 2005a. doi: 10.1111/j.1365-2966.2005.09238.x.
V. Springel, T. Di Matteo, and L. Hernquist. Black Holes in Galaxy Mergers: TheFormation of Red Elliptical Galaxies. ApJ, 620:L79–L82, February 2005b. doi:10.1086/428772.
V. Springel, J. Wang, M. Vogelsberger, A. Ludlow, A. Jenkins, A. Helmi, J. F.Navarro, C. S. Frenk, and S. D. M. White. The Aquarius Project: the subhaloesof galactic haloes. MNRAS, 391:1685–1711, December 2008. doi: 10.1111/j.1365-2966.2008.14066.x.
150
K. R. Stewart, J. S. Bullock, R. H. Wechsler, A. H. Maller, and A. R. Zentner. MergerHistories of Galaxy Halos and Implications for Disk Survival. ApJ, 683:597–610,August 2008. doi: 10.1086/588579.
E. Sturm, E. Gonzalez-Alfonso, S. Veilleux, J. Fischer, and J. et. al. Gracia-Carpio.Massive Molecular Outflows and Negative Feedback in ULIRGs Observed byHerschel-PACS. ApJ, 733:L16+, May 2011. doi: 10.1088/2041-8205/733/1/L16.
A. A. Suchkov, R. J. Hanisch, W. Voges, and T. M. Heckman. Sloan Digital SkySurvey Active Galactic Nuclei with X-Ray Emission from ROSAT PSPC PointedObservations. AJ, 132:1475–1484, October 2006. doi: 10.1086/506563.
J. W. Sulentic, P. Marziani, and D. Dultzin-Hacyan. Phenomenology of Broad Emis-sion Lines in Active Galactic Nuclei. ARA&A, 38:521–571, 2000. doi: 10.1146/an-nurev.astro.38.1.521.
R. A. Sunyaev and L. G. Titarchuk. Comptonization of X-rays in plasma clouds -Typical radiation spectra. A&A, 86:121–138, June 1980.
R. S. Sutherland and M. A. Dopita. Cooling functions for low-density astrophysicalplasmas. ApJS, 88:253–327, September 1993. doi: 10.1086/191823.
G. Tabor and J. Binney. Elliptical Galaxy Cooling Flows Without Mass Drop-Out.MNRAS, 263:323–+, July 1993.
L. J. Tacconi, R. Neri, S. C. Chapman, R. Genzel, I. Smail, R. J. Ivison, F. Bertoldi,A. Blain, P. Cox, T. Greve, and A. Omont. High-Resolution Millimeter Imaging ofSubmillimeter Galaxies. ApJ, 640:228–240, March 2006. doi: 10.1086/499933.
T. A. Thompson, E. Quataert, and N. Murray. Radiation Pressure-supported Star-burst Disks and Active Galactic Nucleus Fueling. ApJ, 630:167–185, September2005. doi: 10.1086/431923.
P. B. Tissera, S. D. M. White, S. Pedrosa, and C. Scannapieco. Dark matter responseto galaxy formation. MNRAS, 406:922–935, August 2010. doi: 10.1111/j.1365-2966.2010.16777.x.
F. Tombesi, M. Cappi, J. N. Reeves, G. G. C. Palumbo, T. Yaqoob, V. Braito, andM. Dadina. Evidence for ultra-fast outflows in radio-quiet AGNs. I. Detection andstatistical incidence of Fe K-shell absorption lines. A&A, 521:A57+, October 2010.doi: 10.1051/0004-6361/200913440.
A. Toomre and J. Toomre. Galactic Bridges and Tails. ApJ, 178:623–666, December1972.
151
G. Toth and J. P. Ostriker. Galactic disks, infall, and the global value of Omega.ApJ, 389:5–26, April 1992. doi: 10.1086/171185.
C. A. Tremonti, J. Moustakas, and A. M. Diamond-Stanic. The Discovery of 1000km s−1 Outflows in Massive Poststarburst Galaxies at z=0.6. ApJ, 663:L77–L80,July 2007. doi: 10.1086/520083.
I. Trujillo, N. M. Forster Schreiber, G. Rudnick, M. Barden, M. Franx, H.-W. Rix,J. A. R. Caldwell, D. H. McIntosh, S. Toft, B. Haussler, A. Zirm, P. G. van Dokkum,I. Labbe, A. Moorwood, H. Rottgering, A. van der Wel, P. van der Werf, and L. vanStarkenburg. The Size Evolution of Galaxies since z˜3: Combining SDSS, GEMS,and FIRES. ApJ, 650:18–41, October 2006. doi: 10.1086/506464.
P. C. van der Kruit and K. C. Freeman. Galaxy Disks. ARA&A, 49:301–371, Septem-ber 2011. doi: 10.1146/annurev-astro-083109-153241.
P. C. van der Kruit and L. Searle. Surface photometry of edge-on spiral galaxies. I -A model for the three-dimensional distribution of light in galactic disks. A&A, 95:105–115, February 1981.
H. Velazquez and S. D. M. White. Sinking satellites and the heating of galaxy discs.MNRAS, 304:254–270, April 1999.
C. A. Vera-Ciro, L. V. Sales, A. Helmi, C. S. Frenk, J. F. Navarro, V. Springel,M. Vogelsberger, and S. D. M. White. The shape of dark matter haloes in theAquarius simulations: evolution and memory. MNRAS, 416:1377–1391, September2011. doi: 10.1111/j.1365-2966.2011.19134.x.
J. C. Vernaleo and C. S. Reynolds. AGN Feedback and Cooling Flows: Problems withSimple Hydrodynamic Models. ApJ, 645:83–94, July 2006. doi: 10.1086/504029.
J. Villa-Vargas, I. Shlosman, and C. Heller. Dark Matter Halos and Evolution of Barsin Disk Galaxies: Collisionless Models Revisited. ApJ, 707:218–232, December2009. doi: 10.1088/0004-637X/707/1/218.
J. Villa-Vargas, I. Shlosman, and C. Heller. Dark Matter Halos and Evolution ofBars in Disk Galaxies: Varying Gas Fraction and Gas Spatial Resolution. ApJ,719:1470–1480, August 2010. doi: 10.1088/0004-637X/719/2/1470.
Y. Wadadekar. Radio emission from AGN detected by the VLA FIRST survey. A&A,416:35–40, March 2004. doi: 10.1051/0004-6361:20034244.
M. D. Weinberg and L. Blitz. A Magellanic Origin for the Warp of the Galaxy. ApJ,641:L33–L36, April 2006. doi: 10.1086/503607.
152
M. Wetzstein, T. Naab, and A. Burkert. Do dwarf galaxies form in tidal tails?MNRAS, 375:805–820, March 2007. doi: 10.1111/j.1365-2966.2006.11360.x.
B. C. Whitmore and M. Bell. IC 4767 (the ’X-galaxy’) - The missing link for under-standing galaxies with peanut-shaped bulges? ApJ, 324:741–748, January 1988.doi: 10.1086/165933.
X. X. Xue, H. W. Rix, G. Zhao, P. Re Fiorentin, T. Naab, M. Steinmetz, F. C. vanden Bosch, T. C. Beers, Y. S. Lee, E. F. Bell, C. Rockosi, B. Yanny, H. Newberg,R. Wilhelm, X. Kang, M. C. Smith, and D. P. Schneider. The Milky Way’s CircularVelocity Curve to 60 kpc and an Estimate of the Dark Matter Halo Mass from theKinematics of ˜2400 SDSS Blue Horizontal-Branch Stars. ApJ, 684:1143–1158,September 2008. doi: 10.1086/589500.
D. G. York, J. Adelman, J. E. Anderson, Jr., S. F. Anderson, J. Annis, N. A. Bahcall,J. A. Bakken, R. Barkhouser, S. Bastian, E. Berman, W. N. Boroski, S. Bracker,C. Briegel, J. W. Briggs, J. Brinkmann, R. Brunner, S. Burles, L. Carey, M. A.Carr, F. J. Castander, B. Chen, P. L. Colestock, A. J. Connolly, J. H. Crocker,I. Csabai, P. C. Czarapata, J. E. Davis, M. Doi, T. Dombeck, D. Eisenstein, N. Ell-man, B. R. Elms, M. L. Evans, X. Fan, G. R. Federwitz, L. Fiscelli, S. Fried-man, J. A. Frieman, M. Fukugita, B. Gillespie, J. E. Gunn, V. K. Gurbani, E. deHaas, M. Haldeman, F. H. Harris, J. Hayes, T. M. Heckman, G. S. Hennessy,R. B. Hindsley, S. Holm, D. J. Holmgren, C.-h. Huang, C. Hull, D. Husby, S.-I.Ichikawa, T. Ichikawa, Z. Ivezic, S. Kent, R. S. J. Kim, E. Kinney, M. Klaene,A. N. Kleinman, S. Kleinman, G. R. Knapp, J. Korienek, R. G. Kron, P. Z. Kun-szt, D. Q. Lamb, B. Lee, R. F. Leger, S. Limmongkol, C. Lindenmeyer, D. C. Long,C. Loomis, J. Loveday, R. Lucinio, R. H. Lupton, B. MacKinnon, E. J. Mannery,P. M. Mantsch, B. Margon, P. McGehee, T. A. McKay, A. Meiksin, A. Merelli,D. G. Monet, J. A. Munn, V. K. Narayanan, T. Nash, E. Neilsen, R. Neswold,H. J. Newberg, R. C. Nichol, T. Nicinski, M. Nonino, N. Okada, S. Okamura, J. P.Ostriker, R. Owen, A. G. Pauls, J. Peoples, R. L. Peterson, D. Petravick, J. R. Pier,A. Pope, R. Pordes, A. Prosapio, R. Rechenmacher, T. R. Quinn, G. T. Richards,M. W. Richmond, C. H. Rivetta, C. M. Rockosi, K. Ruthmansdorfer, D. Sandford,D. J. Schlegel, D. P. Schneider, M. Sekiguchi, G. Sergey, K. Shimasaku, W. A. Sieg-mund, S. Smee, J. A. Smith, S. Snedden, R. Stone, C. Stoughton, M. A. Strauss,C. Stubbs, M. SubbaRao, A. S. Szalay, I. Szapudi, G. P. Szokoly, A. R. Thakar,C. Tremonti, D. L. Tucker, A. Uomoto, D. Vanden Berk, M. S. Vogeley, P. Waddell,S.-i. Wang, M. Watanabe, D. H. Weinberg, B. Yanny, and N. Yasuda. The SloanDigital Sky Survey: Technical Summary. AJ, 120:1579–1587, September 2000. doi:10.1086/301513.
J. D. Younger, P. F. Hopkins, T. J. Cox, and L. Hernquist. The Self-Regulated

153
Growth of Supermassive Black Holes. ApJ, 686:815–828, October 2008. doi:10.1086/591639.
A. R. Zentner. The Excursion Set Theory of Halo Mass Functions, Halo Clustering,and Halo Growth. International Journal of Modern Physics D, 16:763–815, 2007.doi: 10.1142/S0218271807010511.