Embed Size (px)
Citation preview

Numerical modeling of the induced grating autocorrelation for studying optical fibernonlinearities in the picosecond regimeF. A. Oguama, A. Tchouassi, A. M. Johnson, and Hernando Garcia Citation: Applied Physics Letters 86, 091101 (2005); doi: 10.1063/1.1868069 View online: http://dx.doi.org/10.1063/1.1868069 View Table of Contents: http://scitation.aip.org/content/aip/journal/apl/86/9?ver=pdfcov Published by the AIP Publishing Articles you may be interested in Terahertz generation by tilted-front laser pulses in weakly and strongly nonlinear regimes Appl. Phys. Lett. 103, 251103 (2013); 10.1063/1.4851118 Modelling of Induced Gratings in Nonlinear Optics AIP Conf. Proc. 1291, 52 (2010); 10.1063/1.3506127 Integrability of an inhomogeneous nonlinear Schrödinger equation in Bose–Einstein condensates and fiber optics J. Math. Phys. 51, 093503 (2010); 10.1063/1.3462746 Short optical solitons in fibers Chaos 10, 551 (2000); 10.1063/1.1290744 Hydrostatic pressure and thermal loading induced optical effects in double-coated optical fibers J. Appl. Phys. 88, 616 (2000); 10.1063/1.373711
This article is copyrighted as indicated in the article. Reuse of AIP content is subject to the terms at: http://scitation.aip.org/termsconditions. Downloaded to IP:
128.42.202.150 On: Sun, 23 Nov 2014 11:56:31
Numerical modeling of the induced grating autocorrelation for studyingoptical fiber nonlinearities in the picosecond regime
F. A. Oguamaa! and A. Tchouassib!
Department of Physics,Ultrafast Optics and Optoelectronics Laboratory, New Jersey Institute of Technology,University Heights, Newark, New Jersey 07102
A. M. Johnsonc!
Center for Advanced Studies in Photonics Research, University of Maryland, Baltimore County,1000 Hilltop Circle, Baltimore, Maryland 21250
Hernando Garciad!
Department of Physics, Southern Illinois University, Edwardsville, IL 62026
sReceived 16 November 2004; accepted 27 December 2004; published online 23 February 2005d
We report a direct numerical model of the induced grating autocorrelationsIGAd based on thenumerical solution of the nonlinear Schrödinger equation for an intense optical pulse that hasexperienced nonlinear distortionfnotably, self-phase modulationsSPMd and stimulated RamanscatteringsSRSdg after propagating through an optical fiber. Our numerical simulations are in goodagreement with experiments. A significant advantage of the numerical approach over thewell-known analytical models is its capability to predict IGA traces in the presence of pumpdepletion. In the light of this, IGA can now be used to study the combined effects of SPM and SRSin optical fibers in the regime where pump depletion is important, and both the nonlinear refractiveindex and the Raman gain coefficient of the fiber can be extracted. ©2005 American Institute ofPhysics. fDOI: 10.1063/1.1868069g
Optical fibers provide an ideal means for maintaininghigh optical intensity over long distances because of theirlow-loss and small cross section. As a result, the study ofoptical nonlinearities in fibers is an important issue1 for vari-ous applications. Because of their self-phase matched char-acter, self-phase modulationsSPMd and stimulated RamanscatteringsSRSd are the two nonlinear processes most likelyto affect the propagation of a relatively-short intense pulse inan optical fiber. Induced grating autocorrelationsIGAd is auseful tool for studying these processes in the timedomain.2,3 IGA was originally developed for the character-ization of short laser pulses.4–6 IGA involves varying thedelay between two excitation pulses that interfere in a pho-torefractive medium and probing the resulting grating—thephase of the excitation pulses has been modulated by thefiber nonlinearity. The IGA trace is a plot of the diffractedenergy versus the delay between the two excitation beams.
Thus far, analytical approaches have been used to modelthe IGA.2–5 An earlier IGA model utilized the analytic ex-pression for the electric field of an optical pulse that is pri-marily an exact solution of the nonlinear wave equation for aself-phase modulated Gaussian pulse.2,4,5 We have utilizedthis approach to determine the nonlinear refractive index ofshort lengths of optical fiber.2 While this model generallyyielded excellent agreement between theory and experimentin the limit of pure SPM, it failed to account for additionalnonlinear effects such as SRS, observed in certain IGAexperiments.7 A new analytical model of IGA was recentlydeveloped3 to account for the combined effect of SPM and
SRS, in the nondispersive regime using theundepleted pumpapproximation.3,8 Using this method, it was possible to de-termine both the nonlinear refractive index and the Ramangain coefficient from a fit of the experimental data to thetheoretically generated IGA traces. However, this modelbreaks down, as one should expect, when pump depletionbecomes important. Thus the model could not be used toexplain the features of IGA traces that were recorded7 whenthe SRS generated Stokes is sufficiently high that the as-sumption of undepleted pump can no longer hold.
The major problem with the analytical models of IGA isthat in order to derive the required functional form for thedetected IGA signal, one must have a readily available ana-lytic solution of the appropriate nonlinear Schrödinger equa-tion sNLSEd for the electric field of the optical pulse that hasencountered the necessary nonlinear distortions. While thisproblem is readily solved in the nondispersive regime for thecases of the pure SPM4,9 and SPM plus SRS with negligiblepump depletion,3,8,10 finding an analytic solution of thecoupled NLSE in the presence of pump depletion and/orGVD sgroup velocity dispersiond is a difficult exercise, andnumerical procedures are usually a suitable alternative.10
Thus, there is an obvious need for the numerical model ofthe IGA, and we have failed to find any report of such astudy in the literature. Numerical methods have been appliedin other processes to study nonlinear effects in fibers and areknown to yield good results.11–13For example Weineret al.11
have used the numerical approach to study the influence ofSRS on optical pulse compression, while Gentyet al.12 haveused it to investigate spectral modulation due to pulse re-shaping in photonic crystal fibers.
In this letter we present a numerical model of the IGAand simulate the appropriate IGA traces for optical pulsesthat have undergone SPM; SPM plus SRS with negligiblepump depletion, as well as for cases where pump depletion is
adPresent address: Dept. of Physics, New Jersey City University, Jersey City,NJ 07305; electronic mail: [email protected]
bdPresent address: 400 East 33rd Street, #1800, Chicago, IL 60616; elec-tronic mail: [email protected]
cdElectronic mail: [email protected] mail [email protected]
APPLIED PHYSICS LETTERS86, 091101s2005d
0003-6951/2005/86~9!/091101/3/$22.50 © 2005 American Institute of Physics86, 091101-1 This article is copyrighted as indicated in the article. Reuse of AIP content is subject to the terms at: http://scitation.aip.org/termsconditions. Downloaded to IP:
128.42.202.150 On: Sun, 23 Nov 2014 11:56:31
considered. We have compared our numerical results withexperiments and good agreement was found.
The propagation of relatively short pulses in an opticalfiber can be described by the NLSE:10
]A
]z+
i
2b2
]2A
]T2 = guAu2A, s1d
where we have neglected the fiber loss because of the rela-tively short fiber lengths used in IGA experiments. In Eq.s1d,T= t−b1z= t−z/vg is the time measured in a frame of refer-ence moving with the pulse at group velocityvg andb1 is thegroup velocity parameter. Here,A is the slowly varying am-plitude of the pulse envelope;b2 is the GVD parameter, andg=n2v /cAeff is the nonlinear parameter, wheren2 is the non-linear refractive index andAeff is the effective core area ofthe fiber.
In the presence of SRS, Eq.s1d is replaced with thecoupled amplitude NLSE that accounts for the propagationof the pump and Stokes pulses along the fiber3,10 and can bewritten as
]Ap
]z+
i
2b2p
]2Ap
]T2 = igpfuApu2 + s2 − fRduAsu2gAp
−gp
2uAsu2Ap, s2ad
]As
]z+
i
2b2s
]2As
]T2 − d]As
]T= igsfuAsu2 + s2 − fRduApu2gAs
+gs
2uApu2As, s2bd
where the subscripts “p” and “s” stand for the pump andStokes, respectively. In Eq.s2d gs is the Raman gain strengthssometimes referred to as the Raman gain efficiency,gs<gR/Aeff; wheregR is the Raman gain coefficientd andgP isthe pump depletion strength. The parameterfR represents thefractional contribution of the delayed Raman response to thenonlinear polarization10,14—typically, fR is about 0.18. Thewalk-off parameterd is introduced to account for the groupvelocity mismatch between the pump and the Raman pulsessd=1/vgp−1/vgsd. These equations are valid for picosecondpulses with pulse widths between 1 and 100 ps. Thus tran-sient effects are negligible, since the pulse widths are largecompared to the Raman response times,50 fsd. In thisrange, the pump spectrum is narrow compared with the Ra-man gain spectrum and it is appropriate to neglect higherorder nonlinear effects such as intrapulse Raman scatteringand self-frequency shift. Both effects are important only forultrashort pulses with a pulsewidth less than 1 ps. The re-striction of the upper limit of the pulsewidth to 100 ps en-sures that the walk-off lengthsLw=tp/d, tp being the pulsedurationd does not exceed the experimental fiber lengthszd.
For the numerical procedure, it is helpful to rewrite Eq.s2d in terms of normalized variables:
]Up
]z8+
i
2
LW
LD
]2Up
]t2 =iLW
LNLfuUpu2 + s2 − fRduUsu2gUp
−LW
2LGuUsu2Up, s3ad
]Us
]z8+
irL W
2LD
]2Us
]t2 −]Us
]t=
irL W
LNLfuUsu2 + s2 − fRduUpu2gUs
+rLW
2LGuUpu2Us, s3bd
where
Ujs j = p,sd =Aj
ÎPm
, z8 =z
LW, t =
T
tp, r =
lp
ls. s4d
In the above presented equations,z is the fiber length,Pm isthe maximum pulse powerffor a Gaussian pulse,Pm< Ppeak32Îsln 2/pd, where Ppeak=sPavg3 tRd /tp and tR isthe laser pulse periodg while lp and ls are the pump andStokes wavelengths, respectively. The length scalesLNL, LG,LD, andLW are called the nonlinear length, the Raman-gainlength, the dispersion length, and the walk-off length, respec-tively, and are given by
LNL = sgpPmd−1, LG = sgpPmd−1, LD =tp
2
ub2pu, s5d
LW =tp
udu.
These length scales provide the range of fiber length overwhich the various effects become important—the shortestlength among them plays the dominant role. From the choiceof fiber length and peak power, one can determine which ofthe parameters play a significant role in Eq.s3d. In the non-linearity dominant regime,LD /LNL @1. This is the regime ofinterest in IGA measurements. Typically the fiber lengths arein the range of 20–100 m, which are generally much smallerthan the dispersion lengthfLD,10 km for a 50 ps pulse at1064 nm for standard telecommunication fibersg.
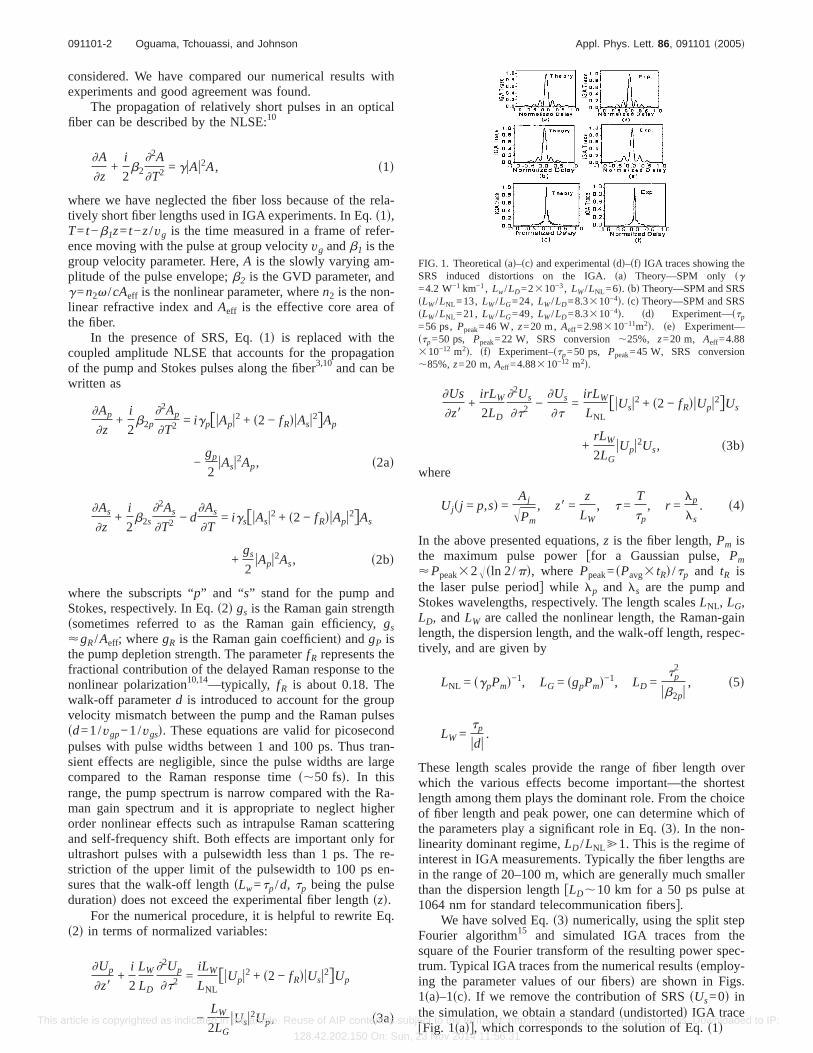
We have solved Eq.s3d numerically, using the split stepFourier algorithm15 and simulated IGA traces from thesquare of the Fourier transform of the resulting power spec-trum. Typical IGA traces from the numerical resultssemploy-ing the parameter values of our fibersd are shown in Figs.1sad–1scd. If we remove the contribution of SRSsUs=0d inthe simulation, we obtain a standardsundistortedd IGA tracefFig. 1sadg, which corresponds to the solution of Eq.s1d
FIG. 1. Theoreticalsad–scd and experimentalsdd–sfd IGA traces showing theSRS induced distortions on the IGA.sad Theory—SPM only sg=4.2 W−1 km−1, Lw/LD=2310−3, LW/LNL =6d. sbd Theory—SPM and SRSsLW/LNL =13, LW/LG=24, LW/LD=8.3310−4d. scd Theory—SPM and SRSsLW/LNL =21, LW/LG=49, LW/LD=8.3310−4d. sdd Experiment—stp
=56 ps,Ppeak=46 W, z=20 m, Aeff=2.98310−11m2d. sed Experiment—stp=50 ps, Ppeak=22 W, SRS conversion,25%, z=20 m, Aeff=4.88310−12 m2d. sfd Experiment–stp=50 ps, Ppeak=45 W, SRS conversion,85%,z=20 m,Aeff=4.88310−12 m2d.
091101-2 Oguama, Tchouassi, and Johnson Appl. Phys. Lett. 86, 091101 ~2005!
This article is copyrighted as indicated in the article. Reuse of AIP content is subject to the terms at: http://scitation.aip.org/termsconditions. Downloaded to IP:
128.42.202.150 On: Sun, 23 Nov 2014 11:56:31
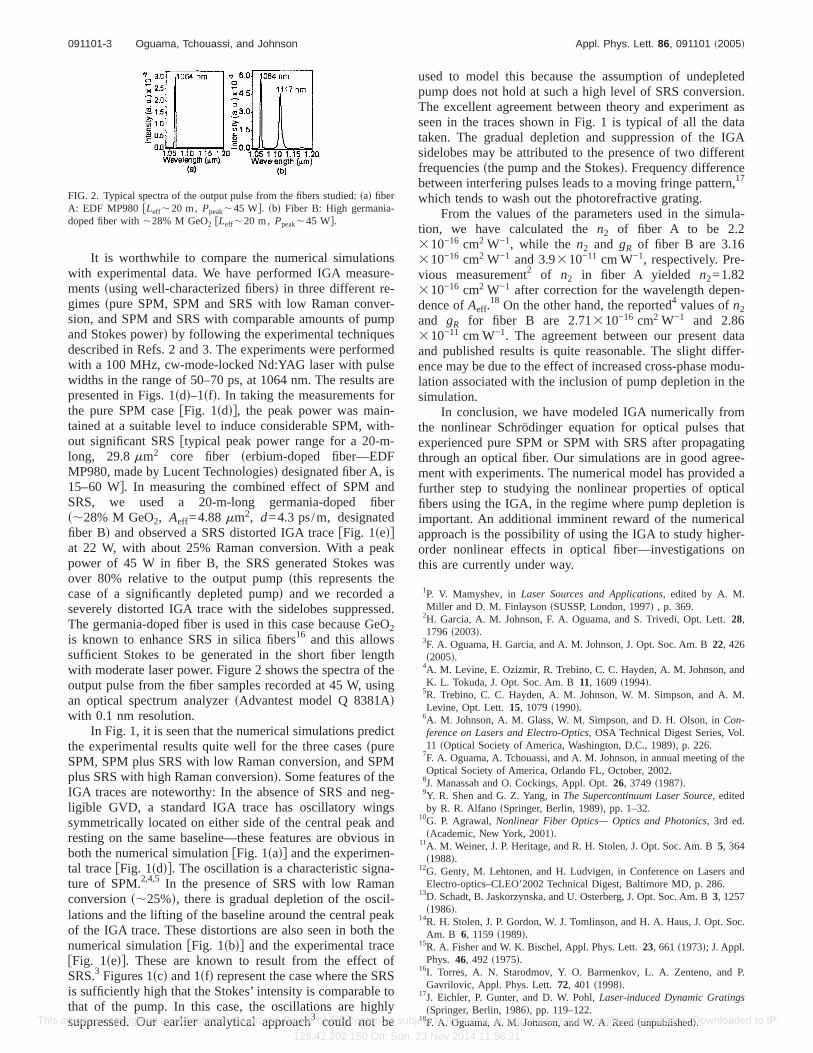
It is worthwhile to compare the numerical simulationswith experimental data. We have performed IGA measure-mentssusing well-characterized fibersd in three different re-gimes spure SPM, SPM and SRS with low Raman conver-sion, and SPM and SRS with comparable amounts of pumpand Stokes powerd by following the experimental techniquesdescribed in Refs. 2 and 3. The experiments were performedwith a 100 MHz, cw-mode-locked Nd:YAG laser with pulsewidths in the range of 50–70 ps, at 1064 nm. The results arepresented in Figs. 1sdd–1sfd. In taking the measurements forthe pure SPM casefFig. 1sddg, the peak power was main-tained at a suitable level to induce considerable SPM, with-out significant SRSftypical peak power range for a 20-m-long, 29.8mm2 core fiber serbium-doped fiber—EDFMP980, made by Lucent Technologiesd designated fiber A, is15–60 Wg. In measuring the combined effect of SPM andSRS, we used a 20-m-long germania-doped fibers,28% M GeO2, Aeff=4.88mm2, d=4.3 ps/m, designatedfiber Bd and observed a SRS distorted IGA tracefFig. 1sedgat 22 W, with about 25% Raman conversion. With a peakpower of 45 W in fiber B, the SRS generated Stokes wasover 80% relative to the output pumpsthis represents thecase of a significantly depleted pumpd and we recorded aseverely distorted IGA trace with the sidelobes suppressed.The germania-doped fiber is used in this case because GeO2is known to enhance SRS in silica fibers16 and this allowssufficient Stokes to be generated in the short fiber lengthwith moderate laser power. Figure 2 shows the spectra of theoutput pulse from the fiber samples recorded at 45 W, usingan optical spectrum analyzersAdvantest model Q 8381Adwith 0.1 nm resolution.
In Fig. 1, it is seen that the numerical simulations predictthe experimental results quite well for the three casesspureSPM, SPM plus SRS with low Raman conversion, and SPMplus SRS with high Raman conversiond. Some features of theIGA traces are noteworthy: In the absence of SRS and neg-ligible GVD, a standard IGA trace has oscillatory wingssymmetrically located on either side of the central peak andresting on the same baseline—these features are obvious inboth the numerical simulationfFig. 1sadg and the experimen-tal tracefFig. 1sddg. The oscillation is a characteristic signa-ture of SPM.2,4,5 In the presence of SRS with low Ramanconversions,25%d, there is gradual depletion of the oscil-lations and the lifting of the baseline around the central peakof the IGA trace. These distortions are also seen in both thenumerical simulationfFig. 1sbdg and the experimental tracefFig. 1sedg. These are known to result from the effect ofSRS.3 Figures 1scd and 1sfd represent the case where the SRSis sufficiently high that the Stokes’ intensity is comparable tothat of the pump. In this case, the oscillations are highlysuppressed. Our earlier analytical approach3 could not be
used to model this because the assumption of undepletedpump does not hold at such a high level of SRS conversion.The excellent agreement between theory and experiment asseen in the traces shown in Fig. 1 is typical of all the datataken. The gradual depletion and suppression of the IGAsidelobes may be attributed to the presence of two differentfrequenciessthe pump and the Stokesd. Frequency differencebetween interfering pulses leads to a moving fringe pattern,17
which tends to wash out the photorefractive grating.From the values of the parameters used in the simula-
tion, we have calculated then2 of fiber A to be 2.2310−16 cm2 W−1, while the n2 and gR of fiber B are 3.16310−16 cm2 W−1 and 3.9310−11 cm W−1, respectively. Pre-vious measurement2 of n2 in fiber A yielded n2=1.82310−16 cm2 W−1 after correction for the wavelength depen-dence ofAeff.
18 On the other hand, the reported4 values ofn2and gR for fiber B are 2.71310−16 cm2 W−1 and 2.86310−11 cm W−1. The agreement between our present dataand published results is quite reasonable. The slight differ-ence may be due to the effect of increased cross-phase modu-lation associated with the inclusion of pump depletion in thesimulation.
In conclusion, we have modeled IGA numerically fromthe nonlinear Schrödinger equation for optical pulses thatexperienced pure SPM or SPM with SRS after propagatingthrough an optical fiber. Our simulations are in good agree-ment with experiments. The numerical model has provided afurther step to studying the nonlinear properties of opticalfibers using the IGA, in the regime where pump depletion isimportant. An additional imminent reward of the numericalapproach is the possibility of using the IGA to study higher-order nonlinear effects in optical fiber—investigations onthis are currently under way.
1P. V. Mamyshev, inLaser Sources and Applications, edited by A. M.Miller and D. M. FinlaysonsSUSSP, London, 1997d , p. 369.
2H. Garcia, A. M. Johnson, F. A. Oguama, and S. Trivedi, Opt. Lett.28,1796 s2003d.
3F. A. Oguama, H. Garcia, and A. M. Johnson, J. Opt. Soc. Am. B22, 426s2005d.
4A. M. Levine, E. Ozizmir, R. Trebino, C. C. Hayden, A. M. Johnson, andK. L. Tokuda, J. Opt. Soc. Am. B11, 1609s1994d.
5R. Trebino, C. C. Hayden, A. M. Johnson, W. M. Simpson, and A. M.Levine, Opt. Lett.15, 1079s1990d.
6A. M. Johnson, A. M. Glass, W. M. Simpson, and D. H. Olson, inCon-ference on Lasers and Electro-Optics, OSA Technical Digest Series, Vol.11 sOptical Society of America, Washington, D.C., 1989d, p. 226.
7F. A. Oguama, A. Tchouassi, and A. M. Johnson, in annual meeting of theOptical Society of America, Orlando FL, October, 2002.
8J. Manassah and O. Cockings, Appl. Opt.26, 3749s1987d.9Y. R. Shen and G. Z. Yang, inThe Supercontinuum Laser Source, editedby R. R. AlfanosSpringer, Berlin, 1989d, pp. 1–32.
10G. P. Agrawal,Nonlinear Fiber Optics— Optics and Photonics, 3rd ed.sAcademic, New York, 2001d.
11A. M. Weiner, J. P. Heritage, and R. H. Stolen, J. Opt. Soc. Am. B5, 364s1988d.
12G. Genty, M. Lehtonen, and H. Ludvigen, in Conference on Lasers andElectro-optics–CLEO’2002 Technical Digest, Baltimore MD, p. 286.
13D. Schadt, B. Jaskorzynska, and U. Osterberg, J. Opt. Soc. Am. B3, 1257s1986d.
14R. H. Stolen, J. P. Gordon, W. J. Tomlinson, and H. A. Haus, J. Opt. Soc.Am. B 6, 1159s1989d.
15R. A. Fisher and W. K. Bischel, Appl. Phys. Lett.23, 661s1973d; J. Appl.Phys. 46, 492 s1975d.
16I. Torres, A. N. Starodmov, Y. O. Barmenkov, L. A. Zenteno, and P.Gavrilovic, Appl. Phys. Lett.72, 401 s1998d.
17J. Eichler, P. Gunter, and D. W. Pohl,Laser-induced Dynamic GratingssSpringer, Berlin, 1986d, pp. 119–122.
18F. A. Oguama, A. M. Johnson, and W. A. Reedsunpublishedd.
FIG. 2. Typical spectra of the output pulse from the fibers studied:sad fiberA: EDF MP980 fLeff,20 m, Ppeak,45 Wg. sbd Fiber B: High germania-doped fiber with,28% M GeO2 fLeff,20 m, Ppeak,45 Wg.
091101-3 Oguama, Tchouassi, and Johnson Appl. Phys. Lett. 86, 091101 ~2005!
This article is copyrighted as indicated in the article. Reuse of AIP content is subject to the terms at: http://scitation.aip.org/termsconditions. Downloaded to IP:
128.42.202.150 On: Sun, 23 Nov 2014 11:56:31


![[3.4]_Fiber Nonlinearities](https://img.pdfslide.us/doc/110x75/55cf8e81550346703b92da6f/34fiber-nonlinearities.jpg)

