Embed Size (px)
Citation preview
lable at ScienceDirect
Renewable Energy 89 (2016) 636e648
Contents lists avai
Renewable Energy
journal homepage: www.elsevier .com/locate/renene
Numerical modeling of the effects of wave energy convertercharacteristics on nearshore wave conditions
G. Chang a, *, K. Ruehl b, C.A. Jones a, J. Roberts b, C. Chartrand b
a Integral Consulting Inc., 200 Washington Street, Suite 101, Santa Cruz, CA 95060, USAb Sandia National Laboratories, P.O. Box 5800, Albuquerque, NM 87185, USA
a r t i c l e i n f o
Article history:Received 23 February 2015Received in revised form19 November 2015Accepted 17 December 2015Available online xxx
Keywords:Wave energy converter (WEC)Wave modelingModel sensitivitySimulating WAves Nearshore (SWAN)Nearshore wave propagation
* Corresponding author.E-mail addresses: [email protected] (G.
(K. Ruehl), [email protected] (C.A. Jones), [email protected] (C. Chartrand).
http://dx.doi.org/10.1016/j.renene.2015.12.0480960-1481/© 2015 Elsevier Ltd. All rights reserved.
a b s t r a c t
Modeled nearshore wave propagation was investigated downstream of simulated wave energy con-verters (WECs) to evaluate overall near- and far-field effects of WEC arrays. Model sensitivity to WECcharacteristics and WEC array deployment scenarios was evaluated using a modified version of an in-dustry standard wave model, Simulating WAves Nearshore (SWAN), which allows the incorporation ofdevice-specific WEC characteristics to specify obstacle transmission. The sensitivity study illustrated thatWEC device type and subsequently its size directly resulted in wave height variations in the lee of theWEC array. Wave heights decreased up to 30% between modeled scenarios with and without WECs forlarge arrays (100 devices) of relatively sizable devices (26 m in diameter) with peak power generationnear to the modeled incident wave height. Other WEC types resulted in less than 15% differences inmodeled wave height with and without WECs, with lesser influence for WECs less than 10 m in diameter.Wave directions and periods were largely insensitive to changes in parameters. However, additionalmodel parameterization and analysis are required to fully explore the model sensitivity of peak waveperiod and mean wave direction to the varying of the parameters.
© 2015 Elsevier Ltd. All rights reserved.
1. Introduction
In order to effectively convert wave energy into commercial-scale onshore electrical power, arrays of multiple wave energyconverter (WEC) devices are necessary. The deployment of WECarrays will likely begin small (pilot-scale or ~10 devices) but couldfeasibly number in the hundreds of individual devices atcommercial-scale. As the industry progresses from pilot- tocommercial-scale, an understanding of the effects of WEC arraysleeward of the deployment site and on the nearshore environmentwill become increasingly important. WEC arrays have the potentialto alter nearshore wave propagation and circulation patterns andpossibly modify sediment transport patterns (e.g., [12]), whichcould have detrimental effects on ecological processes and localsocioeconomic services. To help accelerate the realization ofcommercial-scale wave power, it is necessary to evaluate the po-tential environmental effects of WEC arrays and inform
Chang), [email protected]@sandia.gov (J. Roberts),
environmental assessments associated with the regulatory process(e.g., [8,15,28]).
At present, due to the lack of deployed WEC farms, directmeasurements of the effects of WEC arrays on nearshore wavepropagation are not available. Wave model simulations however,can provide the groundwork for completing such environmentalassessments by investigating the sensitivity of predictive modelresults to differing WEC characteristics over anticipated waveconditions. The understanding developed here will allow in-vestigators to conduct predictive environmental assessments withincreased confidence and reduced uncertainty in future phases ofWEC development.
1.1. Background
Baseline versions of spectral wave models, such as TOMAWAC[29] and SWAN (Simulating WAves Nearshore) [4,20] do not havethe inherent capabilities needed for modeling far-field effects ofarrays of WECs. These codes effectively model a WEC as an obstaclewith a constant, user-specified transmission coefficient [9,11]applied across the entire frequency spectrum. Transmission co-efficients determine the amount of wave energy that is absorbed

Table 1Power matrix computed for a floating two-body heaving converter (select waveperiods and heights shown) [2].
Tp (s)
3 5 7 9 11 13 15 17
Hs (m) 1 2.38 11.41 24.59 43.58 53.08 34.42 19.86 11.782 0 45.28 100.01 153.17 150.81 126.08 60.69 48.033 0 96.17 204.65 357.25 352.72 248.15 136.67 112.524 0 0 366.25 550.98 530.82 419.89 268.44 193.755 0 0 514.29 824.37 617.58 512.41 384.04 257.616 0 0 710.80 973.55 838.26 648.39 501.78 388.417 0 0 781.16 1000 1000 959.05 573.85 449.84
G. Chang et al. / Renewable Energy 89 (2016) 636e648 637
and subsequently allowed to transmit past the obstacles, or WECs.In a study presented by Millar et al. [16], potential WEC farm
effects on shoreline change were modeled at the Wave Hub siteusing the native SWAN model and transmission coefficients set at0%, 40%, 70%, and 90% (corresponding to 100%, 60%, 30%, and 10%wave energy absorption). Millar et al. [16] concluded that waveheights inshore of WECs decrease linearly with increasing waveenergy transmission. Bento et al. [3] also simulated WECs as SWANobstacles with the same transmission coefficients at three differentincoming wave directions along the Portuguese coast during twodifferent seasons. They similarly found decreases in significantwave and swell height with increased energy absorption immedi-ately in the lee of the simulated WEC farm.
Several other studies by Rusu and Guedes Soares (e.g., [24e26])evaluated WEC and WEC farm effects on the Portuguese coast andneighboring archipelagos. Iglesias and Carballo [14] determinedimpact indicators to describe the influence of WEC farm distance toshore on nearshore wave characteristics using constant trans-mission coefficients determined from laboratory studies. Wavefarm configuration sensitivity analysis was performed for thePelamis WEC by Palha et al. [17]. Chang et al. [6] evaluated thesensitivity of the native SWAN model to a variety of model pa-rameters with and without a WEC array (transmission coefficient,frequency spreading, directional spreading, and WEC devicespacing within the array) and concluded that changes in significantwave height in the lee of a simulated WEC array are most sensitiveto wave energy transmission.
While these studies provided insight onwave propagation in thepresence of an array of obstacles, they did not take into accountWEC device-specific characteristics in the specification of theSWAN model's obstacle transmission coefficients. For example, alater review of the study by Millar et al. [16] determined that theapplication of constant obstacle transmission coefficients to modelWECs was not well understood and there was not sufficient guid-ance on how to appropriately account for WEC power performance[1]. This directly motivated the work accomplished by Smith et al.[27]; who modified the SWAN code to account for the frequency-and directionally-dependent power absorption of WECs. WithSmith's modifications to SWAN, WEC power performance can bemodeled by user-defined frequency- and directionally-dependedpower transfer functions. Using this model, the effects of deploy-ing wave farms at the Wave Hub site were re-assessed [27].
The development of the SNL-SWAN (Sandia National Labora-tories e SWAN) code builds upon the work performed by Smithet al. [27] by further modifying the native SWAN code to allow fordirect importation of WEC power performance data in the form ofrelative capture width (RCW) curves, or power matrices. RCWcurves and power matrices are the current industry standardpractice for defining WEC power production (e.g., [13]) (RCWcurves are analogous to turbine power curves in thewind industry).The incorporation of RCW curves or power matrices removes anyuncertainties related to arbitrarily chosen transmission coefficientvalues. Rather, the transmission coefficients (or WEC power ab-sorption) are calculated directly by SNL-SWAN based on user-defined WEC power performance data. This approach has beenverified by comparison to other codes and has undergone pre-liminary validation by comparison to experimental wave tank data[18,23].
1.2. Objectives
The present study incorporates SNL-SWAN, a modified versionof an industry standard wave modeling tool, SWAN to simulatewave propagation through a hypothetical WEC array deploymentsite on the California coast. The primary objective of the SNL-SWAN
sensitivity study is to investigate the potential effects of a range ofWEC devices on leeward and nearshore wave propagation. Toaccomplish this goal, the following tasks are undertaken:
� Evaluate the modified wave propagation model, SNL-SWAN,which allows the incorporation of device-specific WECcharacteristics.
� Perform model sensitivity analysis using SNL-SWAN to examinethe effects of WEC characteristics (WEC device type and size,number of WECs, and WEC device spacing within the WECarray) on near-field and far-field wave conditions in the lee ofthe WEC devices.
2. Methods
2.1. SNL-SWAN
SNL-SWAN was developed to more accurately evaluate WECfarm effects on wave propagation by incorporating a WEC modulethat accounts for device-specific WEC power performance. Basedon the user specified power performance, SNL-SWAN calculatestransmission coefficients that are associated with a WEC's powerperformance. Several methods of determining the transmissioncoefficient are employed in Version 1.0 of SNL-SWAN. The fivemethods are employed through switches (specified in the SNL-SWAN input file) in the SNL-SWAN WEC module, where:
Switch 0) SNL-SWAN uses the standard SWAN obstacle treat-ment [10]. The transmission coefficient value, Kt, is a constant valueentered into the SWAN input file and applied across all wave fre-quencies. The transmission coefficient represents the ratio of waveheights incident to and in the lee of the obstacle (or WEC) (Eq. (1)).
Kt ¼ HleeHincident
(1)
Switch 1) SNL-SWAN computes the transmission coefficientfrom a user-suppliedWEC powermatrix (Table 1 shows an examplepowermatrix for a particularWEC). A power ratio is then calculatedat the peak wave period based on the absorbed wave power fromthe WEC power matrix (supplied by the user) and the incidentwave power (determined from SNL-SWAN). The transmission co-efficient used by SNL-SWAN is calculated based on this power ratioat the peak wave period, as shown in Eq. (2), and is applied as aconstant value across all wave frequencies.
K2t ¼ PLee
PIncident¼ PIncident � PAbsorbed
PIncident¼ 1� PAbsorbed
PIncident(2)
Switch 2) SNL-SWAN computes the transmission coefficientfrom a user-supplied WEC RCW curve. The transmission coefficientused by SNL-SWAN is calculated based on the RCW value from thecurve given the peak incident wave period, as shown in Eq. (3), and
G. Chang et al. / Renewable Energy 89 (2016) 636e648638
is applied as a constant value across all wave frequencies.
K2t ¼ 1� PAbsorbed
PIncident¼ 1� RCW (3)
Switch 3) SNL-SWAN switch 3 is an extension of switch 1, wheredistinct transmission coefficients are applied to each binned wavefrequency based on the WEC power matrix. This results in varyingpower absorption for different wave frequencies as K2
t is a functionof wave frequency.
Switch 4) SNL-SWAN switch 4 is an extension of switch 2, wherethe RCW curve is sampled independently for each binned wavefrequency, resulting in a frequency dependent obstacle trans-mission coefficient. Please refer to the SNL-SWAN user's manual formore information on the SNL-SWAN WEC module [21].
In this paper, all five switches were implemented for a hypo-thetical WEC array in Monterey Bay, CA. Although it is not an idealWEC farm location with respect to its wave climatology, the sitewas chosen based on available wave model validation data as wellas previous wave model assessments conducted in the region. Thesensitivity analysis was performed for the power matrices of a va-riety of existing WEC devices based on the numerical bench-marking paper by Babarit et al. [2].
2.2. Wave model validation: Monterey Bay, CA
SNL-SWAN wave propagation calculations defer to the nativeSWAN code for cases without obstacles. Therefore, initial site-specific wave model validation was accomplished using thenative SWAN model. Deep-water waves were propagated fromoffshore to shallow water for a study site in Monterey Bay andcoastal Santa Cruz, CA. Several local National Oceanic and Atmo-spheric Administration National Data Buoy Center (NOAA NDBC)buoys provided measurements of wave heights, wave periods,wave directions, wind speeds, and wind directions at Monterey Baybuoy locations dating as far back as 1987. Data from NDBC buoy46042 (36�4702900N, 122�270600W; 2098 m water depth) were usedto derive Monterey Bay domain boundary conditions. Data fromNDBC buoy 46236 (36�4503900N, 121�5604800W; 145 mwater depth)were used to validate the Monterey Bay SWAN model predictionsfor significant wave height (Hs), peak wave period (Tp), and meanwave direction (MWD). Additionally, a Datawell DWR-G4 wavebuoy was deployed in 5e6 m water depth near the Santa CruzHarbor, Santa Cruz, CA (36�5703500N, 121�5905600W) for nearshorewave model validation. The model performance statisticscomputed for the Monterey Bay and Santa Cruz, CA SWAN modelstudies showed good agreement between modeled to measureddata (Table 2). The wavemodel and validation are further discussedin Chang et al. (2010, unpublished).
All SWAN and SNL-SWAN model validation, as well as verifica-tion, evaluation, and sensitivity analysis runs (see Sections 2.3 and2.4) employed nautical coordinates in a spherical grid. Thecomputational grids were uniform and rectangular. Monterey Bayhigh resolution digital bathymetric data were obtained from the
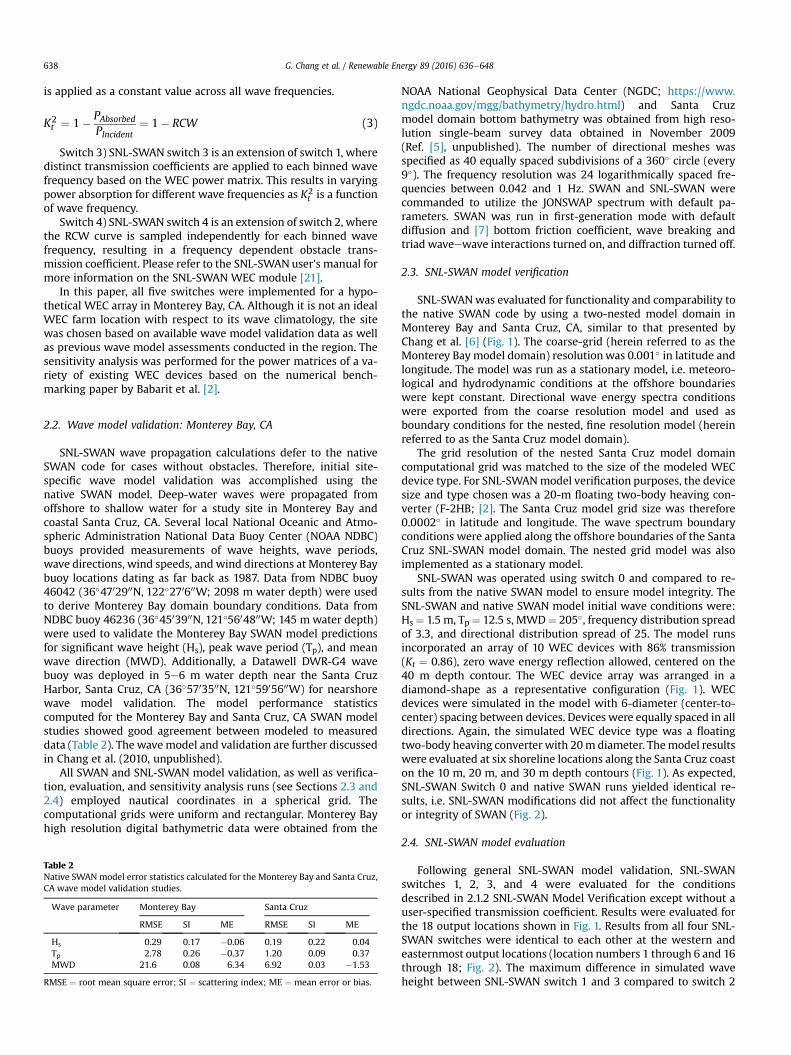
Table 2Native SWAN model error statistics calculated for the Monterey Bay and Santa Cruz,CA wave model validation studies.
Wave parameter Monterey Bay Santa Cruz
RMSE SI ME RMSE SI ME
Hs 0.29 0.17 �0.06 0.19 0.22 0.04Tp 2.78 0.26 �0.37 1.20 0.09 0.37MWD 21.6 0.08 6.34 6.92 0.03 �1.53
RMSE ¼ root mean square error; SI ¼ scattering index; ME ¼ mean error or bias.
NOAA National Geophysical Data Center (NGDC; https://www.ngdc.noaa.gov/mgg/bathymetry/hydro.html) and Santa Cruzmodel domain bottom bathymetry was obtained from high reso-lution single-beam survey data obtained in November 2009(Ref. [5], unpublished). The number of directional meshes wasspecified as 40 equally spaced subdivisions of a 360� circle (every9�). The frequency resolution was 24 logarithmically spaced fre-quencies between 0.042 and 1 Hz. SWAN and SNL-SWAN werecommanded to utilize the JONSWAP spectrum with default pa-rameters. SWAN was run in first-generation mode with defaultdiffusion and [7] bottom friction coefficient, wave breaking andtriad waveewave interactions turned on, and diffraction turned off.
2.3. SNL-SWAN model verification
SNL-SWANwas evaluated for functionality and comparability tothe native SWAN code by using a two-nested model domain inMonterey Bay and Santa Cruz, CA, similar to that presented byChang et al. [6] (Fig. 1). The coarse-grid (herein referred to as theMonterey Bay model domain) resolutionwas 0.001� in latitude andlongitude. The model was run as a stationary model, i.e. meteoro-logical and hydrodynamic conditions at the offshore boundarieswere kept constant. Directional wave energy spectra conditionswere exported from the coarse resolution model and used asboundary conditions for the nested, fine resolution model (hereinreferred to as the Santa Cruz model domain).
The grid resolution of the nested Santa Cruz model domaincomputational grid was matched to the size of the modeled WECdevice type. For SNL-SWANmodel verification purposes, the devicesize and type chosen was a 20-m floating two-body heaving con-verter (F-2HB; [2]. The Santa Cruz model grid size was therefore0.0002� in latitude and longitude. The wave spectrum boundaryconditions were applied along the offshore boundaries of the SantaCruz SNL-SWAN model domain. The nested grid model was alsoimplemented as a stationary model.
SNL-SWAN was operated using switch 0 and compared to re-sults from the native SWAN model to ensure model integrity. TheSNL-SWAN and native SWAN model initial wave conditions were:Hs ¼ 1.5 m, Tp ¼ 12.5 s, MWD¼ 205�, frequency distribution spreadof 3.3, and directional distribution spread of 25. The model runsincorporated an array of 10 WEC devices with 86% transmission(Kt ¼ 0.86), zero wave energy reflection allowed, centered on the40 m depth contour. The WEC device array was arranged in adiamond-shape as a representative configuration (Fig. 1). WECdevices were simulated in the model with 6-diameter (center-to-center) spacing between devices. Devices were equally spaced in alldirections. Again, the simulated WEC device type was a floatingtwo-body heaving converter with 20m diameter. Themodel resultswere evaluated at six shoreline locations along the Santa Cruz coaston the 10 m, 20 m, and 30 m depth contours (Fig. 1). As expected,SNL-SWAN Switch 0 and native SWAN runs yielded identical re-sults, i.e. SNL-SWAN modifications did not affect the functionalityor integrity of SWAN (Fig. 2).
2.4. SNL-SWAN model evaluation
Following general SNL-SWAN model validation, SNL-SWANswitches 1, 2, 3, and 4 were evaluated for the conditionsdescribed in 2.1.2 SNL-SWAN Model Verification except without auser-specified transmission coefficient. Results were evaluated forthe 18 output locations shown in Fig. 1. Results from all four SNL-SWAN switches were identical to each other at the western andeasternmost output locations (location numbers 1 through 6 and 16through 18; Fig. 2). The maximum difference in simulated waveheight between SNL-SWAN switch 1 and 3 compared to switch 2

Fig. 1. The Monterey Bay domain, WEC domain (bounded by solid lines), and Santa Cruz (bounded on three sides e north, west, and east e by dashed lines) SNL-SWAN modeldomains for devices between 6 m and 15 m in diameter. The inset shows a close-up view of the WEC and Santa Cruz domain (boundary between the two marked by the solid line)with 18 output locations and simulated WEC array illustrated.
G. Chang et al. / Renewable Energy 89 (2016) 636e648 639
and 4 was 0.4 cm at the location number 7, which is directly in thelee of theWEC array with an incomingMWD of 205�. Differences inmodeled wave height were 0.2 cm or less at output locationnumbers 8 through 12; switches 1 and 3 simulated wave heightswere consistently 0.1e0.2 cm higher than those modeled usingSNL-SWAN switches 2 and 4. These differences are likely due to thedata interpolation necessary for computing the RCW curve used inswitches 2 and 4.
Results from employing a frequency dependent WEC trans-mission coefficient are minimal for this particular simulation.Switch 2 and switch 4 results are identical. Only a 0.1 cm differencein wave height is observed at output location number 11 whencomparing results from switch 1 and switch 3, with slightly lesspower absorbed (i.e. higher wave height) when using a frequencydependent transmission coefficient. Although no field validation isavailable formodel runs with simulatedWECs, SNL-SWAN switches3 and 4 are assumed to provide the most accurate mechanisticdepiction of wave and WEC interaction(s) (e.g., [27]).
3. SNL-SWAN sensitivity analysis
Model sensitivity analysis was performed using SNL-SWAN inorder to understand model behavior in the vicinity of a variety ofdifferent WEC devices and sizes, WEC spacing within an array, andnumber of WECs in an array. Potential alterations to the nearshorewave climate in proximity to the Santa Cruz, CA shoreline due toWECs were explored by simulating eight different WEC devicetypes with seven different diameters (Table 3) arranged indiamond-shaped arrays of 10, 50, or 100 WEC devices that wereequally spaced 4, 6, or 8 diameters apart, center-to-center. BecauseSNL-SWAN is an energy propagation model and the sensitivityanalysis was performed to investigate the extraction of energy fromincident wave spectra independent of depth, all WECs weresimulated as obstacles extending throughout the water column. Allmodel runs were conducted with the WEC array centered on the
40m depth contour, as shown in Fig.1. The powermatrix for each ofthe eight devices was computed following Babarit et al. [2] (Fig. 3).See Appendix A for a table of notations.
A total of 288 SNL-SWAN model runs were conducted (72 foreach of SNL-SWAN switch 1, 2, 3, and 4). Results were compared toseven model runs conducted with no obstacles. The seven runswith no WECs represented each of the seven different device sizes.The initial wave conditions were determined from statisticalanalysis of NDBC buoy 46042 (Monterey Bay, CA) wave climatologyrecords, where median values are: Hs ¼ 1.7 m and Tp ¼ 12.5 s.Although the median wave direction computed from NDBC buoy46042 wave records is 299�, representative offshore wave condi-tions were selected based on its potential to alter nearshore SantaCruz, CA wave properties. Therefore, the MWD chosen was 205�
such that wave shadowing effects by land are reduced. The initialwave conditions were held constant for all model runs. SNL-SWANmodel parameters were selected based on SNL-SWAN modelevaluation results: frequency spread ¼ 3.3, directional spread ¼ 25,directional resolution ¼ 9�, zero wave energy reflection allowed,and no diffraction.
3.1. Model set-up
Two or three SNL-SWANmodel grids were nested, depending onWEC diameter, to predict the propagation of deep-water wavesfrom offshore of Monterey Bay to nearshore Santa Cruz, CA. Allmodel runs made use of a coarse, Monterey Bay grid. Its modelresolution was 0.001� in latitude and longitude and it was run as astationary model. Directional wave energy spectra conditions wereexported from the coarse resolution model and used as boundaryconditions for the nested, finer resolution model domain.
3.1.1. WECs larger than 15 mIn addition to the coarse Monterey Bay grid, a smaller, nested
model domain was employed in SNL-SWAN for WEC devices
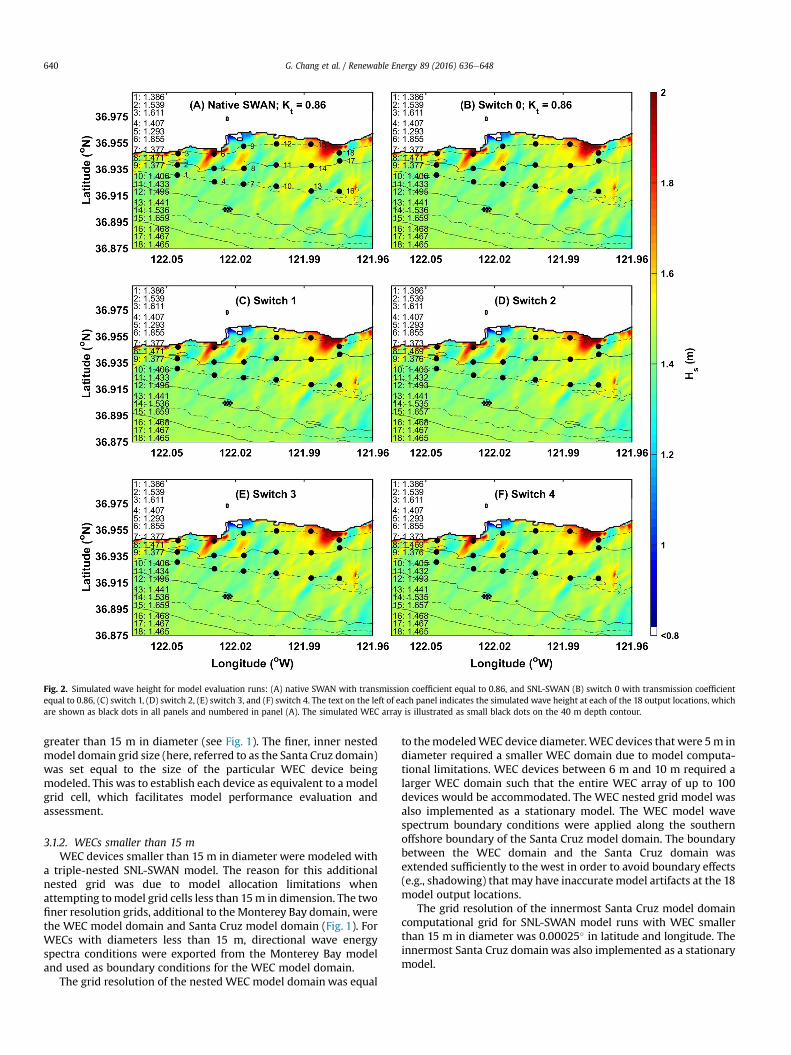
Fig. 2. Simulated wave height for model evaluation runs: (A) native SWAN with transmission coefficient equal to 0.86, and SNL-SWAN (B) switch 0 with transmission coefficientequal to 0.86, (C) switch 1, (D) switch 2, (E) switch 3, and (F) switch 4. The text on the left of each panel indicates the simulated wave height at each of the 18 output locations, whichare shown as black dots in all panels and numbered in panel (A). The simulated WEC array is illustrated as small black dots on the 40 m depth contour.
G. Chang et al. / Renewable Energy 89 (2016) 636e648640
greater than 15 m in diameter (see Fig. 1). The finer, inner nestedmodel domain grid size (here, referred to as the Santa Cruz domain)was set equal to the size of the particular WEC device beingmodeled. This was to establish each device as equivalent to a modelgrid cell, which facilitates model performance evaluation andassessment.
3.1.2. WECs smaller than 15 mWEC devices smaller than 15 m in diameter were modeled with
a triple-nested SNL-SWAN model. The reason for this additionalnested grid was due to model allocation limitations whenattempting tomodel grid cells less than 15m in dimension. The twofiner resolution grids, additional to the Monterey Bay domain, werethe WEC model domain and Santa Cruz model domain (Fig. 1). ForWECs with diameters less than 15 m, directional wave energyspectra conditions were exported from the Monterey Bay modeland used as boundary conditions for the WEC model domain.
The grid resolution of the nested WEC model domain was equal
to themodeledWEC device diameter.WEC devices that were 5m indiameter required a smaller WEC domain due to model computa-tional limitations. WEC devices between 6 m and 10 m required alarger WEC domain such that the entire WEC array of up to 100devices would be accommodated. The WEC nested grid model wasalso implemented as a stationary model. The WEC model wavespectrum boundary conditions were applied along the southernoffshore boundary of the Santa Cruz model domain. The boundarybetween the WEC domain and the Santa Cruz domain wasextended sufficiently to the west in order to avoid boundary effects(e.g., shadowing) that may have inaccurate model artifacts at the 18model output locations.
The grid resolution of the innermost Santa Cruz model domaincomputational grid for SNL-SWAN model runs with WEC smallerthan 15 m in diameter was 0.00025� in latitude and longitude. Theinnermost Santa Cruz domainwas also implemented as a stationarymodel.

Table 3WEC device types and associated diameters (maximum of length and width; fromBabarit et al. [2]) simulated for SNL-SWAN model sensitivity analysis.
WEC type Abbreviation Diameter (m)
Small bottom-referenced heaving buoy Bref-HB 5a
Bottom-fixed heave-buoy arrayb B-HBA 5Bottom-referenced submerged heave-buoyb Bref-SHB 7Floating heave-buoy arrayc F-HBA 8Floating three-body oscillating flap device F3 OF 9.5Floating two-body heaving converter F-2HB 20Bottom-fixed oscillating flap B-OF 26Floating oscillating water column F-OWC 50
a The Bref-HB published size is 3m; however it was specified as 5m in SNL-SWANmodel runs due to limitations on computational grid size.
b B-HBA and Bref-SHB were modeled as obstacles that extended throughout thewater column although both are devices without surface expressions.
c F-HBA is a multi-body WEC, composed of any number of heaving buoys con-nected to a submerged structure. The actual dimension of F-HBA is dependent onthe number of heaving buoys within its body. It was therefore modeled as a singular8-m diameter obstacle.
G. Chang et al. / Renewable Energy 89 (2016) 636e648 641
3.2. Results and discussion
SNL-SWAN model sensitivity analysis results were retained foreach model run. Results included propagated wave heights, waveperiods, wave directions, and near-bottom orbital velocities at allgrid points in the model domains. Further, the same wave prop-erties were extracted at each of the 18 distinct model output lo-cations (Fig. 1) to facilitate point-to-point comparisons. Note thatthe primary focus of this study is the alteration of the incident wavespectra downstream of the WEC, at nearshore locations. Any sec-ondary waves potentially generated and/or radiated by a WEC isassumed to be insignificant at the scales considered here. Surface-to-surface evaluations (Figs. 4e6) compare the modeled scenarioresults to the baseline scenario results, where the baseline scenariodoes not include WEC devices. Black shading in Figs. 4e6 indicatesno changes in wave parameter values from the baseline scenario.Color bars are included in each figure to define the amount ofchange, where change is defined as a percentage change from thebaseline scenario, where:
Percentage Change ¼ ðBaseline� FinalValueÞBaseline
� 100 (4a)
or, for example,
Fig. 3. Power matrices as a function of significant wave height and peak wave period compu(from Babarit et al. [2]). (A) B-HBA, (B) B-OF, (C) Bref-HB, (D) Bref-SHB, (E) F-2HB, (F) F3 OFinterpretation of the references to color in this figure legend, the reader is referred to the
Hs diff ¼ Hs Baseline � Hs WECð ÞHs Baseline
� 100 (4b)
Therefore, a positive change indicates a decrease in the value ofthe wave parameter in the presence of a WEC array. Negativechanges in MWD indicate clockwise rotation of wave direction andpositive changes indicate counter-clockwise rotation.
3.2.1. Significant wave heightResults of significant wave height predictions from the sensi-
tivity analysis for 50 Bref-SHB typeWECs using switches 1, 2, 3, and4 are shown in Fig. 4. The Bref-SHBWEC is relatively small (Table 3)with relatively low power absorption values (Fig. 3). Similar to theSNL-SWAN model evaluation results, switch 2 and switch 4 resul-ted in greater wave height reduction in the presence of the WECarray as compared to switch 1 and switch 3, again likely due to theeffects of the interpolating data when computing the RCW forswitches 2 and 4. Further differences in decreased wave height arefound when comparing results from employing constant frequencyversus frequency-dependent transmission coefficients (i.e. switch 1and 2 versus switch 3 and 4). For the Bref-SHB WEC, SNL-SWANmodel runs with frequency-dependent transmission coefficient(switches 3 and 4) result in up to 0.17% more wave height reduction(output location number 7 comparison between switch 2 andswitch 4). Increased wave height reduction (or more powerabsorbed) for SNL-SWAN switch 3 and 4 runs is also observed forthe B-HBA, F3 OF, and F-HBAWEC device types regardless of WECspacing or the number of WECs in the array (not shown).
However, SNL-SWAN model runs with frequency-dependenttransmission coefficient at times resulted in less wave heightreduction. This is illustrated in Fig. 5 for the B-OFWEC type and alsoholds true for the F-2HB and F-OWC devices. These three devicetypes are the three largest modeled WECs (Table 3) and have moreor less symmetrical power matrices as a function of period ascompared to the smaller WECs, which generally exhibit maximumpower at the lower wave periods and decreasing power withincreasing period (Fig. 3). For the simulations performed here,smaller WECs (less than 10 m diameter) with asymmetric powermatrices result in more power absorption when employingfrequency-dependent transmission coefficient. On the other hand,model runs for larger (greater than 10 m diameter) WECs withmore symmetrical power matrices result in less simulated wave
ted for the eight different WEC device types modeled in SNL-SWAN sensitivity analysis, (G) F-HBA, and (H) F-OWC. Color bar scales differ amongst different WEC types. (Forweb version of this article.)
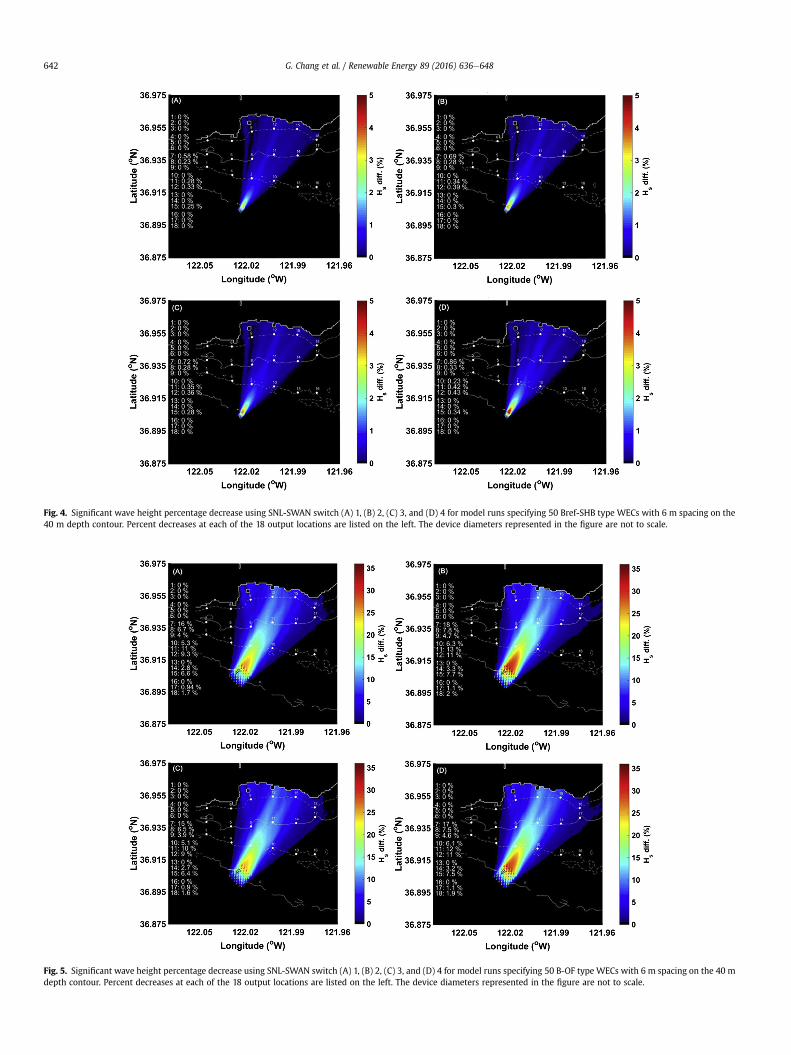
Fig. 4. Significant wave height percentage decrease using SNL-SWAN switch (A) 1, (B) 2, (C) 3, and (D) 4 for model runs specifying 50 Bref-SHB type WECs with 6 m spacing on the40 m depth contour. Percent decreases at each of the 18 output locations are listed on the left. The device diameters represented in the figure are not to scale.
Fig. 5. Significant wave height percentage decrease using SNL-SWAN switch (A) 1, (B) 2, (C) 3, and (D) 4 for model runs specifying 50 B-OF type WECs with 6 m spacing on the 40 mdepth contour. Percent decreases at each of the 18 output locations are listed on the left. The device diameters represented in the figure are not to scale.
G. Chang et al. / Renewable Energy 89 (2016) 636e648642

Fig. 6. Significant wave height percentage decrease using SNL-SWAN with a simulated array of 50 WECs spaced 6 m apart on the 40 m depth contour using switch 1 for (A) Bref-HB,(B) B-HBA, (C) Bref-SHB, (D) F-HBA, (E) F3 OF, (F) F-2HB, (G) B-OF, and (H) F-OWC WEC types. Percent differences at each of the 18 output locations are indicated on the left. Devicediameters are not to scale.
G. Chang et al. / Renewable Energy 89 (2016) 636e648 643

G. Chang et al. / Renewable Energy 89 (2016) 636e648644
height reduction when modeled with frequency-dependenttransmission coefficient.
Switch 1 model results for all eight WEC buoy types are shownin Fig. 6. The model sensitivity parameters are 50 WECs with sixdiameter spacing for each of the WEC device types. General spatialpatterns in wave height reduction are similar for the other threeswitches and other sensitivity parameters and thus are not shown.For all eight device types, the largest wave height decreases weredirectly in the lee of theWEC arrays at output location numbers 7, 8,11, and 12. In general, smaller devices had less impact on wave
Fig. 7. Wave height reduction as affected by variations in (A) WEC device type (and size),number of WECs in a WEC array, (D) number of WECs in an array considering the total absorarea. Results are from SNL-SWAN switch 4 simulations.
height as compared to larger buoy sizes. Exceptions to this state-ment were the Bref-SHB buoy (7 m), which exhibited wave heightreductions of roughly equal magnitude as the B-HBA WEC type(5 m) and the F-OWC buoy (50 m), which had less of an impact onwave height than the 26m B-OF device type (Fig. 6). Themagnitudeof wave height reduction was directly correlated to the WEC's po-wer matrix values at the modeled incoming wave height andperiod, with larger values resulting in more reduction in waveheight and vice versa.
The largest spatial (horizontal or along-shore) wave reduction
(B) WEC device (and size) represented by each WEC's average power absorption, (C)bed power, (E) WEC spacing, and (F) WEC spacing considering the WEC array footprint
G. Chang et al. / Renewable Energy 89 (2016) 636e648 645
effects were observed with the F-OWC device, which makes intu-itive sense given that these were the largest of the modeled devicesand were thus also spaced furthest apart, i.e. influencing a widerswath of the incident wave field.
Fig. 7 summarizes model sensitivity to the following variedparameters: WEC buoy type, WEC power absorption, number ofWEC devices in the array and number ofWECs in an array includingconsideration of the sum total of power absorbed, andWEC spacingand WEC spacing including the influence of the WEC array foot-print area (i.e. wave height difference with and without WECsdivided by the total area occupied by a WEC array including thespacing in between theWECs). General patterns observed in modelsensitivity analysis are similar throughout all four switches;therefore results are shown for a randomly selected switch. Vari-ability inwave height percent differences was largest for buoy type,i.e. the model was most sensitive to WEC device type andWEC sizewith the exception of the F-OWC buoy. The power matrix associ-ated with each WEC was generally scaled to WEC size, i.e. largerbuoys exhibited greater power absorption as compared to smallerdevices, with the exception of the F-OWC buoy. WECs with higherpower absorption resulted in greater wave height reduction. This isillustrated in Fig. 7B, where eachWEC device type is represented byits average power absorption as calculated by SNL-SWAN.
As expected, the larger the number of WECs in the array, thegreater the difference between modeled wave height with andwithout obstacles (Fig. 7C). Again, these results are directly corre-lated to WEC power absorption, i.e. more buoys will absorb morepower. Model results are insensitive to the number of WECs in anarray when the total power absorption is considered. Fig. 7D shows
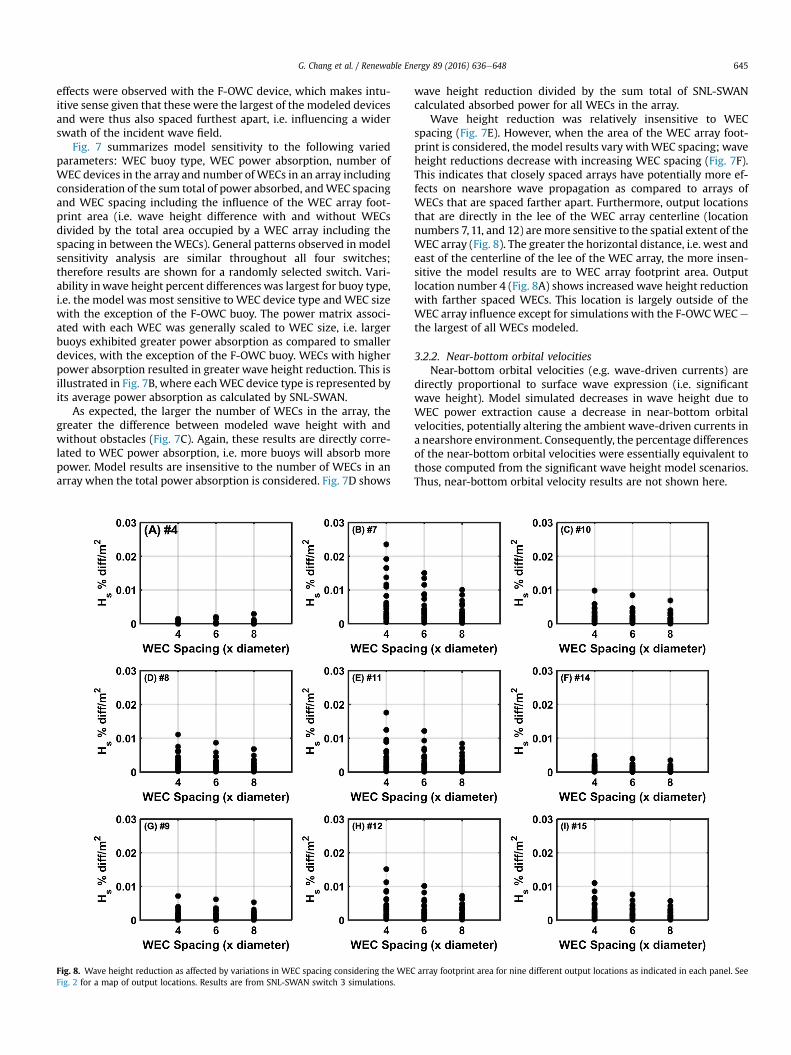
Fig. 8. Wave height reduction as affected by variations in WEC spacing considering the WECFig. 2 for a map of output locations. Results are from SNL-SWAN switch 3 simulations.
wave height reduction divided by the sum total of SNL-SWANcalculated absorbed power for all WECs in the array.
Wave height reduction was relatively insensitive to WECspacing (Fig. 7E). However, when the area of the WEC array foot-print is considered, the model results vary withWEC spacing; waveheight reductions decrease with increasing WEC spacing (Fig. 7F).This indicates that closely spaced arrays have potentially more ef-fects on nearshore wave propagation as compared to arrays ofWECs that are spaced farther apart. Furthermore, output locationsthat are directly in the lee of the WEC array centerline (locationnumbers 7,11, and 12) aremore sensitive to the spatial extent of theWEC array (Fig. 8). The greater the horizontal distance, i.e. west andeast of the centerline of the lee of the WEC array, the more insen-sitive the model results are to WEC array footprint area. Outputlocation number 4 (Fig. 8A) shows increased wave height reductionwith farther spaced WECs. This location is largely outside of theWEC array influence except for simulations with the F-OWCWEC e
the largest of all WECs modeled.
3.2.2. Near-bottom orbital velocitiesNear-bottom orbital velocities (e.g. wave-driven currents) are
directly proportional to surface wave expression (i.e. significantwave height). Model simulated decreases in wave height due toWEC power extraction cause a decrease in near-bottom orbitalvelocities, potentially altering the ambient wave-driven currents ina nearshore environment. Consequently, the percentage differencesof the near-bottom orbital velocities were essentially equivalent tothose computed from the significant wave height model scenarios.Thus, near-bottom orbital velocity results are not shown here.
array footprint area for nine different output locations as indicated in each panel. See

Fig. 9. Peak wave period reduction as affected by variations in (A) WEC device type (and size), (B) number of WECs in a WEC array, (C) WEC spacing, and (D) WEC spacing withconsideration of the WEC array footprint area. Results are from SNL-SWAN switch 3 simulations.
G. Chang et al. / Renewable Energy 89 (2016) 636e648646
3.2.3. Peak wave periodsThe percentage changes in peak wave periods during this study
were negligible, as shown in Fig. 9. Within the model parameters,the frequency bin resolution was likely too large to register smallchanges in wave periods (small changes in frequency would notcause a change in frequency bin in model space). Note that for SNL-SWAN switch 3 and switch 4 simulations, there was no observedchanges in peak wave energy despite the frequency-dependentpower absorption, also indicating that the model frequency binresolution was larger than any changes in wave period.
3.2.4. Mean wave directionsChanges in mean wave directions are illustrated in Fig. 10.
Directional changes were most sensitive to WEC spacing when theWEC array footprint area was considered. The closer spaced arraysthat occupied the smallest footprint resulted in larger directionalrotations. However, all percentage differences between the baselinescenario and a simulated WEC array translated to within ±4.5%,corresponding to ±9� change in MWD. Negative changes indicatedclockwise rotation of wave direction. Positive changes indicatedcounter-clockwise rotation. Rotation, when it occurred in themodel, was relatively large because the directional bin spacing wasequal to 9�. Any changes less than this are indeterminable by themodel as currently parameterized. Zero wave direction change wasobserved for modeled devices smaller than 8 m. It is thus surmisedthat direction changes, if any, caused by the WEC devices were lessthan 9�. Higher resolution changes in MWD could be ascertainedwith increased model directional resolution. However, due tomodel allocation limitations in the present model configuration,model grid resolution or model domain size would be
compromised.
4. Summary and conclusions
The presence of WEC arrays have the potential to alter wavepropagation patterns significantly and affect coastal circulationpatterns, sediment transport patterns, and alter ecosystem pro-cesses. To help accelerate deployment of environmentally friendlyWEC arrays, predictive modeling tools have been developed torepresent WEC induced changes in wave propagation and evaluatethe potential for environmental impact. The present study utilizeda modified version (SNL-SWAN) of an industry standard wavemodeling tool, SWAN, to examine potential WEC array deploymentscenarios at a site on the California coast and investigate modelsensitivity so that themodel can be effectively and confidently usedin environmental studies. This analysis built upon a previoussensitivity analysis in which SWAN model parameters were variedto examine their effect on model results [6].
In the present study, SNL- SWAN, was evaluated against thenative SWAN code and used to investigate the effects of differentWEC devices on nearshore wave propagation. SNL-SWAN sensi-tivity analysis studies were performed to examine the effects ofWEC variations (WEC device type and size, number of WEC devicesin an array, and the spacing of theWEC devices within the array) onnear-field and far-field wave conditions in the lee of the WECdevices.
The results illustrate that, given the present model setup, thewave heights and associated near-bottom orbital velocities showeddecreases of up to 30% between baseline and modeled conditionsfor 100 devices of the B-OF buoy type. The B-OF power matrix

Fig. 10. Meanwave direction as affected by variations in (A) WEC device type (and size), (B) number of WECs in a WEC array, (C) WEC spacing, and (D) WEC spacing considering theWEC array footprint area. Negative differences indicate clockwise rotation and positive differences indicate counterclockwise rotation. Results are from SNL-SWAN switch 2simulations.
G. Chang et al. / Renewable Energy 89 (2016) 636e648 647
values were largest for an incident wave height of 1.7m. Other buoytypes resulted in less than 15% differences in modeled wave heightwith and without obstacles, with lesser influence for buoys lessthan 10 m in diameter. Although the F-OWC device was the largestdevice modeled, its power matrix values for an incident waveheight of 1.7 mwere less than that of the B-OF device and hence itswave reduction potential was less. However, the F-OWC effectsextended over a larger spatial extent due to its size and spacing,thereby potentially having a greater effects on the local shoreline.
Model output locations located to the west (output locations 1through 6) showed relatively little to no change in wave heightscompared to the baseline scenario. The largest wave height differ-ences were observed downstream of the array near the arraycenterline (output locations 7 through 12), where the largest waveshadowing effects are predicted. Additional model output locationsto the east of the array (output locations 13 through 18) indicatedrelatively small changes in wave heights for buoys larger than 9 min diameter. This is intuitive given that the modeled incident wavedirection was from the southwest and these waves refracted to-ward the shoreline in a counter-clockwise manner.
Wave directions and periods did not appear to be sensitive tochanges in WEC and WEC array characteristics except whenconsideringWEC array footprint sizes. However, additional analysisis required to fully explore the model sensitivity of peak waveperiod and mean wave direction to the varying of the WECparameters.
The SNL-SWAN Version 1.0 source code is publically available(https://github.com/SNL-WaterPower/SNL-SWAN/tree/master/bin), has been verified, and has undergone preliminary validation
by comparison to experimental wave tank data. However, it isimportant to utilize ongoing laboratory studies and future fieldtests to determine the most appropriate implementation of WECpower performance data. Until actual power matrix values becomeavailable or further WEC-specific model enhancements are vali-dated, this study shows that environmental assessments of WECdevices should focus on evaluating a range of WEC characteristicsin order to determine the limits of the potential environmentaleffects resulting from the presence of a WEC array. For more in-formation about the ongoing development, validation, and appli-cations of SNL-SWAN, please see Porter et al. [19] and Ruehl et al.[22].
In summary, the present study developed a baseline modelunderstanding while investigating the effects of a range of WECdevices. The sensitivity, optimization, and behavior of themodel forvarious WEC devices provided the basis for a solid model under-standing giving the confidence necessary for future WECevaluations.
Acknowledgments
This research was made possible by support from the Depart-ment of Energy's Wind and Water Power Technologies Office,funded by the U.S. Department of Energy. Sandia is amulti-programlaboratory operated by Sandia Corporation, a Lockheed MartinCompany, for the United States Department of Energy's NationalNuclear Security Administration under contract DE-AC04-94AL85000. Special thanks to Ari Posner for early developmentalefforts associated with SNL-SWAN and to Jason Magalen for initial

G. Chang et al. / Renewable Energy 89 (2016) 636e648648
SWAN model set-up and sensitivity studies.
Appendix A. Nomenclature
B-HBA bottom-fixed heave-buoy arrayB-OF bottom-fixed oscillating flapBref-HB small bottom-referenced heaving buoyBref-SHB bottom-referenced submerged heave-buoyF-2HB floating two-body heaving converterF3 OF floating three-body oscillating flap deviceF-HBA floating heave-buoy arrayF-OWC floating oscillating water columnHincident incident or incoming wave heightHlee wave height in the lee of a simulated WEC or obstacleHs significant wave heightKt transmission coefficientME mean error or biasMWD mean wave directionNDBC National Data Buoy CenterNOAA National Oceanic and Atmospheric AdministrationPabsorbed wave power absorbed by a WECPincident incident or incoming wave powerPlee wave power in the lee of a simulated WEC or obstacleRCW relative capture widthRMSE root mean square errorSI scatter indexSNL Sandia National LaboratoriesSWAN Simulating WAves NearshoreSNL-SWAN modified SWAN modelTp peak wave periodWEC wave energy converter
References
[1] ASR Limited, Review of Wave Hub Technical Studies: Impacts on InshoreSurfing Beaches, 2007. Hamilton, New Zealand.
[2] A. Barbarit, J. Hals, M.J. Muliawan, A. Kurniawan, T. Moan, J. Krokstad, Nu-merical benchmarking study of a selection of wave energy converters, Renew.Energy 41 (2012) 44e63.
[3] A.R. Bento, E. Rusu, P. Martinho, C. Guesdes Soares, Assessment of the changesinduced by a wave energy farm in the nearshore wave conditions, Comput.Geosci. 71 (2014) 50e61.
[4] N. Booij, R.C. Ris, L.H. Holthuijsen, A third-generation wave model for coastalregions. Part I: model description and validation, J. Geophys. Res. 104 (1999)7649e7666.
[5] G. Chang, C. Jones, D. Hansen, M. Twardowski, A. Barnard, Prediction of OpticalVariability in Dynamic Near-shore Environments: Task Completion Report #3e Numerical Modeling and Verification, Sea Engineering, Inc., Santa Cruz, CA,2010.
[6] G. Chang, J. Magalen, C. Jones, J. Roberts, Investigation of Wave Energy Con-verter Effects on Wave Fields: a Modeling Sensitivity Study in Monterey Bay,CA, Sandia Report, SAND2014-16840, Sandia National Laboratories, Albu-querque, NM, 2014.
[7] Collins, Prediction of shallow water spectra, J. Geophys. Res. 93 (C1) (1972)
491e508.[8] A. Copping, L. Hanna, B. Van Cleve, K. Blake, R. Anderson, Environmental risk
evaluation system e an approach to ranking risk of ocean energy develop-ment on coastal and estuarine environments, Est. Coast 38 (2014) 287e302.
[9] K. d’Angremond, J.W. van der Meer, R.J. de Jong, Wave transmission at low-crested structures, in: Proc. 25th Int. Conf. Coastal Engng, ASCE, Orlando,1996, pp. 2418e2427.
[10] Delft University of Technology, SWAN User Manual, SWAN Cycle III Version41.01, 1993. Delft, The Netherlands.
[11] Y. Goda, H. Takeda, Y. Moriya, Laboratory Investigation of Wave Transmissionover Breakwaters, vol. 13, Rep. Port and Harbour Res. Inst., 1967.
[12] R. Gonzalez-Santamaria, Q. Zou, S. Pan, Impacts of a wave farm on waves,currents, and coastal morphology in south west England, Est. Coast 1 (2013)1e14.
[13] G. Hagerman, R. Bedard, Guidelines for Preliminary Estimation of PowerProduction by Offshore Wave Energy Conversion Devices, Technical ReportE2I EPRI-WP-US-001, Electricity Innovation Institute, Electric Power ResearchInstitute, Palo Alto, CA, USA, 2003.
[14] G. Iglesias, R. Carballo, Wave farm impact: the role of farm-to-coast distance,Renew. Energy 69 (2014) 375e385.
[15] R. Leeney, D. Greaves, D. Conley, A. O'Hagan, Environmental impact assess-ments for wave energy developments e learning from existing activities andinformation future research priorities, Ocean Coast. Manage 99 (2014) 14e22.
[16] D.L. Millar, H.C.M. Smith, D.E. Reeve, Modelling analysis of the sensitivity ofshoreline change to a wave farm, Ocean Eng. 34 (2007) 884e901.
[17] A. Palha, L. Mendes, C.J. Fortes, A. Brito-Melo, A. Sarmento, The impact of waveenergy farms in the shoreline wave climate: Portuguese pilot zone case studyusing Pelamis energy wave devices, Renew. Energy 35 (2010) 62e77.
[18] A. Porter, K. Ruehl, C. Chartrand, Further development of SNL-SWAN, a vali-dated wave energy converter array modeling tool, in: Proc. 2nd Marine En-ergy Technology Symposium, Seattle, WA, 2014, pp. 1e9.
[19] A. Porter, K. Ruehl, C. Chartrand, H. Smith, Development and Release of theOpen-Source Wave Climate Environment Assessment Tool SNL-SWAN, in:Proceedings of the 3rd Marine Energy Technology Symposium, WashingtonD.C. USA, 2015.
[20] R.C. Ris, N. Booij, L.H. Holthuijsen, A third-generation wave model for coastalregions. Part II: verification, J. Geophys. Res. 104 (1999) 7667e7682.
[21] K. Ruehl, C. Chartrand, A. Porter, SNL-SWAN Manual, SAND Report, SandiaNational Laboratories, Albuquerque, NM, 2014.
[22] K. Ruehl, A. Porter, C. Chartrand, H. Smith, G. Chang, J. Roberts, Development,Verification and Application of the SNL-SWAN Open Source Wave Farm Code,in: Proceedings of the 11th European Wave and Tidal Energy Conference,Nantes, France, 2015.
[23] K. Ruehl, A. Porter, A. Posner, J. Roberts, in: Development of SNL-SWAN, aValidated Wave Energy Converter Array Modeling Tool, Presented at theEWTEC 2013, Denmark, 2013.
[24] E. Rusu, C. Guedes Soares, Wave energy assessments in the coastal environ-ment of Portugal continental, in: Proceedings of the 27th International Con-ference on Offshore Mechanics and Arctic Engineering (OMAE 2008) Estoril,Portugal, ASME, OMAE2008-57820, 2008.
[25] E. Rusu, C. Guedes Soares, Numerical modeling to estimate the spatial dis-tribution of the wave energy in the Portuguese nearshore, Renew. Energy 34(6) (2009) 1501e1516.
[26] E. Rusu, C. Guedes Soares, Coastal impact induced by a Pelamis wave farmoperating in the Portuguese nearshore, Renew. Energy 58 (2013) 34e49.
[27] H.C.M. Smith, C. Pearse, D.L. Millar, Further analysis of change in nearshorewave climate due to an offshore wave farm: An enhanced case study for theWave Hub site, Renew. Energy 40 (2012) 51e64.
[28] R. Tiron, R. Mallon, D. Frederic, E.G. Reynaud, The challenging life of waveenergy devices at sea: a few points to consider, Renew. Sust. Energy Rev. 43(2015) 1263e1271.
[29] TOMAWAC e Wave Propagation in Coastal Areas. [Online]. Available: http://www.opentelemac.org/index.php/presentation?id¼20. (accessed 27.01.14.).