Embed Size (px)
Citation preview

International Journal of Solids and Structures 48 (2011) 1229–1238
Contents lists available at ScienceDirect
International Journal of Solids and Structures
journal homepage: www.elsevier .com/locate / i jsols t r
Numerical modeling of the double punch test for plain concrete
Alba Pros a,⇑, Pedro Díez a, Climent Molins b
a Laboratori de Càlcul Numèric, Departament de Matemàtica Aplicada III, Universitat Politècnica de Catalunya, Barcelona Tech, Campus Nord UPC, 08034 Barcelona, Spainb Departament d’Enginyeria de la Construcció, Universitat Politècnica de Catalunya, Barcelona Tech, Campus Nord UPC, 08034 Barcelona, Spain
a r t i c l e i n f o a b s t r a c t
Article history:Received 6 October 2010Received in revised form 30 November 2010Available online 11 January 2011
Keywords:Double punch testPlain concreteModelingNumerical simulationFinite element methodNonlocal Mazars damage modelFracture mechanicsJointsValidation
0020-7683/$ - see front matter � 2011 Elsevier Ltd. Adoi:10.1016/j.ijsolstr.2011.01.006
⇑ Corresponding author.E-mail addresses: [email protected] (A. Pros), p
[email protected] (C. Molins).URL: http://www-lacan.upc.es (A. Pros).
Double punch test is used to indirectly assess the tensile strength of plain concrete, ft. For this normalizedtest, the tensile strength is obtained as a function of the failure load, P, which is expressed as ft ¼ FðPÞ.Different authors have proposed different expressions for the relation Fð�Þ, yielding scattered values of ft.None of these alternatives is universally recognized as being more suitable than the others. In fact, theseexpressions are mainly based on elastic models considering the maximum tensile stress under the load Pand ft is obtained as an output of the linear model. A numerical simulation allows using models in which ft
is an input of the material model and the corresponding failure load P is obtained associated with eachvalue of ft. In the present work, double punch test is simulated numerically considering two alternativesfor modeling plain concrete accounting for damage and cracking: (a) the nonlocal Mazars damage modeland (b) an heuristic crack model including joint elements in an a priori defined crack pattern. Numericalresults are validated with experimental data and compared with the analytical expressions available inthe literature.
� 2011 Elsevier Ltd. All rights reserved.
1. Introduction the experimental setup is a force–displacement curve in which the
The double punch test (DPT) (Chen, 1970; Chen and Yuan, 1980;Chen and Ttumbauer, 1972) is used to indirectly measure the ten-sile strength of plain concrete, ft. Indirect measures of tensilestrength (Brazilian test, DPT, 3 and 4 point bending test, etc.) areoften preferred to direct uniaxial tests because (1) they are mucheasier to perform, particularly for controlling material production(for plain concrete, for example, the Brazilian test is of commonand standard use) and (2) they show a reduced scattering of the re-sults. The main focus of this work is proposing numerical modelsfor the DPT in which ft is an input parameter. The idea is to replacethe naif linear elastic model by a more realistic one that has thetensile strength, ft, already as one of material parameters and toidentify the value of this material parameter that better fits theexperimental results. These models are validated using experimen-tal results and other analysis available in the open literature (Chenand Yuan, 1980; Bortolotti, 1988; Marti, 1989; Molins et al., 2007).
The information extracted from the experimental tests is trans-lated into the parameters characterizing the mechanical propertiesof the analyzed concrete. In this case, the parameter to be assessedis precisely the tensile strength, ft. Essentially, the data provided by
ll rights reserved.
[email protected] (P. Díez),
peak points corresponding to the collapse are easily identified. Theforce corresponding to the peak point, P, is readily translated intothe tensile strength value using a theoretical model simulatingthe mechanical behavior of the test, ft ¼ FðPÞ. Currently, theunderlying theoretical model used in this framework is an analyt-ical solution of the linear elastic problem (Chau and Wei, 2000,).These models are a crude approximation of the actual behaviorof the specimen close to the collapse regime but they still providea good approach to the tensile strength by selecting a characteristictensile stress in the linear elastic solution for the peak force, P.
Two different approaches are considered in order to model themechanical behavior of the concrete in the DPT. Firstly (option A), acontinuous model which has been successfully used modeling thecommon Brazilian test (Rodriguez-Ferran and Huerta, 2000), thenonlocal Mazars damage model (Mazars, 1986; Bazant, 2002; Jirá-sek, 2007; Pijaudier-Cabot and Huerta, 1991; Rodriguez-Ferran andHuerta, 2000). Secondly (option B), a model which introduces dis-continuous fracture at the surfaces corresponding to an a priori de-fined cracking pattern, based on the experimentally observedfracture mechanisms (Díez and Pegon, 2002; Beer, 1985; Snymanet al., 1991). On the fracture surfaces, joint elements with cohesivedilatant behavior are used to model the interfaces. In the rest of thespecimen, the mechanical behavior is assumed to be linear elasticbecause the relevant deformation is concentrated in the fracturesurfaces. Here, 3D finite element approximations are usedcomplemented (for option B) with 2D joint elements. Both optionsA and B are solved using 3D finite elements.

Fig. 1. Double punch test layout.
Fig. 2. Two possible collapse mechanisms with three and four radial fractureplanes.
1230 A. Pros et al. / International Journal of Solids and Structures 48 (2011) 1229–1238
Both options A and B provide approximations of the pre-peakand the post-peak behavior. Therefore, the information that maybe extracted from the numerical tests is very rich and, in addition,to identify the parameters it may allow gaining further knowledgeon the phenomenon.
The goal of this study is to analyze the features of the differentmodels and their capabilities to properly approximate the experi-mental tests by fitting the experimental data available. An objec-tive comparison is performed by setting a measure of the errorbetween the experimental data and the model, this is equivalentto define a fitting criterion. Correspondingly, the parameter identi-fication and the model validation are carried out both based on thesame criterion.
All the experimental results are from an experimental campaignwhich consisted of the characterization of an specific concrete,including the double punch test. Hence, experimental data is avail-able not only from the double punch test, but also from two differ-ent tests.
Thus, sophisticated models are used to identify the tensilestrength from the DPT, instead of the linear elastic model. Theadvantage of using this approach is more relevant when DPT is usedto identify the tensile behavior of steel fiber reinforced concrete. Forfiber reinforced concrete (FRC), taking into account the post-peakbehavior (and not only the peak) is extremely relevant. The presentwork has to be seen as a first step towards including steel fibers intothese models in order to simulate the extension of the DPT to assessthe after cracking capacity of FRC (a test introduced in Molins et al.(2007, 2009), named as the Barcelona Test).
The remainder of this paper is structured as follows. First, inSection 2 the double punch test is presented, the problem state-ment is defined and the analytical expressions relating the tensilestrength and the value of the maximum vertical load ðft ¼ FðPÞÞare introduced, as well as the experimental campaign. Section 3presents the numerical simulation: the continuous model andthe discontinuous one. Then, in Section 4, the numerical resultsare presented and contrasted. Moreover, the numerical resultsare validated with the experimental and analytical results avail-able. Finally, the most important conclusions are listed.
2. Double punch test
2.1. Description of the double punch test
Double punch test was introduced in Chen (1970), Chen andYuan (1980), Chen and Ttumbauer (1972) as a tool to assess indi-rectly the tensile strength of plain concrete. It was presented asan alternative to the Brazilian test, which was so far the most com-mon indirect tension test.
The test layout is illustrated in Fig. 1 and consists in compress-ing axially a cylindrical concrete specimen with two steel circularpunches centered at the top and the bottom of the specimen. Thegeometry of the specimen is given by the height (l = 15 cm) andthe diameter (d = 15 cm). The ratio between the diameters of thepunches and the specimen is one fourth ðd0 ¼ 1
4 d ¼ 3:75 cmÞ. Occa-sionally, smaller specimens with identical geometrical proportionsare used to study the influence of size effect (Chen and Yuan,1980), concluding that the tensile strength interpreted from theDPT is relatively insensitive to the size of the specimen.
A typical failure mechanism presents three radial fractureplanes. However, in the experimental results, the observed numberof fracture planes ranges from two to four. The geometry of the col-lapse pattern is completed with two fracture cones beneath eachpunch. In Fig. 2 two different fracture patterns are illustrated.
The goal of the present simulations is to describe the collapse ofthe specimen, with special interest in determining the peak load.
Describing the chronological sequence of the cracks appearance,as discussed in Lilliu and Van Mier (2003, 1999), is beyond thescope of this paper. In the models used here the fracture patternis such that the specimen is partitioned into blocks that behaveas rigid-bodies. Thus, the kinematics compatibility of the motionof these blocks undergoes a simultaneous development of thetwo basic mechanisms, namely the cone penetration and the sep-aration of the crack planes.
The classical indirect tension test for plain concrete is the Bra-zilian test. DPT is often preferred to the Brazilian test because itis easier to carry out and the tensile strength is sampled in differ-ent cracked planes and, therefore, the quantity obtained corre-sponds to an average. On the contrary, the Brazilian test confinesfailure to a predetermined plane. Moreover, for Steel Fiber Rein-forced concrete DPT captures better fibers influence than Braziliantest, due to their fracture mechanisms.
The experimental set up is a displacement controlled compres-sion at a velocity of 0.5 mm/min.
2.2. Close-form expressions for tensile strength determination
Some analytical expressions of the tensile strength are availablein the literature for the DPT. The maximum compression load (P)and the dimensions of the test (d,d
0and l) are the inputs in each
analytical expression.

Fig. 3. Description of the uniaxial compression test.
Fig. 4. Description of the Brazilian test.
A. Pros et al. / International Journal of Solids and Structures 48 (2011) 1229–1238 1231
Chen and Yuan (1980) applied a limit analysis idealizing con-crete as a linear elastic-perfectly plastic material with very largeductility obtaining:
ft ¼P
p 1:2 d2 l� d0
2
� �2� � : ð1Þ
Moreover, in order to be more accurate, they carried out a finiteelement analysis considering concrete as an elastic plastic strain-hardening and fracture material and the final expression proposedis
ft ¼0:75P
p 1:2 d2 l� d0
2
� �2� � : ð2Þ
However, there are other analytical approximations of the ten-sile strength in the DPT given by different authors as follows.
Based on a nonlinear fracture mechanics approach, Marti (1989)proposed:
ft ¼ 0:4P
4 d2
� �2
ffiffiffiffiffiffiffiffiffiffiffiffiffiffiffiffi1þ d
kda
s; ð3Þ
where da is the maximum aggregate size and k is an experimentalparameter depending on the material. This expression is given inorder to analyze the size effect of the specimen on the tensilestrength value.
Bortolotti (1988) assumed a modified Coulomb-like failure cri-terion for concrete getting:
ft ¼P
p d2 l� ðd02 Þ
2 cot a� � ; ð4Þ
considering a ¼ p2 �
/2 with / being the internal friction angle in the
modified Coulomb’s yield criterion.Finally, Molins et al. (2007), presented another analytical
expression based on limit analysis:
ft ¼P
9pl d0
2
: ð5Þ
In the following, these expressions are used for comparison pur-poses and we restrict ourselves to the expressions given in Eqs. (1),(2) and (5).
2.3. Experimental campaign
The DPT is contrasted with two standard tests (the uniaxialcompression test and the Brazilian test). The set up of these twotests is recalled bellow.
2.3.1. Uniaxial compression testThe specimen of the uniaxial compression test, presented in
Fig. 3, is a concrete cylinder of size l = 30 cm and d = 15 cm. Thecompression load is uniformly distributed at the top and bottomof the specimen.
This is a direct compression test which provides the compres-sive strength, fc. The relationship between the compressivestrength fc and the maximum vertical load Pu is given by
fc ¼4Pu
pd2 ; ð6Þ
where d stands for the diameter of the specimen.Experimentally, the value obtained is Pu = 8.9 � 105 N, which is
translated into fc through Eq. (6): fc = 50.45 MPa.
2.3.2. Brazilian testOn the other hand, the Brazilian test is an indirect tension test
consisting in compressing a plain concrete cylinder placed horizon-tally by two steel plates (as shown in Fig. 4). On the modelspresented in the remainder of the paper, the effect of the plateson the top and bottom is accounted for by distributing theprescribed displacements on a contact zone following (Rodri-guez-Ferran and Huerta, 2000).

Table 1Experimental data.
Description Symbol Value
Young’s modulus E 35.5 GPaCompressive strength (from the uniaxial
compression test)fc 50.45 MPa
(2.69%)Tensile strength (from the Brazilian test) ft 3.84 MPa
(8.36%)Maximum load (from the DPT) P 1.52 � 105 N
(4.10%)Vertical displacement at the maximum load
(from the DPT)uz 8.6 � 10�4 m
(7.15%)
1232 A. Pros et al. / International Journal of Solids and Structures 48 (2011) 1229–1238
For the Brazilian test, the relation between the tensile strengthwith the maximum vertical load is given by
ft ¼2PB
pld; ð7Þ
where l and d stand for the length and the diameter of the concretespecimen, respectively.
The given analytic expression is standard and there is agree-ment about its accuracy.
Experimentally, the average value obtained is PB = 8.6 � 105 N,which is translated to the tensile strength, ft, using the Eq. (7).Thus, the value of the tensile strength is set: ft = 3.84 MPa.
2.3.3. Experimental resultsThe data presented in Table 1 is the result of an experimental
campaign carried out in the Departament d’Enginyeria de laConstrucció of the Universitat Politècnica de Catalunya (UPC). Theuniaxial compression test, the Brazilian test and the DPT areconsidered. The mean values are displayed and, in brackets, thecoefficient of variation (standard deviation divided by the meanvalue) is presented. The Poisson ratio (m) is assumed to be equalto 0.2.
The DPT campaign consists in six test, three of them showedthree fracture radial planes and the other three showed four frac-ture radial planes.
In this case, the uniaxial compression test (giving fc), the Brazil-ian test (giving ft as far as the Brazilian test is considered to bereliable) and the output of the DPT (the maximum vertical loadP) are available for the same material. Numerical models areneeded to find the expected value P of the DPT for a given ft.Although analytically some expressions relating ft and P for theDPT are available, they present scattering. The relationft ¼ F BðPBÞ for the Brazilian test is reliable, therefore, the numericalmodels are validated firstly for this test.
3. Numerical modeling
Two different techniques are considered to simulate numeri-cally the double punch test. On one hand, a continuous model,the nonlocal Mazars damage model (based on Mazars, 1986; Ba-zant, 2002), which has already been used in previous simulationsof indirect tension tests (Rodriguez-Ferran and Huerta, 2000). Onthe other hand, a discontinuous model is considered based onintroducing joint elements along the cracks. This model defines apriori the cracking pattern (known through the experimental testsand the analytical description of the DPT). Then, joint elements areused to model the cracks. The rest of the specimen is modeled as anelastic material.
The behavior of the DPT is a fully 3D phenomenon and, there-fore, 3D modeling is required for both cases.
3.1. Nonlocal Mazars damage model
In a damage model, the constitutive equation is given byr ¼ ð1� DÞCe, where D is a scalar parameter representing thedamage and obeying 0 6 D 6 1. If D = 0, the material is consideredhealthy and if D = 1, the material is completely damaged. In theabove, r and e stand for stress and strain tensor, respectively.Meanwhile, C is the elastic forth order tensor.
The damage parameter evolves depending on y, D = D(y), whichis called state variable and depends on the strain field, y = y(e).Commonly, the damage starts when the state variable reaches a gi-ven threshold Y0 and it always increases.
The Mazars Damage Model considers the damage as a linearcombination of the damage generated under tension, Dt, and thedamage under compression, Dc: D = atDt + acDc. Herein, the damagefollows an exponential law and the state variable is defined asy ¼ e.
The Mazars damage model can be written as:
Dt ¼ 1� Y0ð1� AtÞe
� Ate�Btðe�Y0Þ; at ¼X
i
etiheiie2
;
Dc ¼ 1� Y0ð1� AcÞe
� Ace�Bcðe�Y0Þ; ac ¼X
i
eciheiie2
;
with at + ac = 1 and
heii ¼ei þ jeij
2; e ¼
ffiffiffiffiffiffiffiffiffiffiffiffiffiffiffiffiffiffiffiffiffiffiffiffiffiffiffiffiffiffiffiffiffiXi
ei þ jeij2
� �2vuut ;
where ei are the main strains.Moreover, eti and eci are calculated following the next scheme:
r! rprinrþprin ! rþ ! eþ ! eþprin ! eti;
r�prin ! r� ! e� ! e�prin ! eci;
(with r = r+ + r� and ei = eti + eci.
The parameters At, Bt, Ac, Bc and the threshold Y0 are set depend-ing on the material modeled, taking into account the relationshipbetween damage parameters and experimental parameters.
The constitutive equation under tension for a uniaxial test canbe written as:
r ¼E � e; e 6 Y0;
Y0ð1�AtÞe þ At � e�Btðe�Y0Þ
h i� E � e; e > Y0;
(ð8Þ
and the constitutive equation under compression is deduced for auniaxial test:
r ¼E � e; e 6 Y0;
Y0ð1�AcÞe þ Ac � e�Bcðe�Y0Þ
h i� E � e; e > Y0;
(ð9Þ
Now, the damage parameters deduction is presented based on(8) and (9).
� Imposing that if e = Y0) r = ft in (8), it results:
Y0 ¼ft
E: ð10Þ
� Under tension, lime?1r = r1, with r1 standing for the residualtensile strength, is considered. Therefore, using (8):
E � Y0 � ð1� AtÞ ¼ r1 ) At ¼ 1� r1E � Y0
: ð11Þ
� Bt = 10000 � (1 + n), where n is a parameter measuring the mate-rial ductility.� Under compression, r
0(emax) = 0. Let us derivate (9), getting:
Bc ¼1
emax: ð12Þ
A. Pros et al. / International Journal of Solids and Structures 48 (2011) 1229–1238 1233
� Imposing r(emax) = fc under compression in (9) and usingBc ¼ 1
emax;Ac is obtained:
Ac ¼fc � E � Y0
�E � Y0 þ E � emax � eð�1þ Y0emaxÞ: ð13Þ
� To ensure, under compression, that 0 6 D 6 1 it is necessary toimpose that:
0 6 Ac 6 1: ð14Þ
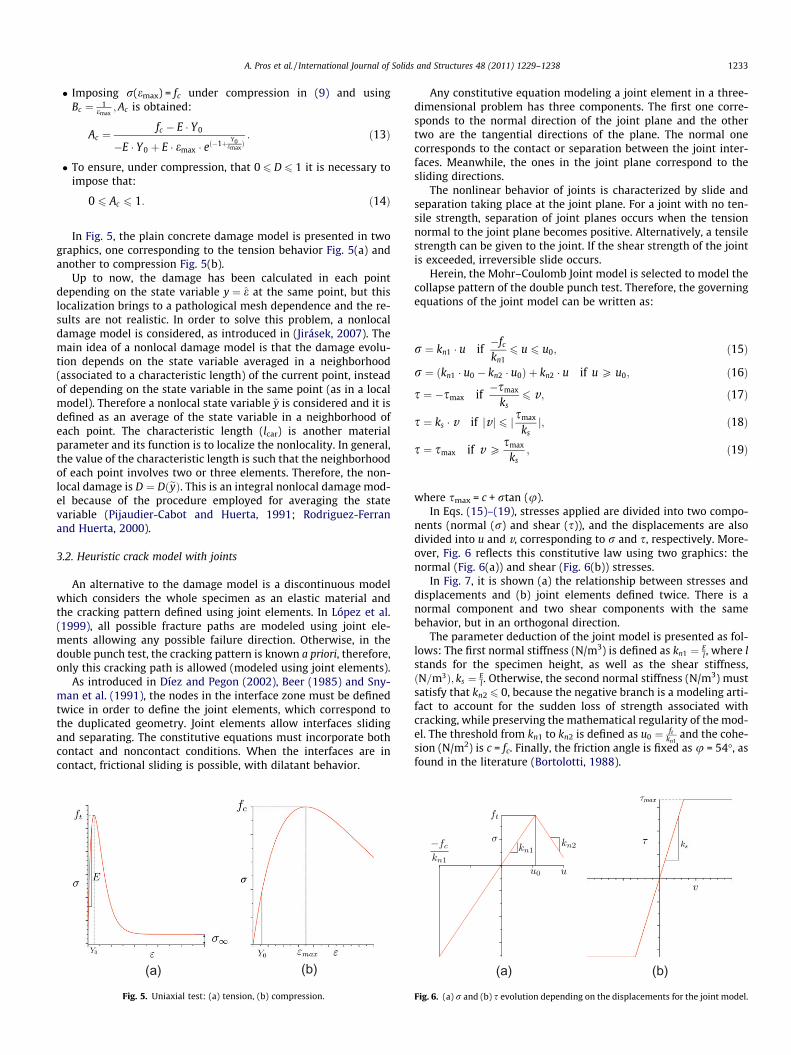
In Fig. 5, the plain concrete damage model is presented in twographics, one corresponding to the tension behavior Fig. 5(a) andanother to compression Fig. 5(b).
Up to now, the damage has been calculated in each pointdepending on the state variable y ¼ e at the same point, but thislocalization brings to a pathological mesh dependence and the re-sults are not realistic. In order to solve this problem, a nonlocaldamage model is considered, as introduced in (Jirásek, 2007). Themain idea of a nonlocal damage model is that the damage evolu-tion depends on the state variable averaged in a neighborhood(associated to a characteristic length) of the current point, insteadof depending on the state variable in the same point (as in a localmodel). Therefore a nonlocal state variable ~y is considered and it isdefined as an average of the state variable in a neighborhood ofeach point. The characteristic length (lcar) is another materialparameter and its function is to localize the nonlocality. In general,the value of the characteristic length is such that the neighborhoodof each point involves two or three elements. Therefore, the non-local damage is D ¼ DðeyÞ. This is an integral nonlocal damage mod-el because of the procedure employed for averaging the statevariable (Pijaudier-Cabot and Huerta, 1991; Rodriguez-Ferranand Huerta, 2000).
3.2. Heuristic crack model with joints
An alternative to the damage model is a discontinuous modelwhich considers the whole specimen as an elastic material andthe cracking pattern defined using joint elements. In López et al.(1999), all possible fracture paths are modeled using joint ele-ments allowing any possible failure direction. Otherwise, in thedouble punch test, the cracking pattern is known a priori, therefore,only this cracking path is allowed (modeled using joint elements).
As introduced in Díez and Pegon (2002), Beer (1985) and Sny-man et al. (1991), the nodes in the interface zone must be definedtwice in order to define the joint elements, which correspond tothe duplicated geometry. Joint elements allow interfaces slidingand separating. The constitutive equations must incorporate bothcontact and noncontact conditions. When the interfaces are incontact, frictional sliding is possible, with dilatant behavior.
(a) (b)
Fig. 5. Uniaxial test: (a) tension, (b) compression.
Any constitutive equation modeling a joint element in a three-dimensional problem has three components. The first one corre-sponds to the normal direction of the joint plane and the othertwo are the tangential directions of the plane. The normal onecorresponds to the contact or separation between the joint inter-faces. Meanwhile, the ones in the joint plane correspond to thesliding directions.
The nonlinear behavior of joints is characterized by slide andseparation taking place at the joint plane. For a joint with no ten-sile strength, separation of joint planes occurs when the tensionnormal to the joint plane becomes positive. Alternatively, a tensilestrength can be given to the joint. If the shear strength of the jointis exceeded, irreversible slide occurs.
Herein, the Mohr–Coulomb Joint model is selected to model thecollapse pattern of the double punch test. Therefore, the governingequations of the joint model can be written as:
r ¼ kn1 � u if�fc
kn16 u 6 u0; ð15Þ
r ¼ ðkn1 � u0 � kn2 � u0Þ þ kn2 � u if u P u0; ð16Þ
s ¼ �smax if�smax
ks6 v; ð17Þ
s ¼ ks � v if jvj 6 j smax
ksj; ð18Þ
s ¼ smax if v Psmax
ks; ð19Þ
where smax = c + rtan (u).In Eqs. (15)–(19), stresses applied are divided into two compo-
nents (normal (r) and shear (s)), and the displacements are alsodivided into u and v, corresponding to r and s, respectively. More-over, Fig. 6 reflects this constitutive law using two graphics: thenormal (Fig. 6(a)) and shear (Fig. 6(b)) stresses.
In Fig. 7, it is shown (a) the relationship between stresses anddisplacements and (b) joint elements defined twice. There is anormal component and two shear components with the samebehavior, but in an orthogonal direction.
The parameter deduction of the joint model is presented as fol-lows: The first normal stiffness (N/m3) is defined as kn1 ¼ E
l , where lstands for the specimen height, as well as the shear stiffness,ðN=m3Þ; ks ¼ E
l . Otherwise, the second normal stiffness (N/m3) mustsatisfy that kn2 6 0, because the negative branch is a modeling arti-fact to account for the sudden loss of strength associated withcracking, while preserving the mathematical regularity of the mod-el. The threshold from kn1 to kn2 is defined as u0 ¼ ft
kn1and the cohe-
sion (N/m2) is c = fc. Finally, the friction angle is fixed as u = 54�, asfound in the literature (Bortolotti, 1988).
(a) (b)
Fig. 6. (a) r and (b) s evolution depending on the displacements for the joint model.

Fig. 7. Stresses applied to a joint model and the corresponding displacements.
Table 2Optimal values of the material parameters of thenonlocal Mazars damage model for the Brazilian test.
Material parameter Value
Y0 1.08 � 10�4
lcar 2 � 10�2 mAt 1Bt 2500Ac 1Bc 266
0 1 2 3x 10⁻⁴
0
2
4
6
8
10x 105
uz (m)
P B (N)
Fig. 8. Brazilian test with the nonlocal Mazars damage model. uz (m) – PB (N).
Fig. 9. Damage distribution at the load peak.
1234 A. Pros et al. / International Journal of Solids and Structures 48 (2011) 1229–1238
4. Numerical results and validation
All the results obtained considering both the continuous andthe discontinuous model are presented. Both the Brazilian testand the double punch test are simulated. Moreover, the resultsare validated and compared with the analytical expressions andwith the experimental data.
4.1. Nonlocal Mazars damage model
For simulating numerically considering the nonlocal Mazarsdamage model, six material parameters must be set: damagethreshold (Y0), characteristic length (lcar), tension parameters (At
and Bt) and compression parameters (Ac and Bc).From the experimental campaign, the value of the compressive
strength obtained through the uniaxial compression test is avail-able, fc = 50.45 MPa. Therefore, through the uniaxial compressiontest, any parameter may be evaluated, but the relation betweenthe two compression parameters is set. Hence, when Ac and Bc sat-isfy the given Eq. (13), the value of the compressive strength is set(fc).
The value given by the experimental campaign from the Brazil-ian test is the tensile strength, ft = 3.84 MPa. Therefore, through theEq. (10), the value of Y0 is set.
Hence, herein, some consideration must be taken into account:
� Y0 ¼ ftE ¼ 3:84�106
35:5�109 ¼ 1:08 � 10�4.
� Considering any value of Ac satisfying 0 6 Ac 6 1 is enough toensure that 0 6 D 6 1 and the chosen value does not influenceon the results, therefore, Ac = 1.� The relationship obtained from the uniaxial compression test
between Ac and Bc must be satisfied (Eq. (13)), considering fc =50.45 MPa. Thus, Bc = 266.� At ¼ 1� r1
E ¼ 1, because the residual strength under tension isr1 = 0 for plain concrete.� Bt = 10000 � (1 + n), with 0 < n < 1, depending on the material.
Hence, Bt = 2500, as appeared in (Rodriguez-Ferran and Huerta,2000).� Observing the specimen size of the test and the expected frac-
ture pattern, the caracteristic length (lcar) is set.
4.1.1. Brazilian testConsidering the previous information for simulating numeri-
cally the Brazilian test, the value of the tensile strength can beobtained (calculated through the value of the maximum verticalload, considering the Eq. (7)). All the material parameters are set
previously, except lcar which depends on the fracture pattern ofthe test and its sizes. Therefore, lcar is set for obtaining the expectedresults. Hence, the optimal material parameters are presented inTable 2.
Vertical displacements are prescribed at the top of the specimenthrough one steel plate, which is modeled as an elastic material.Moreover, both horizontal and vertical symmetric conditions areimposed, thus, only a quarter of the specimen is taken into accountduring the whole simulation.
After the simulation, in Fig. 8, the value of the maximum verti-cal load depending on the vertical displacement is presented and,as expected, the maximum value is PB = 8.8 � 105 N, which corre-sponds to ft = 3.74 MPa (considering the Eq. (7)).
In order to analyze the fracture pattern of the Brazilian test, thedamage distribution obtained numerically is presented in Fig. 9.
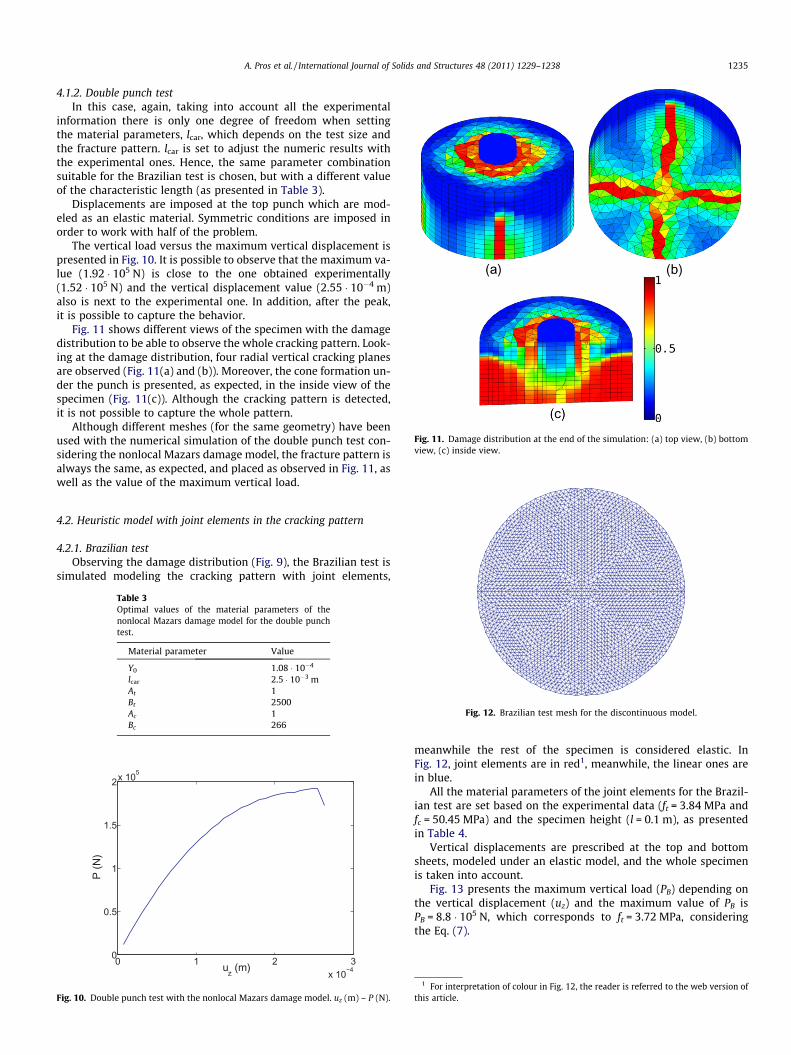
Fig. 11. Damage distribution at the end of the simulation: (a) top view, (b) bottomview, (c) inside view.
A. Pros et al. / International Journal of Solids and Structures 48 (2011) 1229–1238 1235
4.1.2. Double punch testIn this case, again, taking into account all the experimental
information there is only one degree of freedom when settingthe material parameters, lcar, which depends on the test size andthe fracture pattern. lcar is set to adjust the numeric results withthe experimental ones. Hence, the same parameter combinationsuitable for the Brazilian test is chosen, but with a different valueof the characteristic length (as presented in Table 3).
Displacements are imposed at the top punch which are mod-eled as an elastic material. Symmetric conditions are imposed inorder to work with half of the problem.
The vertical load versus the maximum vertical displacement ispresented in Fig. 10. It is possible to observe that the maximum va-lue (1.92 � 105 N) is close to the one obtained experimentally(1.52 � 105 N) and the vertical displacement value (2.55 � 10�4 m)also is next to the experimental one. In addition, after the peak,it is possible to capture the behavior.
Fig. 11 shows different views of the specimen with the damagedistribution to be able to observe the whole cracking pattern. Look-ing at the damage distribution, four radial vertical cracking planesare observed (Fig. 11(a) and (b)). Moreover, the cone formation un-der the punch is presented, as expected, in the inside view of thespecimen (Fig. 11(c)). Although the cracking pattern is detected,it is not possible to capture the whole pattern.
Although different meshes (for the same geometry) have beenused with the numerical simulation of the double punch test con-sidering the nonlocal Mazars damage model, the fracture pattern isalways the same, as expected, and placed as observed in Fig. 11, aswell as the value of the maximum vertical load.
4.2. Heuristic model with joint elements in the cracking pattern
4.2.1. Brazilian testObserving the damage distribution (Fig. 9), the Brazilian test is
simulated modeling the cracking pattern with joint elements,
Table 3Optimal values of the material parameters of thenonlocal Mazars damage model for the double punchtest.
Material parameter Value
Y0 1.08 � 10�4
lcar 2.5 � 10�3 mAt 1Bt 2500Ac 1Bc 266
0 1 2 3x 10⁻⁴
0
0.5
1
1.5
2x 10⁵
uz (m)
P (N
)
Fig. 10. Double punch test with the nonlocal Mazars damage model. uz (m) – P (N).
Fig. 12. Brazilian test mesh for the discontinuous model.
meanwhile the rest of the specimen is considered elastic. InFig. 12, joint elements are in red1, meanwhile, the linear ones arein blue.
All the material parameters of the joint elements for the Brazil-ian test are set based on the experimental data (ft = 3.84 MPa andfc = 50.45 MPa) and the specimen height (l = 0.1 m), as presentedin Table 4.
Vertical displacements are prescribed at the top and bottomsheets, modeled under an elastic model, and the whole specimenis taken into account.
Fig. 13 presents the maximum vertical load (PB) depending onthe vertical displacement (uz) and the maximum value of PB isPB = 8.8 � 105 N, which corresponds to ft = 3.72 MPa, consideringthe Eq. (7).
1 For interpretation of colour in Fig. 12, the reader is referred to the web version ofthis article.

Table 4Values of parameters for the Brazilian test.
Symbol Value
kn1 35:5�109
0:1 N=m3
kn2 �35:5�109
0:1 N=m3
u0 3:84�106
35:5�109 m
ks 35:5�109
0:1 N=m3
ft 3.84 MPac 50.45 MPau 54�
0 1 2 3 4 5 6 7x 10⁻⁵
0
2
4
6
8
10x 105
uz (m)
PB (N
)
Fig. 13. Brazilian test with the joint model: uz (m) – PB (N).
Table 5Values of parameters for the double punch test.
Symbol Value
kn1 35:5�109
0:075 N=m3
kn2 �35:5�109
0:075 N=m3
u0 3:84�106
35:5�109 m
ks 35:5�109
0:075 N=m3
ft 3.84 MPac 50.45 MPau 54�
0 1 2 3 4 5 6x 10⁻⁴
0
0.5
1
1.5
2x 10⁵
Uz (m)
P (N
)
Fig. 15. Double punch test modeled using joint elements considering three crackingplanes: uz (m) – P (N).
1236 A. Pros et al. / International Journal of Solids and Structures 48 (2011) 1229–1238
4.2.2. Double punch testIn order to simulate the double punch test considering the heu-
ristic crack model with joint elements defined here, two differentmeshes are considered (as presented in Fig. 14): one with three ra-dial planes and another with four radial planes.
Although double punch test is modeled in 3D, all joint elementsare two-dimensional and triangular for the fracture planes andquadrilateral for the cone. The tip of the cone is not included inthe mesh because it would be a point defined too many times. Be-sides, three auxiliary planes are defined corresponding to the spec-imen’s cracking planes, but inside the cone. They are necessary todefine properly the joint elements. For the case of four radialplanes, also four auxiliary planes are defined inside the cone (cor-responding to the intersection between the cone and the twodiametral planes).
Firstly, three fracture radial planes are considered. All the mate-rial parameters are set using the experimental data and they arethe same than for the Brazilian test, except the specimen height
(a)Fig. 14. Double punch test including joint elements meshes: (a)
(herein, l = 0.075 m) as presented in Table 5. Moreover, the mate-rial parameters in the auxiliar joint elements inside the cone aredefined in order to not influence on the results.
Vertical displacements are imposed at the top punch which ismodeled as an elastic material. Horizontal symmetric condition istaken into account, thus, only half of the specimen is consideredin the current simulation.
In Fig. 15, the maximum vertical load obtained is presented ver-sus vertical displacement. As observed, it is possible to capture thebehavior after reaching the peak load. The maximum vertical load(1.55 � 105 N) is in the same rang of values than the load obtainedexperimentally (1.52 � 105 N). Moreover, the value of the verticaldisplacements corresponding to the peak load (5.25 � 10�4 m) isalso close to the corresponding experimental value.
It is also observed that both the horizontal displacement (Dh)and the vertical displacement (Dv), corresponding to the peak load,keep the same ratio than the relation between the two cathetus of
(b)three radial cracking planes, (b) four radial cracking planes.

Fig. 16. Double punch test modeled using joint elements considering three cracking planes. Deformed meshes amplified � 10.
0 1 2 3 4 5 6x 10⁻⁴
0
0.5
1
1.5
2x 10⁵
Uz (m)
P (N
)
Fig. 17. Double punch test modeled using joint elements considering four radialcracking planes. uz (m) – P(N).
Table 6Model validation.
Description P (N) Error (P1)(%)
Error (P2)(%)
Error (P3)(%)
Error (Pexp)(%)
P1 1.51 � 105 0 24.4 4.1 0.6P2 2.01 � 105 33.11 0 38.6 32.2P3 1.45 � 105 3.4 27.8 0 5Pexp 1.52 � 105 0.6 24.4 5 0Pcont 1.92 � 105 27 4.5 32 26.3Pdisc3 1.55 � 105 2.7 22.9 6.9 2Pdisc4 1.56 � 105 3.3 22.4 7.6 2.6
A. Pros et al. / International Journal of Solids and Structures 48 (2011) 1229–1238 1237
the cone’s generator triangle. That is, if the horizontal cathetusmeasures ch = 1.875 cm and the vertical one, cv = 3 cm, ch
Dh ¼cvDv is
satisfied.Fig. 16 represents the deformed mesh after the simulation from
different points of views. The cone is penetrating the specimen,meanwhile the three cracking planes are opening in their normaldirections.
Once the results considering three cracking planes defined a pri-ori are analyzed, four radial cracking planes are considered withthe same material parameters (presented in Table 5) than in theprevious case. However, herein, the fracture pattern is different,so the same value of the maximum vertical load under the sameconditions is not expected.
In Fig. 17 the results are presented and it is observed that thebehavior is the same both with three and four radial crackingplanes. Moreover, after the load peak, it is possible to obtain fur-ther results. Besides, the maximum vertical load (1.56 � 105 N) isstill the same as the experimental value, and very close to the valueobtained with three cracking planes. The value of the vertical dis-placement (5.25 � 10�4 m) is also in the expected range of values.
Once all the material parameters are set (for both cases, threeand four radial fracture planes), a geometric parameter is studied:the cone’s height. When defining a priori the fracture pattern,cone’s height is an input. After considering different values of thecone height, it has been found that the value providing results inagreement with the experimental outcome is h = 3 cm. Note thatthis is also coinciding with the cone height observed inexperiments.
4.3. Validation
Considering fc = 50.45 MPa and ft = 3.84 MPa set, in Table 6 allthe numerical results are presented and compared both with ana-lytical expressions and experimental results.
� Analytical expressions:– P1 ¼ ftpð1:2l d
2� d0
2
� �2Þ, from Chen and Yuan (1980).
– P2 ¼ftpð1:2ld2�ð
d02 Þ
2Þ0:75 , from Chen and Yuan (1980).
– P3 ¼ ft9pl d0
2, from Molins et al. (2007).
� Experimental value: Pexp = 1.52 � 105 N
These values are compared to the numerical results consideringthe continuous model, Pcont, and the discontinuous one with threefracture radial planes, Pdisc3, and four fracture radial planes, Pdisc4.

1238 A. Pros et al. / International Journal of Solids and Structures 48 (2011) 1229–1238
The errors are computed considering Error ðPiÞ ¼Pi�Pj
Pi
� 100%,being Pi the maximum vertical load obtained analytically or exper-imentally, and Pj the rest of the values.
5. Concluding remarks
To sum up, all the important conclusions of the present workare presented in the following.
The double punch test has been simulated using two differenttechniques: (a) the nonlocal Mazars damage model and (b) an elas-tic model considering the cracking pattern modeled with joint ele-ments. In both cases, results are as expected, very close to theexperimental and analytical ones (i.e. in the same range of values,as shown in Table 6). These two numerical models are validatedthrough the Brazilian test, taking into account the experimentalinformation from the uniaxial compression test, the Brazilian testand the double punch test.
All the parameters (both the material and the geometrical ones)are set for both numerical models for each test. However, it is notproved that these material parameter combinations are unique.Experimental results are necessary to set all the parameters and,in general, the definition of the test.
After trying different material combinations for the nonlocalMazars damage model, always taking into account all theconditions found during the present work, the optimal parametercombination is found. In this case, the only different parameterfor the two different indirect tension tests (the Brazilian test andthe double punch test) with the same concrete is the characteristiclength which depends on the fracture pattern and the test size.Therefore, lcar is also seen as a numeric parameter which allowsthe numerical results fit with the experimental ones.
For the joint model, it is again observed that with a differentfracture pattern (three or four planes), the same material parame-ters is used. Likewise, for the Brazilian test and the double punchtest, except for the specimen height.
Compared with the available experimental results and some ofthe analytical expressions, the most suitable model is the discon-tinuous one considering both, three and four cracking radial planesbecause fits better the experimental results. However, using thejoint model, it is necessary to know the fracture pattern beforethe simulation. Meanwhile, with the nonlocal Mazars damagemodel, the failure pattern is not set a priori. Moreover, the fracturepattern obtained considering the damage model fits with theexperimental one and the obtained peak value corresponds toother analytical expressions.
Time calculation and computational cost are shorter using thediscontinuous model than with the nonlocal Mazars damagemodel, due to the number of nonlinear elements in each model.
Both the nonlocal Mazars damage model and the model includ-ing joint elements in the cracking pattern are valid alternatives tosimulate the double punch test, which was designed for studyingthe tensile strength (ft) of concrete. Therefore, these numericalsimulations allow to control ft, for any material parameters consid-ering both models. In both cases, ft is an input of the problem andthe maximum vertical load, P, is the output of the problem.
Having at hard these two alternatives allows reproducingnumerically the behavior of the DPT described by different authorsand also with experimental results available.
Up to now, the double punch test has been simulated numeri-cally for plain concrete. Then the next step is including fibers intothese models in order to simulate the double punch test for steelfiber reinforced concrete (a test introduced in Molins et al., 2007and Molins et al., 2009, defined as the Barcelona Test).
Acknowledgements
Authors gratefully acknowledge the financial support of theMinisterio de Fomento, ayudas a la construcción 2006 (ProjectNo. C 59/2006), and the Ministerio de Ciencia e Innovación (ProjectNo. DPI2007-62395).
References
Bazant, Z.P., 2002. Concrete fracture models: testing and practice. EngineeringFracture Mechanics 69, 165–205.
Beer, G., 1985. An isoparametric joint/interface element for finite element analysis.International Journal for Numerical Methods in Engineering 21, 585–600.
Bortolotti, L., 1988. Double-punch test for tensile and compressive strengths inconcrete. IACI Materials Journal 85-M4, 26–32.
Chau, K.T., Wei, X.X., 2000. Finite solid circular cylinders subjected to arbitrarysurface load. Part I: analytic solution. International Journal of Solids andStructures 37, 5707–5732.
Chau, K.T., Wei, X.X., 2000. Finite solid circular cylinders subjected to arbitrarysurface load. Part II: application to double-punch test. International Journal ofSolids and Structures 37, 5733–5744.
Chen, W.F., 1970. Double punch test for tensile strength of concrete. ACI MaterialsJournal 67 (2), 993–995.
Chen, W.F., Ttumbauer, B.E., 1972. Double-punch test and tensile strength ofconcrete. Journal of Materials, American Society of Testing and Materials 7 (2),148–154.
Chen, W.F., Yuan, R.L., 1980. Tensile strength of concrete: double punch test. Journalof Structural Divisions, ASCE 106, 1673–1693.
Díez, P., Pegon, P., 2002. Error assessment of structural computations includingjoints. In: Proceedings of the Fifth World Congress on ComputationalMechanics, July 7–12, Vienna, Austria.
Jirásek, M., 2007. Nonlocal damage mechanics. Damage and Fracture inGeomaterials 11, 993–1021.
Lilliu, G., Van Mier, J.G.M., 1999. Analysis of crack growth in the Brazilian test, inconstruction materials-theory and application. In: Eligehausen, R., (Ed.) H.W.Reinhardt 60th Birthday Commemorative Volume, Novembre 1999, Stutgart,pp. 123–138.
Lilliu, G., Van Mier, J.G.M., 2003. 3D lattice type fracture model for concrete.Engineering Fracture Mechanics 70, 927–941.
López, C.M., Carol, I., Aguado, A., 1999. Estudio de la fractura del hormigón medianteun modelo numérico micromecánico con elementos junta. In: MECOM 99,September 6–10, Mendoza, Argentina.
Marti, P., 1989. Size effect in double-punch test on concrete cylinders. ACI MaterialsJournal 86-M58, 597–601.
Mazars, J., 1986. A description of micro- and macroscale damage of concretestructures. Engineering Fracture Mechanics 25, 729–737.
Molins, C., Aguado, A., Saludes, S., Garcia, T., 2007. New test to control tensionproperties of FRC. In: ECCOMAS Thematic Conference on ComputationalMethods in Tunnelling (EURO:TUN 2007), August 27–29, Vienna, Austria.
Molins, C., Aguado, A., Saludes, S., 2009. Double punch test to control the energydissipation in tension of FRC (Barcelona Test). Materials and Structures 42, 415–425.
Pijaudier-Cabot, G., Huerta, A., 1991. Finite element analysis of bifurcation innonlocal strain softening solids. Computer Methods in Applied Mechanics andEngineering 90, 905–919.
Rodriguez-Ferran, A., Huerta, A., 2000. Error estimation and adaptivity for nonlocaldamage models. International Journal of Solids and Structures 37, 7501–7528.
Snyman, M.F., Bird, W.W., Martin, J.B., 1991. A simple formulation of a dilatant jointelement governed by Coulomb friction. Engineering Computations 8, 215–229.


![IS 456 (2000): Plain and Reinforced Concrete - Code of ... · IS 456 (2000): Plain and Reinforced Concrete - Code of Practice [CED 2: Cement and Concrete] July 2000 ... Tremie concrete](https://img.pdfslide.us/doc/110x75/5af94e397f8b9aac248e3dae/is-456-2000-plain-and-reinforced-concrete-code-of-456-2000-plain-and.jpg)