Embed Size (px)
Citation preview
Numerical modeling of municipalwaste bed incineration
Adrian Chun Hin LaiEnvironmental Process Modelling Centre (EPMC), Nanyang Environment and
Water Research Institute (NEWRI), Nanyang Technological University, Singapore,Singapore, and
Adrian Wing-Keung LawEnvironmental Process Modelling Centre (EPMC), Nanyang Environment and
Water Research Institute (NEWRI), Nanyang Technological University,Singapore and School of Civil and Environmental Engineering,Nanyang Technological University, Singapore, Singapore
AbstractPurpose – Incineration has become increasingly important in many large cities around the world because offast urbanization and population growth. The benefits of energy production and large reduction in the wastevolume to landfills also contribute to its growing adaptation for solid waste management for these cities. Atthe same time, the environmental impact of the pollutant gases emitted from the incineration process is acommon concern for various stakeholders which must be properly addressed. To minimize the pollutant gasemission levels, as well as maximize the energy efficiency, it is critically important to optimize the combustionperformance of an incinerator freeboard which would require the development of reliable approaches basedon computational fluid dynamics (CFD) modeling. A critical task in the CFD modeling of an incineratorfurnace requires the specification of waste characteristics along the moving grate as boundary conditions,which is not available in standard CFD packages at present. This study aims to address this gap bydeveloping a numerical incinerator waste bedmodel.Design/methodology/approach – A one-dimensional Lagrangian model for the incineration waste bedhas been developed, which can be coupled to the furnace CFD model. The changes in bed mass due to drying,pyrolysis, devolatilization and char oxidation are all included in the model. The mass and concentration ofgases produced in these processes through reactions are also predicted. The one-dimensional unsteady energyequations of solid and gas phases, which account for the furnace radiation, conduction, convection and heat ofreactions, are solved by the control volumemethod.Findings – The Lagrangian model is validated by comparing its prediction with the experimental data inthe literature. The predicted waste bed height reduction, temperature profile and gas concentration are inreasonable agreement with the observations.Originality/value – The simplicity and efficiency of the model makes it ideally suitable to be used forcouplingwith the computational furnace model to be developed in future (so as to optimize incinerator designs).
Keyword Numerical modelling
Paper type Research paper
© Adrian Chun Hin Lai and Adrian Wing-Keung Law. Published by Emerald Group PublishingLimited. This article is published under the Creative Commons Attribution (CC BY 4.0) licence.Anyone may reproduce, distribute, translate and create derivative works of this article (for bothcommercial & non-commercial purposes), subject to full attribution to the original publication andauthors. The full terms of this licence may be seen at http://creativecommons.org/licences/by/4.0/legalcode
This research is supported by the National Research Foundation, Prime Minister’s Office, Singapore,and the National Environment Agency, Ministry of the Environment and Water Resources, Singapore,under the Waste-to-Energy Competitive Research Programme (WTE CRP 1601 105).
HFF29,2
504
Received 25April 2018Revised 24 June 2018Accepted 3 July 2018
International Journal of NumericalMethods for Heat & Fluid FlowVol. 29 No. 2, 2019pp. 504-522EmeraldPublishingLimited0961-5539DOI 10.1108/HFF-04-2018-0165
The current issue and full text archive of this journal is available on Emerald Insight at:www.emeraldinsight.com/0961-5539.htm

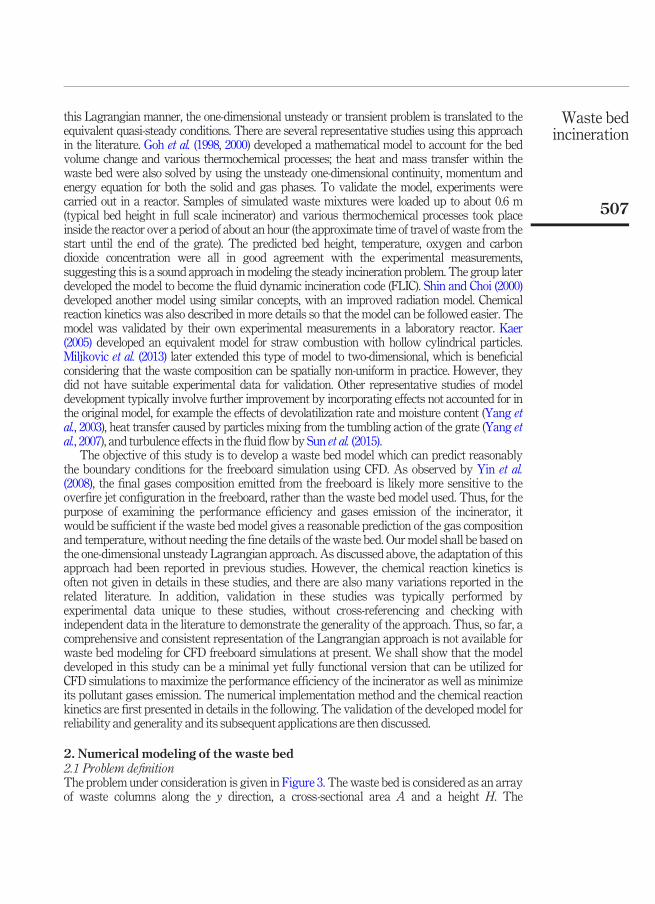
1. IntroductionProper management of municipal solid wastes (MSW) has become increasingly important inmany large cities throughout the world because of fast urbanization and population growth.An efficient alternative of MSW management is through the adaptation of modernincineration, which has the advantages of high volume reduction (approximately 90 percent), low space occupation, relatively stable residues, and potential energy recovery. At thesame time, to be environmentally responsible, incinerator designers and operators mustensure that the air pollutant emission levels resulting from the incineration meet the strictrequirements and regulations of local environmental agencies (Shin et al., 1998).
Globally, a widely used type of incinerator is the moving-grate type (The World Bank,1999) which the solid wastes are transported along the bottom of the incinerator undergoingvarious incineration processes. Gaseous products released from the grate rise and enter thefreeboard above. These gases then react with each other inside the incinerator under hightemperature combustion, and finally the resultant gas mixes are emitted out of thefreeboard; with the final solid products being the bottom ashes which are treated anddisposed. Optimizing the combustion performance of an incinerator freeboard (Figure 1) cangenerally minimize the pollutant gas emission levels. Traditionally, this was solely relied onthe experience of designs over the past decades, based on intuitions developed from a fewestablished thermo-fluid dynamics principles (Niessen, 2002). With the recent advances incomputational power and developments in thermo-fluid dynamics theory, the design ofincinerators can now be greatly assisted by using computational fluid dynamics (CFD). CFDenables the prediction of the detailed flow field as well as temperature and gas distributionof the freeboard for a given incinerator setup, so that designs can be performed with betterscientific basis. Most importantly, optimization of the incinerator design can now be soughtthrough computation before finalizing with pilot and field testing.
To ensure the CFD predictions are sensible and accurate, it is important to implement thecorrect boundary conditions in the simulation. A particularly challenging boundary condition is
Figure 1.Simplified sketch of a
typical incineratorfurnace
Waste bedincineration
505
the moving waste bed at the bottom, which undergoes the complex processes of drying,pyrolysis, gasification and char combustion. Its composition and temperature will hence bevaried along the grate length which is challenging to simulate. A recent approach developed topredict the waste bed characteristics is the particle-based approach, which the waste bed isrepresented by a large group of particles that undergoes various heat and mass transferprocesses including chemical reactions. For example, Brosch et al. (2014) and Wissing et al.(2017) used the discrete element method to represent the waste bed as reacting computationalparticles; conduction, convection, radiation, forces between the particles and the gas phase, andvarious thermochemical processes (drying, pyrolysis, char combustion) are computed for each ofthe particle so that the changes in the particles mass, composition, and temperature are fullyaccounted for. The resulting velocity and concentration of the gas released, and the waste bedtemperature can then act as boundary conditions for the numerical simulations of the freeboard.The approach has been validated by laboratory experiments and field measurements from awaste incinerator plant. Cordiner et al. (2015) used a simplified approach by pre-defining theparticle paths (assuming that the waste bed has a linear reduction in height over the gratelength), so that only the particles thermochemical equations need to be solved without the needto consider the particles equation of motion. The resulting gases product concentration andmomentum are coupled to the CFD model of the freeboard, by representing them as sourceterms in the Eulerian momentum and species transport equations. The model predictions werequalitatively compared with available experimental data, and the comparison showed areasonable agreement in the trend of the waste bed height reduction. In general, particle-basedapproaches produce finer details of the waste bed, and potentially provide insights to problemsthat cannot be handled by other simplifiedmodels (e.g. effects of waste particle size, non-uniformparticle size waste feed); however, the computational time required to complete the simulation isstill excessive for engineering applications at present. Thus, the approach is currently used onlyto consider a limited number of scenarios without the inclusion of the very fine details of thewaste bed, or simply as a tool to obtain the boundary conditions for the freeboard.
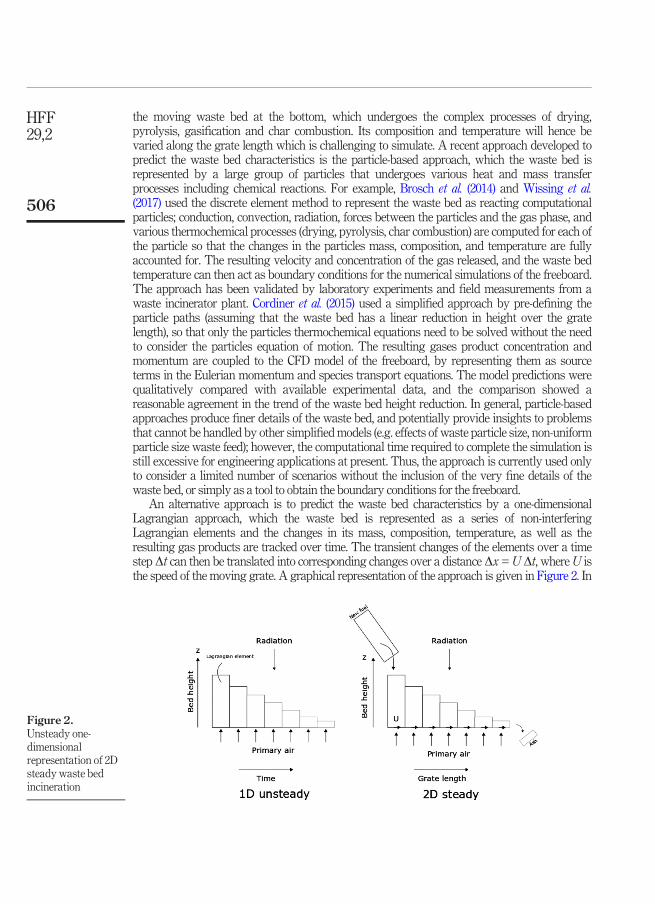
An alternative approach is to predict the waste bed characteristics by a one-dimensionalLagrangian approach, which the waste bed is represented as a series of non-interferingLagrangian elements and the changes in its mass, composition, temperature, as well as theresulting gas products are tracked over time. The transient changes of the elements over a timestepDt can then be translated into corresponding changes over a distanceDx=UDt, whereU isthe speed of the moving grate. A graphical representation of the approach is given in Figure 2. In
Figure 2.Unsteady one-dimensionalrepresentation of 2Dsteadywaste bedincineration
HFF29,2
506
this Lagrangian manner, the one-dimensional unsteady or transient problem is translated to theequivalent quasi-steady conditions. There are several representative studies using this approachin the literature. Goh et al. (1998, 2000) developed a mathematical model to account for the bedvolume change and various thermochemical processes; the heat and mass transfer within thewaste bed were also solved by using the unsteady one-dimensional continuity, momentum andenergy equation for both the solid and gas phases. To validate the model, experiments werecarried out in a reactor. Samples of simulated waste mixtures were loaded up to about 0.6 m(typical bed height in full scale incinerator) and various thermochemical processes took placeinside the reactor over a period of about an hour (the approximate time of travel of waste from thestart until the end of the grate). The predicted bed height, temperature, oxygen and carbondioxide concentration were all in good agreement with the experimental measurements,suggesting this is a sound approach inmodeling the steady incineration problem. The group laterdeveloped the model to become the fluid dynamic incineration code (FLIC). Shin and Choi (2000)developed another model using similar concepts, with an improved radiation model. Chemicalreaction kinetics was also described in more details so that the model can be followed easier. Themodel was validated by their own experimental measurements in a laboratory reactor. Kaer(2005) developed an equivalent model for straw combustion with hollow cylindrical particles.Miljkovic et al. (2013) later extended this type of model to two-dimensional, which is beneficialconsidering that the waste composition can be spatially non-uniform in practice. However, theydid not have suitable experimental data for validation. Other representative studies of modeldevelopment typically involve further improvement by incorporating effects not accounted for inthe original model, for example the effects of devolatilization rate and moisture content (Yang etal., 2003), heat transfer caused by particles mixing from the tumbling action of the grate (Yang etal., 2007), and turbulence effects in the fluidflow by Sun et al. (2015).
The objective of this study is to develop a waste bed model which can predict reasonablythe boundary conditions for the freeboard simulation using CFD. As observed by Yin et al.(2008), the final gases composition emitted from the freeboard is likely more sensitive to theoverfire jet configuration in the freeboard, rather than the waste bed model used. Thus, for thepurpose of examining the performance efficiency and gases emission of the incinerator, itwould be sufficient if the waste bed model gives a reasonable prediction of the gas compositionand temperature, without needing the fine details of the waste bed. Our model shall be based onthe one-dimensional unsteady Lagrangian approach. As discussed above, the adaptation of thisapproach had been reported in previous studies. However, the chemical reaction kinetics isoften not given in details in these studies, and there are also many variations reported in therelated literature. In addition, validation in these studies was typically performed byexperimental data unique to these studies, without cross-referencing and checking withindependent data in the literature to demonstrate the generality of the approach. Thus, so far, acomprehensive and consistent representation of the Langrangian approach is not available forwaste bed modeling for CFD freeboard simulations at present. We shall show that the modeldeveloped in this study can be a minimal yet fully functional version that can be utilized forCFD simulations to maximize the performance efficiency of the incinerator as well as minimizeits pollutant gases emission. The numerical implementation method and the chemical reactionkinetics are first presented in details in the following. The validation of the developed model forreliability and generality and its subsequent applications are then discussed.
2. Numerical modeling of the waste bed2.1 Problem definitionThe problem under consideration is given in Figure 3. The waste bed is considered as an arrayof waste columns along the y direction, a cross-sectional area A and a height H. The
Waste bedincineration
507
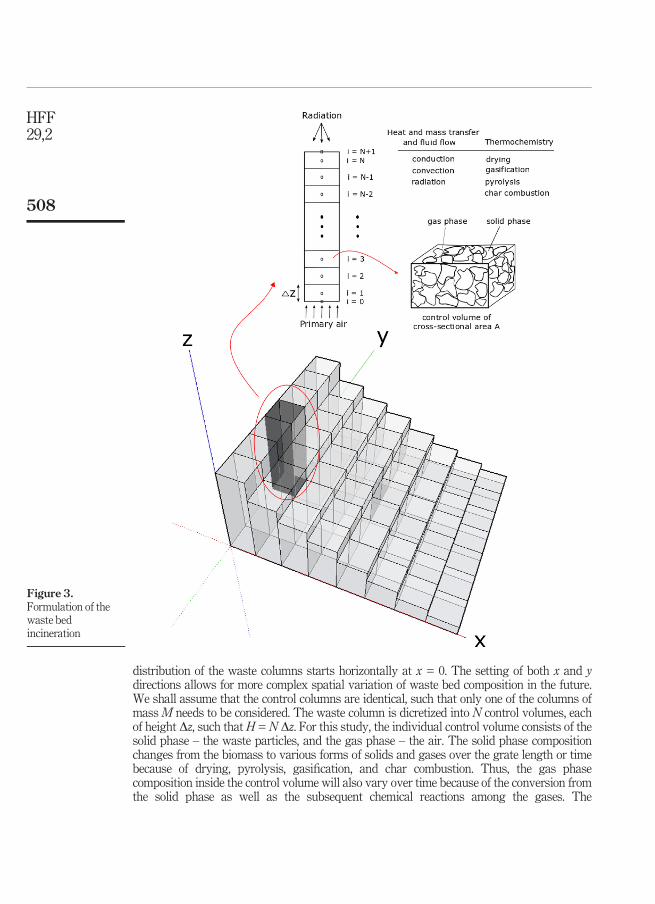
distribution of the waste columns starts horizontally at x = 0. The setting of both x and ydirections allows for more complex spatial variation of waste bed composition in the future.We shall assume that the control columns are identical, such that only one of the columns ofmassM needs to be considered. The waste column is dicretized into N control volumes, eachof height Dz, such that H = N Dz. For this study, the individual control volume consists of thesolid phase – the waste particles, and the gas phase – the air. The solid phase compositionchanges from the biomass to various forms of solids and gases over the grate length or timebecause of drying, pyrolysis, gasification, and char combustion. Thus, the gas phasecomposition inside the control volume will also vary over time because of the conversion fromthe solid phase as well as the subsequent chemical reactions among the gases. The
Figure 3.Formulation of thewaste bedincineration
HFF29,2
508
temperature of the control volume which determines the initiation of the thermochemicalprocess and subsequent reaction rates is mainly governed by the radiation from the furnacewall, which propagates along the waste column. The solid temperature Ts along the columnwill also be changed because of the heat transfer process by conduction, the heat exchangewith the gas phase, and the heat of reactions. The temperature of the gas phase Tg alongthe columnwill changemainly because of conduction, heat of reactions, and the heat exchangewith the solid phase, as well as also the convection from the bottom primary air supply. Thedetails of the governing equations that describe all these processes are given in this section.
2.2 The waste bed mass equation2.2.1 Drying. We consider one of the identical waste columns which the changes in massand temperature over time are to be predicted (which experimentally can be considered as afixed bed reactor). The waste bed massM can be considered to be composed of the mass ofbiomassMbiomass, mass of water (moisture)Mmoisture, and the mass of charMchar. Its rate ofchange over time t can be expressed as:
dMdt
¼ ddt
Mmoisture þMbiomass þMcharð Þ: (1)
The change in moisture content can be represented using the Lewis’ semi-empirical model(Miljkovic et al., 2013) as:
dMmoisture
dt¼ �kdryMmoistureo exp �kdryt
� �; DH ¼ þ40:65 kJ=molð Þ (2)
where Mmoistureo is the initial moisture content, kdry = 5.16 � 10�100b T[Fo]48 and b is anexperimental constant; Miljkovic et al. (2013) used b = 1 in their model, but we found thatb =1.14 yields a better agreement with the experimental data in the literature and is henceadopted in this study. The energy is assumed to be depleted in the drying process wherebythe moisture has been evaporated.
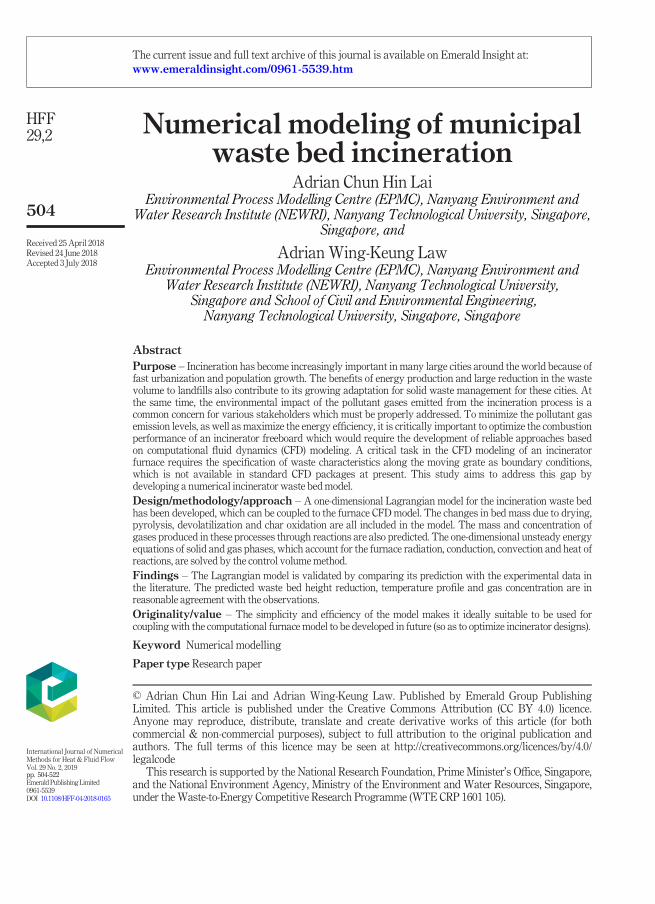
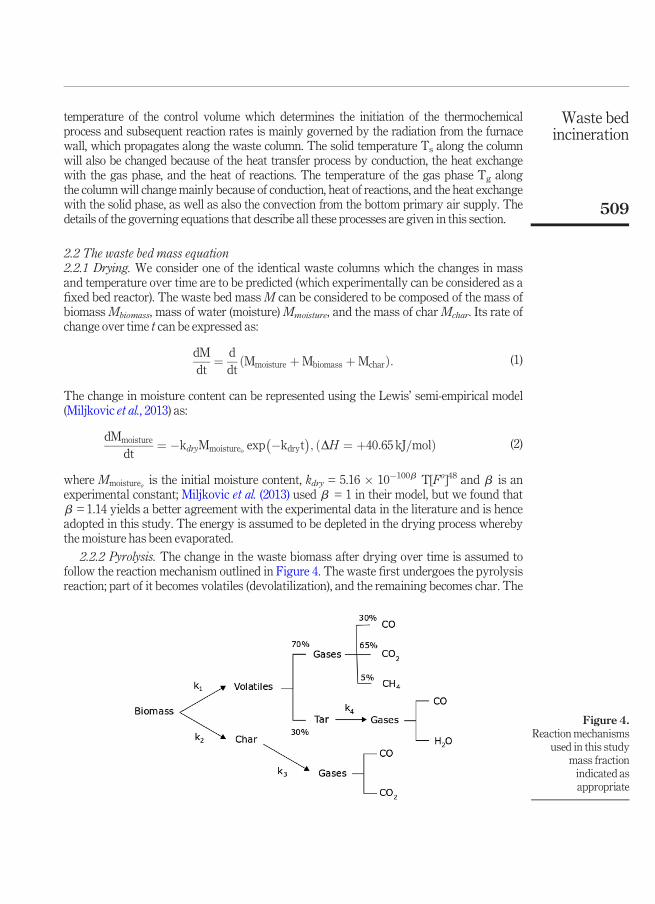
2.2.2 Pyrolysis. The change in the waste biomass after drying over time is assumed tofollow the reaction mechanism outlined in Figure 4. The waste first undergoes the pyrolysisreaction; part of it becomes volatiles (devolatilization), and the remaining becomes char. The
Figure 4.Reactionmechanisms
used in this studymass fractionindicated asappropriate
Waste bedincineration
509

reaction rates for devolatilization k1 and char formation k2 from the biomass are given inShin and Choi (2000) as:
dMvolatile
dt¼ k1Mbiomass¼ 5:16� 106exp �10700=Tsð ÞMbiomass DH ¼�418 kJ=kgð Þ; (3)
and:
dMchar
dt
� �1¼ k2Mbiomass ¼ 2:66� 1010exp �12800=Tsð ÞMbiomass DH ¼�418 kJ=kgð Þ: (4)
The rate of change of the biomass is then given as:
dMbiomass
dt¼ � k1 þ k2ð ÞMbiomass (5)
where the heat of reaction in equations (3) and (4) are given in Yang et al. (2006).2.2.3 Char oxidation. The char (C in this context that represents carbon and not
concentration) will undergo oxidization to become carbon monoxide and carbon dioxide
(Zhou et al., 2005) with the reaction Cþ 1u O2 ! 2 1� 1
u
� �COþ 2
u � 1� �
CO2. Smoot and
Smith (1985) modeled the char oxidation by global modeling, which gave the reaction of asingle char particle as r = vsMpkr j pApCop
n, where Cop is the molar concentration of theoxidizer in the gas phase at the surface of the particle, Ap is the external surface area of thechar particle equivalent sphere, kr is the rate constant for the heterogeneous reaction, Mp isthe molecular weight of the reactant in the char particle, vs is the stoichiometric coefficient toidentify the number of moles of product gas per mole of oxidant, j p is the particle area factorto account for internal surface burning, and n is the apparent order of the reaction. By usingthe Newton’s law of cooling which accounts for the oxidant diffusion rate (to the charsurface), the reaction rate can be expressed as: rp = ApvsMpCog
j pkmkrkmþj pkr
, where km is the masstransfer coefficient. In this study, the model is further simplified such that the reaction rateis expressed in the form of a Arrhenius Equation, described in Zhou et al. (2005) andMiljkovic et al. (2013), and is given as:
dMchar
dt
� �2¼ �Mchark3pO2
¼ �8620 exp �15900Ts
� �McharpO2
DH ¼ �111 kJ=molð Þ;(6)
where Mchar is the mass of the char remaining in the biomass, pO2 is the partial pressureof oxygen in the gas. u ¼ 1 þ 1=rc
1=2 þ 1=rcis the stoichiometric ratio for char combustion,
rc ¼ COCO2
¼ 12exp �3300=Tsð Þ is the ratio of CO-CO2 formation rate. The heat of reaction canbe found in Basu (2010). Together with the char formation rate in Section (2.2.2), the total rateof change of char is then given as.
dMchar
dt¼ dMchar
dt
� �1þ dMchar
dt
� �2
(7)
The accuracy of this simplified model will eventually be justified by comparison withexperimental data in the literature.
HFF29,2
510
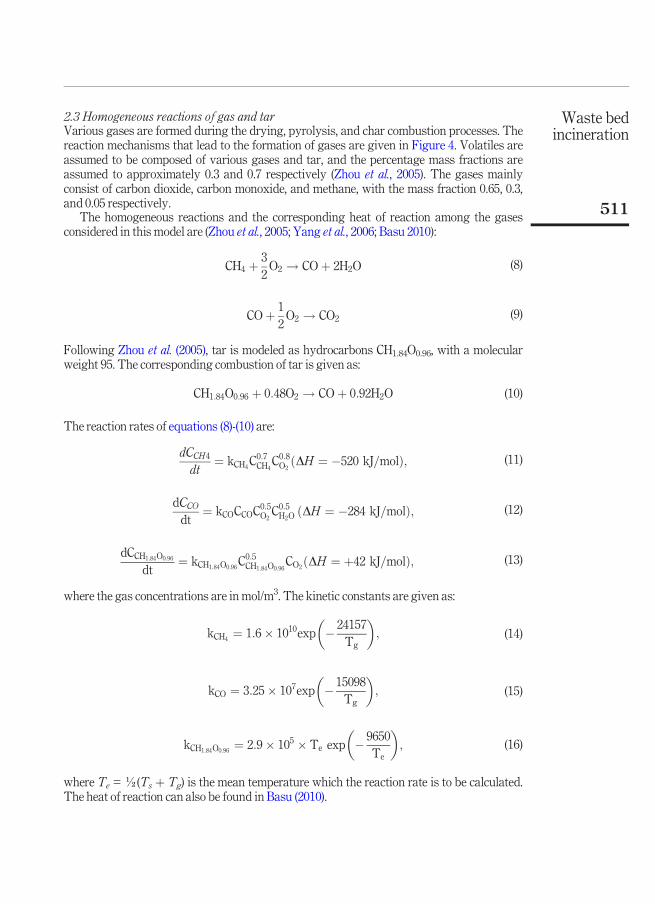
2.3 Homogeneous reactions of gas and tarVarious gases are formed during the drying, pyrolysis, and char combustion processes. Thereaction mechanisms that lead to the formation of gases are given in Figure 4. Volatiles areassumed to be composed of various gases and tar, and the percentage mass fractions areassumed to approximately 0.3 and 0.7 respectively (Zhou et al., 2005). The gases mainlyconsist of carbon dioxide, carbon monoxide, and methane, with the mass fraction 0.65, 0.3,and 0.05 respectively.
The homogeneous reactions and the corresponding heat of reaction among the gasesconsidered in this model are (Zhou et al., 2005; Yang et al., 2006; Basu 2010):
CH4 þ 32O2 ! COþ 2H2O (8)
COþ 12O2 ! CO2 (9)
Following Zhou et al. (2005), tar is modeled as hydrocarbons CH1.84O0.96, with a molecularweight 95. The corresponding combustion of tar is given as:
CH1:84O0:96 þ 0:48O2 ! COþ 0:92H2O (10)
The reaction rates of equations (8)-(10) are:
dCCH4
dt¼ kCH4C
0:7CH4
C0:8O2
DH ¼ �520 kJ=molð Þ; (11)
dCCO
dt¼ kCOCCOC
0:5O2C0:5H2O DH ¼ �284 kJ=molð Þ; (12)
dCCH1:84O0:96
dt¼ kCH1:84O0:96C
0:5CH1:84O0:96
CO2 DH ¼ þ42 kJ=molð Þ; (13)
where the gas concentrations are in mol/m3. The kinetic constants are given as:
kCH4 ¼ 1:6� 1010exp � 24157Tg
� �; (14)
kCO ¼ 3:25� 107exp � 15098Tg
� �; (15)
kCH1:84O0:96 ¼ 2:9� 105 � Te exp � 9650Te
� �; (16)
where Te =½(Ts þ Tg) is the mean temperature which the reaction rate is to be calculated.The heat of reaction can also be found in Basu (2010).
Waste bedincineration
511
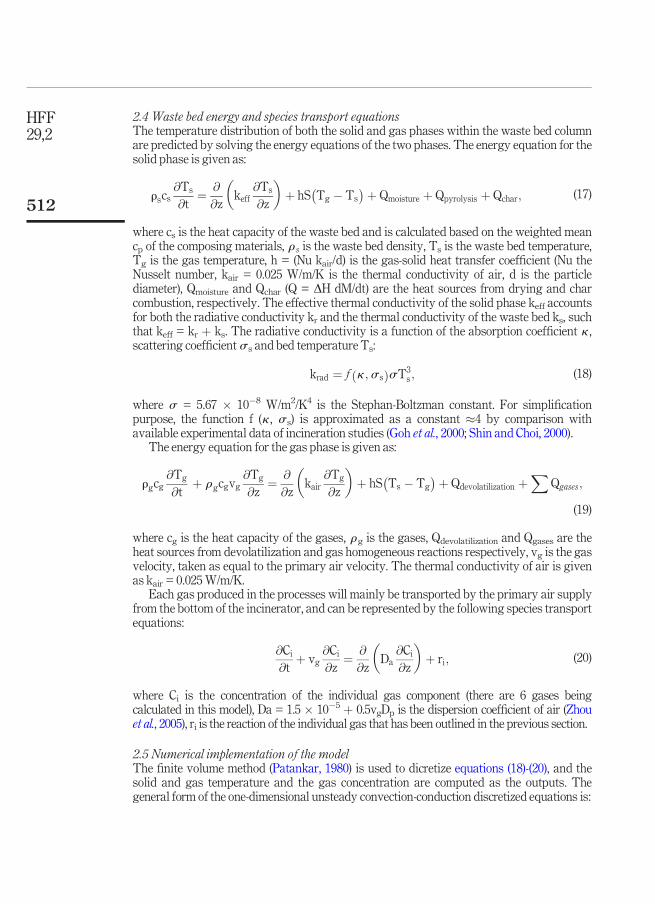
2.4 Waste bed energy and species transport equationsThe temperature distribution of both the solid and gas phases within the waste bed columnare predicted by solving the energy equations of the two phases. The energy equation for thesolid phase is given as:
rscs@Ts
@t¼ @
@zkeff
@Ts
@z
� �þ hS Tg � Ts
� �þ Qmoisture þ Qpyrolysis þ Qchar; (17)
where cs is the heat capacity of the waste bed and is calculated based on the weighted meancp of the composing materials, r s is the waste bed density, Ts is the waste bed temperature,Tg is the gas temperature, h = (Nu kair/d) is the gas-solid heat transfer coefficient (Nu theNusselt number, kair = 0.025 W/m/K is the thermal conductivity of air, d is the particlediameter), Qmoisture and Qchar (Q = DH dM/dt) are the heat sources from drying and charcombustion, respectively. The effective thermal conductivity of the solid phase keff accountsfor both the radiative conductivity kr and the thermal conductivity of the waste bed ks, suchthat keff = kr þ ks. The radiative conductivity is a function of the absorption coefficient k ,scattering coefficient s s and bed temperature Ts:
krad ¼ f k ;s sð ÞsT3s ; (18)
where s = 5.67 � 10�8 W/m2/K4 is the Stephan-Boltzman constant. For simplificationpurpose, the function f (k , s s) is approximated as a constant �4 by comparison withavailable experimental data of incineration studies (Goh et al., 2000; Shin and Choi, 2000).
The energy equation for the gas phase is given as:
rgcg@Tg
@tþ rgcgvg
@Tg
@z¼ @
@zkair
@Tg
@z
� �þ hS Ts � Tg
� �þ Qdevolatilization þX
Qgases;
(19)
where cg is the heat capacity of the gases, rg is the gases, Qdevolatilization and Qgases are theheat sources from devolatilization and gas homogeneous reactions respectively, vg is the gasvelocity, taken as equal to the primary air velocity. The thermal conductivity of air is givenas kair = 0.025W/m/K.
Each gas produced in the processes will mainly be transported by the primary air supplyfrom the bottom of the incinerator, and can be represented by the following species transportequations:
@Ci
@tþ vg
@Ci
@z¼ @
@zDa
@Ci
@z
� �þ ri; (20)
where Ci is the concentration of the individual gas component (there are 6 gases beingcalculated in this model), Da = 1.5 � 10�5 þ 0.5vgDp is the dispersion coefficient of air (Zhouet al., 2005), ri is the reaction of the individual gas that has been outlined in the previous section.
2.5 Numerical implementation of the modelThe finite volume method (Patankar, 1980) is used to dicretize equations (18)-(20), and thesolid and gas temperature and the gas concentration are computed as the outputs. Thegeneral form of the one-dimensional unsteady convection-conduction discretized equations is:
HFF29,2
512
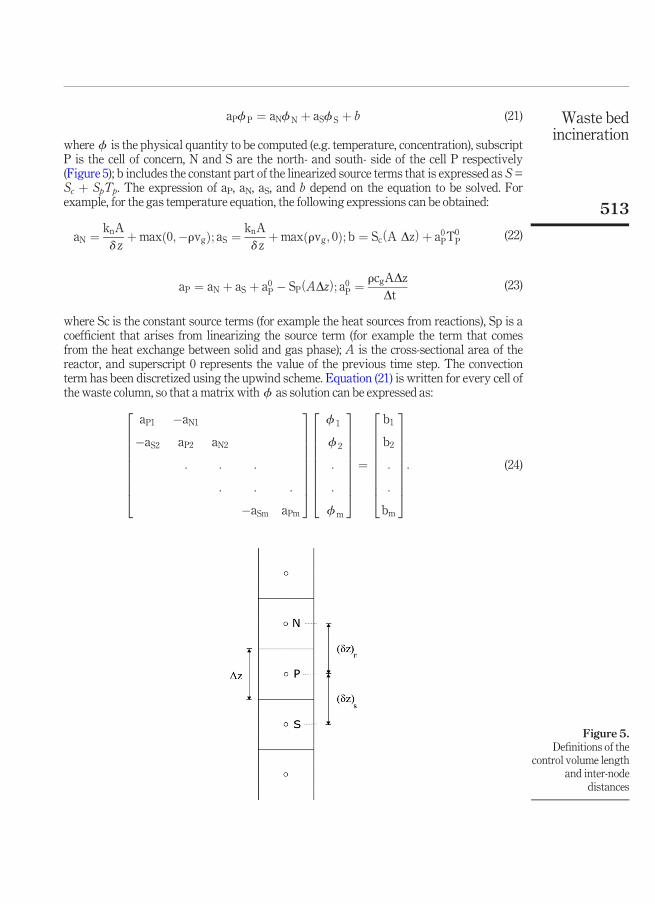
aPf P ¼ aNf N þ aSf S þ b (21)
where f is the physical quantity to be computed (e.g. temperature, concentration), subscriptP is the cell of concern, N and S are the north- and south- side of the cell P respectively(Figure 5); b includes the constant part of the linearized source terms that is expressed as S=Sc þ SpTp. The expression of aP, aN, aS, and b depend on the equation to be solved. Forexample, for the gas temperature equation, the following expressions can be obtained:
aN ¼ knAd z
þmax 0;�rvgð Þ; aS ¼ knAd z
þmax rvg; 0ð Þ; b ¼ Sc A Dzð Þ þ a0PT0P (22)
aP ¼ aN þ aS þ a0P � SP ADzð Þ; a0P ¼ rcgADzDt
(23)
where Sc is the constant source terms (for example the heat sources from reactions), Sp is acoefficient that arises from linearizing the source term (for example the term that comesfrom the heat exchange between solid and gas phase); A is the cross-sectional area of thereactor, and superscript 0 represents the value of the previous time step. The convectionterm has been discretized using the upwind scheme. Equation (21) is written for every cell ofthe waste column, so that a matrix with f as solution can be expressed as:
aP1 �aN1
�aS2 aP2 aN2
: : :
: : :
�aSm aPm
2666666664
3777777775
f 1
f 2
:
:
f m
2666666664
3777777775¼
b1
b2
:
:
bm
2666666664
3777777775: (24)
Figure 5.Definitions of the
control volume lengthand inter-node
distances
Waste bedincineration
513
Boundary conditions (f b is the value of the boundary nodes at one end) can be implementedby setting aP1 = 1, aN1 = 0, and b1 = f b such that f 1 = f b. The boundary value at the otherend can similarly be implemented by setting aPm = 1, aSm = 0. If the boundary value is notgiven but instead the heat flux is specified, an extra equation for their relationship isconstructed to determine the boundary value which will then be fit into the matrix inequation (24). The details of constructing the extra equation can be found in Patankar (1980).
The boundary conditions in this model are implemented as such: for the gas phase, theprimary air temperature and velocity are specified at the waste bed bottom boundary. At thebed top boundary, the temperature gradient is set as zero and the air velocity is assumedto be constant throughout the waste bed. For the solid phase, the bottom temperature is setto be equal to that of the primary air temperature because of intensive heat transfer betweenthe solid and gas phasees (Zhou et al., 2005). At the top of the solid phase, the boundarytemperature is determined by the external convective and radiative heat flux (Park et al.,2010) as follow:
@T@z
¼ h Tg � Ts� �þ ses T4
f � Ts
� �4(25)
where h is the heat transfer coefficient (W/m2K), es = surface emissivity ranging from 0.7 to0.9 (0.85 is adopted in this study), Tf is the temperature of the furnace of the incinerator. Forthe gas species, the gas concentration at the waste bed bottom is set to be the same as that ofair. With respect to the initial conditions, both the gas and solid temperatures are set to bethe same as that of room temperature (T = 300 K). The gas species concentration is also setto be identical to that of air.
In our simulations, the waste bed, typically of height 0.6 m, is discretized into 20 controlvolumes, the time step used is 0.02 s. A total time of 3,600 s is being simulated, which is thetypical duration for the incineration process to be completed. The matrix in equation (24) issolved by the tridiagonal matrix algorithm for every time step.
3. Model validationThe developed model is to be validated with available literature data. Two representativestudies, of on incineration biomass experiments are selected. The waste biomasscomposition differs significantly among the previous studies, which resulted in the verydifferent behavior reported in the literature.
3.1 Incineration of low-density waste biomassGoh et al. (2000) studied the incineration process by carrying out experiments in acylindrical combustion chamber. The height of the chamber was 1.5 m and the internaldiameter was 0.2 m. The simulated wastes consisted of a mixture of wood, cardboard, paperand vegetables. They were piled up to 0.6 m in the combustion chamber. Primary air wassupplied from below the waste bed at a rate of 40 L/min. The furnace temperature, accordingto the experimental results, can reach up to 1200 K, and it was assumed to be the furnacetemperature in this study. Using the measured density and volume fraction of the mixturecomponents, the density of the mixture was calculated to be 190 kg/m3. The gas and solidphase were initially at room temperature, and then the reactor was brought up to the wastebed temperature which started off the various reactions. The temperature at differentheights of the waste bed was then measured. Gases were also produced in the process, andthe gases concentrations were monitored.
HFF29,2
514
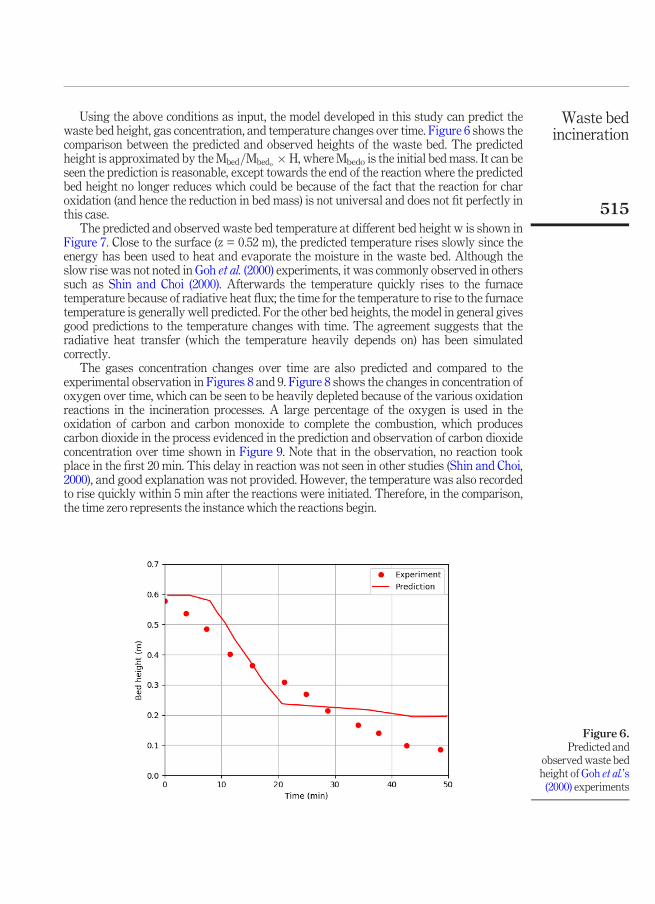
Using the above conditions as input, the model developed in this study can predict thewaste bed height, gas concentration, and temperature changes over time. Figure 6 shows thecomparison between the predicted and observed heights of the waste bed. The predictedheight is approximated by the Mbed=Mbedo � H, where Mbedo is the initial bed mass. It can beseen the prediction is reasonable, except towards the end of the reaction where the predictedbed height no longer reduces which could be because of the fact that the reaction for charoxidation (and hence the reduction in bed mass) is not universal and does not fit perfectly inthis case.
The predicted and observed waste bed temperature at different bed height w is shown inFigure 7. Close to the surface (z = 0.52 m), the predicted temperature rises slowly since theenergy has been used to heat and evaporate the moisture in the waste bed. Although theslow rise was not noted in Goh et al. (2000) experiments, it was commonly observed in otherssuch as Shin and Choi (2000). Afterwards the temperature quickly rises to the furnacetemperature because of radiative heat flux; the time for the temperature to rise to the furnacetemperature is generally well predicted. For the other bed heights, the model in general givesgood predictions to the temperature changes with time. The agreement suggests that theradiative heat transfer (which the temperature heavily depends on) has been simulatedcorrectly.
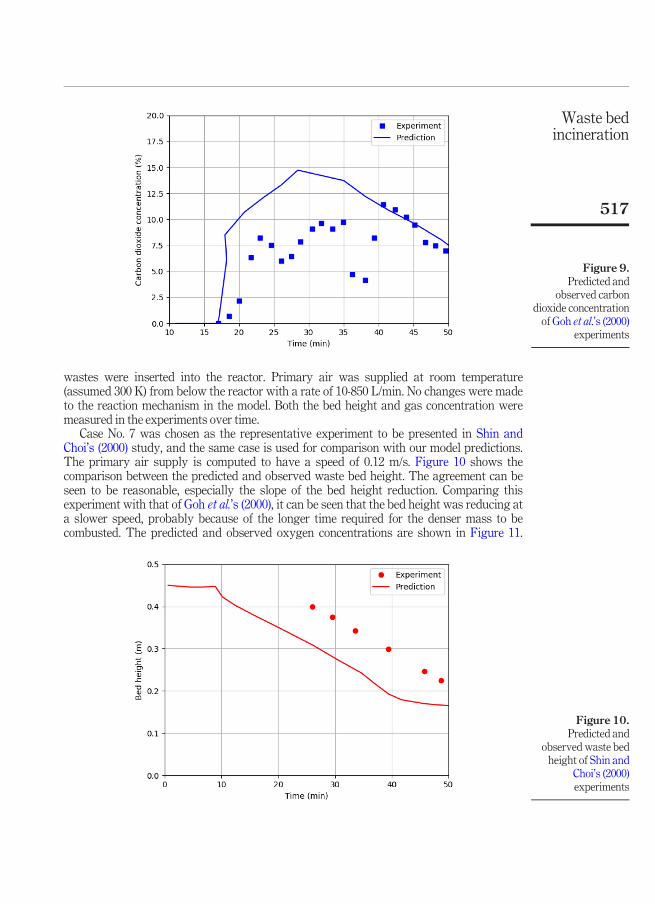
The gases concentration changes over time are also predicted and compared to theexperimental observation in Figures 8 and 9. Figure 8 shows the changes in concentration ofoxygen over time, which can be seen to be heavily depleted because of the various oxidationreactions in the incineration processes. A large percentage of the oxygen is used in theoxidation of carbon and carbon monoxide to complete the combustion, which producescarbon dioxide in the process evidenced in the prediction and observation of carbon dioxideconcentration over time shown in Figure 9. Note that in the observation, no reaction tookplace in the first 20 min. This delay in reaction was not seen in other studies (Shin and Choi,2000), and good explanation was not provided. However, the temperature was also recordedto rise quickly within 5 min after the reactions were initiated. Therefore, in the comparison,the time zero represents the instance which the reactions begin.
Figure 6.Predicted and
observed waste bedheight of Goh et al.’s(2000) experiments
Waste bedincineration
515

3.2 Incineration of high-density waste biomassShin and Choi (2000) studied the incineration process using simulated wastes consisted ofmoisture and wood (which were converted to ashes after reactions). With the givencomposition and assuming the density of wood to be approximately 800 kg/m3, the densityof the simulated wastes is estimated to be 850 kg/m3, which is somewhat denser than thatused in Goh et al. (2000)’s experiments. It is of interest to see whether there is significantdifference in behavior when the waste biomass density varies. The generality of the modelcan also be ensured by comparing the model predictions with measurements in thisindependent study.
In Shin and Choi’s (2000) experiments, the bed of biomass was 0.15 m in diameter, withheight 0.45 m. The temperature of the reactor was first brought up to 1,123 K, and then the
Figure 7.Predicted andobserved waste bedtemperature of Gohet al.’s (2000)experiments
Figure 8.Predicted andobserved oxygenconcentration of Gohet al.’s (2000)experiments
HFF29,2
516
wastes were inserted into the reactor. Primary air was supplied at room temperature(assumed 300 K) from below the reactor with a rate of 10-850 L/min. No changes were madeto the reaction mechanism in the model. Both the bed height and gas concentration weremeasured in the experiments over time.
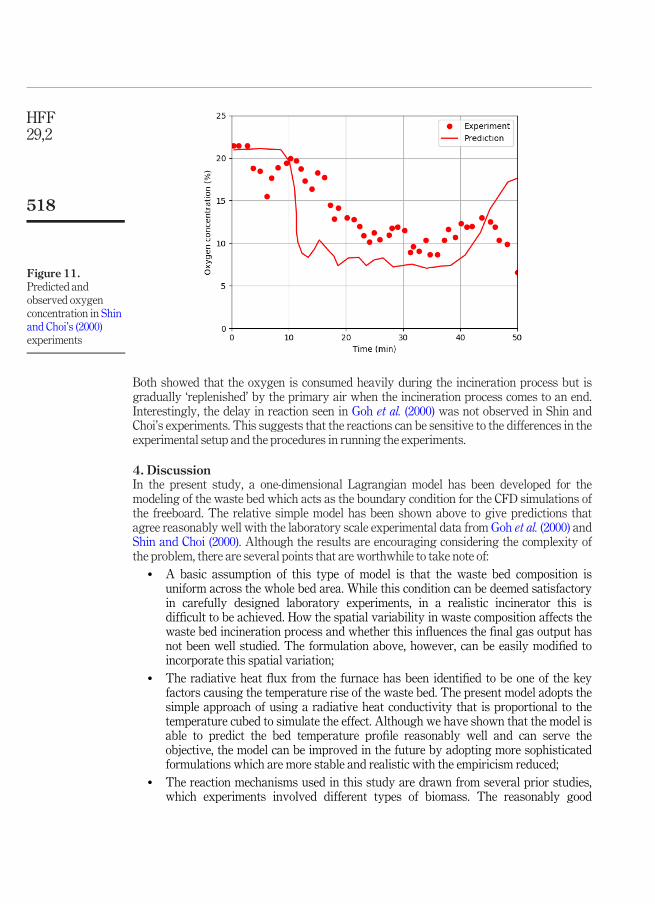
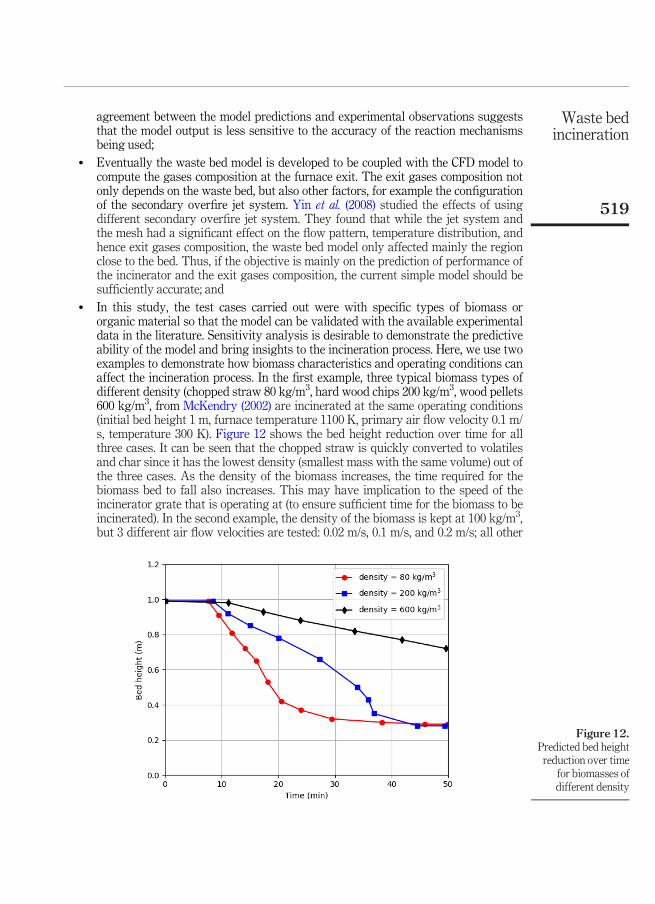
Case No. 7 was chosen as the representative experiment to be presented in Shin andChoi’s (2000) study, and the same case is used for comparison with our model predictions.The primary air supply is computed to have a speed of 0.12 m/s. Figure 10 shows thecomparison between the predicted and observed waste bed height. The agreement can beseen to be reasonable, especially the slope of the bed height reduction. Comparing thisexperiment with that of Goh et al.’s (2000), it can be seen that the bed height was reducing ata slower speed, probably because of the longer time required for the denser mass to becombusted. The predicted and observed oxygen concentrations are shown in Figure 11.
Figure 9.Predicted and
observed carbondioxide concentrationof Goh et al.’s (2000)
experiments
Figure 10.Predicted and
observed waste bedheight of Shin and
Choi’s (2000)experiments
Waste bedincineration
517
Both showed that the oxygen is consumed heavily during the incineration process but isgradually ‘replenished’ by the primary air when the incineration process comes to an end.Interestingly, the delay in reaction seen in Goh et al. (2000) was not observed in Shin andChoi’s experiments. This suggests that the reactions can be sensitive to the differences in theexperimental setup and the procedures in running the experiments.
4. DiscussionIn the present study, a one-dimensional Lagrangian model has been developed for themodeling of the waste bed which acts as the boundary condition for the CFD simulations ofthe freeboard. The relative simple model has been shown above to give predictions thatagree reasonably well with the laboratory scale experimental data from Goh et al. (2000) andShin and Choi (2000). Although the results are encouraging considering the complexity ofthe problem, there are several points that are worthwhile to take note of:
� A basic assumption of this type of model is that the waste bed composition isuniform across the whole bed area. While this condition can be deemed satisfactoryin carefully designed laboratory experiments, in a realistic incinerator this isdifficult to be achieved. How the spatial variability in waste composition affects thewaste bed incineration process and whether this influences the final gas output hasnot been well studied. The formulation above, however, can be easily modified toincorporate this spatial variation;
� The radiative heat flux from the furnace has been identified to be one of the keyfactors causing the temperature rise of the waste bed. The present model adopts thesimple approach of using a radiative heat conductivity that is proportional to thetemperature cubed to simulate the effect. Although we have shown that the model isable to predict the bed temperature profile reasonably well and can serve theobjective, the model can be improved in the future by adopting more sophisticatedformulations which are more stable and realistic with the empiricism reduced;
� The reaction mechanisms used in this study are drawn from several prior studies,which experiments involved different types of biomass. The reasonably good
Figure 11.Predicted andobserved oxygenconcentration in Shinand Choi’s (2000)experiments
HFF29,2
518
agreement between the model predictions and experimental observations suggeststhat the model output is less sensitive to the accuracy of the reaction mechanismsbeing used;
� Eventually the waste bed model is developed to be coupled with the CFD model tocompute the gases composition at the furnace exit. The exit gases composition notonly depends on the waste bed, but also other factors, for example the configurationof the secondary overfire jet system. Yin et al. (2008) studied the effects of usingdifferent secondary overfire jet system. They found that while the jet system andthe mesh had a significant effect on the flow pattern, temperature distribution, andhence exit gases composition, the waste bed model only affected mainly the regionclose to the bed. Thus, if the objective is mainly on the prediction of performance ofthe incinerator and the exit gases composition, the current simple model should besufficiently accurate; and
� In this study, the test cases carried out were with specific types of biomass ororganic material so that the model can be validated with the available experimentaldata in the literature. Sensitivity analysis is desirable to demonstrate the predictiveability of the model and bring insights to the incineration process. Here, we use twoexamples to demonstrate how biomass characteristics and operating conditions canaffect the incineration process. In the first example, three typical biomass types ofdifferent density (chopped straw 80 kg/m3, hard wood chips 200 kg/m3, wood pellets600 kg/m3, from McKendry (2002) are incinerated at the same operating conditions(initial bed height 1 m, furnace temperature 1100 K, primary air flow velocity 0.1 m/s, temperature 300 K). Figure 12 shows the bed height reduction over time for allthree cases. It can be seen that the chopped straw is quickly converted to volatilesand char since it has the lowest density (smallest mass with the same volume) out ofthe three cases. As the density of the biomass increases, the time required for thebiomass bed to fall also increases. This may have implication to the speed of theincinerator grate that is operating at (to ensure sufficient time for the biomass to beincinerated). In the second example, the density of the biomass is kept at 100 kg/m3,but 3 different air flow velocities are tested: 0.02 m/s, 0.1 m/s, and 0.2 m/s; all other
Figure 12.Predicted bed heightreduction over time
for biomasses ofdifferent density
Waste bedincineration
519
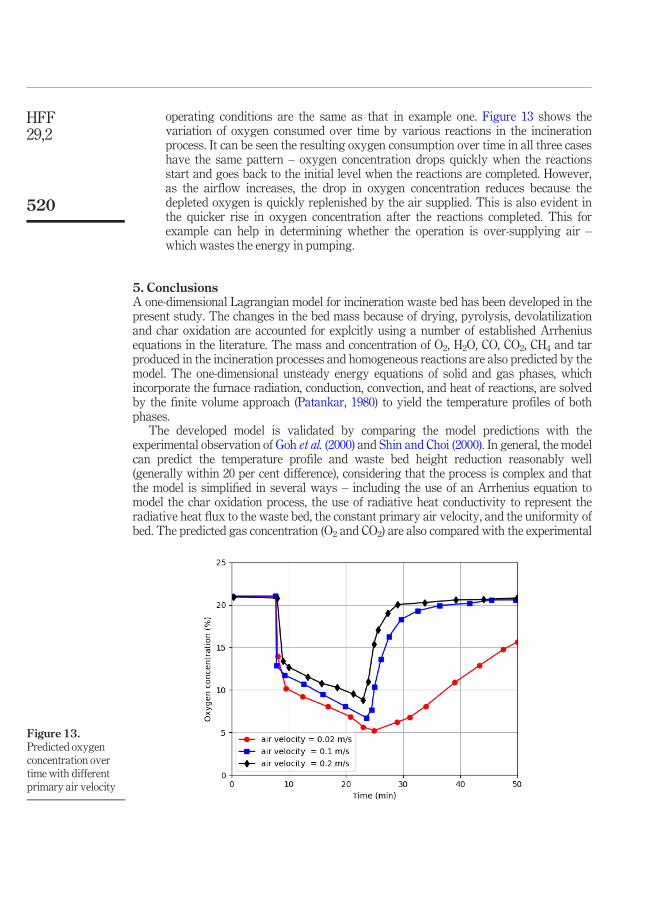
operating conditions are the same as that in example one. Figure 13 shows thevariation of oxygen consumed over time by various reactions in the incinerationprocess. It can be seen the resulting oxygen consumption over time in all three caseshave the same pattern – oxygen concentration drops quickly when the reactionsstart and goes back to the initial level when the reactions are completed. However,as the airflow increases, the drop in oxygen concentration reduces because thedepleted oxygen is quickly replenished by the air supplied. This is also evident inthe quicker rise in oxygen concentration after the reactions completed. This forexample can help in determining whether the operation is over-supplying air –which wastes the energy in pumping.
5. ConclusionsA one-dimensional Lagrangian model for incineration waste bed has been developed in thepresent study. The changes in the bed mass because of drying, pyrolysis, devolatilizationand char oxidation are accounted for explcitly using a number of established Arrheniusequations in the literature. The mass and concentration of O2, H2O, CO, CO2, CH4 and tarproduced in the incineration processes and homogeneous reactions are also predicted by themodel. The one-dimensional unsteady energy equations of solid and gas phases, whichincorporate the furnace radiation, conduction, convection, and heat of reactions, are solvedby the finite volume approach (Patankar, 1980) to yield the temperature profiles of bothphases.
The developed model is validated by comparing the model predictions with theexperimental observation of Goh et al. (2000) and Shin and Choi (2000). In general, the modelcan predict the temperature profile and waste bed height reduction reasonably well(generally within 20 per cent difference), considering that the process is complex and thatthe model is simplified in several ways – including the use of an Arrhenius equation tomodel the char oxidation process, the use of radiative heat conductivity to represent theradiative heat flux to the waste bed, the constant primary air velocity, and the uniformity ofbed. The predicted gas concentration (O2 and CO2) are also compared with the experimental
Figure 13.Predicted oxygenconcentration overtime with differentprimary air velocity
HFF29,2
520
observation. Overall, the depletion of oxygen and the rise of carbon dioxide level arereasonably well predicted by the model. The difference between the model prediction andobservation is also generally within 20 per cent. The reasonable agreement indicates that thekey processes of incineration have been captured. Subsequently, a sensitivity analysis iscarried out to study the effects of different biomass density and airflow velocity. It is foundthat a denser biomass generally requires more time for the incineration process to completeand the waste bed height to fall; the time for the incineration process to complete must beconsidered when designing for the speed of the moving grate. The air velocity effect has alsobeen studied. Increasing the air supply rate results in less oxygen concentration depletionduring the reaction and quicker replenishment of oxygen after the reactions. The model canthus help in determining the air needed in the incineration process and avoid over-supplyingair –which wastes energy in pumping.
Finally, it should be noted that quite often the performance of the incinerator and thefurnace exit gases concentration are the main concerns. Yin et al. (2008) showed that theprediction of the exit gases concentration is more affected by the secondary overfire jetsystem configuration and the computational mesh, rather than the bed model used. As theobjective of this study is to develop a model for the waste bed to couple with thecomputational CFD model of the furnace, the present model should be sufficiently accurateand efficient for this purpose.
ReferencesBasu, P. (2010), Biomass Gasification and Pyrolysis: Practical Design and Theory, Elsevier, New York,
NY.
Brosch, B., Scherer, V. and Wirtz, S. (2014), “Simulation of municipal solid waste incineration in gratefiring systems with a particle based novel discrete element method”, VGB Powertech, Vol. 1No. 2, pp. 75
Cordiner, S., Manni, A., Mulone, V. and Rocco, V. (2015), “Biomass furnace study via 3D numericalmodeling”, International Journal of Numerical Methods for Heat and Fluid Flow, Vol. 26 No. 2,pp. 515-533.
Goh, Y.R., Yang, Y.B., Zakaria, R., Siddall, R.G., Nasserzadeh, V. and Swithenbank, J. (2000),“Development of an incinerator bed model for municipal solid waste incineration”, CombustionScience and Technology, Vol. 162 No. 1, pp. 37-58.
Goh, Y.R., Siddall, R.G., Nasserzadeh, V., Zakaria, R., Swithenbank, J., Lawrence, D., Garrod, N. andJones, B. (1998), “Mathematical modelling of the burning bed of a waste incinerator”, Journal ofthe Institute of Energy, Vol. 71 No. 487, pp. 110-118.
Kaer, S.K. (2005), “Straw combustion on slow-moving grates-a comparison of model predictions withexperimental data”, Biomass and Bioenergy, Vol. 28, pp. 307-320.
McKendry, P. (2002), “Energy production from biomass (part 1): overview of biomass”, BioresourceTechnology, Vol. 83 No. 1, pp. 37-46.
Miljkovic, B., Pesenjanski, I. and Vicevic, M. (2013), “Mathematical modelling of straw combustion in amoving bed combustor: a two dimensional approach”, Fuel, Vol. 104, pp. 351-364.
Niessen, W.R. (2002), Combustion and Incineration Processes: Applications in EnvironmentalEngineering, 3rd ed., CRC Press, Florida.
Park, W.C., Atreya, A. and Baum, H.R. (2010), “Experimental and theoretical investigation of heat andmass transfer processes during wood pyrolysis”, Combustion and Flame, Vol. 157 No. 3,pp. 481-494.
Patankar, S.V. (1980),Numerical Heat Transfer and Fluid Flow, CRC Press, FL.
Waste bedincineration
521
Shin, D. and Choi, S. (2000), “The combustion of simulated waste particles in a fixed bed”, Combustionand Flame, Vol. 121 Nos 1/2, pp. 167-180.
Shin, D., Ryu, C.K. and Choi, S. (1998), “Computational fluid dynamics evaluation of good combustionperformance in waste incinerators”, Journal of the Air and Waste Management Association,Vol. 48 No. 4, pp. 345-351.
Smoot, L.D. and Smith, P.J. (1985), Coal Combustion and Gasification, Plenum Press, New York, NY.Sun, R., Ismail, T.M., Ren, X. and El-Salam, M.A. (2015), “Numerical and experimental studies on effects
of moisture content on combustion characteristics of simulated municipal solid wastes in a fixedbed”,WasteManagement, Vol. 39, pp. 166-178.
TheWorld Bank (1999), “Municipal solid waste incineration”,World Bank Technical Guidance Report.Wissing, F., Wirtz, S. and Scherer, V. (2017), “Simulating municipal solid waste incineration with a
DEM/CFD method–influences of waste properties, grate and furnace design”, Fuel, Vol. 206,pp. 638-656.
Yang, Y.B., Sharifi, V.N. and Swithenbank, J. (2007), “Converting moving-grate incineration fromcombustion to gasification–numerical simulation of the burning characteristics”, WasteManagement, Vol. 27 No. 5, pp. 645-655.
Yang, Y.B., Yamauchi, H., Nasserzadeh, V. and Swithenbank, J. (2003), “Effects of fuel devolatilisationon the combustion of wood chips and incineration of simulated municipal solid wastes in apacked bed”, Fuel, Vol. 82 No. 18, pp. 2205-2221.
Yang, Y.B., Phan, A.N., Ryu, C.K., Sharifi, V. and Swithenbank, J. (2006), “Mathematical modelling ofslow pyrolysis of segregated solid wastes in a packed-bed pyrolyser”, Fuel, Vol. 86 Nos 1/2,pp. 169-180.
Yin, C., Rosendahl, L.A., Kær, S.K., Clausen, S., Hvid, S.L. and Hille, T. (2008), “Mathematical modellingand experimental study of biomass combustion in athermal 108 MW grate-fired boiler”, Energyand Fuels, Vol. 22 No. 2, pp. 1380-1390.
Zhou, H., Jensen, A.D., Glarborg, P., Jensen, P.A. and Kavaliauskas, A. (2005), “Numerical modeling ofstraw combustion in a fixed bed”, Fuel, Vol. 84 No. 4, pp. 389-403.
Further readingKaer, S.K. (2004), “Numerical modelling of a straw-fired grate boiler”, Fuel, Vol. 83 No. 9, pp. 1183-1190.Ryu, C., Shin, D. and Choi, S. (2001), “Effect of fuel layer mixing in waste bed combustion”, Advances in
Environmental Research, Vol. 5 No. 3, pp. 259-267.Ryu, C., Shin, D. and Choi, S. (2002), “Combined simulation of combustion and gas flow in a grate-type
incinerator”, Journal of the Air andWaste Management Association, Vol. 52 No. 2, pp. 189-197.Ryu, C., Yang, Y.B., Nasserzadeh, V. and Swithenbank, J. (2004), “Thermal reaction modeling of a large
municipal solid waste incinerator”, Combustion Science and Technology, Vol. 176 No. 11,pp. 1891-1907.
Yu, Z., Ma, X. and Liao, Y. (2010), “Mathematical modeling of combustion in a grate-fired boiler burningstraw and effect of operating conditions under air-and oxygen-enriched atmospheres”,Renewable Energy, Vol. 35 No. 5, pp. 895-903.
Corresponding authorAdrian Chun Hin Lai can be contacted at: [email protected]
For instructions on how to order reprints of this article, please visit our website:www.emeraldgrouppublishing.com/licensing/reprints.htmOr contact us for further details: [email protected]
HFF29,2
522