Embed Size (px)
Citation preview
JOURNAL OF AIRCRAFT
Vol. 43, No. 1, January–February 2006
Numerical Method for Cost-Weight Optimizationof Stringer–Skin Panels
R. Curran∗
Queen’s University Belfast, Belfast, Northern Ireland BT9 5AG, United KingdomA. Rothwell†
Delft University of Technology, Kluyverweg 1, Delft, The Netherlandsand
S. Castagne‡
Queen’s University Belfast, Belfast, Northern Ireland BT9 5AG, United Kingdom
The need to integrate cost into the early product definition process as an engineering parameter is addressed.The application studied is a fuselage panel that is typical for commercial transport regional jets. Consequently, asemi-empirical numerical analysis using reference data was coupled to model the structural integrity of thin-walledstructures with regard to material failure and buckling: skin, stringer, flexural, and interrivet. The optimizationprocess focuses on direct operating cost (DOC) as a function of acquisition cost and fuel burn. It was found that theratio of acquisition cost to fuel burn was typically 4:3 and that there was a 10% improvement in the DOC for theminimal DOC condition over the minimal weight condition because of the manufacturing cost saving from havinga reduced number of larger-area stringers and a slightly thicker skin than that preferred by the minimal weightcondition. Also note that the minimal manufacturing cost condition was slightly better than the minimal weightcondition, which highlights the key finding: The traditional minimal weight condition is a dated and suboptimalapproach to airframe structural design.
Nomenclatureb = stringer pitchCi = total cost for part family iCl
i = labor cost for part family iCm
i = material cost for part family iCpanel = total cost of the panelcl
i = time factor, h/unitcm
i = material cost coefficient, $/unitcm
2024 = material cost coefficient for 2024 T3 aluminum, $/gE = elastic modulush = stringer heighth f = frame heightKF = flexural buckling coefficientKL = local buckling coefficientk = radius of gyration of stringer with attached skinL = lengthL F = frame pitchl f = frame flange lengthnstringers = number of stringersr l
i = labor rate, $/hrp = rivet pitcht = thicknesst̄ = equivalent (smeared) thickness
Presented as Paper 2004-2018 at the AIAA/ASMA/ASCE/AHS/ASC45th Structures, Structural Dynamics, and Materials Conference, PalmSprings, CA, 19–22 April 2004; received 3 September 2004; accepted forpublication 21 October 2004. Copyright c© 2005 by R. Curran. Publishedby the American Institute of Aeronautics and Astronautics, Inc., with per-mission. Copies of this paper may be made for personal or internal use,on condition that the copier pay the $10.00 per-copy fee to the CopyrightClearance Center, Inc., 222 Rosewood Drive, Danvers, MA 01923; includethe code 0021-8669/06 $10.00 in correspondence with the CCC.
∗Senior Lecturer, School of Aeronautical Engineering, David Keir Build-ing, Stranmillis Road. Member AIAA.
†Professor, Structures and Computational Mechanics, Faculty ofAerospace Engineering.
‡Research Assistant, Centre of Excellence for Integrated Aircraft Tech-nologies, School of Aeronautical Engineering, David Keir Building, Stran-millis Road. Member AIAA.
V f = frame volumeW = widthwcleats = average weight of one cleat, gη = of the panelρ = densityσL = buckling stressσVM = von Mises equivalent stressτ = applied shear stressesτB = buckling stress in pure shear
Introduction
T HIS paper presents the initial findings of a research study intothe development of a numerical approach to the cost-weight op-
timization of aircraft stringer–skin panels. A key aim of the work isthe development of a methodology that facilitates the optimal choiceof design variables, with the ultimate objective function of mini-mizing the direct operating cost (DOC) of transporting that givenweight of the aircraft structure during the aircraft’s life span. Es-sentially, the optimization process considers the structural require-ments, structural configuration, and manufacturing cost in generat-ing a design that minimizes the cost to the airline operator. However,the study does not consider maintenance issues, nonrecurring costs,etc.
Literature Review: Cost Integrated DesignIt is well documented in the literature that cost is an important at-
tribute of any product and highly relevant to the engineering designprocess.1,2 Sheldon et al. have stated that customer affordability,product quality, and market timeliness are the three key elements ofcompetitiveness.3 They also point out that there are two fundamen-tal engineering approaches to controlling cost, namely, 1) designingfor cost and 2) costing for design. Within the aerospace commu-nity, Dean is well known for promoting such considerations withinNASA (see Ref. 4). Although Sheldon et al. define the design forcost (DFC) methodology as being driven by management imposedcost targets, this is usually referred to specifically as design to cost(DTC),5 implying that a cost target is to be met and adhered to.DFC is taken generally to mean that the design process is mind-ful of cost. Many authors now believe that imposing strict target
264
CURRAN, ROTHWELL, AND CASTAGNE 265
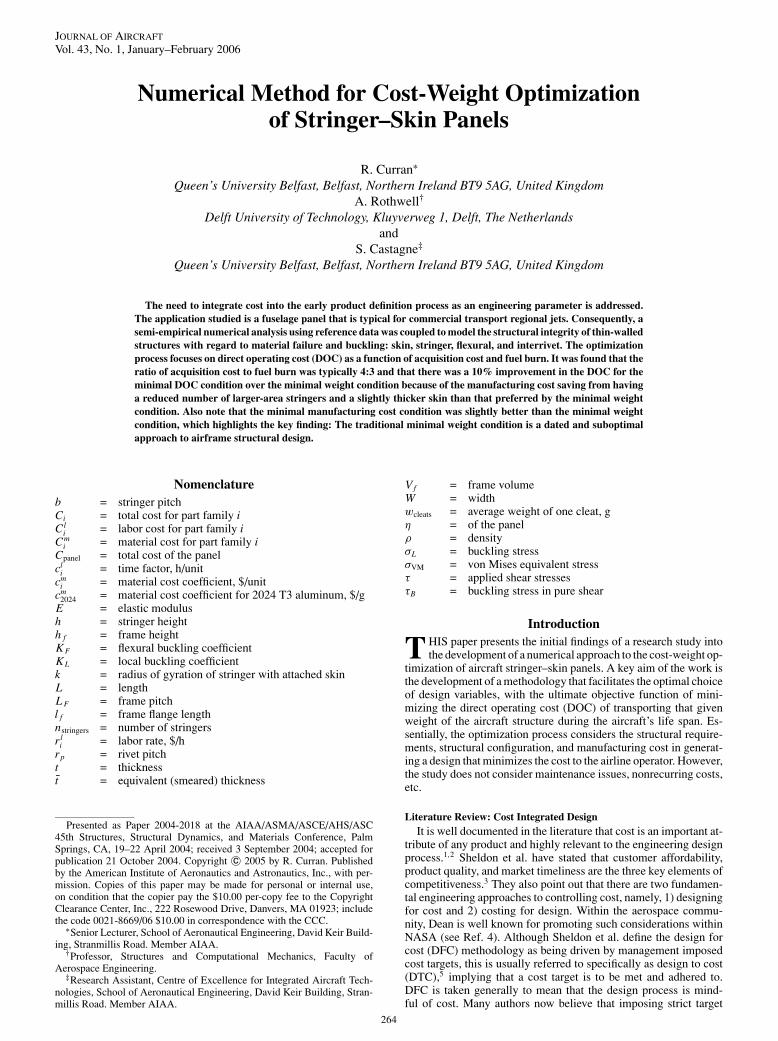
Fig. 1 Typical generic model of design-oriented cost model.
costing on engineering design, as for DTC, is not effective be-cause it tends to result in inferior design that still overshoots thepoor cost estimates used as guidance.6 Rather, it seems to be moreimportant to give designers supportive costing tools that facilitatethe product definition process by linking design decisions to costimpact.
Figure 1 shows a typical generic model of a cost-estimating toolthat can be used within the design domain.7 However, most ofthese DFC/DTC tools are bespoke and highly customized withinthe aerospace industry.8 For example, Geiger and Dilts have pre-sented an automated DTC tool that can be linked to a CAD pack-age to provide the estimated cost of machined parts from a par-ticular material.9 Within the aerospace community, this would bemost relevant to the detailed design process for a range of partsfrom smaller complex machinings, but could be extended to largerfuselage frames of machined-finish aluminum forging, for exam-ple. The cost tool interprets the machined part using feature-basedmodeling10 and classes it accordingly using group technology.11
Various costing modules then plan and cost the machining pro-cess using a mixture of activity-based costing (ABC)12,13 andanalogous costing in a comparative manner. Taylor has also ad-vocated a feature-based approach to aerospace cost estimating,and this has often been a mainstay of traditional aircraft costestimators.14
Analogous costing is also a traditional costing technique that usesthe cost of a similar product to gain a first baseline estimate. Devia-tions in the design or manufacture of the new product are then usedto account for alterations in the initial cost estimate.15 Apart fromthe analogous ABC and feature-based techniques, there are a rangeof other methods for generating the actual cost estimates from inputdata and constraints,16 including regression-oriented parametrics,17
bottom-up costing, fuzzy logic,18 and neural networks.19 It is thelevel of input data and the range of constraints that tend to differen-tiate these techniques and make them more or less suitable to a givenapplication, especially according to the level of product and processdefinition available. The parametric estimating technique20,21 is verywidespread and varies greatly from being purely statistical to morecausal in nature, being linear, exponential (logarithmic linearity), orpolynomial in form.
It is also well documented in the literature that the impact ofcost needs to be introduced upfront at the concept design stage.Pugh has advised that top-down cost estimating should begin evenbefore the aircraft development process begins.22 Thurston and Es-sington advocate a holistic approach to the design process that isappropriate at the concept stage, where a product is defined in termsof a measure of its utility value to the customer.23 This includescost in a multi-attribute analysis24 of the design that can then bemathematically optimized.25 Another form of this design method-ology has also been applied by Collopy and Eames to satisfy theholistic design requirements of an unmanned arial vehicle.26 A high-level objective function that reflected the wider design requirementsof both cost and performance is at the core of the method, provid-ing a tradeoff mechanism that, through maximization, promotes the
optimal choice of design parameters within stipulated ranges ofconstraint.
This type of approach can be traced back to much of the classic re-search within the aerospace industry into parametric optimization27:the identification of key design parameters that drive performanceand that can be optimized when combined in mathematical for-mula. Much of the current mainstream research in the industry isfocused toward multidisciplinary optimization (MDO), whether ata high level or the lower level linking of discrete computationalmodels.28 Marx et al. have linked MDO to life-cycle analysis (LCA)by defining high-level objective functions that encompass the life-cycle needs of aircraft, supported by necessary disciplinary modelsthat facilitate the optimization process through the linkage definedby an objective function.29 In aerospace, LCA tends to be associatedwith military application, whereas the commercial sector focuses onDOC, being more associated with the cost of transporting a persona number of air miles at as low a cost as possible. There are variousDOC models available, which tend to be of a parametric nature,30,31
that allow tradeoff of design parameters and that can be linked tomanufacturing models to couple in the impact on production.6,16,32
It has been shown from the literature that aerospace manufactureis a key fundamental driver in cost integrated design, whether con-sidering high-level cost control methodologies such as DFC/DTCor integrated design methodologies for the high-level concept stageor at the lower-level preliminary scheme and detailed stages. Theimpact of the work of Boothroyd and Dewhurst in highlighting theneed for a methodology that links the impact of design decisionson manufacture is well documented.33 The major contribution, inaddition to firmly establishing the design for manufacture and as-sembly (DFMA) principle, was in providing an analysis techniquethat quantitatively compared a given design with a theoretical base-line in terms of design complexity, classically with regard to partcount and fastener count. Stoll has also addressed many of the orga-nizational and implementation aspects of DFMA,34 whereas otherauthors were already reporting on the important linkage betweenDFMA and LCA.35
The basic principle of relevance to life-cycle cost (LCC) is stillas prevalent an issue today as shown by Murman et al., who definebetter–faster–cheaper life-cycle needs in terms of value-orientedcost, performance, and time functions.36 The process technologyaspects are addressed by considering lean practices for design, en-gineering, and manufacturing. Marx et al. have presented a paramet-ric analytical solution for linking life-cycle needs back to design.29
They use the case study of a high-speed commercial transporterto investigate the best structural layout for the wing in terms oflife-cycle requirements, including chordwise stiffened, spanwisestiffened, and biaxially stiffened structural layouts. A much moredetailed analysis platform for the manufacturing cost drivers hasbeen developed by Rais-Rohani,37 where he incorporates all of therelevant manufacturing issues in terms of parametrically definedcomplexity factors, including compatibility, complexity, quality, ef-ficiency, and coupling. His work is integrated into the aircraft de-sign process using a three-tier MDO methodology (see Ref. 38).
266 CURRAN, ROTHWELL, AND CASTAGNE
For example, with respect to three alternate structural designs of awing box (thin heavily stiffened skin, thick lightly stiffened skin,multispar), the authors advocate first setting out the structural designconfiguration, as well as defining materials, part manufacture, andassembly method. Second, a single- or multiple-optimization proce-dure is carried out according to some objective function with a mul-tidisciplinary set of design and manufacturing constraints. Third,the design is validated and the cost estimates improved to allowfor tradeoff, sensitivity studies, and optimization of the airframestructures.
With regard to the aircraft fuselage panels considered in this pa-per, the need to understand the linkage between material and pro-cess selection, structural design needs, and LCC has been drivenby industrial needs in the face of ever tighter competition anddemanding passenger requirements. Sandoz, a chief engineer onthe Boeing 747, was already projecting a value-oriented approachto the integration of these needs for aircraft structures in 1973(Ref. 39). Other authors have continued to address the impact onmanufacturing by characterizing the various manufacturing pro-cesses for fuselage panel parts,40 along with the associated assemblyprocesses,41 with respect to key design drivers and cost. Much ofthe work has again been industrial oriented with an interest in as-sessing the tradeoff between technologies or materials.42 However,there has been very little published work carried out in the link-age and simulation of accurate cost estimation and detailed struc-tural requirements. Consequently, this paper sets out a methodol-ogy for the integration of cost into the airframe design processat the performance analysis stage so that proper tradeoff of de-sign solutions can be carried out through explicit optimization pro-cedures involving both structural performance and manufacturingcost.
Genetic-Causal Cost ModelingNote from the literature review that there is not an established
technique for the scientific modeling of manufacturing cost withinengineering design. However, there are a number of aspects thatcan be seen consistently to relate to cost, that is, form or geometricdefinition, and production processes and materials. It is also evi-dent that there are a number of ways in which to formulate relationsquantitatively, but that statistical significance is a fitting mannerin which to formulate relations that are sensitive to environmentalnoise yet characterized by certain generic aspects, typically relat-ing to design information. The genetic-causal approach is proposedas a scientific approach to the modeling of manufacturing cost asarising from the work done in converting a raw material througha number of stages into a part that may then be assembled intoa whole.
Within this paper, it is proposed that manufacturing cost be mod-eled using a methodology referred to as the genetic-causal method.This is achieved by 1) classifying the generic cost elements thatare linked to particular genetic indicators and 2) developing causalparametric relations that link those genetic identifiers to the resul-tant manufacturing costs. In proceeding with a hierarchical design-oriented classification, there are three key aspects that can be con-sidered as genetic, cost being a result these aspects within the designdefinition. The relevant information from these three aspects can bethought of as bits of genetic information that are coded into thedesign and that give rise to cost. The actual cost, however, is onlyfixed if all things remain equal. Otherwise, environmental factorssuch as rates and interest will vary, and process cycle factors willvary depending on company efficiency. Therefore, any scientificcost prediction is truly termed an estimate because the prediction isthe most likely potential cost given 1) the nature of the pure designand 2) the environmental factors that might additionally influenceits manufacture.
The genetic-causal method utilizes the following indicators andhierarchy:
1) The first indicator is form, or the required shape: The classifica-tion according to form or geometric similarity is crucial for linkingmanufacturing cost into the design definition process. This may alsoinclude additional form definition in terms of identified features or
higher-fidelity ratings of design information such as through com-plexity factors. It will be shown that a first-order classification isimposed in the presented study to identify skin, stringer, frame,cleat, and rivet as forms, whereas a second-order classification oflightening hole is used in conjunction with frame to improve theresolution of design information.
2) The second indicator is process, or the available conversions:The classification of physical form can then be matched to poten-tial processes available to achieve those forms. There are two as-pects to this: 1) the understanding of the various process stages and2) the understanding of each of those processes. The significantstages in the production cycle are identified through the definitionof a material conversion route, after which individual process mod-els can be assigned to each stage. It is at this stage that cycle-timefactors and established rates need to be introduced to characterizethe processes relative to influential geometric information. For ex-ample, it will be seen that the form stringer and feature T-shapeis first used to classify the stringer riveting, after which the cost ispredicted using the design length of stringers in conjunction with aprocess performance rate and its cost rate.
3) The third indicator is material, or its required behavior: Thechoice of material is associated with the required behavior of theparts but is highly coupled to process selection, also through worka-bility. Producers may preference a process and then work to satisfymaterial requirements, for example, developing stringer alloys thatcan be welded. However, it is clear that the material categorizationcontributes a raw material cost and treatment cost. This is a func-tion of the material quantities required by the design form, but it iscoupled to the process type in terms of material addition or materialremoval. A further complication with materials procurement is thedegree of preprocessing, such as rolling, forming, or the extrusionof the stringer lengths. This need not affect the costing accuracysignificantly, but does impinge on the clarity of the tradeoff stud-ies within the context of the design process. However, the additionof bought-out and subcontracted items does require a procurementfactor.
Note from the preceding three aspects that design informationis absolutely fundamental to the understanding of manufacturingcost, according to the genetic cost coding imposed by the designerthrough the impact of their decisions on form, process, and material.We have also recognized the impact of environmental noise on fac-toring the causal impact from form, process, and material. However,these causal relations can now be modeled using statistical signifi-cance with appropriate normalization for the environmental factors.This results in scientifically based relations that numerically linkcost to causal sources embedded in the design definition. Apart frombeing a highly generic cost modeling technique, the genetic-causaltechnique is also extremely well suited to use within an integrateddesign platform because changes in the design for performance ben-efit can be mapped through to cost to trade off manufacturing costrelative to some global objective function directly, as exemplifiedlater in this paper.
Manufacturing Cost AnalysisThe manufacturing cost analysis is based on empirical data gath-
ered from Bombardier Aerospace Shorts and is typical for regionalpassenger jets. These data are provided in the form of engineeringdrawings and a work breakdown structure (WBS) that contains thecost information within several Excel spreadsheets.
The cost modeling methodology for the linkage between manu-facturing and design imposes a breakdown of the cost into a numberof elements, including material cost, fabrication cost, and assemblycost, so that it can be formulated into semi-empirical equations tobe linked to the same design variables as considered in the structuralanalysis.
Actual Cost of the PanelThe generic product families used on a typical stringer–skin
panel are the panel itself, which forms the skin of the aircraft;the stringers and the frames that support it in the longitudinal andlateral directions, respectively; the cleats that are present at every
CURRAN, ROTHWELL, AND CASTAGNE 267
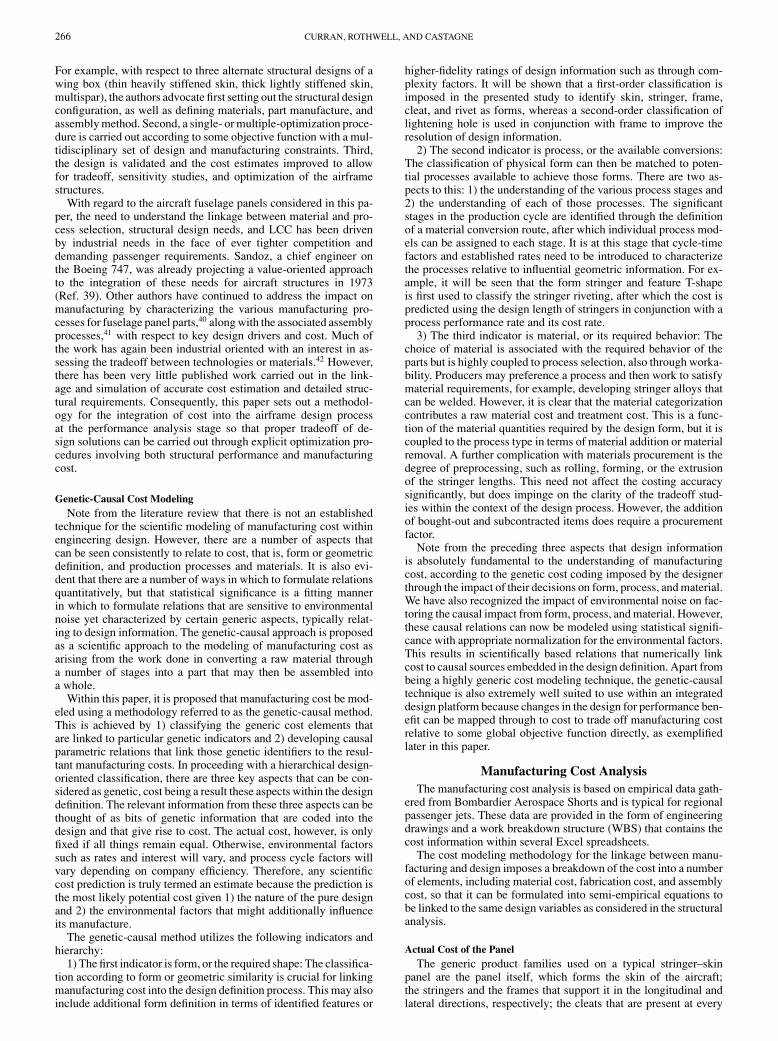
Fig. 2 Total cost breakdown.
Fig. 3 Actual assembly cost.
stringer–frame junction in the studied panel; and the rivets that holdit all together. The overall breakdown in the manufacturing cost anal-ysis is summarized in Eq. (1), expressed in term of these productfamilies (skin, stringers, frames, cleats, and rivets):
Cpanel =5∑
i = 1
Ci = Cskin + Cstringers + Cframes + Ccleats + Crivets (1)
where Cpanel is the total cost of the panel and Ci the total cost forthe part family i .
Three major types of costs are to be taken into account: materialcosts, fabrication costs, and assembly costs. In accordance with theempirical data provided for the stringer–skin panel, the repartitionof these costs is shown in Fig. 2. Note that the fabrication costsonly include the in-house labor costs. This means that for severalparts the material costs also include fabrication costs. For example,relative to the particular industrial data being used, the material costfor the skin panel already includes fabrication costs because theskin is supplied to the assembly stage in a ready condition, thatis, at the correct thickness and to net trim at the edges. Likewise,the stringer material cost already includes the extrusion process.A true raw material cost is available for the cleats and the frames.The rivets are standard commercial parts, that are received in theirmanufactured state. From a costing point of view, the rivets are partof the material costs.
With the assumptions just mentioned, the total cost breakdownin Fig. 2 shows that the repartition between the three cost elementsare almost equivalent, the material being a little less important.
The assembly or riveting cost can then be divided into differentcomponents, as shown in Fig. 3. The rivets have been included inFig. 3 because, even if they are supposed to be part of the materialcosts in Fig. 2, they take part in the assembly process.
It is obvious that the drilling cost is the most important part. Thedrilling cost also includes the cost linked to the setup, that is, thecost of positioning all parts. The cost of the rivets themselves is verylow (only 3%). The remaining cost is divided into the costs relatedto the subassembly of the frames, the manual and automatic riveting(assuming that 85% of the rivets are automatic), the final riveting,and the layoff operations such as cleaning and inspection.
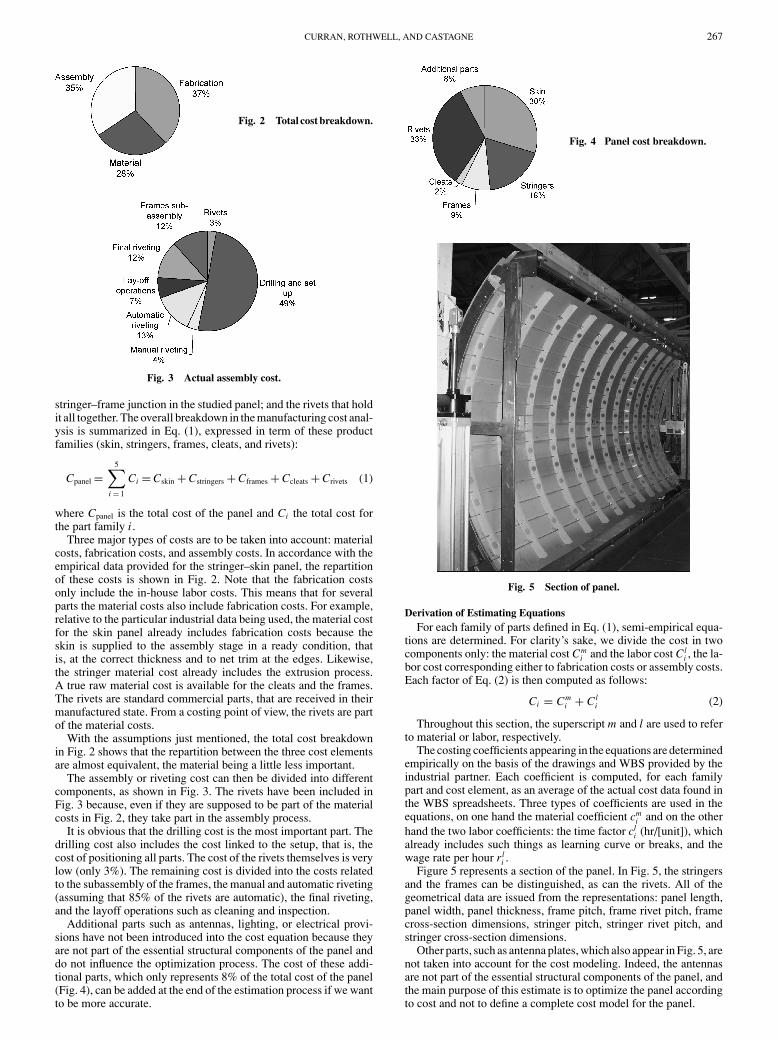
Additional parts such as antennas, lighting, or electrical provi-sions have not been introduced into the cost equation because theyare not part of the essential structural components of the panel anddo not influence the optimization process. The cost of these addi-tional parts, which only represents 8% of the total cost of the panel(Fig. 4), can be added at the end of the estimation process if we wantto be more accurate.
Fig. 4 Panel cost breakdown.
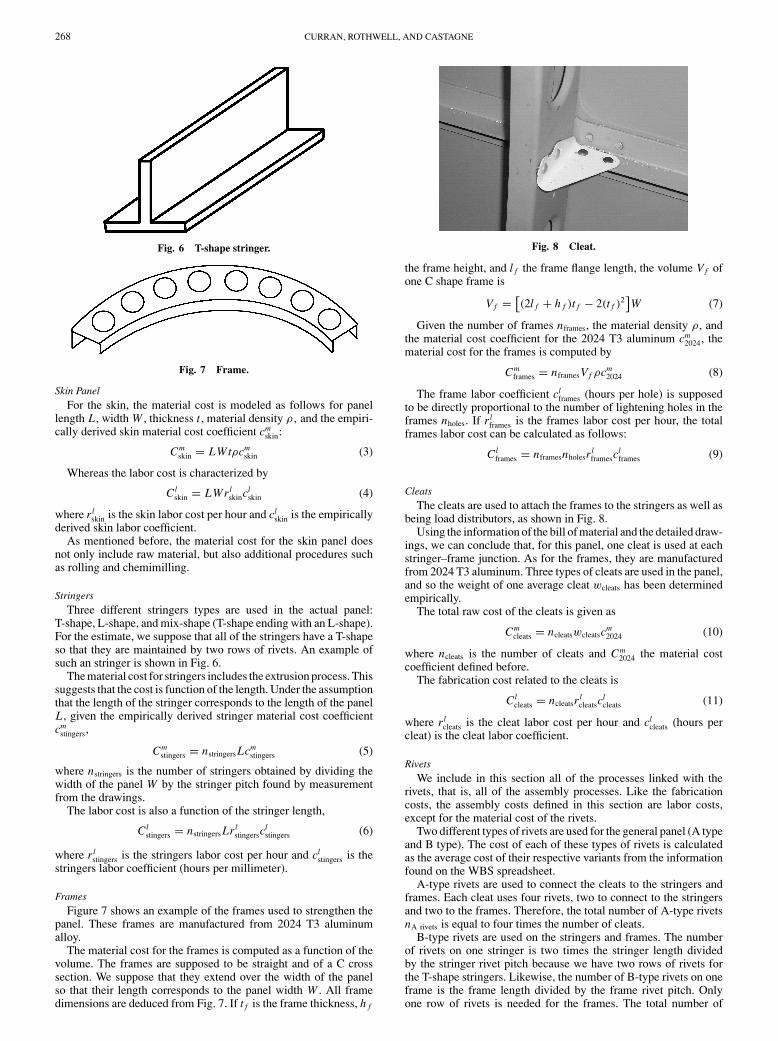
Fig. 5 Section of panel.
Derivation of Estimating EquationsFor each family of parts defined in Eq. (1), semi-empirical equa-
tions are determined. For clarity’s sake, we divide the cost in twocomponents only: the material cost Cm
i and the labor cost Cli , the la-
bor cost corresponding either to fabrication costs or assembly costs.Each factor of Eq. (2) is then computed as follows:
Ci = Cmi + Cl
i (2)
Throughout this section, the superscript m and l are used to referto material or labor, respectively.
The costing coefficients appearing in the equations are determinedempirically on the basis of the drawings and WBS provided by theindustrial partner. Each coefficient is computed, for each familypart and cost element, as an average of the actual cost data found inthe WBS spreadsheets. Three types of coefficients are used in theequations, on one hand the material coefficient cm
i and on the otherhand the two labor coefficients: the time factor cl
i (hr/[unit]), whichalready includes such things as learning curve or breaks, and thewage rate per hour r l
i .Figure 5 represents a section of the panel. In Fig. 5, the stringers
and the frames can be distinguished, as can the rivets. All of thegeometrical data are issued from the representations: panel length,panel width, panel thickness, frame pitch, frame rivet pitch, framecross-section dimensions, stringer pitch, stringer rivet pitch, andstringer cross-section dimensions.
Other parts, such as antenna plates, which also appear in Fig. 5, arenot taken into account for the cost modeling. Indeed, the antennasare not part of the essential structural components of the panel, andthe main purpose of this estimate is to optimize the panel accordingto cost and not to define a complete cost model for the panel.
268 CURRAN, ROTHWELL, AND CASTAGNE
Fig. 6 T-shape stringer.
Fig. 7 Frame.
Skin PanelFor the skin, the material cost is modeled as follows for panel
length L , width W , thickness t , material density ρ, and the empiri-cally derived skin material cost coefficient cm
skin:
Cmskin = LW tρcm
skin (3)
Whereas the labor cost is characterized by
Clskin = LWrl
skinclskin (4)
where r lskin is the skin labor cost per hour and cl
skin is the empiricallyderived skin labor coefficient.
As mentioned before, the material cost for the skin panel doesnot only include raw material, but also additional procedures suchas rolling and chemimilling.
StringersThree different stringers types are used in the actual panel:
T-shape, L-shape, and mix-shape (T-shape ending with an L-shape).For the estimate, we suppose that all of the stringers have a T-shapeso that they are maintained by two rows of rivets. An example ofsuch an stringer is shown in Fig. 6.
The material cost for stringers includes the extrusion process. Thissuggests that the cost is function of the length. Under the assumptionthat the length of the stringer corresponds to the length of the panelL , given the empirically derived stringer material cost coefficientcm
stingers,
Cmstingers = nstringers Lcm
stingers (5)
where nstringers is the number of stringers obtained by dividing thewidth of the panel W by the stringer pitch found by measurementfrom the drawings.
The labor cost is also a function of the stringer length,
Clstingers = nstringers Lrl
stingersclstingers (6)
where r lstingers is the stringers labor cost per hour and cl
stingers is thestringers labor coefficient (hours per millimeter).
FramesFigure 7 shows an example of the frames used to strengthen the
panel. These frames are manufactured from 2024 T3 aluminumalloy.
The material cost for the frames is computed as a function of thevolume. The frames are supposed to be straight and of a C crosssection. We suppose that they extend over the width of the panelso that their length corresponds to the panel width W . All framedimensions are deduced from Fig. 7. If t f is the frame thickness, h f
Fig. 8 Cleat.
the frame height, and l f the frame flange length, the volume V f ofone C shape frame is
V f = [(2l f + h f )t f − 2(t f )
2]W (7)
Given the number of frames nframes, the material density ρ, andthe material cost coefficient for the 2024 T3 aluminum cm
2024, thematerial cost for the frames is computed by
Cmframes = nframesV f ρcm
2024 (8)
The frame labor coefficient clframes (hours per hole) is supposed
to be directly proportional to the number of lightening holes in theframes nholes. If r l
frames is the frames labor cost per hour, the totalframes labor cost can be calculated as follows:
Clframes = nframesnholesr
lframesc
lframes (9)
CleatsThe cleats are used to attach the frames to the stringers as well as
being load distributors, as shown in Fig. 8.Using the information of the bill of material and the detailed draw-
ings, we can conclude that, for this panel, one cleat is used at eachstringer–frame junction. As for the frames, they are manufacturedfrom 2024 T3 aluminum. Three types of cleats are used in the panel,and so the weight of one average cleat wcleats has been determinedempirically.
The total raw cost of the cleats is given as
Cmcleats = ncleatswcleatsc
m2024 (10)
where ncleats is the number of cleats and Cm2024 the material cost
coefficient defined before.The fabrication cost related to the cleats is
Clcleats = ncleatsr
lcleatsc
lcleats (11)
where r lcleats is the cleat labor cost per hour and cl
cleats (hours percleat) is the cleat labor coefficient.
RivetsWe include in this section all of the processes linked with the
rivets, that is, all of the assembly processes. Like the fabricationcosts, the assembly costs defined in this section are labor costs,except for the material cost of the rivets.
Two different types of rivets are used for the general panel (A typeand B type). The cost of each of these types of rivets is calculatedas the average cost of their respective variants from the informationfound on the WBS spreadsheet.
A-type rivets are used to connect the cleats to the stringers andframes. Each cleat uses four rivets, two to connect to the stringersand two to the frames. Therefore, the total number of A-type rivetsnA rivets is equal to four times the number of cleats.
B-type rivets are used on the stringers and frames. The numberof rivets on one stringer is two times the stringer length dividedby the stringer rivet pitch because we have two rows of rivets forthe T-shape stringers. Likewise, the number of B-type rivets on oneframe is the frame length divided by the frame rivet pitch. Onlyone row of rivets is needed for the frames. The total number of
CURRAN, ROTHWELL, AND CASTAGNE 269
B-type rivets nB rivets is the number of rivets on the stringers plus thenumber of rivets on the frames, minus the common rivets that wouldbe overlaid by both components, that is, two times the number ofstringer–frame junctions.
If cmA rivets is the cost of one A-type rivet and cm
B rivets the cost ofone B-type rivet, the total material cost for the rivets is
Cmrivets = nA rivetsc
mA rivets + nB rivetsc
mB rivets (12)
The first stage in the assembly process is the subassembly offrames, which consists of riveting reinforcements on the frames.It is assumed that the cost of this process is proportional to thelength of the frame. If r l
sa-fr is the frame subassembly labor cost perhour (dollars per hour) and cl
sa-fr (hours per millimeter) the framesubassembly labor coefficient, the total subassembly cost for theframes is
Clsa-fr = nframesr
lsa-frc
lsa-fr (13)
For the whole panel, the assembly process can be divided into thefollowing steps: First, the holes for the rivets are drilled and reamedto the required dimensions; then, rivets are inserted, beginning withthe manual rivets and completed by the autoriveting process; finally,layoff operations for the panel and the final riveting and assemblyare realized.
The drilling and reaming of the holes is assumed constant for bothtypes of rivets and is a function of rivet number. Therefore, the totalcost for drilling and reaming is
Cldrill = (nA rivet + nB rivet)r
ldrillc
ldrill (14)
where r ldrill is the drilling and reaming labor cost per hour (dollars
per hour) and cldrill (hours per rivet) the rivet labor coefficient.
The riveting process can be split into two sections, manual rivetingand autoriveting. It is assumed that the A-type rivets that connect thecleats to the frames and stringers are manually riveted. Also, a certainnumber of B-type rivets are required to hold the panel together whileit is autoriveted. It is assumed that these rivets are the end rivets of thestringers and frames and the rivets at the stringer–frame junctions.Assuming that all of the other rivets are automatically riveted, wefound that, for this particular panel, 85% of the rivets were autorivets.
If nman-riv is the number of manual rivets, r lman-riv the manual riv-
eting labor cost per hour (dollars per hour), and clman-riv (hours per
rivet) the manual riveting labor coefficient, we have, for the totalmanual riveting labor cost,
Clman-riv = nman-rivr l
man-rivclman-riv (15)
Likewise, if nauto-riv is the number of automatic rivets, r lauto-riv the
automatic riveting labor cost per hour (dollars per hour), and clauto-riv
(hours per rivet) the automatic riveting labour coefficient, the totalautomatic riveting labor cost is
Clauto-riv = nauto-rivr l
auto-rivclauto-riv (16)
The layoff operations, such as cleaning and inspection, are as-sumed to be a function of the area of the panel. If r l
layoff is the panellayoff operations cost per hour (dollars per hour) and cl
layoff (hoursper square millimeter) the panel layoff operations labor coefficient,the total the panel layoff operations cost for the panel is
Cllayoff = LWrl
layoffcllayoff (17)
The final riveting and assembly procedures are calculated perrivet. The total final procedures cost is
Clfinal-riv = (nA rivet + nB rivet)r
lfinal-rivcl
final-riv (18)
where r lfinal-riv is the final procedures labor cost per hour (dollars
per hour) and clfinal-riv (hours per rivet) the final procedures labor
coefficient.
The total labor cost associated with the assembly process can becomputed by adding Eqs. (13–18). The labor component of the totalrivet and assembly costs Cl
rivets is
Clrivets = Cl
sa-fr + Cldrill + Cl
man-riv + Clauto-riv + Cl
layoff + Clfinal-riv
(19)
Results of the EstimationAs a first validation, the total cost of the panel has been calculated
using, on the one hand, the raw data of the WBS spreadsheets and,on the other hand, the average equations of the preceding sectionsfor a standard panel having the same dimensions. The comparisonof the actual cost of the panel and the estimated cost is shown inFigs. 9–11. The cost data and estimates have been normalized forproprietary reasons relative to the total actual cost.
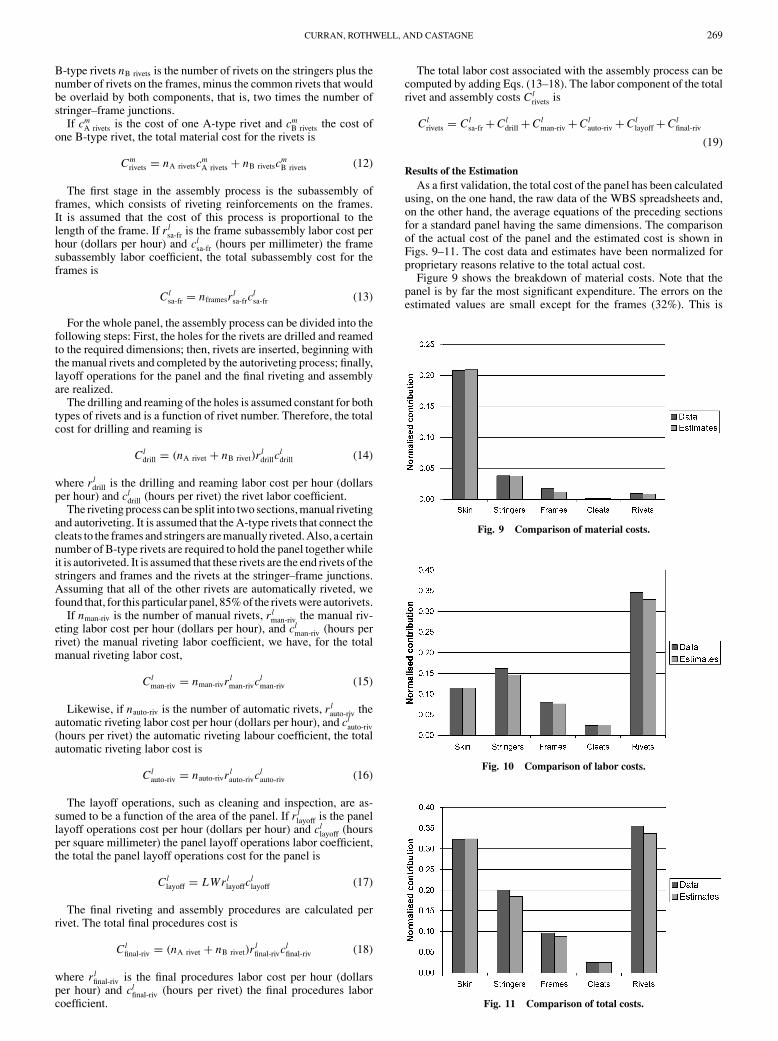
Figure 9 shows the breakdown of material costs. Note that thepanel is by far the most significant expenditure. The errors on theestimated values are small except for the frames (32%). This is
Fig. 9 Comparison of material costs.
Fig. 10 Comparison of labor costs.
Fig. 11 Comparison of total costs.
270 CURRAN, ROTHWELL, AND CASTAGNE
due to a lack of data concerning the frame dimensions. This partof the estimate will be corrected as soon as new data are avail-able. A small error (10%) is also perceptible concerning the rivets.This underestimation comes from the number of rivets that appearin the bill of material being greater than the number of rivets wededuce from the rivet pitch and the component length. Some riv-ets are probably used for additional operations not detailed in theestimates.
Alternatively, Fig. 10 shows the breakdown of labor costs forthe various product families that constitute the stringer–skin panel.Note that the labor cost associated with the rivets is now most sig-nificant, and the stringers are also of great influence. However, notethat, as stated earlier, the panel in this analysis was taken to arrivein finished net trim form and the stringers in the extruded form.That explains why the material cost was high for the panel. Like-wise, the material cost for the stringers was also high due to theinitial fabrication processes to make them ready for the assemblyshop.
With regard to the labor cost, small errors appear in Fig. 10 for thestringers and the rivets for the same reason as that for the materialcost, that is, greater quantities in the bill of material than can bededuced from the panel dimensions. This was already mentionedfor the rivets, but the same problems appeared for the stringerswhose total length in the costing data is greater than the numberof stringers multiplied by the length of the panel. Actually, thestringers cost should be overestimated because we consider forthe estimates that stringers cover the whole length of the panel,but in the actual panel they are a little bit smaller. The cost datafor the stringers will be corrected as soon as more information isavailable.
Finally, the overall breakdown in total manufacturing costs isshown in Fig. 11, which corresponds to the addition of Figs. 9 and10. The same remarks can be made regarding the errors for the rivetsand the stringers. For the frame, the error is not so important whenwe take the total cost.
Figure 11 shows that the greater expenditure comes actually fromthe rivets, that is, from the assembly process and from the skin itself,each totaling between 30 and 35% of the total cost. Then come thestringers with 20% of the cost, followed by the frames and thecleats.
The simple cost model developed will be used in the optimizationsection to compute the manufacturing and material costs appearingin the optimization procedure. The cost model includes all of theequations proposed in this section, as well as the empirical coeffi-cients defined on the basis of the industrial data.
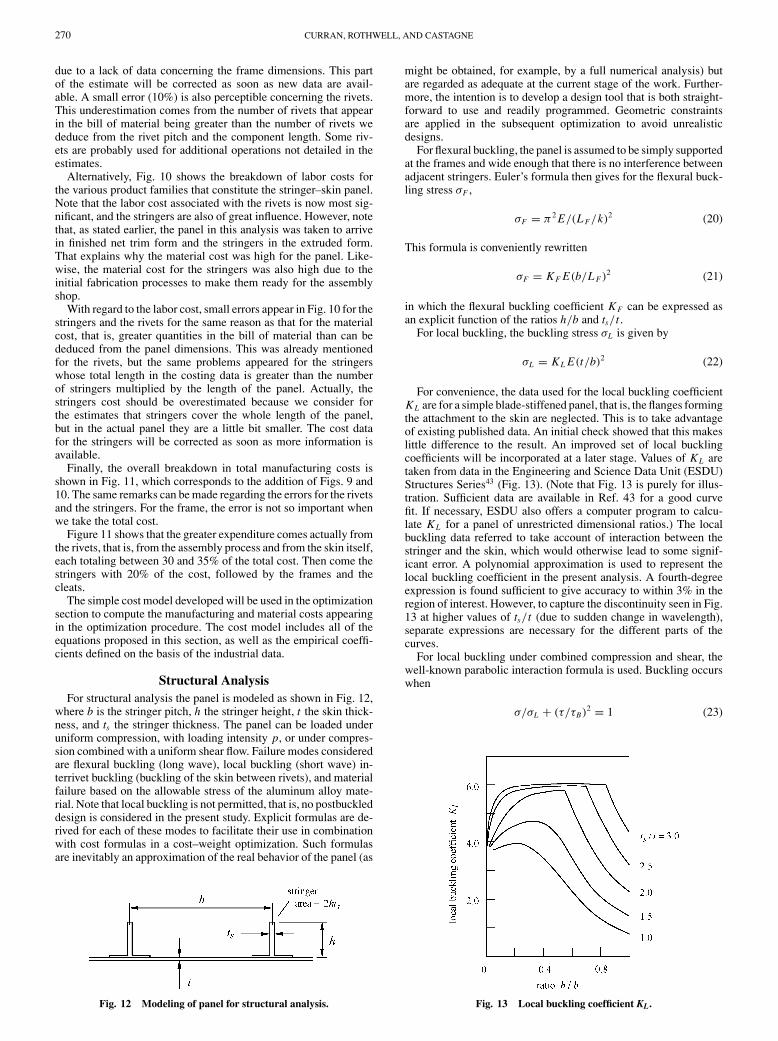
Structural AnalysisFor structural analysis the panel is modeled as shown in Fig. 12,
where b is the stringer pitch, h the stringer height, t the skin thick-ness, and ts the stringer thickness. The panel can be loaded underuniform compression, with loading intensity p, or under compres-sion combined with a uniform shear flow. Failure modes consideredare flexural buckling (long wave), local buckling (short wave) in-terrivet buckling (buckling of the skin between rivets), and materialfailure based on the allowable stress of the aluminum alloy mate-rial. Note that local buckling is not permitted, that is, no postbuckleddesign is considered in the present study. Explicit formulas are de-rived for each of these modes to facilitate their use in combinationwith cost formulas in a cost–weight optimization. Such formulasare inevitably an approximation of the real behavior of the panel (as
Fig. 12 Modeling of panel for structural analysis.
might be obtained, for example, by a full numerical analysis) butare regarded as adequate at the current stage of the work. Further-more, the intention is to develop a design tool that is both straight-forward to use and readily programmed. Geometric constraintsare applied in the subsequent optimization to avoid unrealisticdesigns.
For flexural buckling, the panel is assumed to be simply supportedat the frames and wide enough that there is no interference betweenadjacent stringers. Euler’s formula then gives for the flexural buck-ling stress σF ,
σF = π2 E/(L F/k)2 (20)
This formula is conveniently rewritten
σF = KF E(b/L F )2 (21)
in which the flexural buckling coefficient KF can be expressed asan explicit function of the ratios h/b and ts/t .
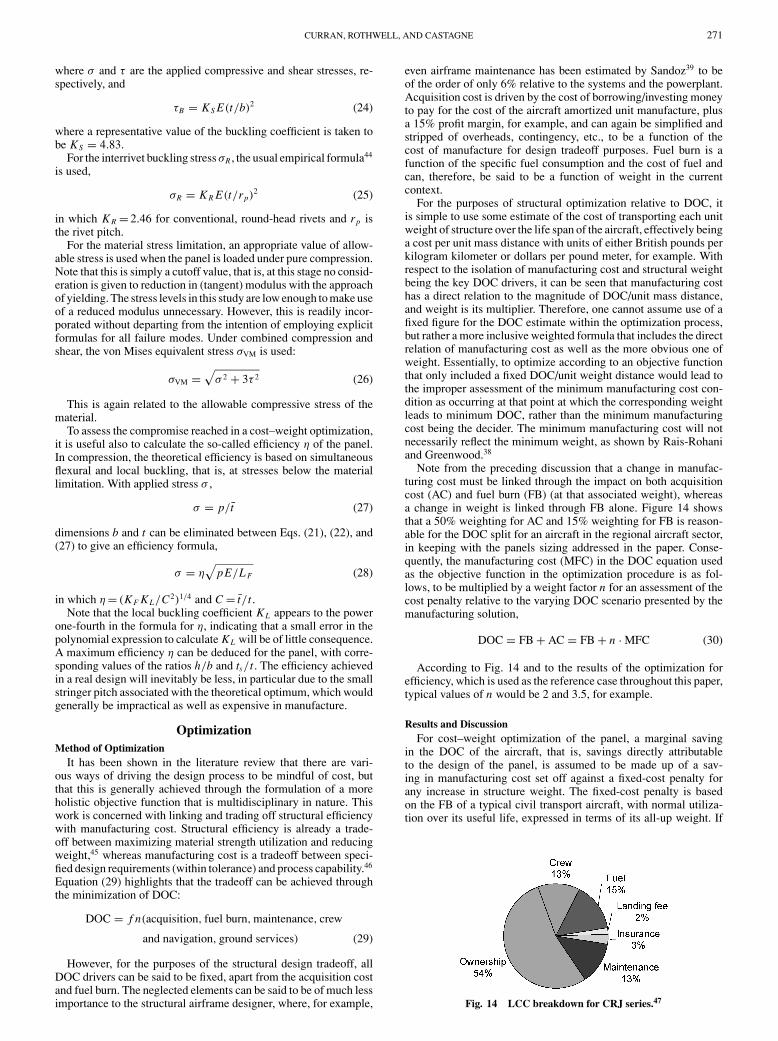
For local buckling, the buckling stress σL is given by
σL = KL E(t/b)2 (22)
For convenience, the data used for the local buckling coefficientKL are for a simple blade-stiffened panel, that is, the flanges formingthe attachment to the skin are neglected. This is to take advantageof existing published data. An initial check showed that this makeslittle difference to the result. An improved set of local bucklingcoefficients will be incorporated at a later stage. Values of KL aretaken from data in the Engineering and Science Data Unit (ESDU)Structures Series43 (Fig. 13). (Note that Fig. 13 is purely for illus-tration. Sufficient data are available in Ref. 43 for a good curvefit. If necessary, ESDU also offers a computer program to calcu-late KL for a panel of unrestricted dimensional ratios.) The localbuckling data referred to take account of interaction between thestringer and the skin, which would otherwise lead to some signif-icant error. A polynomial approximation is used to represent thelocal buckling coefficient in the present analysis. A fourth-degreeexpression is found sufficient to give accuracy to within 3% in theregion of interest. However, to capture the discontinuity seen in Fig.13 at higher values of ts/t (due to sudden change in wavelength),separate expressions are necessary for the different parts of thecurves.
For local buckling under combined compression and shear, thewell-known parabolic interaction formula is used. Buckling occurswhen
σ/σL + (τ/τB)2 = 1 (23)
Fig. 13 Local buckling coefficient KL.
CURRAN, ROTHWELL, AND CASTAGNE 271
where σ and τ are the applied compressive and shear stresses, re-spectively, and
τB = KS E(t/b)2 (24)
where a representative value of the buckling coefficient is taken tobe KS = 4.83.
For the interrivet buckling stress σR , the usual empirical formula44
is used,
σR = K R E(t/rp)2 (25)
in which K R = 2.46 for conventional, round-head rivets and rp isthe rivet pitch.
For the material stress limitation, an appropriate value of allow-able stress is used when the panel is loaded under pure compression.Note that this is simply a cutoff value, that is, at this stage no consid-eration is given to reduction in (tangent) modulus with the approachof yielding. The stress levels in this study are low enough to make useof a reduced modulus unnecessary. However, this is readily incor-porated without departing from the intention of employing explicitformulas for all failure modes. Under combined compression andshear, the von Mises equivalent stress σVM is used:
σVM =√
σ 2 + 3τ 2 (26)
This is again related to the allowable compressive stress of thematerial.
To assess the compromise reached in a cost–weight optimization,it is useful also to calculate the so-called efficiency η of the panel.In compression, the theoretical efficiency is based on simultaneousflexural and local buckling, that is, at stresses below the materiallimitation. With applied stress σ ,
σ = p/t̄ (27)
dimensions b and t can be eliminated between Eqs. (21), (22), and(27) to give an efficiency formula,
σ = η√
pE/L F (28)
in which η = (KF KL/C2)1/4 and C = t̄/t .Note that the local buckling coefficient KL appears to the power
one-fourth in the formula for η, indicating that a small error in thepolynomial expression to calculate KL will be of little consequence.A maximum efficiency η can be deduced for the panel, with corre-sponding values of the ratios h/b and ts/t . The efficiency achievedin a real design will inevitably be less, in particular due to the smallstringer pitch associated with the theoretical optimum, which wouldgenerally be impractical as well as expensive in manufacture.
OptimizationMethod of Optimization
It has been shown in the literature review that there are vari-ous ways of driving the design process to be mindful of cost, butthat this is generally achieved through the formulation of a moreholistic objective function that is multidisciplinary in nature. Thiswork is concerned with linking and trading off structural efficiencywith manufacturing cost. Structural efficiency is already a trade-off between maximizing material strength utilization and reducingweight,45 whereas manufacturing cost is a tradeoff between speci-fied design requirements (within tolerance) and process capability.46
Equation (29) highlights that the tradeoff can be achieved throughthe minimization of DOC:
DOC = f n(acquisition, fuel burn, maintenance, crew
and navigation, ground services) (29)
However, for the purposes of the structural design tradeoff, allDOC drivers can be said to be fixed, apart from the acquisition costand fuel burn. The neglected elements can be said to be of much lessimportance to the structural airframe designer, where, for example,
even airframe maintenance has been estimated by Sandoz39 to beof the order of only 6% relative to the systems and the powerplant.Acquisition cost is driven by the cost of borrowing/investing moneyto pay for the cost of the aircraft amortized unit manufacture, plusa 15% profit margin, for example, and can again be simplified andstripped of overheads, contingency, etc., to be a function of thecost of manufacture for design tradeoff purposes. Fuel burn is afunction of the specific fuel consumption and the cost of fuel andcan, therefore, be said to be a function of weight in the currentcontext.
For the purposes of structural optimization relative to DOC, itis simple to use some estimate of the cost of transporting each unitweight of structure over the life span of the aircraft, effectively beinga cost per unit mass distance with units of either British pounds perkilogram kilometer or dollars per pound meter, for example. Withrespect to the isolation of manufacturing cost and structural weightbeing the key DOC drivers, it can be seen that manufacturing costhas a direct relation to the magnitude of DOC/unit mass distance,and weight is its multiplier. Therefore, one cannot assume use of afixed figure for the DOC estimate within the optimization process,but rather a more inclusive weighted formula that includes the directrelation of manufacturing cost as well as the more obvious one ofweight. Essentially, to optimize according to an objective functionthat only included a fixed DOC/unit weight distance would lead tothe improper assessment of the minimum manufacturing cost con-dition as occurring at that point at which the corresponding weightleads to minimum DOC, rather than the minimum manufacturingcost being the decider. The minimum manufacturing cost will notnecessarily reflect the minimum weight, as shown by Rais-Rohaniand Greenwood.38
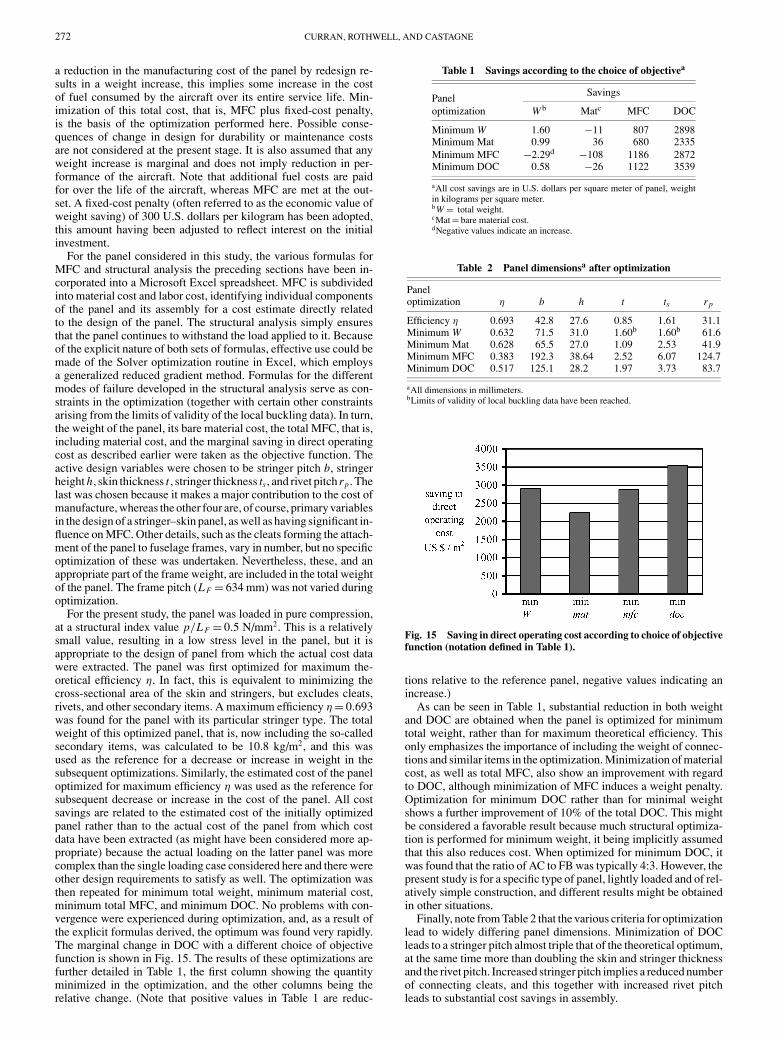
Note from the preceding discussion that a change in manufac-turing cost must be linked through the impact on both acquisitioncost (AC) and fuel burn (FB) (at that associated weight), whereasa change in weight is linked through FB alone. Figure 14 showsthat a 50% weighting for AC and 15% weighting for FB is reason-able for the DOC split for an aircraft in the regional aircraft sector,in keeping with the panels sizing addressed in the paper. Conse-quently, the manufacturing cost (MFC) in the DOC equation usedas the objective function in the optimization procedure is as fol-lows, to be multiplied by a weight factor n for an assessment of thecost penalty relative to the varying DOC scenario presented by themanufacturing solution,
DOC = FB + AC = FB + n · MFC (30)
According to Fig. 14 and to the results of the optimization forefficiency, which is used as the reference case throughout this paper,typical values of n would be 2 and 3.5, for example.
Results and DiscussionFor cost–weight optimization of the panel, a marginal saving
in the DOC of the aircraft, that is, savings directly attributableto the design of the panel, is assumed to be made up of a sav-ing in manufacturing cost set off against a fixed-cost penalty forany increase in structure weight. The fixed-cost penalty is basedon the FB of a typical civil transport aircraft, with normal utiliza-tion over its useful life, expressed in terms of its all-up weight. If
Fig. 14 LCC breakdown for CRJ series.47
272 CURRAN, ROTHWELL, AND CASTAGNE
a reduction in the manufacturing cost of the panel by redesign re-sults in a weight increase, this implies some increase in the costof fuel consumed by the aircraft over its entire service life. Min-imization of this total cost, that is, MFC plus fixed-cost penalty,is the basis of the optimization performed here. Possible conse-quences of change in design for durability or maintenance costsare not considered at the present stage. It is also assumed that anyweight increase is marginal and does not imply reduction in per-formance of the aircraft. Note that additional fuel costs are paidfor over the life of the aircraft, whereas MFC are met at the out-set. A fixed-cost penalty (often referred to as the economic value ofweight saving) of 300 U.S. dollars per kilogram has been adopted,this amount having been adjusted to reflect interest on the initialinvestment.
For the panel considered in this study, the various formulas forMFC and structural analysis the preceding sections have been in-corporated into a Microsoft Excel spreadsheet. MFC is subdividedinto material cost and labor cost, identifying individual componentsof the panel and its assembly for a cost estimate directly relatedto the design of the panel. The structural analysis simply ensuresthat the panel continues to withstand the load applied to it. Becauseof the explicit nature of both sets of formulas, effective use could bemade of the Solver optimization routine in Excel, which employsa generalized reduced gradient method. Formulas for the differentmodes of failure developed in the structural analysis serve as con-straints in the optimization (together with certain other constraintsarising from the limits of validity of the local buckling data). In turn,the weight of the panel, its bare material cost, the total MFC, that is,including material cost, and the marginal saving in direct operatingcost as described earlier were taken as the objective function. Theactive design variables were chosen to be stringer pitch b, stringerheight h, skin thickness t , stringer thickness ts , and rivet pitch rp . Thelast was chosen because it makes a major contribution to the cost ofmanufacture, whereas the other four are, of course, primary variablesin the design of a stringer–skin panel, as well as having significant in-fluence on MFC. Other details, such as the cleats forming the attach-ment of the panel to fuselage frames, vary in number, but no specificoptimization of these was undertaken. Nevertheless, these, and anappropriate part of the frame weight, are included in the total weightof the panel. The frame pitch (L F = 634 mm) was not varied duringoptimization.
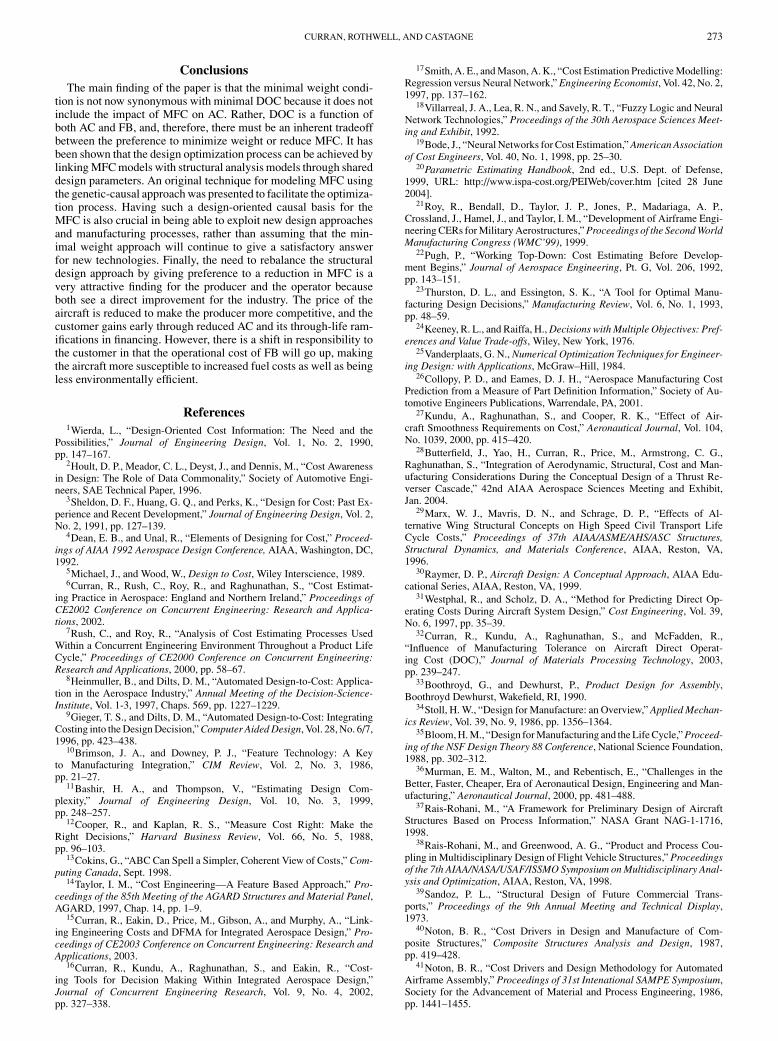
For the present study, the panel was loaded in pure compression,at a structural index value p/L F = 0.5 N/mm2. This is a relativelysmall value, resulting in a low stress level in the panel, but it isappropriate to the design of panel from which the actual cost datawere extracted. The panel was first optimized for maximum the-oretical efficiency η. In fact, this is equivalent to minimizing thecross-sectional area of the skin and stringers, but excludes cleats,rivets, and other secondary items. A maximum efficiency η = 0.693was found for the panel with its particular stringer type. The totalweight of this optimized panel, that is, now including the so-calledsecondary items, was calculated to be 10.8 kg/m2, and this wasused as the reference for a decrease or increase in weight in thesubsequent optimizations. Similarly, the estimated cost of the paneloptimized for maximum efficiency η was used as the reference forsubsequent decrease or increase in the cost of the panel. All costsavings are related to the estimated cost of the initially optimizedpanel rather than to the actual cost of the panel from which costdata have been extracted (as might have been considered more ap-propriate) because the actual loading on the latter panel was morecomplex than the single loading case considered here and there wereother design requirements to satisfy as well. The optimization wasthen repeated for minimum total weight, minimum material cost,minimum total MFC, and minimum DOC. No problems with con-vergence were experienced during optimization, and, as a result ofthe explicit formulas derived, the optimum was found very rapidly.The marginal change in DOC with a different choice of objectivefunction is shown in Fig. 15. The results of these optimizations arefurther detailed in Table 1, the first column showing the quantityminimized in the optimization, and the other columns being therelative change. (Note that positive values in Table 1 are reduc-
Table 1 Savings according to the choice of objectivea
SavingsPaneloptimization W b Matc MFC DOC
Minimum W 1.60 −11 807 2898Minimum Mat 0.99 36 680 2335Minimum MFC −2.29d −108 1186 2872Minimum DOC 0.58 −26 1122 3539
aAll cost savings are in U.S. dollars per square meter of panel, weightin kilograms per square meter.bW = total weight.cMat = bare material cost.dNegative values indicate an increase.
Table 2 Panel dimensionsa after optimization
Paneloptimization η b h t ts rp
Efficiency η 0.693 42.8 27.6 0.85 1.61 31.1Minimum W 0.632 71.5 31.0 1.60b 1.60b 61.6Minimum Mat 0.628 65.5 27.0 1.09 2.53 41.9Minimum MFC 0.383 192.3 38.64 2.52 6.07 124.7Minimum DOC 0.517 125.1 28.2 1.97 3.73 83.7
aAll dimensions in millimeters.bLimits of validity of local buckling data have been reached.
Fig. 15 Saving in direct operating cost according to choice of objectivefunction (notation defined in Table 1).
tions relative to the reference panel, negative values indicating anincrease.)
As can be seen in Table 1, substantial reduction in both weightand DOC are obtained when the panel is optimized for minimumtotal weight, rather than for maximum theoretical efficiency. Thisonly emphasizes the importance of including the weight of connec-tions and similar items in the optimization. Minimization of materialcost, as well as total MFC, also show an improvement with regardto DOC, although minimization of MFC induces a weight penalty.Optimization for minimum DOC rather than for minimal weightshows a further improvement of 10% of the total DOC. This mightbe considered a favorable result because much structural optimiza-tion is performed for minimum weight, it being implicitly assumedthat this also reduces cost. When optimized for minimum DOC, itwas found that the ratio of AC to FB was typically 4:3. However, thepresent study is for a specific type of panel, lightly loaded and of rel-atively simple construction, and different results might be obtainedin other situations.
Finally, note from Table 2 that the various criteria for optimizationlead to widely differing panel dimensions. Minimization of DOCleads to a stringer pitch almost triple that of the theoretical optimum,at the same time more than doubling the skin and stringer thicknessand the rivet pitch. Increased stringer pitch implies a reduced numberof connecting cleats, and this together with increased rivet pitchleads to substantial cost savings in assembly.
CURRAN, ROTHWELL, AND CASTAGNE 273
ConclusionsThe main finding of the paper is that the minimal weight condi-
tion is not now synonymous with minimal DOC because it does notinclude the impact of MFC on AC. Rather, DOC is a function ofboth AC and FB, and, therefore, there must be an inherent tradeoffbetween the preference to minimize weight or reduce MFC. It hasbeen shown that the design optimization process can be achieved bylinking MFC models with structural analysis models through shareddesign parameters. An original technique for modeling MFC usingthe genetic-causal approach was presented to facilitate the optimiza-tion process. Having such a design-oriented causal basis for theMFC is also crucial in being able to exploit new design approachesand manufacturing processes, rather than assuming that the min-imal weight approach will continue to give a satisfactory answerfor new technologies. Finally, the need to rebalance the structuraldesign approach by giving preference to a reduction in MFC is avery attractive finding for the producer and the operator becauseboth see a direct improvement for the industry. The price of theaircraft is reduced to make the producer more competitive, and thecustomer gains early through reduced AC and its through-life ram-ifications in financing. However, there is a shift in responsibility tothe customer in that the operational cost of FB will go up, makingthe aircraft more susceptible to increased fuel costs as well as beingless environmentally efficient.
References1Wierda, L., “Design-Oriented Cost Information: The Need and the
Possibilities,” Journal of Engineering Design, Vol. 1, No. 2, 1990,pp. 147–167.
2Hoult, D. P., Meador, C. L., Deyst, J., and Dennis, M., “Cost Awarenessin Design: The Role of Data Commonality,” Society of Automotive Engi-neers, SAE Technical Paper, 1996.
3Sheldon, D. F., Huang, G. Q., and Perks, K., “Design for Cost: Past Ex-perience and Recent Development,” Journal of Engineering Design, Vol. 2,No. 2, 1991, pp. 127–139.
4Dean, E. B., and Unal, R., “Elements of Designing for Cost,” Proceed-ings of AIAA 1992 Aerospace Design Conference, AIAA, Washington, DC,1992.
5Michael, J., and Wood, W., Design to Cost, Wiley Interscience, 1989.6Curran, R., Rush, C., Roy, R., and Raghunathan, S., “Cost Estimat-
ing Practice in Aerospace: England and Northern Ireland,” Proceedings ofCE2002 Conference on Concurrent Engineering: Research and Applica-tions, 2002.
7Rush, C., and Roy, R., “Analysis of Cost Estimating Processes UsedWithin a Concurrent Engineering Environment Throughout a Product LifeCycle,” Proceedings of CE2000 Conference on Concurrent Engineering:Research and Applications, 2000, pp. 58–67.
8Heinmuller, B., and Dilts, D. M., “Automated Design-to-Cost: Applica-tion in the Aerospace Industry,” Annual Meeting of the Decision-Science-Institute, Vol. 1-3, 1997, Chaps. 569, pp. 1227–1229.
9Gieger, T. S., and Dilts, D. M., “Automated Design-to-Cost: IntegratingCosting into the Design Decision,” Computer Aided Design, Vol. 28, No. 6/7,1996, pp. 423–438.
10Brimson, J. A., and Downey, P. J., “Feature Technology: A Keyto Manufacturing Integration,” CIM Review, Vol. 2, No. 3, 1986,pp. 21–27.
11Bashir, H. A., and Thompson, V., “Estimating Design Com-plexity,” Journal of Engineering Design, Vol. 10, No. 3, 1999,pp. 248–257.
12Cooper, R., and Kaplan, R. S., “Measure Cost Right: Make theRight Decisions,” Harvard Business Review, Vol. 66, No. 5, 1988,pp. 96–103.
13Cokins, G., “ABC Can Spell a Simpler, Coherent View of Costs,” Com-puting Canada, Sept. 1998.
14Taylor, I. M., “Cost Engineering—A Feature Based Approach,” Pro-ceedings of the 85th Meeting of the AGARD Structures and Material Panel,AGARD, 1997, Chap. 14, pp. 1–9.
15Curran, R., Eakin, D., Price, M., Gibson, A., and Murphy, A., “Link-ing Engineering Costs and DFMA for Integrated Aerospace Design,” Pro-ceedings of CE2003 Conference on Concurrent Engineering: Research andApplications, 2003.
16Curran, R., Kundu, A., Raghunathan, S., and Eakin, R., “Cost-ing Tools for Decision Making Within Integrated Aerospace Design,”Journal of Concurrent Engineering Research, Vol. 9, No. 4, 2002,pp. 327–338.
17Smith, A. E., and Mason, A. K., “Cost Estimation Predictive Modelling:Regression versus Neural Network,” Engineering Economist, Vol. 42, No. 2,1997, pp. 137–162.
18Villarreal, J. A., Lea, R. N., and Savely, R. T., “Fuzzy Logic and NeuralNetwork Technologies,” Proceedings of the 30th Aerospace Sciences Meet-ing and Exhibit, 1992.
19Bode, J., “Neural Networks for Cost Estimation,” American Associationof Cost Engineers, Vol. 40, No. 1, 1998, pp. 25–30.
20Parametric Estimating Handbook, 2nd ed., U.S. Dept. of Defense,1999, URL: http://www.ispa-cost.org/PEIWeb/cover.htm [cited 28 June2004].
21Roy, R., Bendall, D., Taylor, J. P., Jones, P., Madariaga, A. P.,Crossland, J., Hamel, J., and Taylor, I. M., “Development of Airframe Engi-neering CERs for Military Aerostructures,” Proceedings of the Second WorldManufacturing Congress (WMC’99), 1999.
22Pugh, P., “Working Top-Down: Cost Estimating Before Develop-ment Begins,” Journal of Aerospace Engineering, Pt. G, Vol. 206, 1992,pp. 143–151.
23Thurston, D. L., and Essington, S. K., “A Tool for Optimal Manu-facturing Design Decisions,” Manufacturing Review, Vol. 6, No. 1, 1993,pp. 48–59.
24Keeney, R. L., and Raiffa, H., Decisions with Multiple Objectives: Pref-erences and Value Trade-offs, Wiley, New York, 1976.
25Vanderplaats, G. N., Numerical Optimization Techniques for Engineer-ing Design: with Applications, McGraw–Hill, 1984.
26Collopy, P. D., and Eames, D. J. H., “Aerospace Manufacturing CostPrediction from a Measure of Part Definition Information,” Society of Au-tomotive Engineers Publications, Warrendale, PA, 2001.
27Kundu, A., Raghunathan, S., and Cooper, R. K., “Effect of Air-craft Smoothness Requirements on Cost,” Aeronautical Journal, Vol. 104,No. 1039, 2000, pp. 415–420.
28Butterfield, J., Yao, H., Curran, R., Price, M., Armstrong, C. G.,Raghunathan, S., “Integration of Aerodynamic, Structural, Cost and Man-ufacturing Considerations During the Conceptual Design of a Thrust Re-verser Cascade,” 42nd AIAA Aerospace Sciences Meeting and Exhibit,Jan. 2004.
29Marx, W. J., Mavris, D. N., and Schrage, D. P., “Effects of Al-ternative Wing Structural Concepts on High Speed Civil Transport LifeCycle Costs,” Proceedings of 37th AIAA/ASME/AHS/ASC Structures,Structural Dynamics, and Materials Conference, AIAA, Reston, VA,1996.
30Raymer, D. P., Aircraft Design: A Conceptual Approach, AIAA Edu-cational Series, AIAA, Reston, VA, 1999.
31Westphal, R., and Scholz, D. A., “Method for Predicting Direct Op-erating Costs During Aircraft System Design,” Cost Engineering, Vol. 39,No. 6, 1997, pp. 35–39.
32Curran, R., Kundu, A., Raghunathan, S., and McFadden, R.,“Influence of Manufacturing Tolerance on Aircraft Direct Operat-ing Cost (DOC),” Journal of Materials Processing Technology, 2003,pp. 239–247.
33Boothroyd, G., and Dewhurst, P., Product Design for Assembly,Boothroyd Dewhurst, Wakefield, RI, 1990.
34Stoll, H. W., “Design for Manufacture: an Overview,” Applied Mechan-ics Review, Vol. 39, No. 9, 1986, pp. 1356–1364.
35Bloom, H. M., “Design for Manufacturing and the Life Cycle,” Proceed-ing of the NSF Design Theory 88 Conference, National Science Foundation,1988, pp. 302–312.
36Murman, E. M., Walton, M., and Rebentisch, E., “Challenges in theBetter, Faster, Cheaper, Era of Aeronautical Design, Engineering and Man-ufacturing,” Aeronautical Journal, 2000, pp. 481–488.
37Rais-Rohani, M., “A Framework for Preliminary Design of AircraftStructures Based on Process Information,” NASA Grant NAG-1-1716,1998.
38Rais-Rohani, M., and Greenwood, A. G., “Product and Process Cou-pling in Multidisciplinary Design of Flight Vehicle Structures,” Proceedingsof the 7th AIAA/NASA/USAF/ISSMO Symposium on Multidisciplinary Anal-ysis and Optimization, AIAA, Reston, VA, 1998.
39Sandoz, P. L., “Structural Design of Future Commercial Trans-ports,” Proceedings of the 9th Annual Meeting and Technical Display,1973.
40Noton, B. R., “Cost Drivers in Design and Manufacture of Com-posite Structures,” Composite Structures Analysis and Design, 1987,pp. 419–428.
41Noton, B. R., “Cost Drivers and Design Methodology for AutomatedAirframe Assembly,” Proceedings of 31st Intenational SAMPE Symposium,Society for the Advancement of Material and Process Engineering, 1986,pp. 1441–1455.

274 CURRAN, ROTHWELL, AND CASTAGNE
42Ermanni, P., and Ziegmann, G., “Cost-Efficiency of Highly IntegratedFuselage Structures—Comparison Between Metals and Composites,” Pro-ceedings of SAMPE Advanced Materials: Cost Effectiveness, Quality Con-trol, Health and Environment, Society for the Advancement of Material andProcess Engineering, 1991, pp. 347–359.
43“Local Buckling of Compression Panels with Unflanged Integral Stiff-eners,” Engineering Sciences Data Unit, ESDU International, Item 70003(Structures Series), 1970.
44“Buckling in Compression of Sheet Between Rivets,” Engineering Sci-ences Data Unit, ESDU International, Item 02.01.08 (Structures Series),1962.
45Rothwell, A., “Structural Optimisation,” Lecture Notes, Faculty ofAerospace Engineering, Delft Univ. of Technology, Delft, The Netherlands,2004.
46Curran, R., Kundu, A., Raghunathan, S., and McFadden, R., “Im-pact of Aerodynamic Surface Tolerance on Aircraft Cost Driver,”Journal of Aerospace Engineering, Vol. 216(G1), 2002, pp. 29–39.
47Curran, R., Watson, P., Cowan, S., Mahwinney, P., and Raghunathan, S.,“Development of an Aircraft Cost Estimating Model for Program Cost Ra-tionalisation,” Proceedings of the Canadian Aeronautics and Space Institute(CASI), 2003.