Embed Size (px)
Citation preview
Research in Developmental Disabilities 32 (2011) 2853–2859
Contents lists available at ScienceDirect
Research in Developmental Disabilities
Numerical magnitude processing in children with mildintellectual disabilities
Carmen Brankaer *, Pol Ghesquiere, Bert De Smedt **
Parenting and Special Education Research Group, Katholieke Universiteit Leuven, Vesaliusstraat 2, Box 3765, 3000 Leuven, Belgium
A R T I C L E I N F O
Article history:
Received 5 May 2011
Accepted 10 May 2011
Available online 6 June 2011
Keywords:
Magnitude representation
Mild intellectual disability
Low math achievement
Comparison
Delay
A B S T R A C T
The present study investigated numerical magnitude processing in children with mild
intellectual disabilities (MID) and examined whether these children have difficulties in the
ability to represent numerical magnitudes and/or difficulties in the ability to access
numerical magnitudes from formal symbols. We compared the performance of 26 children
with MID on a symbolic (digits) and a non-symbolic (dot-arrays) comparison task with the
performance of two control groups of typically developing children: one group matched on
chronological age and one group matched on mathematical ability level. Findings revealed
that children with MID performed more poorly than their typically developing
chronological age-matched peers on both the symbolic and non-symbolic comparison
tasks, while their performance did not substantially differ from the ability-matched
control group. These findings suggest that the development of numerical magnitude
representation in children with MID is marked by a delay. This performance pattern was
observed for both symbolic and non-symbolic comparison tasks, although difficulties on
the former task were more prominent. Interventions in children with MID should
therefore foster both the development of magnitude representations and the connections
between symbols and the magnitudes they represent.
� 2011 Elsevier Ltd. All rights reserved.
1. Introduction
Mathematical abilities are crucial in modern Western societies, for example when taking medical and social decisions(Reyna & Brainerd, 2007), and they are associated with greater labour market success (Chiswick, Lee, & Miller, 2003).Children with below-average intellectual abilities (IQ < 85) are known to have difficulties with the development ofmathematical skills (Hoard, Geary, & Hamson, 1999), but little is known about the cognitive deficits that underlie their poorachievement in mathematics. Such information is important in order to devise appropriate interventions for these children.It has been suggested that the ability to represent numerical magnitudes plays a crucial role in the development ofmathematical skills (e.g., Butterworth, 2005a; Gersten, Jordan, & Flojo, 2005). The present study therefore aims to investigatenumerical magnitude processing skills in children with mild intellectual disabilities (MID).
Infants (Xu & Spelke, 2000) and kindergarteners (Barth, Beckmann, & Spelke, 2008) are able to understand and processnumerical magnitude information by means of non-symbolic representations: they are able to compare and add sets of dotsor objects. It is assumed that this ability is innate and independent of language and education (Dehaene, 1997) as uneducatedadults (Pica, Lemer, Izard, & Dehaene, 2004) and even non-human animals (Brannon, 2006; Brannon & Terrace, 1998) areable to make such comparisons. Over the course of development, children learn to link these non-symbolic representations
* Corresponding author. Tel.: +32 16326182; fax: +32 16325933.
** Corresponding author. Tel.: +32 16325705; fax: +32 16325933.
E-mail addresses: [email protected] (C. Brankaer), [email protected] (B. De Smedt).
0891-4222/$ – see front matter � 2011 Elsevier Ltd. All rights reserved.
doi:10.1016/j.ridd.2011.05.020
C. Brankaer et al. / Research in Developmental Disabilities 32 (2011) 2853–28592854
with symbols or numbers (Griffin, 2003). Both cross-sectional (Holloway & Ansari, 2009) and longitudinal studies (De Smedt,Verschaffel, & Ghesquiere, 2009; Halberda, Mazzocco, & Feigenson, 2008) with typically developing children showed that theability to represent numerical magnitudes is related to mathematics achievement.
A classic task to measure numerical magnitude representation is the numerical magnitude comparison task (Sekuler &Mierkiewicz, 1977). In this task, children have to indicate the numerically larger of two presented numerical magnitudes.These magnitudes can be presented both in a symbolic and a non-symbolic format (e.g., De Smedt et al., 2009; De Smedt &Gilmore, 2011; Halberda et al., 2008; Holloway & Ansari, 2009). When people are comparing two numerical magnitudes, thedistance effect occurs (Moyer & Landauer, 1967): people are faster and more accurate at making responses when thenumerical distance between the two magnitudes is relatively large (e.g., 2 vs. 9) than when it is small (e.g., 7 vs. 9). This effectis assumed to arise from overlapping internal representations of numerical magnitudes: magnitudes that are closer to eachother have more representational overlap and are more difficult to discriminate than magnitudes that are further apart (for areview, see Noel, Rousselle, & Mussolin, 2005). This distance effect decreases with increasing age (Sekuler & Mierkiewicz,1977), indicating that these magnitude representations become more precise and show less overlap throughoutdevelopment. Moreover, the size of the distance effect predicts later individual differences in mathematics achievement. Forexample, De Smedt et al. (2009) showed that children with a smaller distance effect at the start of formal schooling hadhigher mathematics achievement levels in second grade.
Several studies have demonstrated that children with mathematical difficulties have difficulties with magnitudecomparison (De Smedt & Gilmore, 2011; Landerl, Bevan, & Butterworth, 2004; Landerl, Fussenegger, Moll, & Willburger,2009; Mussolin et al., 2010; Rouselle & Noel, 2007). Two explanations for difficulties in magnitude comparison have been putforward. According to the defective number module hypothesis (Butterworth, 2005b), these difficulties originate from aspecific deficit in the innate ability to understand and represent numerical magnitudes. In contrast, the access deficit
hypothesis (Rouselle & Noel, 2007) proposes that these difficulties originate from impairments in accessing numericalmeaning from symbols, rather than from difficulties in processing magnitude per se. To disentangle between bothhypotheses, one needs to compare performance on a symbolic and a non-symbolic task. If children with mathematicaldifficulties perform more poorly on both types of tasks, this supports the defective number module hypothesis. If childrenwith mathematical difficulties perform more poorly on the symbolic, but not on the non-symbolic task, this favours theaccess deficit hypothesis.
Because children with MID are expected to have difficulties in acquiring mathematical skills, it is important to find outwhether they mainly have problems with the representation of magnitude per se (defective number module) or withaccessing numerical information from symbols (access deficit). To the best of our knowledge, only one study examinednumerical magnitude comparison in children with below-average intellectual abilities (Hoard et al., 1999). This studyrevealed that children with a below-average IQ (M = 78) were less accurate in comparing digits than their typicallydeveloping peers. However, it remains unclear whether children with MID participated in this study. Furthermore, theseauthors only examined accuracy but not the speed with which the digits were compared, and it has been argued in researchon numerical magnitude processing in children that reaction time might reveal subtle yet important differences that cannotbe uncovered by looking at accuracy alone (Berch, 2005). The comparison of non-symbolic magnitudes was also not includedin the study of Hoard et al. (1999), which makes it impossible to determine whether the children in this study had difficultieswith representing numerosity per se (number module) or whether they had only difficulties in accessing numericalinformation from symbolic digits (access deficit).
The present study tried to address these issues by systematically investigating numerical magnitude comparison inchildren with MID. In order to contrast the defective number module hypothesis and the access deficit hypothesis, wefocused both on symbolic and non-symbolic magnitude comparison tasks. If children with MID have problems with therepresentation of numerical magnitudes per se, they should perform more poorly on both the symbolic and the non-symbolic comparison tasks. If children with MID have mainly difficulties in accessing magnitude information from symbols,they should perform more poorly on the symbolic but not on the non-symbolic comparison task.
We also wanted to examine whether the difficulties with magnitude representation in children with MID are marked by adelay or a deficit. According to the delay model, children with MID follow the same overall pattern of development astypically developing individuals, but they progress at a slower rate and ultimately attain a lower asymptote of cognitivefunctioning. In contrast, the deficit model states that the difficulties of children with MID are the result of deficits in specificcognitive processes, which makes the general principles of development not applicable (Bennett-Gates & Zigler, 1998). Thisresearch question was addressed by using a chronological-age/ability-level-match design. This design involves the selectionof two control groups of typically developing children: one control group matched on chronological age to the group ofchildren with MID and one control group matched on arithmetic achievement level to the children with MID. If theperformance of children with MID differs from the performance of their chronological age matched peers, but not from theperformance of younger children with the same arithmetic achievement level, then the development of children with MID ismarked by a delay. If, by contrast, the performance of children with MID differs from the performance of both control groups,then their development can be characterized by a deficit.
It should be noted that children’s performance on the symbolic magnitude comparison task might be influenced by theirknowledge of the digits that are used in this task. In order to control for this factor, we administered a digit identification taskto find out whether group differences are due to differences in symbolic knowledge rather than to differences in accessingmagnitude information from symbols.
C. Brankaer et al. / Research in Developmental Disabilities 32 (2011) 2853–2859 2855
2. Method
2.1. Participants
Participants with MID were recruited from five special education schools for children with MID. Control children wereselected from five mainstream primary schools. Parental consent was obtained for 255 children (130 boys, 125 girls), who allcompleted a standardized arithmetic test (De Vos, 1992) to determine their mathematics achievement level. All children alsocompleted the Raven’s Standard Progressive Matrices (Raven, Court, & Raven, 1992) as a measure of intellectual ability.Against the background of DSM-IV-TR criteria for defining mild intellectual disabilities (APA, 2000), only children with an IQbetween 50 and 70 were included in the group of children with MID.
Control children had a normal IQ, i.e. between 85 and 115. None of them had a developmental disorder and none of themhad repeated grade. Two control groups were selected: one group matched on chronological age (CA-group) to the childrenwith MID and one group matched on arithmetic achievement level (AL-group) to the children with MID.
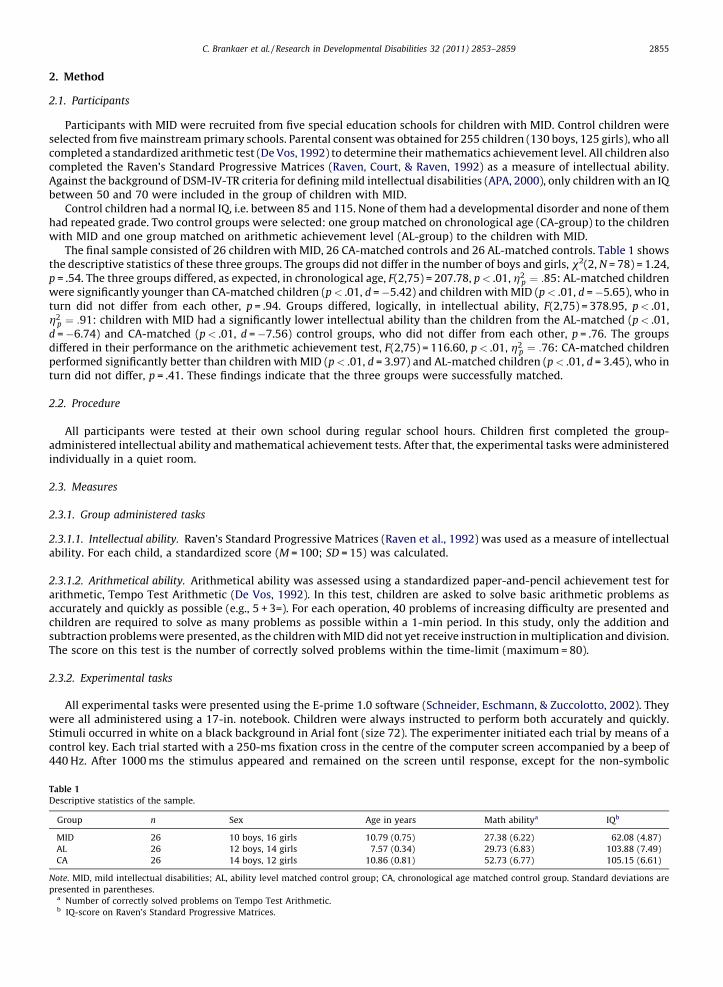
The final sample consisted of 26 children with MID, 26 CA-matched controls and 26 AL-matched controls. Table 1 showsthe descriptive statistics of these three groups. The groups did not differ in the number of boys and girls, x2(2, N = 78) = 1.24,p = .54. The three groups differed, as expected, in chronological age, F(2,75) = 207.78, p < .01, h2
p ¼ :85: AL-matched childrenwere significantly younger than CA-matched children (p < .01, d = �5.42) and children with MID (p < .01, d = �5.65), who inturn did not differ from each other, p = .94. Groups differed, logically, in intellectual ability, F(2,75) = 378.95, p < .01,h2
p ¼ :91: children with MID had a significantly lower intellectual ability than the children from the AL-matched (p < .01,d = �6.74) and CA-matched (p < .01, d = �7.56) control groups, who did not differ from each other, p = .76. The groupsdiffered in their performance on the arithmetic achievement test, F(2,75) = 116.60, p < .01, h2
p ¼ :76: CA-matched childrenperformed significantly better than children with MID (p < .01, d = 3.97) and AL-matched children (p < .01, d = 3.45), who inturn did not differ, p = .41. These findings indicate that the three groups were successfully matched.
2.2. Procedure
All participants were tested at their own school during regular school hours. Children first completed the group-administered intellectual ability and mathematical achievement tests. After that, the experimental tasks were administeredindividually in a quiet room.
2.3. Measures
2.3.1. Group administered tasks
2.3.1.1. Intellectual ability. Raven’s Standard Progressive Matrices (Raven et al., 1992) was used as a measure of intellectualability. For each child, a standardized score (M = 100; SD = 15) was calculated.
2.3.1.2. Arithmetical ability. Arithmetical ability was assessed using a standardized paper-and-pencil achievement test forarithmetic, Tempo Test Arithmetic (De Vos, 1992). In this test, children are asked to solve basic arithmetic problems asaccurately and quickly as possible (e.g., 5 + 3=). For each operation, 40 problems of increasing difficulty are presented andchildren are required to solve as many problems as possible within a 1-min period. In this study, only the addition andsubtraction problems were presented, as the children with MID did not yet receive instruction in multiplication and division.The score on this test is the number of correctly solved problems within the time-limit (maximum = 80).
2.3.2. Experimental tasks
All experimental tasks were presented using the E-prime 1.0 software (Schneider, Eschmann, & Zuccolotto, 2002). Theywere all administered using a 17-in. notebook. Children were always instructed to perform both accurately and quickly.Stimuli occurred in white on a black background in Arial font (size 72). The experimenter initiated each trial by means of acontrol key. Each trial started with a 250-ms fixation cross in the centre of the computer screen accompanied by a beep of440 Hz. After 1000 ms the stimulus appeared and remained on the screen until response, except for the non-symbolic
Table 1
Descriptive statistics of the sample.
Group n Sex Age in years Math abilitya IQb
MID 26 10 boys, 16 girls 10.79 (0.75) 27.38 (6.22) 62.08 (4.87)
AL 26 12 boys, 14 girls 7.57 (0.34) 29.73 (6.83) 103.88 (7.49)
CA 26 14 boys, 12 girls 10.86 (0.81) 52.73 (6.77) 105.15 (6.61)
Note. MID, mild intellectual disabilities; AL, ability level matched control group; CA, chronological age matched control group. Standard deviations are
presented in parentheses.a Number of correctly solved problems on Tempo Test Arithmetic.b IQ-score on Raven’s Standard Progressive Matrices.
C. Brankaer et al. / Research in Developmental Disabilities 32 (2011) 2853–28592856
numerical magnitude comparison task where the stimulus disappeared after 840 ms, in order to avoid counting. In thenumerical magnitude comparison tasks, participants had to respond by pressing a key on a computer keyboard that was putin front of the notebook and was connected to it. The left response key, labeled with a blue sticker, was ‘d’; the right responsekey, labeled with a yellow sticker, was ‘k’. Each task was preceded by three practice trials to familiarize the child with the keyassignments. Answers and reaction times were recorded by the notebook. In digit identification, responses were verbal.When the child responded, the experimenter, who was seated next to the child, immediately pressed the spacebar of theexternal keyboard that was connected to the notebook, to register reaction time. After the registration of the reaction time,the child’s answer was entered on the keyboard by the experimenter. Two practice trials were included to make childrenfamiliar with the task administration.
2.3.2.1. Numerical magnitude comparison.
2.3.2.1.1. Symbolic comparison. A classic numerical magnitude comparison task (Sekuler & Mierkiewicz, 1977) wasadministered. In this task, children indicated the numerically larger of two simultaneously presented numbers, onedisplayed on the left and one displayed on the right side of the computer screen. Stimuli involved all combinations of thenumbers 1–9, yielding 72 trials. Children were required to select the larger number by pressing the response key on the sideof the larger number. The position of the largest number was counterbalanced.2.3.2.1.2. Non-symbolic comparison. Children indicated the larger of two simultaneously presented arrays of dots – onedisplayed on the left, one displayed on the right side of the computer screen. Stimuli comprised the same numerosities as inthe symbolic comparison task, yielding 72 trials. The stimuli were generated by means of the MATLAB script provided byPiazza, Izard, Pinel, Le Bihan, and Dehaene (2004) and were controlled for non-numerical parameters, i.e. individual dot size,total occupied area, and density. This was done to ensure that children could not reliably use these non-numerical cues orperceptual features to make a correct decision. Similar to the symbolic comparison task, children were required to select thelarger numerosity by pressing the response key on the side of the larger numerosity. The position of the largest numerositywas counterbalanced.
2.3.2.2. Control task: speed of digit identification. Each of the digits 1–9 was successively presented on the computer screenand the child was asked to name each digit as fast as possible. Each digit was presented twice, which yielded 18 trials.
3. Results
3.1. Control task
Before we turn to the numerical magnitude comparison tasks, performance on the digit identification task is discussed.All participants performed with 100% accuracy on this control task, which indicates that they were all able to recognize thenumbers presented in this study. There were group differences in the speed of digit identification, F(2,75) = 9.12, p < .01,h2
p ¼ :20: CA-matched children (M = 733.04 ms, SD = 73.99) were significantly faster than children with MID (M = 840.09 ms,SD = 106.18; p < .01, d = �1.19) and AL-matched children (M = 803.72 ms, SD = 92.63; p < .01, d = �0.86), whereas the lattertwo groups did not differ from each other, p = .33. These differences are considered in subsequent analyses.
3.2. Numerical magnitude comparison
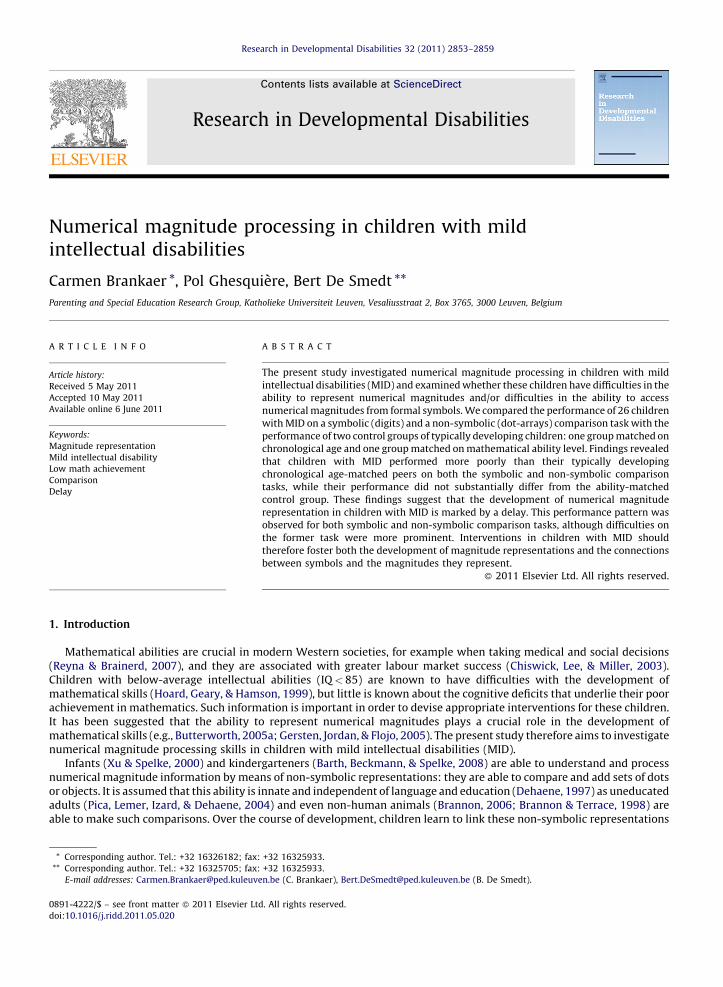
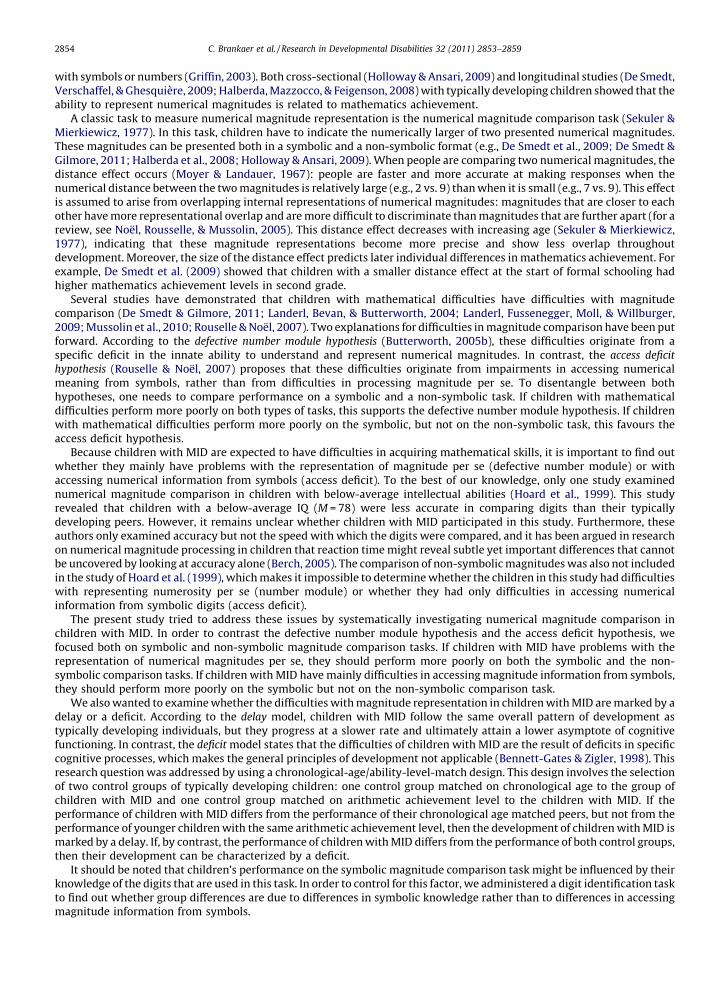
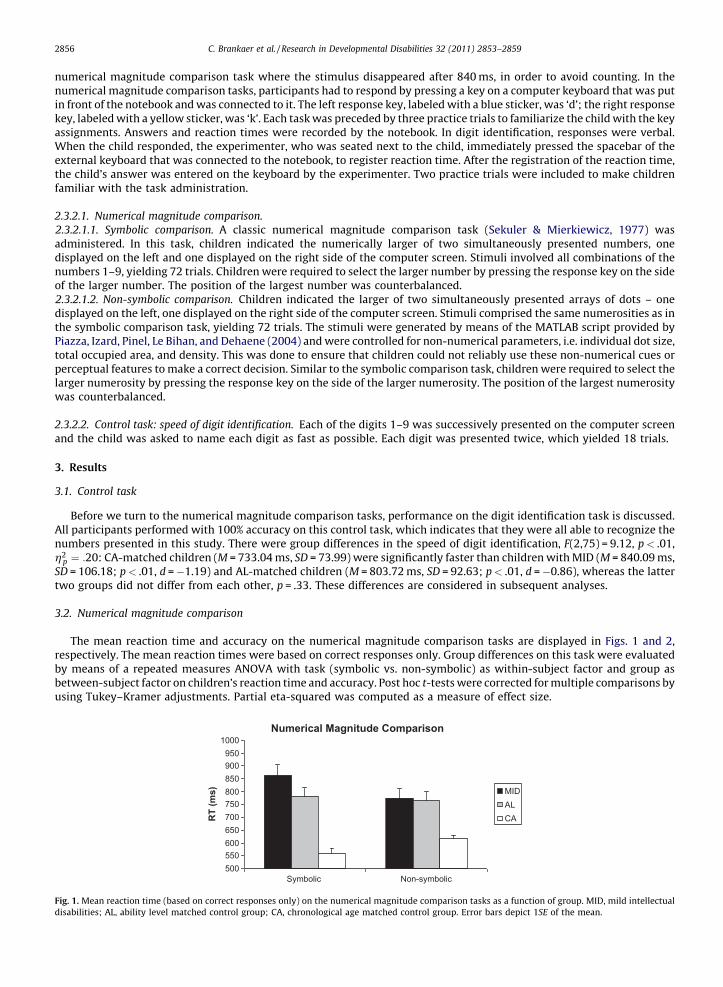
The mean reaction time and accuracy on the numerical magnitude comparison tasks are displayed in Figs. 1 and 2,respectively. The mean reaction times were based on correct responses only. Group differences on this task were evaluatedby means of a repeated measures ANOVA with task (symbolic vs. non-symbolic) as within-subject factor and group asbetween-subject factor on children’s reaction time and accuracy. Post hoc t-tests were corrected for multiple comparisons byusing Tukey–Kramer adjustments. Partial eta-squared was computed as a measure of effect size.
Numerical Magnitude Comparison
5005506006507007508008509009501000
Symbolic Non-symbolic
RT
(ms) MID
ALCA
Fig. 1. Mean reaction time (based on correct responses only) on the numerical magnitude comparison tasks as a function of group. MID, mild intellectual
disabilities; AL, ability level matched control group; CA, chronological age matched control group. Error bars depict 1SE of the mean.
Numerical Magnitude Comparison
0,80
0,84
0,88
0,92
0,96
1,00
Symbolic Non-symbolic
Acc
urac
y (P
ropo
rtio
n co
rrec
t)
MIDALCA
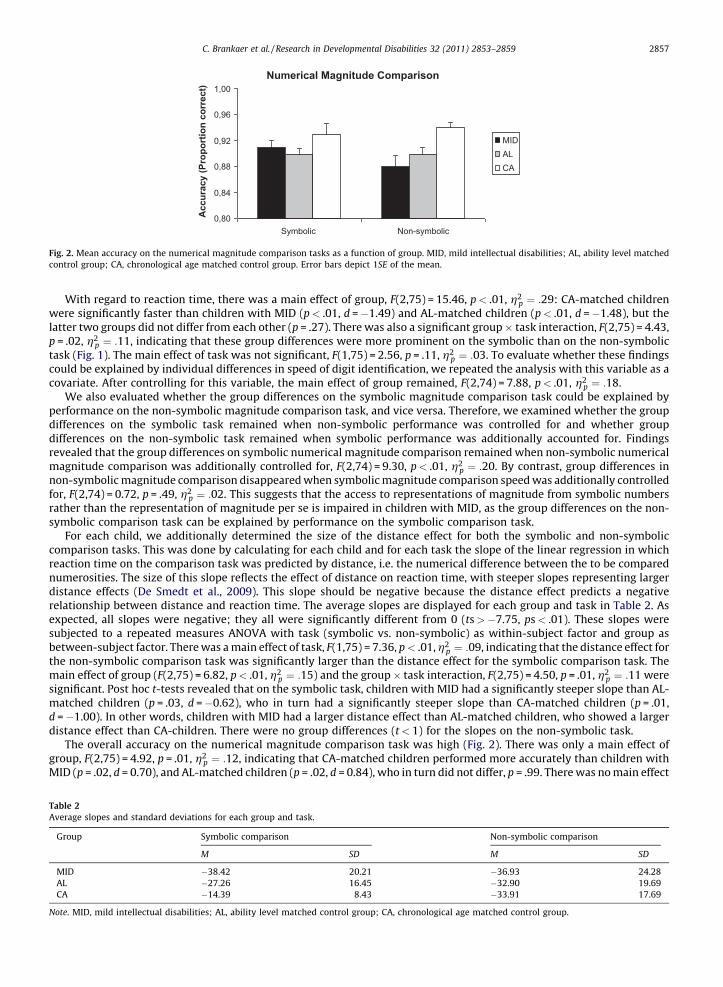
Fig. 2. Mean accuracy on the numerical magnitude comparison tasks as a function of group. MID, mild intellectual disabilities; AL, ability level matched
control group; CA, chronological age matched control group. Error bars depict 1SE of the mean.
C. Brankaer et al. / Research in Developmental Disabilities 32 (2011) 2853–2859 2857
With regard to reaction time, there was a main effect of group, F(2,75) = 15.46, p < .01, h2p ¼ :29: CA-matched children
were significantly faster than children with MID (p < .01, d = �1.49) and AL-matched children (p < .01, d = �1.48), but thelatter two groups did not differ from each other (p = .27). There was also a significant group � task interaction, F(2,75) = 4.43,p = .02, h2
p ¼ :11, indicating that these group differences were more prominent on the symbolic than on the non-symbolictask (Fig. 1). The main effect of task was not significant, F(1,75) = 2.56, p = .11, h2
p ¼ :03. To evaluate whether these findingscould be explained by individual differences in speed of digit identification, we repeated the analysis with this variable as acovariate. After controlling for this variable, the main effect of group remained, F(2,74) = 7.88, p < .01, h2
p ¼ :18.We also evaluated whether the group differences on the symbolic magnitude comparison task could be explained by
performance on the non-symbolic magnitude comparison task, and vice versa. Therefore, we examined whether the groupdifferences on the symbolic task remained when non-symbolic performance was controlled for and whether groupdifferences on the non-symbolic task remained when symbolic performance was additionally accounted for. Findingsrevealed that the group differences on symbolic numerical magnitude comparison remained when non-symbolic numericalmagnitude comparison was additionally controlled for, F(2,74) = 9.30, p < .01, h2
p ¼ :20. By contrast, group differences innon-symbolic magnitude comparison disappeared when symbolic magnitude comparison speed was additionally controlledfor, F(2,74) = 0.72, p = .49, h2
p ¼ :02. This suggests that the access to representations of magnitude from symbolic numbersrather than the representation of magnitude per se is impaired in children with MID, as the group differences on the non-symbolic comparison task can be explained by performance on the symbolic comparison task.
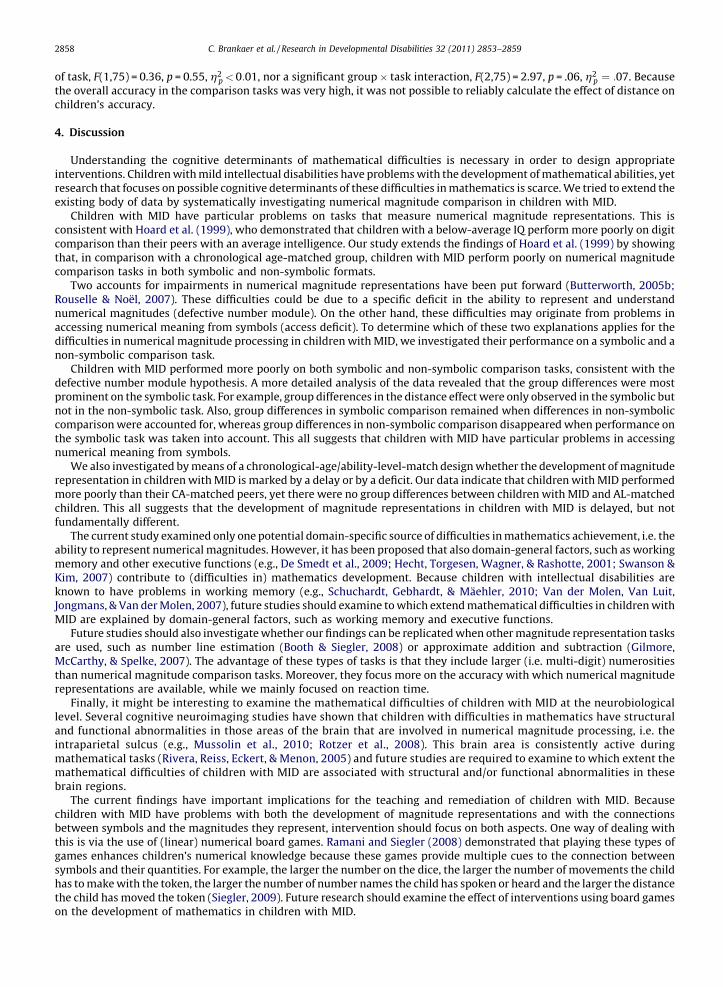
For each child, we additionally determined the size of the distance effect for both the symbolic and non-symboliccomparison tasks. This was done by calculating for each child and for each task the slope of the linear regression in whichreaction time on the comparison task was predicted by distance, i.e. the numerical difference between the to be comparednumerosities. The size of this slope reflects the effect of distance on reaction time, with steeper slopes representing largerdistance effects (De Smedt et al., 2009). This slope should be negative because the distance effect predicts a negativerelationship between distance and reaction time. The average slopes are displayed for each group and task in Table 2. Asexpected, all slopes were negative; they all were significantly different from 0 (ts > �7.75, ps < .01). These slopes weresubjected to a repeated measures ANOVA with task (symbolic vs. non-symbolic) as within-subject factor and group asbetween-subject factor. There was a main effect of task, F(1,75) = 7.36, p < .01, h2
p ¼ :09, indicating that the distance effect forthe non-symbolic comparison task was significantly larger than the distance effect for the symbolic comparison task. Themain effect of group (F(2,75) = 6.82, p < .01, h2
p ¼ :15) and the group � task interaction, F(2,75) = 4.50, p = .01, h2p ¼ :11 were
significant. Post hoc t-tests revealed that on the symbolic task, children with MID had a significantly steeper slope than AL-matched children (p = .03, d = �0.62), who in turn had a significantly steeper slope than CA-matched children (p = .01,d = �1.00). In other words, children with MID had a larger distance effect than AL-matched children, who showed a largerdistance effect than CA-children. There were no group differences (t < 1) for the slopes on the non-symbolic task.
The overall accuracy on the numerical magnitude comparison task was high (Fig. 2). There was only a main effect ofgroup, F(2,75) = 4.92, p = .01, h2
p ¼ :12, indicating that CA-matched children performed more accurately than children withMID (p = .02, d = 0.70), and AL-matched children (p = .02, d = 0.84), who in turn did not differ, p = .99. There was no main effect
Table 2
Average slopes and standard deviations for each group and task.
Group Symbolic comparison Non-symbolic comparison
M SD M SD
MID �38.42 20.21 �36.93 24.28
AL �27.26 16.45 �32.90 19.69
CA �14.39 8.43 �33.91 17.69
Note. MID, mild intellectual disabilities; AL, ability level matched control group; CA, chronological age matched control group.
C. Brankaer et al. / Research in Developmental Disabilities 32 (2011) 2853–28592858
of task, F(1,75) = 0.36, p = 0.55, h2p < 0:01, nor a significant group � task interaction, F(2,75) = 2.97, p = .06, h2
p ¼ :07. Becausethe overall accuracy in the comparison tasks was very high, it was not possible to reliably calculate the effect of distance onchildren’s accuracy.
4. Discussion
Understanding the cognitive determinants of mathematical difficulties is necessary in order to design appropriateinterventions. Children with mild intellectual disabilities have problems with the development of mathematical abilities, yetresearch that focuses on possible cognitive determinants of these difficulties in mathematics is scarce. We tried to extend theexisting body of data by systematically investigating numerical magnitude comparison in children with MID.
Children with MID have particular problems on tasks that measure numerical magnitude representations. This isconsistent with Hoard et al. (1999), who demonstrated that children with a below-average IQ perform more poorly on digitcomparison than their peers with an average intelligence. Our study extends the findings of Hoard et al. (1999) by showingthat, in comparison with a chronological age-matched group, children with MID perform poorly on numerical magnitudecomparison tasks in both symbolic and non-symbolic formats.
Two accounts for impairments in numerical magnitude representations have been put forward (Butterworth, 2005b;Rouselle & Noel, 2007). These difficulties could be due to a specific deficit in the ability to represent and understandnumerical magnitudes (defective number module). On the other hand, these difficulties may originate from problems inaccessing numerical meaning from symbols (access deficit). To determine which of these two explanations applies for thedifficulties in numerical magnitude processing in children with MID, we investigated their performance on a symbolic and anon-symbolic comparison task.
Children with MID performed more poorly on both symbolic and non-symbolic comparison tasks, consistent with thedefective number module hypothesis. A more detailed analysis of the data revealed that the group differences were mostprominent on the symbolic task. For example, group differences in the distance effect were only observed in the symbolic butnot in the non-symbolic task. Also, group differences in symbolic comparison remained when differences in non-symboliccomparison were accounted for, whereas group differences in non-symbolic comparison disappeared when performance onthe symbolic task was taken into account. This all suggests that children with MID have particular problems in accessingnumerical meaning from symbols.
We also investigated by means of a chronological-age/ability-level-match design whether the development of magnituderepresentation in children with MID is marked by a delay or by a deficit. Our data indicate that children with MID performedmore poorly than their CA-matched peers, yet there were no group differences between children with MID and AL-matchedchildren. This all suggests that the development of magnitude representations in children with MID is delayed, but notfundamentally different.
The current study examined only one potential domain-specific source of difficulties in mathematics achievement, i.e. theability to represent numerical magnitudes. However, it has been proposed that also domain-general factors, such as workingmemory and other executive functions (e.g., De Smedt et al., 2009; Hecht, Torgesen, Wagner, & Rashotte, 2001; Swanson &Kim, 2007) contribute to (difficulties in) mathematics development. Because children with intellectual disabilities areknown to have problems in working memory (e.g., Schuchardt, Gebhardt, & Maehler, 2010; Van der Molen, Van Luit,Jongmans, & Van der Molen, 2007), future studies should examine to which extend mathematical difficulties in children withMID are explained by domain-general factors, such as working memory and executive functions.
Future studies should also investigate whether our findings can be replicated when other magnitude representation tasksare used, such as number line estimation (Booth & Siegler, 2008) or approximate addition and subtraction (Gilmore,McCarthy, & Spelke, 2007). The advantage of these types of tasks is that they include larger (i.e. multi-digit) numerositiesthan numerical magnitude comparison tasks. Moreover, they focus more on the accuracy with which numerical magnituderepresentations are available, while we mainly focused on reaction time.
Finally, it might be interesting to examine the mathematical difficulties of children with MID at the neurobiologicallevel. Several cognitive neuroimaging studies have shown that children with difficulties in mathematics have structuraland functional abnormalities in those areas of the brain that are involved in numerical magnitude processing, i.e. theintraparietal sulcus (e.g., Mussolin et al., 2010; Rotzer et al., 2008). This brain area is consistently active duringmathematical tasks (Rivera, Reiss, Eckert, & Menon, 2005) and future studies are required to examine to which extent themathematical difficulties of children with MID are associated with structural and/or functional abnormalities in thesebrain regions.
The current findings have important implications for the teaching and remediation of children with MID. Becausechildren with MID have problems with both the development of magnitude representations and with the connectionsbetween symbols and the magnitudes they represent, intervention should focus on both aspects. One way of dealing withthis is via the use of (linear) numerical board games. Ramani and Siegler (2008) demonstrated that playing these types ofgames enhances children’s numerical knowledge because these games provide multiple cues to the connection betweensymbols and their quantities. For example, the larger the number on the dice, the larger the number of movements the childhas to make with the token, the larger the number of number names the child has spoken or heard and the larger the distancethe child has moved the token (Siegler, 2009). Future research should examine the effect of interventions using board gameson the development of mathematics in children with MID.
C. Brankaer et al. / Research in Developmental Disabilities 32 (2011) 2853–2859 2859
Acknowledgements
We would like to thank all participating children, parents and teachers. Special thanks are due to Tina Jacobs for herassistance with data collection. This study was supported by the Marguerite-Marie Delacroix Support Fund.
References
American Psychological Association. (2000). Diagnostic and statistical manual of mental disorders text revision (4th ed.). Washington, DC: American PsychologicalAssociation.
Barth, H., Beckmann, L., & Spelke, E. S. (2008). Nonsymbolic, approximate arithmetic in children: Abstract addition prior to instruction. Developmental Psychology,44, 1466–1477.
Bennett-Gates, D., & Zigler, E. (1998). Resolving the developmental-difference debate: An evaluation of the triarchic and systems theory models. In J. A. Burack, R.M. Hodapp, & E. Zigler (Eds.), Handbook of mental retardation and development (pp. 115–131). Cambridge, UK: Cambridge University Press.
Berch, D. B. (2005). Making sense of number sense: Implications for children with mathematical disabilities. Journal of Learning Disabilities, 38, 333–339.Booth, J. L., & Siegler, R. S. (2008). Numerical magnitude representations influence arithmetic learning. Child Development, 79, 1016–1031.Brannon, E. (2006). The representation of numerical magnitude. Current Opinion in Neurobiology, 16, 222–229.Brannon, E. M., & Terrace, H. S. (1998). Ordering of the numerosities 1 to 9 by monkeys. Science, 282, 746–749.Butterworth, B. (2005a). The development of arithmetical abilities. Journal of Child Psychology and Psychiatry, 46, 3–18.Butterworth, B. (2005b). Developmental dyscalculia. In J. I. D. Campbell (Ed.), Handbook of mathematical cognition (pp. 455–467). Hove, UK: Psychology Press.Chiswick, B. R., Lee, Y. L., & Miller, P. W. (2003). Schooling, literacy, numeracy and labour market success. The Economic Record, 79, 165–181.De Smedt, B., & Gilmore, C. K. (2011). Defective number module or impaired access? Numerical magnitude processing in first graders with mathematical
difficulties. Journal of Experimental Child Psychology, 108, 278–292.De Smedt, B., Janssen, R., Bouwens, K., Verschaffel, L., Boets, B., & Ghesquiere, P. (2009). Working memory and individual differences in mathematics achievement:
A longitudinal study from first grade to second grade. Journal of Experimental Child Psychology, 103, 186–201.De Smedt, B., Verschaffel, L., & Ghesquiere, P. (2009). The predictive value of numerical magnitude comparison for individual differences in mathematics
achievement. Journal of Experimental Child Psychology, 103, 469–479.De Vos, T. (1992). Tempo-Test-Rekenen. Handleiding [Tempo Test Arithmetic. Manual]. Nijmegen: Berkhout.Dehaene, S. (1997). The number sense: How the mind creates mathematics. New York, NY: Oxford University Press.Gersten, R., Jordan, N. C., & Flojo, J. R. (2005). Early identification and interventions for students with mathematics difficulties. Journal of Learning Disabilities, 38,
293–304.Gilmore, C. K., McCarthy, S. E., & Spelke, E. S. (2007). Symbolic arithmetic knowledge without instruction. Nature, 447, 589–591.Griffin, S. (2003). The development of math competence in the preschool and early school years: Cognitive foundations and instructional strategies. In J. M. Royer
(Ed.), Mathematical cognition (pp. 1–32). Connecticut: Information Age Publishing.Halberda, J., Mazzocco, M. M. M., & Feigenson, L. (2008). Individual differences in non-verbal number acuity correlate with maths achievement. Nature, 455, 665–
668.Hecht, S. A., Torgesen, J. K., Wagner, R. K., & Rashotte, C. A. (2001). The relations between phonological processing abilities and emerging individual differences in
mathematical computation skills: A longitudinal study from second to fifth grades. Journal of Experimental Child Psychology, 79, 192–227.Hoard, M. K., Geary, D. C., & Hamson, C. O. (1999). Numerical and arithmetical cognition: Performance of low- and average-IQ children. Mathematical Cognition, 5,
65–94.Holloway, I. D., & Ansari, D. (2009). Mapping numerical magnitudes onto symbols: The numerical distance effect and individual differences in children’s
mathematics achievement. Journal of Experimental Child Psychology, 103, 17–29.Landerl, K., Bevan, A., & Butterworth, B. (2004). Developmental dyscalculia and basic numerical capacities: A study of 8–9-year-old students. Cognition, 93, 99–
125.Landerl, K., Fussenegger, B., Moll, K., & Willburger, E. (2009). Dyslexia and dyscalculia: Two learning disorders with different cognitive profiles. Journal of
Experimental Child Psychology, 103, 309–324.Moyer, R. S., & Landauer, T. K. (1967). Time required for judgments of numerical inequality. Nature, 215, 1519–1520.Mussolin, C., De Volder, A., Grandin, C., Schlogel, X., Nassogne, M. C., & Noel, M. P. (2010). Neural correlates of symbolic number comparison in developmental
dyscalculia. Journal of Cognitive Neuroscience, 22(5), 860–874.Noel, M. P., Rousselle, L., & Mussolin, C. (2005). Magnitude representation in children: Its development dysfunction. In J. I. D. Campbell (Ed.), Handbook of
mathematical cognition (pp. 179–195). Hove, UK: Psychology Press.Piazza, M., Izard, V., Pinel, P., Le Bihan, D., & Dehaene, S. (2004). Tuning curves for approximate numerosity in the human intraparietal sulcus. Neuron, 44, 547–555.Pica, P., Lemer, C., Izard, W., & Dehaene, S. (2004). Exact and approximate arithmetic in an Amazonian indigene group. Science, 306, 499–503.Ramani, G. B., & Siegler, R. S. (2008). Promoting broad and stable improvements in low-income children’s numerical knowledge through playing number board
games. Child Development, 79, 375–394.Raven, J. C., Court, J. H., & Raven, J. (1992). Standard progressive matrices. Oxford, UK: Oxford Psychologists Press.Reyna, V. F., & Brainerd, C. J. (2007). The importance of mathematics in health and human judgment: Numeracy, risk communication, and medical decision
making. Learning and Individual Differences, 17, 147–159.Rivera, S. M., Reiss, A. L., Eckert, M. A., & Menon, V. (2005). Developmental changes in mental arithmetic: Evidence for increased functional specialization in the left
inferior parietal cortex. Cerebral Cortex, 15, 1779–1790.Rotzer, S., Kucian, K., Martin, E., von Aster, M., Klaver, P., & Loenneker, T. (2008). Optimized voxel-based morphometry in children with developmental dyscalculia.
NeuroImage, 39, 417–422.Rousselle, L., & Noel, M. P. (2007). Basic numerical skills in children with mathematics learning disabilities: A comparison of symbolic vs. non-symbolic number
magnitude processing. Cognition, 102, 361–395.Schneider, W., Eschmann, A., & Zuccolotto, A. (2002). E-prime reference guide. Pittsburgh, PA: Psychology Software Tools.Schuchardt, K., Gebhardt, M., & Maehler, C. (2010). Working memory functions in children with different degrees of intellectual disability. Journal of Intellectual
Disability Research, 54, 346–353.Sekuler, R., & Mierkiewicz, D. (1977). Children’s judgments of numerical inequality. Child Development, 48, 630–633.Siegler, R. S. (2009). Improving the numerical understanding of children from low-income families. Child Development Perspectives, 3, 118–124.Swanson, L., & Kim, K. (2007). Working memory, short-term memory, and naming speed as predictors of children’s mathematical performance. Intelligence, 35,
151–168.Van der Molen, M. J., Van Luit, J. E. H., Jongmans, M. J., & Van der Molen, M. W. (2007). Verbal working memory in children with mild intellectual disabilities. Journal
of Intellectual Disability Research, 51, 162–169.Xu, F., & Spelke, E. S. (2000). Large number discrimination in 6-month-old infants. Cognition, 74, B1–B11.